
 Submit a Paper
 Propose a Special lssue
 Open Access
ARTICLE
Research on Welding Quality Traceability Model of Offshore Platform Block Construction Process
1 College of Mechanical and Electrical Engineering, Harbin Engineering University, Harbin, 150001, China
2 College of Shipbuilding Engineering, Harbin Engineering University, Harbin, 150001, China
* Corresponding Authors: Boxin Yang. Email: ; Qinghua Zhou. Email:
(This article belongs to the Special Issue: Computer Modeling in Ocean Engineering Structure and Mechanical Equipment)
Computer Modeling in Engineering & Sciences 2023, 134(1), 699-730. https://doi.org/10.32604/cmes.2022.020811
Received 14 December 2021; Accepted 10 February 2022; Issue published 24 August 2022
 View Full Text
 Download PDF
Abstract
Quality traceability plays an essential role in assembling and welding offshore platform blocks. The improvement of the welding quality traceability system is conducive to improving the durability of the offshore platform and the process level of the offshore industry. Currently, quality management remains in the era of primary information, and there is a lack of effective tracking and recording of welding quality data. When welding defects are encountered, it is difficult to rapidly and accurately determine the root cause of the problem from various complexities and scattered quality data. In this paper, a composite welding quality traceability model for offshore platform block construction process is proposed, it contains the quality early-warning method based on long short-term memory and quality data backtracking query optimization algorithm. By fulfilling the training of the early-warning model and the implementation of the query optimization algorithm, the quality traceability model has the ability to assist enterprises in realizing the rapid identification and positioning of quality problems. Furthermore, the model and the quality traceability algorithm are checked by cases in actual working conditions. Verification analyses suggest that the proposed early-warning model for welding quality and the algorithm for optimizing backtracking requests are effective and can be applied to the actual construction process.Keywords
Offshore platforms are characterized by their intricate structure and extensive welding [1]. Extreme temperatures, high humidity, high salt, and high corrosive environment are all present in their normal operating conditions, resulting in significant maintenance costs. In order to ensure the safe operation of platforms, extremely stringent requirements regarding the quality management of welding during the block construction process are imposed. Given the discrete nature of the offshore platform building process, attaining welding quality data traceability is critical to guaranteeing successful welding quality control.
Traceability refers to the ability to trace the history, application, or location of the object under consideration [2]. Clarifying business requirements is the first step in achieving traceability. Rempel et al. [3] analyzed the aspects of traceability in the depth of software requirements, created a quality model, specified the mechanism of detecting acceptable status and unacceptable deviation, assessed the effect of traceability issues, and prioritizes the evaluation of traceability elements. Adam et al. [4] developed a set of initial meta-models that included quality objectives, business processes, and quality needs in order to achieve continuous monitoring of software requirements from business activities to central organization goals. Salem [5] proposed a quantitative and dynamic demand tracing model, as well as a method that coupled event-based tracing with information retrieval and tracing. The traceability process may be separated into two stages: “Follow-up Tracing” and “Problems Backtracking”, which are motivated by the requirements for quality traceability management. The first stage is oriented to the manufacturing process, Cheng et al. [6] stated four data traceability enabling factors based on data acquisition rate, integrity of traceability batch, clarity of product identification and timeliness and accuracy of data, and Steele [7] proposed batch-based quality management concept, which was successfully applied to traceability management business in discrete manufacturing industry for the first time by King [8]. Peng et al. [9] established a traceability analysis model based on discrete-time Markov chain theory, calculate the theoretical value of system steady-state performance, and investigated the impact of the number of traceable nodes and traceable information on system performance. It will enter the “Problem Backtracking” stage to locate the cause of the problem once the production execution is done and quality defects are discovered during the inspection phase. Khabbazi et al. [10] investigated the data transmission model of the manufacturing control system's information layer, which can track all relevant product data from orders to final products, and proposed a data expression method based on entity relationship modeling, which can achieve rapid information search. Mustafa et al. [11] proposed to build a universal traceability model to adapt to the traceability information interaction between heterogeneous systems and elaborated on innovative methods for defining and constraining trace connections or system artifacts. Li et al. [12] developed a causal traceability model of production quality based on a quality information resource database and offered a quality traceability algorithm based on an extended event graph. In addition, some scholars [13–16] proposed a variety of data tracking and query methods for distributed scenarios based on blockchain technology. We discovered the key and difficult points in the quality traceability process through a series of literature studies. First of all, it is hard for software practitioners to fully understand the quality management activities of the offshore platform manufacturing industry, leading to the failure of the traceability software. Second, the failure of the traceability algorithm may arise from incomplete or missing traceability data. Third, there is a lack of an early warning system for quality issues and is unable to offer maintenance employees support information ahead of time.
As a result, in order to better solve the problem of welding quality traceability in the offshore platform manufacturing process, we first carried out the combing of the business process of block welding quality management and clarified the welding inspection sequence and content from the demand of quality traceability. Furthermore, we systematically summarize the elements and the instantiation stage of the Quality Traceability Information Units on the basis of the work orders. Then we provide a comprehensive quality traceability model that describes two aspects of welding quality inspection, respectively, “Follow-up Tracing” and “Problems Backtracking”. In the first aspect, we used time series analysis to establish a welding quality early warning model considering that the welding quality data complete statistics over time and is characterized by incomplete data and lack of stability. By comparing various modeling approaches, the Long Short-term Memory network (LSTM) has the ability to handle unstable time series with large sample data and can meet the practical engineering requirements for practicality and robustness. Therefore, LSTM is selected to model the quality follow-up tracing operation. In the second aspect, in order to be able to quickly query all production execution information and complete defect identification and location based on the work order number entered by the early warning model, based on statistical principles and data mainstream query algorithms, we established a quality data query optimization algorithm and a backtracking location model based on Rank Sum Test by comparing various nonparametric tests and intelligent optimization algorithms to accommodate fast and accurate finding of large sample data with no Continuous data under the welding defect discrimination. Finally, we carried out case validation under actual engineering scenarios to demonstrate the feasibility of the above method for quality traceability process modeling and its ability to solve the problems of lack of quality problem warning, slow traceability of welding problems, and manual judgment of defect types in the quality management stage of enterprises.
The remainder of the paper is structured as follows: We describe the essential aspects of welding quality traceability information in Section 2 and outline assumptions of our work. In Section 3, we present a quality traceability model for two sections of quality early-warning and welding defects judgment. We present a training and algorithm implementation of quality information early-warning model based on LSTM, and design an algorithm of data multi-connection query in Section 4. We carried out the example verification stated in Section 5 in an offshore platform manufacturing firm and displayed the verification data findings to demonstrate the proposed evaluation model and algorithm. In Section 6, we discuss the major accomplishments, contributions, and limits of our work. Additionally, we propose a future research direction based on these constraints.
2 Preliminary Assumptions and Definitions
A complicated offshore platform is usually composed of multiple blocks. In offshore platform manufacturing firms, a single block is typically utilized as a quality control node at the workshop level. Taking the block as the basic unit, by analyzing the business process of welding quality management, combing all quality inspection contents and inspection standards in the whole life cycle of blocks production, and refining various traceability information elements to work order layer granularity, so as to meet the practical application needs of enterprises for a single weld corresponding to individual. In this section, we elaborate on these elements.
2.1 Analysis of Information for Block Welding Quality Management Process
The offshore platform construction adopts the mainstream integrated construction mode of design, procurement, and construction in the industry, specialized production-oriented by the assembly and welding of intermediate products, implements work order control management and compound type of work organization, establishes Lane separation process flow, and adopts parallel integrated manufacturing mode. As the core of the integrated construction technology, the blocks construction process is shown in Fig. 1. The quality management business runs through the full-cycle production process of the block. Based on the concept of the full-lifecycle, there are separate management processes in the initial stage of the project, the incoming inspection stage, the production stage, the delivery stage, and the quality assurance stage.
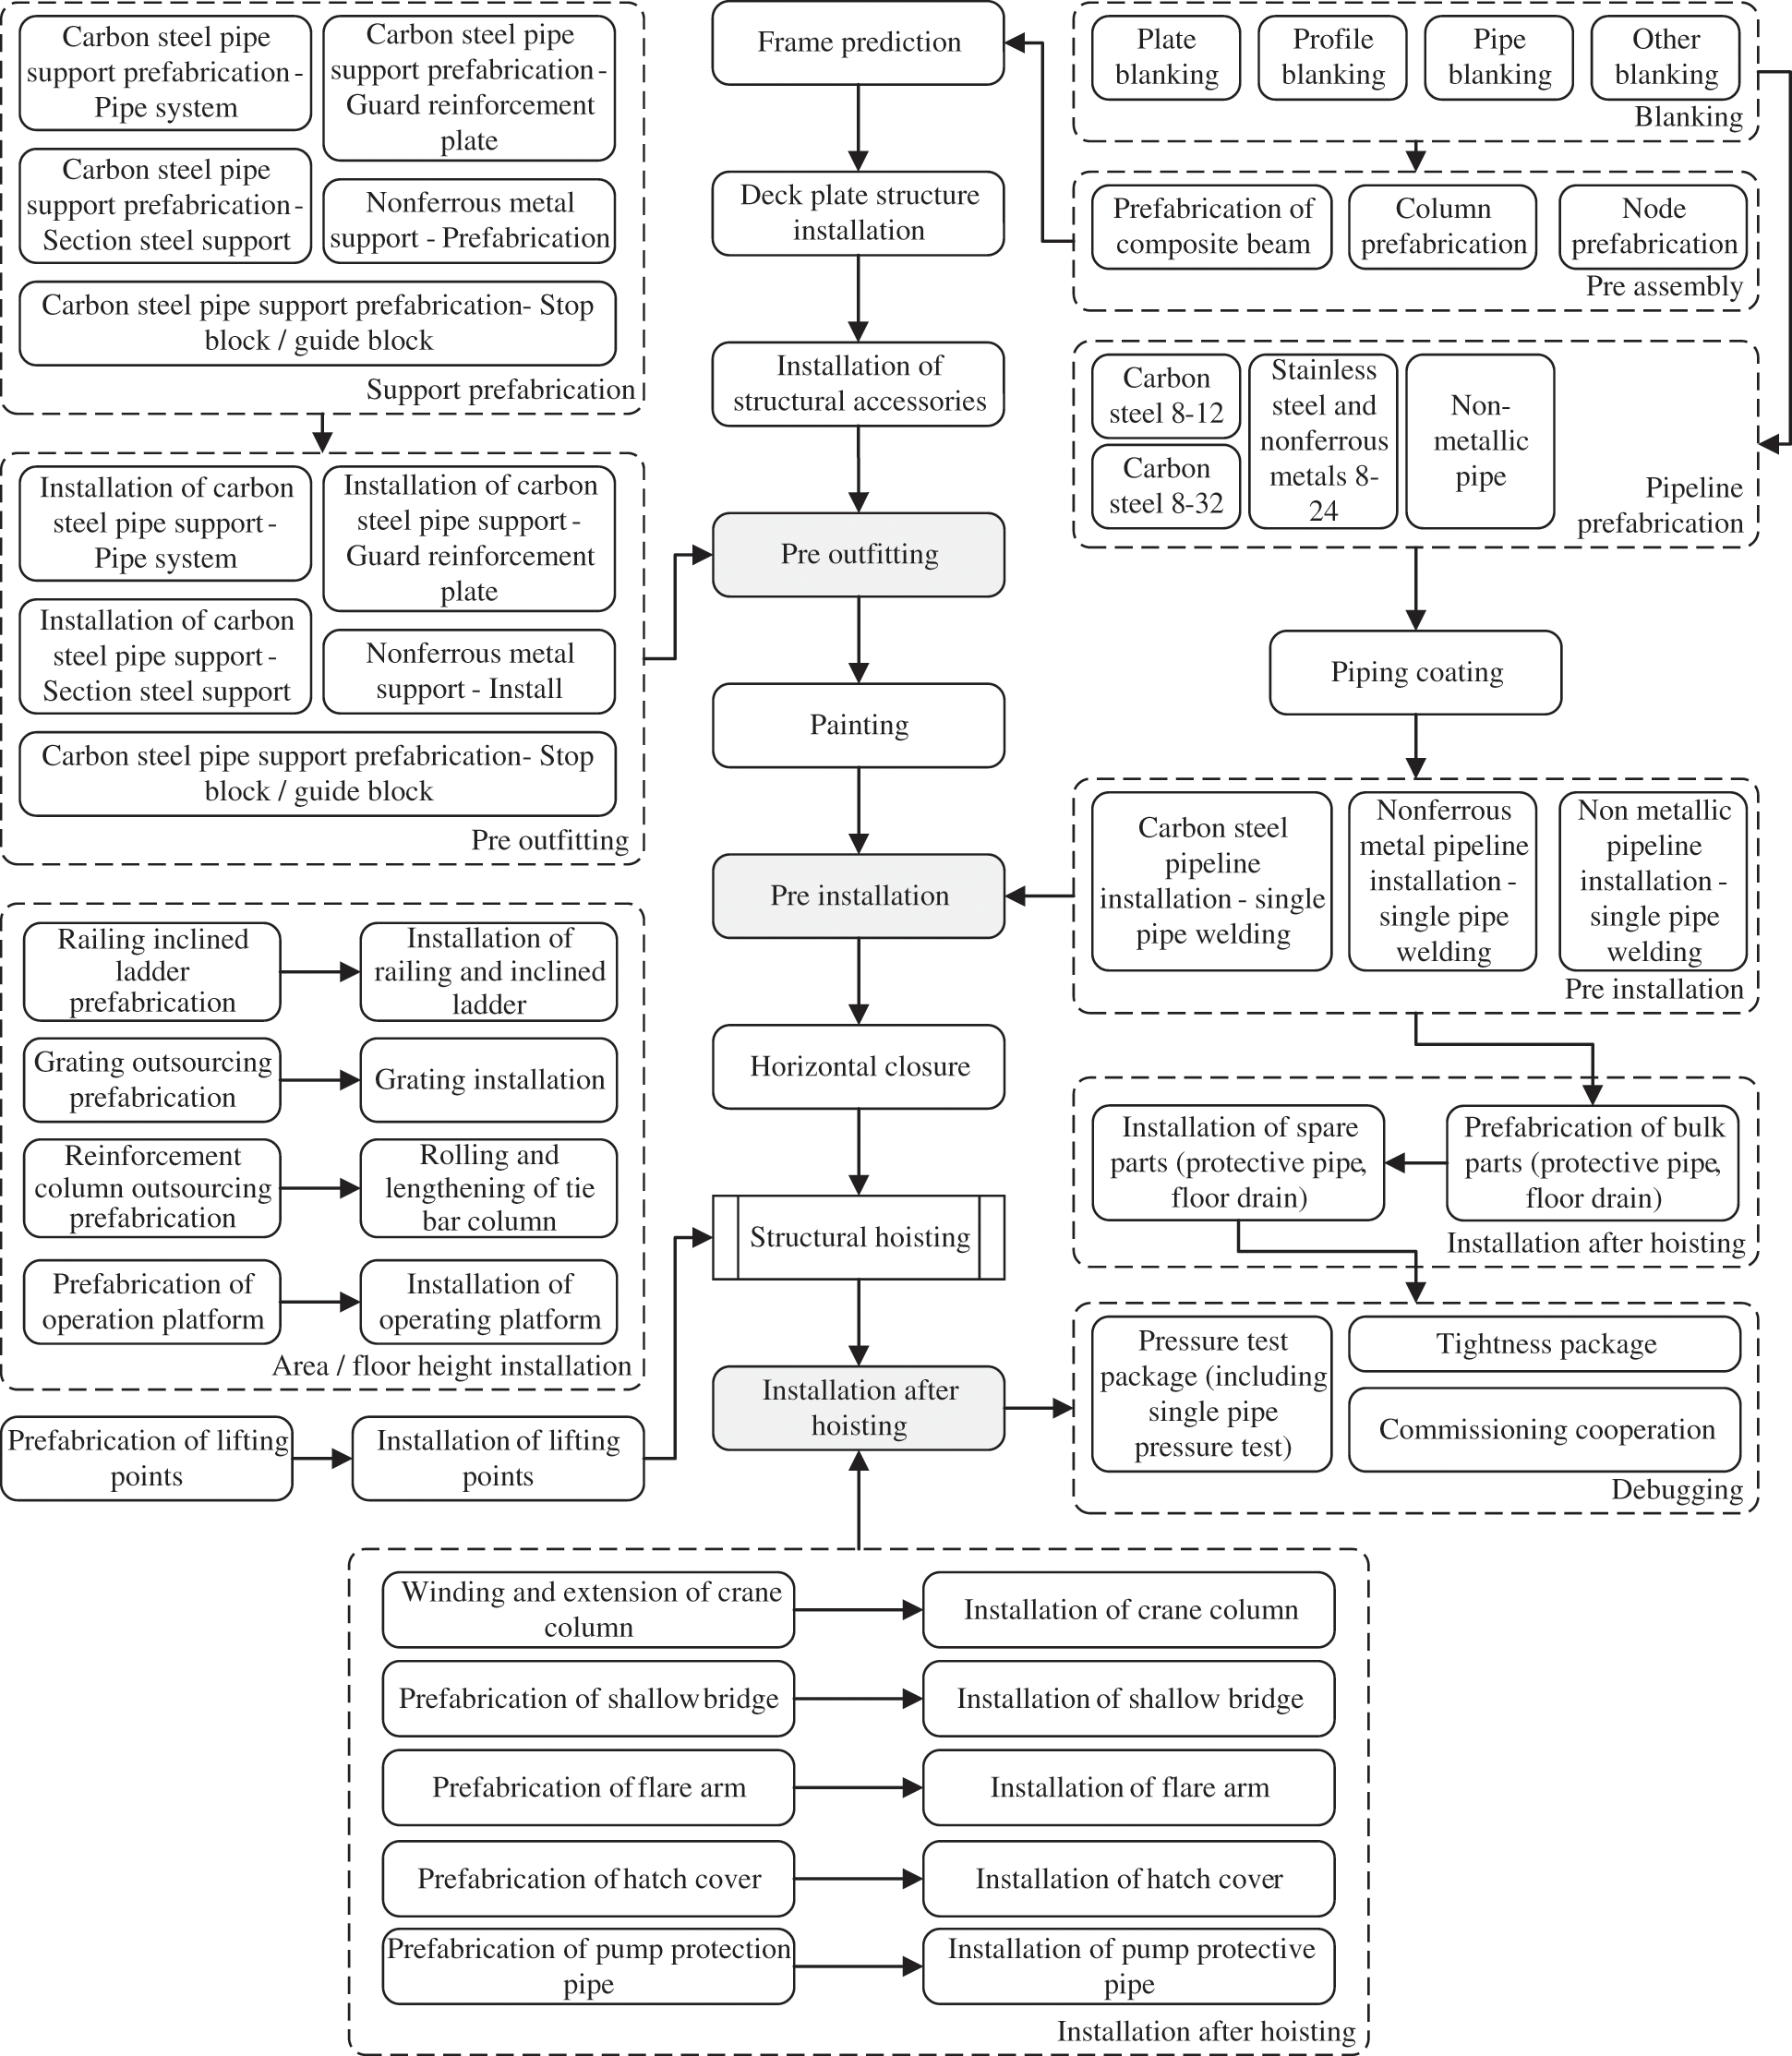
Figure 1: The process of offshore platform block construction
2.1.1 The Initial Stage of Projects
The project management department is primarily responsible for developing the welding quality Inspection and Testing Plan (ITP) at the initial stage of projects. The specific quality inspection procedure and precise regulations must be completed in collaboration with the technical department, the proprietor, and the third-party inspection, and must be used as a reference and standard for future welding quality inspections. Following the creation of the plan, the weld quality inspector will be taught and evaluated in accordance with the projects’ quality criteria. The quality inspector's inspection rating must be summarized and recorded in the Quality Control (QC) department.
2.1.2 The Incoming Inspection Stage
The QC department needs to verify the supplier, inspect the welding materials and equipment, and complete the arrival quality inspection report after the examination at the stage of incoming inspection. The proprietor and the third-party inspection shall check key equipment upon its arrival. The QC department is in charge of contacting the proprietor and any third-party inspections that may be involved in the inspection process, as well as organizing all parties to finish the inspection process and provide any necessary certificates.
The QC department's main task in the production stage is to inspect the assembly and welding construction operations at the stage specified in ITP, primarily welding appearance inspection, dimensional error inspection, and nondestructive inspection, as well as conduct sampling inspection in the production process to ensure the quality of the construction operation. Specific to different operation types, such as supervision of pre-set steel plates and pipe fittings, welding material inspection, machined part inspection, cable inspection, and so on. In the manufacturing stage, the QC department's major responsibility is to examine the assembly and welding processes. Self-inspection by the manufacturing unit, mutual inspection by supervisors, and special inspection by the quality department are all part of the inspection process at each level. The proprietor and third-party inspection will perform sampling inspections as part of the quality inspection process, and the QC department will need to submit the inspection application at the project stage at the key nodes. The third-party inspectors are aided by the QC department in completing the inspection. It is critical to categorize and coordinate all departments to settle disagreements.
The QC department predominantly completes general assembly inspection, completion commissioning, launching inspection, and other tasks throughout the delivery stage. Furthermore, it is in charge of inspecting a huge number of outfitting parts. The NDT of segmented welding is mostly handled by the general assembly. Following that, the QC department is required to compile and record essential quality reports and other written records.
2.1.5 The Quality Assurance Stage
In the quality assurance stage, provide structural dimension displacement detection, strength detection, flaw detection. If there are any quality problems, it will track out the individual who is accountable for welds, and provide rework services and technical support for the offshore platform during the daily operation of deep-sea oil wells.
2.2 Elements of Traceability Information Units Based on Work Orders
According to the analysis of the aforementioned research, a substantial amount of production data is created throughout the block construction and quality management processes for further traceability. We propose the concept of “Quality Traceability Information Unit” (QTU) based on work order to fully express the data content of the manufacturing process of the block in each link of the production line and to structurally express the data. QTUs are divided according to work orders. A single QTU includes intermediate product information, production execution information, resource information and quality inspection information related to blocks processing sets. Each QTU is associated with a work order and encompasses the three types of elements listed below.
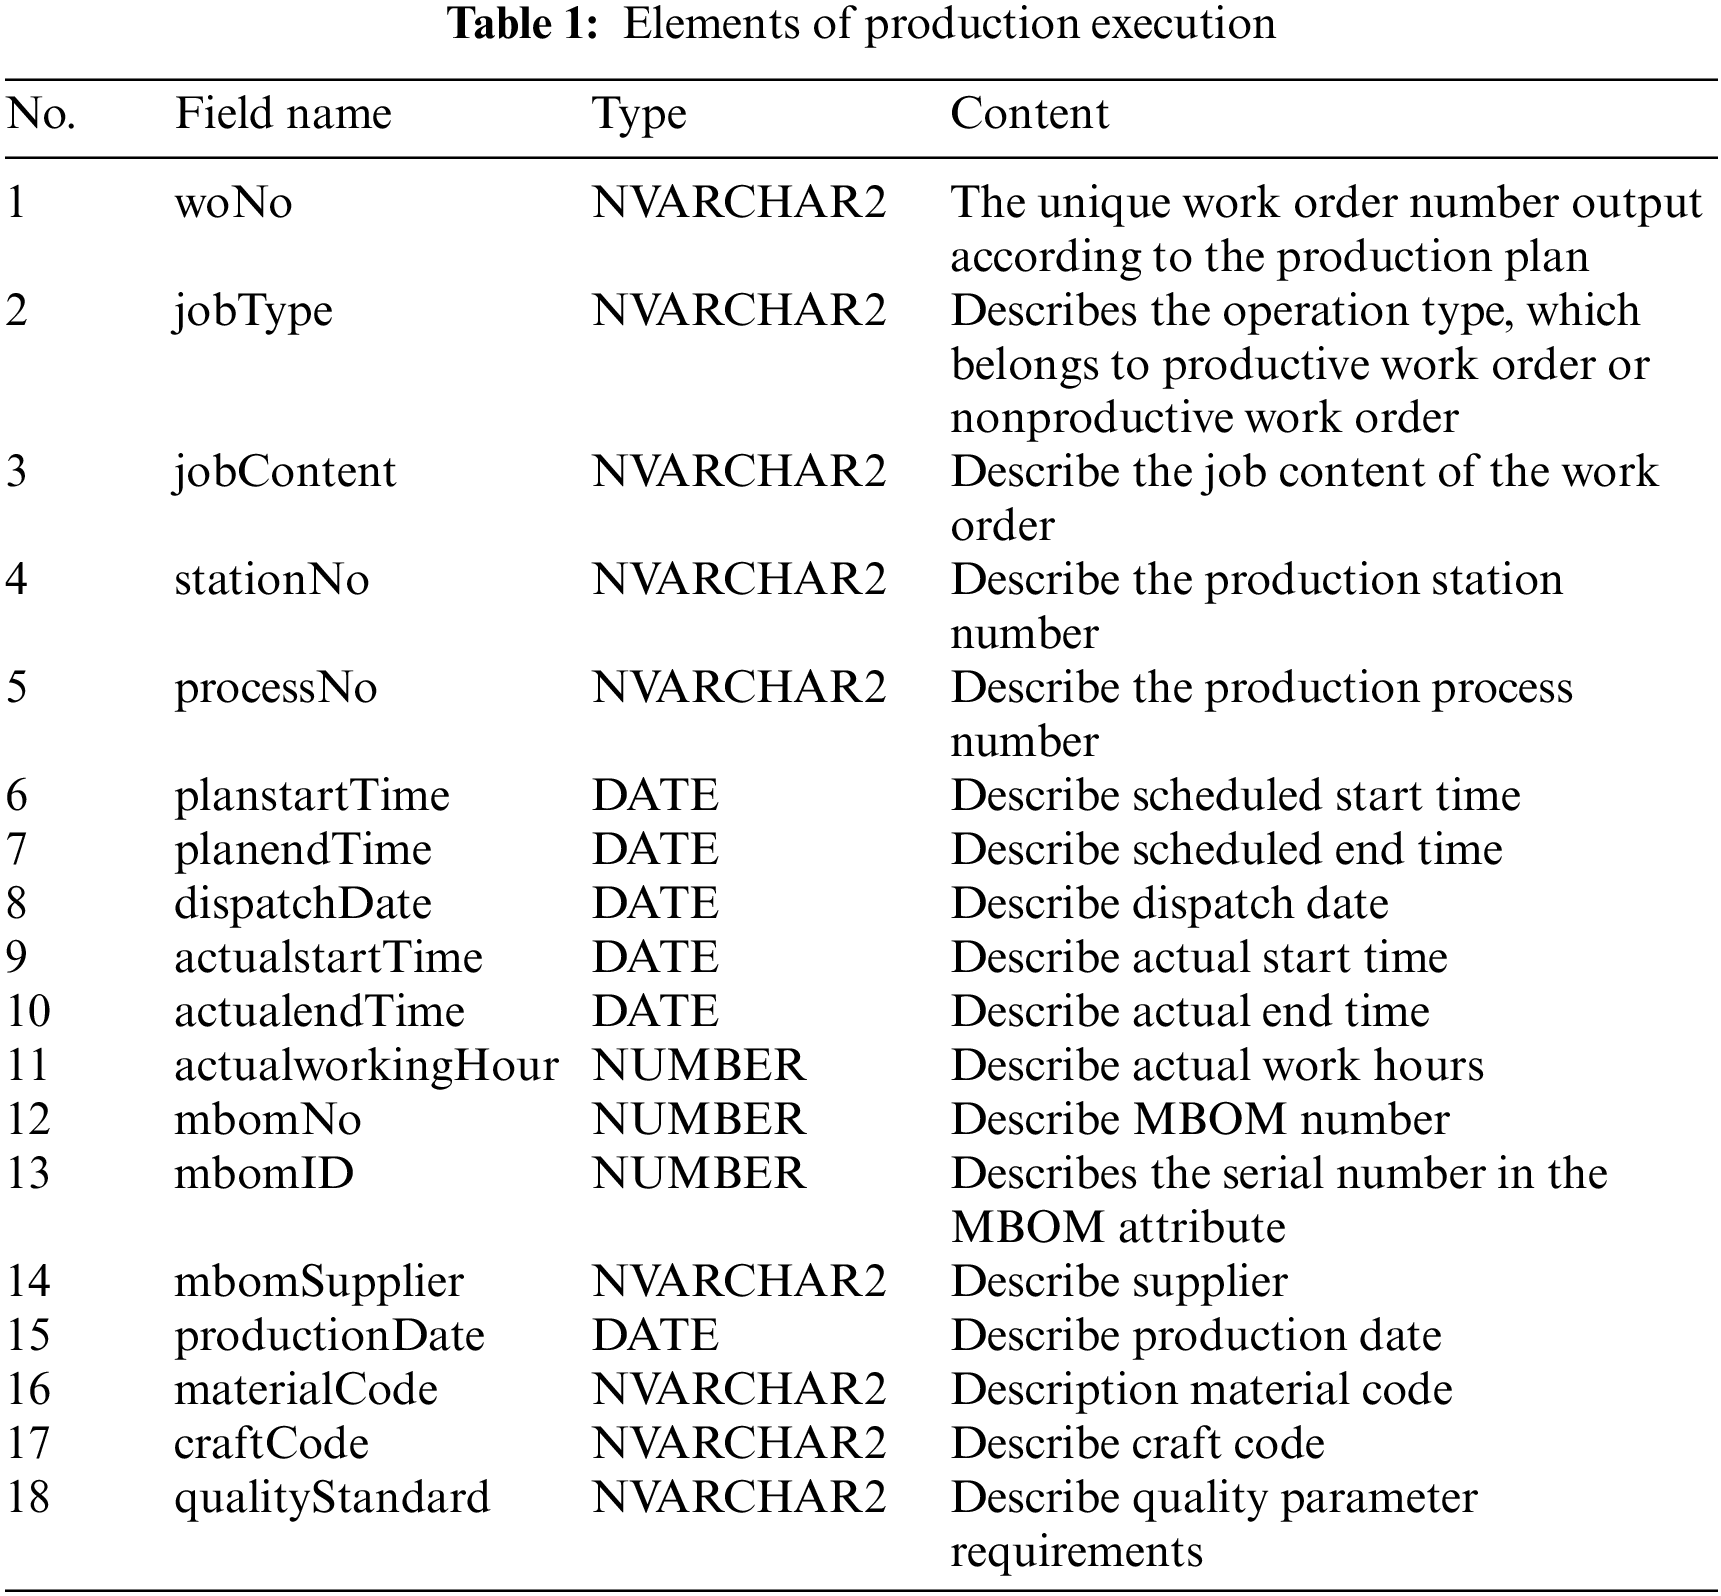
The carrier of arranging production activities is production execution information. Due to the discontinuous manufacture of each component product in a discrete manufacturing process, the whole manufacturing process is generally split by a manufacturing bill of materials (MBOM) [17], and the production activities of individual components are recorded in the form of work orders. In a discrete manufacturing process, production operation information includes material input and output, process input, quality parameter needs, production plan execution, and production plan closure. The operational activities can be categorized into productive and nonproductive operations based on their direct link to the product. Product processing and assembly are examples of production procedures that are directly related to the goods. It provides process information on how resources are used to create products that meet particular standards using operating methods. As a result, product information, operating procedure information, and material information are all included in manufacturing processes. Nonproductive operations are not directly related to product generation, such as station loading, job spot inspection, etc. The production operation information is identified by the work order number during execution, and the specific information of the production operation phase can be traced through the work order number. Table 1 gives the production execution information elements.
The assembly and welding process consume a significant portion of an offshore platform manufacturing firm's production resources, including process, station, staff, material resource characteristics, etc. In order to provide optimal coordinate manufacturing resources, define the total quantity and source of all resources used from raw material input to final platform delivery, and collaborate with material attribute analysis in the quality traceability process. According to its function, manufacturing resource information is separated into process resource information, human resource information, station resource information, and material resource information. The manufacturing resource information includes the kind of process operation, welder, and process equipment and material used during blocks assembly and welding. The elements of manufacturing resource information are presented in Table 2.

2.2.3 Quality Inspection Feedback
In the production and manufacturing process, as well as subsequent operation and maintenance, quality inspection feedback information is a description and record of numerous process requirements, process status, and inspection results. The structural inspection data for the whole life cycle of the block, from the start of the manufacturing line through subsequent operation and maintenance, must be collected. It primarily contains information on block structure, quality characteristics, production abnormalities, engineering changes, and quality event feedback, among other things. The quality feedback information may be traced back to the platform's quality characteristics and the relevant iterative update records in the production process, which is a crucial element of the block manufacturing process's backtracking. The quality feedback information elements are listed in Table 3.

2.3 Traceability Roles and Their Stakes in a Project
Each unit is associated with the stages of design, plan, progress, quality inspection, materials, outsourcing, operation, and maintenance, as can be observed by combining the above QTU elements. As a consequence, before constructing the traceability model, the functions of each information module must be clarified. In Fig. 2, we illustrate how these roles are theoretically independent of one another and may also achieve data linkage. Only by developing the welding quality traceability system, establishing the mode with the QTU as the center, and connecting each external system through the interface can the whole operation of the traceability job be completed in the offshore platform construction project.
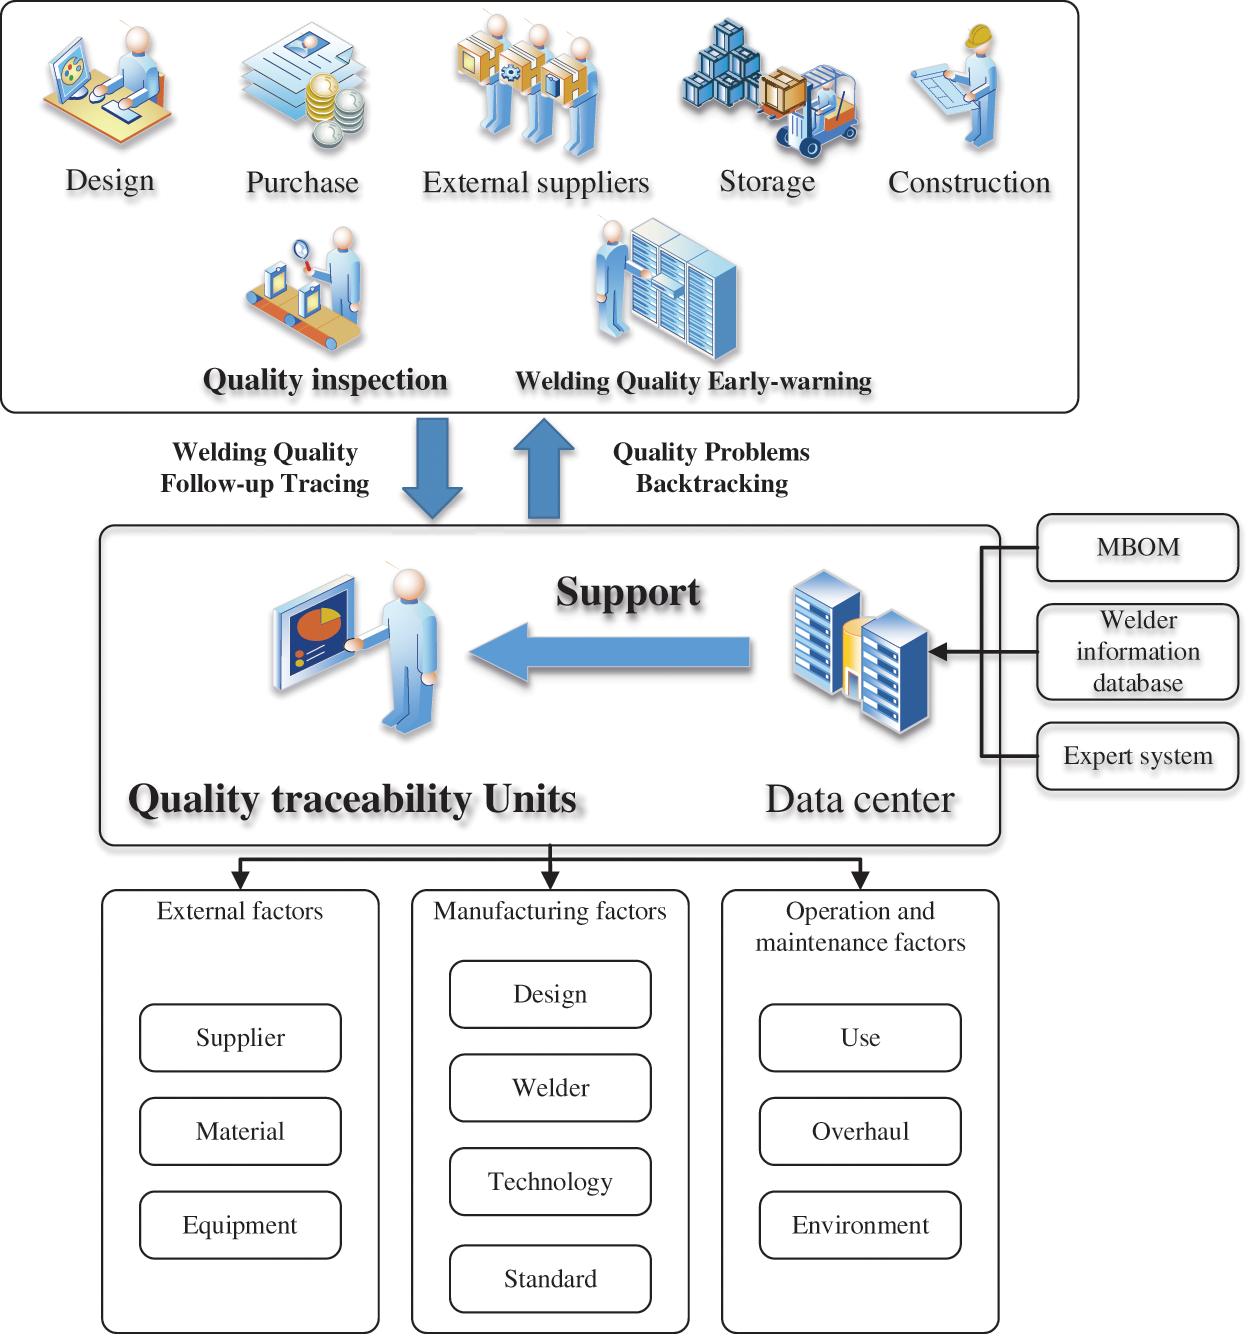
Figure 2: Overview of traceability roles and their stakes in a project
2.4 The Traceability Instantiation
To accomplish traceability, it is necessary to establish a traceability connection between QTU and the company's existing information systems. In this part, we create an entity-relationship model based on the information business research and traceability model requirements, which define and describe what is important to processes in quality traceability [18]. In Fig. 3, the QTU is simplified into an entity. The primary key, foreign key, index, and constraint relationship is built by linking the design software, Manufacturing Execution System (MES), platform operation and maintenance system, production master database, welding technology route database, and expert knowledge base, each element is implemented into the entity to complete the traceability instantiation.
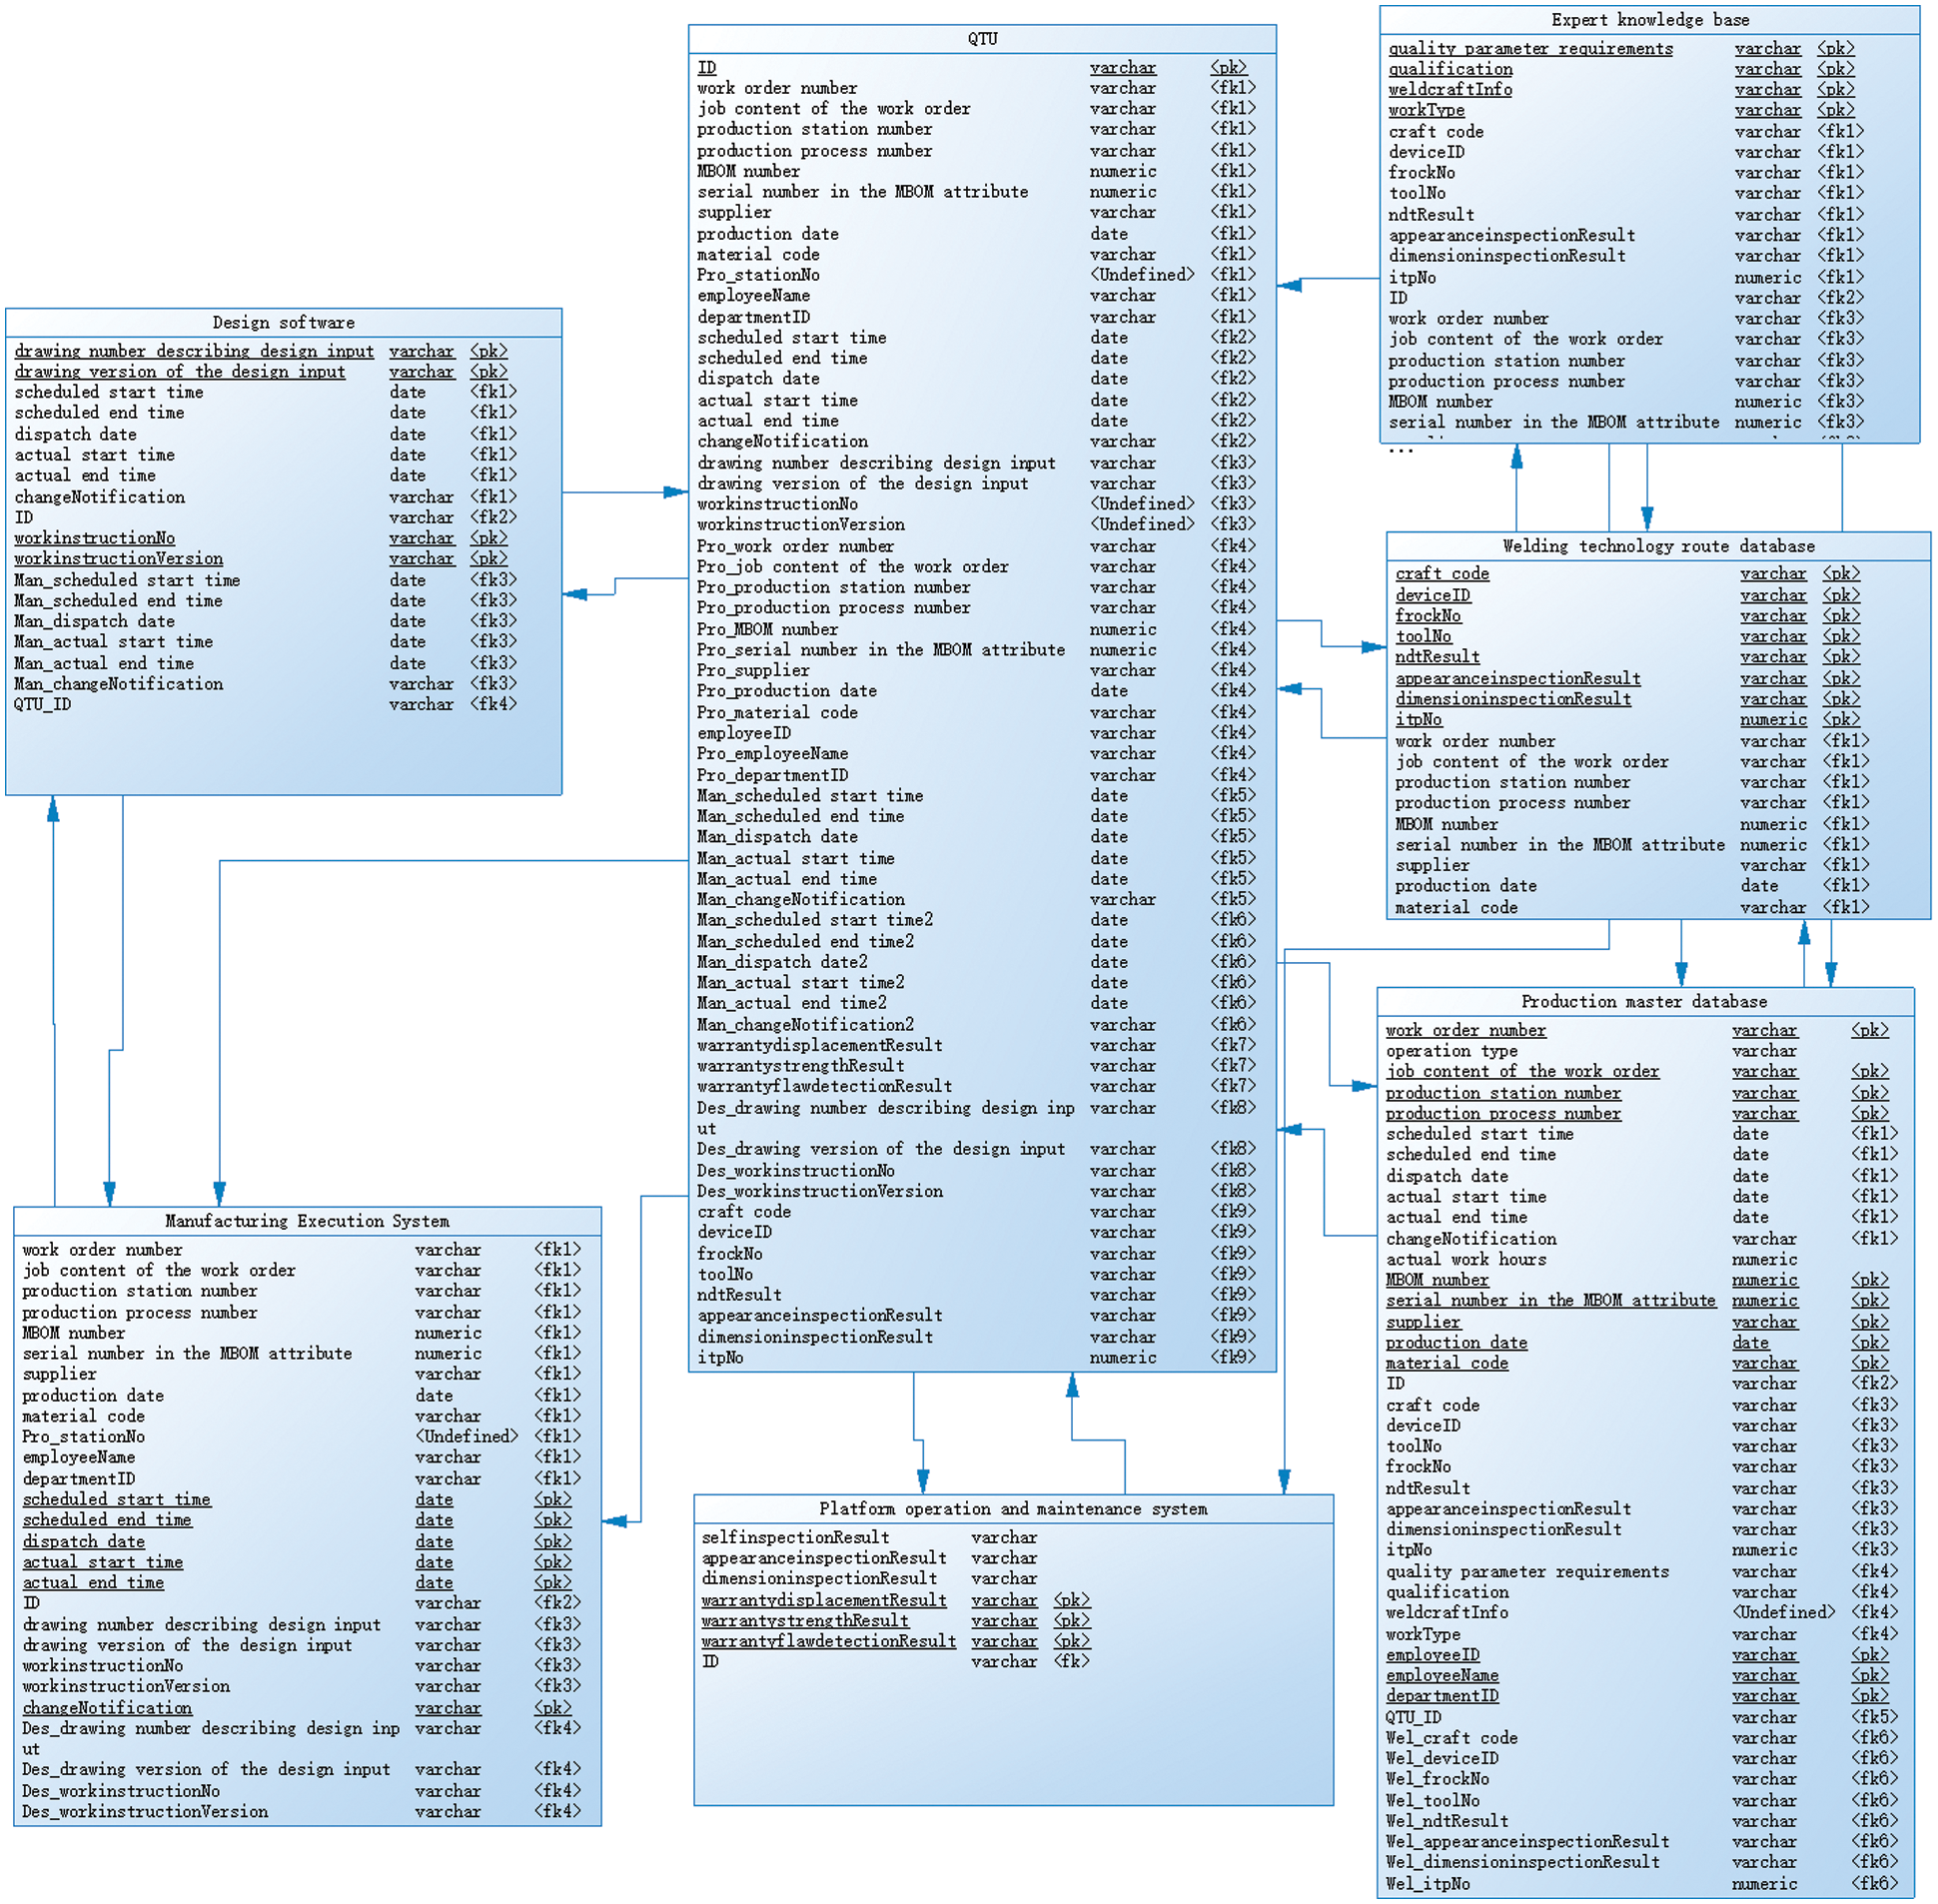
Figure 3: The entity relationship model of quality traceability model
3 Quality Traceability Model for Welding
In this section, we propose a set of composite welding quality traceability models that may be easily adapted to the actual offshore platform blocks construction process. Quality traceability is the process of identifying and then addressing faults. As a consequence, the most frequent errors in the blocks welding process should be analyzed first. Welding defects are the most prevalent cause of structural failure and accidents [19]. According to the provisions of GB 641 “Classification and Description of Metal Fusion Welding” (China), fusion welding defects include cracks, holes, solid inclusions, incomplete fusion, incomplete penetration, and shape defects. The quality traceability model determines whether each work order has a quality problem based on the defect type, tracks quality on a fixed cycle (day/month/year), finds abnormal measurement values by analyzing tracking data and provides an early warning in time, and then searches for information such as welding personnel, quality inspectors, welding materials, and problem parts based on the work order provided in the early-warning part.
3.1 Section of Welding Quality Follow-Up Tracing
The primary objective of the welding quality tracking process is to follow inspection results over time and determine if the welding quality is abnormal based on these data models, which can be done using multivariate time series prediction technology. In contrast to commonly used prediction models (such as Regression Analysis, Grey Prediction, and Markov Prediction), time series analysis realizes the prediction function by fitting and parameter estimation according to the measured data, eliminates the overfitting phenomenon of Regression Analysis in the face of high-order data, solves the lack of computational power of the Grey Prediction model when dealing with large sample data, and avoids the high requirements of a Markov Prediction model on the integrity and stability of enterprise quality data.
In multivariate time series analysis, anomaly identification is a critical issue. Many researchers have used deep learning algorithms to cope with anomaly detection in complicated data in recent years [20]. Zong et al. [21] examined the depth automated encoder and Gaussian mixture model in depth, estimated the density distribution of multidimensional data, and suggested a Depth Automatic Coding Gaussian Mixture Model (DAGMM). The generally used way for modeling the temporal correlation in time series is to employ Autoregressive Integrated Moving Average Model (ARIMA), Prophet Model, or Long Short-Term Memory networks (LSTM). ARIMA is known for its straightforward modeling. It just requires endogenous factors rather than exogenous variables, but time series data must be stable or stable after differential differentiation, and it can only capture linear relationships. As a result, ARIMA is unable to properly cope with welding data uploading delays, uneven content, and the unpredictability of welding flaws. Through nonlinear fitting of periodic data, the Prophet model successfully solves the problem of data loss and effectively solves the problem of trend migration and anomalous data points. However, one problem is that the prediction judgment is confined to a few input circumstances and cannot use more information to enhance the forecast results, such as the qualification rate judgment, which cannot be optimized based on welding process improvement. As a special recurrent neural network (RNN), LSTM tends to deal with unstable time series with more fixed components. The accuracy of LSTM is determined by the step-by-step prediction results, which correspond to the block creation process in accordance with the structure. Furthermore, LSTM has the potential to respond swiftly to rapid changes in patterns. Of course, like other neural networks, LSTM has the disadvantage of requiring a big quantity of data for proper training, and the prediction impact is restricted in the short term. The LSTM approach is used in this section because it has a high level of practicality and robustness in actual engineering.
The LSTM-based welding quality early-warning model is primarily used to input the welding strength, shape variable, stress value, and other parameters of all finished structural components, as well as to compute the fluctuation of relevant parameters in real-time. For instance, when the welding strength prediction curve clearly deviates from the welding process standard, an early-warning signal is issued to inform the next stage of the backtracking inquiry. In order to fulfill high-performance time series data prediction while keeping the quality tracking process interpretable. Following the model's generation of tracking prediction data, the residual is evaluated using a non-parametric and dynamic threshold approach, and the related work order is queried through the associated database and output to the quality problem backtracking section to begin the relevant process.
To be more specific, we create a set of models based on the number of work orders and welding inspection indications. Each work order gets its own model, which is used to store detection and prediction results. In Fig. 4, we set a time series

Figure 4: Overview of the input matrix used to predict each time step
We assume that
In (1),
In (2),
In order to reduce the possible false positives of quality defects in the model, based on the research of [22] and [23], this paper adds constraints. In (7), the elite strategy is combined with result correction, and the relationship between
A quality problem backtracking signal is represented as
3.2 Section of Quality Problems Backtracking
The Quality Problems Backtracking procedure is initiated based on the Quality Follow-up Tracking model after getting the welding defect early-warning signal or manually submitting the application. The main principle behind modeling in the enterprise quality management process is to concentrate on the breadth and speed of backtracking search, immediately clarify the search direction, and identify groupings.
The complete quality problem backtracking model contains two processes, which are quality problem backtracking query and defect identification. In the actual quality traceability process of offshore enterprises, the huge number of data tables and scattered key information, usually lead to slow query speed and inaccurate output information. Establishing a quality data query optimization algorithm is a reasonable solution to the exponential growth of data tables with the increase in query plans. Among the current mainstream query algorithms, there are three main categories, which are the Enumeration method, Heuristic Algorithms, and Intelligent Optimization Algorithms. Enumeration method as the query algorithm with the highest accuracy, by traversing all the data information, can completely output all the doubtful work order information, but its low efficiency is difficult to meet the fast query requirements. Heuristic algorithms are generally based on priority rules, which reduce the complexity of the search space by polynomials, but usually fall into the case of local optimum and cannot guarantee the stability of search results. Intelligent optimization algorithms have obvious advantages over the first two in solving query optimization problems of large databases, so genetic algorithms are chosen as the basis of query optimization algorithms in intelligent optimization algorithms, which can quickly complete the task of backtracking queries.
The defect identification process retrieves the attributes, design drawings, quality inspection sheets, production progress records, quality inspection sheets, welder information, welding materials, equipment, and other information of all welds involved under the work order according to the WO number output by the early warning model, starting with the early warning and information obtained from the query. Then, using statistical methods, connect to the enterprise's process route library, where the block welding standards are stored, extract the welding material attributes, strength attributes, weld size standards, and other data from the work order, and compare them to the work order inspection results one by one. Based on the layered method, check the defect location first, then compare the welding specifications, and determine the defect type based on the sample inspection. Finally, according to the welding execution process records, confirm that the defect belongs to one or more of the five categories: steel welding materials, mechanical equipment, welding personnel, operating environment, and process methods, and put forward the rework decision information.
The data interleaving phenomena are prevalent at this stage. Based on non-parametric tests of statistical analysis methods, the fast-processing capability and stable performance of Rank Sum Test (RST) become more important for such discontinuous data. Compared with the chi-square test, binomial distribution test, and variable randomness test, RST does not depend on the specific form of the overall distribution and can be applied without considering what kind of distribution the weld defects are and whether the distribution is known. It is very suitable for locating quality problems retrospectively. As a result, we propose an RST-based backtracking location model. Following that, it is confirmed that the defect cause is caused by one or more variables such as welding equipment and welding materials, based on the defect cause, by sample verification of five random welds under the work order. Finally, finish one by one the inventory of equipment and materials, as well as the retracing and placing of quality faults. We created a welding quality problem backtracking process model, as illustrated in Fig. 5.

Figure 5: Process model of welding quality traceability
The requirements of finding defects and rapid positioning in the process of welding quality management can be realized through the integration of the quality data backtracking query algorithm and the backtracking positioning test based on RST, which forms a feasible quality problem backtracking model.
Among them, the backtracking concept is built upon a judgment approach for welding flaws. We utilize the Kruskal Wallis test (K-W test) to see if more than two samples originate from the same probability distribution, which is based on statistical principles. We'll quickly outline the process of picking five weld sampling data for rank sum inspection using the quality inspection retracing triggered by a work order as an example.
Step 1: Make a hypothesis and order all of the observed values for each sample in ascending order.
e.g.,:
Step 2:
Step 3: Calculate the multiple Rank Sum Test statistics, and its value is:
In (9),
Step 4: According to the saliency level and degree of freedom of the sample, the sample rejection area is obtained to determine which type of quality problem the weld defect sample belongs to.
4 Solutions of Quality Traceability Model
This section describes in detail the training and algorithm implementation of the quality information early-warning model based on LSTM in the quality follow-up tracking stage, and the quality data backtracking query optimization algorithm based on Binary Search Tree (BST) in the quality problem backtracking stage in order to successfully apply the proposed set of composite welding quality traceability models in the assembly and welding process of blocks. The traceability model is linked to the production business through model training and query optimization algorithm development, and it may be enlarged and utilized in the enterprise's existing production execution system.
4.1 Training and Algorithm Implementation of Quality Information Early-Warning Model Based on LSTM
The execution judgment condition of the early warning model based on LSTM depends on
To train a unified model
According to the analysis of the above elements of the quality traceability unit, the quality data are scattered in each production subsystem, and the problem of data distribution and storage needs to be solved. Through model training using the federal learning paradigm, its characteristic learning objectives can be described as follows:
Among them, weights
After training all quality data source models
In (13), the neural network parameters are denoted by
The depth neural network and federal average algorithm are utilized to begin the iteration after getting the training goal

Figure 6: The process of quality data adjustment
Two LSTM layers, two Dropout layers, one Sense layer, and one Linear layer compensate the algorithm flow. The predicted time series data is generated by entering multivariate time series data. The LSTM and Dropout layers are maintained frozen during iterative computation, whereas the Sense and Linear layers are mostly modified. The following is the flow of the algorithm:
Input: Public data set
Step 1: Train the LSTM model
Step 2: Determine the number of algorithm cycles and enter the iterative calculation.
Step 3: Distribute the public data set
Step 4: Each data source trains its own model
Step 5: Aggregate and align the model parameters returned from all quality data sources, update and obtain
Step 6: End the cycle.
Step 7: Update each data source according to
Output: Quality data source model
4.2 Implementation of Quality Data Backtracking Query Optimization Algorithm Based on BST
We examine the techniques of welding defect judgment and blame localization based on rank sum test in the process of quality problem backtracking. In this section, we propose a quality information query optimization method to supplement the breakpoints from getting an early warning signal to finishing the defect diagnostic process, and we optimize the quality data traceability query path to achieve the best efficiency in the quickest period.
4.2.1 Strategy of Data Multi-Join Query
The strategy for executing query instructions in a database is a crucial technology for achieving data multi-join quick queries, and it is a significant component to consider when testing the database system's performance. Each input query expression will entail numerous data tables when dealing with a huge amount of welding quality data. The complexity and variety of Query Execution Plans (QEP) are determined by the diversity of connection order across tables. The algorithm must search in the subspace that may exist in the query value for extensive QEPs combined constitute a vast strategy space.
Based on the formal expression of mutating QEP into a join tree proposed by Schneider et al. [25], we propose a data multi join query strategy using binary tree search technology. In the case of querying four relationships, for a multi join query with n join operations, the correlation coefficient is
4.2.2 Model of Data Multi-Join Query Cost
There are I/O costs, storage costs, computing costs, and communication costs in data interactive communication. In the process of multi-connection query of welding quality data, I/O cost is the main influencing factor. We establish a model by using a dynamic cost estimation method. Taking a connection K containing two relationships
where,
If a query contains n relationships, the query cost is the cumulative sum of the intermediate node relationship
In (16),
The purpose of establishing a data multi-join query cost model is to specify the constraints for the welding quality traceability query optimization algorithm's implementation.
4.2.3 Design of Improved Algorithm
Through the construction of quality backtracking model and data multi-connection query cost model, the pre constraints and expected objectives of the algorithm are determined. We design an improved Genetic Algorithm based on Partition and Neighborhood-search to solve the multi-join query optimization problem of welding quality traceability data.
1) Ideas of Improvement
Based on the previous research, Partition Algorithm, which is a common quick sorting method, divides the query optimization stage into two stages according to the relational connection attributes, so as to improve the parallelism and speed up the query speed. In the first stage, it divides the sub-targets into “clusters” according to the query ability of the data source to form a new column. In the first “cluster”, all sub-targets output variables
2) Algorithm Flow
Based on the above ideas, we design an improved flow based on genetic algorithm, as shown in Fig. 7.

Figure 7: Schematic diagram of the improved genetic algorithm flow
The specific process is:
Step 1: Initialize algorithm parameters.
Step 2: Encode based on the left deep tree to form a legal chromosome.
Step 3: Use the “clustering” idea of the Partition Algorithm to find an effective QEP as the initial population.
Step 4: Calculate the fitness value of the current individual and determine the termination condition, if it meets, go to Step 8, otherwise, go to Step 5.
Step 5: Perform selection, crossover, and mutation operations within the current population.
Step 6: Determine whether the calculation reaches the predetermined time interval t. If it reaches the predetermined time interval t, go to Step 7, otherwise, go to Step 3.
Step 7: Perform the neighborhood search stage.
Step 7.1: Calculate fitness value
Step 7.2: Calculate
Step 7.3: Select the chromosome K that satisfies the fitness function in the field.
Step 7.4: Perform crossover work according to crossover probability to obtain new chromosomes.
Step 7.5: Select the best chromosome to replace i in the new chromosomes generated according to the elite strategy, and return to the genetic algorithm loop.
Step 8: The program ends, output the optimal QEP sequence, and find the welding quality data content according to QEP, and complete the traceability.
In the process of algorithm implementation, it is necessary to issue these additional statements of the key factors to make the algorithm completes.
1) Neighborhood Structure
Neighborhood structure is to limit the local search range to a small range. Specifically, when chromosomes i and j meet the condition of (17), chromosome j is called the neighborhood of chromosome i.
where,
2) Chromosomal Coding
In the Multi-join Query Optimization Problem, the chromosome coding design is mostly based on the shape of the join tree, and different tree shapes correspond to different QEP. Considering that different join trees involve different connection relationships, and whether the tree shape is legal or not. We use the left deep tree as the search space, use the way of first root traversal, express the relationship (i.e., leaf node) with decimal numbers, and express the join operation (i.e., root node) with letters, so as to intuitively reflect the tree structure and facilitate the subsequent genetic operation.
According to the coding rules, the chromosomal code of query Q is
3) Fitness Function
Since this algorithm uses special methods to process population initialization and genetic operation, it will not lead to the generation of illegal chromosomes. Therefore, there is no need to introduce penalty function in individual fitness evaluation. The fitness function of this algorithm is:
4) Probability of Selection
The selection operation is based on individual fitness, and the main purpose is to avoid the loss of better genetic genes, so as to improve the global convergence. In this paper, roulette selection method [26] is adopted and elite retention strategy is adopted. The selection probability is defined as:
where N is the population size and
5) Probability of Crossover and Mutation
Crossover probability
where,
6) Crossover Operator
In this paper, the chromosomal code is generated by traversing the left deep tree first. Therefore, the premise of genetic operation is to ensure the legitimacy of chromosome, that is, to ensure the legitimacy of join tree. Based on this consideration, we adopt the crossover strategy of equal large and small trees to ensure the tree type legitimacy of left deep tree, that is, two subtrees with equal size and similar shape are randomly selected under the crossover probability to generate offspring through crossover operation. In view of the two problems that cross operation will lead to the interleaving of nodes and relationships, which makes the tree structure impossible to form, and the generation of duplicate genes after crossover, this paper takes the following measures to adjust the chromosome after crossover: exchange the leaf node representing the relationship with the root node representing the join operation. The duplicate genes were randomly changed to the remaining genes that did not appear. Let two join trees to be crossed. The chromosomes of X and Y are as follows, where “|” represents the intersection.
After crossover:
Obviously, there are duplicate gene bit c and 5, less b and 6, so b and 6 are used to replace c and 5. Similarly, the adjusted result is:
7) Mutation Operator
Select the offspring generated after crossing with a small probability to mutate, so as to make its gene mutation. In order to ensure that the chromosome can still be expressed as a legal join tree after mutation operation, two operations are proposed: random exchange of gene positions of any two decimal numbers in chromosome individuals; Take letters or numbers as separators and randomly divide them into equal size strings for gene bit exchange. The mutation results are shown in Fig. 8.

Figure 8: Schematic diagram of mutation operator operation process
In this section, we discuss an empirical validation of the proposed Quality Traceability Model and its solutions. Our major purpose for proposing this model is to cover all companies in the quality traceability process of an offshore platform manufacturing facility, as well as to finish the project application. In case verification, there are two areas of study. The first is to test the feasibility of an early warning model in the welding quality follow-up tracking stage, and the second is to examine the efficacy of the data multi-join query optimization technique in the quality problem backtracking stage.
We conducted model test experiments in the offshore platform manufacturing enterprise for more than half a year, collaborated with the enterprise's existing Manufacturing Execution System, completed the development of multiple quality related database interfaces, and obtained some welding quality data with permission in order to ensure the authenticity of the example verification results.
In particular, in order to fully train the quality early-warning model, we preset the model training parameters in Table 4.
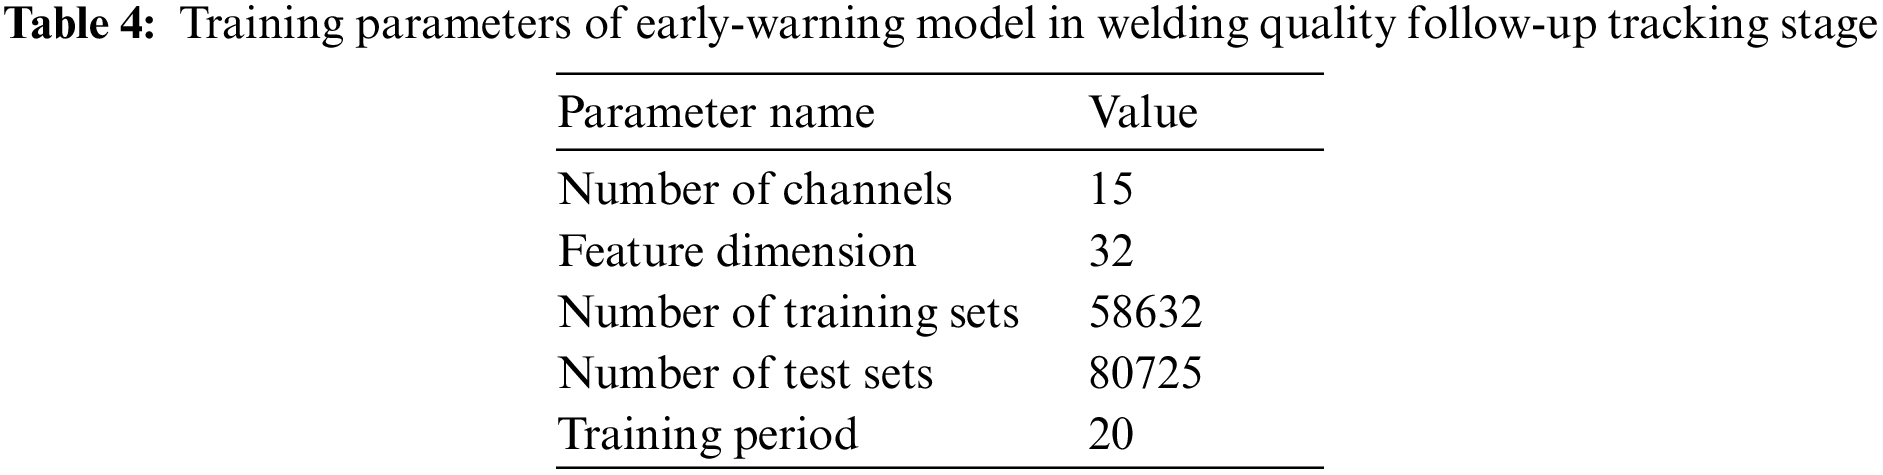
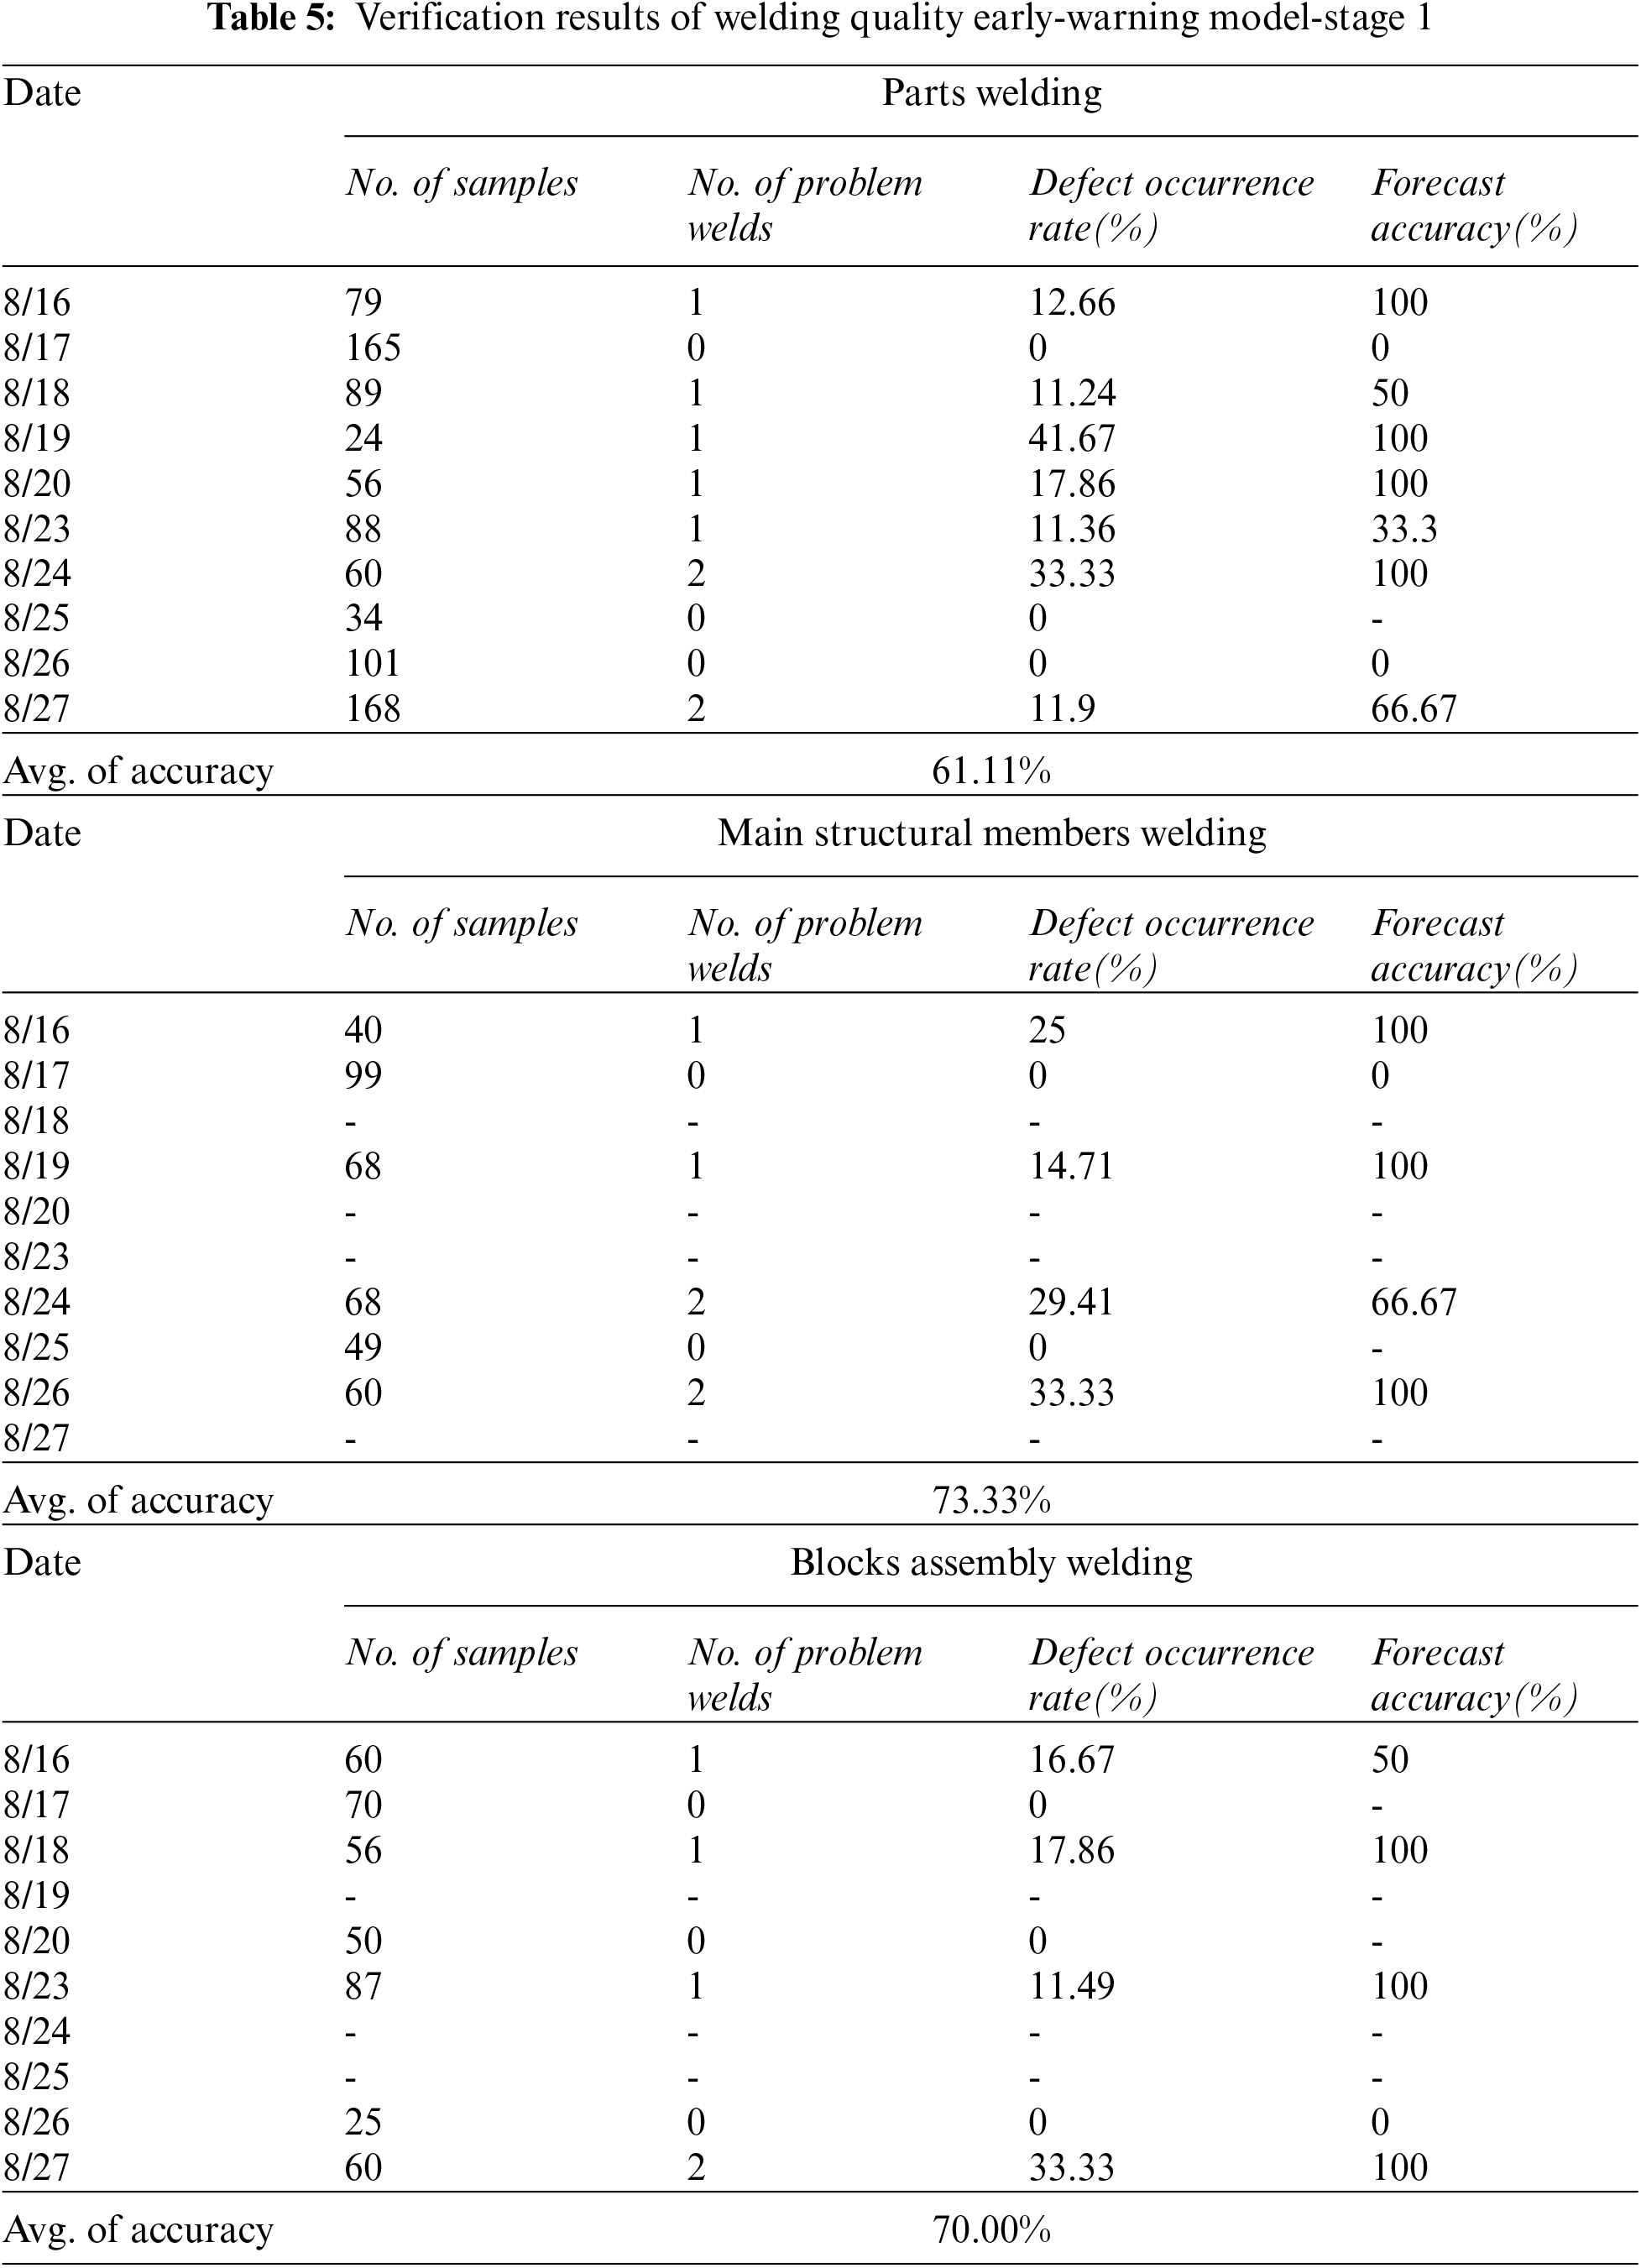
5.2.1 Model of Welding Quality Early-Warning
Through the training of the Quality Early-warning Model, we have preliminarily applied it in the manufacturing enterprises of offshore engineering platforms. In this study, we have completed the collection and analysis of multiple groups of quality tracking data. Considering that there may be quality fluctuation in different areas of the block, we have selected three scene statistical models to predict the accuracy, as shown in Table 5. We have selected the same time period, three different types of welding processes of parts, main structural parts, and segmented assembly are followed up for two weeks by using the welding quality tracking model. We found that: (1) The accuracy of the quality early warning model under the three scenarios has exceeded 60%, which can confirm the effectiveness of the model in the actual welding production process. (2) The quality early-warning model has the best success rate in tracing the welding quality of main structural parts, followed by the assembly welding of blocks, and the worst judgment effect on the welding quality of parts, which proves that the quality judgment of the model for large-size welds is better than that for small-size welds. (3) In the verification process, after the quality warning is issued by the model, the welding quality is usually verified by manual re-inspection. Some welds may not need to be traced and reworked, which is also the low accuracy caused by high identification sensitivity. (4) Because the three test scenarios are in the actual production process, the number of welds tested is different, so the prediction accuracy will vary with the number of samples. Considering that the number of test stages has reached the minimum requirements, the overall fluctuation range is controllable.
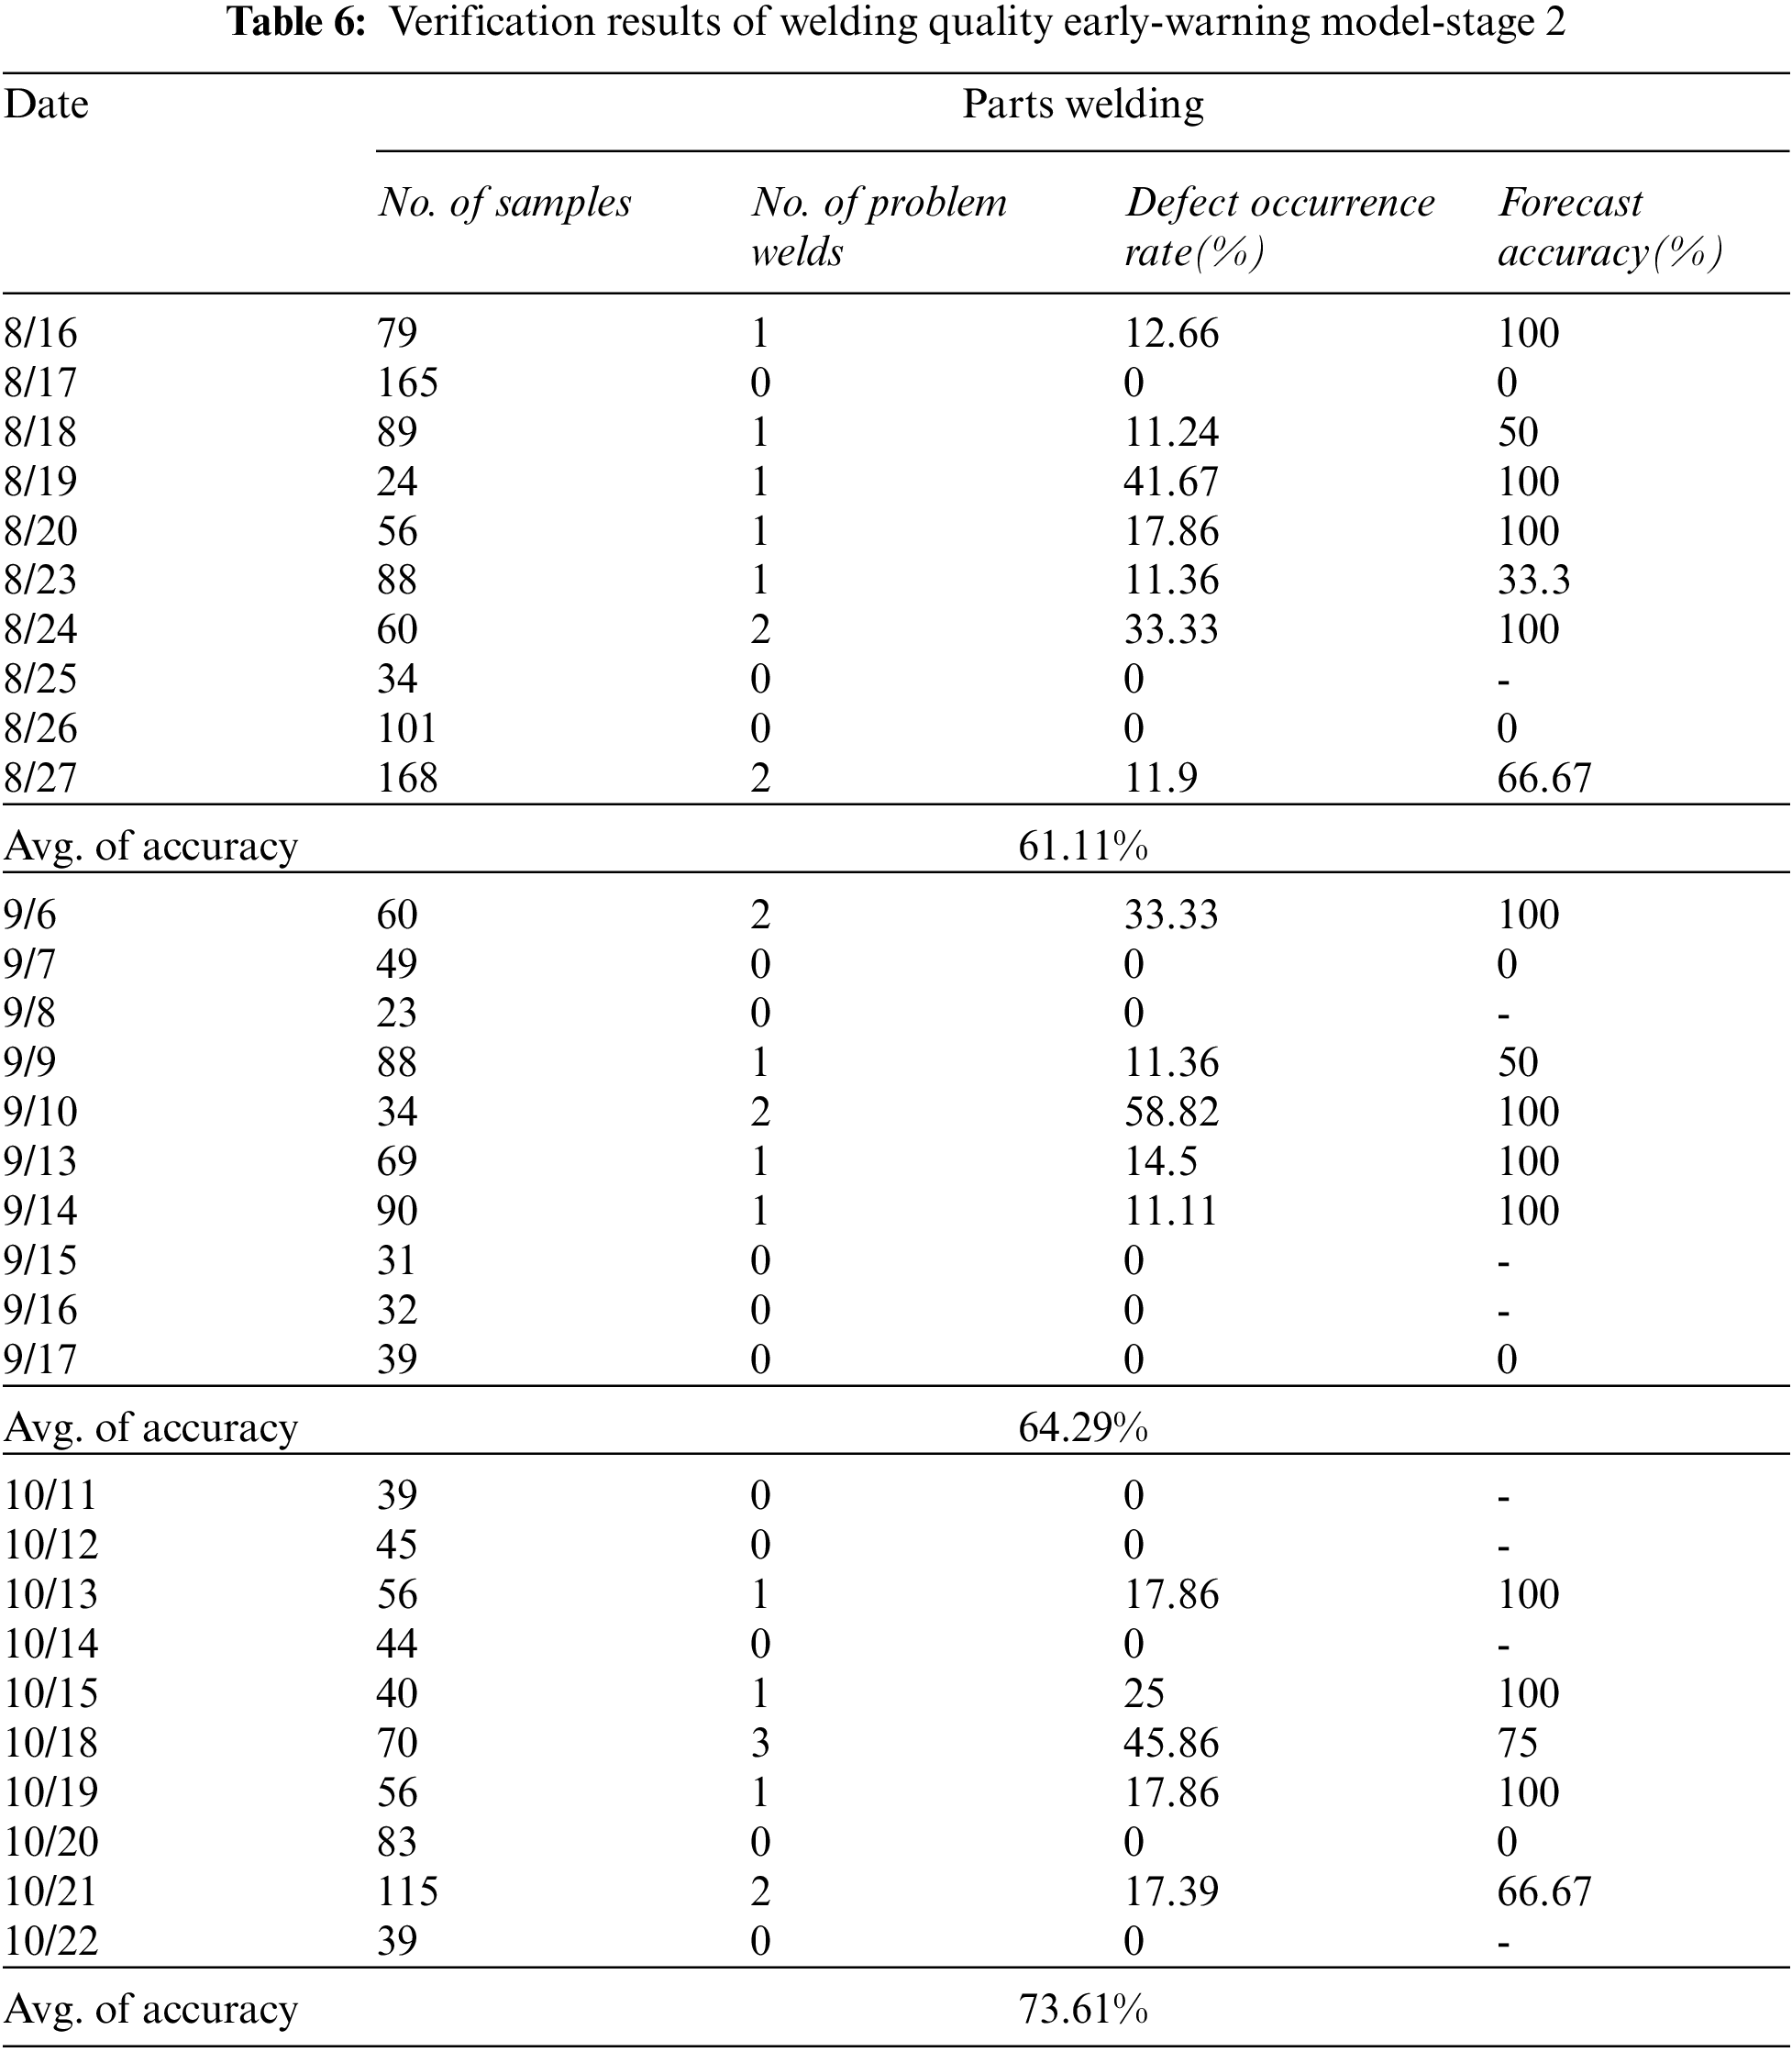
Based on the first verification results, we continuously tracked the welding quality data of parts for 3 months. The verification results are shown in Table 6. We found that: (1) Considering that the average accuracy rate of early warning of welding defects of parts in two working weeks from August 16 to August 27 is 61.11%, which is significantly lower than that in the main structure and blocks assembly and welding stage, we recorded the prediction accuracy rate for two weeks every month in September and October, and obtained 64.29% and 73.61% respectively. With the continuous extension of the verification time of LSTM, extensive welding quality data are input into the model, which can effectively improve the prediction accuracy. Meanwhile, it is also verified that LSTM must pass a large number of data training in order to achieve accurate welding defect prediction and put into practical use. (2) According to the occurrence rate of welding defects, with the opening of the quality tracking and detection mode, the welding quality is gradually improved. A large number of early warnings urge the welding personnel to pay more attention to improving the welding process and reducing the occurrence of welding defects. (3) According to the two rounds of model test results, the welding quality tracking stage early warning model proposed in this paper is effective. In addition, it is also necessary to further improve the prediction accuracy through continuous training of the model in the later stage.
5.2.2 Data Multi-Join Query Optimization Algorithm
In order to verify the performance of the Data Multi-join Query Optimization Algorithm in the process of welding quality data backtracking query, we implemented the algorithm in Python and compared its performance with Partition Algorithm and Genetic Algorithm to demonstrate the feasibility and effectiveness of the algorithm in practical engineering. In the validation initialization stage, we selected 8 groups of queries, and the number of relationships increased in turn, each group ran 20 times, took the average execution time, and all tested the optimal solution and optimal convergence algebra. In the initialization part of the algorithm, the population size is set to 100, the crossover probability is 0.6, and the mutation probability is 0.01. The specific experimental results are shown in Table 7. In addition, the average execution time of the three algorithms is also obtained, as shown in Fig. 9 and the average convergence generation curve in Fig. 10.
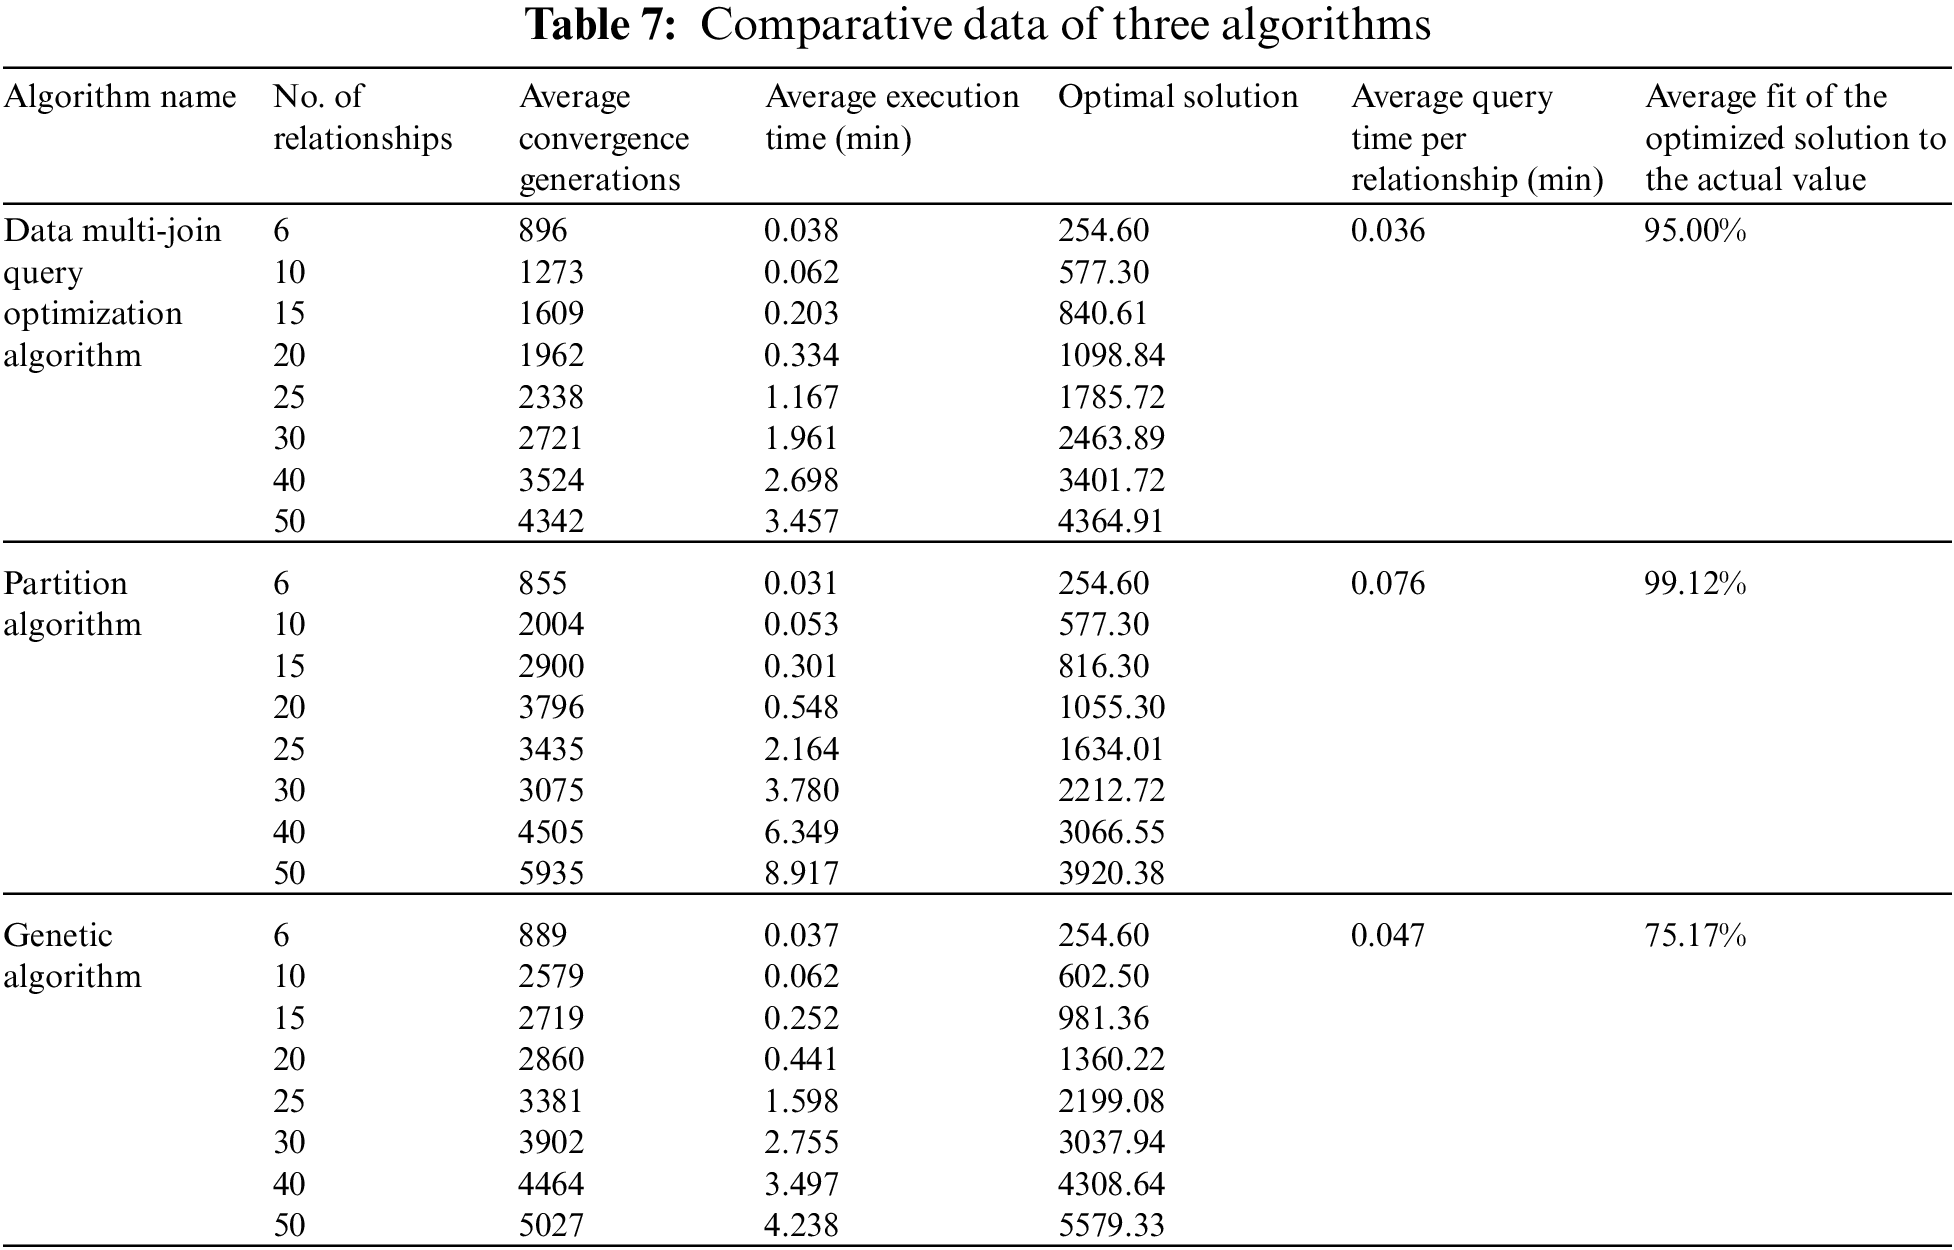

Figure 9: Average execution time curve

Figure 10: Average convergence generations curve
It can be seen from the verification results. Each of the three algorithms can obtain its own optimal solution, and the partition algorithm can receive the optimal solution in the three algorithms. By comparing with the results of all screening by enumerating method, the partition algorithm and the algorithm proposed in this paper can better fit the actual value. According to the average convergence generations, the data multi-join query optimization algorithm converges fastest among the three algorithms, and the average query time per relationship is significantly better than the other two algorithms. Considering the principle of being fast and accurate in the actual quality traceability process, when enumeration screening cannot be implemented, we take the optimal solution of partition algorithm as the target value and compare the fitting degree of genetic algorithm and data multi-join query algorithm to the optimal solution, as shown in Fig. 11. It can be seen that the proposed algorithm is closer to the optimal solution, and its advantages are more obvious than the Genetic Algorithm with the increase of the number of relationships.

Figure 11: Optimal value fitting curve
In this paper, we propose a Composite Welding Quality Traceability Model to adapt to the actual construction process of offshore platform blocks, which is feasible and easy to use. By combing the business processes of offshore platform construction enterprises and summarizing the elements of the quality traceability model, the construction objectives of quality traceability model are defined, and the model is divided into two sections: Quality Follow-up Tracing and Problem Backtracking. In the stage of welding quality follow-up tracking, we put forward a set of welding Quality Early-warning Model based on LSTM, and carried out model training and case verification. It has proven that effectiveness of the proposed early-warning model in practical application. In the quality problem backtracking stage, the implementation of the Welding Quality Backtracking Query Optimization Algorithm based on BST is studied. In addition, in order to realize the source location of the quality problems, a welding defect discrimination model based on Rank Sum Test is established.
In the process of verifying the welding quality prediction and data query, the welding defect early warning with good accuracy and fast and accurate data query fully demonstrate that the above methods are suitable for establishing the welding quality management model, It can solve the low-efficiency problem found in the investigation of the actual quality management implementation process of offshore engineering enterprises, which is “result-oriented, according to the unqualified structure inspection, manual tracing of paper files, backward reasoning of the causes of welding defects and accountability”. The intelligent idea is introduced into the implementation process of quality control. Based on this series of research work, a quality traceability management system for the whole production process has been established. In comparison to the traditional quality management mode, the early warning model can assist quality inspectors in detecting welding defects earlier, the quality data backtracking query has more targeted retrieval and more efficient defect discrimination, changes the way of manual classification and search of multiple databases in the actual traceability process, and can quickly generate quality control decision information.
We will broaden the scope of existing research and address the unification of quality management and welding standards for the multi-agent dispersed maritime manufacturing sector in the future research project. We will continue to research big data and blockchain technology's vast quality data retrieval algorithms, and train a high-accuracy welding quality early warning model in line with actual enterprise production over time.
Acknowledgement: The authors are responsible for the contents of this publication. Besides, the authors would like to thank lab classmates for contribution to the writing quality.
Funding Statement: This research program is funded by Ministry of Industry and Information Technology of the People's Republic of China [Grant No. 2018473].
Conflicts of Interest: The authors declare that they have no conflicts of interest to report regarding the present study.
References
1. Miao, S. (2014). Research on welding quality traceability management technology of jack-up drilling platform. (M.A. Thesis). Harbin Engineering University, Harbin, China. [Google Scholar]
2. Olsen, P., Borit, M. (2013). How to define traceability. Trends in Food Science & Technology, 29(2), 142–150. DOI 10.1016/j.tifs.2012.10.003. [Google Scholar] [CrossRef]
3. Rempel, P., Mäder, P. (2015). A quality model for the systematic assessment of requirements traceability. 2015 IEEE 23rd International Requirements Engineering Conference (RE), Ottawa, ON, Canada. [Google Scholar]
4. Adam, S., Doerr, J. (2007). On the notion of determining system adequacy by analyzing the traceability of quality. Proceedings of Workshops and Doctoral Consortium, Germany. [Google Scholar]
5. Salem, A. M. (2010). A model for enhancing requirements traceability and analysis. International Journal of Advanced Computer Science and Applications, 1(5), 14–21. DOI 10.14569/ijacsa.2010.010503. [Google Scholar] [CrossRef]
6. Cheng, M. J., Simmons, J. E. L. (1994Traceability in manufacturing systems. International Journal of Operations & Production Management, 14(10), 4–16. DOI 10.1108/01443579410067199. [Google Scholar] [CrossRef]
7. Steele, D. C. (1995). A structure for lot-tracing design. Production and Inventory Management Journal, 36(1), 53. [Google Scholar]
8. King, B. (2000). The practical realization of the traceability of chemical measurements standards. Traceability in chemical measurement, pp. 85–92, Berlin, Heidelberg, Springer. [Google Scholar]
9. Peng, L., Wen, L., Qiang, L., Yue, D., Min, D. et al. (2020). Research on complexity model of important product traceability efficiency based on Markov chain. Procedia Computer Science, 166, 456–462. DOI 10.1016/j.procs.2020.02.065. [Google Scholar] [CrossRef]
10. Khabbazi, M. R., Ismail, N., Ismail, M. Y., Mousavi, S. (2009). Data modeling of traceability information for manufacturing control system. 2009 International Conference on Information Management and Engineering, pp. 633–637, Kuala Lumpur, Malaysia. [Google Scholar]
11. Mustafa, N., Labiche, Y. (2015). Towards traceability modeling for the engineering of heterogeneous systems. 2015 3rd International Conference on Model-Driven Engineering and Software Development (MODELSWARD), pp. 321–328, Angers, France. [Google Scholar]
12. Li, C., Ji, D., Lv, B., Zhang, S. (2020). Research on traceability modelling of tobacco production quality based on information synergy. Journal of Physics: Conference Series, 1646(1), 012124. DOI 10.1088/1742-6596/1646/1/012124. [Google Scholar] [CrossRef]
13. Westerkamp, M., Victor, F., Küpper, A. (2018). Blockchain-based supply chain traceability: Token recipes model manufacturing processes. 2018 IEEE International Conference on Internet of Things (iThings) and IEEE Green Computing and Communications (GreenCom) and IEEE Cyber, Physical and Social Computing (CPSCom) and IEEE Smart Data (SmartData), pp. 1595–1602, Halifax, NS, Canada. [Google Scholar]
14. Casino, F., Kanakaris, V., Dasaklis, T. K., Moschuris, S., Rachaniotis, N. P. (2019). Modeling food supply chain traceability based on blockchain technology. IFAC-PapersOnLine, 52(13), 2728–2733. DOI 10.1016/j.ifacol.2019.11.620. [Google Scholar] [CrossRef]
15. Wang, S., Li, D., Zhang, Y., Chen, J. (2019). Smart contract-based product traceability system in the supply chain scenario. IEEE Access, 7, 115122–115133. DOI 10.1109/Access.6287639. [Google Scholar] [CrossRef]
16. Zhang, Z., Yuan, Z., Ni, G., Lin, H., Lu, Y. (2020). The quality traceability system for prefabricated buildings using blockchain: An integrated framework. Frontiers of Engineering Management, 7(4), 528–546. DOI 10.1007/s42524-020-0127-z. [Google Scholar] [CrossRef]
17. Lee, C., Leem, C. S., Hwang, I. (2011). PDM and ERP integration methodology using digital manufacturing to support global manufacturing. The International Journal of Advanced Manufacturing Technology, 53(1), 399–409. DOI 10.1007/s00170-010-2833-x. [Google Scholar] [CrossRef]
18. Chen, P. P. S. (1976). The entity-relationship model—Toward a unified view of data. ACM Transactions on Database Systems (TODS), 1(1), 9–36. DOI 10.1145/320434.320440. [Google Scholar] [CrossRef]
19. Hou, W., Wei, Y., Guo, J., Jin, Y. (2017). Automatic detection of welding defects using deep neural network. Journal of Physics: Conference Series, 933(1), 012006. DOI 10.1088/1742-6596/933/1/012006. [Google Scholar] [CrossRef]
20. Chakraborty, K., Mehrotra, K., Mohan, C. K., Ranka, S. (1992). Forecasting the behavior of multivariate time series using neural networks. Neural Networks, 5(6), 961–970. DOI 10.1016/S0893-6080(05)80092-9. [Google Scholar] [CrossRef]
21. Zong, B., Song, Q., Min, M. R., Cheng, W., Lumezanu, C. et al. (2018). Deep autoencoding Gaussian mixture model for unsupervised anomaly detection. International Conference on Learning Representations, Vancouver, BC, Canada. [Google Scholar]
22. Hundman, K., Constantinou, V., Laporte, C., Colwell, I., Soderstrom, T. (2018). Detecting spacecraft anomalies using lstms and nonparametric dynamic thresholding. Proceedings of the 24th ACM SIGKDD International Conference on Knowledge Discovery & Data Mining, New York, NY, USA. [Google Scholar]
23. Haotian, W., Dongyi, Z., Fang, L., Nong, X. (2021). Personalized federated anomaly detection method for multivariate time series data. Computer Engineering and Applications, 9(1), 1–7. [Google Scholar]
24. McKight, P. E., Najab, J. (2010). Kruskal–wallis test. The corsini encyclopedia of psychology. Wiley Online Library. DOI 10.1002/97804704792, 16. [Google Scholar] [CrossRef]
25. Schneider, D. A., DeWitt, D. J. (1990). Tradeoffs in processing complex join queries via hashing in multiprocessor database machines. University of Wisconsin-Madison. Computer Sciences Department. [Google Scholar]
26. Yadav, S. L., Sohal, A. (2017). Comparative study of different selection techniques in genetic algorithm. international journal of engineering. Science and Mathematics, 6(3), 174–180. [Google Scholar]
27. Liu, J. L., Ravishankar, C. V. (2011). LEACH-GA: Genetic algorithm-based energy-efficient adaptive clustering protocol for wireless sensor networks. International Journal of Machine Learning and Computing, 1(1), 79. DOI 10.7763/IJMLC.2011.V1.12. [Google Scholar] [CrossRef]
Cite This Article
 Copyright © 2023 The Author(s). Published by Tech Science Press.
This work is licensed under a Creative Commons Attribution 4.0 International License , which permits unrestricted use, distribution, and reproduction in any medium, provided the original work is properly cited.
 Downloads
 Citation Tools