
 Submit a Paper
 Propose a Special lssue
 Open Access
ARTICLE
Novel Soft Computing Model for Predicting Blast-Induced Ground Vibration in Open-Pit Mines Based on the Bagging and Sibling of Extra Trees Models
1
Department of Surface Mining, Mining Faculty, Hanoi University of Mining and Geology, Hanoi, 100000, Vietnam
2
Innovations for Sustainable and Responsible Mining (ISRM) Research Group, Hanoi University of Mining and Geology,
Hanoi, 100000, Vietnam
* Corresponding Author: Quang-Hieu Tran. Email:
(This article belongs to the Special Issue: Computational Intelligent Systems for Solving Complex Engineering Problems: Principles and Applications)
Computer Modeling in Engineering & Sciences 2023, 134(3), 2227-2246. https://doi.org/10.32604/cmes.2022.021893
Received 11 February 2022; Accepted 22 April 2022; Issue published 20 September 2022
 View Full Text
 Download PDF
Abstract
This study considered and predicted blast-induced ground vibration (PPV) in open-pit mines using bagging and sibling techniques under the rigorous combination of machine learning algorithms. Accordingly, four machine learning algorithms, including support vector regression (SVR), extra trees (ExTree), K-nearest neighbors (KNN), and decision tree regression (DTR), were used as the base models for the purposes of combination and PPV initial prediction. The bagging regressor (BA) was then applied to combine these base models with the efforts of variance reduction, overfitting elimination, and generating more robust predictive models, abbreviated as BA-ExTree, BAKNN, BA-SVR, and BA-DTR. It is emphasized that the ExTree model has not been considered for predicting blastinduced ground vibration before, and the bagging of ExTree is an innovation aiming to improve the accuracy of the inherently ExTree model, as well. In addition, two empirical models (i.e., USBM and Ambraseys) were also treated and compared with the bagging models to gain a comprehensive assessment. With this aim, we collected 300 blasting events with different parameters at the Sin Quyen copper mine (Vietnam), and the produced PPV values were also measured. They were then compiled as the dataset to develop the PPV predictive models. The results revealed that the bagging models provided better performance than the empirical models, except for the BA-DTR model. Of those, the BA-ExTree is the best model with the highest accuracy (i.e., 88.8%). Whereas, the empirical models only provided the accuracy from 73.6%–76%. The details of comparisons and assessments were also presented in this study.Keywords
Rock fragmentation is essential before shoveling, loading, and transporting activities in open-pit mines. It can be conducted by drilling-blasting or mechanized methods. Of those, blasting has been recommended as the best method for fragmenting rock with high quality in fragmentation and low cost [1]. However, the environmental impacts induced by this method are significant, such as ground vibration (GV), flyrock, air over-pressure, and air pollution [2–4]. Of the mentioned impacts, GV is recommended as the most dangerous problem that can threaten the structural integrity of surrounding structures, benches, and slope stability [5,6].
To evaluate the effects of blast-induced GV on the surroundings, seismographs have been proposed to measure the GV intensity, and peak particle velocity (PPV) is used as the main indicator. Although the field measurement with the seismograph can provide measurement results with high accuracy; nevertheless, it is only determined after blasting operations have been implemented. In other words, the damages are inevitable. In addition, the field measurement method is often time-consuming, costly, and requires several experiences in calibration and use of the seismograph. As a matter of fact, many countries have issued standards for measuring PPV (e.g., the U.S. Bureau of Mines standard, OSM Standard, the 01/2019-BCT standard of Vietnam, Swiss standards SN 640 312a, to name a few), and many blasts produced the PPV within the allowable limits of the standards; however, the surrounding structures were still affected and damaged. For reducing PPV, the selection of proper blast pattern is considered an effective method [7]. The blasting management techniques have also been proposed to mitigate unwanted effects, including ground vibration [8,9]. Despite a proper blast pattern that can reduce PPV [10]; however, it is challenging to know how a reduction of PPV is safe for the surroundings if it has not been quantified? Therefore, the prediction of PPV in mine blasting is necessary to control the damage induced by blasting operations.
For this aim, many empirical equations have been proposed based on the historical PPV measurements [11]. However, they have been adjudged as low accuracy and cannot reflect the relationship between PPV and blasting parameters, as well as rock properties [12–16].
To gain better results, artificial intelligence (AI) methods/models have been proposed to predict PPV with many advantages, such as high accuracy, rock properties are considered, different blasting parameters are investigated and applied, low-cost, and time-saving. A variety of AI models have been proposed for the aims of PPV prediction and control in open-pit mines, such as artificial neural networks (ANN) models [17–20], machine learning-based models (e.g., support vector machine, CART, multivariate statistical analysis, multivariate adaptive regression splines, to name a few) [21–25], metaheuristic algorithm-based ANN models [1,5,26–30], metaheuristic algorithm-based machine learning models [31–37], and clustering-based models [38–41]. Therein, the accuracies of the introduced models are in the range of 92.7%–98.6%. These techniques and models have been recommended as superior for predicting PPV with high accuracy and reliability in open-pit mines. In addition to these techniques, ensemble models based on the bagging or/and boosting strategies were also suggested as a potential approach for predicting environmental issues in mine blasting with improved accuracy. Nonetheless, they just have been applied for predicting air over-pressure and flyrock in mine blasting [42–44]. In this study, the bagging technique (BA) with four novel ensemble models based on this technique and various machine learning algorithms, including extra trees (ExTree), Support Vector Regression (SVR), K-nearest neighbors (KNN), and decision tree regression (DTR), were applied and combined to predict PPV in open-pit mines, abbreviated as BA-ExTree, BA-SVR, BA-KNN, and BA-DTR. It is worth mentioning that among these bagging models, the BA-SVR model has been proposed for predicting PPV [45]. Also, the standalone SVR, KNN, and DTR models have been applied to predict PPV [46–48]. Nonetheless, the ExTree and other bagging models, particularly the BA-ExTree model, have not been applied for predicting PPV and other environmental issues in mine blasting (e.g., air over-pressure, flyrock. Therefore, this study aims to discover how the ExTree model predicts PPV and its performance upon bagged for predicting PPV. Besides, USBM and Ambraseys, which are the most common empirical models for estimating PPV, were also applied to compare with the proposed bagging models to assess their accuracy and reliability comprehensively.
Extra trees (ExTree) is an ensemble machine learning model based on the supervised learning technique [49]. It is also referred to as the extremely randomized trees model for regression and classification problems [50]. The ExTree was developed as an extended version of the random forest (RF) model to overcome overfitting.
Similar to the RF algorithm, ExTree uses random subsets to train the base models, and finally, the predictions are combined as a data frame for the outcome predictions [51]. However, the ExTree selects the best feature by randomly splitting the node. Regarding the structure, ExTree consists of a number of decision trees, and each tree includes a root node, split nodes, and leaf nodes (Fig. 1). Given a dataset X, the ExTree splits the dataset into random subsets of features at the root node. Each subset is considered as a split/child node, and splitting evolution is continuously conducted until a leaf node is reached. In each tree, the outcome predictions are calculated. Finally, they are combined from different trees, and the average of predictions is taken into account as the official result of the model for regression problems.

Figure 1: ExTree structure for regression problems
In the ExTree, three critical parameters can be considered while developing the model: the number of trees, random features selected, and minimum samples for splitting. One of the robust advantages of the ExTree is the reduction of variance and bias on the training dataset under the cut-point selection and attributes’ explicit subset randomization [52]. This study considered the ExTree algorithm to predict PPV in mine blasting based on these advantages.
2.2 Support Vector Machine (for Regression-SVR)
SVR is one of the two branches of the support vector machine (SVM) algorithm that was developed by Drucker et al. [53] based on the first version of the classification problem (SVC) proposed by Cortes et al. [54]. The mathematical model of the SVR can be described as follows:
Given a dataset with two dimensions
where the hyperplane is denoted by
where

Figure 2: Structure and principle of the SVR model (a) Support vectors with the structure of SVR; (b) The mechanism of the mapping dataset with kernel functions; (c) SVR flowchart with kernel functions and slack variables
The loss function of the SVR is then applied to minimize the error of the model using Eq. (3):
where P stands for the penalty parameter which is used to control the trade-off between the margin and slack variable;
Finally, the objective function for SVR based on support vectors and hyperplane is expressed as the Eq. (5). Fig. 2c shows the mechanism of the SVR model with the slack variables and mapping procedure of the data.
KNN is known as a lazy algorithm in machine learning. The principle of the KNN is described based on finding the number of nearest neighbors k and computing the weights of new samples through the average value of the k nearest neighbors [55]. It can be used for multi-model targets with no training. In KNN, the similarities between testing samples and predefined ones are calculated and the largest values are selected. Finally, the testing samples are considered and compared with the similarities and the selected values. The similarity is calculated based on Euclidean distance, as follows:
where
Once the Euclidean distance is calculated, a weight is assigned to each neighbor. Subsequently, the calculated distances are sorted in ascending and the k nearest neighbors are selected. The mathematical model of this task is expressed as follows:
where
The outcome prediction is then computed using Eq. (9) based on the weighted sum.
where
2.4 Decision Tree Regression (DTR)
DTR is a nonparametric machine learning method that was proposed based on a decision tree model with leaves and nodes [56]. DTR can learn any mapping function form from the training dataset [57]. In this way, it is easy to explore the complex relationships of the dataset based on IF-THEN rules [58].
DTR creates a single regression tree for a regression problem by splitting the dataset into groups, and the homogeneity is maintained as much as possible in the output [59]. For this aim, a specific independent variable will be splitter under a set of decision rules (IF-THEN rules). To measure the homogeneity of the output, the residual sum of squares, also referred to as the impurity of a node in the tree, is calculated. Accordingly, an independent variable is selected to split the node with the maximum homogeneity in the child nodes. The remaining independent variables are used as the child nodes. The tree is then pruned to avoid overfitting. The cross-validation process can support this to reduce the prediction error as much as possible. In short, DTR is a top-down decision tree and the splitting process is employed continuously until the stopping criterion is met. It is a flexible and powerful algorithm for regression problems without any requirements for calculations in graphical forms. The top-down development of the DTR is illustrated in Fig. 3.

Figure 3: An illustration of DTR in machine learning
2.5 Bagging Models Based on Base Machine Learning Algorithms
Bagging is one of the ensemble learning techniques aiming to combine multiple base models to get better predictions based on the mechanism of variance reduction within a noisy dataset. This technique allows the models to avoid or minimize the overfitting problem of data due to the bootstrap aggregating method being applied. Also, it is a potential method to deal with datasets with high dimensions. To perform bagging model, five following steps are employed:
•Step 1: Given a training dataset with m features and n observations. A random sample from the training dataset is selected without replacement.
•Step 2: Creating a model based on a random subset and sample observations.
•Step 3: Splitting the nodes using the best split out of the lot.
•Step 4: Getting the best root nodes with the grown tree.
•Step 5: Repeat Steps 1–4 with n times. Then the results of individual decision trees are aggregated to give the best prediction.
Fig. 4 expresses the flowchart of the bagging models proposed to predict PPV in this study.
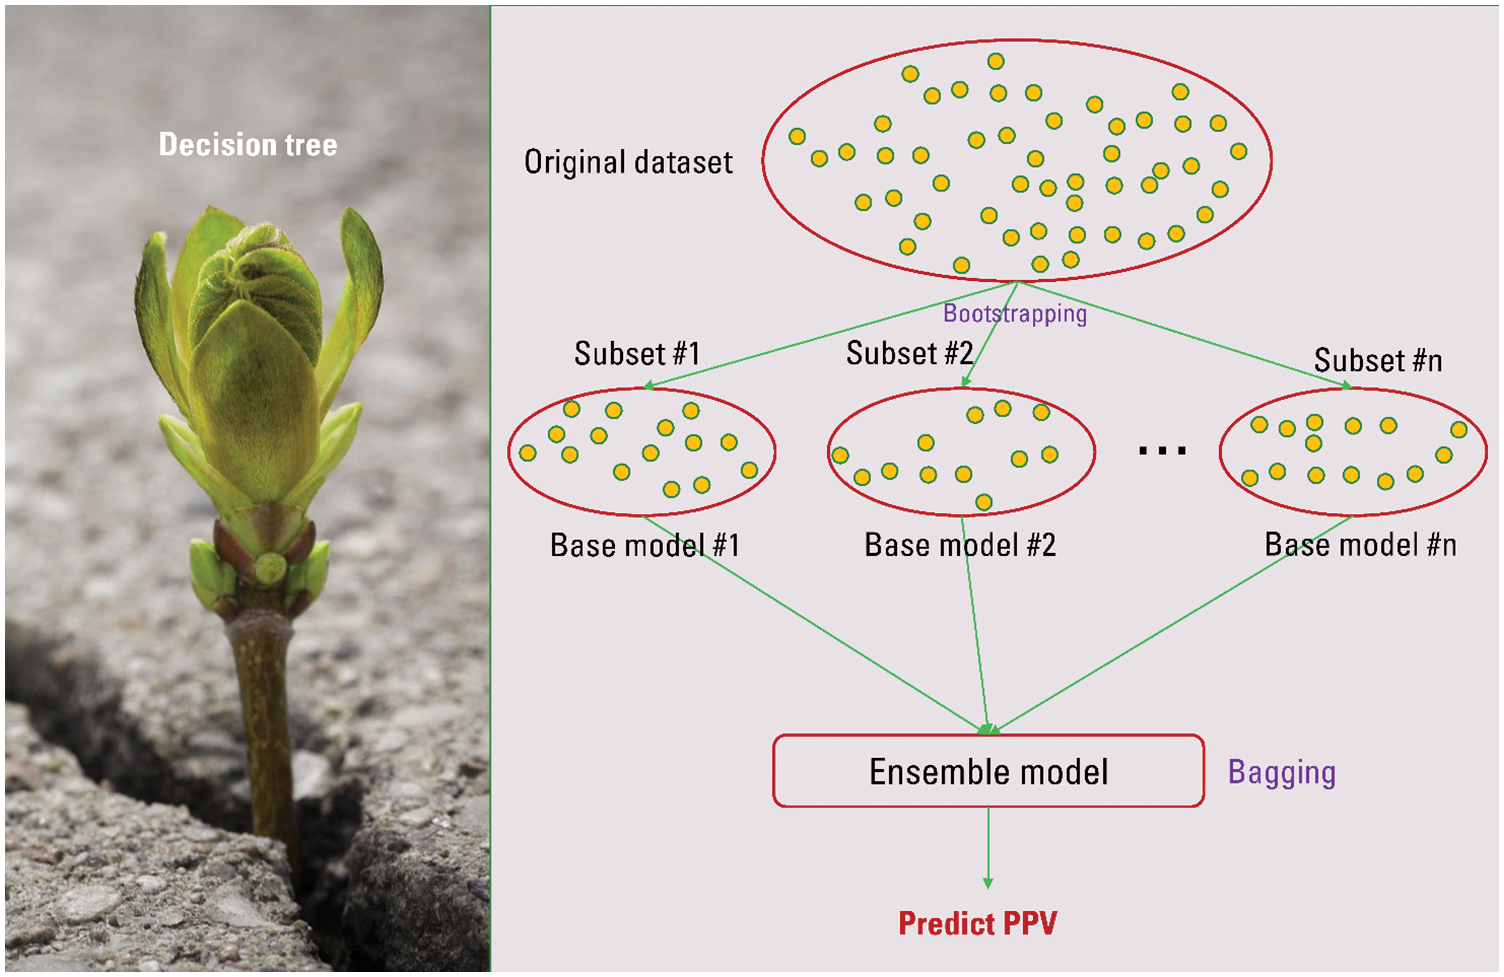
Figure 4: Flowchart of the bagging models for predicting PPV
3 Measurement of PPV and the Dataset Used
For the PPV prediction, 300 blasting events were measured using the Micromate seismograph (Fig. 5) and the relevant blasting parameters were investigated, including diameter of borehole (Dbh), bench height (H), length of borehole (Lbh), hardness of rock mass (f), powder factor (PF), burden (B), spacing (S), stemming (ST), and maximum explosive charge per delay (MEC). Before measuring PPV, the distance between blasting sites and seismograph was determined by GPS receivers (MD). The collected dataset is visualized in Fig. 6 as the underlying data, and the statistical overview of the dataset is summarized in Table 1.
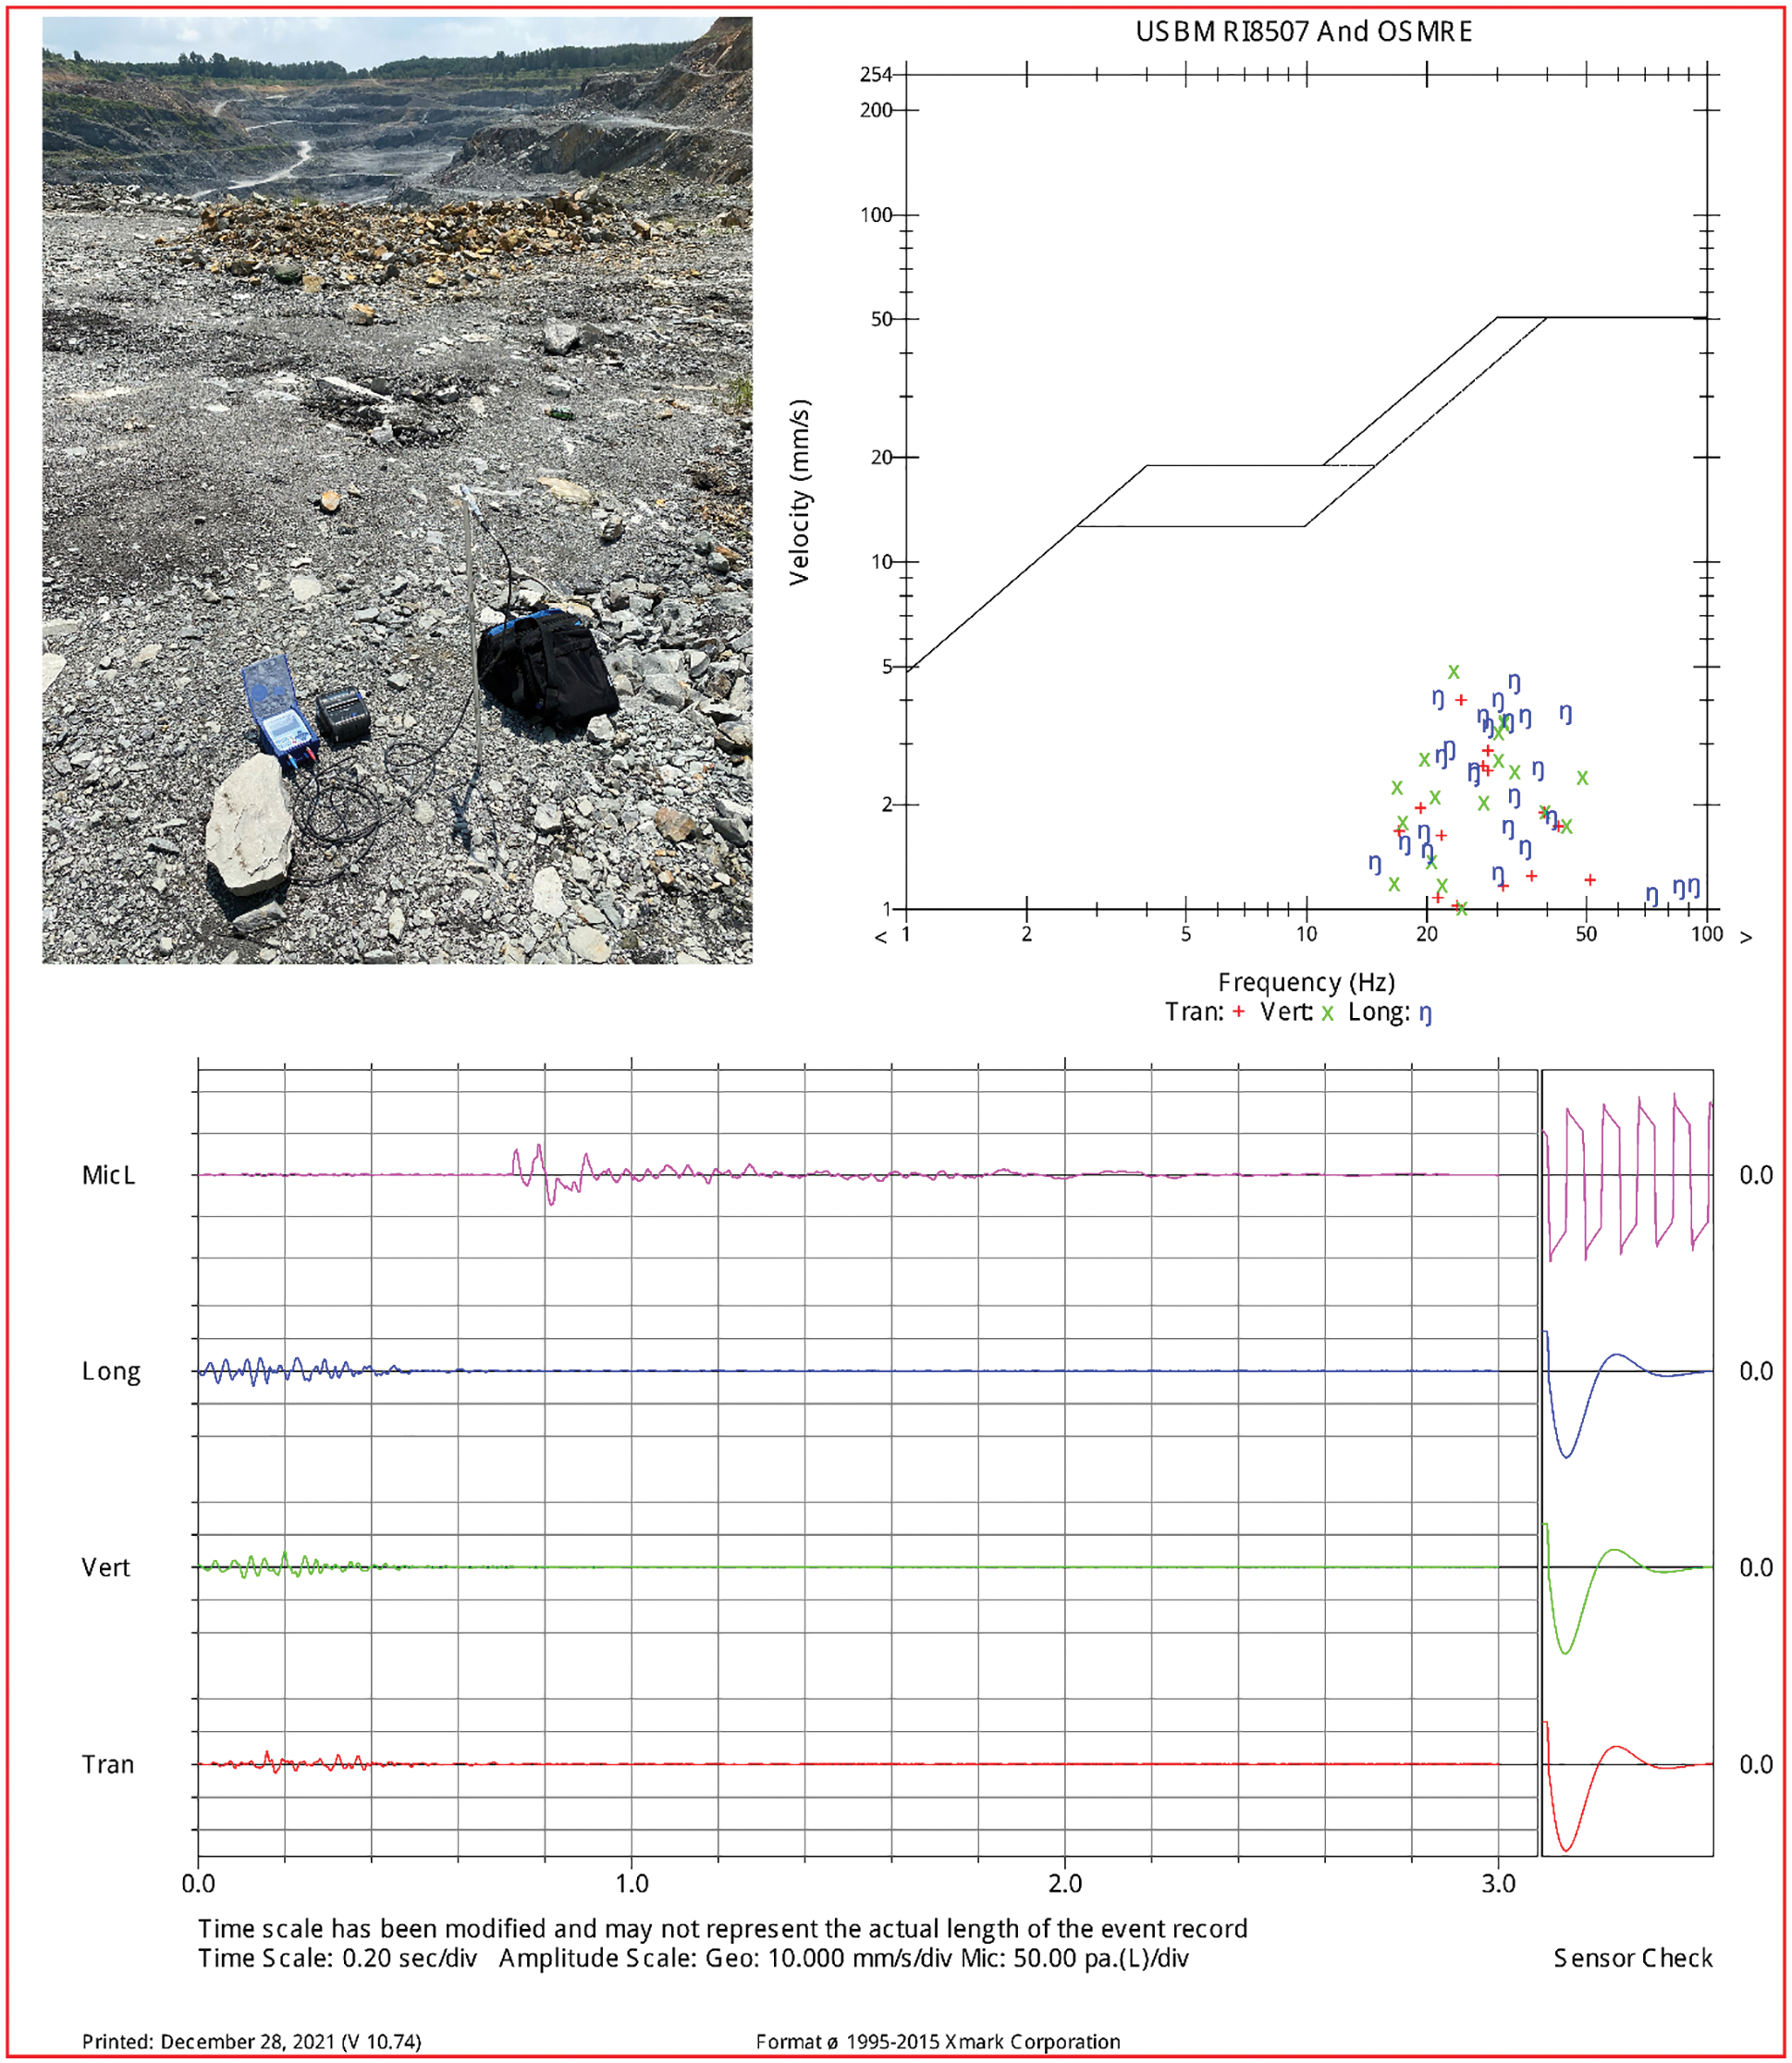
Figure 5: PPV measurement using micromate seismograph
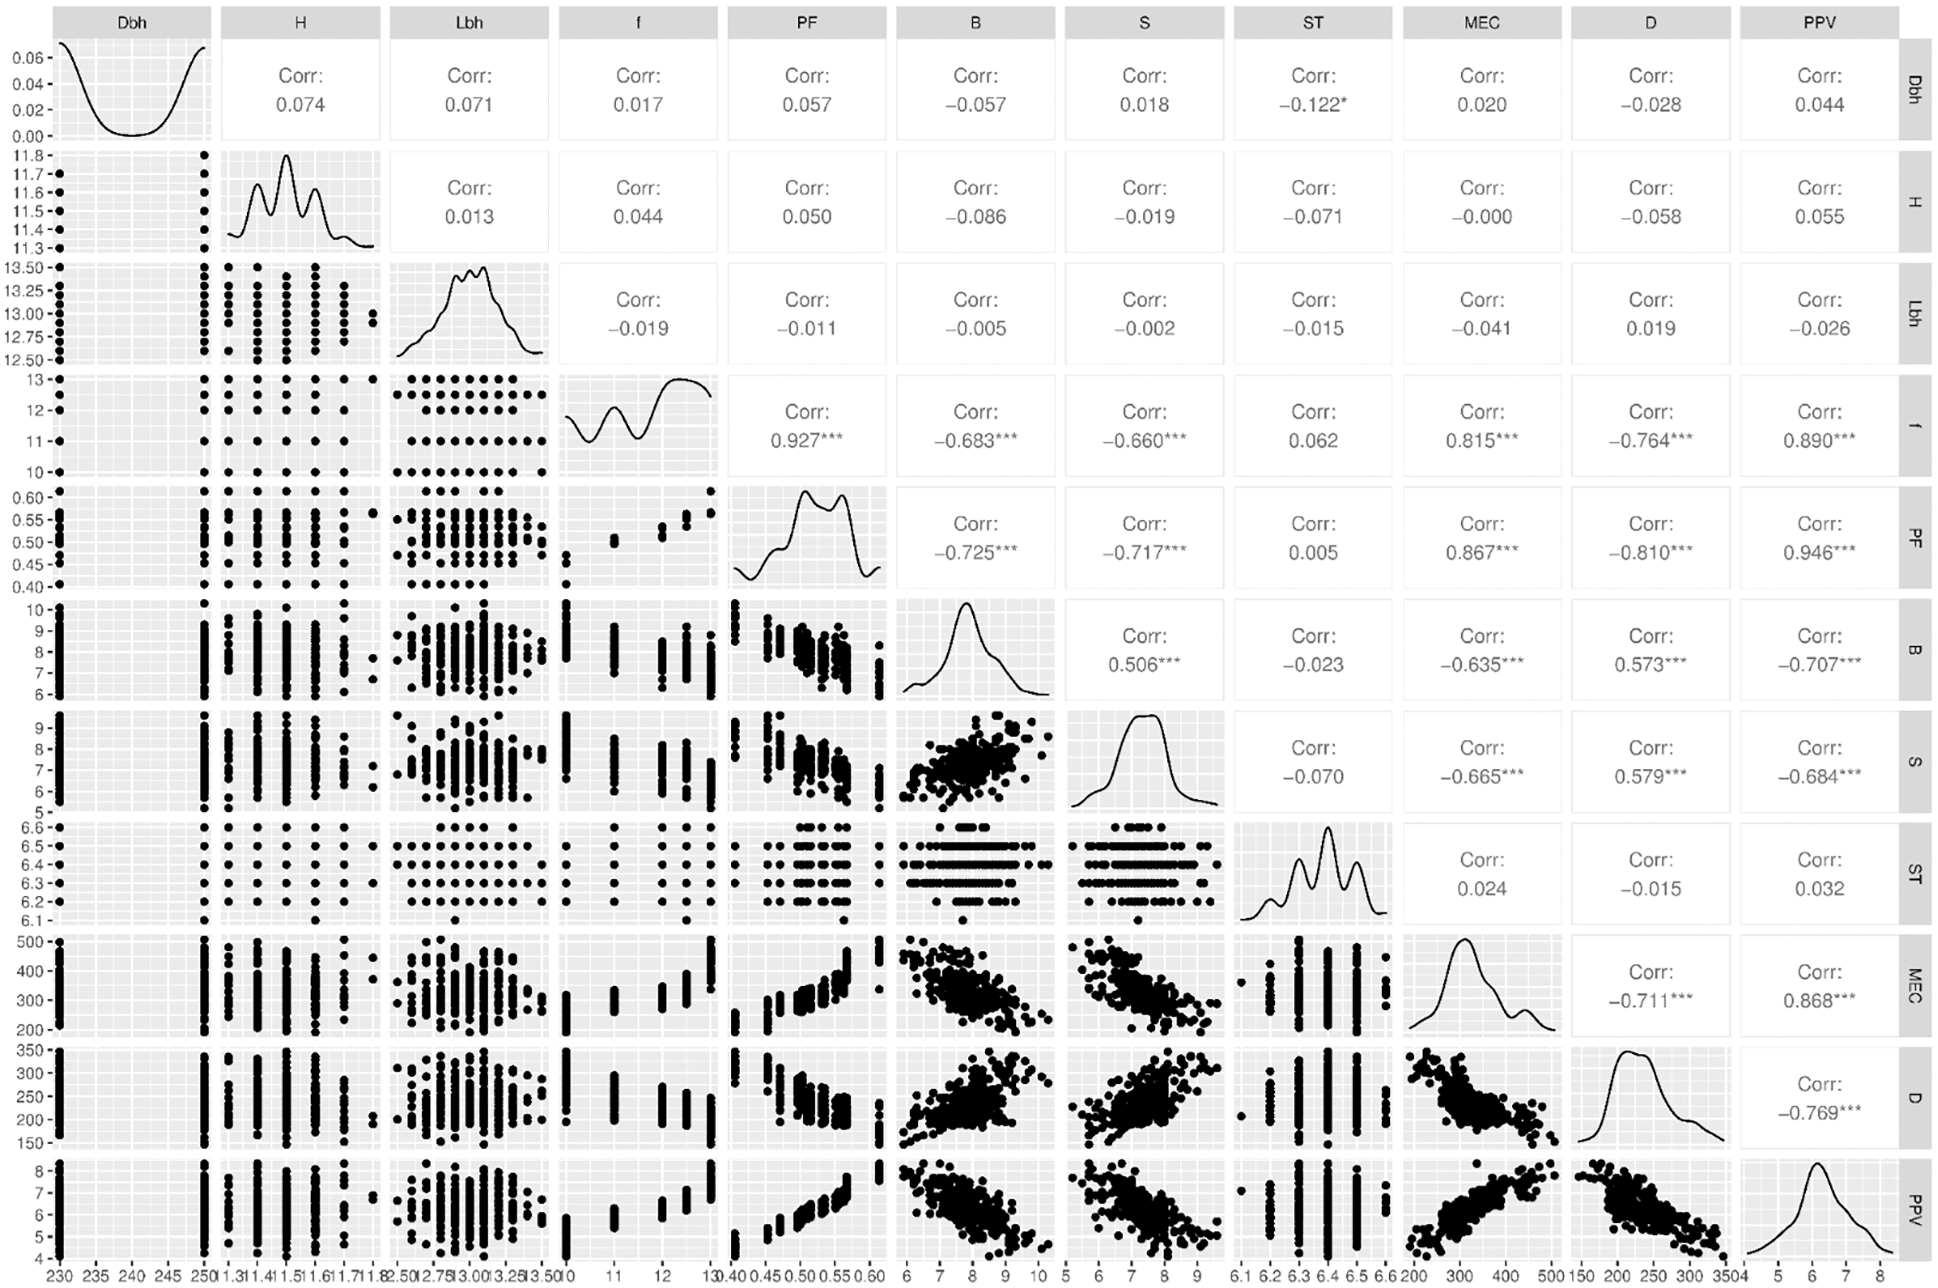
Figure 6: Scatterplot matrix of the PPV dataset collected in this study

Prior to developing the bagging models for predicting PPV, the dataset was scaled using the standard scaler method interval [−1, 1] to reduce the bias of the models due to the different ranges of the input variables. Subsequently, the dataset was divided randomly into two parts: 70% was used to train the bagging models, and 30% was used to test the developed bagging models in predicting PPV.
To evaluate a given model, 10-folds cross-validation method was applied, aiming to avoid overfitting and exactly test every data points, as well as reduce the variance of the resulting estimate [41,60,61]. In this way, all the subsets will be trained and validated to ensure the ranges of the dataset fit with the model. Ofcourse, we can use 5-folds instead of 10-folds as used for this paper. However, the use of 10-folds provides more details of the subsets during the training of the model, and that’s the reason why it is the common way to be used by researchers [62–64]. Furthermore, the negative root means squared error was used to measure the accuracy of the bagging models in predicting PPV herein. The use of this metric aims to handle both scores and losses in the same way based on the scenario of the loss function. To develop the bagging models, the flowchart in Fig. 4 was applied based different base models, such as ExTree, SVR, KNN, and DTR.
For developing the BA-ExTree model, the number of estimators was considered the main parameter used to tune the accuracy of the ExTree model in predicting PPV. Based on the motivation of combining multiple ExTree models (as base models), 20 different ExTree models were created with a number of estimators in the range of [100, 119]. The performance of the base ExTree models is shown in Fig. 7a. Finally, 20 base ExTree models were bagged to generate the BA-ExTree model for predicting PPV.
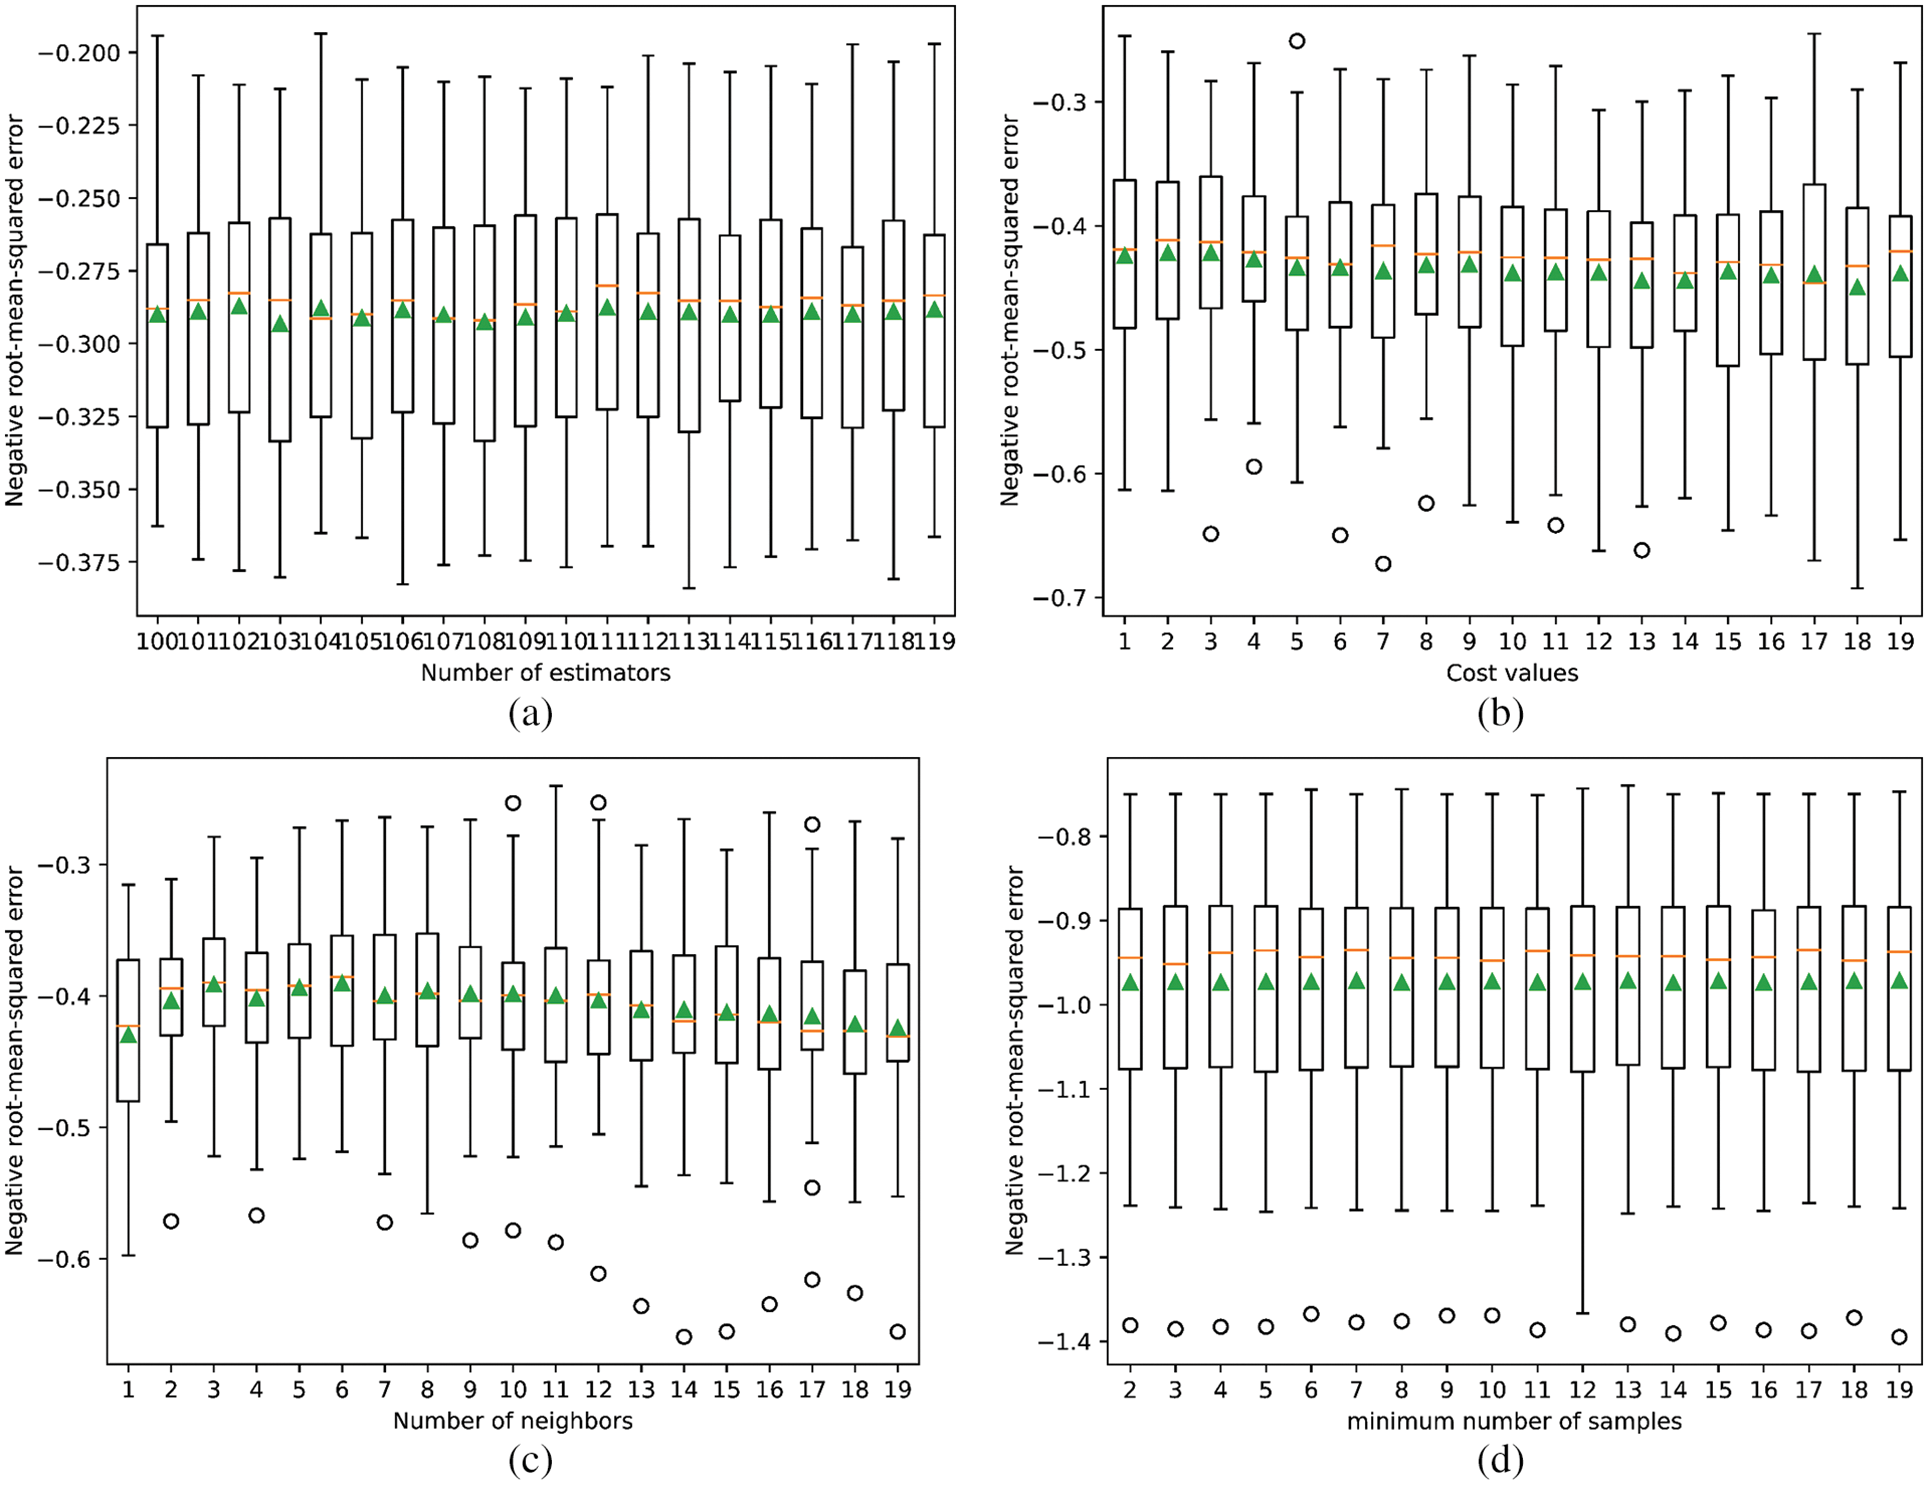
Figure 7: Performance of different base models based on the individual ensemble models (a) BA-ExTree; (b) BA-SVR; (c) BA-KNN; (d) BA-DTR
A similar approach was applied for developing the BA-SVR model, but the controlling parameter is different. Herein, the radial basis function was used as a kernel function to transfer the dataset in the SVR model, and three parameters were used, including cost (C), gamma
For developing the BA-KNN model, 19 different base KNN models were also developed based on the tunning of the k parameter (i.e., the number of nearest neighbors). Herein, k was tunned with the range of 1 to 19. The performance of the base KNN models is shown in Fig. 7c. Eventually, the BA-KNN model was established based on the combination of 19 developed KNN models for predicting PPV.
Similar to the previous bagging models, the BA-DTR model was developed for predicting PPV based on the combination of different base DTR models. However, many parameters were used as parts of the model in the DTR model. To split an internal node, a minimum number of samples is required (i.e., samplemin) for a small dataset. It was then used and tuned to check the accuracy of the DTR models. In addition, the minimum weight at a leaf node (i.e., leafw_min) was fixed as 0.5 during tunning the samplemin parameter in the range of 2 to 19. The performance of the base DTR models for predicting PPV is shown in Fig. 7d. Ultimately, 18 DTR models were combined to create the BA-DTR model for predicting PPV.
In order to compare with the bagging models (i.e., BA-ExTree, BA-SVR, BA-KNN, BA-DTR), two empirical models based on the equations proposed by USBM and Ambraseys [65]. The form of the empirical equations is as follows:
The USBM equation for estimating PPV:
The Ambraseys empirical equation for estimating PPV:
where
It is worth noting that although the empirical models use only two variables (e.g., MD and MEC) to estimate PPV; however, the same datasets with the same observations were used as those used for the bagging models. Finally, the empirical models were defined for predicting PPV in this study, as expressed in Eqs. (12) and (13). The correlation between the scaled distance and estimated PPVs by the empirical models is shown in Fig. 8.
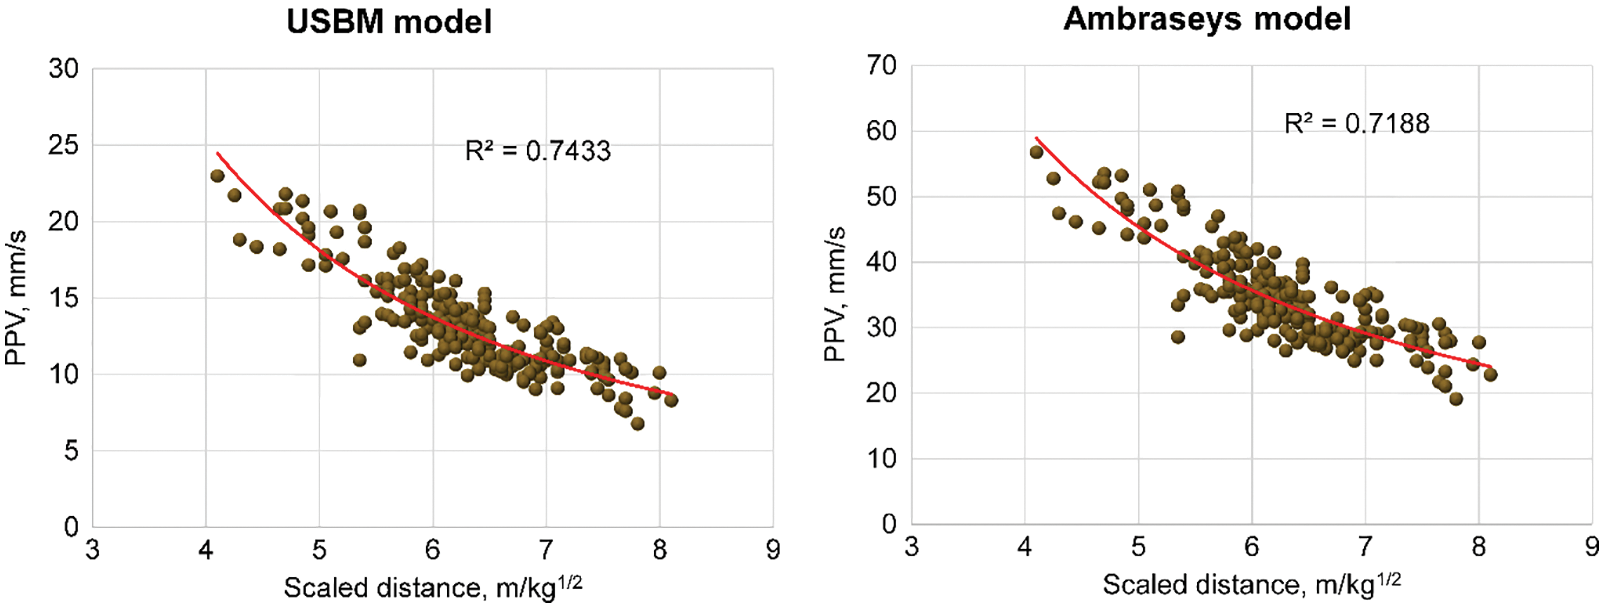
Figure 8: Correlation between the scaled distance vs. PPV by the empirical models
The USBM model:
The Ambraseys [65] model:
4.3 Results and Models’ Evaluation
Once the machine learning-based bagging models and empirical models were well-developed, they were used to predict PPV on the testing dataset, and their performance was carefully evaluated. Looking at Fig. 7, we can see that the base ExTree models provided better predictions without outliers than the other models. In contrast, three remaining models (SVR, KNN and DTR) provided PPV predictions with outliers. Moreover, taking a closer look at the performance metric in Fig. 7 (negative RMSE), we can see that the errors of the base ExTree models are lower than the remaining models. These findings can reveal positive results for the BA-ExTree model when we combine these base models for predicting PPV.
Prior to evaluating the bagging and empirical models, the testing dataset with the remaining 30% of the dataset was imported to the developed models. The results were then predicted and exported to compare and evaluate through four performance metrics, including R2, RMSE, MAE, and VAF. These metrics can be calculated using the following equations:
The errors and goodness-of-fit of the dataset for the bagging and empirical models are summarized in Table 2.

Compare PPV predictions resulting on the two groups (e.g., bagging models and empirical models), there is no double that the machine learning-based bagging models group provided better performances than those of the empirical models group except the BA-DTR model. This also indicated that the DTR or BA-DTR models have a tendency towards low performance for predicting PPV in this study, and its accuracy is even lower than the empirical models (i.e., R2 = 0.607, RMSE = 0.567, MAE = 0.449, VAF = 52.874 on the testing dataset). Among the three remaining bagging models (i.e., BA-ExTree, BA-SVR, BA-KNN), the BA-ExTree model yielded the highest accuracy of 88.8%. Follows are the BA-SVR and BA-KNN models with 83.4% and 80.7%, respectively.
Regarding the empirical models, despite the fact that their performances are lower than the BA-ExTree, BA-SVR, BA-KNN models; however, the USBM model provided slightly better accuracy than the Ambraseys empirical model with the accuracies of 76% compared to 73.7%.
As one of the most common statistical indexes to evaluate how the model is sound and goodness of fit, the correlation between predictions obtained by the individual bagging and empirical models and measurements was considered, as shown in Fig. 9.
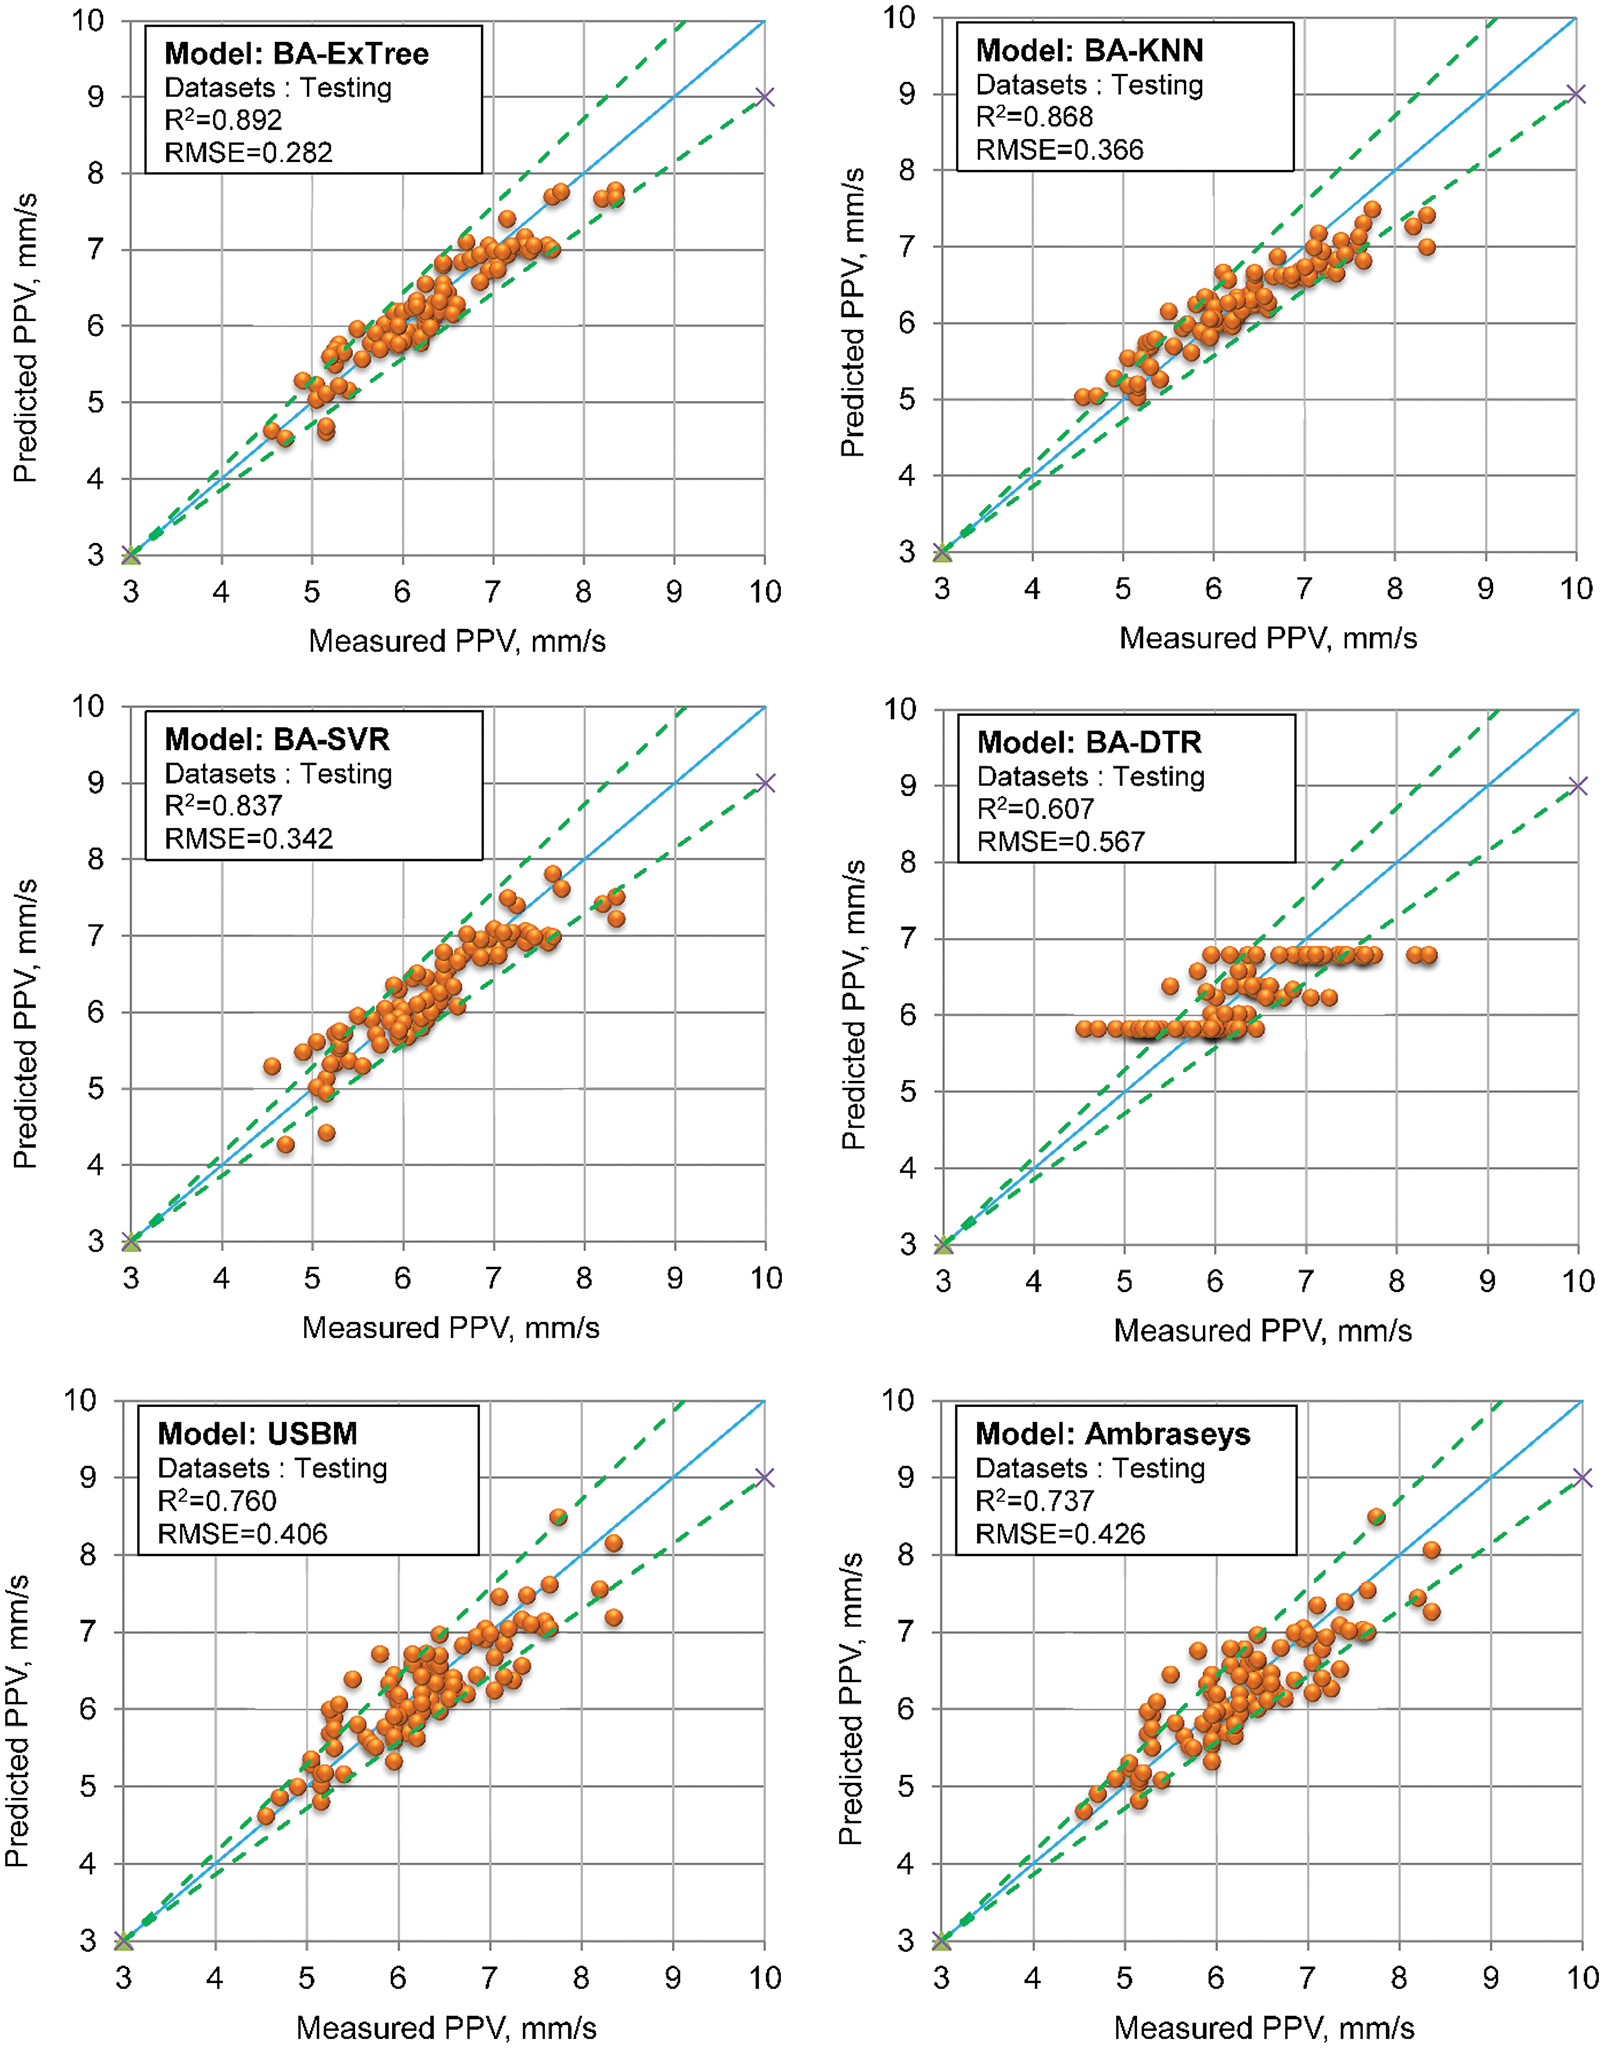
Figure 9: Regression performance of different ensemble and empirical models
As interpreted in Fig. 9, it is visible that the convergence of the BA-ExTree, BA-SVR, BA-KNN models is much better than the BA-DTR model. Whereas, the convergence of the BA-DTR model tends to be flat, and this led to its low performance, as discussed earlier. Taking a closer look at Fig. 9, we can see that most of the data points of the BA-ExTree model are neatly distributed within the 80% confidence interval of the model. Meanwhile, the BA-KNN and BA-SVR models provided more data points outside the 80% confidence interval. The empirical models got lower convergences with so many data points outside the 80% confidence interval. An absolute difference comparison was conducted to understand which model can provide the highest accuracy in practical engineering. This comparison can show how close measured PPV and predicted PPV is, as shown in Fig. 10. Accordingly, the predicted PPVs by the BA-ExTree model tend to be close to the measured PPVs than predicted by the other models. Of the testing samples, most of the predicted PPVs by the BA-ExTree model can be considered as matches with the measured PPVs. In contrast, the PPV values predicted by the BA-DTR model are furthest from the measured PPV values, as shown in Fig. 10.
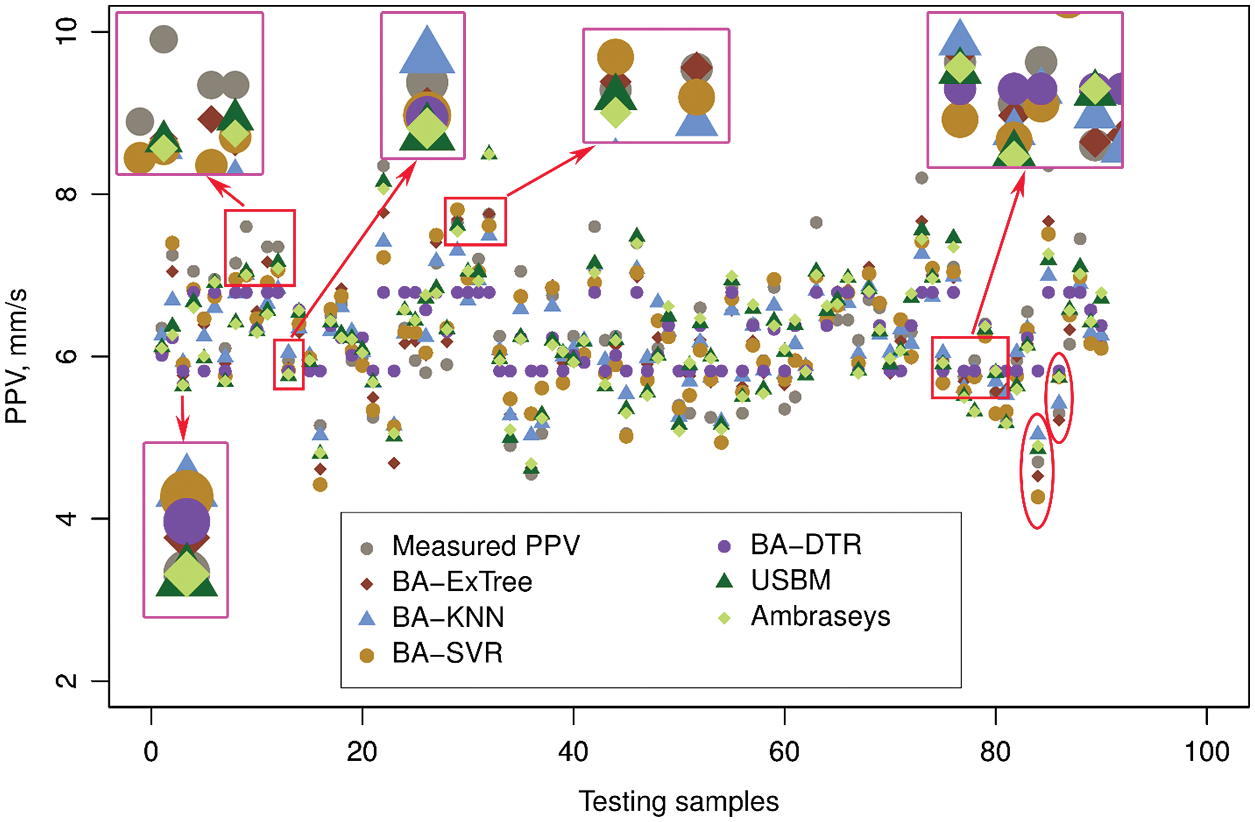
Figure 10: Absolute difference comparison of testing PPVs
Considering the complexity of the models, it is clear that the empirical models are simpler than the machine learning-based bagging models in model development. Nonetheless, the application/use of both machine learning-based bagging models and empirical models in practice is the same because the input variables are entered, and the models can predict PPV automatically.
Although the developed models are pretty good, especially the BA-ExTree model; however, it is still necessary to study how various sources of uncertainty in an AI-based model contribute to the overall uncertainty of the model. It plays an essential role in providing insight into the blasting dataset used, as well as the developed model and the bias for dimensional reduction that can improve the accuracy of the predictive model on the PPV prediction problem. Thus, a sensitivity analysis was performed in this study to determine how different values of the PPV variable affect a particular dependent variable (input variable) under a given set of assumptions.
Herein, the BA-ExTree model was selected as the best one for predicting PPV among the developed models in this study. This model can provide a feature importance property after being fit, and it can be accessed to retrieve the relative importance scores for each input variable, as shown in Fig. 11. Please be noted that the input variables, Dbh, H, Lbh, f, PF, B, S, ST, MEC, and D are encoded as 0–9 feature labels in Fig. 11. Due to the stochastic nature of the algorithm, this procedure was implemented 10 times to consider the average values of feature importance. Finally, as depicted in Fig. 11, the model found three important features, including f, PF, and MEC. Following is the D variable, and the other variables provided low importance. These findings are met with the properties of rock mechanics and blasting mechanisms. Indeed, if the hardness of rock mass (f) is high, it requires a high volume of explosives to break a unit of rock mass, too, i.e., m3 (PF). These parameters will lead to high MEC and this parameter significantly affect the PPV induced by blasting in open-pit mines. In fact, D is an uncontrollable parameter, and we cannot change it while blasting. It is worth noting that the feature importance provided by the BA-ExTree model may vary from the other models due to the different theories and stochastic nature of the algorithms.
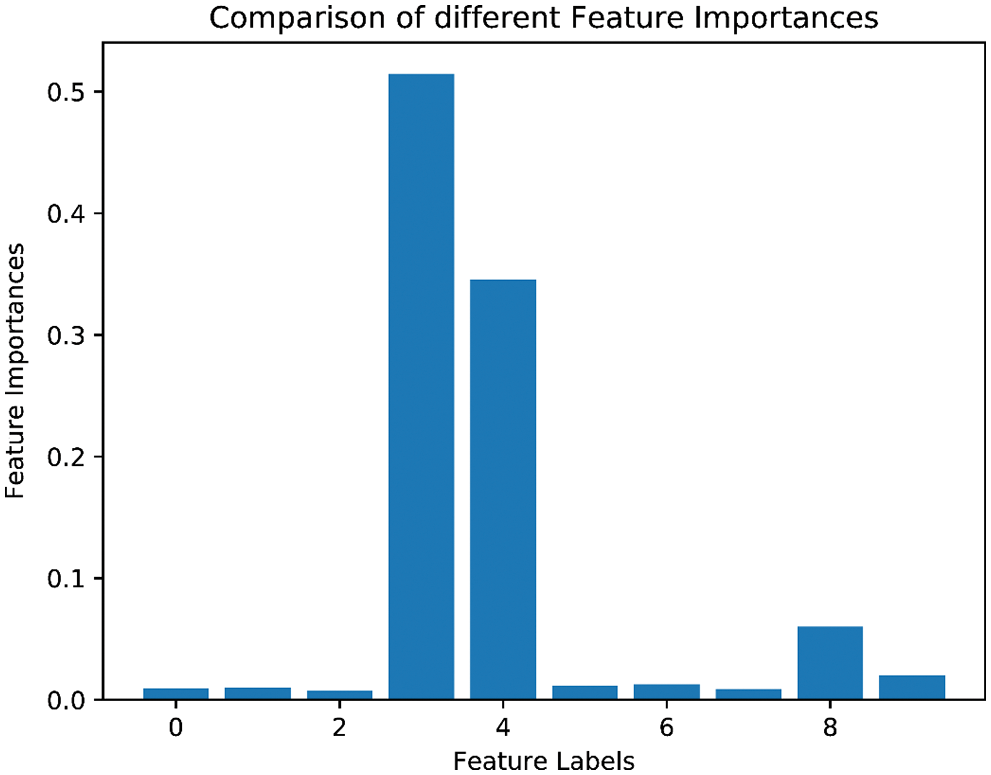
Figure 11: Feature importances of the ExTree model at predicting PPV
Blasting and its advantages/disadvantages in practical engineering are considerable concerns, primarily environmental issues. Of those, the efforts to reduce adverse effects on the surrounding environment due to blast-induced GV are the primary goal of researchers. For this aim, this study proposed a novel intelligent model (i.e., BA-ExTree) based on the bagging technique for predicting PPV. The results were thoroughly considered and evaluated through the other bagging models (i.e., BA-SVR, BA-KNN, and BA-DTR) and empirical models. They indicated that the BA-ExTree model provided high accuracy and reliability in predicting PPV in open-pit mines.
Author Contributions: Quang-Hieu Tran: Conceptualization; Investigation; Resources; Writing-Original Draft; Writing-Review & Editing. Hoang Nguyen: Methodology; Formal Analysis; Visualization; Writing-Review & Editing. Xuan-Nam Bui: Conceptualization; Investigation; Resources; Writing-Original Draft; Validation; Writing-Review & Editing; Supervision; Project Administration.
Funding Statement: This research is funded by Vietnam National Foundation for Science and Technology Development (NAFOSTED) under Grant No. 105.99–2019.309.
Conflicts of Interest: The authors declare that they have no conflicts of interest to report regarding the present study.
References
1. Zhang, X., Nguyen, H., Choi, Y., Bui, X. N., Zhou, J. (2021). Novel extreme learning machine-multi-verse optimization model for predicting peak particle velocity induced by mine blasting. Natural Resources Research, 30(6), 4735–4751. DOI 10.1007/s11053-021-09960-z. [Google Scholar] [CrossRef]
2. Armaghani, D. J., Hajihassani, M., Monjezi, M., Mohamad, E. T., Marto, A. et al. (2015). Application of two intelligent systems in predicting environmental impacts of quarry blasting. Arabian Journal of Geosciences, 8(11), 9647–9665. DOI 10.1007/s12517-015-1908-2. [Google Scholar] [CrossRef]
3. Kahriman, A., Ozer, U., Aksoy, M., Karadogan, A., Tuncer, G. (2006). Environmental impacts of bench blasting at Hisarcik Boron open pit mine in Turkey. Environmental Geology, 50(7), 1015–1023. DOI 10.1007/s00254-006-0274-5. [Google Scholar] [CrossRef]
4. Torres, V. N., Silveira, L. G., Lopes, P. F., de Lima, H. M. (2018). Assessing and controlling of bench blasting-induced vibrations to minimize impacts to a neighboring community. Journal of Cleaner Production, 187, 514–524. DOI 10.1016/j.jclepro.2018.03.210. [Google Scholar] [CrossRef]
5. Bui, X. N., Nguyen, Q. H., Tran, H., Nguyen, D. A., Bui, H. B. (2021). Predicting blast-induced ground vibration in quarries using adaptive fuzzy inference neural network and moth–flame optimization. Natural Resources Research, 30(6), 4719–4734. DOI 10.1007/s11053-021-09968-5. [Google Scholar] [CrossRef]
6. Nguyen, H., Bui, X. N., Tran, Q. H., Nguyen, H. A., Nguyen, D. A. et al. (2021). Prediction of ground vibration intensity in mine blasting using the novel hybrid MARS–PSO–MLP model. Engineering with Computers. DOI 10.1007/s00366-021-01332-8. [Google Scholar] [CrossRef]
7. Yari, M., Bagherpour, R., Jamali, S., Asadi, F. (2015). Selection of most proper blasting pattern in mines using linear assignment method: Sungun copper mine. Archives of Mining Sciences, 60(1), 375–386. DOI 10.1515/amsc-2015-0025. [Google Scholar] [CrossRef]
8. Yari, M., Monjezi, M., Bagherpour, R., Sayadi, A., (2015). Blasting operation management using mathematical methods. Engineering Geology for Society and Territory, vol. 1, pp. 483–493. Switzerland, Springer, Cham. [Google Scholar]
9. Yari, M., Monjezi, M., Bagherpour, R., Jamali, S. (2014). Developing a mathematical assessment model for blasting patterns management: Sungun copper mine. Journal of Central South University, 21(11), 4344–4351. DOI 10.1007/s11771-014-2434-1. [Google Scholar] [CrossRef]
10. Yari, M., Monjezi, M., Bagherpour, R. (2014). A novel investigation in blasting operation management using decision making methods. Rudarsko-geološko-naftni Zbornik, 29(1), 69–79. [Google Scholar]
11. Nguyen, H., Bui, X. N., Moayedi, H. (2019). A comparison of advanced computational models and experimental techniques in predicting blast-induced ground vibration in open-pit coal mine. Acta Geophysica, 67(4), 1025–1037. DOI 10.1007/s11600-019-00304-3. [Google Scholar] [CrossRef]
12. Khandelwal, M., Singh, T. N. (2009). Prediction of blast-induced ground vibration using artificial neural network. International Journal of Rock Mechanics and Mining Sciences, 46(7), 1214–1222. DOI 10.1016/j.ijrmms.2009.03.004. [Google Scholar] [CrossRef]
13. Kumar, R., Choudhury, D., Bhargava, K. (2016). Determination of blast-induced ground vibration equations for rocks using mechanical and geological properties. Journal of Rock Mechanics and Geotechnical Engineering, 8(3), 341–349. DOI 10.1016/j.jrmge.2015.10.009. [Google Scholar] [CrossRef]
14. Monjezi, M., Ahmadi, M., Sheikhan, M., Bahrami, A., Salimi, A. (2010). Predicting blast-induced ground vibration using various types of neural networks. Soil Dynamics and Earthquake Engineering, 30(11), 1233–1236. DOI 10.1016/j.soildyn.2010.05.005. [Google Scholar] [CrossRef]
15. Monjezi, M., Baghestani, M., Faradonbeh, R. S., Saghand, M. P., Armaghani, D. J. (2016). Modification and prediction of blast-induced ground vibrations based on both empirical and computational techniques. Engineering with Computers, 32(4), 717–728. DOI 10.1007/s00366-016-0448-z. [Google Scholar] [CrossRef]
16. Singh, T., Singh, V. (2005). An intelligent approach to prediction and control ground vibration in mines. Geotechnical & Geological Engineering, 23(3), 249–262. DOI 10.1007/s10706-004-7068-x. [Google Scholar] [CrossRef]
17. Monjezi, M., Ghafurikalajahi, M., Bahrami, A. (2011). Prediction of blast-induced ground vibration using artificial neural networks. Tunnelling and Underground Space Technology, 26(1), 46–50. DOI 10.1016/j.tust.2010.05.002. [Google Scholar] [CrossRef]
18. Monjezi, M., Hasanipanah, M., Khandelwal, M. (2013). Evaluation and prediction of blast-induced ground vibration at Shur River Dam, Iran, by artificial neural network. Neural Computing and Applications, 22(7–8), 1637–1643. DOI 10.1007/s00521-012-0856-y. [Google Scholar] [CrossRef]
19. Khandelwal, M., Singh, T. (2006). Prediction of blast induced ground vibrations and frequency in opencast mine: A neural network approach. Journal of Sound and Vibration, 289(4), 711–725. DOI 10.1016/j.jsv.2005.02.044. [Google Scholar] [CrossRef]
20. Lawal, A. I., (2020). An artificial neural network-based mathematical model for the prediction of blast-induced ground vibration in granite quarries in Ibadan, Oyo State, Nigeria. Scientific African, 8, e00413. DOI 10.1016/j.sciaf.2020.e00413. [Google Scholar] [CrossRef]
21. Khandelwal, M., Kankar, P., Harsha, S. (2010). Evaluation and prediction of blast induced ground vibration using support vector machine. Mining Science and Technology (China), 20(1), 64–70. DOI 10.1016/S1674-5264(09)60162-9. [Google Scholar] [CrossRef]
22. Himanshu, V. K., Roy, M., Mishra, A., Paswan, R. K., Panda, D. et al. (2018). Multivariate statistical analysis approach for prediction of blast-induced ground vibration. Arabian Journal of Geosciences, 11(16), 460. DOI 10.1007/s12517-018-3796-8. [Google Scholar] [CrossRef]
23. Hasanipanah, M., Faradonbeh, R. S., Amnieh, H. B., Armaghani, D. J., Monjezi, M. (2017). Forecasting blast-induced ground vibration developing a CART model. Engineering with Computers, 33(2), 307–316. DOI 10.1007/s00366-016-0475-9. [Google Scholar] [CrossRef]
24. Hosseini, S. A., Tavana, A., Abdolahi, S. M., Darvishmaslak, S. (2019). Prediction of blast-induced ground vibrations in quarry sites: A comparison of GP, RSM and MARS. Soil Dynamics and Earthquake Engineering, 119, 118–129. DOI 10.1016/j.soildyn.2019.01.011. [Google Scholar] [CrossRef]
25. Hasanipanah, M., Monjezi, M., Shahnazar, A., Armaghani, D. J., Farazmand, A. (2015). Feasibility of indirect determination of blast induced ground vibration based on support vector machine. Measurement, 75, 289–297. DOI 10.1016/j.measurement.2015.07.019. [Google Scholar] [CrossRef]
26. Azimi, Y., Khoshrou, S. H., Osanloo, M. (2019). Prediction of blast induced ground vibration (BIGV) of quarry mining using hybrid genetic algorithm optimized artificial neural network. Measurement, 147, 106874. DOI 10.1016/j.measurement.2019.106874. [Google Scholar] [CrossRef]
27. Shang, Y., Nguyen, H., Bui, X. N., Tran, Q. H., Moayedi, H. (2019). A novel artificial intelligence approach to predict blast-induced ground vibration in open-pit mines based on the firefly algorithm and artificial neural network. Natural Resources Research, 29(2), 723–737. DOI 10.1007/s11053-019-09503-7. [Google Scholar] [CrossRef]
28. Murlidhar, B. R., Nguyen, H., Rostami, J., Bui, X., Armaghani, D. J. et al. (2021). Prediction of flyrock distance induced by mine blasting using a novel Harris Hawks optimization-based multi-layer perceptron neural network. Journal of Rock Mechanics and Geotechnical Engineering, 13(6), 1413–1427. DOI 10.1016/j.jrmge.2021.08.005. [Google Scholar] [CrossRef]
29. Nguyen, H., Bui, X. N., Tran, Q. H., Nguyen, D. A., Hoa, L. T. T. et al. (2021). Predicting blast-induced ground vibration in open-pit mines using different nature-inspired optimization algorithms and deep neural network. Natural Resources Research, 30(6), 4695–4717. DOI 10.1007/s11053-021-09896-4. [Google Scholar] [CrossRef]
30. Nguyen, H., Bui, X. N. (2021). A novel hunger games search optimization-based artificial neural network for predicting ground vibration intensity induced by mine blasting. Natural Resources Research, 30(5), 3865–3880. DOI 10.1007/s11053-021-09903-8. [Google Scholar] [CrossRef]
31. Bui, X. N., Jaroonpattanapong, P., Nguyen, H., Tran, Q. H., Long, N. Q. (2019). A novel hybrid model for predicting blast-induced ground vibration based on K-nearest neighbors and particle swarm optimization. Scientific Reports, 9(1), 13971. DOI 10.1038/s41598-019-50262-5. [Google Scholar] [CrossRef]
32. Zhang, X., Nguyen, H., Bui, X. N., Tran, Q. H., Nguyen, D. A. et al. (2020). Novel soft computing model for predicting blast-induced ground vibration in open-pit mines based on particle swarm optimization and XGBoost. Natural Resources Research, 29(2), 711–721. DOI 10.1007/s11053-019-09492-7. [Google Scholar] [CrossRef]
33. Yu, Z., Shi, X., Zhou, J., Gou, Y., Huo, X. et al. (2020). A new multikernel relevance vector machine based on the HPSOGWO algorithm for predicting and controlling blast-induced ground vibration. Engineering with Computers, 38, 1905--1920. DOI 10.1007/s00366-020-01136-2. [Google Scholar] [CrossRef]
34. Nguyen, H., Choi, Y., Bui, X. N., Nguyen-Thoi, T. (2020). Predicting blast-induced ground vibration in open-pit mines using vibration sensors and support vector regression-based optimization algorithms. Sensors, 20(1), 132. DOI 10.3390/s20010132. [Google Scholar] [CrossRef]
35. Qiu, Y., Zhou, J., Khandelwal, M., Yang, H., Yang, P. et al. (2021). Performance evaluation of hybrid WOA-XGBoost, GWO-XGBoost and BO-XGBoost models to predict blast-induced ground vibration. Engineering with Computers. DOI 10.1007/s00366-021-01393-9. [Google Scholar] [CrossRef]
36. Ding, Z., Nguyen, H., Bui, X. N., Zhou, J., Moayedi, H. (2020). Computational intelligence model for estimating intensity of blast-induced ground vibration in a mine based on imperialist competitive and extreme gradient boosting algorithms. Natural Resources Research, 29(2), 751–769. DOI 10.1007/s11053-019-09548-8. [Google Scholar] [CrossRef]
37. Zhou, J., Qiu, Y., Khandelwal, M., Zhu, S., Zhang, X. (2021). Developing a hybrid model of Jaya algorithm-based extreme gradient boosting machine to estimate blast-induced ground vibrations. International Journal of Rock Mechanics and Mining Sciences, 145, 104856. DOI 10.1016/j.ijrmms.2021.104856. [Google Scholar] [CrossRef]
38. Nguyen, H., Drebenstedt, C., Bui, X. N., Bui, D. T. (2020). Prediction of blast-induced ground vibration in an open-pit mine by a novel hybrid model based on clustering and artificial neural network. Natural Resources Research, 29(2), 691–709. DOI 10.1007/s11053-019-09470-z. [Google Scholar] [CrossRef]
39. Bui, X. N., Choi, Y., Atrushkevich, V., Nguyen, H., Tran, Q. H. et al. (2020). Prediction of blast-induced ground vibration intensity in open-pit mines using unmanned aerial vehicle and a novel intelligence system. Natural Resources Research, 29(2), 771–790. DOI 10.1007/s11053-019-09573-7. [Google Scholar] [CrossRef]
40. Amiri, M., Bakhshandeh Amnieh, H., Hasanipanah, M., Mohammad Khanli, L. (2016). A new combination of artificial neural network and K-nearest neighbors models to predict blast-induced ground vibration and air-overpressure. Engineering with Computers, 32(4), 631–644. DOI 10.1007/s00366-016-0442-5. [Google Scholar] [CrossRef]
41. Nguyen, H., Bui, X. N., Tran, Q. H., Mai, N. L. (2019). A new soft computing model for estimating and controlling blast-produced ground vibration based on Hierarchical K-means clustering and Cubist algorithms. Applied Soft Computing, 77, 376–386. DOI 10.1016/j.asoc.2019.01.042. [Google Scholar] [CrossRef]
42. Nguyen, H., Bui, X. N., Tran, Q. H. (2021). Estimating air over-pressure resulting from blasting in quarries based on a novel ensemble model (GLMNETs–MLPNN). Natural Resources Research, 30(3), 2629–2646. DOI 10.1007/s11053-021-09822-8. [Google Scholar] [CrossRef]
43. Guo, H., Nguyen, H., Bui, X. N., Armaghani, D. J. (2021). A new technique to predict fly-rock in bench blasting based on an ensemble of support vector regression and GLMNET. Engineering with Computers, 37(1), 421–435. DOI 10.1007/s00366-019-00833-x. [Google Scholar] [CrossRef]
44. Nguyen, H., Bui, X. N., Nguyen-Thoi, T., Ragam, P., Moayedi, H. (2019). Toward a state-of-the-art of fly-rock prediction technology in open-pit mines using EANNs model. Applied Sciences, 9(21), 4554. DOI 10.3390/app9214554. [Google Scholar] [CrossRef]
45. Ding, X., Hasanipanah, M., Nikafshan Rad, H., Zhou, W. (2020). Predicting the blast-induced vibration velocity using a bagged support vector regression optimized with firefly algorithm. Engineering with Computers, 37(3), 2273–2284. DOI 10.1007/s00366-020-00937-9. [Google Scholar] [CrossRef]
46. Rana, A., Bhagat, G. P., Jadaun, N. K., Rukhaiyar, S., Pain, A. et al. (2020). Predicting blast-induced ground vibrations in some indian tunnels: A comparison of decision tree, artificial neural network and multivariate regression methods. Mining Metallurgy & Exploration, 37(4), 1039–1053. DOI 10.1007/s42461-020-00205-w. [Google Scholar] [CrossRef]
47. Khandelwal, M. (2010). Blast-induced ground vibration prediction using support vector machine. Engineering with Computers, 27(3), 193–200. DOI 10.1007/s00366-010-0190-x. [Google Scholar] [CrossRef]
48. Nguyen, H. (2020). Application of the K-nearest neighbors algorithm for predicting blast-induced ground vibration in open-pit coal mines: A case study. Journal of Mining and Earth Sciences, 61(6), 22–29. DOI 10.46326/JMES.2020.61(6). 03. [Google Scholar] [CrossRef]
49. Maier, O., Wilms, M., von der Gablentz, J., Krämer, U. M., Münte, T. F. et al. (2015). Extra tree forests for sub-acute ischemic stroke lesion segmentation in MR sequences. Journal of Neuroscience Methods, 240, 89–100. DOI 10.1016/j.jneumeth.2014.11.011. [Google Scholar] [CrossRef]
50. Geurts, P., Ernst, D., Wehenkel, L. (2006). Extremely randomized trees. Machine Learning, 63(1), 3–42. DOI 10.1007/s10994-006-6226-1. [Google Scholar] [CrossRef]
51. John, V., Liu, Z., Guo, C., Mita, S., Kidono, K., (2015). Real-time lane estimation using deep features and extra trees regression. In: Image and video technology. Switzerland: Springer, Cham. [Google Scholar]
52. Saeed, U., Jan, S. U., Lee, Y. D., Koo, I. (2021). Fault diagnosis based on extremely randomized trees in wireless sensor networks. Reliability Engineering & System Safety, 205, 107284. DOI 10.1016/j.ress.2020.107284. [Google Scholar] [CrossRef]
53. Drucker, H., Burges, C. J., Kaufman, L., Smola, A., Vapnik, V. (1997). Support vector regression machines. Advances in Neural Information Processing Systems, 9, 155–161. [Google Scholar]
54. Cortes, C., Vapnik, V. (1995). Support vector machine. Machine Learning, 20(3), 273–297. DOI 10.1007/BF00994018. [Google Scholar] [CrossRef]
55. Gao, Z., Lin, Y., Sun, X., Zeng, X. (2021). A reduced order method for nonlinear parameterized partial differential equations using dynamic mode decomposition coupled with K-nearest-neighbors regression. Journal of Computational Physics, 452, 110907. DOI 10.1016/j.jcp.2021.110907. [Google Scholar] [CrossRef]
56. Breiman, L., Friedman, J. H., Olshen, R. A., Stone, C. J. (2017). Classification and regression trees (1st ed.). New York: Routledge. DOI 10.1201/9781315139470. [Google Scholar] [CrossRef]
57. Russell, S., Norvig, P. (2002). Artificial intelligence: A modern approach. Hoboken, NJ: Pearson. [Google Scholar]
58. Srivastava, R., Tiwari, A. N., Giri, V. K. (2019). Solar radiation forecasting using MARS, CART, M5, random forest model: A case study for India. Heliyon, 5(10), e02692. DOI 10.1016/j.heliyon.2019.e02692. [Google Scholar] [CrossRef]
59. Gomes, C. M. A., Jelihovschi, E. (2020). Presenting the regression tree method and its application in a large-scale educational dataset. International Journal of Research & Method in Education, 43(2), 201–221. DOI 10.1080/1743727X.2019.1654992. [Google Scholar] [CrossRef]
60. Refaeilzadeh, P., Tang, L., Liu, H. (2009). Cross-validation. Encyclopedia of Database Systems, 5, 532–538. DOI 10.1007/978-0-387-39940-9. [Google Scholar] [CrossRef]
61. Marcot, B. G., Hanea, A. M. (2021). What is an optimal value of k in k-fold cross-validation in discrete Bayesian network analysis? Computational Statistics, 36(3), 2009–2031. DOI 10.1007/s00180-020-00999-9. [Google Scholar] [CrossRef]
62. Tsamardinos, I., Greasidou, E., Borboudakis, G. (2018). Bootstrapping the out-of-sample predictions for efficient and accurate cross-validation. Machine Learning, 107(12), 1895–1922. DOI 10.1007/s10994-018-5714-4. [Google Scholar] [CrossRef]
63. Jiang, P., Chen, J. (2016). Displacement prediction of landslide based on generalized regression neural networks with K-fold cross-validation. Neurocomputing, 198, 40–47. DOI 10.1016/j.neucom.2015.08.118. [Google Scholar] [CrossRef]
64. Jian, Z., Shi, Z., Huang, R., Qiu, X., Chong, C. (2016). Feasibility of stochastic gradient boosting approach for predicting rockburst damage in burst-prone mines. Transactions of Nonferrous Metals Society of China, 26(7), 1938–1945. DOI 10.1016/S1003-6326(16)64312-1. [Google Scholar] [CrossRef]
65. Ambraseys, N. N., Hendron, A. J. (1968). Rock mechanics in engineering practice, pp. 203--236. London: Wiley & Sons. [Google Scholar]
Cite This Article
 Copyright © 2023 The Author(s). Published by Tech Science Press.
This work is licensed under a Creative Commons Attribution 4.0 International License , which permits unrestricted use, distribution, and reproduction in any medium, provided the original work is properly cited.
 Downloads
 Citation Tools