
 Submit a Paper
 Propose a Special lssue
 Open Access
ARTICLE
Predicting Carpark Prices Indices in Hong Kong Using AutoML
1
Sustainable Real Estate Research Center, Hong Kong Shue Yan University, Hong Kong, 999077, China
2
Chakrabongse Bhuvanarth International Institute for Interdisciplinary Studies, Rajamangala University of Technology Tawan-Ok,
Bangkok, 10400, Thailand
3
Zhongyuan Region Company, Jinke Property Group Co., Ltd., Zhengzhou, 450000, China
4
Wolfson College, Oxford University, Oxford, OX2 6UD, UK
5
Institute of Biomedical and Environmental Science & Technology, University of Bedfordshire, Luton, LU1 3JU, UK
6
School of Life Sciences, Shanxi University, Taiyuan, 030006, China
7
Department of Computer Science and Engineering, European University Cyprus, Nicosia, 1516, Cyprus
* Corresponding Author: Xiao-Guang Yue. Email:
Computer Modeling in Engineering & Sciences 2023, 134(3), 2247-2282. https://doi.org/10.32604/cmes.2022.020930
Received 20 December 2021; Accepted 13 May 2022; Issue published 20 September 2022
 View Full Text
 Download PDF
Abstract
The aims of this study were threefold: 1) study the research gap in carpark and price index via big data and natural language processing, 2) examine the research gap of carpark indices, and 3) construct carpark price indices via repeat sales methods and predict carpark indices via the AutoML. By researching the keyword “carpark” in Google Scholar, the largest electronic academic database that covers Web of Science and Scopus indexed articles, this study obtained 999 articles and book chapters from 1910 to 2019. It confirmed that most carpark research threw light on multi-storey carparks, management and ventilation systems, and reinforced concrete carparks. The most common research method was case studies. Regarding price index research, many previous studies focused on consumer, stock, press and futures, with many keywords being related to finance and economics. These indicated that there is no research predicting carpark price indices based on an AutoML approach. This study constructed repeat sales indices for 18 districts in Hong Kong by using 34,562 carpark transaction records from December 2009 to June 2019. Wanchai’s carpark price was about four times that of Yuen Long’s carpark price, indicating the considerable carpark price differences in Hong Kong. This research evidenced the features that affected the carpark price indices models most: gold price ranked the first in all 19 models; oil price or Link stock price ranked second depending on the district, and carpark affordability ranked third.Graphic Abstract

Keywords
Parking a car is routine for many drivers [1]. Many modern cities have limited carparks despite increasing the number of vehicles [2,3]. Some US cities have implemented a clear policy to manage off-street parking [4]. The demand has led to a sharp rise in car parking fees. Previous research [5–8] showed that parking costs in the city, transit time via public transport, and transport times at the station were essential factors that affected driving behaviour. Indeed, in response to the high demand for parking, the Victorian State Government provided 5,000 additional parking spaces at railway stations within the regional and metropolitan rail networks in 2006 [9]. In Hong Kong, many carparks locate beneath towers of residential buildings to meet residents’ needs [10].
As carpark availability impacts drivers' time, some research investigated carpark management systems. It mainly includes parking management, user management, spatial allocation, and route distribution. An automatic parking lot allocation mechanism was developed to ease the parking process. The user management module provides users with registration information to address individual parking needs [11], which is the basis for automatic parking allocation. The automatic parking lot distribution mechanism, based on WiFi positioning technology [12], considers the individual needs of the parking user in the allocation of parking spaces and the route distribution module, thereby overcoming the problem of finding a parking lot and easing traffic congestion.
Some users have raised concerns regarding mobile apps that provide real-time parking information. Automatically assigned carparks via algorithms could alleviate parking problems [13]. System insecurity and privacy leakage that protect personal data were found to have room for improvement. Moreover, a digital divide exists among disadvantaged groups, and the mere provision of Information and Communication Technology (ICT) facilities cannot solve the problem. It is developing a suitable way for ICTs that serves all citizens matters [14]. Overall, technologies alone cannot make a city smart or more intelligent.
Another strand of carpark research mainly sheds light on environmental and sustainability issues. Liquid fuel combustion in vehicles' engines is the primary source of the emission of benzene, toluene, ethylbenzene, and xylene (BTEX) compounds into the air in the underground car park. Marć et al. [15] concluded that benzene concentration is considerably higher in an underground carpark than in an above-ground carpark. It was found that air quality in a car park is affected by the number of cars parking on the lower carpark level and the closest location of the exit/entrance of the car park.
Zhang et al. [16] threw light on electric vehicles; matching the vehicles and carpark locations do concern renting price and time fit and how vehicles in the shared carparks may take part in the electricity market according to the behaviour of typical electric vehicles (EVs). Furthermore, a shared carpark system for multiple parking units in a power market can integrate multiple carpark units. Each unit contains its position scenarios, power price, and independent power consumption. To address the competition between units, a renting bids sequencing table could integrate the rental price and the benefit that contribute to the units. A nesting optimization model was also built for benefit contribution computation. To process the nesting optimization model, a modified Lagrangian multiplier method was developed to establish an optimization model to solve various competing concerns like rental price and power by a gradient-based algorithm.
In Hong Kong, carparks may be restricted to residents’ use, or they could be opened to the public. 90% of the open space carpark is for the public. There are approximately 690,000 carparks in Hong Kong, 195,000 designated for public use and 495,000 for private use in commercial, residential, and industrial buildings [17]. According to the Estate Agents Authority [18], carpark conveyancing involves (1) provisional agreement for sale and purchase, (2) formal agreement for sale and purchase, (3) redemption, (4) assignment, (5) mortgage, (6) stamp duty, (7) land registration, (8) completion, (9) title, (10) sub-sale and sub-purchase.
The Rating and Valuation Department first introduced computer-assisted mass appraisal (CAMA) techniques for assessing rates mid-1980s. CAMA has since been extensively applied to systematically enable the valuation staff to assess large numbers of properties within a short time frame and produce more accurate and consistent valuations [19]. While there are indices for most property types such as residential, industrial and offices, the Rating and Valuation Department in Hong Kong and academia have not yet constructed carpark price indices. Furthermore, predicting carpark price indices via AutoML will be of great practical value, allowing officials to forecast future prices better and provide valuable information to town planners.
2 Methods, Results and Discussion
2.1 Google Scholar Results from 1910 to 2019
This study reviewed carpark and price index research indexed in Google Scholar. Previous research found that Google contained the most academic articles for each topic [20]. Google Scholar had the most significant percentage of citations in all fields of research (93%–96%), substantially more than Web of Science (WoS) (27%–73%) and Scopus (35%–77%) [21]. It then utilized the tokenization method to parse the titles of the publications indexed on Google Scholar to identify the research void [22].
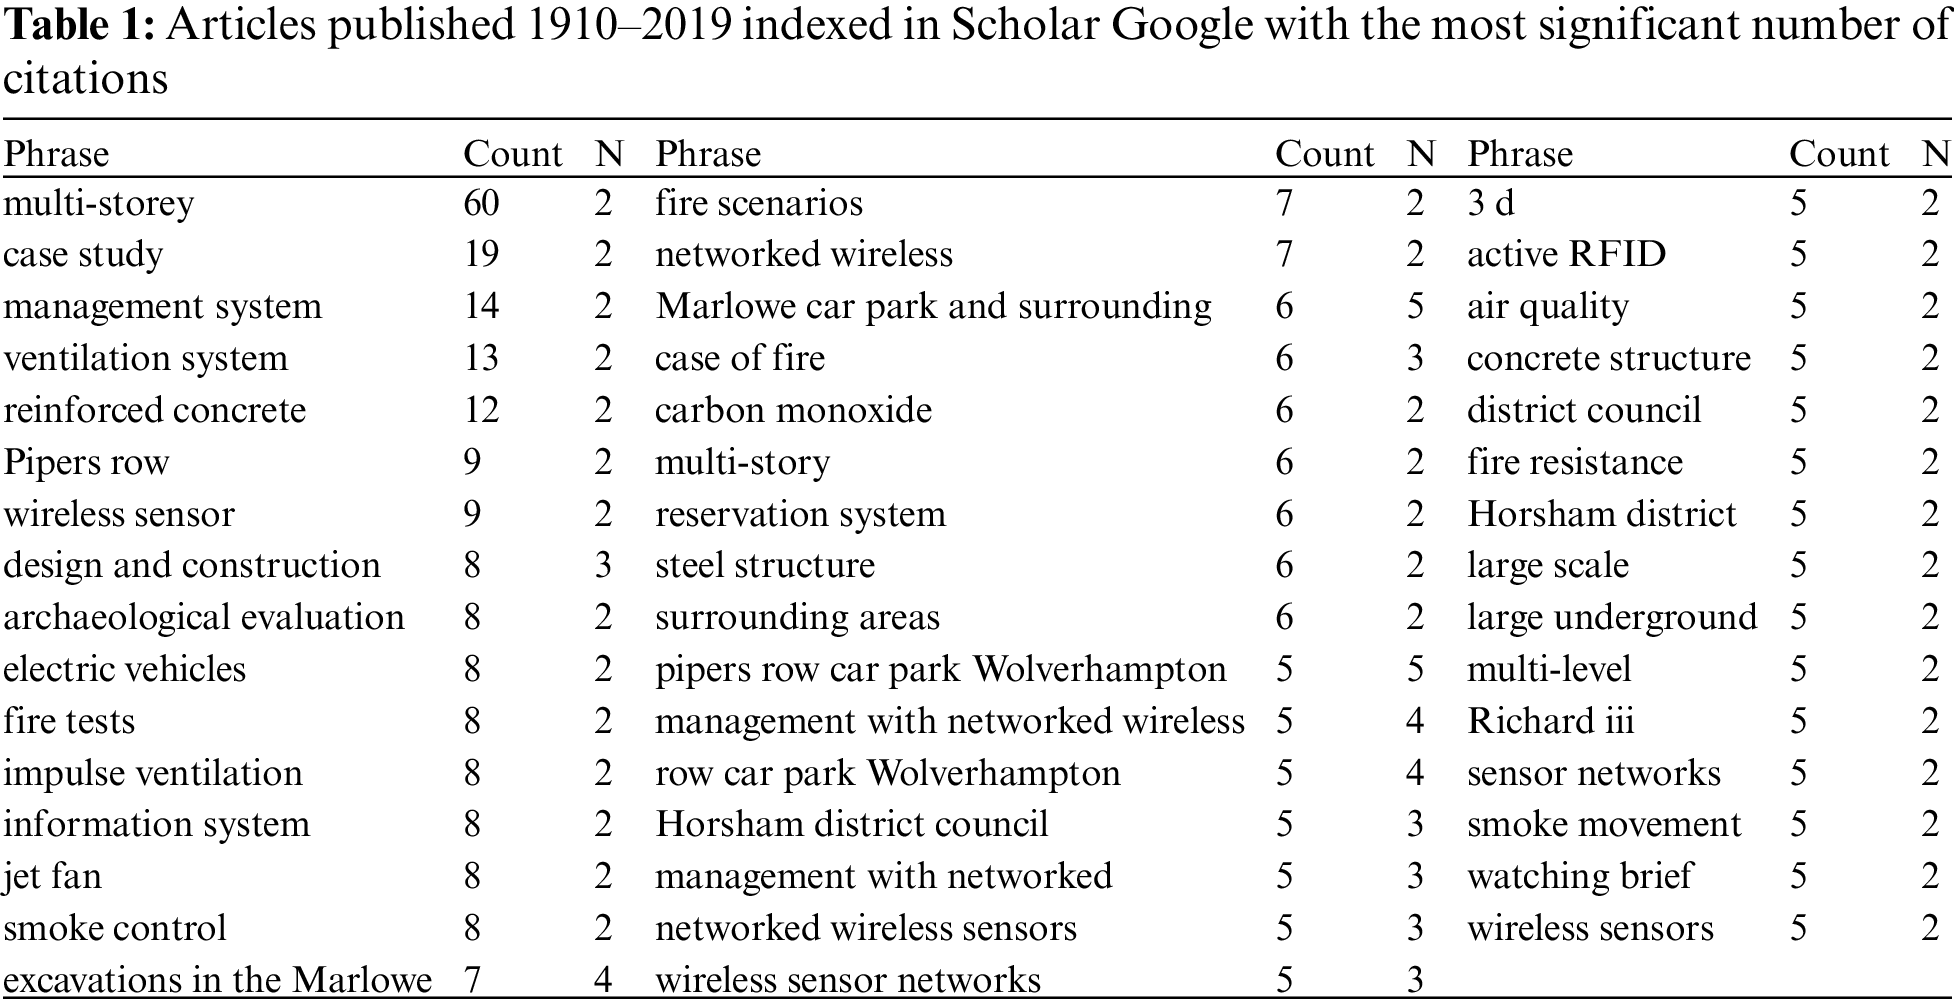
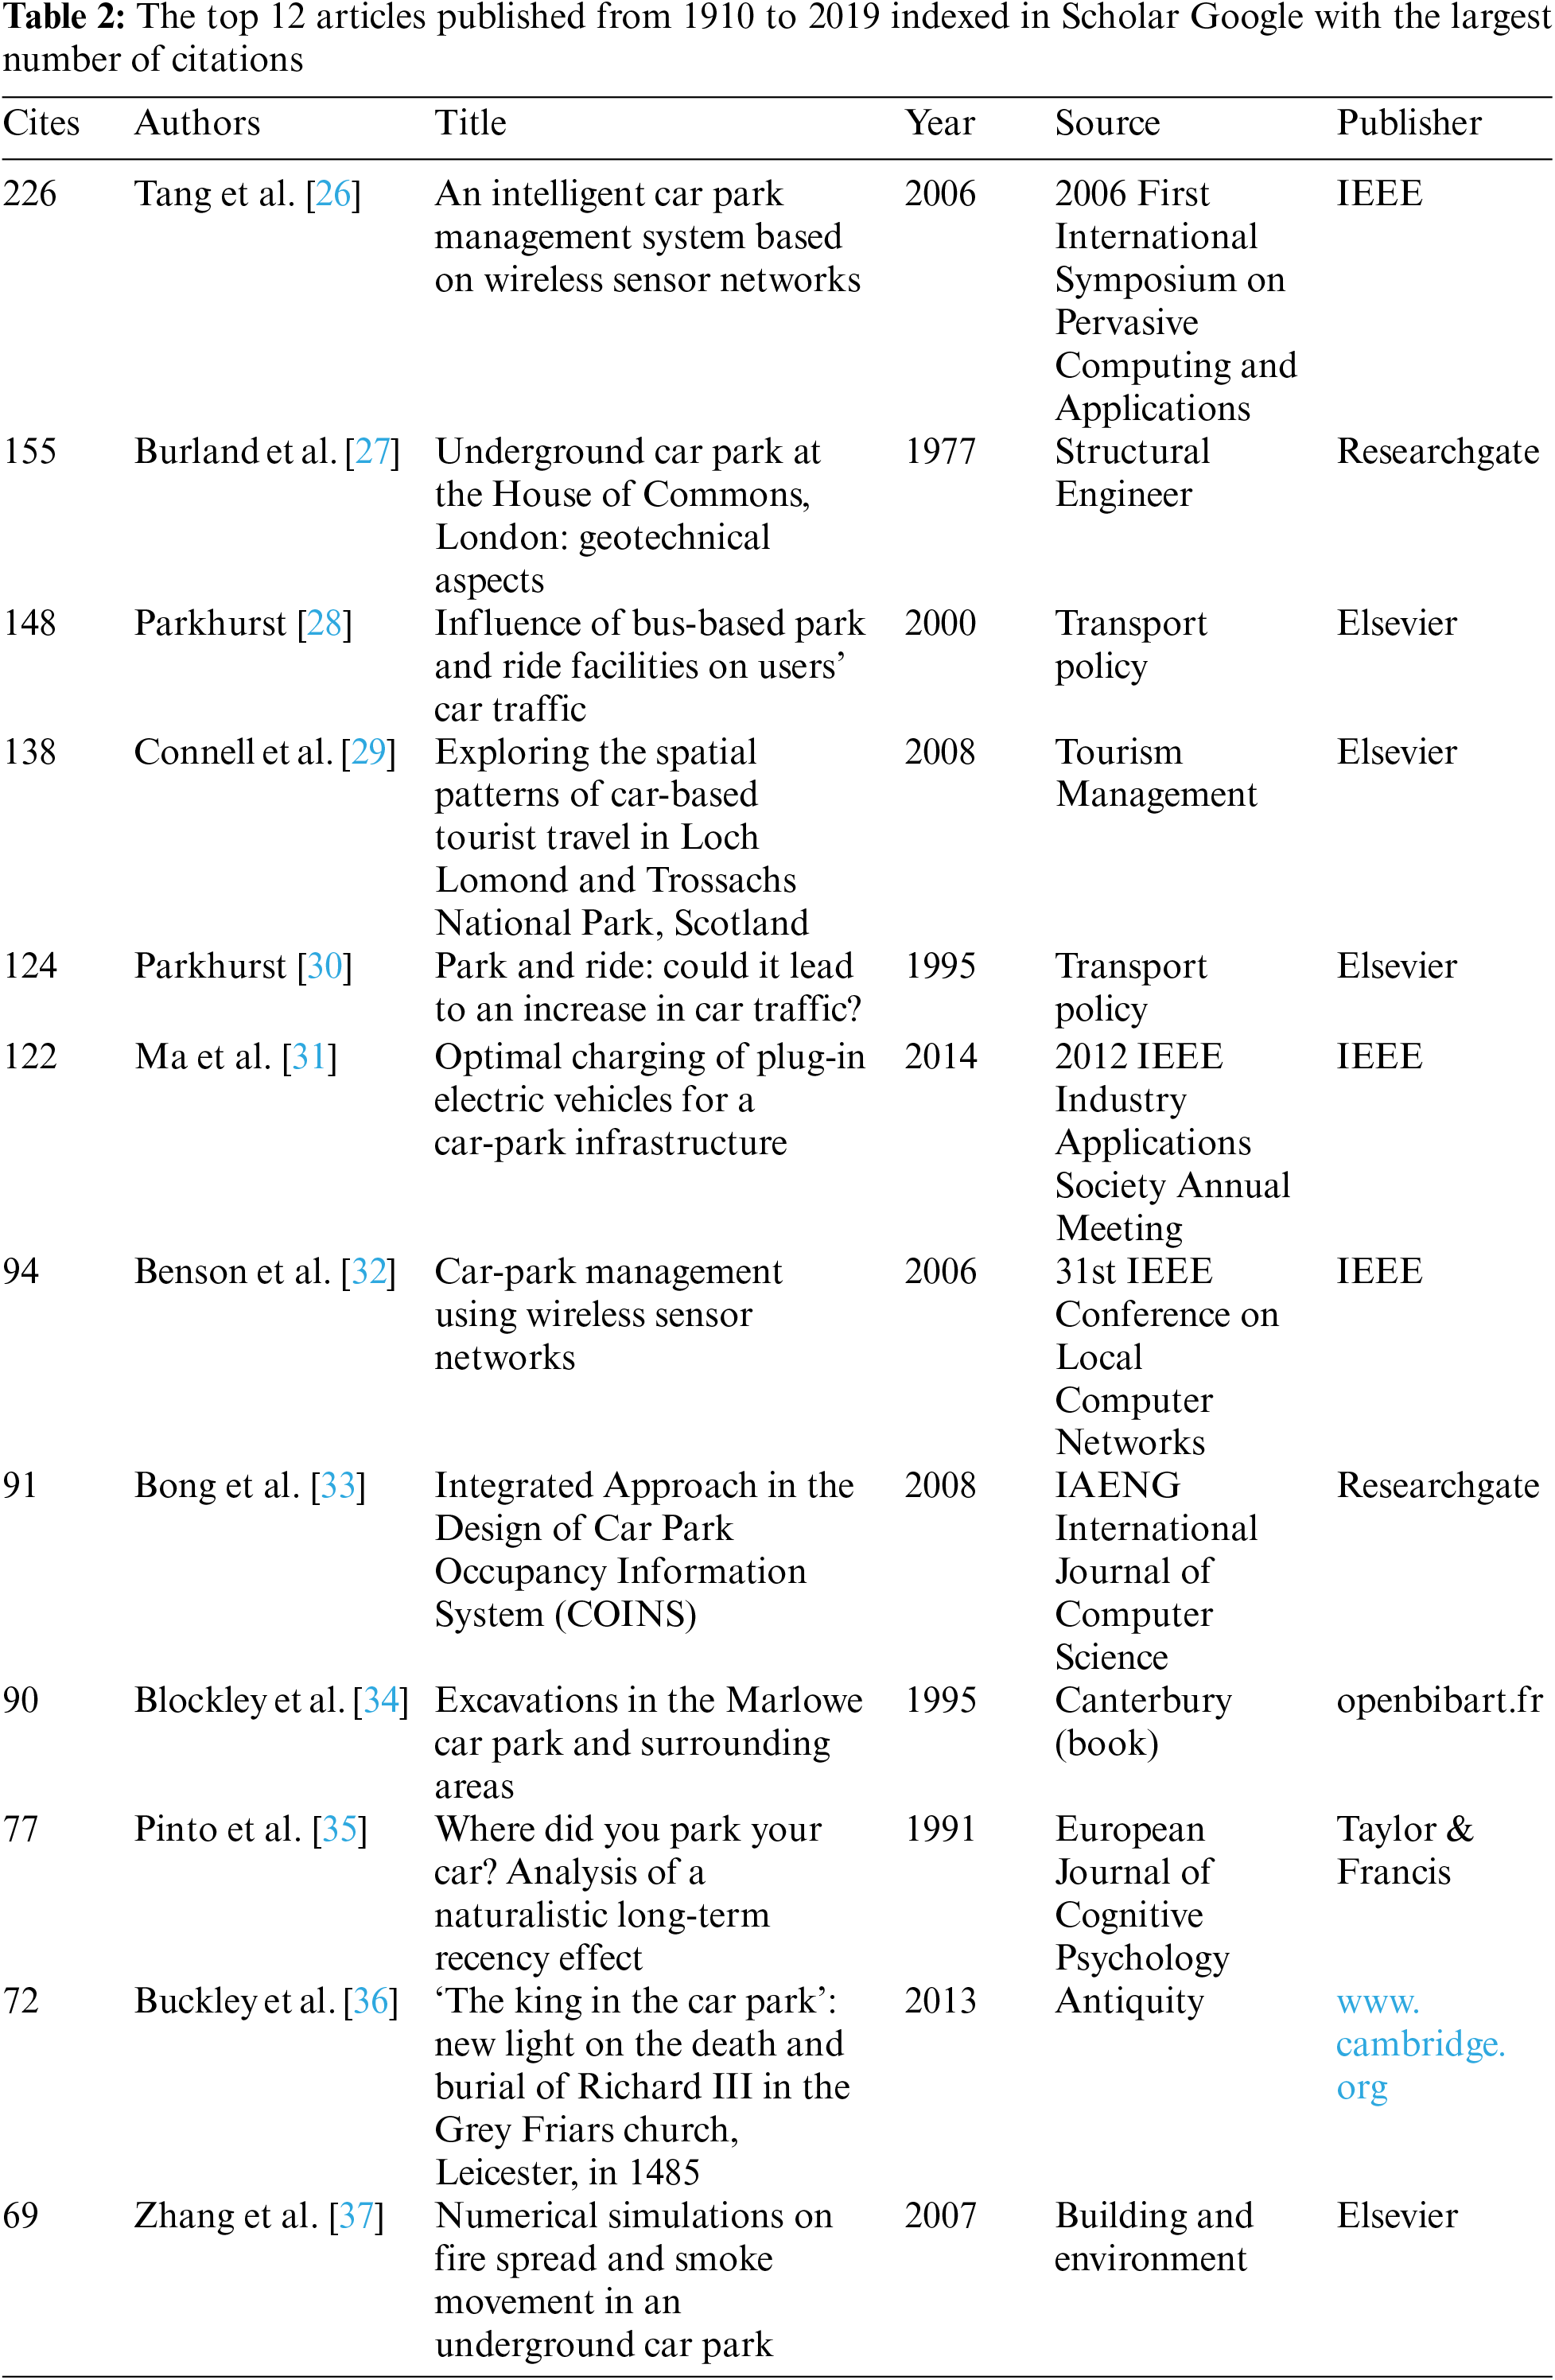
Google Scholar may include articles outside the authoritative databases such as WoS and Scopus, comprehensive coverage can reveal articles related to carparks, including those indexed in these databases and outside this topic [23]. Using carpark as the keyword search in Google Scholar, this study obtained 999 results from 1910 to 2019 with carpark in the title. It allowed us to find the latest research about carpark quickly and confirmed carpark price index prediction as to the research gap.1The results showed that the most used words in the title associated with carpark research include “underground”, “system”, “fire”, “multi”, and “design” (Fig. 1). The results of tokenization, one branch of natural language processing, showed that many of these studies focused on multi-storey management and ventilation systems, multi-storey, and reinforced concrete case studies (Table 1). All these factors indicated that popular studies of carparks were related to the built environment. There was no carpark research with “index” in the title. The most relevant cited articles are “An intelligent car park management system based on wireless sensor networks”, “Underground carpark at the House of Commons, London: geotechnical aspects”, and “Influence of bus-based park and ride facilities on users’ car traffic” (Table 2). However, one notable characteristic of carpark research is that many of these are conference articles rather than peer-reviewed journal articles.
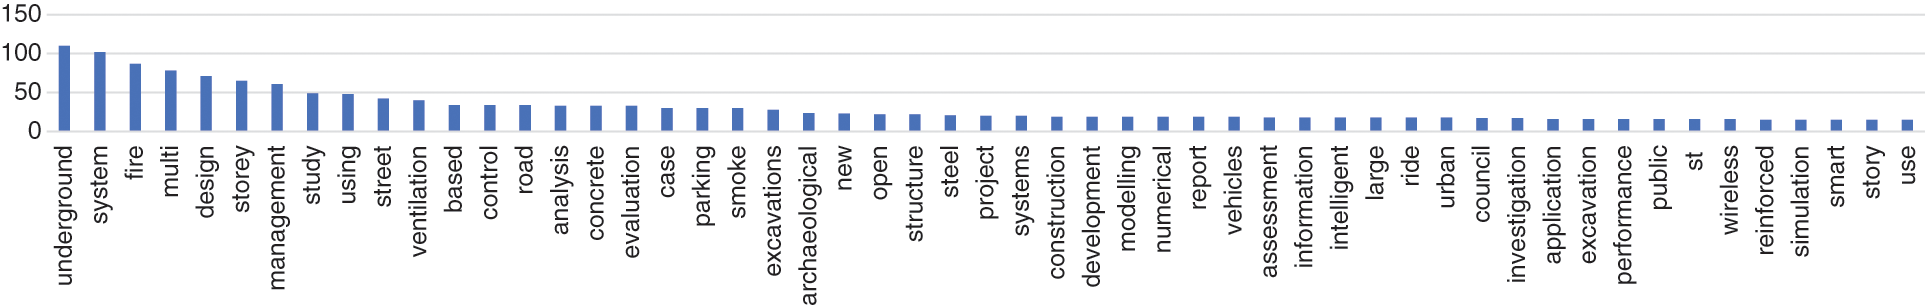
Figure 1: Major words used in carpark research titles for research work indexed in Scholar Google results from 1910 to 2019
2.2 Price Index: Scholar Google Results from 1988 to 2019
To quantify and compare price movements, different indices were developed. For example, the Hang Seng Index is used to measure the movement of a basket of stock prices in Hong Kong, and the World Development Index is used to compare the different levels of development Worldwide. Likewise, there are many different ways to construct indices in academia [24].
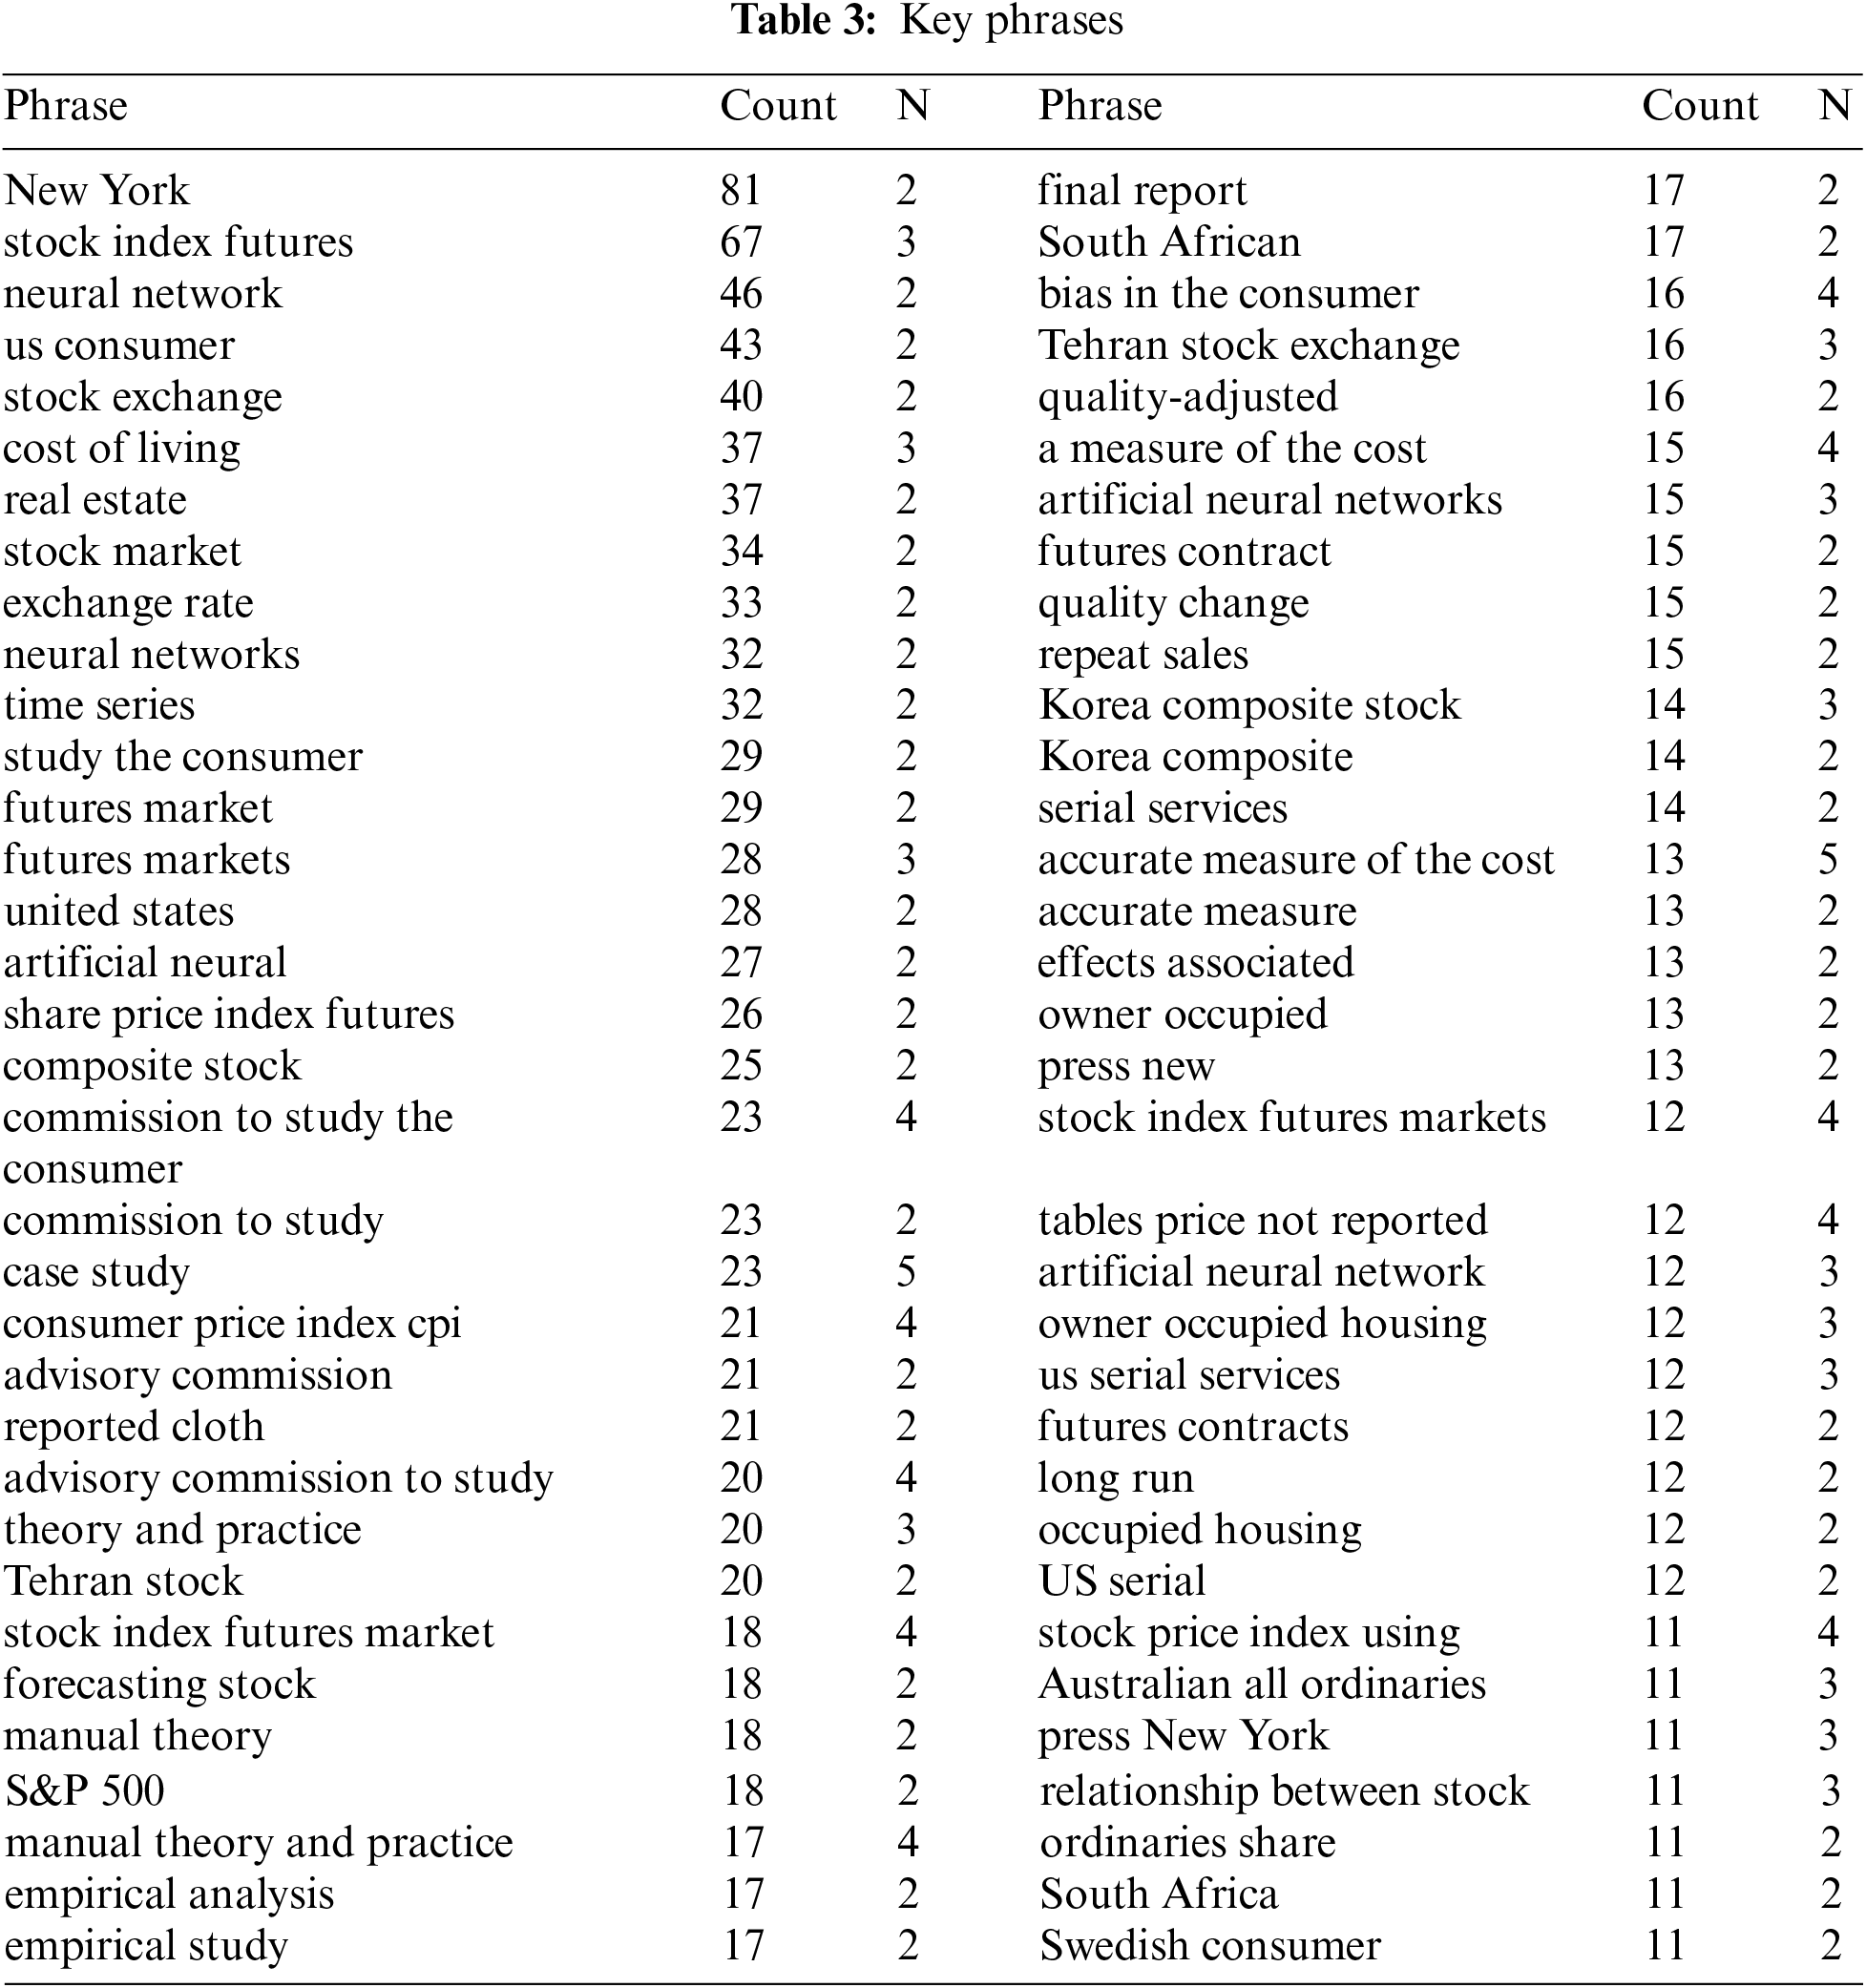
There were 2982 articles in Google Scholar search results. Popular article titles were associated with consumer, stock, press and futures (Fig. 2). Thus, many of these title keywords were related to finance and economics. The study of natural language has been an area of research interest for years, and tokenization is one of the methods that has been adopted [22,25]. However, this method is rarely used in real estate research. This study obtained the highest frequency of phrases by utilizing a tokenization approach, a natural language processing method. These included “New York”, “stock index futures”, “neural network”, and “US consumer” (Table 3).
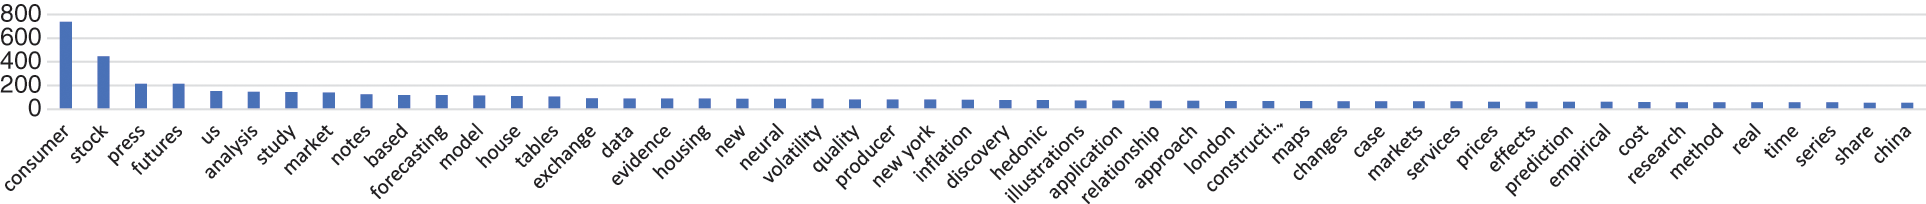
Figure 2: Major words used in price index research titles for research work indexed in Scholar Google results from 1988 to 2019
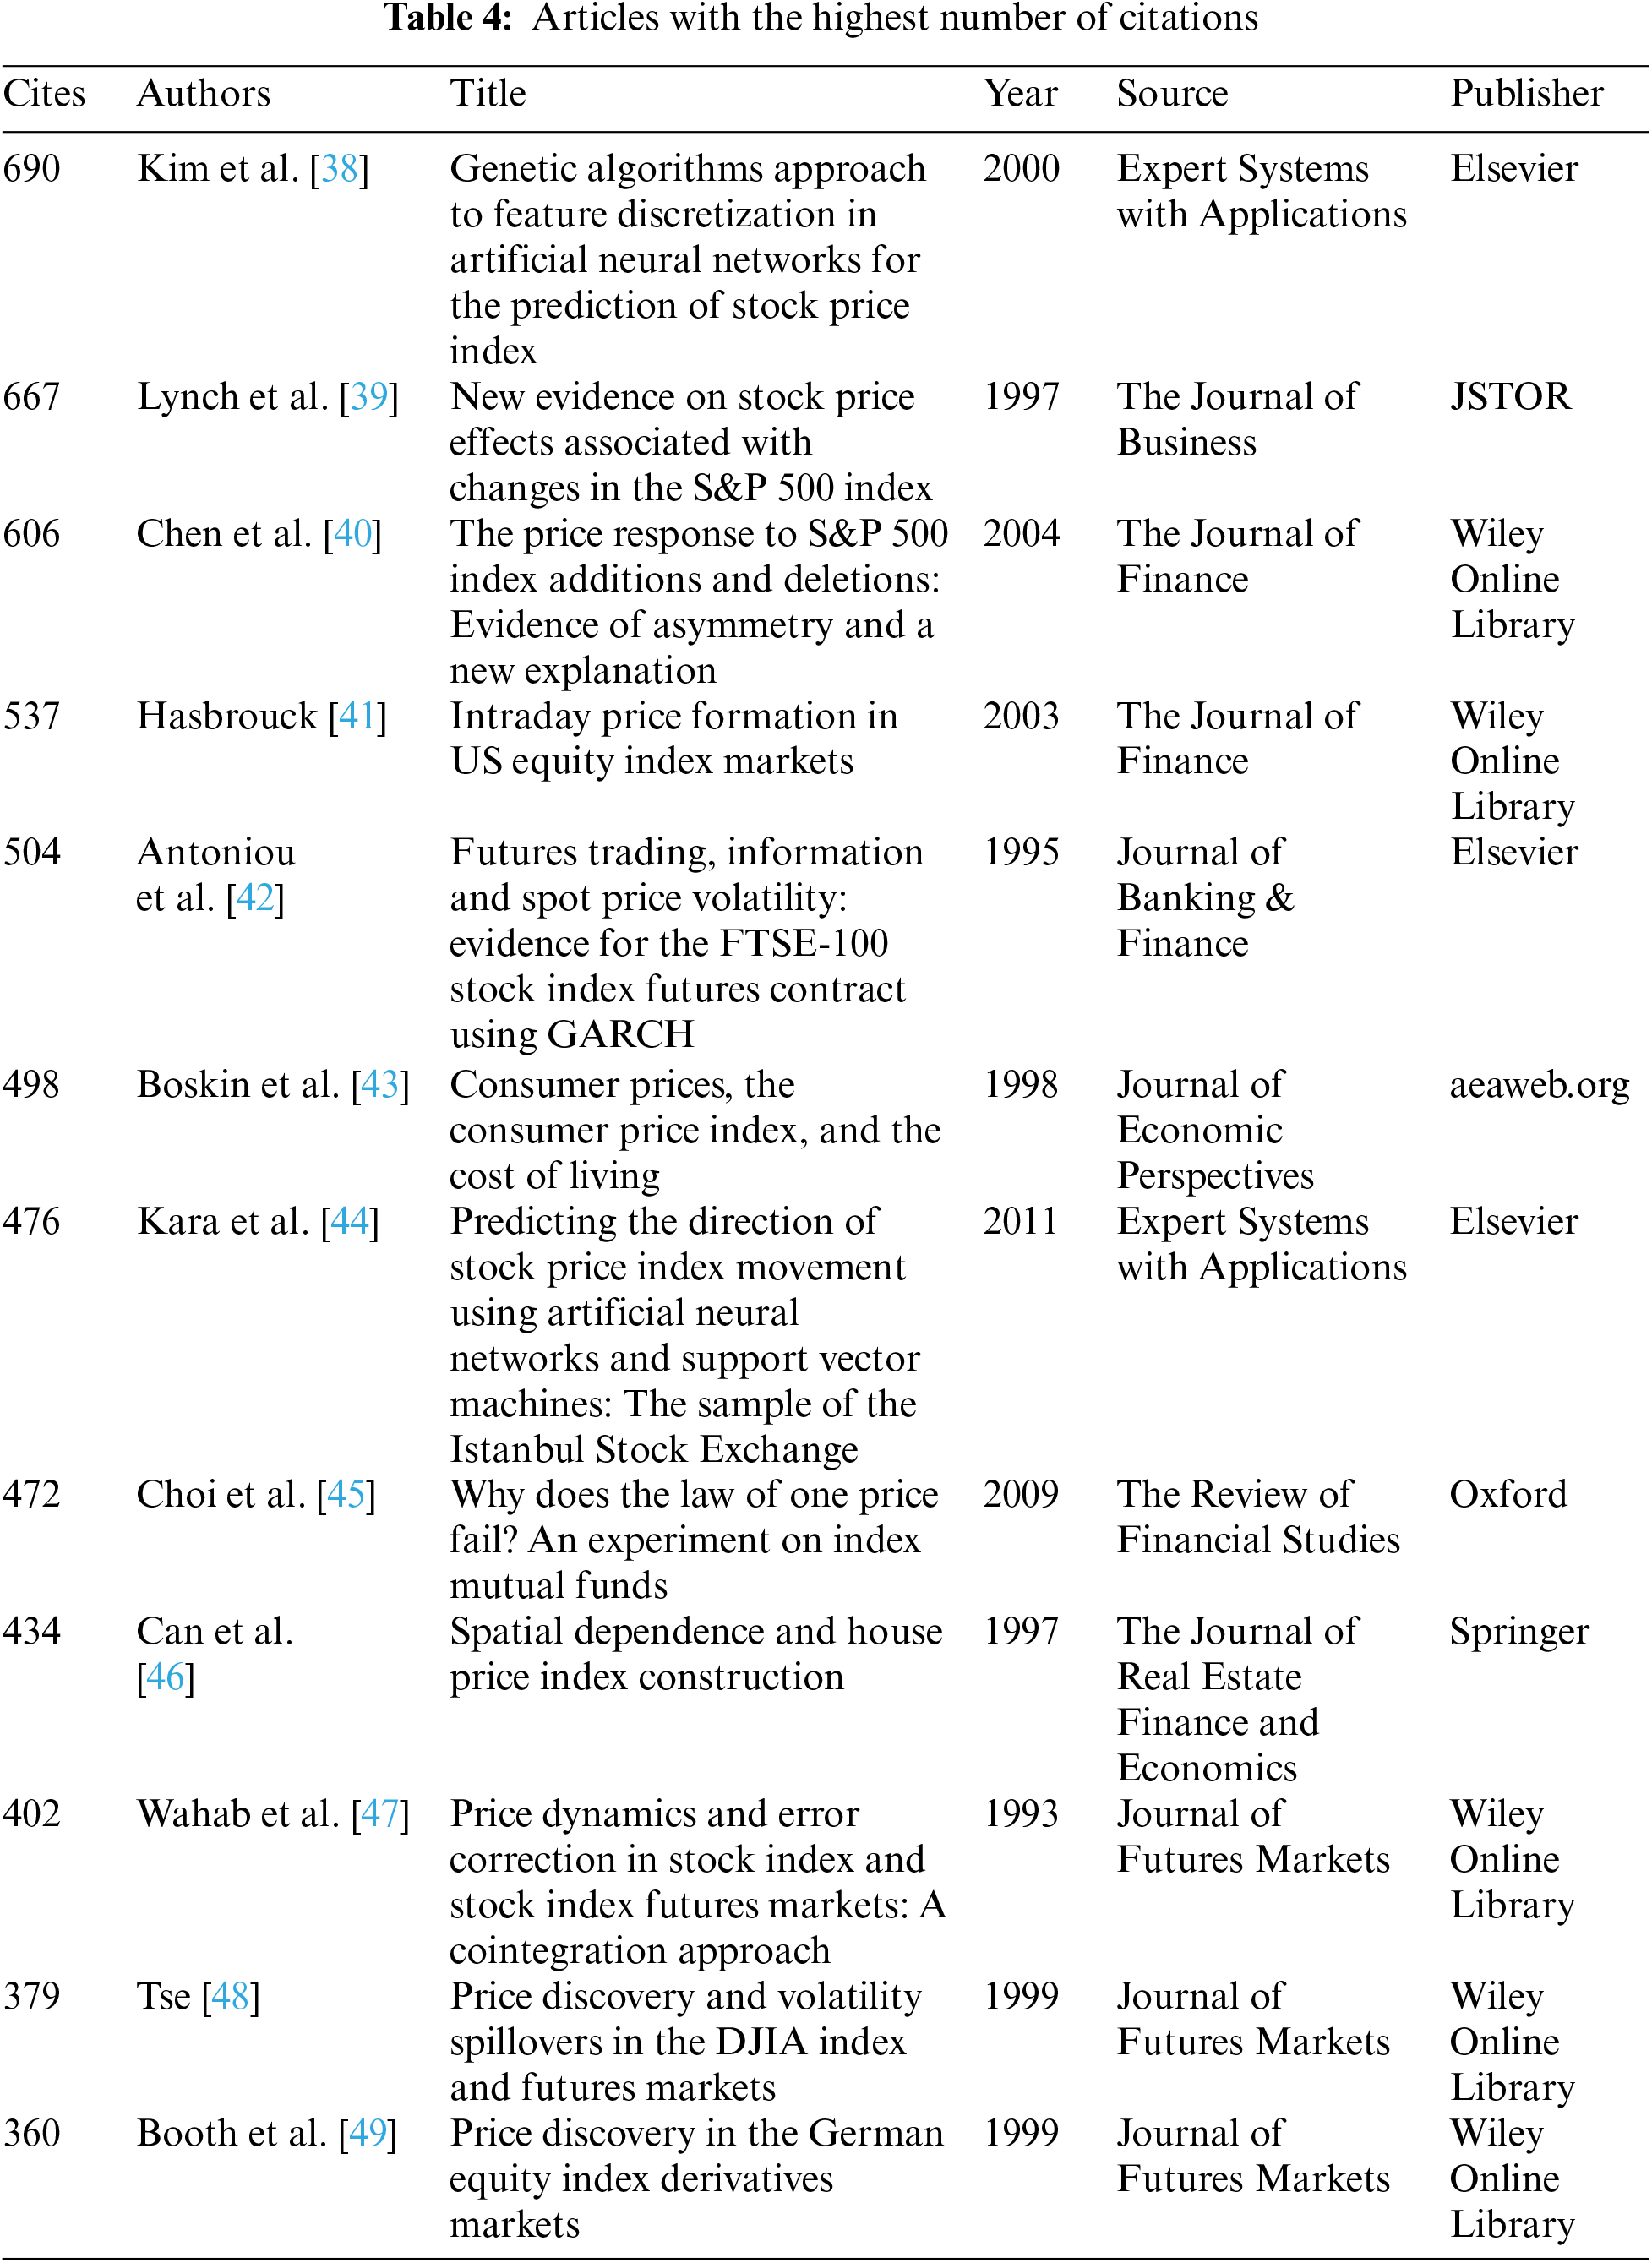
Besides, this study also threw light on these articles’ citations, that is, articles cited and referenced by other research. Although criticisms exist regarding the use of citations to measure the impact of the research, it remains one easy way to obtain a rough idea of the usefulness of the research within the academic circle. This study found that the highest cited articles included “Genetic algorithms approach to feature discretization in artificial neural networks for the prediction of stock price index” (690 citations), “New evidence on stock price effects associated with changes in the S&P 500 index” (667 citations) and “The price response to S&P 500 index additions and deletions: Evidence of asymmetry and a new explanation” (Table 4). While there are articles related to real estate and housing indices, none focused on the carpark price index. This study constructed a carpark index to fill the research void.
2.3 Previous Research on Real Estate Indices
This study presented detailed information in indices allows readers to track price changes over time [24] easily. Real estate price indices have been applied to test the efficiency of the housing market [50], understand the role of housing in a mixed-asset portfolio [51], examine the hedging mechanism for commercial real estate assets [42–54], estimate real estate derivatives and home equity insurance [55], the relationship between house price and housing demand [56], and model the supply of housing [57,58].
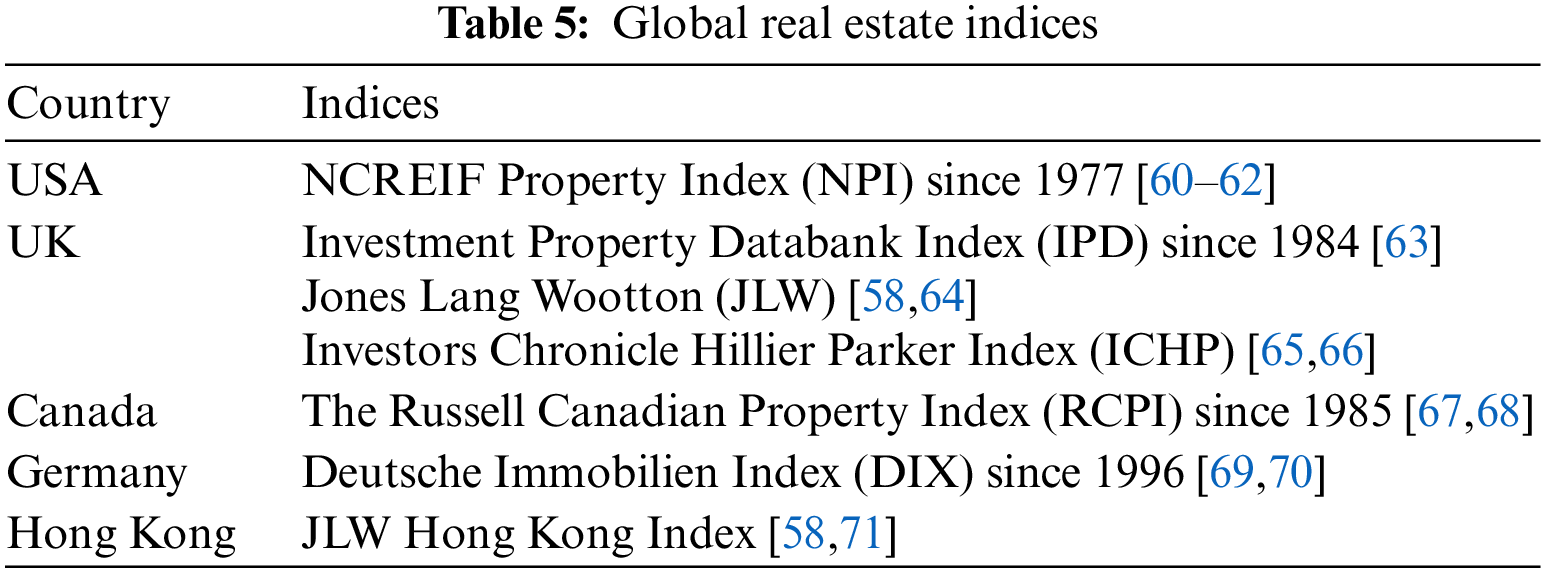
There is no consensus on the best method for constructing real estate indices [58]. Real estate indices can generally be categorized into three groups: appraisal-based, stock market-based, and transaction-based [53]. The appraisal-based indices are used for commercial properties, as the amount of information available on transaction prices in the commercial property market is insufficient. Appraisal data is also primarily used in an emerging housing market, where property transactions are infrequent and are mainly completed in secret, meaning that transaction databases rarely exist [58,59]. The appraisal indices are constructed as an average of the current appraised values of the properties for each period in which the indices are reported. Thus, the appraisal-based indices rely on a sample of properties, and the appraisers have to ensure reliable results. However, the major drawback of this approach is that regular estimation of the property values requires a large amount of work. The following table presents some of the existing appraisal indices used around the world (Table 5).
2.3.1 Indirect Real Estate Indices
Indirect real estate includes listed property stock [72] refers to shares of real estate companies listed on the stock exchanges [73]. It also includes REITs, publicly listed real estate stocks, and real estate funds [74]. There are many indirect real estate indices globally. For example, The S&P/ASX 300 Property Index included 24 A-REITs with office, retail and industrial sectors [75].
The most direct and fundamental source of information about property asset prices is transaction prices for individual assets. Derived from daily price changes of Real Estate Investment Trusts (REITs) prices in the stock market, the REITs index reflects the implied valuations of the underlying property assets held by the REITs [53]. The real estate transaction price index, which attempts to control the heterogeneity issue, has recently become popular. It has primarily focused on single-family housing. Two major different approaches to control for heterogeneity have characterized the development of transaction price indices. The first is a hedonic index, and the other is repeat-sales regression [53]. Table 6 identifies the existing transactional indices adopted by various countries [58].

2.3.2 Methods for Constructing Indices
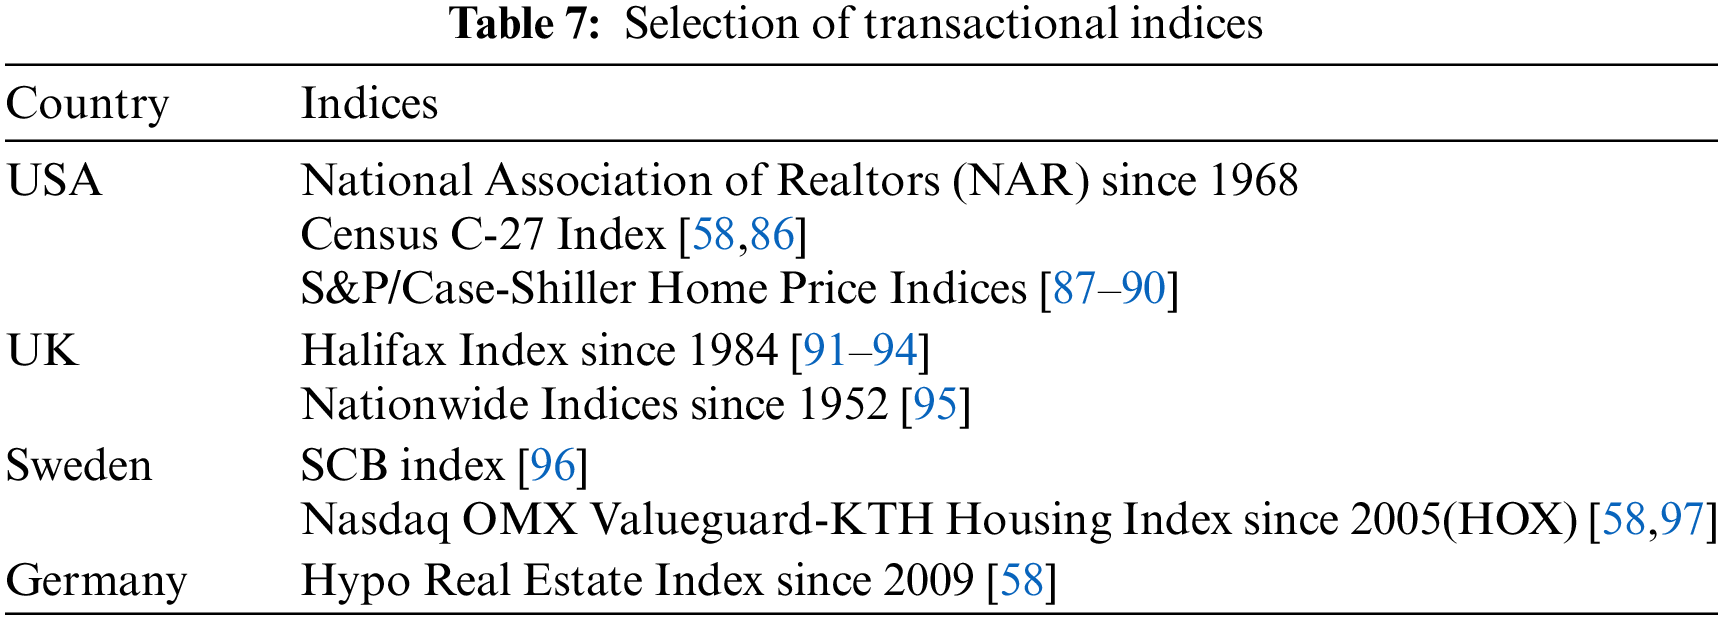
There are three main quality-controlled index construction approaches used for the transaction based index: the hedonic, repeat-sales and the hybrid, a combination of the first two approaches (Table 7) [53,58,98,99]. The hedonic method constructs housing price indices using the time variable hedonic and cross-sectional hedonic models [58]. In the hedonic model, property prices are regressed according to the property’s characteristics, which are applied on a period-by-period basis or estimated on pooled transaction data with time dummies as additional regressors [100].
There are two basic variations of the repeat-sales method: the original repeat-sales (ORS) model and the weighted repeat-sales model [58].
The repeat-sales method standardizes properties’ characteristics regarding the transacted properties by confining the analysis to properties sold at least twice [101]. The repeat-sales method is a variant of the hedonic model. The only difference is that hedonic characteristics are excluded as they assume the properties’ characteristics are the same in different periods.
The hybrid method utilizes the desirable features of hedonic and repeat-sales techniques to estimate real estate price indices [102]. The idea for this model development is credited to Case et al. [103], with many improvements made since then. These include the Quigley (Q-hybrid) model, the Hill, Knight and Sirmans (HKS-hybrid) model, and the Englund, Quigley and Redfearn (EQR-hybrid) model [58].
Most regularly published indices have utilized the repeat sales method to construct indices. Silverstein [104] explained that the repeat sales index of housing price is an OLS (ordinary least square) panel regression of log house price over time fixed effects and house-specific fixed effects. Wang et al. [105] pointed out that the repeat sales model estimated a price index by regressing the price change of each item based on a set of dummy variables. The repeated sales method is relatively robust regarding specification error and omitted variables, more transparent, and easier for industry practitioners and the public to understand [58]. Grimes et al. [106] suggested that the repeat-sales house price index had the advantage of simplicity in analyzing the price change. Clapp et al. [107] suggested that the repeat sales index could be better applied in real estate price estimation to control unchanged quality between sales. Therefore, this model has been applied to construct real estate indices. However, the repeat sales index also has disadvantages. For example, Wong et al. [108] indicated that the repeat sales model could not adjust for depreciation because age and time between sales exhibited a linear relationship.
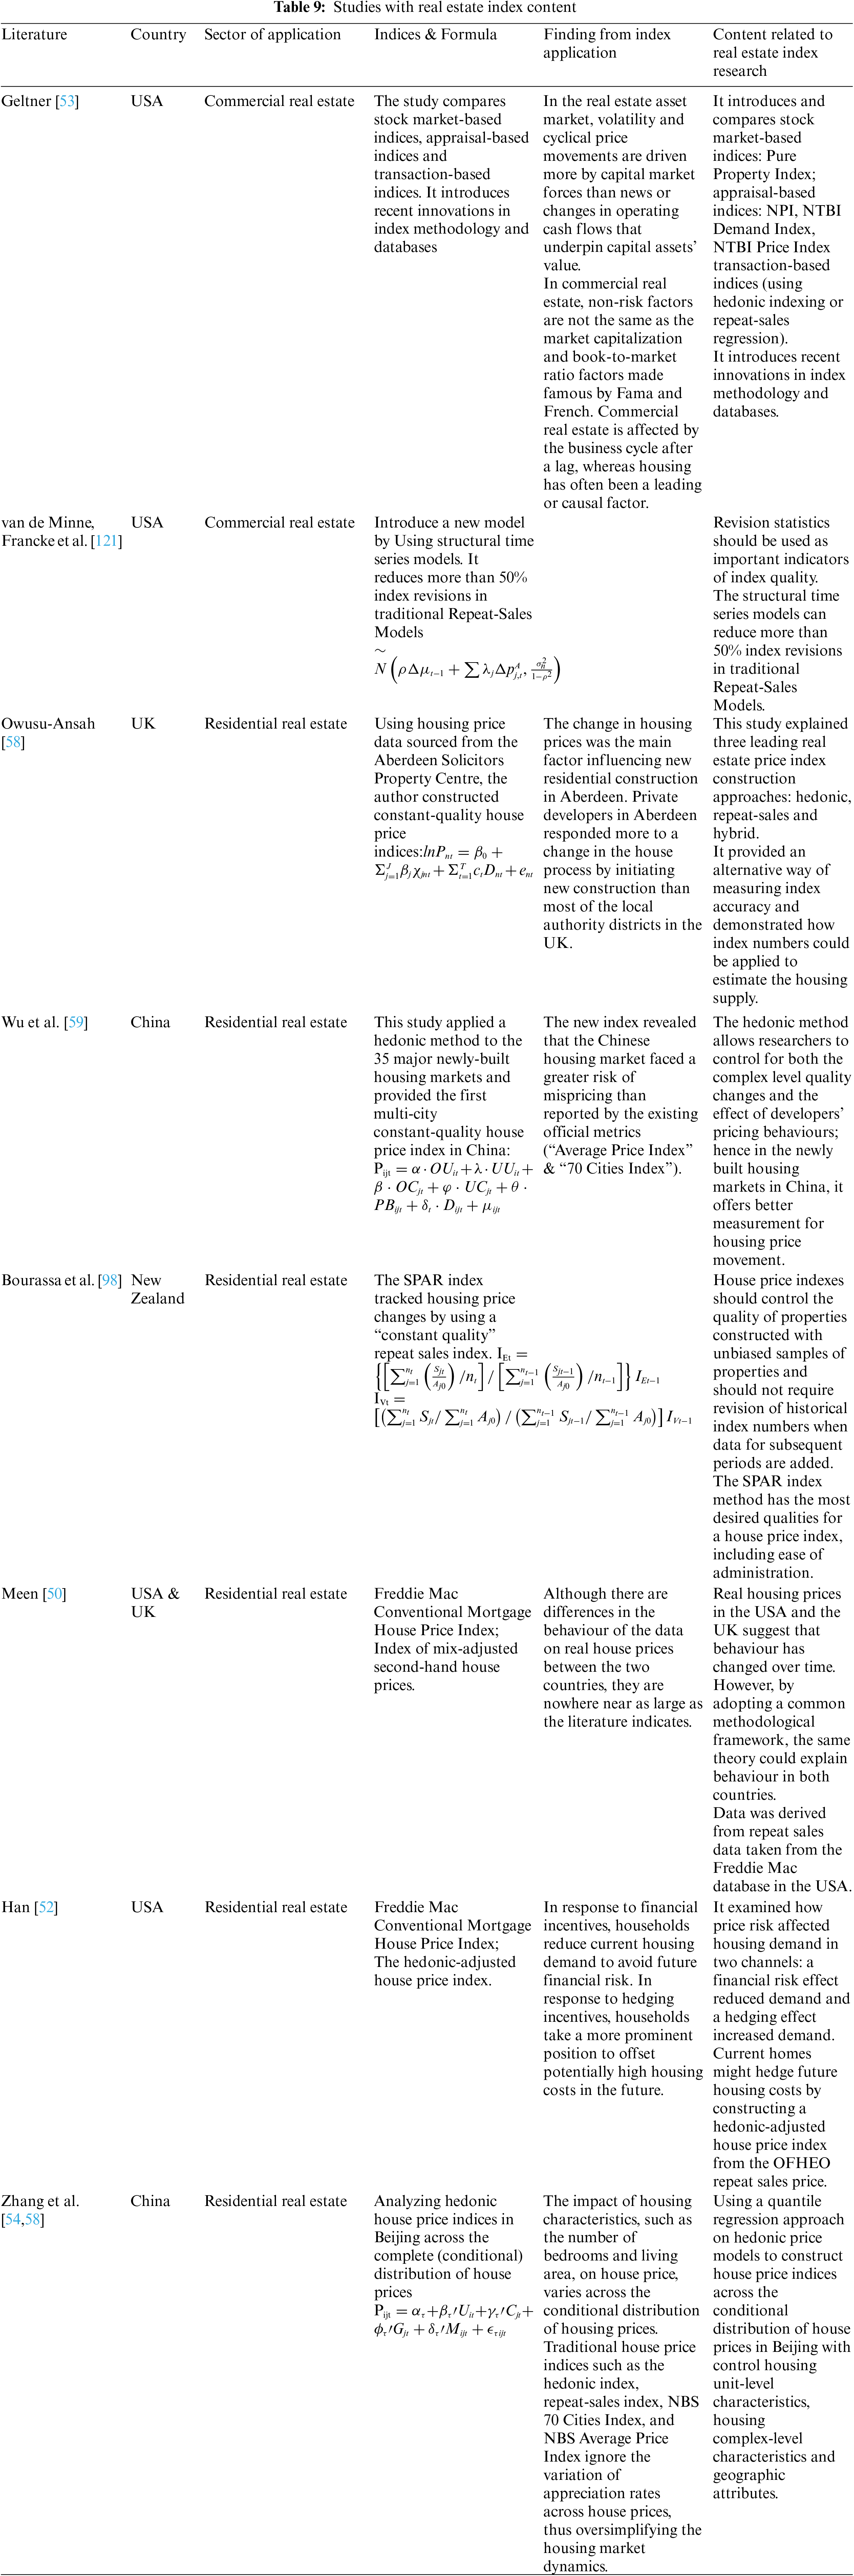
There is no consensus regarding which index construction method performs best regarding accuracy. However, over the past two decades, the innovation and honing of the real estate transaction price indexing method have been impressive. The index method has been greatly improved, but large-scale transaction databases have been developed [53] (see Table 8). For example, van de Minne et al. [121] suggested a structural time series model which can reduce overall index revisions by more than 50%, and Zhang et al. [54] constructed the first quantile house price indices in China to provide insight into the evolution of China’s house price distribution. The feature of a suitable property price index method should include, but are not limited to the following [98]: 1) require fewer data in implementation; 2) use data which is representative of the inventory; 3) standardize quality (constant-quality); 4) easy to implement; 5) no need to change the index construction method when historical numbers are revised.

2.4 Carpark Index Construction
The 34,562 carpark transaction data from December 2009 to June 2019 obtained from CarparkHK.com [122] were included in this research. The website included information about the districts of the carparks, transaction price, date of the transaction and addresses of the carparks.
Firstly, the repeat sales index was used to analyze the carpark price of 18 districts in Hong Kong. Secondly, these data were used to collect the date and the price of the first and second sales for the carpark transaction. Thirdly, we calculated the log price of the difference for each carpark unit. Then, a dummy matrix was created, defining December 2009 as the base period, and the index of this year was equal to 1 (The last year of the research was June 2019). Finally, the number was put at “–1” if the year of the first sale was equal to the current year, equal to “1” if the year of the second sale was equal to the current year; otherwise, the number of as put at 0.
The first step was to input the data of all 18 districts in Hong Kong (HK). After combining these data into Excel, Rstudio was used to obtain the repeat sales index. Secondly, a linear regression model was used to obtain the coefficient of the repeat sales index. The formula was as follows:
Index = lm (Logp ~ 0 + Y201001 + Y201002 + Y201003 + Y201004 + … + Y201904 + Y201905 + Y201906, data = Data). The exponents (unti-log the coefficient of the repeat sales index) were then calculated and a code of “plot(exp(coef(index)))” was used to obtain the plot of the repeat sales index.
The results are shown in Fig. 3 and the location of these 18 districts are depicted in Fig. 4. While almost all of them oscillate around an increasing trend, the North district only displays a slight increase in price index compared to other districts. The Wanchai district’s carpark price index does not have a clear upward trend.

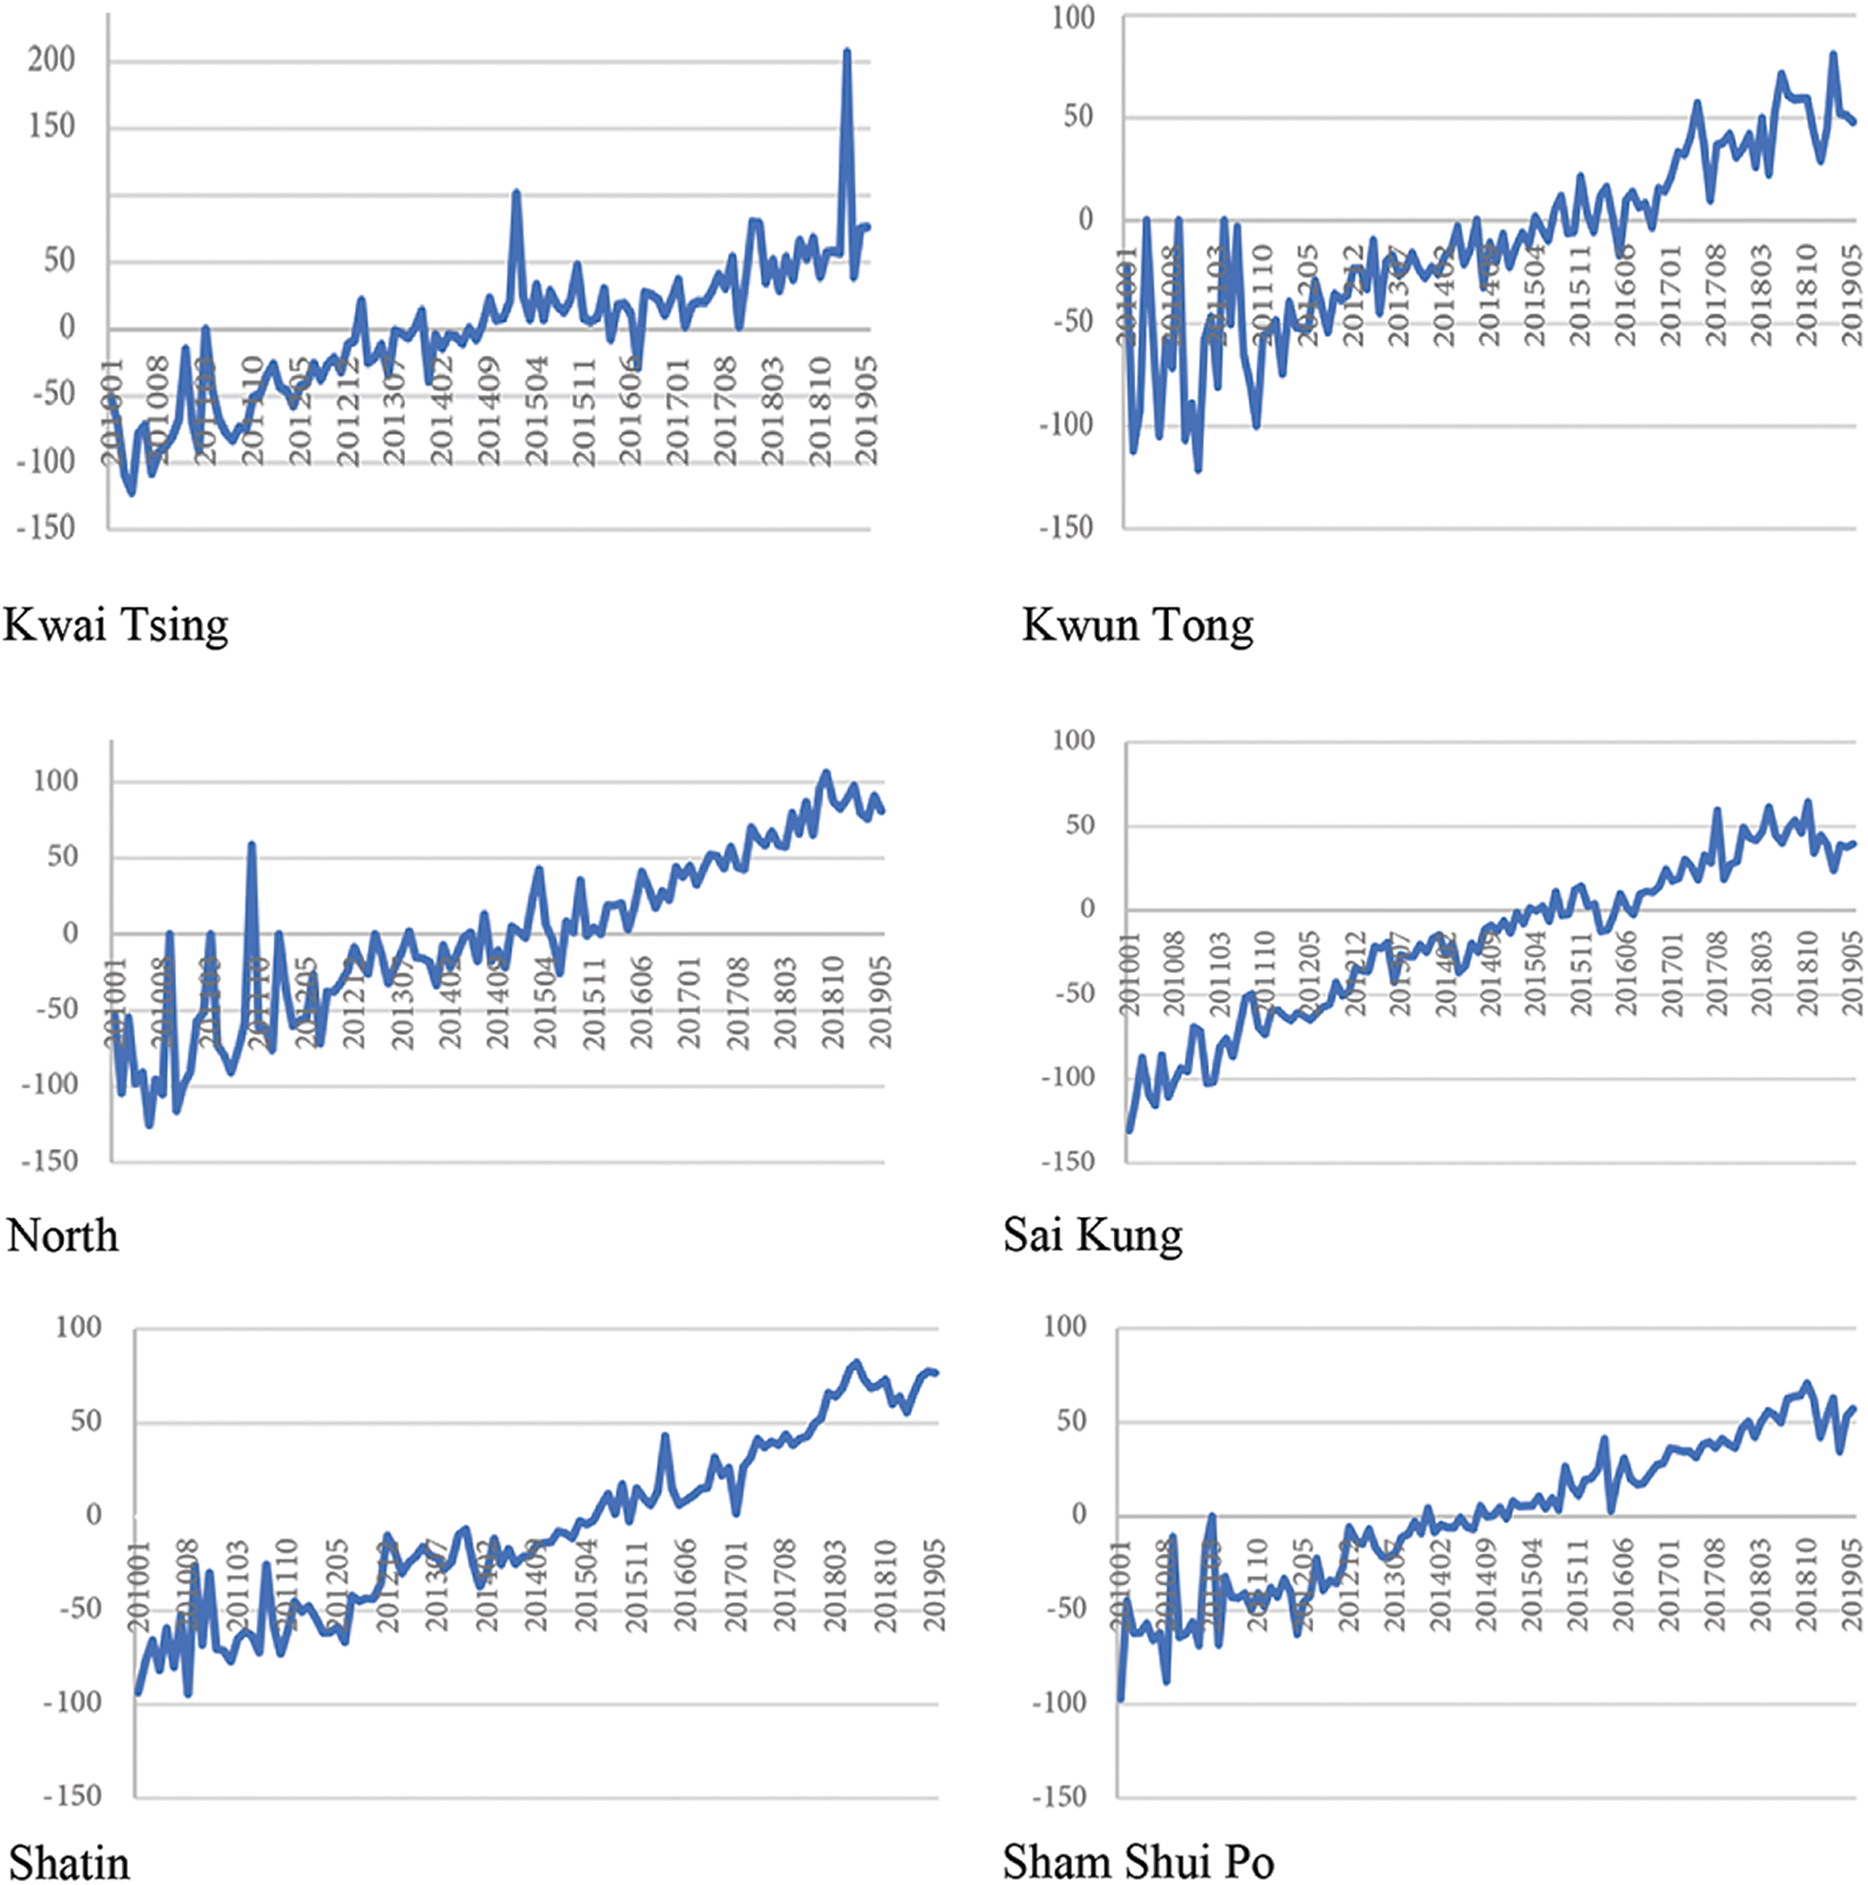


Figure 3: Repeat sales indices in 18 districts in Hong Kong and overall index for Hong Kong in general

Figure 4: 18 administrative regions in Hong Kong
2.5 Automatic Machine Learning (AutoML)
Today, the popularity of Web 2.0, such as Facebook and Linkedin [123] has increased data size substantially; big data, artificial intelligence, data mining, machine learning, pattern recognition, computational intelligence and other theories and technologies are applied in many aspects, such as:
1. image processing and classification: upsampling [124], facial recognition [125], crack detection [126];
2. Natural language processing: sentiment classification [127–129], land use classification [130], tokenisation [131], chatbots [132,133];
3. Numerical data handling and analysis: scheduling [134,135] and planning [136], data analytics [137,138], forecasting [139], and inventory management [140].
Prediction using artificial intelligence is a key area in modern real estate research, apart from the traditional econometrics models like the Autoregressive Moving Average model (ARMA) [141,142] and the Autoregressive Integrated Moving Average model (ARIMA) for real estate time series prediction, Li et al. [143] utilized State Space models for forecasting real estate stock prices. Various types of AI and machine learning models have been used for real estate asset price predictions in recent years. For example, Li et al. [144] applied a long short term memory (LSTM) and an artificial neural network [145] for housing price prediction, and a Group Method of Data Handling Neural Network for forecasting real estate investment trusts and stock indices [75].
Most AI and machine learning approaches need fine-tuning. Automated machine learning (AutoML) is a promising solution for building a deep learning system in the absence of human effort and has been applied in many different fields [146], such as finance [147] and ICU (intensive care unit) triage prediction [148]. The automated model selection method in AutoML includes feature engineering and neural architecture searching; AutoML streamlines the construction and application of machine learning models and significantly decreases the time, and improves the customized models’ accuracy by reducing human errors [149]. For example, Gerassis et al. [150] utilized AutoML to study the impacts of mining activity on deterioration in ecosystems, including the secondary industry pollution from natural slate manufacturing. Li et al. [151] utilized satellite data from 2014 to 2018 from the US Geological Survey as a proxy for the urban heat island effect. They then used that for conducting housing price prediction via AutoML.
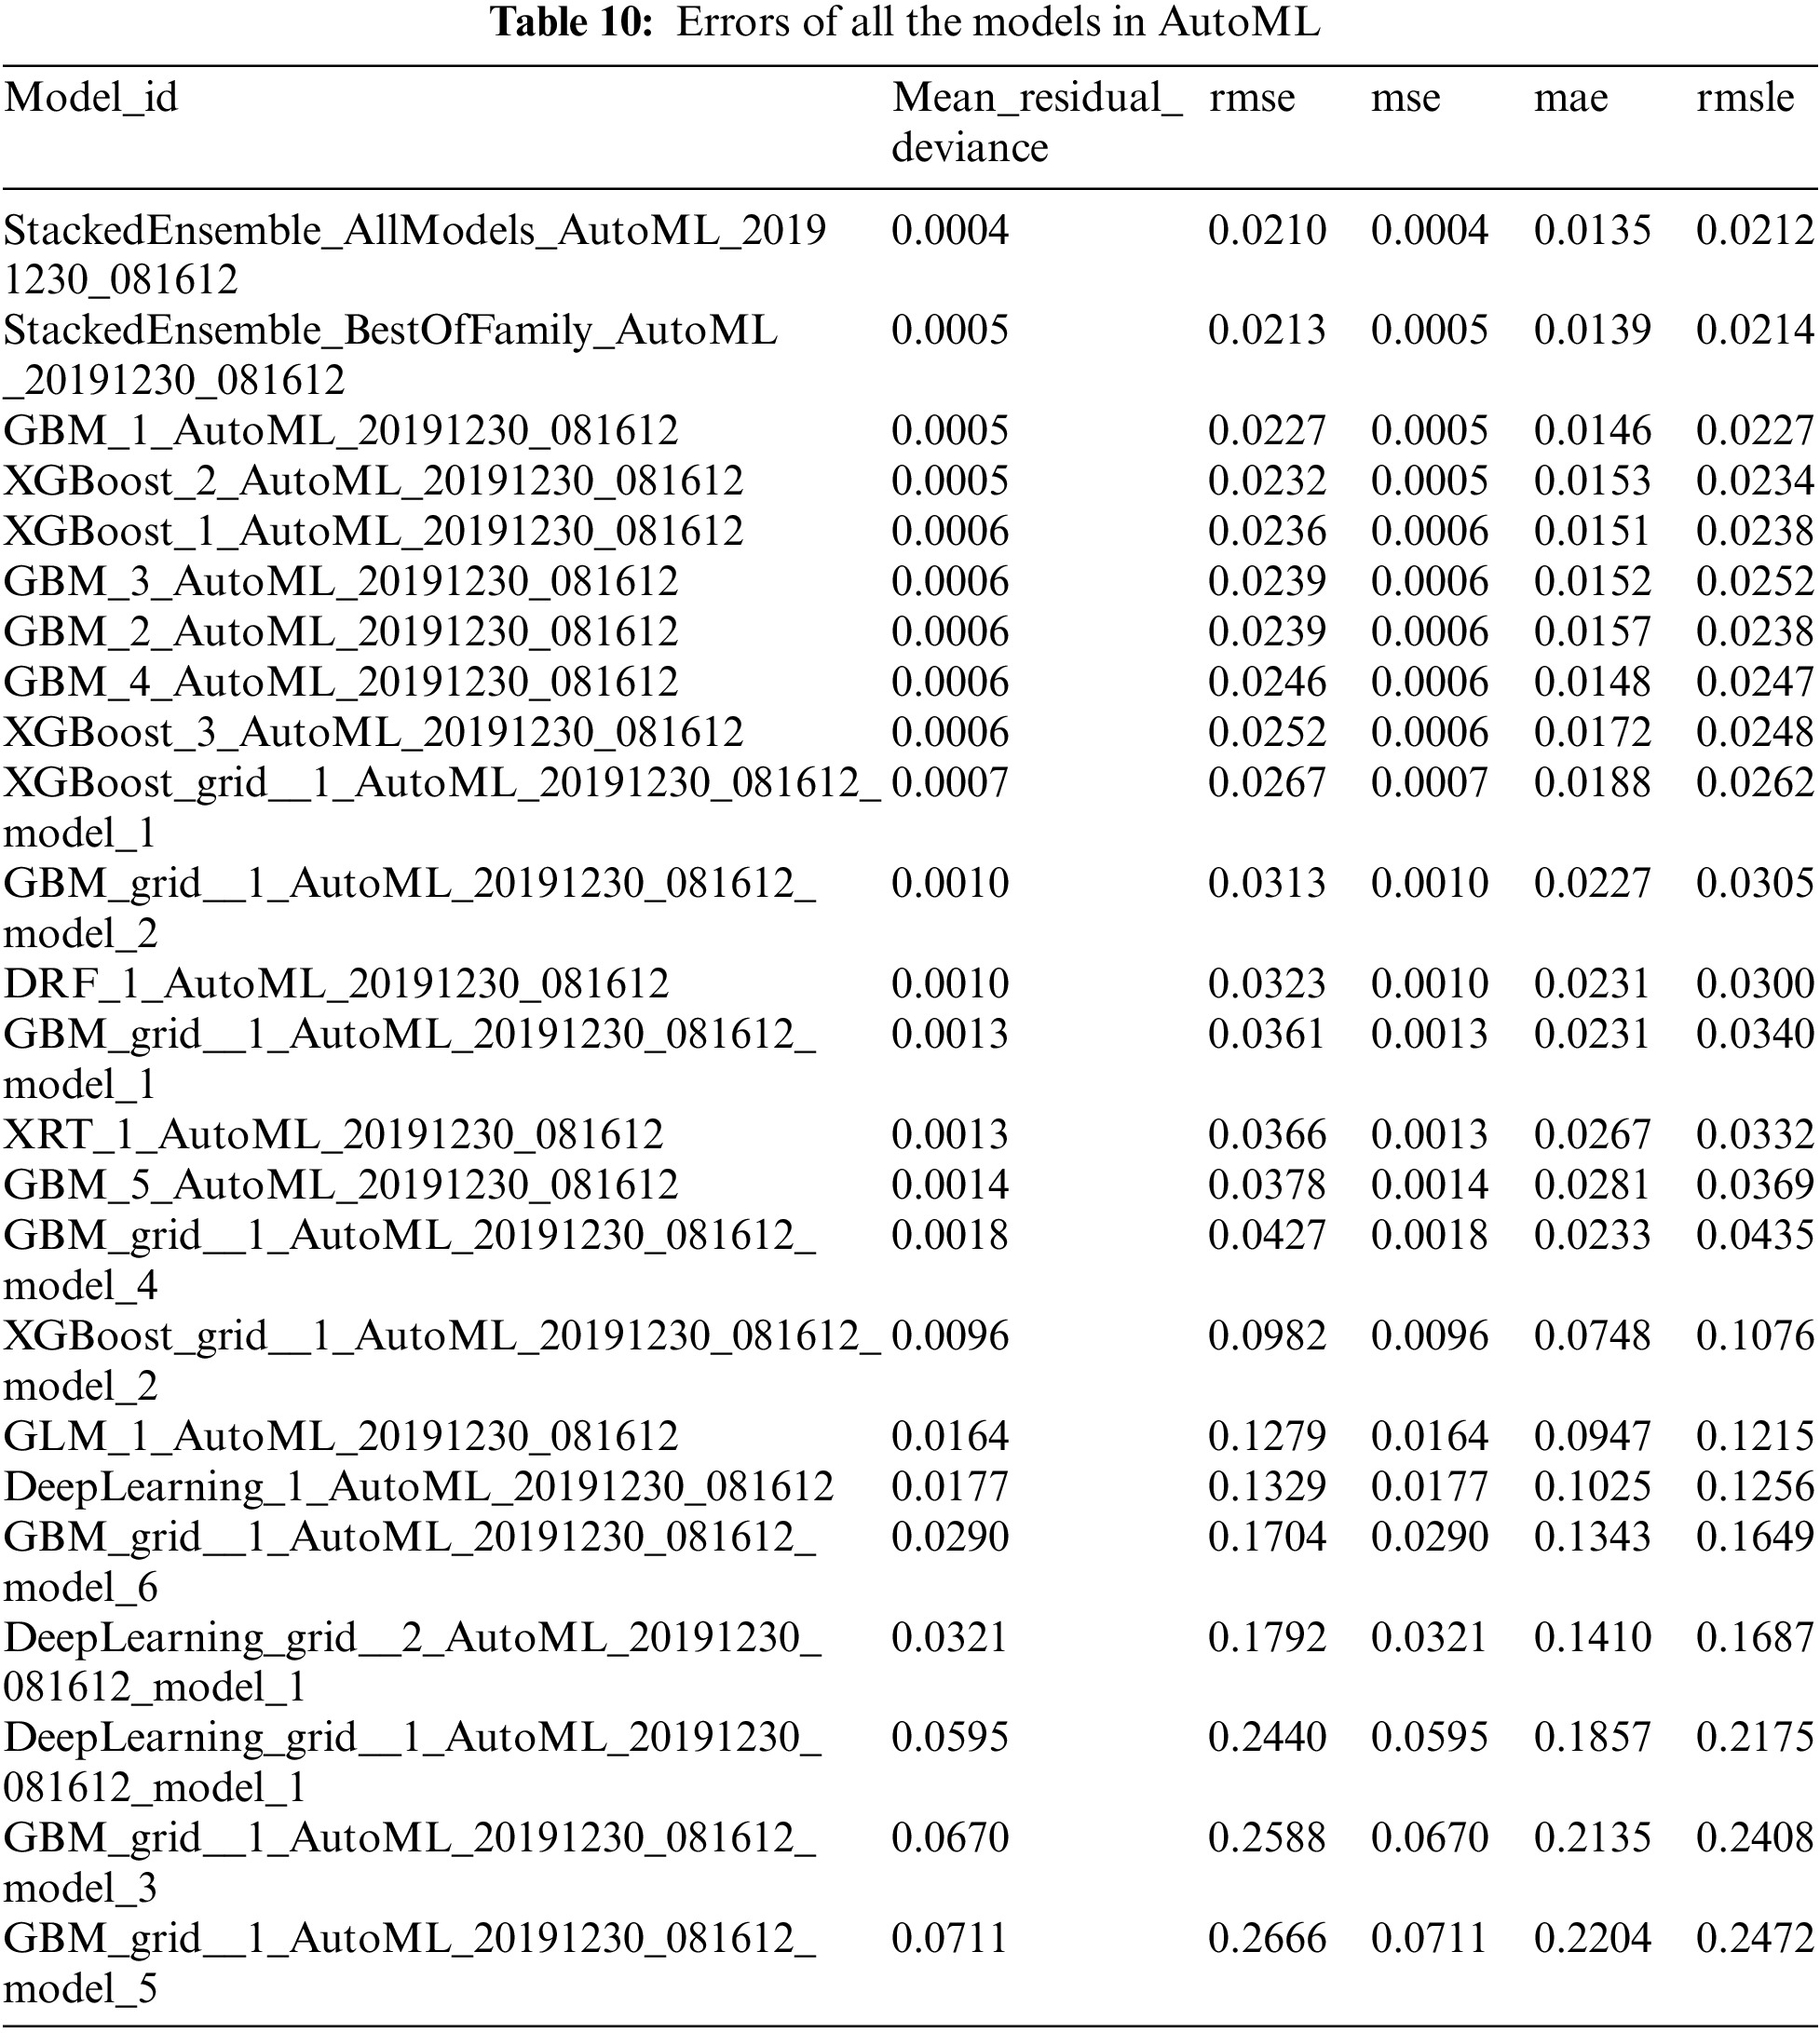
Our research used the Automatic Machine Learning (AutoML) model, utilizing automatic feature selection, feature transformation and automatic hyper-parameter tuning [152,153], model generation and model evaluation methods [146]. AutoML eases the application of machine learning [153], as it automatically streamlines the whole machine learning process from data loading, modelling and model picking. It ran through over 30 models and automatically picked the best model based on the lowest error values: mean residual deviance, root mean square error (rmse), mean squared error (mse), mean absolute error (mae), root mean squared logarithmic error (rmsle) (Table 10). For the best model, it ranked different variables’ relative importance as features based on a top-down approach (Table 11).
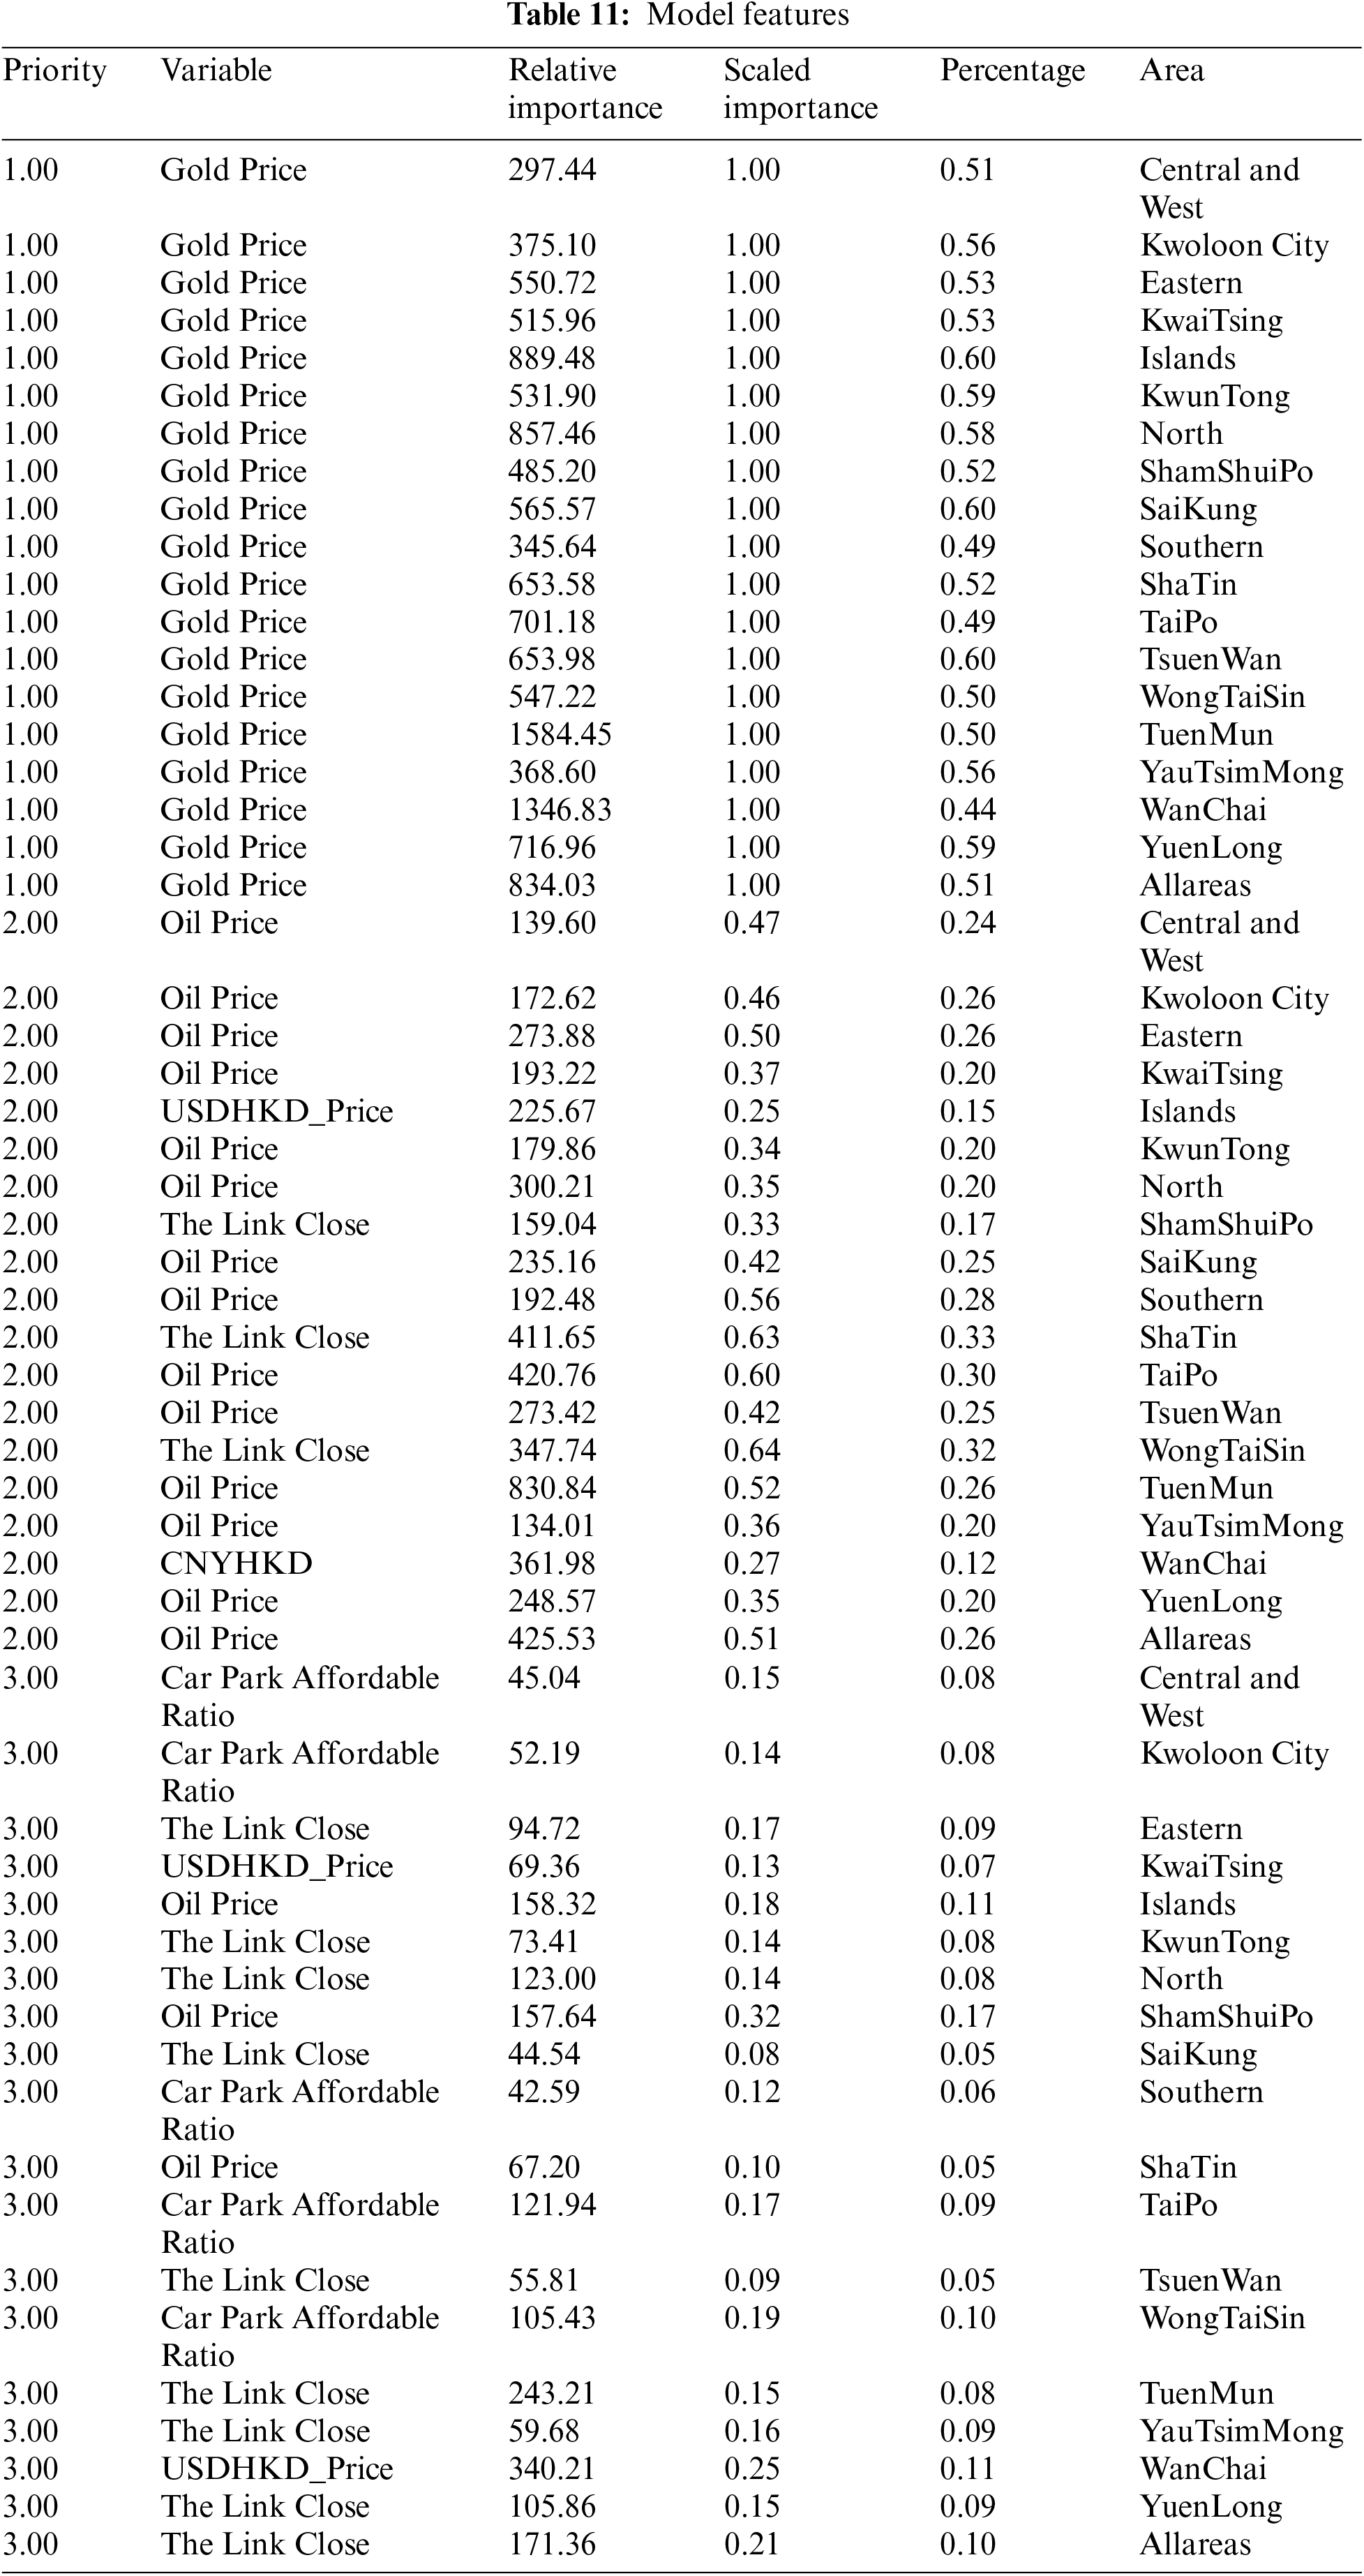
The same dataset was run with 18 districts (Fig. 3) to discover the features that drove the carpark price indices up and down most (Table 9). We included several variables which might correlate with carpark price as per other types of property markets in Hong Kong, such as housing (direct real estate) and real estate stock prices (indirect real estate): gold and oil price, Renminbi to Hong Kong dollars, US dollar to Hong Kong dollar, and the Link’s price. Gold has been considered an investment tool when many assets are risky, and oil price is related to the costs of using an automobile. When the cost of oil is high, demand for cars decreases so does the price of the carparks. As many property investors come from China, the carpark market is no exception. We speculated that, similar to other types of property in Hong Kong [143], rises and falls in Renminbi affect our carpark prices. Lastly, The Link is one most significant scale real estate investment trusts in Hong Kong and may be an indicator of the real estate market in Hong Kong.
The Gold Price ranked first in all 19 models; oil price was the second most important variable in 14 models. Interestingly, there are three districts (Shum Shui Po, Wong Tai Sin, Shatin) where the second important variable was the Link stock price. The Link has many carparks among the company’s assets, especially in the three districts mentioned. There were five districts (Central and West, Kowloon City, Southern, Taipo, Wong Tai Sin) in the carpark affordability ratio for the third important variable.
There has been researched on carparks’ impact on housing prices in the past. For example, a one-unit increase in carparks caused housing prices to drop from $95,928 to $59,569, and ppsf (price per square foot) decreased by $1.389658 [154]. However, no research has constructed the carpark price index via repeated sales methods, not to mention predicting the carpark price index via an AutoML approach. According to our big data and natural language processing results of articles published between 1910 to 2019, indexed in Google, most threw light on multi-storey carparks, management and ventilation systems, and reinforced concrete carparks. This study indicated that the second transactions of Wanchai's carpark price was about four times that of Yuen Long’s carpark price.
Our novel research suggests new ways for determining car park indices in urban areas. It is the first to construct carpark indices based on carparks with repeated sales from 1910 to 2019. It then used real estate indices and AutoML, a type of artificial intelligence method to predict carpark indices in the 18 regions of Hong Kong. This research showed the features that affected the carpark price AutoML prediction model most: gold price ranked the first in all 19 models; oil price or Link stock price second depending on district, and carpark affordability ratio third.
The results provide practical implications to allow us to know more about the price gap in carpark markets in Hong Kong. As most types of properties, that is, residential, offices, industrial buildings etc. have already constructed their indices by the Rating and Valuation Departments, with carparks as an exception. Our research will be helpful to the government when they formulate the carpark price indices and inform governments in other countries. It also fills the academic void of carpark price prediction via AutoML and contributes to academia.
Funding Statement: The authors received no specific funding for this study.
Conflicts of Interest: The authors declare that they have no conflicts of interest to report regarding the present study.
1When we used “carpark price” as the keyword, there were two results only which did not indicate research on carpark price prediction. In contrast, there were 999 results of carpark price (the quotation marks were removed), which consisted of far more irrelevant results due to different types of asset prices.
References
1. Beetham, I. F., Enoch, M. P., Tuuli, M. M., Davison, L. J. (2014). Stakeholder perspectives on the value of car parking. Urban, Planning and Transport Research, 2(1), 195–214. DOI 10.1080/21650020.2014.885385. [Google Scholar] [CrossRef]
2. Stolfi, D. H., Alba, E., Yao, X. (2019). Can I park in the city center? Predicting car park occupancy rates in smart cities. Journal of Urban Technology, 27(4), 27–41. DOI 10.1080/10630732.2019.1586223. [Google Scholar] [CrossRef]
3. Dogaroglu, B., Caliskanelli, S. P. (2020). Investigation of car park preference by intelligent system guidance. Research in Transportation Business & Management, 37(4), 100567. DOI 10.1016/j.rtbm.2020.100567. [Google Scholar] [CrossRef]
4. Pierce, G., Willson, H., Shoup, D. (2015). Optimizing the use of public garages: Pricing parking by demand. Transport Policy, 44(6), 89–95. DOI 10.1016/j.tranpol.2015.07.003. [Google Scholar] [CrossRef]
5. Millard-Ball, A. (2019). The autonomous vehicle parking problem. Transport Policy, 75, 99–108. DOI 10.1016/j.tranpol.2019.01.003. [Google Scholar] [CrossRef]
6. Morton, C., Caulfield, B., Anable, J. (2016). Customer perceptions of quality of service in public transport: Evidence for bus transit in Scotland. Case Studies on Transport Policy, 4(3), 199–207. DOI 10.1016/j.cstp.2016.03.002. [Google Scholar] [CrossRef]
7. Li, S., Zhao, P. (2017). Exploring car ownership and car use in neighborhoods near metro stations in Beijing: Does the neighborhood built environment matter? Transportation Research Part D: Transport and Environment, 56, 1–17. DOI 10.1016/j.trd.2017.07.016. [Google Scholar] [CrossRef]
8. Asensio, J. (2002). Transport mode choice by commuters to Barcelona’s CBD. Urban Studies, 39(10), 1881–1895. DOI 10.1080/0042098022000003000. [Google Scholar] [CrossRef]
9. Islam, S. T., Liu, Z., Sarvi, M., Zhu, T. (2015). Exploring the mode change behavior of park-and-ride users. Mathematical Problems in Engineering, 2015, 1–8. DOI 10.1155/2015/282750. [Google Scholar] [CrossRef]
10. Li, R. Y. M. (2014). Transaction costs, firms’ growth and oligopoly: Case studies in Hong Kong real estate agencies’ branch locations. Asian Social Science, 10(6), 40–52. DOI 10.5539/ass.v10n6p40. [Google Scholar] [CrossRef]
11. Han, Y., Shan, J., Wang, M., Yang, G. (2017). Optimization design and evaluation of parking route based on automatic assignment mechanism of parking lot. Advances in Mechanical Engineering, 9(7), 168781401771241. DOI 10.1177/1687814017712416. [Google Scholar] [CrossRef]
12. Chen, B., Liu, R., Chen, Y., Liu, J., Liu, D. (2015). WiFi fingerprint based self-adaptive indoor localization in the dynamic environment. Chinese Journal of Sensors and Actuators, 28(5), 729–738. DOI 10.3969/j.issn.1004-1699.2015.05.020. [Google Scholar] [CrossRef]
13. Singh, R., Dutta, C., Singhal, N., Choudhury, T. (2020). An improved vehicle parking mechanism to reduce parking space searching time using firefly algorithm and feed forward back propagation method. Procedia Computer Science, 167(12), 952–961. DOI 10.1016/j.procs.2020.03.394. [Google Scholar] [CrossRef]
14. Ma, R., Lam, P. T. I., Leung, C. K. (2018). Potential pitfalls of smart city development: A study on parking mobile applications (apps) in Hong Kong. Telematics and Informatics, 35(6), 1580–1592. DOI 10.1016/j.tele.2018.04.004. [Google Scholar] [CrossRef]
15. Marć, M., Śmiełowska, M., Zabiegała, B. (2016). Concentrations of monoaromatic hydrocarbons in the air of the underground car park and individual garages attached to residential buildings. Science of the Total Environment, 573, 767–777. DOI 10.1016/j.scitotenv.2016.08.173. [Google Scholar] [CrossRef]
16. Zhang, M., Kang, J., Tang, R., Xu, F., Fan, Y. et al. (2020). Sharing car park system for parking units of multiple EVs in a power market. Energy, 212(9), 118489. DOI 10.1016/j.energy.2020.118489. [Google Scholar] [CrossRef]
17. Transport Department the Goverment of Hong Kong Special Administration Region, Carparks. https://www.td.gov.hk/en/transport_in_hong_kong/parking/carparks/index.html. [Google Scholar]
18. Estate Agents Authority. Monograph: Conveyancing. https://www.eaa.org.hk/en-us/Information-Centre/Publications/Monograph-Conveyancing. [Google Scholar]
19. Rating and Valuating Department of the Government of the Hong Kong Spercial Administrative Region (2021). Property Rates in Hong Kong: Assessment, Collection and Administration. https://www.rvd.gov.hk/doc/en/property_rates.pdf. [Google Scholar]
20. Pulikowski, A., Matysek, A. (2021). Searching for LIS scholarly publications: A comparison of search results from Google, Google Scholar, EDS, and LISA. The Journal of Academic Librarianship, 47(5), 102417. DOI 10.1016/j.acalib.2021.102417. [Google Scholar] [CrossRef]
21. Martín-Martín, A., Orduna-Malea, E., Thelwall, M., Delgado López-Cózar, E. (2018). Google Scholar, Web of Science, and Scopus: A systematic comparison of citations in 252 subject categories. Journal of Informetrics, 12(4), 1160–1177. DOI 10.1016/j.joi.2018.09.002. [Google Scholar] [CrossRef]
22. Chen, B., Liu, R., Chen, Y., Liu, J., Liu, D. (2015). WiFi fingerprint based self-adaptive indoor localization in the dynamic environment. Chinese Journal of Sensors and Actuators, 28(5), 729–738. DOI 10.3969/j.issn.1004-1699.2015.05.020. [Google Scholar] [CrossRef]
23. Jozaghi, E. (2019). A new innovative method to measure the demographic representation of scientists via Google Scholar. Methodological Innovations, 12(3), 205979911988427. DOI 10.1177/2059799119884273. [Google Scholar] [CrossRef]
24. Li, R. Y. M. (2015). Construction safety and waste management: An economic analysis. Singapore: Springer. [Google Scholar]
25. Bajwa, I. S., Samad, A., Mumtaz, S. (2009). Object oriented software modeling using NLP based knowledge extraction. European Journal of Scientific Research, 35(1), 22–33. [Google Scholar]
26. Tang, V., Yuan, Z., Cao, J. (2006). An intelligent car park management system based on wireless sensor networks. IEEE Pervasive Computing and Applications, 2006 1st International Symposium, pp. 65–70, Urumqi. [Google Scholar]
27. Burland, J. B., Hancock, R. J. R. (1997). Underground car park at the house of commons: Geotechnical aspects. Structural Engineer, 55(2), 87–100. [Google Scholar]
28. Parkhurst, G. (2000). Influence of bus-based park and ride facilities on users’ car traffic. Transport Policy, 7(2), 159–172. DOI 10.1016/S0967-070X(00)00006-8. [Google Scholar] [CrossRef]
29. Connell, J., Page, S. J. (2008). Exploring the spatial patterns of car-based tourist travel in Loch Lomond and Trossachs National Park, Scotland. Tourism Management, 29(3), 561–580. DOI 10.1016/j.tourman.2007.03.019. [Google Scholar] [CrossRef]
30. Parkhurst, G. (1997). Park and ride: Could it lead to an increase in car traffic? Transport Policy, 2(1), 15–23. DOI 10.1016/0967-070X(95)93242-Q. [Google Scholar] [CrossRef]
31. Tan, M., Mohamed, A., Mohammed, O. (2014). Optimal of plug-in electric vehicles for a car-park infrastructure. IEEE Industry Applications Society Meeting, 50(4), 2323–2330. DOI 10.1109/spca.2006.297498. [Google Scholar] [CrossRef]
32. Benson, J. P., O’Donovan, T., O’Sullivan, P., Roedig, U., O’Flynn, B. (2006). Car-park management using wireless sensor networks. LCN 2006, The 31st Annual IEEE Conference on Local Computer Networks, pp. 588–595. Tampa, Florida, USA [Google Scholar]
33. Bong, D., Ting, K. C., Lai, K. C. (2008). Integrated approach in the design of car park occupancy information system (coins). IAENG International Journal of Computer Science, 35(1), 1–8. [Google Scholar]
34. Blockley, K., Blockley, M., Blockley, P., Frere, S., Stow, S. (1997). Excavations in the Marlowe car park and surrounding areas. Britannia, 28, 491–492. DOI 10.2307/526789. [Google Scholar] [CrossRef]
35. Pinto, A. C., Baddeley, A. D. (1991). Where did you park your car? Analysis of a naturalistic long-term recency effect. European Journal of Cognitive Psychology, 3(3), 297–313. DOI 10.1080/09541449108406231. [Google Scholar] [CrossRef]
36. Buckley, R., Morris, M., Appleby, J., King, T., O'Sullivan, D. et al. (2013). The king in the car park’: New light on the death and burial of Richard III in the Grey Friars Church, Leicester, in 1485. Antiquity, 87(336), 519–538. DOI 10.1017/S0003598X00049103. [Google Scholar] [CrossRef]
37. Zhang, X. G., Guo, Y. C., Chan, C. K., Lin, W. Y. (2007). Numerical simulations on fire spread and smoke movement in an underground car park. Building & Environment, 42(10), 3466–3475. DOI 10.1016/j.buildenv.2006.11.002. [Google Scholar] [CrossRef]
38. Kim, K. J., Han, I. (2000). Genetic algorithms approach to feature discretization in artificial neural networks for the prediction of stock price index. Expert Systems with Applications, 19(2), 125–132. DOI 10.1016/S0957-4174(00)00027-0. [Google Scholar] [CrossRef]
39. Lynch, A. W., Mendenhall, R. R. (1997). New evidence on stock price effects associated with changes in the S&P 500 Index. The Journal of Business, 70(3), 351–383. DOI 10.1086/209722. [Google Scholar] [CrossRef]
40. Chen, H., Singal, N. V. (2004). The price response to S&P 500 index additions and deletions: Evidence of asymmetry and a new explanation. The Journal of Finance, 59(4), 1901–1929. DOI 10.1111/j.1540-6261.2004.00683.x. [Google Scholar] [CrossRef]
41. Hasbrouck, J. (2003). Intraday Price formation in US Equity Index Markets. The Journal of Finance, 58(6), 2375–2399. DOI 10.1046/j.1540-6261.2003.00609.x. [Google Scholar] [CrossRef]
42. Holmes, A. P. (1995). Futures trading, information and spot price volatility: Evidence for the FTSE-100 stock index futures contract using GARCH. Journal of Banking & Finance, 19(1), 117–129. DOI 10.1016/0378-4266(94)00059-c. [Google Scholar] [CrossRef]
43. Boskin, M. J., Dulberger, E. R., Gordon, R. J., Griliches, Z., Jorgenson, D. W. (1998). Consumer prices, the consumer price index and the cost of living. Journal of Economic Perspectives, 12(1), 3–26. DOI 10.1257/jep.12.1.3. [Google Scholar] [CrossRef]
44. Kara Y., Acar Boyacioglu M., Baykan Ömer, K. (2011). Predicting direction of stock price index movement using artificial neural networks and support vector machines: the sample of the Istanbul stock exchange. Expert Systems with Applications, 38(5), 5311–5319. DOI 10.1016/j.eswa.2010.10.027. [Google Scholar] [CrossRef]
45. Choi, J. J., Laibson, D., Madrian, B. C. (2010). Why does the law of one price fail? An experiment on index mutual funds. The Review of Financial Studies, 23(4), 1405–1432. DOI 10.1093/rfs/hhp097. [Google Scholar] [CrossRef]
46. Can, A. S., Megbolugbe, I. (1997). Spatial dependence and house price index construction. Journal of Real Estate Finance & Economics, 14(1–2), 203–222. DOI 10.1023/A:1007744706720. [Google Scholar] [CrossRef]
47. Wahab, M., Lashgari, M. (1993). Price dynamics and error correction in stock index and stock index futures markets: A cointegration approach. Journal of Futures Markets, 13, 711–742. DOI 10.1002/(ISSN)1096-9934. [Google Scholar] [CrossRef]
48. Tse, Y. (1999). Price discovery and volatility spillovers in the Djia index and futures markets. Journal of Futures Markets, 19(8), 911–930. DOI 10.1002/(ISSN)1096-9934. [Google Scholar] [CrossRef]
49. Booth, G. G., So, R. W., Tse, Y. (1999). Price discovery in the German equity index derivatives markets. Journal of Futures Markets, 19, 619–643. DOI 10.1002/(ISSN)1096-9934. [Google Scholar] [CrossRef]
50. Meen, G. (2002). The time-series behavior of house prices: A transatlantic divide? Journal of Housing Economics, 11(1), 1–23. DOI 10.1006/jhec.2001.0307. [Google Scholar] [CrossRef]
51. Sousa, R. M. (2014). Wealth, asset portfolio, money demand and policy rule. Bulletin of Economic Research, 66(1), 95–111. DOI 10.1111/j.1467-8586.2011.00431.x. [Google Scholar] [CrossRef]
52. Han, L. (2010). The effects of price risk on housing demand: Empirical evidence from US markets. Review of Financial Studies, 23(11), 3889–3928. DOI 10.1093/rfs/hhq088. [Google Scholar] [CrossRef]
53. Geltner, D. (2015). Real estate price indices and price dynamics: An overview from an investments perspective. Annual Review of Financial Economics, 7(1), 615–633. DOI 10.1146/annurev-financial-111914-041850. [Google Scholar] [CrossRef]
54. Zhang, L., Yi, Y. (2017). Quantile house price indices in Beijing. Regional Science and Urban Economics, 63, 85–96. DOI 10.1016/j.regsciurbeco.2017.01.002. [Google Scholar] [CrossRef]
55. Englund, P. (2010). Trading on home price risk: Index derivatives and home equity insurance. The Blackwell companion to the economics of housing. In: Smith, S., Searle, B. A., Eds., Blackwell (Eds.Blackwell companions to contemporary economics, vol. 19, pp. 499–511, Chichester: Wiley-Blackwell. [Google Scholar]
56. Ioannides, Y. M., Zabel, J. E. (2008). Interactions, neighborhood selection and housing demand. Journal of Urban Economics, 63(1), 229–252. DOI 10.1016/j.jue.2007.01.010. [Google Scholar] [CrossRef]
57. Ball, M., Meen, G., Nygaard, C. (2010). Housing supply price elasticities revisited: Evidence from international, national, local and company data. Journal of Housing Economics, 19(4), 255–268. DOI 10.1016/j.jhe.2010.09.004. [Google Scholar] [CrossRef]
58. Owusu-Ansah, A. (2018). Construction and application of property price indices. London, New York: Routledge. [Google Scholar]
59. Wu, J., Deng, Y., Liu, H. (2014). House price index construction in the Nascent Housing Market: The case of China. The Journal of Real Estate Finance and Economics, 48(3), 522–545. DOI 10.1007/s11146-013-9416-1. [Google Scholar] [CrossRef]
60. Fisher, J., Geltner, D., Pollakowski, H. (2007). A quarterly transactions-based index of institutional real estate investment performance and movements in supply and demand. The Journal of Real Estate Finance and Economics, 34(1), 5–33. DOI 10.1007/s11146-007-9001-6. [Google Scholar] [CrossRef]
61. Seiler, M. J., Lee, S. T., Seiler, V. L. (2003). International unsecuritized real estate: A comparison between NCREIF (US) and MTB-IKOMA (Japan). Property Management, 21(1), 63–81. DOI 10.1108/02637470310464481. [Google Scholar] [CrossRef]
62. Fisher, J. D., Rutledge, S. R. (2021). The impact of Hurricanes on the value of commercial real estate. Business Economics, 56(3), 129–145. DOI 10.1057/s11369-021-00212-9. [Google Scholar] [CrossRef]
63. Su, Z., Taltavull, P. (2021). Applying the Fama and French three-factor model to analyze risk/reward in the Spanish REITs: An ARDL approach. Journal of European Real Estate Research, 14(2), 189–208. DOI 10.1108/JERER-11-2019-0043. [Google Scholar] [CrossRef]
64. Lizieri, C. (2018). Property ownership, leasehold forms and industrial change. In: Industrial property, pp. 181–194. London, New York: Routledge. [Google Scholar]
65. Fraser, W. (1993). Principles of property investment and pricing. London: Red Globe Press London. [Google Scholar]
66. Patel, K., Sing, T. F. (2000). Implied volatility in the UK commercial property market: Empirical evidence based on transaction data. The Journal of Real Estate Finance and Economics, 20(1), 5–24. DOI 10.1023/A:1007824720502. [Google Scholar] [CrossRef]
67. Jim, C. (1996). Market fundamentals, risk and the Canadian property cycle: implications for property valuation and investment decisions. Journal of Real Estate Research, 12(2), 347–367. DOI 10.1080/10835547.1996.12090861. [Google Scholar] [CrossRef]
68. Sirmans, C. F., Worzala, E. (2003). International direct real estate investment: A review of the literature. Urban Studies, 40(5–6), 1081–1114. DOI 10.1080/0042098032000074335. [Google Scholar] [CrossRef]
69. Lausberg, C., Lee, S., Müller, M., Oertel, C., Schultheiß, T. (2020). Risk measures for direct real estate investments with non-normal or unknown return distributions. Zeitschrift für Immobilienökonomie, 6(1), 3–27. DOI 10.1365/s41056-019-00028-x. [Google Scholar] [CrossRef]
70. Kurzrock, B. M. (2015). Einflussfaktoren auf die performance von immobilien-direktanlagen. Germany: Springer Gabler Wiesbaden. [Google Scholar]
71. Newell, G., Chau, K. W. (1996). Linkages between direct and indirect property performance in Hong Kong. Journal of Property Finance, 7(4), 9–29. DOI 10.1108/09588689610152363. [Google Scholar] [CrossRef]
72. Ekemode, B. G., Olaleye, A. (2016). Convergence between direct and indirect real estate investments. Journal of Financial Management of Property and Construction, 21(3), 212–230. DOI 10.1108/JFMPC-12-2015-0040. [Google Scholar] [CrossRef]
73. Kutlu, V. (2010). The long term relation between indirect and direct real estate. In: Network for studies on pensions, aging and retirement, pp. 1–50. Tilburg: Tilburg University. [Google Scholar]
74. Chau, K., Wong, S. K., Yiu, C. (2014). International real estate markets. Public Real Estate Markets and Investments, 37, 37–58. DOI 10.1093/acprof:oso/9780199993277.001.0001. [Google Scholar] [CrossRef]
75. Li, R. Y. M., Fong, S., Chong, K. W. S. (2017). Forecasting the REITs and stock indices: Group method of data handling neural network approach. Pacific Rim Property Research Journal, 23(2), 123–160. DOI 10.1080/14445921.2016.1225149. [Google Scholar] [CrossRef]
76. Mandaci, P. E., Aktan, B., Cagli, E. Ç. (2014). Co-movements of REIT indices with structural changes before and during the subprime mortgage crisis: evidence from Euro-Med markets. International Journal of Strategic Property Management, 18(1), 1–10. DOI 10.3846/1648715X.2013.849302. [Google Scholar] [CrossRef]
77. Kandlbinder, K., Dietzel, M. A. (2019). Intraday online information demand and its relationship to REIT prices. Journal of Real Estate Portfolio Management, 25(2), 113–127. DOI 10.1080/10835547.2020.1791643. [Google Scholar] [CrossRef]
78. Feng, Z., Ghosh, C., Sirmans, C. (2006). Changes in REIT stock prices, trading volume and institutional ownership resulting from S&P REIT index changes. Journal of Real Estate Portfolio Management, 12(1), 59–71. DOI 10.1080/10835547.2006.12089733. [Google Scholar] [CrossRef]
79. Wechsler, S. A. (2013). The role of REITs in strategic investment portfolios. In: Real estate investment trusts in Europe, pp. 43–52. Berlin Heidelberg: Springer-Verlag. [Google Scholar]
80. Kauškale, L., Geipele, I. (2019). Integration opportunities of stability-oriented processes for real estate transaction entities. In: Entrepreneurial complexity, pp. 109–116. Boca Raton: CRC Press. [Google Scholar]
81. Andrew, M., Glenn, M. (2003). Public and private real estate in a mixed-asset portfolio. Journal of Real Estate Portfolio Management, 9(3), 193–203. DOI 10.1080/10835547.2003.12089684. [Google Scholar] [CrossRef]
82. Packer, F., Riddiough, T., Shek, J. (2014). A global tour of commercial property and REIT markets. International Real Estate Review, 17(2), 241–274. DOI 10.53383/100186. [Google Scholar] [CrossRef]
83. Huerta-Sanchez, D., Escobari, D. (2018). Changes in sentiment on REIT industry excess returns and volatility. Financial Markets Portfolio Management, 32(3), 239–274. DOI 10.1007/s11408-018-0312-9. [Google Scholar] [CrossRef]
84. Joseph, O., Graeme, N., Tien-Foo, S. (2006). The growth of REIT markets in Asia. Journal of Real Estate Literature, 14(2), 203–222. DOI 10.1080/10835547.2006.12090182. [Google Scholar] [CrossRef]
85. Sotelo, R., McGreal, S. (2016). Real estate investment trusts in Europe. Switzerland: Springer. [Google Scholar]
86. Case, K. E. (2007). Land prices and house prices in the United States. In: Housing markets in the United States and Japan, pp. 29–48. Chicago: University of Chicago Press. [Google Scholar]
87. Guo, X., Zheng, S., Geltner, D., Liu, H. (2014). A new approach for constructing home price indices: The pseudo repeat sales model and its application in China. Journal of Housing Economics, 25, 20–38. DOI 10.1016/j.jhe.2014.01.005. [Google Scholar] [CrossRef]
88. Bollerslev, T., Patton, A. J., Wang, W. (2015). Daily house price indices: Construction, modeling, and longer-run predictions. Journal of Applied Econometrics, 31(6), 1005–1025. DOI 10.1002/jae.2471. [Google Scholar] [CrossRef]
89. Elder, J., Villupuram, S. (2012). Persistence in the return and volatility of home price indices. Applied Financial Economics, 22(22), 1855–1868. DOI 10.1080/09603107.2012.687095. [Google Scholar] [CrossRef]
90. Schindler, F. (2013). Predictability and persistence of the price movements of the S&P/Case-Shiller house price indices. The Journal of Real Estate Finance and Economics, 46(1), 44–90. DOI 10.1007/s11146-011-9316-1. [Google Scholar] [CrossRef]
91. Cook, S., Watson, D. (2016). A new perspective on the ripple effect in the UK housing market: Comovement, cyclical subsamples and alternative indices. Urban Studies, 53(14), 3048–3062. DOI 10.1177/0042098015610482. [Google Scholar] [CrossRef]
92. Elbourne, A. (2008). The UK housing market and the monetary policy transmission mechanism: An SVAR approach. Journal of Housing Economics, 17(1), 65–87. DOI 10.1016/j.jhe.2007.09.002. [Google Scholar] [CrossRef]
93. Crosby, N., McAllister, P., Wyatt, P. (2013). Fit for planning? An evaluation of the application of development viability appraisal models in the UK planning system. Environment and Planning B: Planning and Design, 40(1), 3–22. DOI 10.1068/b37181. [Google Scholar] [CrossRef]
94. Jones, C. (2016). The credit crunch: short-term UK housing market correction or long-term tipping point? International Journal of Housing Policy, 16(1), 70–90. DOI 10.1080/14616718.2015.1067971. [Google Scholar] [CrossRef]
95. Chamberlin, G. (2009). Recent developments in the UK housing market. Economic & Labour Market Review, 3(8), 29–38. DOI 10.1057/elmr.2009.141. [Google Scholar] [CrossRef]
96. Wilhelmsson, M. (2009). Construction and updating of property price index series: The case of segmented markets in Stockholm. Property Management, 27(2), 119–137. DOI 10.1108/02637470910946426. [Google Scholar] [CrossRef]
97. Hjalmarsson, E., Österholm, P. (2020). Heterogeneity in households’ expectations of housing prices-evidence from micro data. Journal of Housing Economics, 50, 101731. DOI 10.1016/j.jhe.2020.101731. [Google Scholar] [CrossRef]
98. Bourassa, S. C., Hoesli, M., Sun, J. (2006). A simple alternative house price index method. Journal of Housing Economics, 15(1), 80–97. DOI 10.1016/j.jhe.2006.03.001. [Google Scholar] [CrossRef]
99. Diewert, W. E., Shimizu, C. (2016). Hedonic regression models for Tokyo condominium sales. Regional Science and Urban Economics, 60(2), 300–315. DOI 10.1016/j.regsciurbeco.2016.08.002. [Google Scholar] [CrossRef]
100. Zabel, J. (2015). The hedonic model and the housing cycle. Regional Science and Urban Economics, 54(4), 74–86. DOI 10.1016/j.regsciurbeco.2015.07.005. [Google Scholar] [CrossRef]
101. Francke, M. K. (2010). Repeat sales index for thin markets. The Journal of Real Estate Finance and Economics, 41(1), 24–52. DOI 10.1007/s11146-009-9203-1. [Google Scholar] [CrossRef]
102. Leishman, C., Watkins, C. (2017). Assessing the spatial impact of policy interventions on real-estate values: An exemplar of the use of the hybrid hedonic/repeat-sales method. Regional Studies, Regional Science, 4(1), 202–217. DOI 10.1080/21681376.2017.1360790. [Google Scholar] [CrossRef]
103. Case, B., Quigley, J. M. (1991). The dynamics of real estate prices. The Review of Economics and Statistics, 73(1), 50–58. DOI 10.2307/2109686. [Google Scholar] [CrossRef]
104. Silverstein, J. M. (2014). House price indexes: Methodology and revisions. Research Rap Special Report, pp. 1–14. [Google Scholar]
105. Wang, F., Zheng, X. (2018). The comparison of the hedonic, repeat sales, and hybrid models: Evidence from the Chinese paintings market. Cogent Economics & Finance, 6(1), 1443372. DOI 10.1080/23322039.2018.1443372. [Google Scholar] [CrossRef]
106. Grimes, A., Young, C. (2010). A simple repeat sales house price index: comparative properties under alternative data generation processes. Motu Working Paper, pp. 1–22. [Google Scholar]
107. Clapp, J. M., Lu-Andrews, R., Zhou, T. (2018). Controlling unobserved heterogeneity in repeat sales models: Application to the disposition effect in housing. SSRN Electronic Journal, 1–45. DOI 10.2139/ssrn.3146943. [Google Scholar] [CrossRef]
108. Wong, S. K., Chau, K. W., Karato, K., Shimizu, C. (2017). Separating the age effect from a Repeat Sales Index: Land and structure decomposition. The Journal of Real Estate Finance and Economics, 57(3), 351–366. DOI 10.1007/s11146-017-9631-2. [Google Scholar] [CrossRef]
109. Owusu-Ansah, A., Abdulai, R. T. (2014). Producing hedonic price indices for developing markets: Explicit time variable versus strictly cross-sectional models. International Journal of Housing Markets and Analysis, 7(4), 444–458. DOI 10.1108/IJHMA-08-2013-0047. [Google Scholar] [CrossRef]
110. Tiwari, P., Hasegawa, H. (2000). House price dynamics in Mumbai, 1989--1995. Review of Urban & Regional Development Studies, 12(2), 150–163. DOI 10.1111/1467-940X.00027. [Google Scholar] [CrossRef]
111. Owusu-Ansah, A., Adolwine, W. M., Yeboah, E. (2017). Construction of real estate price indices for developing housing markets: Does temporal aggregation matter? International Journal of Housing Markets and Analysis, 10(3), 371–383. DOI 10.1108/IJHMA-06-2016-0047. [Google Scholar] [CrossRef]
112. Gatzlaff, D. H., Ling, D. C. (1994). Measuring changes in local house prices: An empirical investigation of alternative methodologies. Journal of Urban Economics, 35(2), 221–244. DOI 10.1006/juec.1994.1014. [Google Scholar] [CrossRef]
113. Goh, Y. M., Costello, G., Schwann, G. (2012). Accuracy and robustness of house price index methods. Housing Studies, 27(5), 643–666. DOI 10.1080/02673037.2012.697551. [Google Scholar] [CrossRef]
114. Owusu-Ansah, A. (2013). Construction of property price indices: Temporal aggregation and accuracy of various index methods. Property Management, 31(2), 115–131. DOI 10.1108/02637471311309427. [Google Scholar] [CrossRef]
115. Grimes, A., Sorensen, K., Young, C. (2021). Repeat sales house price indices: Comparative properties under alternative data generation processes. New Zealand Economic Papers, 55(3), 7–18. DOI 10.1080/00779954.2019.1612937. [Google Scholar] [CrossRef]
116. Singh, A. (2019). An application of repeat sales regression to distressed lodging prices. International Journal of Hospitality Management, 85(3), 102364. DOI 10.1016/j.ijhm.2019.102364. [Google Scholar] [CrossRef]
117. Hargreaves, B., Chen, M. (2001). A comparison of residential rental indices. Pacific Rim Property Research Journal, 7(1), 35–46. DOI 10.1080/14445921.2001.11104093. [Google Scholar] [CrossRef]
118. Leishman, C., Watkins, C. (2013). Estimating local repeat sales house price indices for British cities. Journal of Property Investment & Finance, 20(1), 36–58. DOI 10.1108/14635780210416255. [Google Scholar] [CrossRef]
119. Englund, P., Quigley, J. M., Redfearn, C. L. (1999). The choice of methodology for computing housing price indexes: Comparisons of temporal aggregation and sample definition. The Journal of Real Estate Finance and Economics, 19(2), 91–112. DOI 10.1023/A:1007846404582. [Google Scholar] [CrossRef]
120. Hargreaves, B., Shi, S. (2005). A total returns index for investor housing in New Zealand. Pacific Rim Property Research Journal, 11(3), 253–267. DOI 10.1080/14445921.2005.11104186. [Google Scholar] [CrossRef]
121. Minne, A., Francke, M., Geltner, D., White, R. (2020). Using revisions as a measure of price index quality in repeat-sales models. The Journal of Real Estate Finance and Economics, 60(4), 514–553. DOI 10.1007/s11146-018-9692-x. [Google Scholar] [CrossRef]
122. CarparkHK.com (2011). Transaction record. https://www.carparkhk.com/transaction-records.php?page=4726. [Google Scholar]
123. Li, R. Y. M., Poon, S. W. (2011). Using Web 2.0 to share knowledge of construction safety: The fable of economic animals. Economic Affairs, 31(1), 73–79. DOI 10.1111/j.1468-0270.2010.02053.x. [Google Scholar] [CrossRef]
124. Chen, J., He, Z., Zhu, D., Hui, B., Li, R. Y. M. et al. (2022). Mu-Net: Multi-path upsampling convolution network for medical image segmentation. Computer Modeling in Engineering & Sciences, 131(1), 73–95. DOI 10.32604/cmes.2022.018565. [Google Scholar] [CrossRef]
125. Shao, X. F., Li, Y., Suseno, Y., Li, R. Y. M., Gouliamos, K. et al. (2021). How does facial recognition as an urban safety technology affect firm performance? The moderating role of the home country’s government subsidies. Safety Science, 143(4), 105434. DOI 10.1016/j.ssci.2021.105434. [Google Scholar] [CrossRef]
126. Zhang, J., Lu, C., Wang, J., Wang, L., Yue, X. G. (2019). Concrete cracks detection based on FCN with dilated convolution. Applied Sciences, 9(13), 2686. DOI 10.3390/app9132686. [Google Scholar] [CrossRef]
127. Regona, M., Yigitcanlar, T., Xia, B., Li, R. Y. M. (2022). Artificial intelligent technologies for the construction industry: How are they perceived and utilized in Australia? Journal of Open Innovation: Technology, Market, and Complexity, 8(1), 16. DOI 10.3390/joitmc8010016. [Google Scholar] [CrossRef]
128. Song, L., Li, R. Y. M., Yao, Q. (2022). An informal institution comparative study of occupational safety knowledge sharing via French and English Tweets: Languaculture, weak-strong ties and AI sentiment perspectives. Safety Science, 147(2), 105602. DOI 10.1016/j.ssci.2021.105602. [Google Scholar] [CrossRef]
129. Yao, Q., Li, R. Y. M., Song, L., Crabbe, M. J. C. (2021). Construction safety knowledge sharing on Twitter: A social network analysis. Safety Science, 143(5), 105411. DOI 10.1016/j.ssci.2021.105411. [Google Scholar] [CrossRef]
130. Zeng, F. F., Feng, J., Zhang, Y., Tsou, J. Y., Xue, T. et al. (2021). Comparative study of factors contributing to land surface temperature in high-density built environments in megacities using satellite imagery. Sustainability, 13(24), 13706. DOI 10.3390/su132413706. [Google Scholar] [CrossRef]
131. Chen, T., Guo, W., Gao, X., Liang, Z. (2021). AI-based self-service technology in public service delivery: User experience and influencing factors. Government Information Quarterly, 38(4), 101520. DOI 10.1016/j.giq.2020.101520. [Google Scholar] [CrossRef]
132. Yigitcanlar, T., Corchado, J. M., Mehmood, R., Li, R. Y. M., Mossberger, K. (2021). Responsible urban innovation with local government artificial intelligence (AIA conceptual framework and research agenda. Journal of Open Innovation: Technology, Market, and Complexity, 7(1), 71. DOI 10.3390/joitmc7010071. [Google Scholar] [CrossRef]
133. Li, R. Y. M. (2017). An economic analysis on automated construction safety: Internet of things, artificial intelligence and 3D printing, pp. 1--173. Singapore: Springer. [Google Scholar]
134. Chen, X., Yue, X. G., Li, R., Zhumadillayeva, A., Liu, R. (2021). Design and application of an improved genetic algorithm to a class scheduling system. International Journal of Emerging Technologies in Learning, 16(1), 44–59. DOI 10.3991/ijet.v16i01.18225. [Google Scholar] [CrossRef]
135. Regona, M., Yigitcanlar, T., Xia, B., Li, R. Y. M. (2022). Opportunities and adoption challenges of AI in the construction industry: A PRISMA review. Journal of Open Innovation: Technology, Market, and Complexity, 8(1), 45. DOI 10.3390/joitmc8010045. [Google Scholar] [CrossRef]
136. Richter, A., Ng, K. T. W., Karimi, N., Li, R. Y. M. (2021). An iterative tessellation-based analytical approach to the design and planning of waste management regions. Computers, Environment and Urban Systems, 88(10), 101652. DOI 10.1016/j.compenvurbsys.2021.101652. [Google Scholar] [CrossRef]
137. Yigitcanlar, T., Kankanamge, N., Regona, M., Ruiz Maldonado, A., Rowan, B. (2020). Artificial intelligence technologies and related urban planning and development concepts: How are they perceived and utilized in Australia? Journal of Open Innovation: Technology, Market, and Complexity, 6(4), 187. DOI 10.3390/joitmc6040187. [Google Scholar] [CrossRef]
138. Li, R. Y. M., Tang, B., Chau, K. W. (2019). Sustainable construction safety knowledge sharing: A partial least square-structural equation modeling and a feedforward neural network approach. Sustainability, 11(20), 5831. DOI 10.3390/su11205831. [Google Scholar] [CrossRef]
139. Yue, X. G., Zhang, G., Wu, Q., Li, F., Chen, X. F. et al. (2015). Wearing prediction of satellite alloys based on opposite degree algorithm. Rare Metals, 34(2), 125–132. DOI 10.1007/s12598-014-0430-0. [Google Scholar] [CrossRef]
140. Lei, T., Li, R. Y. M., Fu, H. (2021). Dynamics analysis and fractional-order approximate entropy of nonlinear inventory management systems. Mathematical Problems in Engineering, 2021, 1–8. DOI 10.1155/2021/5516703. [Google Scholar] [CrossRef]
141. Yue, X. G., Shao, X. F., Li, R. Y. M., Crabbe, M. J. C., Mi, L. (2020). Risk prediction and assessment: Duration, infections, and death toll of the COVID-19 and its impact on China’s economy. Journal of Risk and Financial Management, 13(4), 66. DOI 10.3390/jrfm13040066. [Google Scholar] [CrossRef]
142. He, Z., Liu, Z., Wu, H., Gu, X., Zhao, Y. et al. (2020). Research on the impact of green finance and fintech in smart city. Complexity, 2020(3), 1–10. DOI 10.1155/2020/6673386. [Google Scholar] [CrossRef]
143. Li, R. Y. M., Chau, K. W. (2016). Econometric analyses of international housing markets. London, New York: Routledge. [Google Scholar]
144. Li, N., Li, R. Y. M., Pu, R. (2021). What is in a name? A modern interpretation from housing price in Hong Kong. Pacific Rim Property Research Journal, 27(1), 55–74. DOI 10.1080/14445921.2021.1961182. [Google Scholar] [CrossRef]
145. Li, R. Y. M., Cheung, K. Y., Shoaib, M. (2018). Walled buildings, sustainability, and housing prices: An artificial neural network approach. Sustainability, 10(4), 1298. DOI 10.3390/su10041298. [Google Scholar] [CrossRef]
146. He, X., Zhao, K., Chu, X. (2021). AutoML: A survey of the state-of-the-art. Knowledge-Based Systems, 212(3), 106622. DOI 10.1016/j.knosys.2020.106622. [Google Scholar] [CrossRef]
147. Yang, F., Qiao, Y., Qi, Y., Bo, J., Wang, X. (2022). BACS: Blockchain and AutoML-based technology for efficient credit scoring classification. Annals of Operations Research, 1–21. DOI 10.1007/s10479-022-04531-8. [Google Scholar] [CrossRef]
148. Vagliano, I., Brinkman, S., Abu-Hanna, A., Arbous, M. S., Dongelmans, D. A. et al. (2022). Can we reliably automate clinical prognostic modelling? A retrospective cohort study for ICU triage prediction of in-hospital mortality of COVID-19 patients in the Netherlands. International Journal of Medical Informatics, 160(2), 104688. DOI 10.1016/j.ijmedinf.2022.104688. [Google Scholar] [CrossRef]
149. Chen, W., Tong, J., He, R., Lin, Y., Chen, P. et al. (2021). An easy method for identifying 315 categories of commonly-used Chinese herbal medicines based on automated image recognition using AutoML platforms. Informatics in Medicine Unlocked, 25(18), 100607. DOI 10.1016/j.imu.2021.100607. [Google Scholar] [CrossRef]
150. Gerassis, S., Giráldez, E., Pazo-Rodríguez, M., Saavedra, Á., Taboada, J. (2021). AI approaches to environmental impact assessments (EIAs) in the mining and metals sector using AutoML and Bayesian modeling. Applied Sciences, 11(17), 7914. DOI 10.3390/app11177914. [Google Scholar] [CrossRef]
151. Li, R. Y. M., Chau, K. W., Li, H. C. Y., Zeng, F., Tang, B. et al. (2021). Remote sensing, heat island effect and housing price prediction via AutoML. Advances in Intelligent Systems and Computing, 1213, 113–118. DOI 10.1007/978-3-030-51328-3_17. [Google Scholar] [CrossRef]
152. Fu, Y., Guo, T., Zhao, X. (2021). Intelligent splicing method of virtual reality Lingnan cultural heritage panorama based on automatic machine learning. Mobile Information Systems, 2021(4), 1–10. DOI 10.1155/2021/8693436. [Google Scholar] [CrossRef]
153. Li, P. (2020). Research on radar signal recognition based on automatic machine learning. Neural Computing and Applications, 32(2), 1959–1969. DOI 10.1007/s00521-019-04494-1. [Google Scholar] [CrossRef]
154. Li, R. Y. M., Li, H. C. Y. (2018). Have housing prices gone with the smelly wind? Big data analysis on landfill in Hong Kong. Sustainability, 10(2), 341. DOI 10.3390/su10020341. [Google Scholar] [CrossRef]
Cite This Article
 Copyright © 2023 The Author(s). Published by Tech Science Press.
This work is licensed under a Creative Commons Attribution 4.0 International License , which permits unrestricted use, distribution, and reproduction in any medium, provided the original work is properly cited.
 Downloads
 Citation Tools