
 Submit a Paper
 Propose a Special lssue
 Open Access
ARTICLE

Predicting the Thickness of an Excavation Damaged Zone around the Roadway Using the DA-RF Hybrid Model
1
School of Resources and Safety Engineering, Central South University, Changsha, 410083, China
2
Laboratory 3SR, CNRS UMR 5521, Grenoble Alpes University, Grenoble, 38000, France
* Corresponding Authors: Jian Zhou; Email: ;
(This article belongs to the Special Issue: Computational Intelligent Systems for Solving Complex Engineering Problems: Principles and Applications)
Computer Modeling in Engineering & Sciences 2023, 136(3), 2507-2526. https://doi.org/10.32604/cmes.2023.025714
Received 26 July 2022; Accepted 28 October 2022; Issue published 09 March 2023
 View Full Text
 Download PDF
Abstract
After the excavation of the roadway, the original stress balance is destroyed, resulting in the redistribution of stress and the formation of an excavation damaged zone (EDZ) around the roadway. The thickness of EDZ is the key basis for roadway stability discrimination and support structure design, and it is of great engineering significance to accurately predict the thickness of EDZ. Considering the advantages of machine learning (ML) in dealing with high-dimensional, nonlinear problems, a hybrid prediction model based on the random forest (RF) algorithm is developed in this paper. The model used the dragonfly algorithm (DA) to optimize two hyperparameters in RF, namely mtry and ntree, and used mean absolute error (MAE), root mean square error (RMSE), determination coefficient (R2), and variance accounted for (VAF) to evaluate model prediction performance. A database containing 217 sets of data was collected, with embedding depth (ED), drift span (DS), surrounding rock mass strength (RMS), joint index (JI) as input variables, and the excavation damaged zone thickness (EDZT) as output variable. In addition, four classic models, back propagation neural network (BPNN), extreme learning machine (ELM), radial basis function network (RBF), and RF were compared with the DA-RF model. The results showed that the DARF mold had the best prediction performance (training set: MAE = 0.1036, RMSE = 0.1514, R2 = 0.9577, VAF = 94.2645; test set: MAE = 0.1115, RMSE = 0.1417, R2 = 0.9423, VAF = 94.0836). The results of the sensitivity analysis showed that the relative importance of each input variable was DS, ED, RMS, and JI from low to high.Keywords
After the excavation of the roadway, the original stress equilibrium state of the surrounding rock is broken, resulting in stress redistribution. On the one hand, the radial stress decreases and the tangential stress increases; on the other hand, the stress state of the surrounding rock changes from a three-dimensional stress state to an approximately two-dimensional stress state. Therefore, the surrounding rock will appear strength reduction and stress concentration phenomenon. When the induced stress in the surrounding rock exceeds the strength of the rock mass, the rock mass will be broken, and a ring-shaped broken rock zone (BRZ) will be formed within a certain range around the roadway, which is called the excavation damaged zone (EDZ) or loose circle [1–3]. The thickness of the excavation damaged zone is not only an important basis for judging the stability of the roadway but also crucial for the construction of underground space engineering and the design of supporting structures [4–6]. Therefore, accurate prediction of the thickness of the excavation damaged zone (EDZ) around the roadway is of great importance in engineering practice.
At present, there are several methods for predicting EDZ thickness, including the empirical formula method, on-site measurement method, numerical simulation, and machine learning (ML). Based on onsite tests and theoretical analysis, various empirical formulas for calculating EDZ thickness have been proposed [7–10]. Shemyakin et al. [11,12] proposed the concept of a discontinuous zone and derived an empirical formula for the thickness of the discontinuous zone. Serrano et al. [13] obtained a mathematical expression for determining the radius of the loose circle based on the convergence-confinement method. Wang et al. [14] revised the H-B strength criterion and derived a theoretical formula for the loose circle radius. Qiao et al. [15] used the Drucker-Prager yield criterion to derive a formula for calculating the thickness of EDZ. Although these empirical formulas can predict the thickness of EDZ, they have been validated for only a few engineering sites and are difficult to be applied beyond the original environmental features, and are not applicable to complex engineering environments. With the development of technology, there are a variety of on-site measurement methods to determine the thickness of EDZ, including the ultrasonic method [16,17], geological radar method [18], microseismic monitoring [1,19], complex resistivity method [20], borehole imaging method [21–23], multi-point extensometer method [24], etc. However, the on-site measurement method has disadvantages such as cumbersome operation, high measurement cost, and is easily restricted by on-site conditions. Based on the development of computer technology, numerical simulation methods have been widely used to study the distribution of EDZ around roadways [25–30]. Golshani et al. [31] performed numerical simulations of the EDZ around openings in brittle rocks. Xia et al. [32] used the finite element method to obtain the loose range of the surrounding rock of the roadway through numerical simulation, and the simulation results were very close to the actual results. Yang et al. [33] performed a 3D numerical simulation of the evolution of the EDZ around the tunnel using LS-DYNA software. An et al. [34] proposed a hybrid finite element-discrete element method to simulate the EDZ formation process around the tunnel. Some scholars have used finite elements, discrete elements, marker point processing techniques, and material point dormancy method to build numerical models for estimating EDZ and obtained the formation pattern and distribution characteristics of the loose zone [35–38]. Although the numerical simulation method is low-cost and easy to operate, there are many assumptions in the simulation process, and it is often necessary to simplify the boundary conditions and material properties, resulting in model results that are inconsistent with reality.
Due to the advantages of ML methods in dealing with nonlinear problems, ML has been widely used to solve complex problems in the engineering field [39–48]. In particular, there have been many studies using ML to predict the thickness of EDZ and its related problems. Zhou et al. [3] developed a support vector machine (SVM) model for estimating the broken rock zone thickness (BRZT), and its predictive performance was more accurate than the regression model. Liu et al. [49] established a roadway surrounding rock stability prediction model based on concept lattice theory and improved probabilistic neural network. Xie et al. [2] developed a random forest regression model to predict EDZ, and the results proved that the random forest model has excellent prediction performance. Yu et al. [50] developed four prediction models of the multiple linear regression, artificial neural network, Gaussian process (GP), and particle swarm optimization (PSO)-GP to predict EDZ thickness. Zhao et al. [51] used the sparrow search algorithm (SSA) to optimize the backpropagation neural network (BPNN), Elman neural network (ENN), and support vector regression (SVR), and constructed SSA-BPNN, SSA-ENN, and SSA -SVR three models to predict the thickness of EDZ around the roadway, of which the SSA-BPNN model performed the best. According to the above, ML has the advantages of low cost, less time, high reliability of results, and shows excellent prediction performance in predicting the thickness of EDZ around the roadway.
Random forest (RF), as an efficient machine learning (ML) technique, has been applied in many engineering practices and has shown good predictive ability [52–57]. Dragonfly algorithm (DA) is a new type of intelligent optimization algorithm, which has the characteristics of strong optimization ability, simple principle, and few parameters [58]. Based on the above, this paper constructs a DA-RF hybrid model to predict the thickness of EDZ around the roadway. The model uses the dragonfly algorithm to optimize two hyperparameters in RF, namely the number of features used to grow each tree (mtry) and the number of trees (ntree), to enhance its predictive power. In addition, the DA-RF hybrid model is compared with three classical models to evaluate its predictive performance. Finally, the degree of influence of each output parameter on the prediction of EDZ thickness was determined by sensitivity analysis.
The dragonfly algorithm (DA) is a metaheuristic algorithm proposed by Mirjalili [58] based on the hunting and migration behavior of dragonflies, which has been applied in many fields [59–66]. The algorithm simulates two swarming behaviors of dragonflies, namely static swarm and dynamic swarm. In static swarming behaviors, dragonflies divide into small groups and fly back and forth in a small area in search of prey, which is similar to the exploration phase. In dynamic swarming behaviors, a large number of dragonflies form swarms for long-distance migration in the same direction, which is similar to the development stage [67,68]. During the movement of dragonflies, the updating of individual positions is related to five behaviors, namely separation, alignment, cohesion, foraging, and avoiding the enemy, as shown in Fig. 1. The mathematical expressions of the five behaviors are as follows.

Figure 1: Five behavioral patterns of the DA
Separation refers to the behavior of dragonflies to separate from the population in order to avoid static collisions with neighbors during flight, its mathematical model is as follows:
where X is the position of the current individual, Xj is the position of the j-th neighboring individual, and N is the number of neighboring individuals in the population.
Alignment refers to the speed at which a dragonfly individual maintains the same speed as its neighbors when flying, and its mathematical model is as follows:
where Vj denotes the flight speed of the j-th neighboring individual.
Cohesion refers to the behavior that dragonfly individuals tend to gather toward the center of neighboring individuals, and its mathematical model is as follows:
where X represents the current position of the dragonfly individual.
Foraging is the behavior of a dragonfly that is attracted to food and flies towards it, and its mathematical model is as follows:
where X+ is the location of the food source.
Avoiding the enemy refers to distracting the enemy's attention and escaping from the natural enemy, and its mathematical model is as follows:
where X− represents the position of the enemy.
The position of the food source is the current optimal position of the algorithm, and the fitness value is the best, and the position of the enemy is the current worst position, and the fitness value is the worst. DA is developed based on the particle swarm algorithm, and to imitate the flight direction of the dragonfly in space as well as the step length, a step vector ΔX and a position vector X were introduced. The step vector represents the direction of motion of the dragonfly and is mathematically defined as follows:
where t denotes the number of current iterations, s is the separation weight, a is the alignment weight, c is the cohesion weight, f is the foraging weight, e is the enemy avoidance weight, w is the inertia weight, and ΔXt+1 is the next population location update step.
The position vector represents the position of the individual dragonfly movement. When the former individual has neighboring dragonflies (i.e., there are other dragonflies within his radius (r)), the mathematical model is as follows:
When there is no neighboring dragonfly, to improve the randomness of dragonfly searching, the Lévy flight method is used to fly around the search space to update the position of the dragonfly. The mathematical model is as follows:
where d is the position vector dimension, r1 and r2 are random numbers in [0,1], and β is a constant.
To adjust the search performance of the DA algorithm, the parameter values (s, a, c, f, e) will be adaptively adjusted during the search process. The algorithm flow of DA is shown in Fig. 2.

Figure 2: The flow chart of DA
2.2 Random Forest (RF) Algorithm
Random Forest (RF) algorithm is a machine learning model based on the decision tree proposed by Breiman [69]. It essentially uses the idea of ensemble learning to integrate multiple decision trees by bagging methods (also known as bootstrap aggregating) and random feature selection to increase the diversity of classification and regression trees (CART) [70], the mean value of each regression decision tree is taken as the prediction result. The RF algorithm has good generalization ability, is simple to implement, has high precision, and is not prone to overfitting. Fig. 3 shows the structure of the random forest. The basic steps to construct the RF are as follows.

Figure 3: Structure of RF algorithm
First, the bagging method is used to repeatedly randomly select k samples from the original training sample set N with replacement to form k training subsets with a sample size of n. Second, a single CART regression tree (decision tree) is constructed with the training subset. In the training process, the splitting rule for each node is to randomly select m (m ≪ M) feature attributes from the set M of all feature attributes, then select the optimal splitting point from these m features, and then divide the left and right subtrees until it cannot be split, and there is no pruning in the formation of the regression decision tree. Repeat the above steps to construct a large number of regression decision trees and maximize the growth of each tree, and these regression decision trees will form a random forest. Finally, based on the idea of ensemble learning, the prediction results of all regression decision trees are averaged as the final prediction results [71–73].
3.1 Data Preparation and Description
To construct a DA-RF hybrid model for predicting EDZ thickness, we built a database by referring to previous literature [51,74,75]. The database has collected a total of 217 sets of data from various mines in different places. In this database, each sample contains embedding depth (ED), drift span (DS), surrounding rock mass strength (RMS), joint index (JI), and the excavation damaged zone thickness (EDZT), where ED, DS, RMS, and JI are used as input parameters and EDZT is used as an output parameter. ED refers to the depth of the roadway from the ground. Since the thickness of the EDZ increases with the increase of the original rock stress, ED is selected to describe the original rock stress. DS refers to the width of the roadway, the size and shape of the roadway section have a certain influence on the thickness of the EDZ, and the roadway span is generally selected as the analysis index. RMS refers to the uniaxial compressive strength of the surrounding rock, and JI refers to the degree of joint development in the surrounding rock. The strength of the surrounding rock reflects the difficulty of the surrounding rock resisting damage and is inversely proportional to the thickness of the EDZ. In addition, the presence of joints and fissures in the rock mass also affects the strength of the rock mass, so RMS and JI are chosen to jointly describe the strength of the rock mass. These indicators are the main influencing factors of EDZ formation, are easily accessible and the information described is independent [51], so these four parameters were chosen as inputs. Pearson correlation coefficients were calculated to describe the correlation between the input parameters and between the input and output parameters, as shown in Fig. 4. As can be seen from the figure, the correlations among the parameters are low, indicating that the input variables are relatively independent, and the input and output parameters are not simply linearly related to each other. For better understanding, Table 1 shows some statistical information about the dataset, and a schematic of the structure of the EDZ around the roadway is shown in Fig. 5.
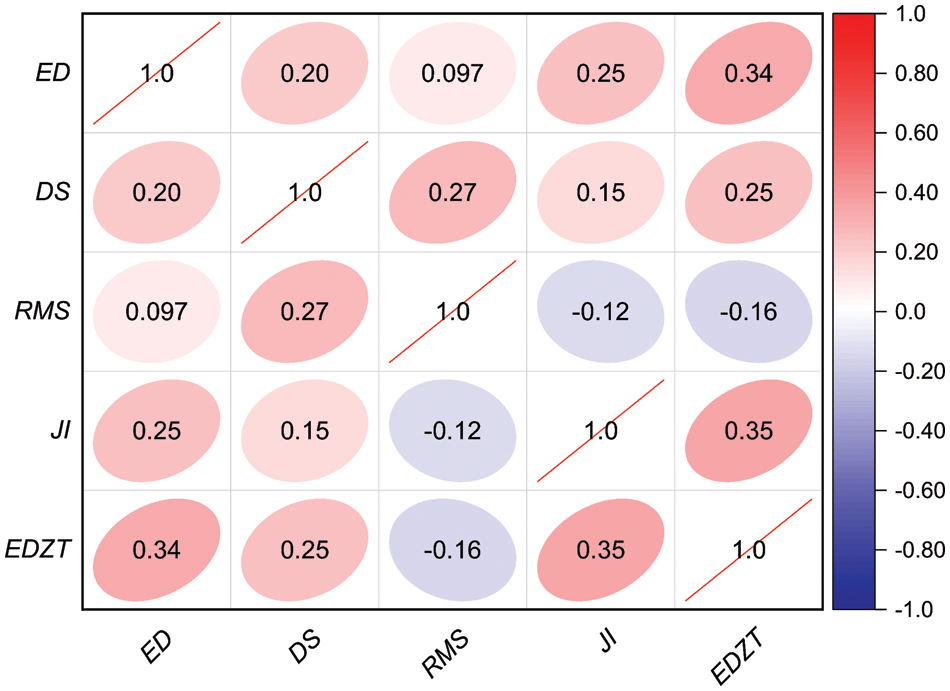
Figure 4: Correlation plot of EDZ dataset

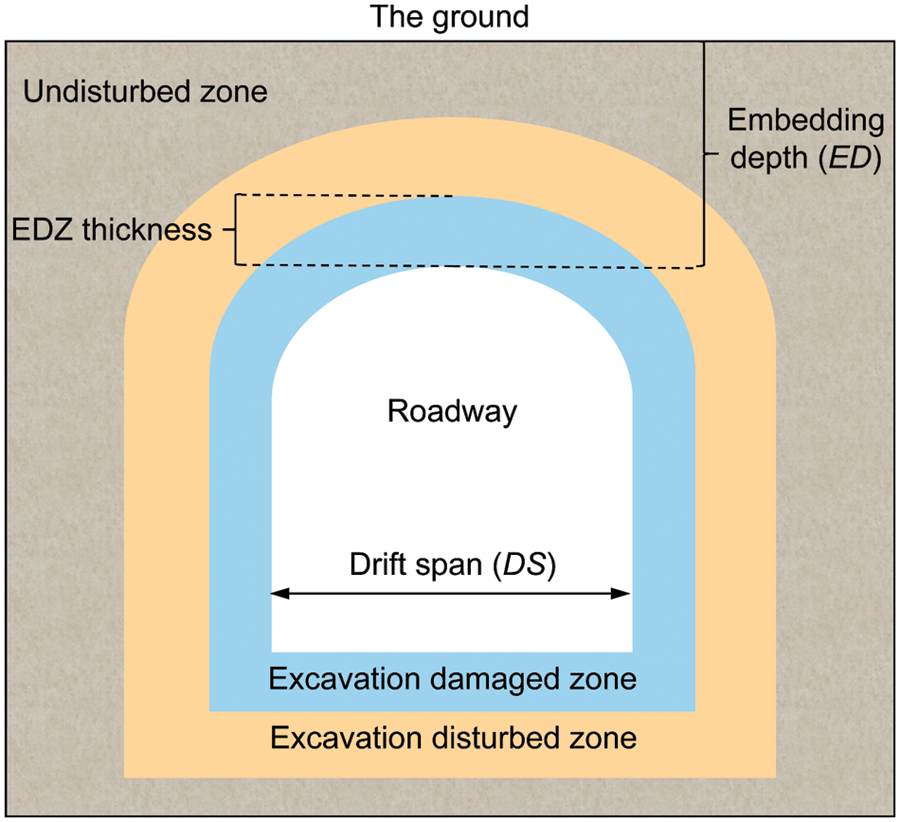
Figure 5: Schematic diagram of the structure of EDZ around the roadway
3.2 Model Verification and Evaluation
In order to verify and evaluate the prediction performance of the DA-RF hybrid model and ensure that the model can reliably predict the thickness of the EDZ around the roadway, four evaluation indicators were selected in this study, namely mean absolute error (MAE) and root mean square error (RMSE), determination coefficient (R2), and variance accounted for (VAF) [76–78]. The smaller the RMSE and MAE values, the closer the R2 is to 1, and the closer the VAF value is to 100, indicating that the prediction quality of the model is higher. The formulas of the evaluation indexes are as follows [79–85]:
where N is the number of samples,
In this paper, the RF algorithm is used to predict the thickness of the EDZ around the roadway, and DA is used to optimize the two hyperparameters mtry and ntree in RF to improve the prediction performance of the RF model. From this, a DA-RF hybrid prediction model is constructed. To more intuitively illustrate the architecture of the proposed hybrid prediction model, the construction process of DA-RF model development and evaluation is shown in Fig. 6. As can be seen from Fig. 6, the model can be divided into four stages. First, the dataset was randomly divided into the training set and the test set, of which the training set accounts for 80% and the test set accounts for 20%. After that, all datasets were normalized to the range [−1, 1], which was to attenuate the influence of input parameters of different scales on the results and reduce the computational cost. Next, initialize the relevant parameters, optimize the two hyperparameters mtry and ntree in RF through DA, and the RMSE was used as the fitness value to determine whether the termination condition was satisfied and if so, the best RF model was determined. Finally, the prediction performance of the proposed hybrid models was evaluated by calculating the evaluation indicators (R2, VAF, RMSE, MAE) for the training and test sets.

Figure 6: Flowchart of hybrid model based on RF optimized by DA technique
The correlation between the predicted and actual values of the training and test sets of the DA-RF model is shown in Fig. 7. The confidence and prediction bands in the figure define the upper and lower bounds and width of the correlation interval, with the 95% confidence band indicating a 95% probability of containing the true best-fit linear regression line within the interval and the 95% prediction band indicating the region expected to contain 95% of the new data points. As can be seen from the figure, the confidence band and prediction band of both the training and test sets are narrow, indicating that the prediction performance of the DA-RF hybrid model is relatively stable. It is worth noting that several hybrid models have been developed to predict the thickness of the EDZ. Zhao et al. [51] developed an SSA-BPNN model with an MAE, RMSE, and R2 of 0.1246,0.1636, and 0.9277, respectively, during the test phase. Yu et al [50] constructed the PSO-GP with RMSE, R2, and VAF of 0.1591, 0.9153, and 89.2192, respectively, during the testing phase. The MAE, RMSE, R2, and VAF of the DA-RF model constructed in this paper were 0.1115, 0.1417, 0.9423, and 94.0836, respectively, in the testing phase, which was significantly better than the above two models and possessed higher prediction performance.
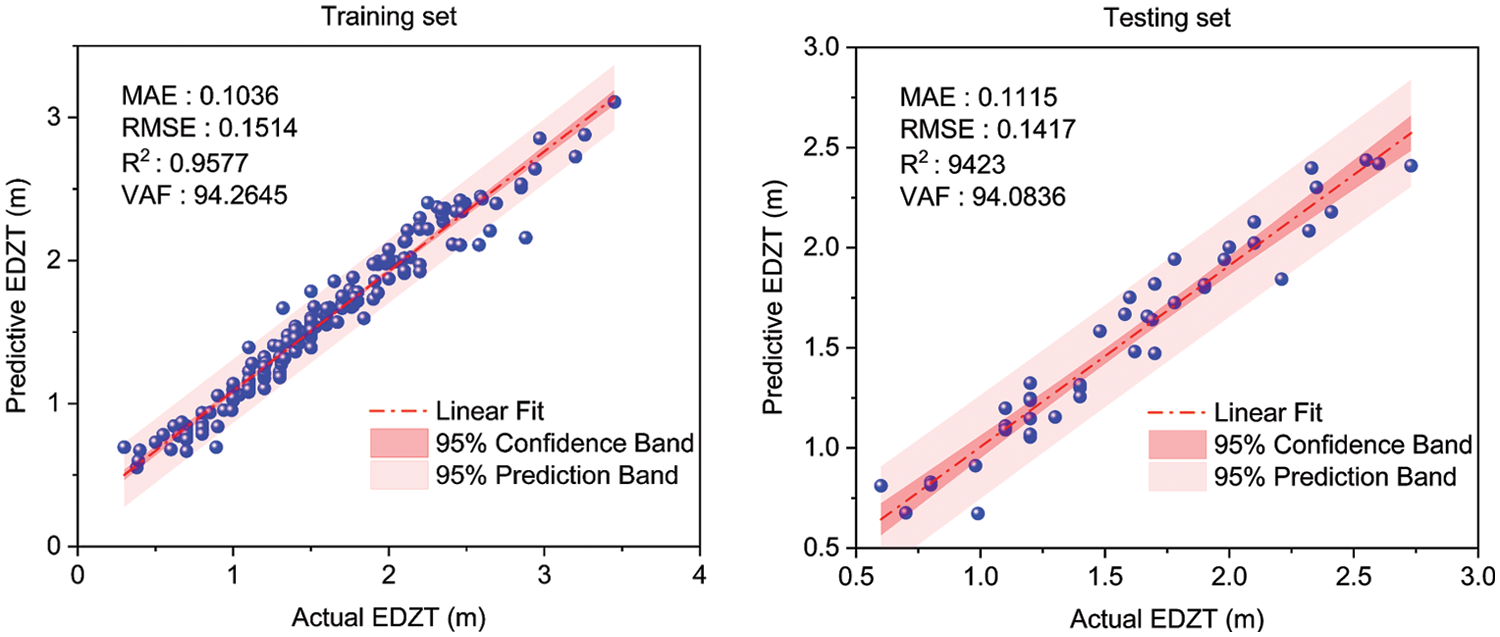
Figure 7: Predictive performance of DA-RF model
4.2 Comparison with Classical Models
Several classical models and risk assessment procedures have been applied to high-risk operations and projects such as blasting and quarrying [86–90]. To verify and evaluate the superiority of the DA-RF model prediction performance, we introduced four classical models to predict the thickness of EDZ, which were back propagation neural network (BPNN), extreme learning machine (ELM), radial basis function network (RBF) and RF, and the prediction results of these classical models were compared with the DA-RF model, as shown in Table 2. In the table, we comprehensively score the evaluation indicators of the training set and test set of the models. The higher the score, the better the prediction performance of the model [91,92].

The prediction results of the test set of DA-RF and classic models are shown in Fig. 8. The larger the area of the bubble in the figure represents the larger the absolute error (AE), and the AE is calculated as follows:


Figure 8: Prediction error analysis of the five models test sets
As can be seen from Fig. 6, the AE value of the DA-RF model is generally lower than that of the other four models. To compare the predictive performance of all models more intuitively and accurately, we rank the comprehensive scores of the five models, and the results are shown in Fig. 9. It can be seen that the DA-RF model has the best performance in predicting the thickness of the EDZ.

Figure 9: Comprehensive score ranking of EDZ thickness prediction models
The prediction of the thickness of the EDZ around the roadway is related to the roadway excavation and the design of the support structure, which plays an important role in ensuring the stability of the roadway. To accurately predict the EDZ thickness, the influence of various factors must be comprehensively considered. It is known that the four input parameters selected in this paper have a certain influence on the prediction of the thickness of the EDZ, but the extent of their influence is not clear. Therefore, sensitivity analysis is needed to judge the importance of each input variable in the DA-RF model to the output EDZ thickness.
The RF algorithm has built-in feature importance to calculate the sensitivity of the input parameters [69,93]. The basic idea is to calculate the mean square error (MSE) of each decision tree in the RF using the corresponding out-of-bag (OOB) data sample for it. Then keep the values at other features unchanged, perform random up-down permutation on the value at feature j in OOB, and the MSE of its OOB is calculated again. The importance of feature j can be represented by the difference between the MSEs calculated before and after [73]. Assuming there are N trees, the importance of feature X can be calculated by the formula (16).
where

Figure 10: Relative importance of input variables in predicting EDZ thickness
The thickness of the excavation damaged zone (EDZ) is an important basis for determining and controlling the stability of roadway engineering construction, and it is of great significance to accurately predict the thickness of the EDZ in engineering practice. Therefore, in this paper, a hybrid RF-based prediction model is developed to accurately predict the thickness of the EDZ around the roadway. The model utilized the dragonfly algorithm (DA) to optimize two hyperparameters in RF, namely mtry and ntree. We established a database containing 217 sets of data, of which 174 sets were used as the training set and the remaining 43 sets as the test set. The embedding depth (ED), drift span (DS), surrounding rock mass strength (RMS), and joint index (JI) were used as input variables, and the excavation damage zone thickness (EDZT) was used as output variables. To demonstrate the superiority of the DA-RF model, four models, BPNN, ELM, RBF, and RF, are cited for comparison with the DA-RF model. The results show that the DA-RF model is significantly better than the unoptimized classical model and has the best prediction performance (training set: MAE = 0.1036, RMSE = 0.1514, R2 = 0.9577, VAF = 94.2645; test set: MAE = 0.1115, RMSE = 0.1417, R2 = 0.9423, VAF = 94.0836), so it is recommended to predict the thickness of the EDZ around the roadway. Finally, the relative importance of each input variable was determined by sensitivity analysis, and the order from low to high was DS, ED, RMS, and JI. The hybrid model developed in this paper provides a simple and accurate method for predicting the thickness of the excavation damaged zone, and the algorithm used can be applied to other similar engineering problems. In the future, it is necessary to collect more data samples, consider more influencing factors, and optimize the algorithm to further improve the prediction performance of the hybrid model.
Funding Statement: This research was funded by the National Science Foundation of China (42177164), the Distinguished Youth Science Foundation of Hunan Province of China (2022JJ10073) and the Innovation-Driven Project of Central South University (2020CX040).
Conflicts of Interest: The authors declare that they have no known competing financial interests or personal relationships that could have appeared to influence the work reported in this paper.
References
1. Cai, M., Kaiser, P. K. (2005). Assessment of excavation damaged zone using a micromechanics model. Tunnelling and Underground Space Technology, 20(4), 301–310. https://doi.org/10.1016/j.tust.2004.12.002 [Google Scholar] [CrossRef]
2. Xie, Q., Peng, K. (2019). Space-time distribution laws of tunnel excavation damaged zones (EDZs) in deep mines and EDZ prediction modeling by random forest regression. Advances in Civil Engineering, 2019(7), 1–13. https://doi.org/10.1155/2019/6505984 [Google Scholar] [CrossRef]
3. Zhou, J., Li, X. B. (2011). Evaluating the thickness of broken rock zone for deep roadways using nonlinear SVMs and multiple linear regression model. Procedia Engineering, 26, 972–981. https://doi.org/10.1016/j.proeng.2011.11.2264 [Google Scholar] [CrossRef]
4. Fattahi, H., Farsangi, M. A. E., Shojaee, S., Mansouri, H. (2015). Selection of a suitable method for the assessment of excavation damage zone using fuzzy AHP in Aba Saleh Almahdi tunnel, Iran. Arabian Journal of Geosciences, 8(5), 2863–2877. https://doi.org/10.1007/s12517-014-1280-7 [Google Scholar] [CrossRef]
5. Jing, W., Liu, S. X., Yang, R. S., Jing, L. W., Xue, W. P. (2022). Mechanism of aging deformation zoning of surrounding rock in deep high stress soft rock roadway based on rock creep characteristics. Journal of Applied Geophysics, 202(6), 104632. https://doi.org/10.1016/j.jappgeo.2022.104632 [Google Scholar] [CrossRef]
6. Liu, Y., Ye, Y. C., Wang, Q. H., Liu, X. Y., Wang, W. Q. (2019). Predicting the loose zone of roadway surrounding rock using wavelet relevance vector machine. Applied Sciences, 9(10), 2064. https://doi.org/10.3390/app9102064 [Google Scholar] [CrossRef]
7. Guo, H. S., Tong, J. Q., Sun, Q. C., Yang, X., Luo, W. J. et al. (2022). Determination method of excavation damage zone based on surrounding rock damage-fracture ratio in underground engineering. Frontiers in Earth Science, 10, 1922. https://doi.org/10.3389/feart.2022.836313 [Google Scholar] [CrossRef]
8. Guo, X. F., Zhao, Z. Q., Gao, X., Wu, X. Y., Ma, N. J. (2019). Analytical solutions for characteristic radii of circular roadway surrounding rock plastic zone and their application. International Journal of Mining Science and Technology, 29(2), 263–272. https://doi.org/10.1016/j.ijmst.2018.10.002 [Google Scholar] [CrossRef]
9. Jing, W., Chen, H. E., Yang, R. S., Jing, L. W., Xue, W. P. et al. (2022). Elastoplastic analysis of surrounding rock of deep roadway based on rock creep and D-P criterion. Chinese Journal of Theoretical and Applied Mechanics, 54(7), 1982–1993. https://doi.org/10.6052/0459-1879-21-619 [Google Scholar] [CrossRef]
10. Wang, R., Liu, Y. Y., Deng, X. H., Zhang, Y., Huang, X. D. et al. (2020). Analysis on loose circle of surrounding rock of large deformation soft-rock tunnel. Advances in Civil Engineering, 2020, 8842976. https://doi.org/10.1155/2020/8842976 [Google Scholar] [CrossRef]
11. Shemyakin, E. I., Fisenko, G. L., Kurlenya, M. V., Oparin, V. N., Reva, V. N. et al. (1987). Zonal disintegration of rocks around underground mines, part III: Theoretical concepts. Soviet Mining Science, 23(1), 1–6. https://doi.org/10.1007/BF02534034 [Google Scholar] [CrossRef]
12. Shemyakin, E. I., Kurlenya, M. V., Oparin, V. N., Reva, V. N., Glushikhin, F. P. et al. (1989). Zonal disintegration of rocks around underground workings. IV. Practical applications. Soviet Mining Science, 25(4), 297–302. https://doi.org/10.1007/BF02528546 [Google Scholar] [CrossRef]
13. Serrano, A., Olalla, C., Reig, I. (2011). Convergence of circular tunnels in elastoplastic rock masses with non-linear failure criteria and non-associated flow laws. International Journal of Rock Mechanics and Mining Sciences, 48(6), 878–887. https://doi.org/10.1016/j.ijrmms.2011.06.008 [Google Scholar] [CrossRef]
14. Wang, R., Deng, X. H., Meng, Y. Y., Yuan, D. Y., Xia, D. H. (2019). Case study of modified H-B strength criterion in discrimination of surrounding rock loose circle. KSCE Journal of Civil Engineering, 23(3), 1395–1406. https://doi.org/10.1007/s12205-019-1055-5 [Google Scholar] [CrossRef]
15. Qiao, S., Cai, Z., Xu, P., Tan, J., Zhang, Y. (2021). Investigation on the scope and influence factors of surrounding rock loose circle of shallow tunnel under bias pressure: A case study. Arabian Journal of Geosciences, 14(15), 1428. https://doi.org/10.1007/s12517-021-07869-8 [Google Scholar] [CrossRef]
16. Yang, J. H., Dai, J. H., Yao, C., Jiang, S. H., Zhou, C. B. et al. (2020). Estimation of rock mass properties in excavation damage zones of rock slopes based on the Hoek-Brown criterion and acoustic testing. International Journal of Rock Mechanics and Mining Sciences, 126(2), 104192. https://doi.org/10.1016/j.ijrmms.2019.104192 [Google Scholar] [CrossRef]
17. Tao, M., Hong, Z. X., Peng, K., Sun, P. W., Cao, M. Y. et al. (2019). Evaluation of excavation-damaged zone around underground tunnels by theoretical calculation and field test methods. Energies, 12(9), 1682. https://doi.org/10.3390/en12091682 [Google Scholar] [CrossRef]
18. Tian, M. L., Han, L. J., Meng, Q. B., Jin, Y. H., Meng, L. D. (2019). In situ investigation of the excavation-loose zone in surrounding rocks from mining complex coal seams. Journal of Applied Geophysics, 168(8), 90–100. https://doi.org/10.1016/j.jappgeo.2019.06.008 [Google Scholar] [CrossRef]
19. Wang, Y. Q., Chang, H. T., Wang, J. Y., Shi, X. L., Qiu, J. L. (2019). Countermeasures to treat collapse during the construction of road tunnel in fault zone: A case study from the Yezhuping tunnel in South Qinling, China. China Environmental Earth Sciences, 78(15), 464. https://doi.org/10.1007/s12665-019-8481-z [Google Scholar] [CrossRef]
20. Kruschwitz, S., Yaramanci, U. (2004). Detection and characterization of the disturbed rock zone in claystone with the complex resistivity method. Journal of Applied Geophysics, 57(1), 63–79. https://doi.org/10.1016/j.jappgeo.2004.09.003 [Google Scholar] [CrossRef]
21. Song, Z. W., Liu, H. Y., Tang, C. A., Kong, X. Y. (2021). Development of excavation damaged zones around a rectangular roadway under mining-induced pressure. Tunnelling and Underground Space Technology, 118(4), 104163. https://doi.org/10.1016/j.tust.2021.104163 [Google Scholar] [CrossRef]
22. Yang, Y. J., Wang, M., Wang, K. (2012). Test method and application of broken rock zone of roadway surrounding rock by borehole imaging. Advanced Materials Research, 524–527, 1213–1216. https://doi.org/10.4028/www.scientific.net/AMR.524-527.1213 [Google Scholar] [CrossRef]
23. Yao, Q. L., Xu, Q., Liu, J. F., Zhu, L., Li, D. W. et al. (2021). Post-mining failure characteristics of rock surrounding coal seam roadway and evaluation of rock integrity: A case study. Bulletin of Engineering Geology and the Environment, 80(2), 1653–1669. https://doi.org/10.1007/s10064-020-02018-z [Google Scholar] [CrossRef]
24. Huang, D., Zhong, Z., Kuang, X. B., Ma, W. Z. (2020). A method to identify the position of fracture surface in a rock slope based on multi-point extensometer monitoring. Arabian Journal of Geosciences, 13(3), 149. https://doi.org/10.1007/s12517-020-5093-6 [Google Scholar] [CrossRef]
25. Perras, M. A., Diederichs, M. S. (2016). Predicting excavation damage zone depths in brittle rocks. Journal of Rock Mechanics and Geotechnical Engineering, 8(1), 60–74. https://doi.org/10.1016/j.jrmge.2015.11.004 [Google Scholar] [CrossRef]
26. Qiao, D. P., Zhang, Z. S., Wang, S. H., Zhang, Y. B. (2006). Numerical modelling and assessment of excavation damaged zone around the underground excavations: A case study. Key Engineering Materials, 324–325, 77–80. https://doi.org/10.4028/www.scientific.net/KEM.324-325.77 [Google Scholar] [CrossRef]
27. Satici, O., Topal, T. (2021). Assessment of damage zone thickness and wall convergence for tunnels excavated in strain-softening rock masses. Tunnelling and Underground Space Technology, 108(2), 103722. https://doi.org/10.1016/j.tust.2020.103722 [Google Scholar] [CrossRef]
28. Shreedharan, S., Kulatilake, P. (2016). Discontinuum-equivalent continuum analysis of the stability of tunnels in a deep coal mine using the distinct element method. Rock Mechanics and Rock Engineering, 49(5), 1903–1922. https://doi.org/10.1007/s00603-015-0885-9 [Google Scholar] [CrossRef]
29. Xu, D. P., Huang, X., Li, S. J., Xu, H. S., Qiu, S. L. et al. (2021). Predicting the excavation damaged zone within brittle surrounding rock masses of deep underground caverns using a comprehensive approach integrating in situ measurements and numerical analysis. Geoscience Frontiers, 13(2), 101273. https://doi.org/10.1016/j.gsf.2021.101273 [Google Scholar] [CrossRef]
30. Yang, H. Q., Zeng, Y. Y., Lan, Y. F., Zhou, X. P. (2014). Analysis of the excavation damaged zone around a tunnel accounting for geostress and unloading. International Journal of Rock Mechanics and Mining Sciences, 69, 59–66. https://doi.org/10.1016/j.ijrmms.2014.03.003 [Google Scholar] [CrossRef]
31. Golshani, A., Oda, M., Okui, Y., Takemura, T., Munkhtogo, E. (2007). Numerical simulation of the excavation damaged zone around an opening in brittle rock. International Journal of Rock Mechanics and Mining Sciences, 44(6), 835–845. https://doi.org/10.1016/j.ijrmms.2006.12.005 [Google Scholar] [CrossRef]
32. Xia, H. B., Xu, Y., Zhang, Y. J. (2013). Numerical simulation and experimental analysis of roadway surrounding rock loose circle under blasting vibration. 2013 Fourth International Conference on Digital Manufacturing and Automation (ICDMA), pp. 850–854. Qingdao, China. https://doi.org/10.1109/ICDMA.2013.201 [Google Scholar] [CrossRef]
33. Yang, J. H., Lu, W. B., Hu, Y. G., Chen, M., Yan, P. (2015). Numerical simulation of rock mass damage evolution during deep-buried tunnel excavation by drill and blast. Rock Mechanics and Rock Engineering, 48(5), 2045–2059. https://doi.org/10.1007/s00603-014-0663-0 [Google Scholar] [CrossRef]
34. An, H. M., Liu, H. Y., Han, H. Y. (2020). Hybrid finite-discrete element modelling of excavation damaged zone formation process induced by blasts in a deep tunnel. Advances in Civil Engineering, 2020, 7153958. https://doi.org/10.1155/2020/7153958 [Google Scholar] [CrossRef]
35. Gao, C. L., Zhou, Z. Q., Li, Z. H., Li, L. P., Cheng, S. (2020). Peridynamics simulation of surrounding rock damage characteristics during tunnel excavation. Tunnelling and Underground Space Technology, 97(2), 103289. https://doi.org/10.1016/j.tust.2020.103289 [Google Scholar] [CrossRef]
36. Han, H. Y., Fukuda, D., Liu, H. Y., Salmi, E. F., Sellers, E. et al. (2020). Combined finite-discrete element modelling of rock fracture and fragmentation induced by contour blasting during tunnelling with high horizontal in-situ stress. International Journal of Rock Mechanics and Mining Sciences, 127(8), 104214. https://doi.org/10.1016/j.ijrmms.2020.104214 [Google Scholar] [CrossRef]
37. Kim, D. (2021). Large deformation finite element analyses in TBM tunnel excavation: CEL and auto-remeshing approach. Tunnelling and Underground Space Technology, 116(3), 104081. https://doi.org/10.1016/j.tust.2021.104081 [Google Scholar] [CrossRef]
38. Rodriguez, A. A., Kuhlmann, U., Marschall, P. (2019). 3D modelling of the excavation damaged zone using a marked point process technique. Geomechanics for Energy and the Environment, 17(9), 29–46. https://doi.org/10.1016/j.gete.2018.07.003 [Google Scholar] [CrossRef]
39. Ahmad, M., Kaminski, P., Olczak, P., Alam, M., Iqbal, M. J. et al. (2021). Development of prediction models for shear strength of rockfill material using machine learning techniques. Applied Sciences, 11(13), 6167. https://doi.org/10.3390/app11136167 [Google Scholar] [CrossRef]
40. Mahmoodzadeh, A., Mohammadi, M., Ibrahim, H. H., Noori, K. M. G., Abdulhamid, S. N. et al. (2021). Forecasting sidewall displacement of underground caverns using machine learning techniques. Automation in Construction, 123, 103530. https://doi.org/10.1016/j.autcon.2020.103530 [Google Scholar] [CrossRef]
41. Mahmoodzadeh, A., Mohammadi, M., Salim, S. G., Ali, H. F. H., Ibrahim, H. H. et al. (2022). Machine learning techniques to predict rock strength parameters. Rock Mechanics and Rock Engineering, 55(3), 1721–1741. https://doi.org/10.1007/s00603-021-02747-x [Google Scholar] [CrossRef]
42. Monjezi, M., Hesami, S. M., Khandelwal, M. (2011). Superiority of neural networks for pillar stress prediction in bord and pillar method. Arabian Journal of Geosciences, 4(5–6), 845–853. https://doi.org/10.1007/s12517-009-0101-x [Google Scholar] [CrossRef]
43. Qiu, Y. G., Zhou, J., Khandelwal, M., Yang, H. T., Yang, P. X. et al. (2021). Performance evaluation of hybrid WOA-XGBoost, GWO-XGBoost and BO-XGBoost models to predict blast-induced ground vibration. Engineering with Computers, 8(3), 297. https://doi.org/10.1007/s00366-021-01393-9 [Google Scholar] [CrossRef]
44. Shi, X. Z., Zhou, J., Wu, B. B., Huang, D., Wei, W. (2012). Support vector machines approach to mean particle size of rock fragmentation due to bench blasting prediction. Transactions of Nonferrous Metals Society of China, 22(2), 432–441. https://doi.org/10.1016/S1003-6326(11)61195-3 [Google Scholar] [CrossRef]
45. Soepangkat, B. O. P., Norcahyo, R., Effendi, M. K., Pramujati, B. (2020). Multi-response optimization of carbon fiber reinforced polymer (CFRP) drilling using back propagation neural network-particle swarm optimization (BPNN-PSO). Engineering Science and Technology, An International Journal, 23(3), 700–713. https://doi.org/10.1016/j.jestch.2019.10.002 [Google Scholar] [CrossRef]
46. Zhou, J., Li, X. B., Mitri, H. S. (2015). Comparative performance of six supervised learning methods for the development of models of hard rock pillar stability prediction. Natural Hazards, 79(1), 291–316. https://doi.org/10.1007/s11069-015-1842-3 [Google Scholar] [CrossRef]
47. Zhou, J., Li, X. B., Mitri, H. S. (2016). Classification of rockburst in underground projects: Comparison of ten supervised learning methods. Journal of Computing in Civil Engineering, 30(5), 65. https://doi.org/10.1061/(ASCE)CP.1943-5487.0000553 [Google Scholar] [CrossRef]
48. Zhou, J., Qiu, Y. G., Armaghani, D. J., Zhang, W. G., Li, C. Q. et al. (2021). Predicting TBM penetration rate in hard rock condition: A comparative study among six XGB-based metaheuristic techniques. Geoscience Frontiers, 12(3), 101091. https://doi.org/10.1016/j.gsf.2020.09.020 [Google Scholar] [CrossRef]
49. Liu, Y., Ye, Y. C., Wang, Q. H., Liu, X. Y. (2018). Stability prediction model of roadway surrounding rock based on concept lattice reduction and a symmetric alpha stable distribution probability neural network. Applied Sciences, 8(11), 2164. https://doi.org/10.3390/app8112164 [Google Scholar] [CrossRef]
50. Yu, Z., Shi, X. Z., Zhou, J., Huang, R. D., Gou, Y. G. (2020). Advanced prediction of roadway broken rock zone based on a novel hybrid soft computing model using gaussian process and particle swarm optimization. Applied Sciences, 10(17), 6031. https://doi.org/10.3390/app10176031 [Google Scholar] [CrossRef]
51. Zhao, G. Y., Wang, M., Liang, W. Z. (2022). A comparative study of SSA-BPNN, SSA-ENN, and SSA-SVR models for predicting the thickness of an excavation damaged zone around the roadway in rock. Mathematics, 10(8), 1351. https://doi.org/10.3390/math10081351 [Google Scholar] [CrossRef]
52. Dai, Y., Khandelwal, M., Qiu, Y. G., Zhou, J., Monjezi, M. et al. (2022). A hybrid metaheuristic approach using random forest and particle swarm optimization to study and evaluate backbreak in open-pit blasting. Neural Computing & Applications, 34(8), 6273–6288. https://doi.org/10.1007/s00521-021-06776-z [Google Scholar] [CrossRef]
53. Kumar, S., Mishra, A. K., Choudhary, B. S. (2022). Prediction of back break in blasting using random decision trees. Engineering with Computers, 38, 1185–1191. https://doi.org/10.1007/s00366-020-01280-9 [Google Scholar] [CrossRef]
54. Yu, Z., Shi, X. Z., Zhou, J., Chen, X., Qiu, X. Y. (2020). Effective assessment of blast-induced ground vibration using an optimized random forest model based on a harris hawks optimization algorithm. Applied Sciences, 10(4), 1403. https://doi.org/10.3390/app10041403 [Google Scholar] [CrossRef]
55. Zhou, J., Huang, S., Zhou, T., Armaghani, D. J., Qiu, Y. G. (2022). Employing a genetic algorithm and grey wolf optimizer for optimizing RF models to evaluate soil liquefaction potential. Artificial Intelligence Review, 55(7), 5673–5705. https://doi.org/10.1007/s10462-022-10140-5 [Google Scholar] [CrossRef]
56. Zhou, Y., Li, S. Q., Zhou, C., Luo, H. B. (2019). Intelligent approach based on random forest for safety risk prediction of deep foundation pit in subway stations. Journal of Computing in Civil Engineering, 33(1), 2065. https://doi.org/10.1061/(ASCE)CP.1943-5487.0000796 [Google Scholar] [CrossRef]
57. Ziegler, A., Konig, I. R. (2014). Mining data with random forests: Current options for real-world applications. Wiley Interdisciplinary Reviews-Data Mining and Knowledge Discovery, 4(1), 55–63. https://doi.org/10.1002/widm.1114 [Google Scholar] [CrossRef]
58. Mirjalili, S. (2016). Dragonfly algorithm: A new meta-heuristic optimization technique for solving single-objective, discrete, and multi-objective problems. Neural Computing & Applications, 27(4), 1053–1073. https://doi.org/10.1007/s00521-015-1920-1 [Google Scholar] [CrossRef]
59. Gulcu, S. (2022). Training of the feed forward artificial neural networks using dragonfly algorithm. Applied Soft Computing, 124, 109023. https://doi.org/10.1016/j.asoc.2022.109023 [Google Scholar] [CrossRef]
60. Jafari, M., Chaleshtari, M. H. B. (2017). Using dragonfly algorithm for optimization of orthotropic infinite plates with a quasi-triangular cut-out. European Journal of Mechanics-A/Solids, 66(1), 1–14. https://doi.org/10.1016/j.euromechsol.2017.06.003 [Google Scholar] [CrossRef]
61. Liang, T., Zhao, Q., Lv, Q. Z., Sun, H. X. (2021). A novel wind speed prediction strategy based on Bi-LSTM, MOOFADA and transfer learning for centralized control centers. Energy, 230(4), 120904. https://doi.org/10.1016/j.energy.2021.120904 [Google Scholar] [CrossRef]
62. Li, L. L., Zhao, X., Tseng, M. L., Tan, R. R. (2020). Short-term wind power forecasting based on support vector machine with improved dragonfly algorithm. Journal of Cleaner Production, 242(6), 118447. https://doi.org/10.1016/j.jclepro.2019.118447 [Google Scholar] [CrossRef]
63. Moayedi, H., Abdullahi, M. M., Nguyen, H., Rashid, A. S. A. (2021). Comparison of dragonfly algorithm and Harris hawks optimization evolutionary data mining techniques for the assessment of bearing capacity of footings over two-layer foundation soils. Engineering with Computers, 37(1), 437–447. https://doi.org/10.1007/s00366-019-00834-w [Google Scholar] [CrossRef]
64. Qiao, W. B., Moayedi, H., Foong, L. K. (2020). Nature-inspired hybrid techniques of IWO, DA, ES, GA, and ICA, validated through a k-fold validation process predicting monthly natural gas consumption. Energy and Buildings, 217, 110023. https://doi.org/10.1016/j.enbuild.2020.110023 [Google Scholar] [CrossRef]
65. Rahman, C. M., Rashid, T. A. (2019). Dragonfly algorithm and its applications in applied science survey. Computational Intelligence and Neuroscience, 2019, 9293617. https://doi.org/10.1155/2019/9293617 [Google Scholar] [PubMed] [CrossRef]
66. Ranjini, K. S. S., Murugan, S. (2017). Memory based hybrid dragonfly algorithm for numerical optimization problems. Expert Systems with Applications, 83(4), 63–78. https://doi.org/10.1016/j.eswa.2017.04.033 [Google Scholar] [CrossRef]
67. Das, D., Bhattacharya, A., Ray, R. N. (2020). Dragonfly algorithm for solving probabilistic economic load dispatch problems. Neural Computing & Applications, 32(8), 3029–3045.https://doi.org/10.1007/s00521-019-04268-9 [Google Scholar] [CrossRef]
68. Emambocus, B. A. S., Jasser, M. B., Mustapha, A., Amphawan, A. (2021). Dragonfly algorithm and its hybrids: A survey on performance, objectives and applications. Sensors, 21(22), 7542. https://doi.org/10.3390/s21227542 [Google Scholar] [PubMed] [CrossRef]
69. Breiman, L. (2001). Random forests. Machine Learning, 45(1), 5–32.https://doi.org/10.1023/A:1010933404324 [Google Scholar] [CrossRef]
70. Zhou, J., Dai, Y., Khandelwal, M., Monjezi, M., Yu, Z. et al. (2021). Performance of hybrid SCA-RF and HHO-RF models for predicting backbreak in open-pit mine blasting operations. Natural Resources Research, 30(6), 4753–4771. https://doi.org/10.1007/s11053-021-09929-y [Google Scholar] [CrossRef]
71. Liu, Y., Chen, H. Y., Zhang, L. M., Wang, X. J. (2021). Risk prediction and diagnosis of water seepage in operational shield tunnels based on random forest. Journal of Civil Engineering and Management, 27(7), 539–552. https://doi.org/10.3846/jcem.2021.14901 [Google Scholar] [CrossRef]
72. Rodriguez-Galiano, V. F., Ghimire, B., Rogan, J., Chica-Olmo, M., Rigol-Sanchez, J. P. (2012). An assessment of the effectiveness of a random forest classifier for land-cover classification. ISPRS Journal of Photogrammetry and Remote Sensing, 67(4), 93–104. https://doi.org/10.1016/j.isprsjprs.2011.11.002 [Google Scholar] [CrossRef]
73. Zhou, J., Dai, Y., Du, K., Khandelwal, M., Li, C. et al. (2022). COSMA-RF: New intelligent model based on chaos optimized slime mould algorithm and random forest for estimating the peak cutting force of conical picks. Transportation Geotechnics, 36(3), 100806. https://doi.org/10.1016/j.trgeo.2022.100806 [Google Scholar] [CrossRef]
74. Jing, Y., Wang, S., Lu, J. (2021). Thickness prediction of loose zone in rock excavation and criterion of non-explosive mechanized mining. Gold Science and Technology, 29, 525–534 (in Chinese). [Google Scholar]
75. Zhao, G. Y., Wu, H. (2013). Application of unascertained clustering method in the thickness prediction of excavation damaged zone. Science & Technology Review, 32, 50–55 (in Chinese). [Google Scholar]
76. Murlidhar, B. R., Nguyen, H., Rostami, J., Bui, X., Armaghani, D. J. et al. (2021). Prediction of flyrock distance induced by mine blasting using a novel Harris Hawks optimization-based multi-layer perceptron neural network. Journal of Rock Mechanics and Geotechnical Engineering, 13(6), 1413–1427. https://doi.org/10.1016/j.jrmge.2021.08.005 [Google Scholar] [CrossRef]
77. Paji, M. K., Gordan, B., Biklaryan, M., Armaghani, D. J., Zhou, J. et al. (2021). Neuro-swarm and neuro-imperialism techniques to investigate the compressive strength of concrete constructed by freshwater and magnetic salty water. Measurement, 182(4), 109720. https://doi.org/10.1016/j.measurement.2021.109720 [Google Scholar] [CrossRef]
78. Zhou, J., Qiu, Y. G., Zhu, S. L., Armaghani, D. J., Li, C. Q. et al. (2021). Optimization of support vector machine through the use of metaheuristic algorithms in forecasting TBM advance rate. Engineering Applications of Artificial Intelligence, 97(3), 104015. https://doi.org/10.1016/j.engappai.2020.104015 [Google Scholar] [CrossRef]
79. Li, C., Zhou, J., Tao, M., Du, K., Wang, S. et al. (2022). Developing hybrid ELM-ALO, ELM-LSO and ELM-SOA models for predicting advance rate of TBM. Transportation Geotechnics, 36(3), 100819. https://doi.org/10.1016/j.trgeo.2022.100819 [Google Scholar] [CrossRef]
80. Hasanipanah, M., Monjezi, M., Shahnazar, A., Armaghani, D. J., Farazmand, A. (2015). Feasibility of indirect determination of blast induced ground vibration based on support vector machine. Measurement, 75(3), 289–297. https://doi.org/10.1016/j.measurement.2015.07.019 [Google Scholar] [CrossRef]
81. Li, C. Q., Zhou, J., Khandelwal, M., Zhang, X. L., Monjezi, M. et al. (2022). Six novel hybrid extreme learning machine-swarm intelligence optimization (ELM-SIO) models for predicting backbreak in open-pit blasting. Natural Resources Research, 31(5), 3017–3039. https://doi.org/10.1007/s11053-022-10082-3 [Google Scholar] [CrossRef]
82. Armaghani, D. J., Harandizadeh, H., Momeni, E., Maizir, H., Zhou, J. (2022). An optimized system of GMDH-ANFIS predictive model by ICA for estimating pile bearing capacity. Artificial Intelligence Review, 55(3), 2313–2350. https://doi.org/10.1007/s10462-021-10065-5 [Google Scholar] [CrossRef]
83. Zhou, J., Huang, S., Qiu, Y. G. (2022). Optimization of random forest through the use of MVO, GWO and MFO in evaluating the stability of underground entry-type excavations. Tunnelling and Underground Space Technology, 124(12), 104494. https://doi.org/10.1016/j.tust.2022.104494 [Google Scholar] [CrossRef]
84. Armaghani, D. J., Yagiz, S., Mohamad, E. T., Zhou, J. (2021). Prediction of TBM performance in fresh through weathered granite using empirical and statistical approaches. Tunnelling and Underground Space Technology, 118(1), 104183. https://doi.org/10.1016/j.tust.2021.104183 [Google Scholar] [CrossRef]
85. Yong, W., Zhang, W., Nguyen, H., Bui, X. N., Choi, Y. et al. (2022). Analysis and prediction of diaphragm wall deflection induced by deep braced excavations using finite element method and artificial neural network optimized by metaheuristic algorithms. Reliability Engineering & System Safety, 221(4), 108335. https://doi.org/10.1016/j.ress.2022.108335 [Google Scholar] [CrossRef]
86. Asheghi, R., Shahri, A. A., Zak, M. K. (2019). Prediction of uniaxial compressive strength of different quarried rocks using metaheuristic algorithm. Arabian Journal for Science and Engineering, 44(10), 8645–8659. https://doi.org/10.1007/s13369-019-04046-8 [Google Scholar] [CrossRef]
87. Lu, X., Hasanipanah, M., Brindhadevi, K., Amnieh, H. B., Khalafi, S. (2020). ORELM: A novel machine learning approach for prediction of flyrock in mine blasting. Natural Resources Research, 29(2), 641–654. https://doi.org/10.1007/s11053-019-09532-2 [Google Scholar] [CrossRef]
88. Yari, M., Bagherpour, R., Jamali, S., Asadi, F. (2015). Selection of most proper blasting pattern in mines using linear assignment method: Sungun copper mine. Archives of Mining Sciences, 60(1), 375–386. https://doi.org/10.1515/amsc-2015-0025 [Google Scholar] [CrossRef]
89. Yari, M., Bagherpour, R., Jamali, S., Shamsi, R. (2016). Development of a novel flyrock distance prediction model using BPNN for providing blasting operation safety. Neural Computing & Applications, 27(3), 699–706. https://doi.org/10.1007/s00521-015-1889-9 [Google Scholar] [CrossRef]
90. Yari, M., Monjezi, M., Bagherpour, R. (2013). Selecting the most suitable blasting pattern using AHP-TOPSIS method: Sungun copper mine. Journal of Mining Science, 49(6), 967–975. https://doi.org/10.1134/S1062739149060178 [Google Scholar] [CrossRef]
91. Li, E. M., Yang, F. H., Ren, M. H., Zhang, X. L., Zhou, J. et al. (2021). Prediction of blasting mean fragment size using support vector regression combined with five optimization algorithms. Journal of Rock Mechanics and Geotechnical Engineering, 13(6), 1380–1397. https://doi.org/10.1016/j.jrmge.2021.07.013 [Google Scholar] [CrossRef]
92. Zorlu, K., Gokceoglu, C., Ocakoglu, F., Nefeslioglu, H. A., Acikalin, S. (2008). Prediction of uniaxial compressive strength of sandstones using petrography-based models. Engineering Geology, 96(3–4), 141–158. https://doi.org/10.1016/j.enggeo.2007.10.009 [Google Scholar] [CrossRef]
93. Zhou, J., Li, E. M., Wei, H. X., Li, C. Q., Qiao, Q. Q. et al. (2019). Random forests and cubist algorithms for predicting shear strengths of rockfill materials. Applied Sciences, 9(8), 1621. https://doi.org/10.3390/app9081621 [Google Scholar] [CrossRef]
Cite This Article
 Copyright © 2023 The Author(s). Published by Tech Science Press.
This work is licensed under a Creative Commons Attribution 4.0 International License , which permits unrestricted use, distribution, and reproduction in any medium, provided the original work is properly cited.
 Downloads
 Citation Tools