
 Submit a Paper
 Propose a Special lssue
 Open Access
ARTICLE

A Systematic Approach for Exploring Underground Environment Using LiDAR-Based System
1
Industrial Innovation & Robotics Center, University of Tabuk, Tabuk, 71491, Saudi Arabia
2
Faculty of Computers & Information Technology, University of Tabuk, Tabuk, 71491, Saudi Arabia
* Corresponding Authors: Tareq Alhmiedat. Email: ; Abdelrahman Osman Elfaki. Email:
Computer Modeling in Engineering & Sciences 2023, 136(3), 2321-2344. https://doi.org/10.32604/cmes.2023.025641
Received 23 July 2022; Accepted 25 November 2022; Issue published 09 March 2023
 View Full Text
 Download PDF
Abstract
Agricultural projects in different parts of the world depend on underground water wells. Recently, there have been many unfortunate incidents in which children have died in abandoned underground wells. Providing topographical information for these wells is a prerequisite to protecting people from the dangers of falling into them, especially since most of these wells become buried over time. Many solutions have been developed recently, most with the aim of exploring these well areas. However, these systems suffer from several limitations, including high complexity, large size, or inefficiency. This paper focuses on the development of a smart exploration unit that is able to investigate underground well areas, build a 3D map, search for persons and animals, and determine the levels of oxygen and other gases. The exploration unit has been implemented and validated through several experiments using various experiment testbeds. The results proved the efficiency of the developed exploration unit, in terms of 3D modeling, searching, communication, and measuring the level of oxygen. The average accuracy of the 3D modeling function is approximately 95.5%. A benchmark has been presented for comparing our results with related works, and the comparison has proven the contributions and novelty of the proposed system’s results.Keywords
Agricultural regions depend on groundwater, where this water often is sourced from deep underground wells. Due to the passage of time and continuous consumption, many of these wells dry up and are abandoned. Once this happens, some of the wells are obliterated with the ground, but others may retain a very narrow entrance, which makes them unnoticeable and thus extremely dangerous.
To safely handle old wells, a number of variables must be identified about both the well itself and its surrounding environment. These include depth, internal dimensions, external aperture diameter, terrain, internal content, internal soil type, proportion, and the density of gases inside the well. Unfortunately, this information is often unknown or undocumented. Therefore, it is necessary to find a way to obtain this information about these wells, including a way to safely explore them to obtain missing data.
There are many technical solutions to this problem. Prior studies have suggested robotic explorer solutions. In addition, many academic and industrial works have provided successful theories, methods, algorithms, and hardware to solve the complexities of exploring deep wells and caves [1–3]. Unfortunately, all these solutions have a relatively high cost that might not be accessible for local populations. One possible solution to this is light detection and ranging (LiDAR) data, which can be collected from laser sensors detecting the reflections of a pulsed laser beam. Recently, the LiDAR data has been employed in diverse types of applications. For instance, the work presented in [4] involves an efficient, model-free approach for detecting and tracking moving objects using 3D LiDAR scans.
Though well exploration can be easy for humans, it is a hard mission for robotic sensors, which are exploring unknown environments. Developing a cost-effective, autonomous robot that can explore deep wells is an academic and technical challenge. Creating robots that can explore obscure environments and also distinguish between different objects within that environment—tasks that both require expensive sensors, using limited calculation power to keep the device small enough to remain mobile—are among the most serious issues that specialists face, in this field [5,6]. These tasks are further complicated by the necessity of performing multiple tasks using different subsystems, which increases power consumption and is additionally limiting [7].
Interest in smart underground exploration units has increased in recent years. This is because these units can be used in extraterrestrial investigations as well as in emergency situations, including search and rescue operations, disaster responses, and infrastructure examinations. Smart exploration is particularly useful in wells, mines, tunnels, and caves, especially in risky areas like constrained spaces. In those situations, the proposed unit is a very beneficial tool to extract data, in real-time, that is easy to analyze and interpret in the base station; it also provides precise 3D mapping within underground wells.
This research addresses the problem of undiscovered wells. Because there is limited data about these wells, there is a critical need to explore them to obtain information about their locations, depths, heights, and other geography and topography data. These wells’ topography has a changeable nature, and frequent updates are needed to keep local populations safe. However, collecting such information manually is impossible, as some wells are not easily accessible by, or safe for, humans. Autonomous robots are a safer solution, but it is expensive to develop a suitable device, which is not affordable for many populations.
In robotics, the exploration problem has been defined as an attempt to gain knowledge about a specific area. Exploration by robots has been useful in dealing with hazardous environments that cannot be accessed by humans for safety reasons [8]. In these environments, an autonomous robot is an appropriate solution. In robotics, there are three overlapping scientific terms that are important in this area:
• Exploring: Exploration is the search for unknown objects or places in a certain area [9]. The difference between navigation and exploration is that in navigation, the location of the target is known. However, in exploration, the robot needs to search the entire environment to find a missing object or place. This requires path optimization and planning to search the entire environment in the shortest time possible.
• Localization: Localization is the ability of the robot to determine its position in the surrounding environment [10]. There are two ways to find one’s current location: externally and internally. External identification uses a global positioning system (GPS), and internal uses the robot’s sensors. Typically, the localization process goes into the following three stages. First, the robot detects obstacles already known in the environment. Second, it determines the range between the robot and these obstacles. Third, it calculates the intersection of the obstacles to find the exact position of the robot. Usually, at least three obstacles are required to achieve an accurate localization.
• Navigation: Navigation is the process of reaching a desired location from another location within the environmental map [11]. Navigation systems can be categorized into three main groups: geometric-based, semantic-based, and hybrid approaches [12]. To achieve navigation, the robot needs to localize and map its location in the surrounding environment to then navigate to the desired spot.
• Mapping: Mapping is the process of modeling the surrounding environment [13]. The robot builds a map of the environment to know exactly where the obstacles are. This is essential to determine the location of the robot in context to the surrounding environment.
These concepts are important in creating a systematic approach for exploring the wells, to both define their topography and internal states.
Authors of [14,15] demonstrated the applicability and efficiency of robotic exploratory capabilities in complex environments by using a LiDAR-based system that has been used on simulated and real environments. Authors of [3] provided a competitive survey on LiDAR-SLAM based sensor technologies. Their results showed remarkable challenges in using the LiDAR-SLAM system, which were: 1) LiDAR could not provide accurate localization due to a lack of precision; 2) LiDAR suffered from time complexity in performing and computing the gathered data; 3) the accuracy of location was more accurate in 3D than 2D and 4) LiDAR could not easily identify one specific object out of a group of objects. For instance, it was not easy for LiDAR to identify a shape as either a human or a rock. To understand a well’s features, then, autonomous robot designs must account for these challenges.
This article’s proposed solution overcomes the challenges of LiDAR while keeping the cost and technologies accessible. The developed device will provide a clear picture of the internal contents of the wells; this device will provide a fast and safe method for exploring dangerous places. The main contributions of this paper are as follows:
• This article reviews recently developed exploration methods, which have been implemented to scan underground and well environments.
• It then develops an efficient exploration system in terms of software and hardware requirements.
• The article then tests the developed system in real well areas to evaluate its efficiency and accuracy.
• It also develops a benchmark for evaluating future solutions that address the challenges of exploring underground environments.
This paper uses the following structure. Section 2 presents related works, which have been discussed and analyzed to highlight the research gap. Section 3 presents the technical design of the proposed systematic approach. The system architecture is presented and discussed in Section 4. Section 5 illustrates the implementation of the proposed systematic approach in two different environments: synthetic and natural. Section 6 presents the results. Section 7 contains the discussion and conclusion.
This section presents related works on autonomous robots. The methodology that has been followed for the collection of the recent developed systems, was carried out as follows:
1. Determine the source of related research (Where to search). Since the goal is to collect high-quality research papers, then, “Google Scholar” was chosen as the search engine.
2. Set the time frame. In computer science, ten years is considered as a sufficient period for research in a field to reach maturity. Therefore, the search for suitable related works was limited to the period between 2016 and 2022.
3. Define the search term. The search term is a key concept in selecting successful related works and preventing valuable works from being overlooked. It directly affects the results obtained from the analysis of related works. The search terms used to collect related works in this paper are: 1) (“LiDAR + underground”), 2) (“LiDAR + mines”), 3) (“robot + mines”), 4) (“robot or Lidar + deep environment”), 5) “robot + underground +exploring”, “robot + wells + exploring”, and “exploring + robot”).
4. Define exclusion criteria. The articles collected in the previous steps were filtered according to two exclusion criteria, namely: 1) The papers in which ideas are repeated were omitted, i.e., all papers that do not discuss any new concept or application in the field of exploring underground environment using LiDAR. 2) The papers deal with exploring underground environments with expensive and complicated systems. 3) All papers that dealt with underground pipes, underground water, underground water caves, and oil or gas wells.
As the results from the methodology that have been used for collecting related works, several research papers have been acquired. In the following, these works have been discussed and analyzed.
Authors of [16] developed mobile robot navigation in undetermined static environments by using adaptive neuro fuzzy inference system. The experiment was developed based on MATLAB simulations, implemented in real time, using C/C++ languages.
In [17], authors proposed a comprehensive system for autonomous mapping and navigating underground mines using aerial robots. This work collected informative and useful data from deep mines using a LiDAR system, assembled with visual and thermal cameras as well as an inertial measurement unit. The work presented in [18] used an unmanned aerial vehicle (UAV) equipped with a 2D LiDAR system for exploring complex environments. Their system was developed and evaluated based on a hardware-in-the-loop (HitL) simulation environment. Authors of [19] designed and developed a multi-robot heterogeneous exploration system to search for people and objects of interest in underground areas. Their work was evaluated based on efficiency, which was defined by the number of objects found and the accuracy of their position estimation.
A large-scale, LiDAR autonomous exploration system was presented in [20] for subterranean environments. Their experiments showed that the great challenge in real environments was a communication system, i.e., sending and receiving data from the robot.
Authors of [21] conducted experiments for investigating localization and navigation control strategies. Their results showed that the LiDAR odometry demonstrated the most systematic performance, in addition to having a high feasibility.
The work presented in [22] includes the development of a six-wheeled robot rover to explore rough terrain. It was controlled by software developed using the Robot Operating System (ROS). It is not clear how the developed robot rover was validated and evaluated.
In [23], authors developed an intelligent system to find the location of an autonomous driving robot in an underground environment. Their results showed the necessity of obstacle avoidance and path planning algorithms in real environments. In other words, applying the proposed solutions in simulation only will not provide accurate results. Authors of [24] dealt with the problem of inspecting underground facilities with their developed wheeled robot chain control system. In [25], authors developed an integrated system for exploration and path planning based on a multi-goal rapidly exploring random trees (RRT). This work was implemented in a simulated operating environment. Authors of [26] developed a method based on frontier selection in GPS-denied, confined spaces for underground facilities.
The work presented in [27] employed noisy sensor data and perform SLAM to build a 3D map for underground environment. In [28], authors proposed a real-time method to extract 3D ego-motion by using flow constraint and point patch covariance equations. This method used the structured data provided by rotating LiDARs. Authors of [29] generated results proved that LiDAR system is significantly more efficient for underground environment when compared to classical systems. The work presented in [30] involves an improvement of LeGO-LOAM by using SegMatch the results showed better accuracy in loopback detection. The performance is tested using the KITTI dataset. In [31], authors developed a system that aims to monitor and model underground cavities. Authors of [32] developed a system for exploring the tunnel wall convergence and correlated the movement to geological circumstances.
In [33], authors developed a small-size autonomous driving robot for unmanned environmental monitoring in underground mines, where the developed robot system controls the steering based on an array of sensors, including LiDAR, an inertial measurement unit and encoders to estimate the location and the distance travelled by the robot.
Table 1 shows an analysis of the related works, where the purpose and used technology of each work are presented.
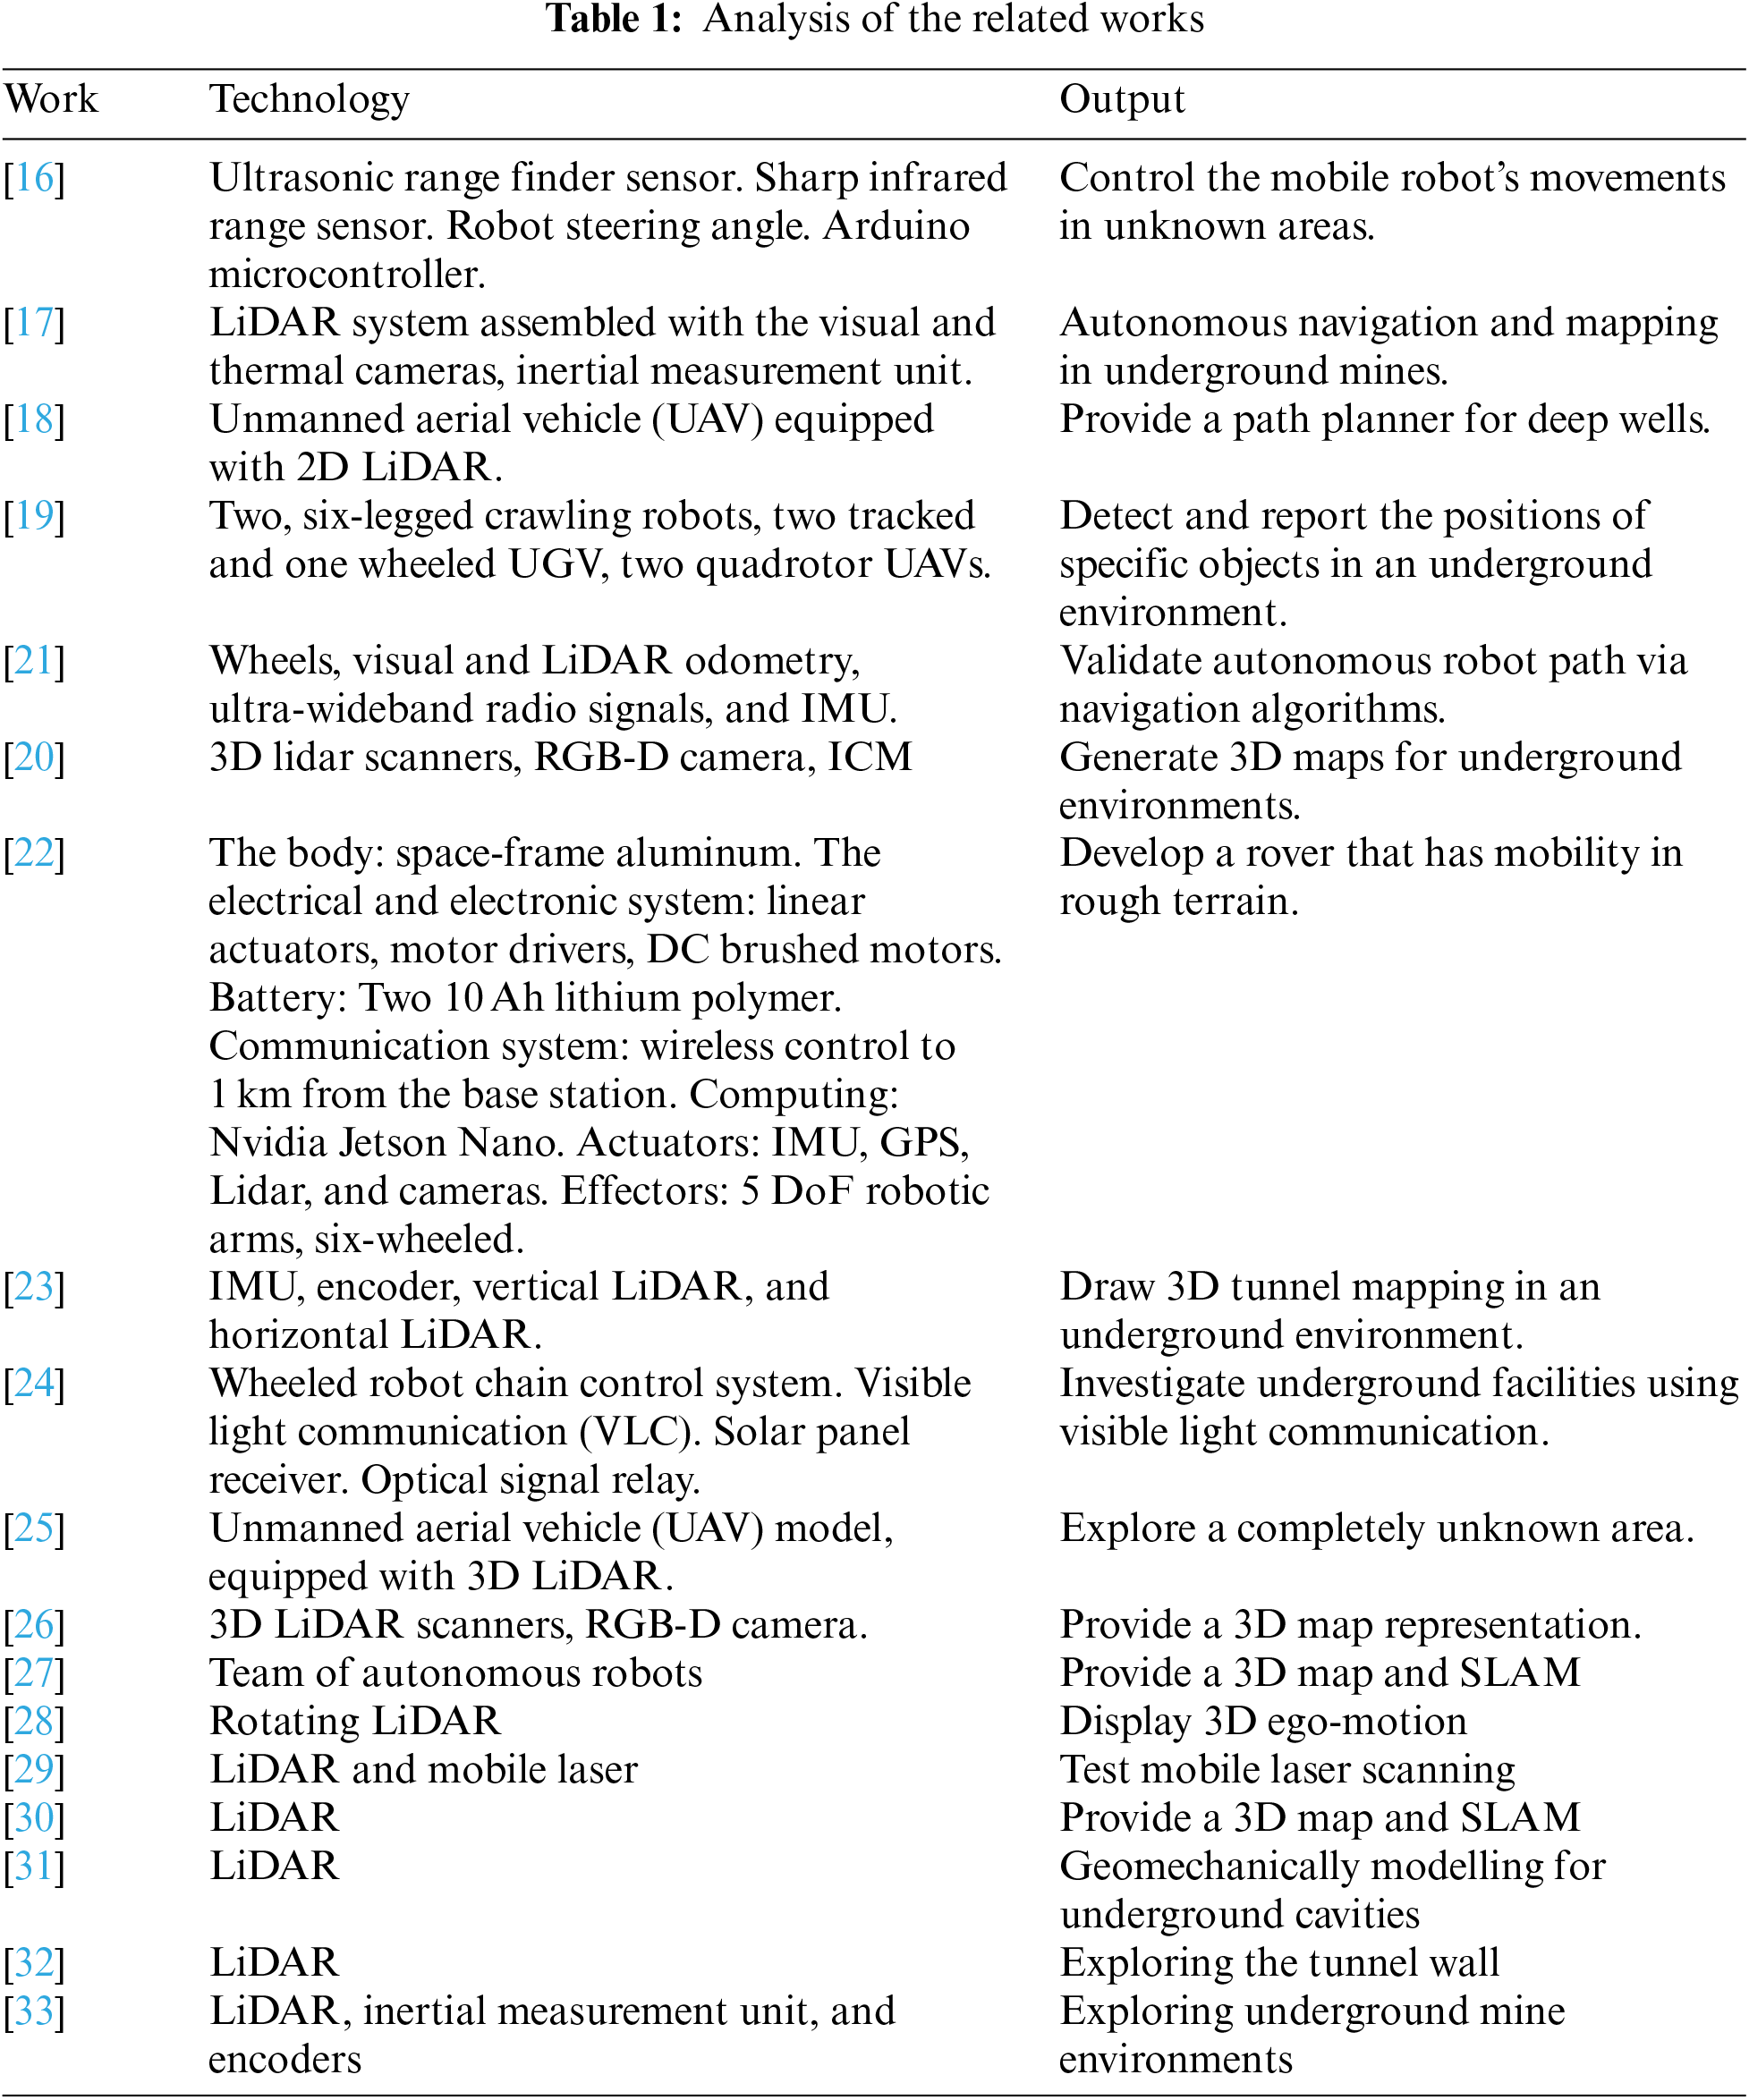
According to these studies, the challenges, and difficulties of exploring underground environment are as follows:
• The possible presence of combinations of darkness, dust, and smoke.
• The possible presence of existence of water.
• The possible presence of gases.
• The possible presence of wireless communication and cable restrictions in underground environments.
• The difficulty of recognizing live objects inside unknown and unstructured environments.
• The challenge of generating highly accurate 3D maps for uneven terrains.
• The challenge of providing a validation of the extracted results based on experiments in real environments (vs. simulations).
• Accuracy. Solving any real-time problem by processing sensors’ inputs requires accuracy to be successful. Hence, defining accuracy is a must.
As is evident from previous works, the above challenges readily occur in underground environments; therefore, developing a solution to address them simultaneously is needed. The importance of this is compounded by researchers, such as the work presented in [24,34]. Both studies emphasize that underground environments must be investigated regularly to be able to use the collected data safely in the long run. Hence, creating an affordable and portable system to tackle the above challenges is crucial.
3 Well Exploration System Design
This section discusses the design of the proposed system by presenting and explaining its framework and functionalities.
Fig. 1 shows the framework of the proposed system. The framework consists of two parts which are the exploration unit, and the user monitoring unit. The exploration unit has three functions: searching, scanning, and measuring the level of gases in the well area. The searching process is concerned with identifying both the contents of the well in addition to whether or not it contains living organisms, whereas the second process—the scanning process—is concerned with exploring the topography of the well such as its width, depth, and terrain. Finally, the system measures gas levels, focusing primarily on three: oxygen, carbon monoxide, and carbon dioxide.
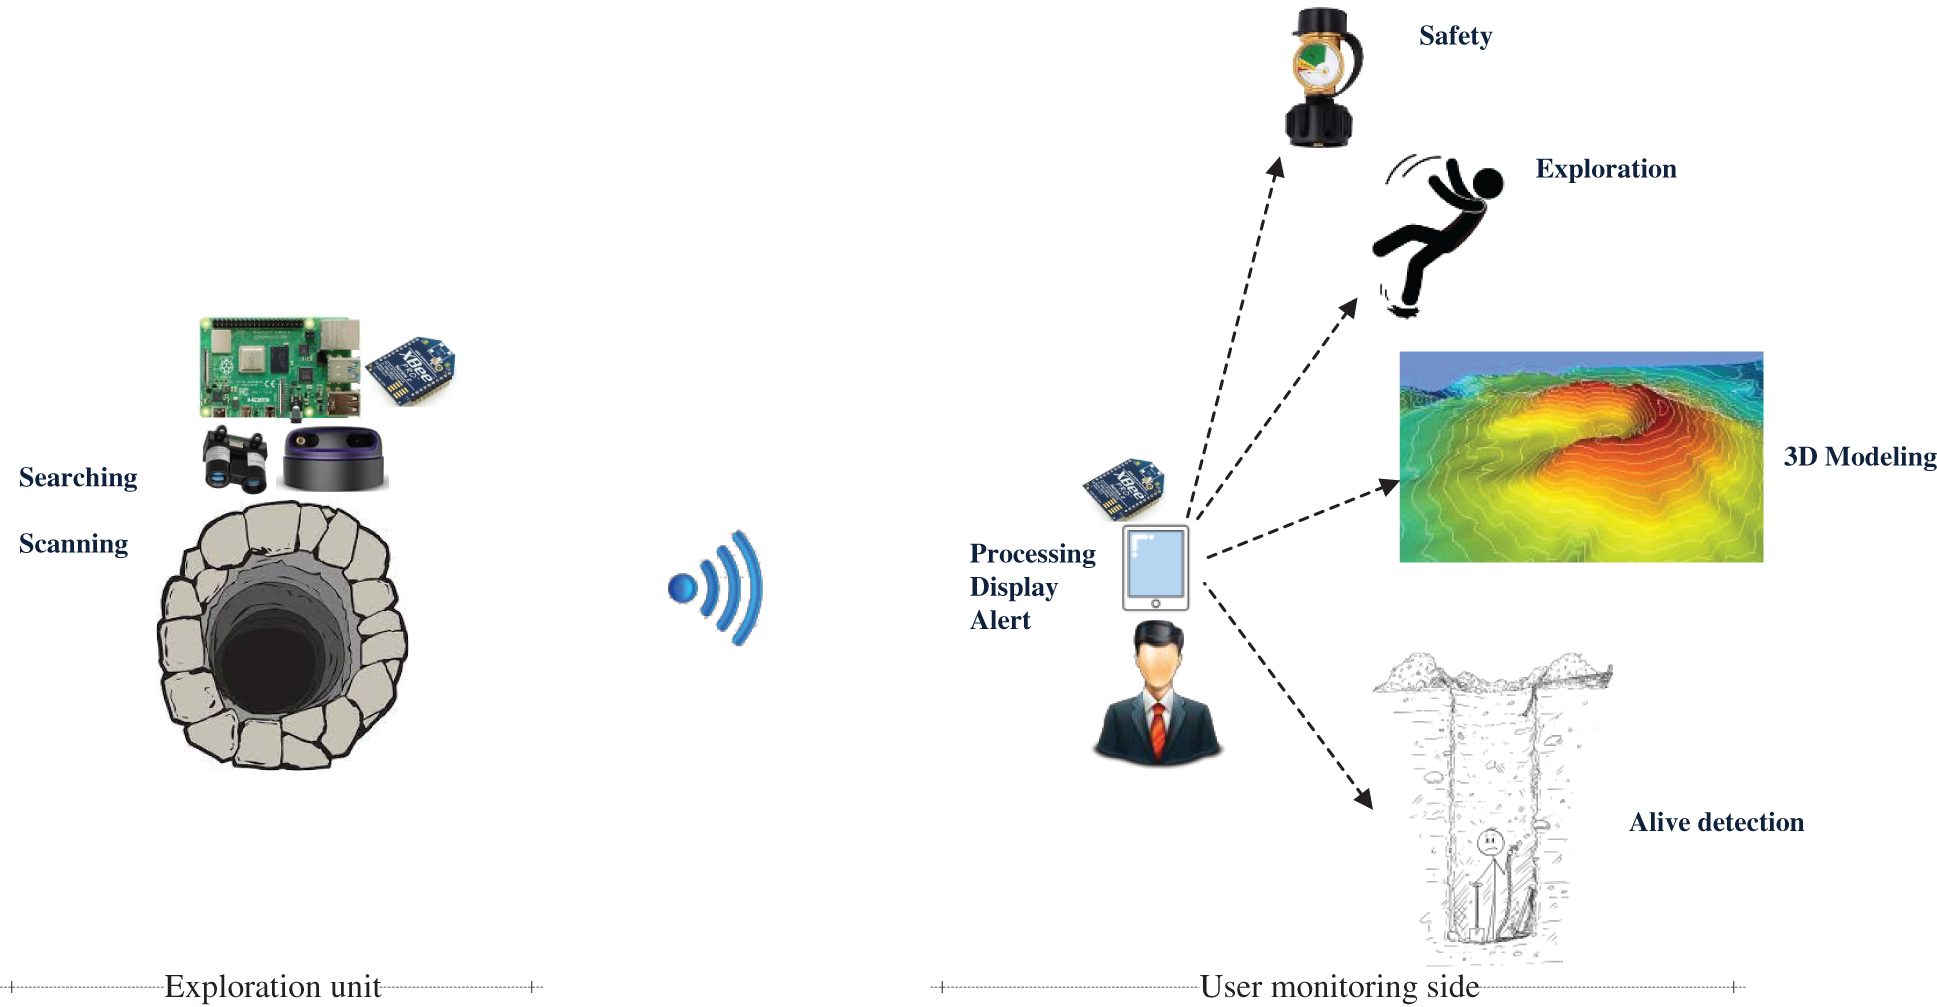
Figure 1: The framework of the proposed system
The scanning, searching, and measuring processes all take advantage of data collected using onboard sensors, such as RPLidar, LiDAR light, digital cameras, thermal cameras, and oxygen and air quality sensors. The collected information is then transmitted through a long-range ZigBee communication to the user monitoring the robot.
On the user monitoring side, the received information is processed through two functions, which display the well’s topography in 3D, and alert the user to the presence of live objects and the levels of different valuable gases.
The proposed exploration system requires a wide range of functionalities in order to perform the 3D modelling, searching, and alerting tasks. Fig. 2 shows the system functionalities of the proposed system, identifying its main functions along with the associated sensor device required to perform that function. The proposed exploring system scans the well area horizontally using a RPLidar A3 module, and vertically using the LiDAR light module, in order to build a 3D model shape of the well area. The collected data is processed on the Raspberry Pi computer, and a 3D model is formed. At the same time, a digital camera scans for living persons or animals using a smart human detection system, while a thermal camera scans for heat signatures, to augment the visuals. The developed system then measures the levels of oxygen, carbon monoxide, and carbon dioxide.
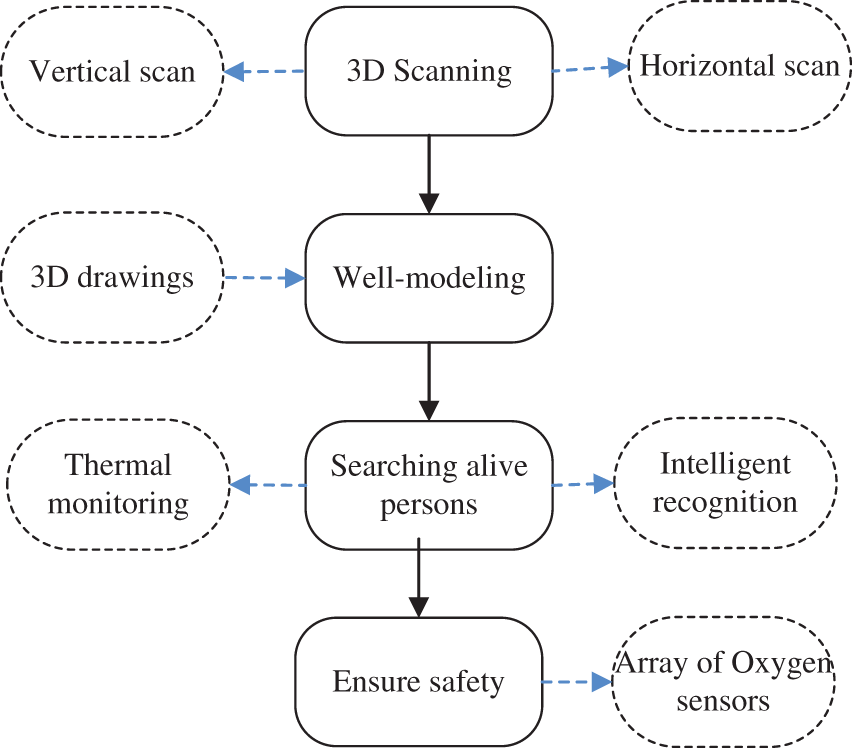
Figure 2: The system architecture of the proposed system
Fig. 3 shows the four modules needed to implement the proposed system. The main functions offered are as follows:
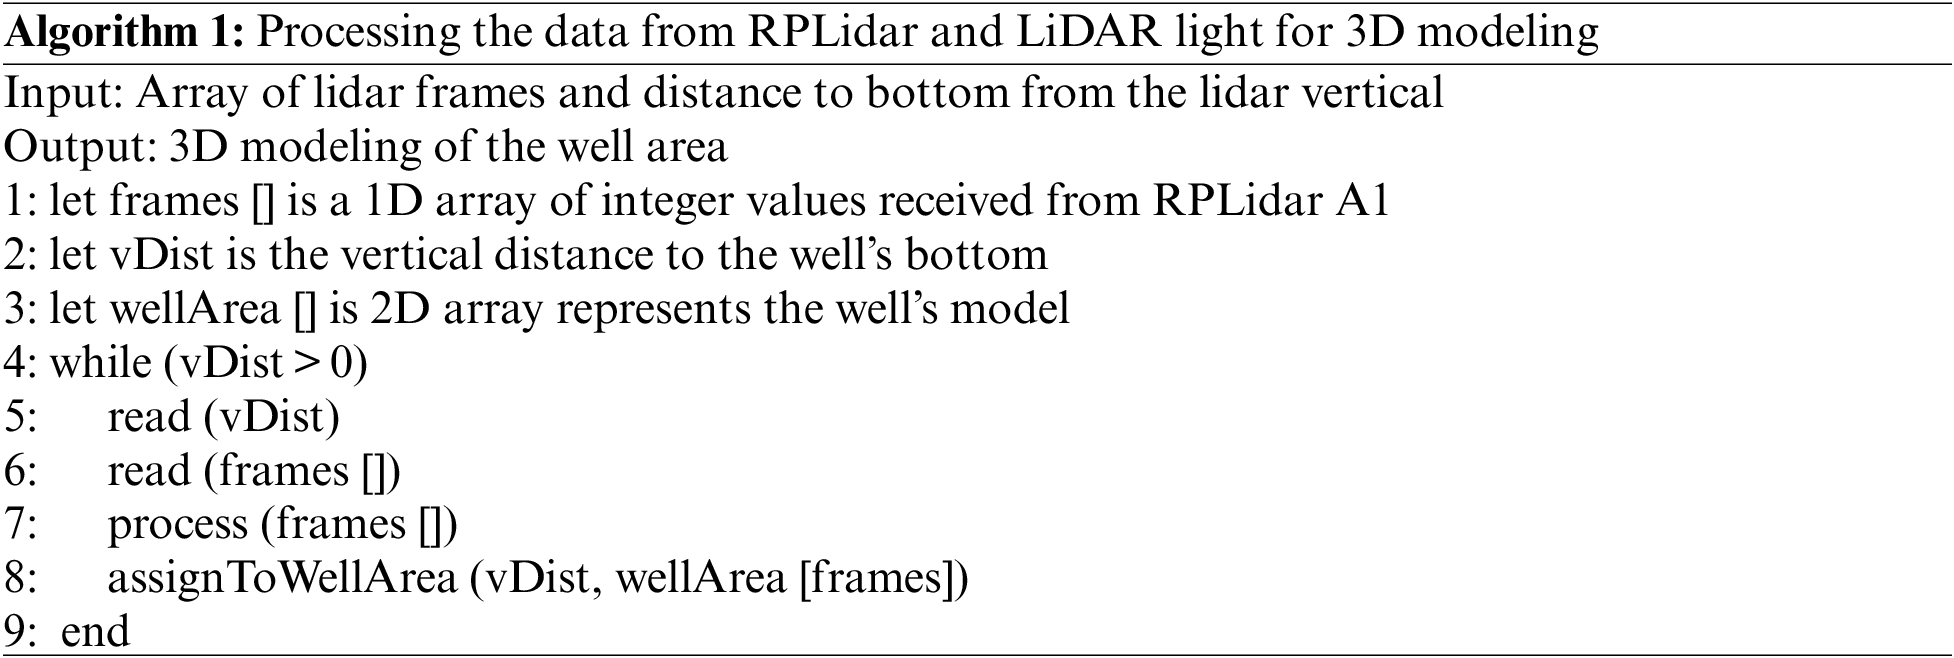
1. Well 3D modelling module: This includes an efficient method to model the well area using advanced sensing technologies and an intelligent system to compute and draw the dimensions of the well area. The 3D modelling system is based on two different technologies: the depth and the width sensor information. The depth sensor can measure the distance between the exploration unit and the bottom of the well, whereas the width sensor can measure the distance between the exploration unit and the inner walls of the well. The combination of these technologies offers an efficient 3D modelling function. Authors of [35] revealed that 3D model segmentation is largely useful in several tasks, including shape deformation, texture mapping, shape partial matching, and skeleton extraction. Algorithm 1 presents the 3D modelling code for generating the 3D shape of the well area.
2. Human detection module: This module involves two intelligent methods (vision and thermal cameras) to identify and localize any persons or animals in the well area. The former involves a high-resolution digital camera equipped with a human detection system for identifying humans in the well area, whereas the latter involves a thermal camera that is used to detect the presence of humans and animals in the well area in the absence of a light source. The data received from both systems are processed in the Raspberry Pi computer, and the final decision is transmitted to the base station.
3. Safety module: This includes a smart unit to measure the level of oxygen in the well area, through an array of oxygen sensors, in order to estimate the period of time that the available oxygen will last. A smart function is adopted to measure the level of oxygen at different depths of the well. The collected oxygen data is processed and analyzed in the base-station unit, and the most significant data is transmitted to the base station and displayed to the user.
4. Broadcast module: This includes a long-range transceiver system to allow for long communication between the exploration device and the base station. All communications are processed through a long-range ZigBee protocol, where several live datapoints are transmitted to the base station simultaneously. ZigBee is a common tool for IoT applications, because it provides essential features, such as security, range, and connectivity. Moreover, a ZigBee protocol offers several fault-tolerance mechanisms that ensure the integrity of the data exchanged between the exploration and base-station units. An efficient exchange function is implemented to transfer the collected data from an onboard sensor to the base station (including LiDAR, vision, and oxygen data). This is a vital feature of the developed system when the user needs to obtain online data from the exploration unit about the whole situation in the well area, in order to allow the rescuers to make suitable decisions quickly.
5. Base-station processing module: This module gathers and processes the received data from the sensors on the exploration device. The base station includes a smart graphical user interface (GUI) system that displays the data received from the onboard sensors in a human-friendly way. It displays the 3D model of the well area, the existence of humans or animals, and the level of oxygen.
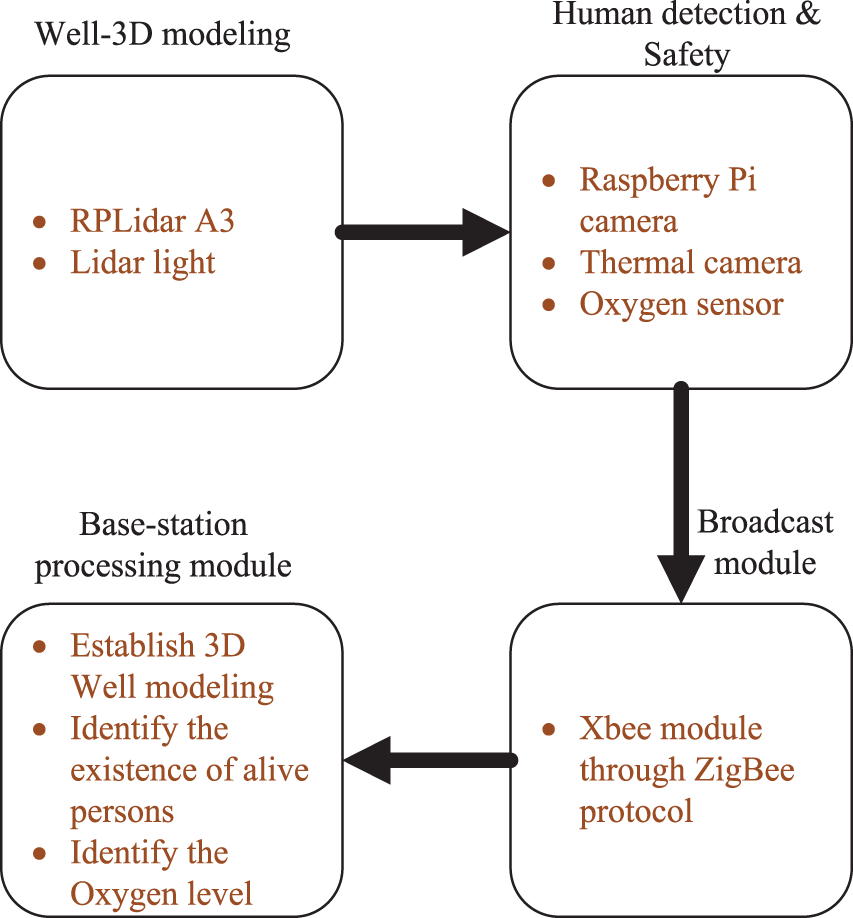
Figure 3: The main modules for the well-explorer system
The developed smart well-explorer system aims to detect and identify the presence of live persons in well areas. It also 3D-scans and models them. This section discusses the hardware and software requirements for developing this well explorer device.
The exploring device is able to explore and form a 3D dimensional shape of the well area. The device consists of four main units as presented in Fig. 4: an array of sensors, a processing device, a communication protocol, and a power supply.
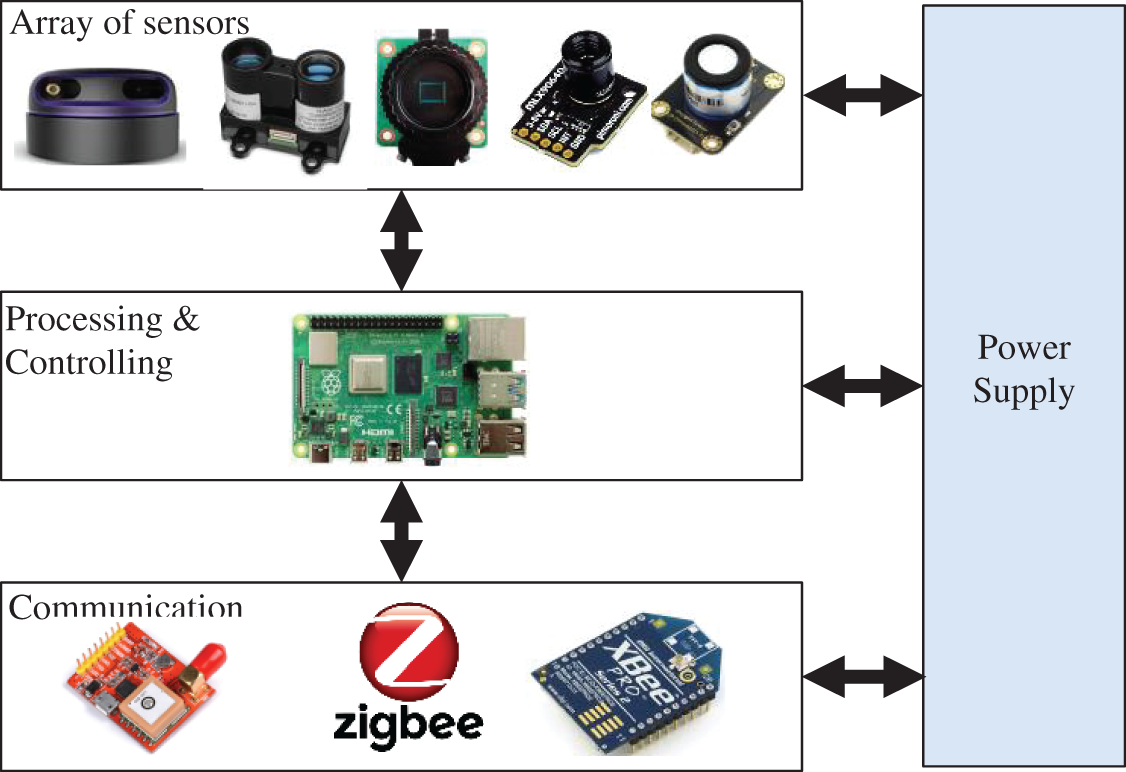
Figure 4: Exploration unit architecture
1. Array of sensors: An array of efficient and reliable sensors is equipped to 3D-scan the well area, and to identify and locate live persons. These sensors include a RPLidar A3, LiDAR light, a digital camera, a thermal camera, and oxygen sensors.
2. Processing device: A small-size, low-power consumption Raspberry Pi 4 computer is employed in the exploration unit.
3. Communication protocol: A long-range ZigBee wireless communication protocol is employed to allow for fast and reliable communication between the exploration and the base-station units. The exploration unit employs a ZigBee router component in order to transmit all the processed sensor data to the base station, whereas the base-station unit uses a ZigBee coordinator that starts and manages the ZigBee network, and then receives the sensed data from the exploration unit. In addition, GPS is employed to obtain the coordinates of the well location.
4. Power supply: A battery is attached to the exploration unit in order to feed the array of sensors, processor, and communication modules with the necessary required energy.
The base station (monitoring unit) consists of a friendly GUI to allow communication between the exploration unit and the base station. The developed GUI allows the user to monitor and control the exploration device at several levels. The GUI has been developed using the Tkinter library. Tkinter offers a fast, reliable, and easy way to create GUI, and it is the standard GUI library for Python. Tkinter offers a powerful, object-oriented interface to the Tk GUI toolkit.
This section presents the hardware and software requirements needed to develop the exploration and monitoring units. The developed system consists of two main units: the exploration unit and the monitoring unit. The two units communicate through the ZigBee protocol, which supports long-range data transfer, to exchange the required data between the exploration and the monitoring units.
The exploration unit is presented in Fig. 5. The shape of the exploration unit allows it to move smoothly in the area of interest, so that the unit will not get stuck in the well area, even though large stones may limit its movement. As presented in Fig. 5 below, the bottom of the exploration unit consists of a water buoy to protect the onboard sensors (LiDAR, digital camera, and thermal camera) from water and solid stones in the well area.
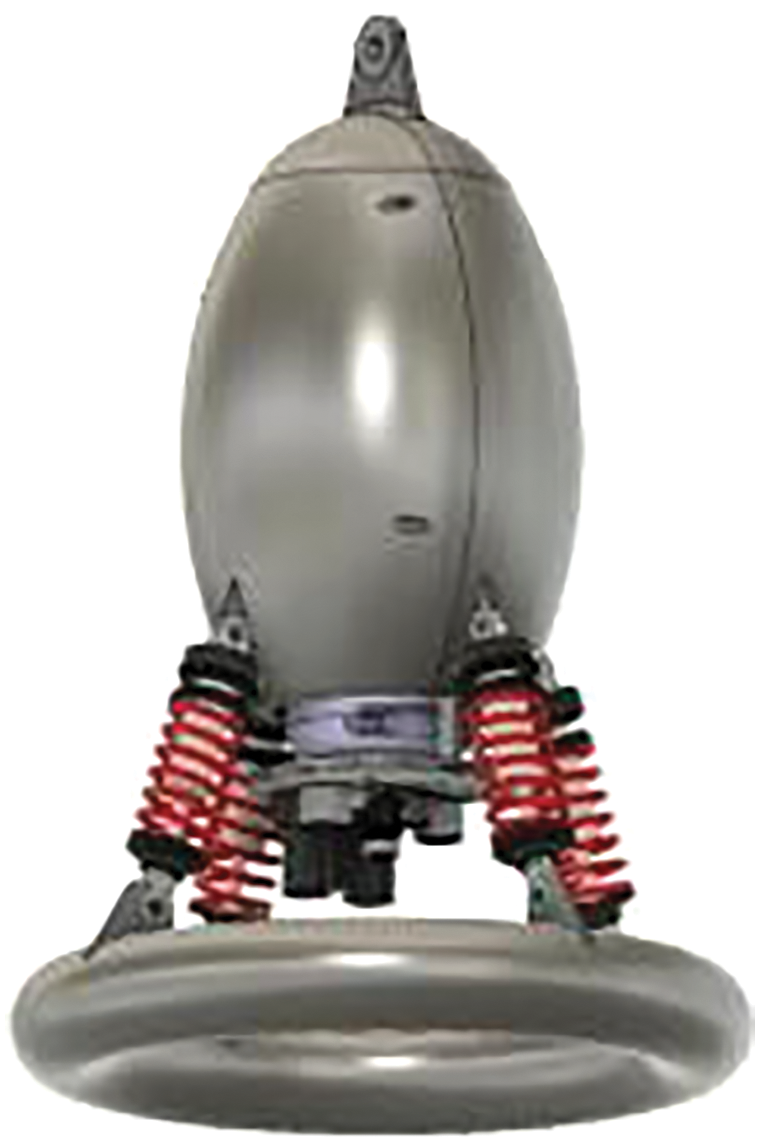
Figure 5: The 3D design of the exploration unit
Fig. 6 presents the inner workings of the exploration unit, including the Raspberry Pi computer, and the electronic equipment needed for the system. The inner computer and equipment are protected by plastic material, to keep it safe from the outside environment. The bottom view of the exploration unit is presented in Fig. 7, where the attached sensors are shown below.
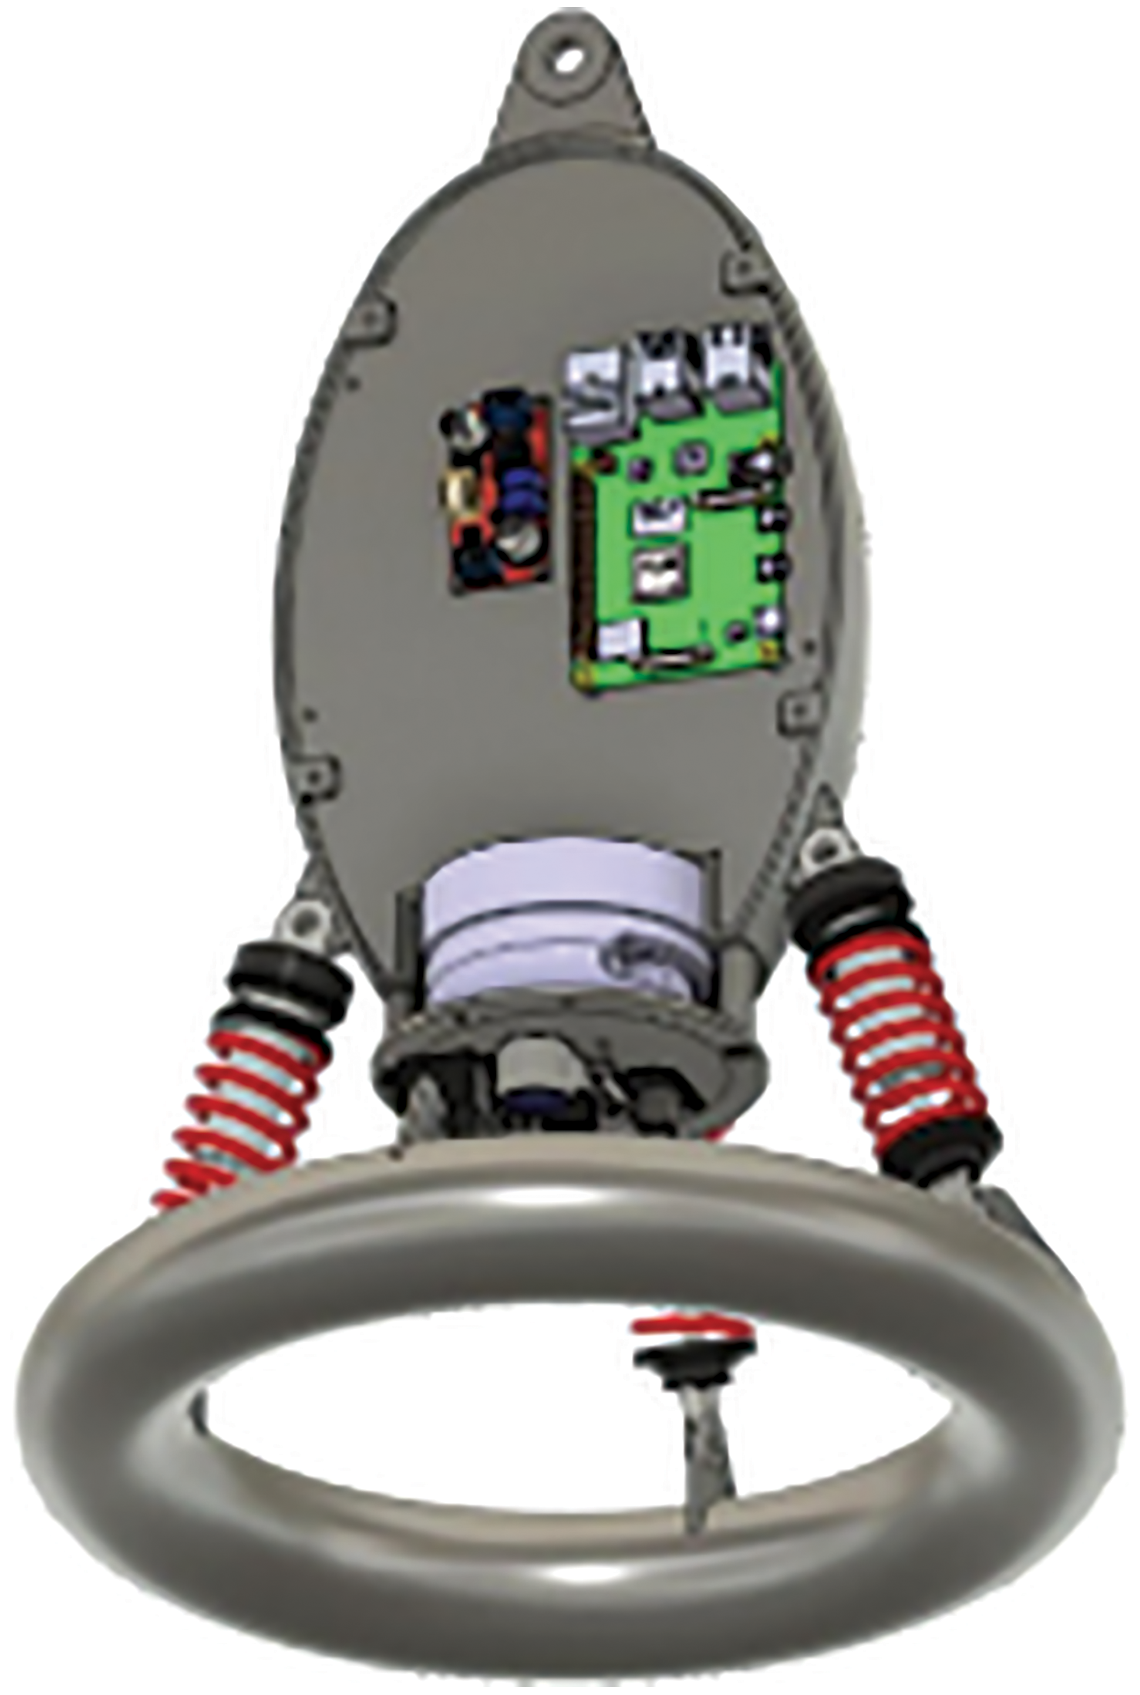
Figure 6: The inner side-view of the exploration unit
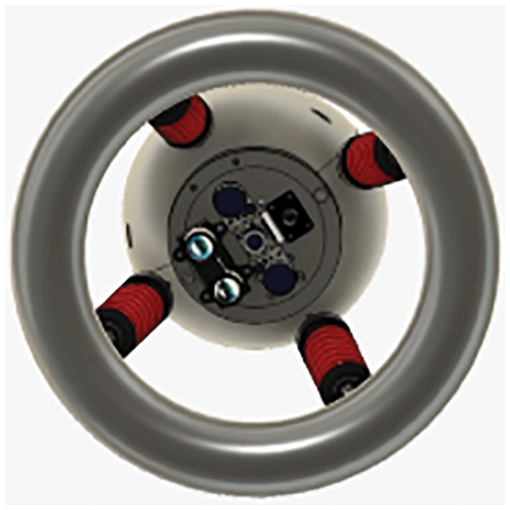
Figure 7: The bottom side-view of the exploration unit
Finally, Fig. 8 presents the actual exploration unit with all its components and sensors. The body of the exploration unit is printed using a 3D printer and polylactic acid (PLA) filament, while the water buoy part is printed using a thermoplastic polyurethane (TPU) filament to offer the design flexibility and to allow the buoy to float on the water, to protect the electronic components.
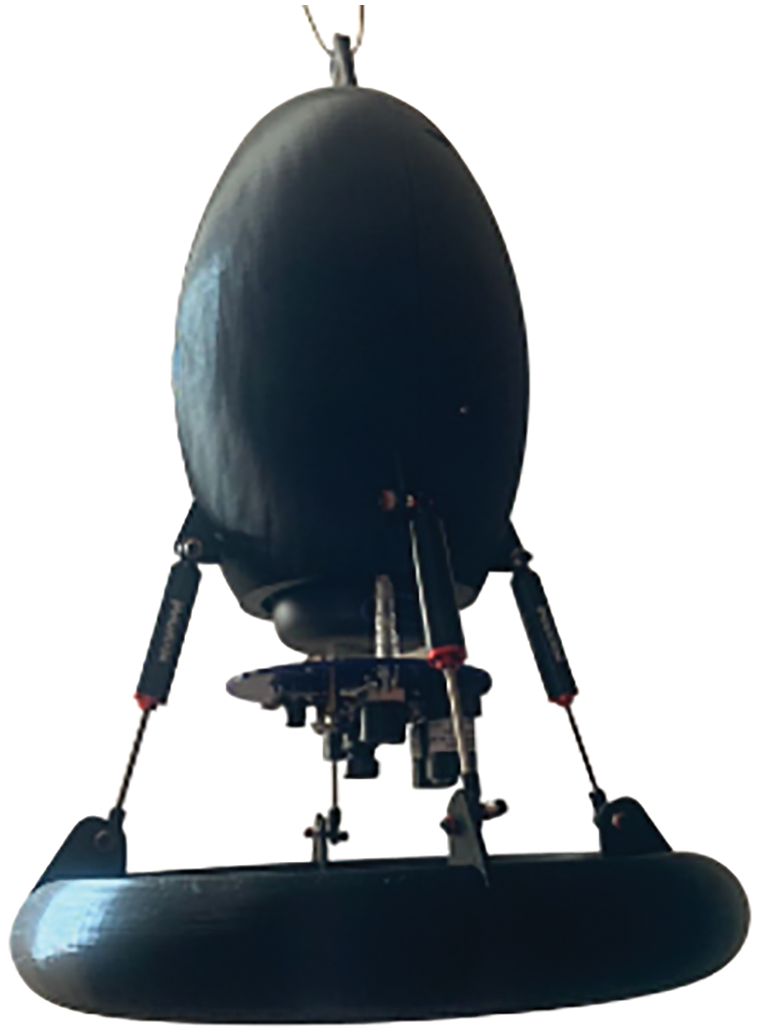
Figure 8: The developed exploration unit
The developed exploration unit may be used by rescue or exploration teams. This unit is useful whenever a well area needs to be explored, or a rescue team needs to search for live persons or animals. In addition, the developed system can be used to monitor gases in a well area (for example: measuring the amount of oxygen at different depths). The developed system has been tested by the General Authority for Survey and Geospatial Information in the Kingdom of Saudi Arabia.
In terms of software implementation, the proposed system uses a Python-based GUI that is presented in Fig. 9; it offers a friendly GUI to give flexibility and reliability to any user who might interact with the system. As shown in Fig. 9, the developed GUI consists of four main parts, as follows:
1. 3D well modelling: The GUI receives the sensed data from two sensors, the RPLidar A3 and the LiDAR light, in order to build the 3D model. The RPLidar A3 scans the well area horizontally, whereas the LiDAR light scans the well area vertically. The two sets of data integrate to show the well area in 3D.
2. Display the scene from the digital camera: The attached digital camera presents the scene inside the well area and transmits an array of images to the GUI in order to display the scene to the user. In addition, the GUI detects autonomously the presence of humans inside the well area using a human detection system and alerts the user as soon as a human has been detected.
3. Display the thermal scene: In addition to the scene received from the attached digital camera, a thermal camera is attached to detect the presence of humans or animals in the well area when the digital camera fails to detect them (for instance, in dark regions).
4. Measure the level of oxygen: One of the significant functions in the developed exploration system is that it displays the level of oxygen by measuring different levels of the well area, in order to estimate how long the available oxygen will last. The results are displayed on the GUI.
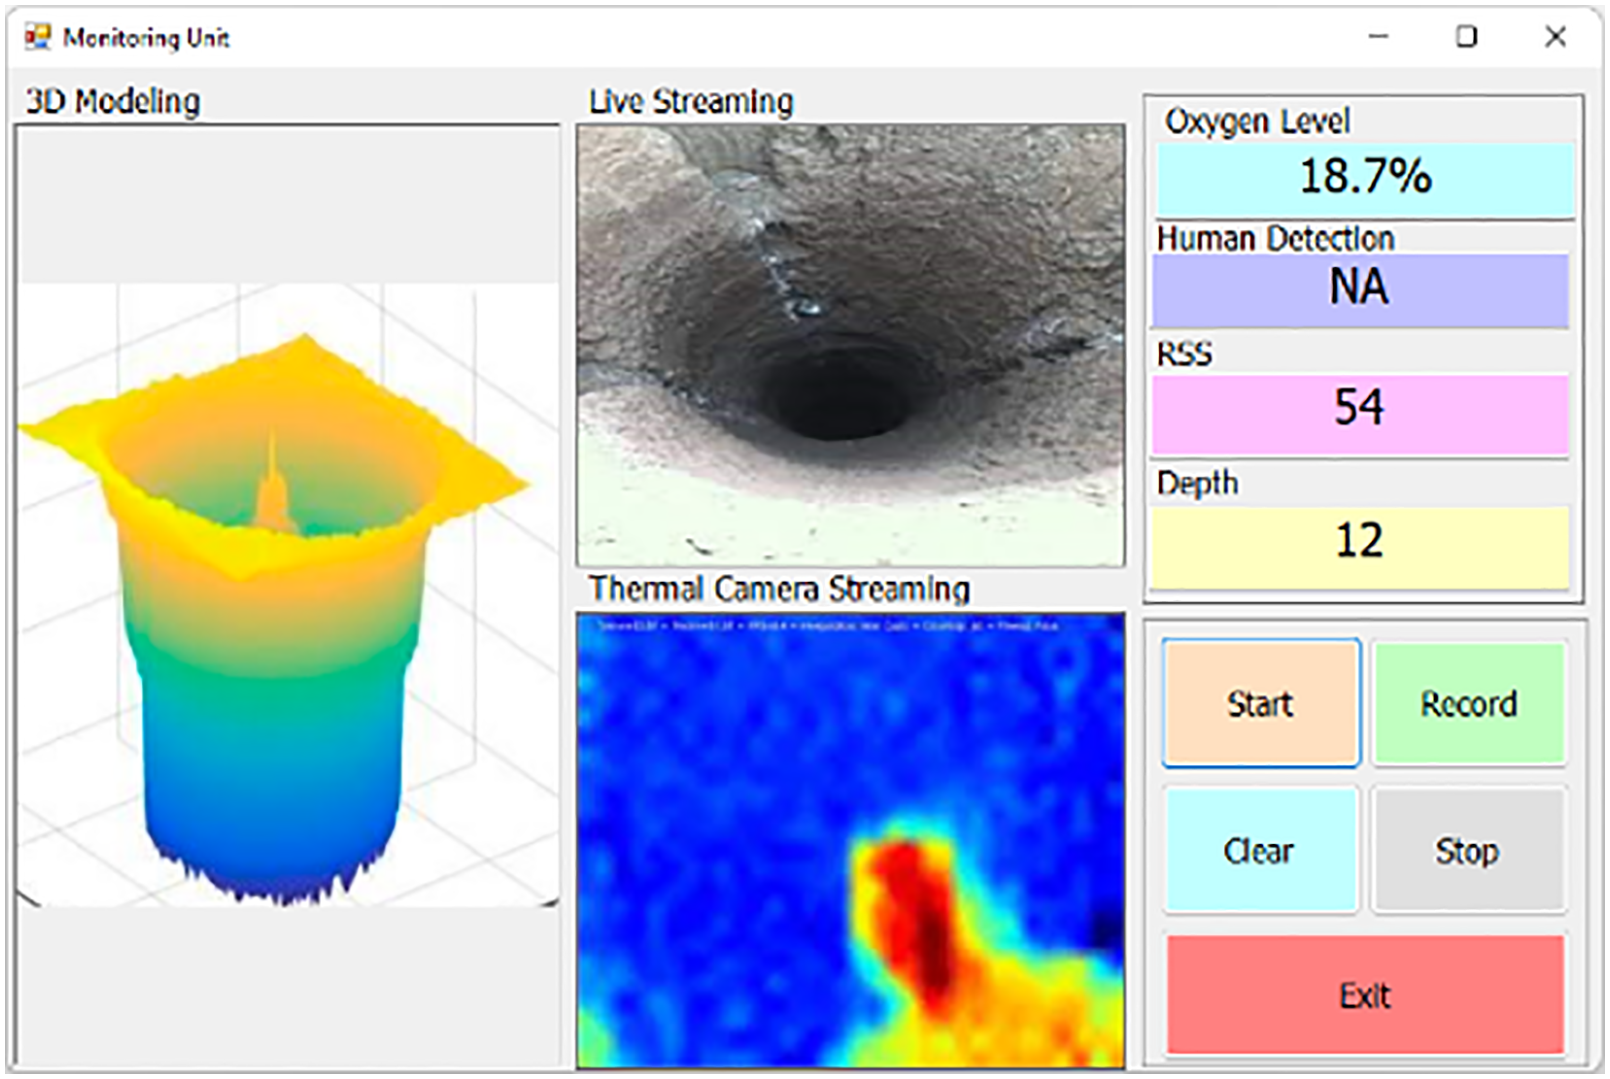
Figure 9: The developed GUI of the monitoring unit
This section discusses the results obtained from several experiments conducted in a number of well areas. For evaluation purposes, this research assessed the system efficiency in terms of the 3D modelling accuracy, communication range, the system’s ability to measure the levels of oxygen in different areas, and the efficiency of the live streaming unit (specifically the thermal and digital cameras). The developed systematic exploration system is evaluated according to several factors:
1. 3D modelling: This assesses the performance of the 3D modelling function to create a 3D model of the well areas. The 3D modelling subsystem has been tested in two different places, as discussed later in this section.
2. Transmission range: The communication range is a significant factor, to guarantee that the sensed data has been received successfully by the monitoring unit.
3. Measuring the level of oxygen: This shows the ability of the exploration unit to measure the amount of oxygen in different places within the well.
4. Data exchange: This includes assessing the number of received frames per second, the ability to obtain data from the thermal camera, and to display a live scene on the monitoring unit to the user.
5. Packet loss: This involves measuring the average number of packets that have been lost during the transmission process between the exploration unit and the monitoring station, for a certain period of time.
First, the 3D modelling function was evaluated. In terms of the 3D modelling accuracy, the developed exploration unit has been tested in three different areas (a simulated equal cylinder, real well area, and unequal cylinder) to assess the performance of the 3D modelling. Table 2 shows the specifications for each well area. The equal cylinder shape is presented in Fig. 10 with an identical shape, whereas Fig. 11 depicts the real well area, where the exploration system has been tested. Fig. 12 presents the real shape for the unequal cylinder.
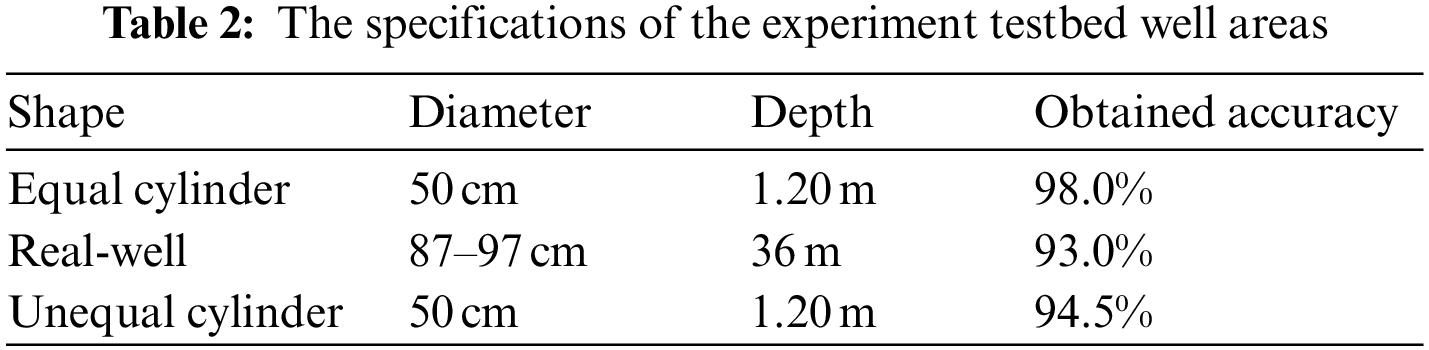
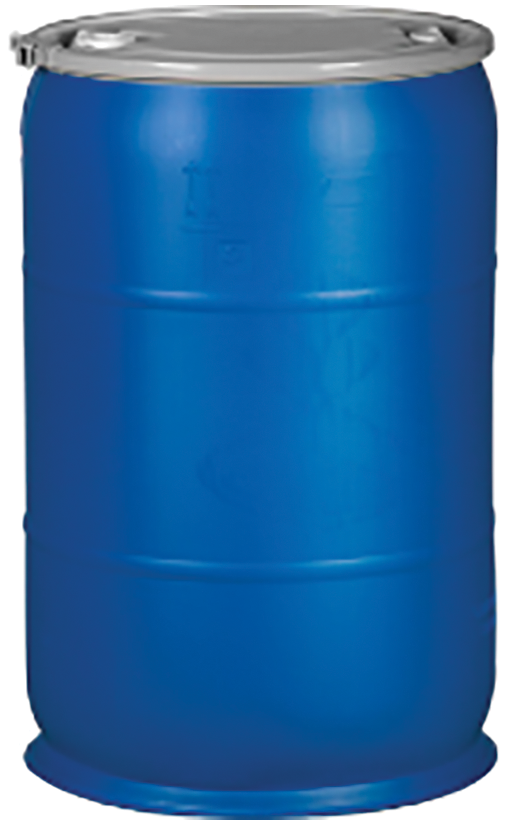
Figure 10: Cylinder area shape
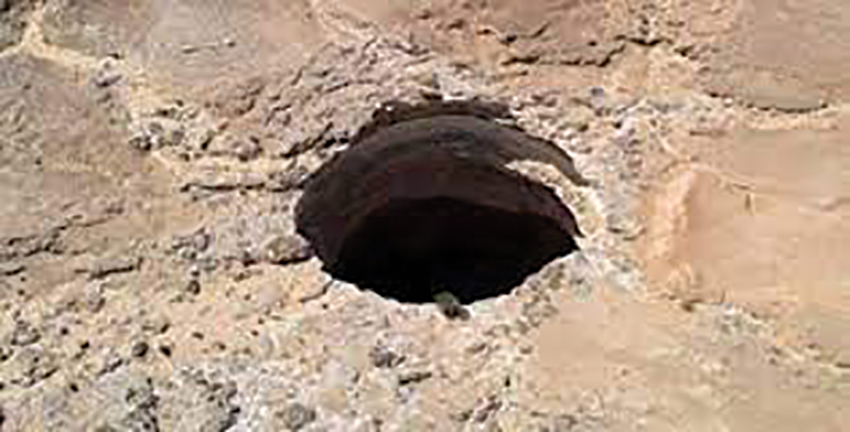
Figure 11: The real view of the well area
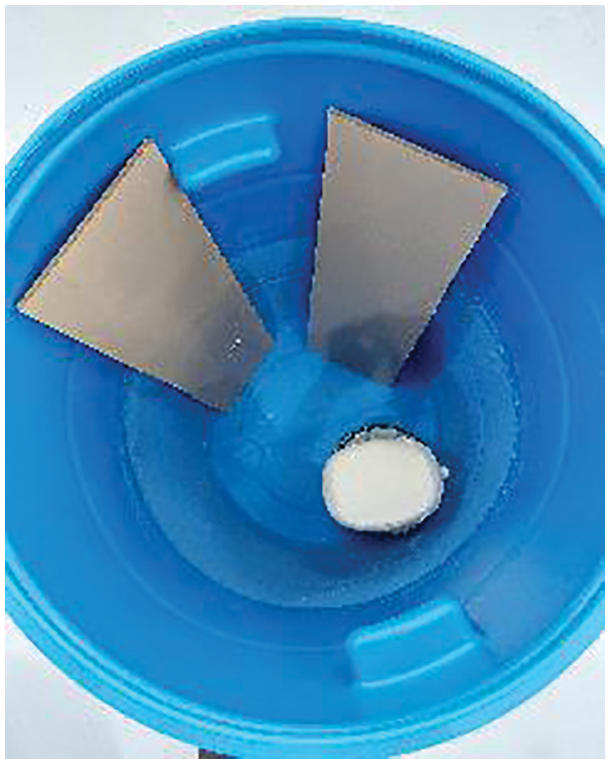
Figure 12: The real view of the unequal cylinder shape
The 3D model for each experiment testbed has been achieved after processing the 3D modelling function. Fig. 13 shows the 3D drawing for the cylinder shape using the exploration system with a 3D modelling accuracy of almost 98%. In addition, Fig. 14 presents the 3D modelling accuracy for the real well area with an accuracy of 93%. Finally, Fig. 15 shows the 3D modeling shape for the unequal cylinder with an accuracy of almost 94.5%. For evaluation purposes, the modelling accuracy was estimated based on measuring the difference between the 3D shape obtained from the developed exploration unit and the 3D shape for the same well, collected from the General Authority for Survey and Geospatial Information in the Kingdom of Saudi Arabia.
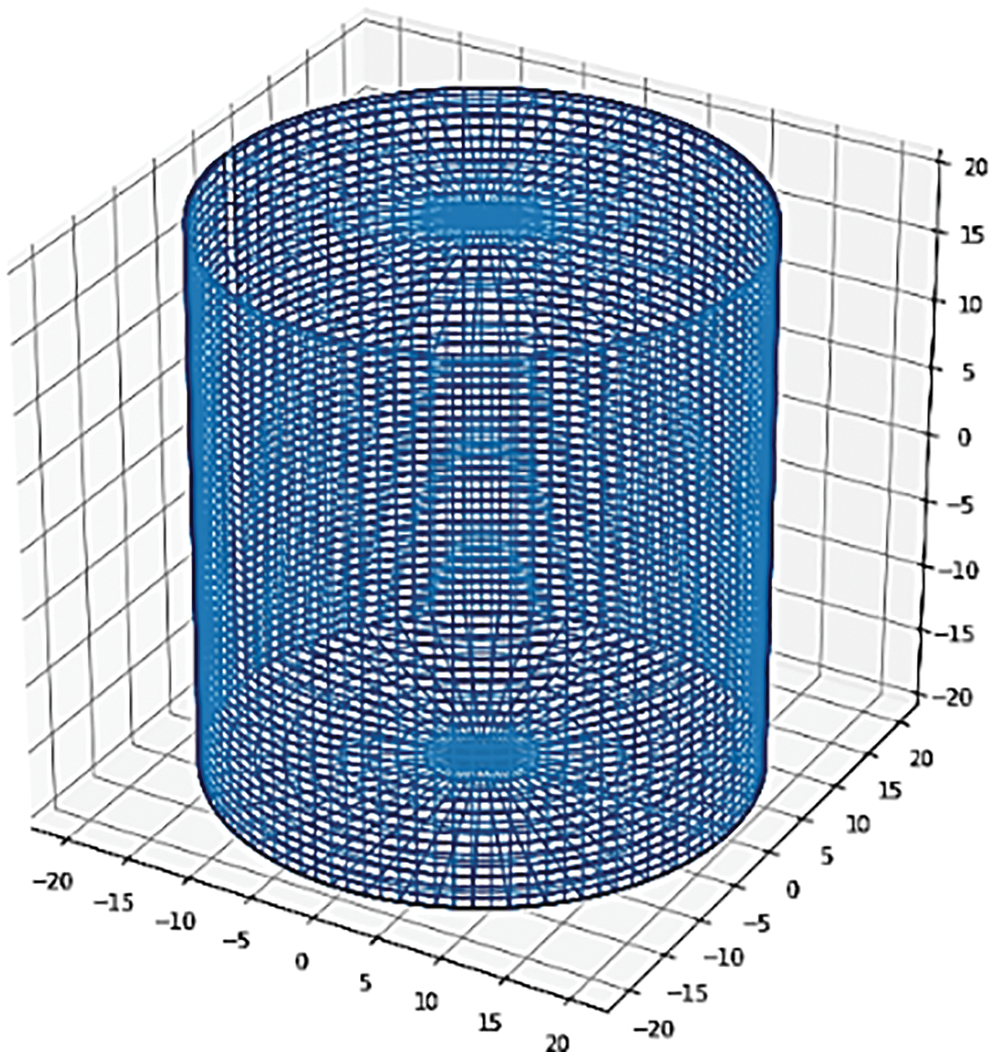
Figure 13: The 3D-modelled cylinder shape
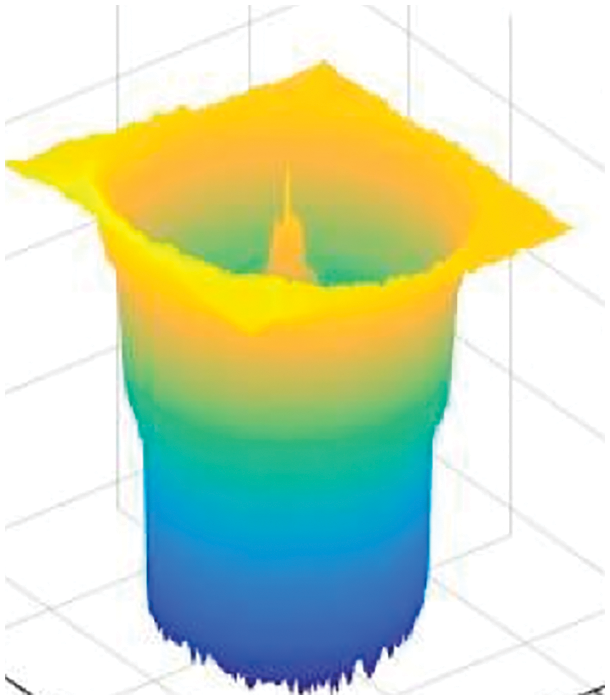
Figure 14: The 3D-modelled shape for the real well area
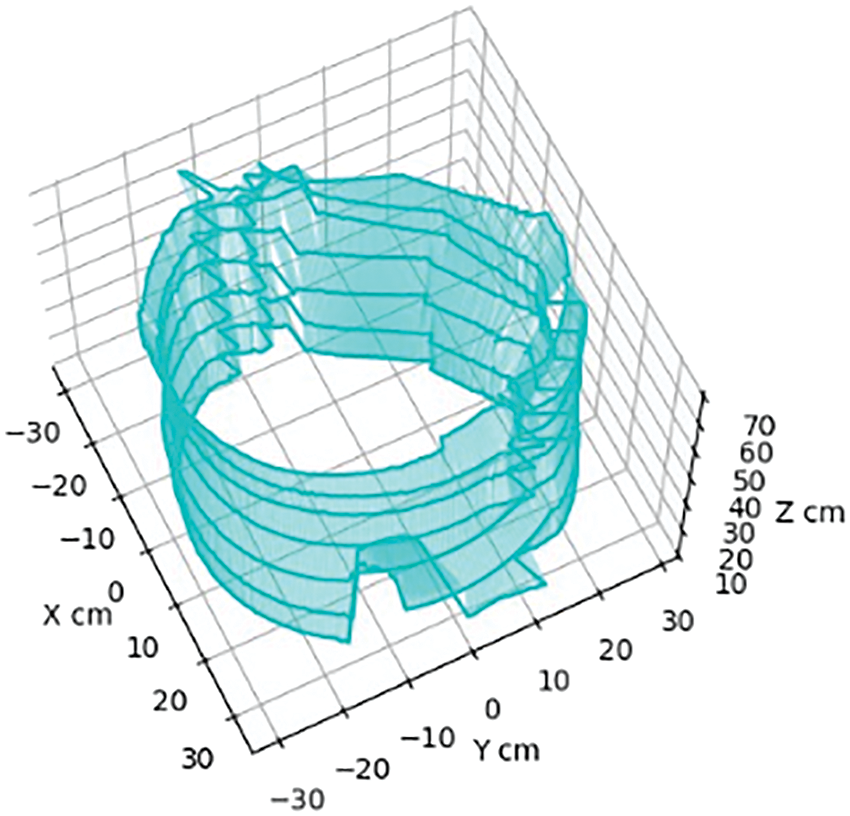
Figure 15: The 3D-modelled shape for the unequal cylinder area
As noticed from the obtained 3D modeling results, there was a minor error in the 3D modeling task, mainly when the developed system was employed in unequal or unstructured areas, as with the second and third experiment testbeds. However, this error will not largely affect the performance of the 3D modeling function, as usually, the rescue team requires general construction information about the well area, in order to manage the suitable equipment and tools for rescue operations.
According to the obtained 3D modeling results, in general, the 3D modeling error is generated in two ways: the error in the horizontal data collected from the RPLiDAR A3 sensor, and the error obtained from the depth sensor (LiDAR Light). The first problem has been recovered through interpolating the missing data values based on the nearest correct values. On the other hand, the second problem has also been recovered through averaging the depth distance values received from the LiDAR Light sensor. Therefore, these two issues have been recovered, however, the recovery process allows for unnoticeable error in the 3D modeling process.
Second, the transmission range was assessed. The live information (for instance: human detection, level of oxygen, and the presence of animals) are critical to save human lives. The transmission range between the exploration and the motoring units was assessed in this section. Because radio signals are usually affected by walls and obstacles—and those signals might be absorbed or reflected, thus weakening the signals—this research employed a ZigBee-based communication unit, which offered a long transmission range equal to one mile, outdoors. Since the exploration unit works in well areas where signals might get absorbed or reflected, it is valuable to study the communication range in the well areas.
Therefore, for this purpose, this research assessed the performance of the received signal strength (RSS) in two different well areas to guarantee the receipt of the sensed data. Fig. 16 shows the RSS values along with the travelled distance in the well area. The employed communication unit successfully transmitted the data between the exploration and monitoring units for almost 48 meters.
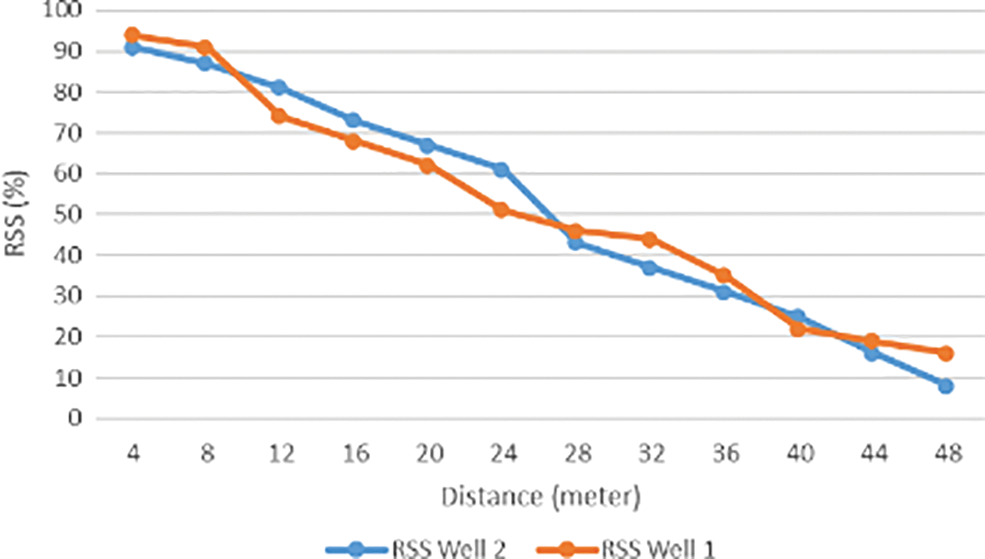
Figure 16: The signal strength for two different well areas
Third, the quality of oxygen measurement was assessed. Authors of [36] studied the variability of levels of oxygen in the atmosphere of wells, and then identified the ambient conditions associated with the low-oxygen situations. The authors revealed that in most well areas, the oxygen concentration decreases with the increasing of well depth, where the oxygen level in deeper areas range from 0.0% to 20.9%. Measuring the amount of oxygen in the well area is therefore a significant function, especially when a live person is found in a well area, as determining the level of oxygen will help rescue team feed the victim more oxygen as needed. For evaluation purposes, the oxygen level was measured at different levels in the well area, to present the relationship between the depth and the amount of oxygen available at that level. Fig. 17 presents the value of oxygen in different well layers. The measured value dropped down as the exploration unit moved deeper into the well.
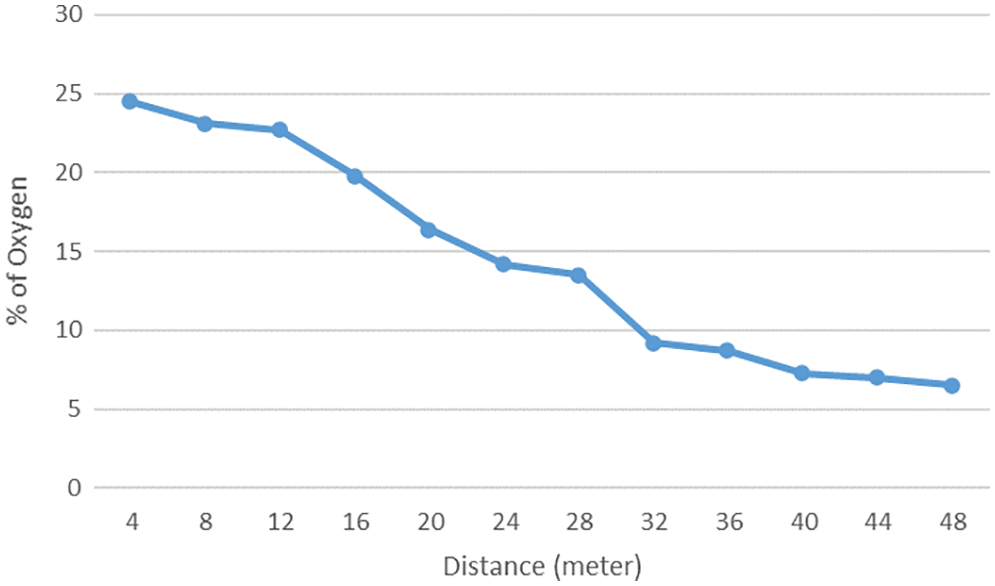
Figure 17: The obtained oxygen levels in different well layers
Fourth, the quality of the vision and thermal cameras were assessed. To discover live persons or animals, it is important to obtain live video feeds from the well area. However, a ZigBee communication protocol offers a low data rate (a max rate of 250 kbps), which makes it important to study the trade-off between reliable data communication and live video frames. The thermal camera provides a binary classification (heat exists or does not), while the digital camera frequently transmits several frames per second. Fig. 18 estimates the number of received frames by the monitoring unit, according to transmission distance. In the proposed systematic approach, two to three frames per second are efficient to monitor the area of interest and detect persons in the well area.
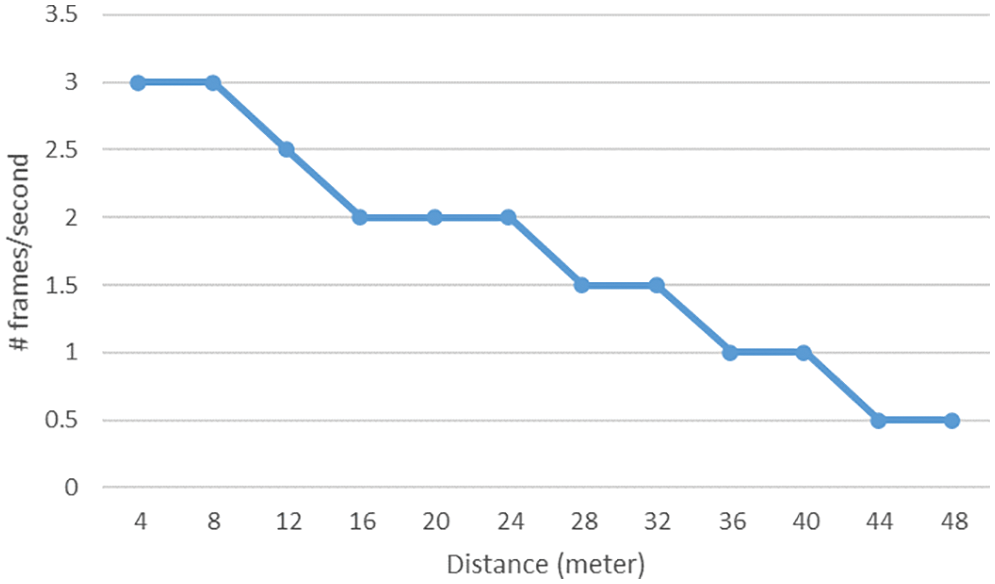
Figure 18: The number of received frames/seconds with regards to the transmission distance (in meters)
Fifth, the packet loss issue is considered. This project involves a real-time data transfer of video frames, thermal images, and level of different gas values. Then, some of these data might be lost during the transmission process, and incomplete information will be received at the monitoring unit. In addition, a high packet loss will reduce the speed or throughput for the ZigBee network. Therefore, it is important to keep the ratio of packet loss as minimum as possible to guarantee the reception of transmitted packets on the receiver side. In ZigBee network, the packet loss is the number of packets that have been lost during the transmission process between the sender (exploration unit) and receiver (monitoring station).
Usually, packet loss occurs when one or more of the data packets passing through the network fail to reach the destination. The Packet Loss Rate (PLR) can be easily performed by extracting all the real-time packet sizes that are transmitted and received, PLR is estimated using the following formula:
where
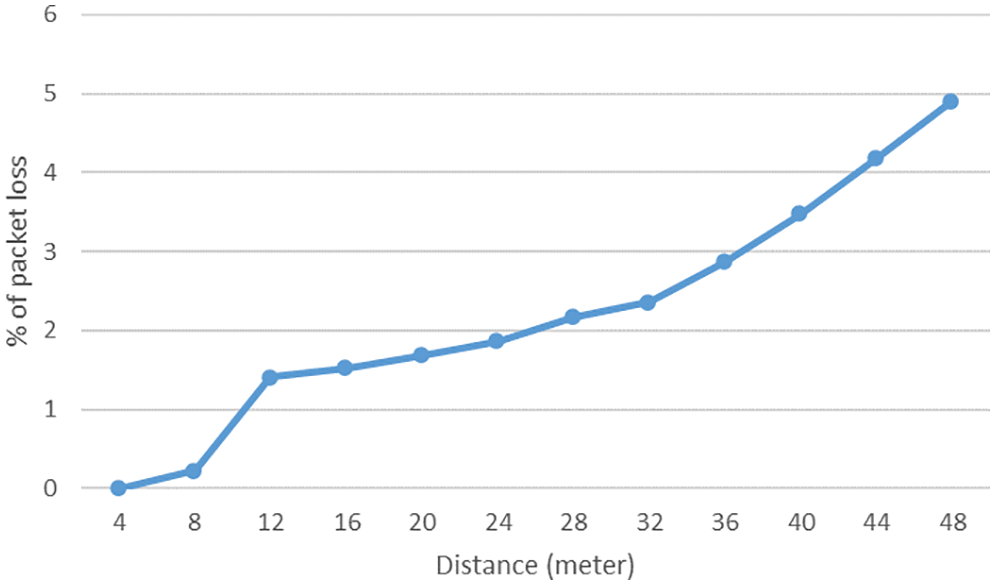
Figure 19: The PLR with regards to the transmission distance (in meters)
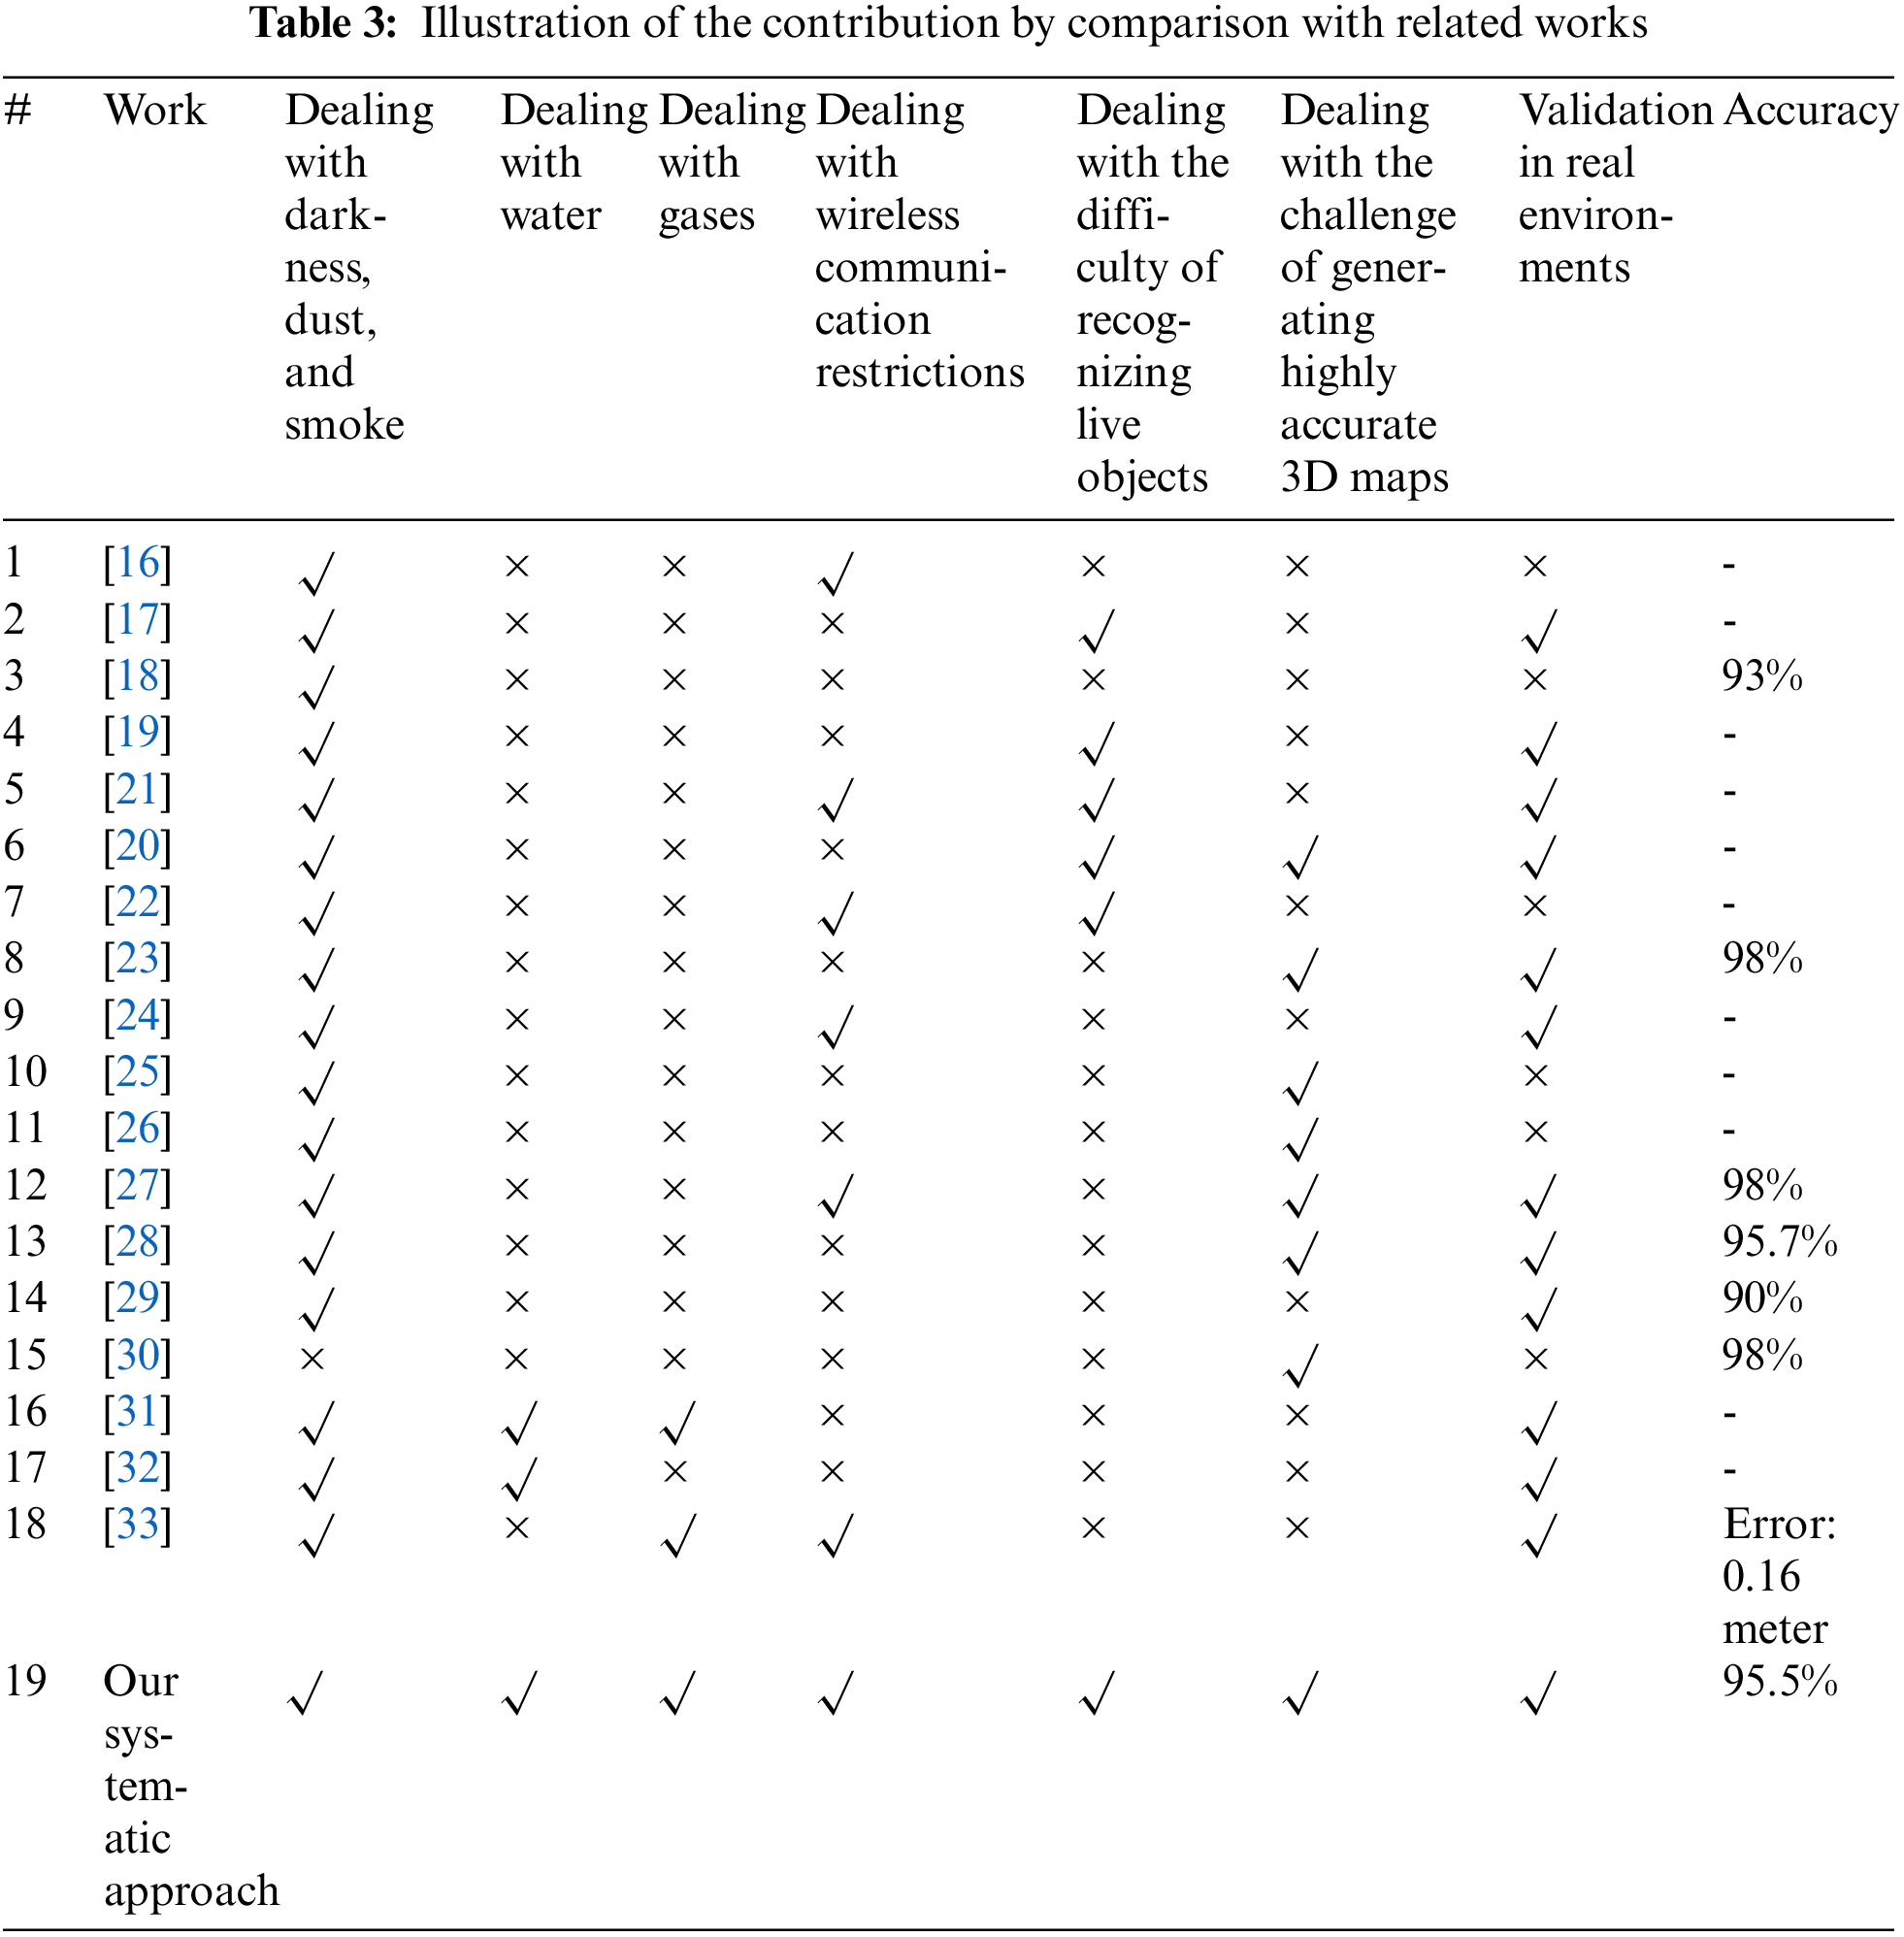
A systematic approach to exploring underground environments using a LiDAR-based system has been introduced in this paper. This research fills the gaps that are highlighted in Section 2, which details the challenges and difficulties in exploring underground environments. This research gap discusses eight points that can be considered as a benchmark to evaluate future solutions that deal with exploring the underground environment. Table 3 shows a comparison between the recent developed systems and the system proposed in this paper, in terms of the following eight contributions:
1. To account for the possibility of combinations of darkness, dust, and smoke, the proposed systematic approach contains digital cameras. The digital cameras display the inside the well area and send a series of images to the GUI to present a live view of the underground environment. The second part of GUI displays living persons inside the well area using a human detection system. Hence, the proposed systematic approach has overcome the difficulty of combinations of darkness, dust, and smoke by using a human detection system that takes advantage of digital camera images.
2. To account for the possibility of water, Figs. 5–7 show the proposed system’s hardware: The bottom of this unit consists of a water buoy to protect the onboard sensors (LiDAR, digital camera, and thermal camera) from any water and solid stones. See Fig. 5.
3. To account for the possibility of low oxygen, the system measures oxygen levels Deep wells, and underground environments in general often contain toxic gases, which makes inhabiting them impossible for living organisms. The survival of an organism in deep wells and underground environments depends on the percentage of oxygen in the air. In the proposed systematic approach, the level of oxygen has been measured in all well layers and then presented in the GUI. Fig. 15 presents the obtained oxygen levels throughout different well layers.
4. To address the issue of wireless communication and cable restrictions in underground environments, the proposed systematic approach employs a ZigBee-based communication unit to provide a long transmission range. Fig. 14 presents the values of the RSS along with the travelled distance in the well area. The proposed communication unit successfully transmitted data between the exploration and monitoring units for almost 48 meters.
5. To address the difficulty of recognizing live objects inside unknown and unstructured environments, the proposed approach utilizes attached digital and thermal cameras. The thermal camera is used when the digital camera fails to detect anything. The thermal camera provides a binary classification (detected or not detected), whereas the digital camera transmits several frames per second.
6. To address the challenge of generating highly accurate 3D maps for uneven terrains, the proposed systematic approach utilizes two sensors: RPLidar A3 and the LiDAR light. The LiDAR light scans the well area vertically, while the RPLidar A3 scans the well area horizontally. When combined, the model creates an accurate 3D model.
7. To validate the research results, the proposed systematic approach has been tested and evaluated in a real environment.
8. To ensure accuracy, the proposed systematic approach compares the accuracy of extracted results with real data from authorized bodies, such as governmental official maps. The 3D drawing of the cylinder shape, using the exploration system, had a 3D modelling accuracy of almost 98%. The 3D modelling accuracy for the real well had an accuracy of 93%.
Funding Statement: The research was financially supported by the Deanship of Scientific Research (DSR) at the University of Tabuk, Tabuk, Saudi Arabia, under Grant No. [1441-105].
Conflicts of Interest: The authors declare that they have no conflicts of interest to report regarding the present study.
References
1. Yampolskiy, R. V. (2018). Artificial intelligence safety and security. New York: Chapman and Hall/CRC. [Google Scholar]
2. Copley, J. (2019). Ask an ocean explorer. UK: Hodder & Stoughton publisher. [Google Scholar]
3. Khan, M. U., Zaidi, S. A. A., Ishtiaq, A., Bukhari, S. U. R., Samer, S. et al. (2021). A comparative survey of LiDAR-SLAM and LiDAR based sensor technologies. 2021 Mohammad Ali Jinnah University International Conference on Computing (MAJICC), pp. 1–8. Pakistan. [Google Scholar]
4. Dewan, A., Caselitz, T., Tipaldi, G. D., Burgard, W. (2016). Motion-based detection and tracking in 3D lidar scans. 2016 IEEE International Conference on Robotics and Automation (ICRA), pp. 4508–4513. Sweden. [Google Scholar]
5. Zhao, W., Kamezaki, M., Yoshida, K., Konno, M., Toriumi, R. et al. (2018). A prototype of a small tracked robot for gas pipeline inspection and maintenance. International Conference on Intelligent Human Systems Integration, pp. 137–142. Italy. [Google Scholar]
6. Zhang, W., Liu, N., Zhang, Y. (2021). Learn to navigate maplessly with varied LiDAR configurations: A support point-based approach. IEEE Robotics and Automation Letters, 6(2), 1918–1925. https://doi.org/10.1109/LSP.2016 [Google Scholar] [CrossRef]
7. Krell, E., Sheta, A., Balasubramanian, A. P. R., King, S. A. (2019). Collision-free autonomous robot navigation in unknown environments utilizing PSO for path planning. Journal of Artificial Intelligence and Soft Computing Research, 9(4), 267–282. https://doi.org/10.2478/jaiscr-2019-0008 [Google Scholar] [CrossRef]
8. Thrun, S., Burgard, W., Fox, D. (2005). Probabilistic robotics. Cambridge: MIT Press. [Google Scholar]
9. Burgard, W., Moors, M., Stachniss, C., Schneider, F. E. (2005). Coordinated multi-robot exploration. IEEE Transactions on Robotics, 21(3), 376–386. https://doi.org/10.1109/TRO.2004.839232 [Google Scholar] [CrossRef]
10. Betke, M., Gurvits, L. (1997). Mobile robot localization using landmarks. IEEE Transactions on Robotics and Automation, 13(2), 251–263. https://doi.org/10.1109/70.563647 [Google Scholar] [CrossRef]
11. DeSouza, G. N., Kak, A. C. (2002). Vision for mobile robot navigation: A survey. IEEE Transactions on Pattern Analysis and Machine Intelligence, 24(2), 237–267. https://doi.org/10.1109/34.982903 [Google Scholar] [CrossRef]
12. Alenzi, Z., Alenzi, E., Alqasir, M., Alruwaili, M., Alhmiedat, T. et al. (2022). A semantic classification approach for indoor robot navigation. Electronics, 11(13), 2063–2080. https://doi.org/10.3390/electronics11132063 [Google Scholar] [CrossRef]
13. Thrun, S., Burgard, W., Fox, D. (2000). A real-time algorithm for mobile robot mapping with applications to multi-robot and 3D mapping. IEEE International Conference on Robotics and Automation, vol. 1, pp. 321–328. USA. [Google Scholar]
14. Brooks, A. J. W., Fink, W., Tarbell, M. A. (2018). An adaptive hierarchical approach to lidar-based autonomous robotic navigation. In: Micro- and nanotechnology sensors, systems, and applications X, vol. 10639, pp. 106391–106399. USA: SPIE. [Google Scholar]
15. Camargo, A. B., Liu, Y., He, G., Zhuang, Y. (2019). Mobile robot autonomous exploration and navigation in large-scale indoor environments. 2019 Tenth International Conference on Intelligent Control and Information Processing (ICICIP), pp. 106–111. Morocco. [Google Scholar]
16. Pandey, A., Kumar, S., Pandey, K. K., Parhi, D. R. (2016). Mobile robot navigation in unknown static environments using ANFIS controller. Perspectives in Science, 8, 421–423. https://doi.org/10.1016/j.pisc.2016.04.094 [Google Scholar] [CrossRef]
17. Papachristos, C., Khattak, S., Mascarich, F., Alexis, K. (2019). Autonomous navigation and mapping in underground mines using aerial robots. 2019 IEEE Aerospace Conference, pp. 1–8. USA. [Google Scholar]
18. Faria, M., Ferreira, A. S., Pérez-Leon, H., Maza, I., Viguria, A. (2019). Autonomous 3D exploration of large structures using an UAV equipped with a 2D LIDAR. Sensors, 19(22), 4849. https://doi.org/10.3390/s19224849 [Google Scholar] [PubMed] [CrossRef]
19. Rouček, T., Pecka, M., Čížek, P., Petříček, T., Bayer, J. et al. (2019). Darpa subterranean challenge: Multi-robotic exploration of underground environments. International Conference on Modelling and Simulation for Autonomous Systems, pp. 274–290. Italy. [Google Scholar]
20. Ebadi, K., Chang, Y., Palieri, M., Stephens, A., Hatteland, A. et al. (2020). LAMP: Large-scale autonomous mapping and positioning for exploration of perceptually degraded subterranean environments. 2020 IEEE International Conference on Robotics and Automation (ICRA), pp. 80–86. France. [Google Scholar]
21. Rezende, A. M., Júnior, G. P., Fernandes, R., Miranda, V. R., Azpúrua et al. (2020). Indoor localization and navigation control strategies for a mobile robot designed to inspect confined environments. 2020 IEEE 16th International Conference on Automation Science and Engineering (CASE), pp. 1427–1433. Hong Kong. [Google Scholar]
22. Sharma, V., Sangwan, S., Bora, K. S. (2021). Design, development and control of a planetary rover using ROS. 2021 Second International Conference on Electronics and Sustainable Communication Systems (ICESC), pp. 69–76. India. [Google Scholar]
23. Kim, H., Choi, Y. (2021). Self-driving algorithm and location estimation method for small environmental monitoring robot in underground mines. Computer Modeling in Engineering & Sciences, 127(3), 943–964. https://doi.org/10.32604/cmes.2021.015300 [Google Scholar] [CrossRef]
24. Zhao, W., Kamezaki, M., Yamaguchi, K., Konno, M., Onuki, A. et al. (2021). A wheeled robot chain control system for underground facilities inspection using visible light communication and solar panel receivers. IEEE/ASME Transactions on Mechatronics, 27(1), 180–189. https://doi.org/10.1109/TMECH.2021.3060189 [Google Scholar] [CrossRef]
25. Lindqvist, B., Agha-Mohammadi, A. A., Nikolakopoulos, G. (2021). Exploration-RRT: A multi-objective path planning and exploration framework for unknown and unstructured environments. 2021 IEEE/RSJ International Conference on Intelligent Robots and Systems (IROS), pp. 3429–3435. Czech Republic. [Google Scholar]
26. Azpúrna, H., Campos, M. F., Macharet, D. G. (2021). Three-dimensional terrain aware autonomous exploration for subterranean and confined spaces. 2021 IEEE International Conference on Robotics and Automation (ICRA), pp. 2443–2449. China. [Google Scholar]
27. Chang, Y., Ebadi, K., Denniston, C. E., Ginting, M. F., Rosinol, A. et al. (2022). LAMP 2.0: A robust multi-robot SLAM system for operation in challenging large-scale underground environments. IEEE Robotics and Automation Letters, 7(10), 9651–9658. https://doi.org/10.1109/LRA.2022.3191204 [Google Scholar] [CrossRef]
28. Lesak, M. C., Gonzalez, D. J., Zhou, M. W., Petruska, A. J. (2022). Map-free lidar odometry (MFLO) using a range flow constraint and point patch covariances. IEEE Robotics and Automation Letters, 7(4), 10073–10080. https://doi.org/10.1109/LRA.2022.3191198 [Google Scholar] [CrossRef]
29. Fahle, L., Holley, E. A., Walton, G., Petruska, A. J., Brune, J. F. (2022). Analysis of SLAM-based lidar data quality metrics for geotechnical underground monitoring. Mining, Metallurgy & Exploration, 39(5), 1939–1960. https://doi.org/10.1007/s42461-022-00664-3 [Google Scholar] [CrossRef]
30. Xue, G., Li, R., Liu, S., Wei, J. (2022). Research on underground coal mine map construction method based on LeGO-LOAM improved algorithm. Energies, 15(17), 6256. https://doi.org/10.3390/en15176256 [Google Scholar] [CrossRef]
31. Modeste, G., Masson, F., Doubre, C., Cornet, F. (2022). Repeated lidar acquisitions in an underground salt gallery in the alsatian potassic basin (FranceMonitoring and geomechanical modelling. Tunnelling and Underground Space Technology, 123, 104406. [Google Scholar]
32. Kamp, F. (2022). Tunnel stability analysis and geological mapping using LiDAR and RGB sensor technologies in the Kristineberg underground mine (Master Thesis). Victoria University. [Google Scholar]
33. Kim, H., Choi, Y. (2021). Location estimation of autonomous driving robot and 3D tunnel mapping in underground mines using pattern matched LiDAR sequential images. International Journal of Mining Science and Technology, 31(5), 779–788. [Google Scholar]
34. Yan, K., Ma, B. (2020). Mapless navigation based on 2D LIDAR in complex unknown environments. Sensors, 20(20), 5802. [Google Scholar] [PubMed]
35. Gezawa, A., Wang, Q., Chiroma, H., Lei, Y. (2022). A deep learning approach to mesh segmentation. Computer Modeling in Engineering & Sciences, 135(5), 1745–1763. https://doi.org/10.32604/cmes.2022.021351 [Google Scholar] [CrossRef]
36. Wuthichotwanichgij, G., Geater, A. F. (2015). Low-oxygen atmosphere and its predictors among agricultural shallow wells in northern Thailand. Safety and Health at Work, 6(1), 18–24. [Google Scholar] [PubMed]
Cite This Article
 Copyright © 2023 The Author(s). Published by Tech Science Press.
This work is licensed under a Creative Commons Attribution 4.0 International License , which permits unrestricted use, distribution, and reproduction in any medium, provided the original work is properly cited.
 Downloads
 Citation Tools