
 Submit a Paper
 Propose a Special lssue
 Open Access
ARTICLE

Experimental and Numerical Analysis of the Influence of Microchannel Size and Structure on Boiling Heat Transfer
School of Mechanical and Electrical Engineering, Shaanxi University of Science and Technology, Xi’an, 710021, China
* Corresponding Author: Xianming Gao. Email:
Computer Modeling in Engineering & Sciences 2023, 136(3), 3061-3082. https://doi.org/10.32604/cmes.2023.026657
Received 19 September 2022; Accepted 28 November 2022; Issue published 09 March 2023
 View Full Text
 Download PDF
Abstract
Computational fluid dynamics was used and a numerical simulation analysis of boiling heat transfer in microchannels with three depths and three cross-sectional profiles was conducted. The heat transfer coefficient and bubble generation process of three microchannel structures with a width of 80 μm and a depth of 40, 60, and 80 μm were compared during the boiling process, and the factors influencing bubble generation were studied. A visual test bench was built, and test substrates of different sizes were prepared using a micro-nano laser. During the test, the behavior characteristics of the bubbles on the boiling surface and the temperature change of the heated wall were collected with a high-speed camera and a temperature sensor. It was found that the microchannel with a depth of 80 μm had the largest heat transfer coefficient and shortest bubble growth period, the rectangular channel had a larger peak heat transfer coefficient and a lower frequency of bubble occurrence, while the V-shaped channel had the shortest growth period, i.e., the highest frequency of bubble occurrence, but its heat transfer coefficient was smaller than that of the rectangular channel.Keywords
Nomenclature
| u, v, w | velocity components in x, y, z directions |
| velocity vector | |
| velocity divergence | |
| p | the pressure of the micro-body (Pa) |
| Fx, Fy, Fz | body strength (N) |
| T | temperature (K) |
| Cp | specific heat capacity (J/kg⋅K) |
| Tg | saturation temperature under pressure inside the bubble (K) |
| Ts | ambient temperature (K) |
| Tw | wall temperature (K) |
| superheat (K) | |
| Tave | average temperature of the temperature sensor (K) |
| Tcu | copper block temperature (K) |
| q | heat flux (kW/m²) |
| Tsat | saturated deionized water temperature (K) |
| h | surface heat transfer coefficient (W/m²⋅K) |
| Lb | the actual diameter of the bubble (mm) |
| Lr | reference actual diameter (mm) |
| Pb | number of bubble pixels |
| Pr | number of bubble pixels |
| volumetric mass transfer rate from gas phase to liquid phase (kg/m/3⋅s) | |
| volumetric mass transfer rate from liquid phase to gas phase (kg/m3⋅s) | |
| gravitational acceleration (m/s2) | |
| body force (N) | |
| hlv | latent heat transfer from liquid phase to gas phase (J/kg) |
| hvl | latent heat transfer from gas phase to liquid phase (J/kg) |
| K | the heat transfer coefficient of the fluid itself (W/m²⋅K) |
| ST | viscous dissipative term |
| R | gas molar constant |
| pl | liquid pressure outside the bubble (Pa) |
| ps | ambient pressure of boiling system (Pa) |
| pg | pressure inside the bubble (Pa) |
| liquid temperature (K) |
Greek Symbol
| phase volume fraction in the cell | |
| liquid volume fraction | |
| gas phase volume fraction | |
| fluid density (kg/m³) | |
| surface viscous stress | |
| thermal conductivity (W/m⋅K) | |
| Test base plate thickness (0.002 m) | |
| mixed phase dynamic viscosity (Pa⋅s) |
Subscripts or Superscripts
| x,y,z | direction |
| cu | copper |
| ave | average |
| sat | saturation |
| b | bubble |
| r | reference |
| l | liquid |
| v | vapor |
With the rapid development of microelectronics, electronic devices continue to shrink, and the degree of integration continues to improve. However, as the calorific value per unit volume increases, the heat dissipation of these small devices cannot meet operating requirements, resulting in a device with a shorter life. At the same time, the continuous high-temperature conditions have led to a 3.8% decrease in reliability [1]. Traditional single-phase fluid convection heat dissipation can no longer meet the demand. As a result, attention has shifted to phase change heat transfer, which relies on the latent heat of vaporization in the phase change process to achieve heat transfer, because its thermal conductivity is tens to hundreds of times that of traditional thermal conductive materials [2,3], Using the phase transition of the two-phase fluid to increase the heat transfer efficiency has become the focus of development.
Research on boiling heat transfer originated from the saturated boiling heat transfer curve under standard atmospheric pressure proposed by Nukiyama [4] in 1934. Nukiyama subdivided the boiling process into four stages–free convection boiling [5], nucleate boiling [6–8], transition boiling [9,10], and film boiling [11,12]. The nucleate boiling stage, in particular, has low superheating and high heat flux density, and heat transfer design is frequently controlled within this range in engineering applications. Increasing the bubble detachment diameter, detachment frequency, and the density of gasification core points on the heating surface can greatly enhance the heat transfer performance during boiling.
Many studies have been conducted on boiling bubbles’ occurrence, growth, and detachment. Ranjan et al. [13] studied the porous medium and substrate when the degree of wall superheat is 5 K by using the volume of fluid (VOF) model to track the gas-liquid interface during bubble growth. They observed the formation of nucleated bubbles at the interface, demonstrating that there is no uniform bubble detachment phenomenon. More vertical air columns were generated when the porosity was 50%∼70%, and when the porosity was less than 50%, more lateral bubbles were generated. Vontas et al. [14] performed three sets of simulations for hydrophilic and hydrophobic surfaces using the VOF solver under constant heat, mass, and flow rate. Their results show that surface wettability plays avital role in the heat transfer coefficient. The main heat transfer mechanisms for hydrophilic and hydrophobic surfaces are liquid film evaporation and contact line evaporation, respectively. Raut et al. [15] used the sharp interface double grid level set method (SI-DGLSM) to simulate the effect of the oscillation of the bottom of the isolated bubble on the nucleate boiling heat transfer under the condition of low superheat. Their findings show that for nucleate boiling perpendicular to the plate surface on an oscillating plate, a phase-locked region is observed and that within a certain amplitude and frequency range, the frequency of bubble detachment is synchronized with the frequency of plate oscillation, and the frequency of plate oscillation effectively controls the size of the bubbles. Zhang et al. [16] used the lattice Boltzmann method (LBM) to conduct a numerical study on the interaction of nucleation sites during pool boiling and their effects on wettability. Their results show that the degree of wall superheat can alter the thermodynamic and hydrodynamic interactions between nucleation sites. Many studies have also proved that the existence of surface microstructure can, to a certain extent, enhance the heat transfer of nucleate boiling [17–24].
Tiwari et al. [25], under conjugate heat transfer situation, the effect of flow boiling instability in straight and wavy microchannel is numerically studied using water as the working fluid. The variation of bubble growth rate and two-phase flow pattern in direct and wave microchannels is studied in a certain range of parameters. It can be concluded that a vertical wavy wall configuration microchannel helps to reduce flow boiling instability compared to a straight wall microchannel. Hutter et al. [26], using degassed FC-72 as the working fluid, studied the bubble growth process in an isolated artificial cavity on a 380 μm-thick silicon wafer and found that the frequency of bubble nucleation and vertical coalescence increased with the wall surface area. Yan et al. [27] investigated the bubble behavior of flow boiling in a horizontal rectangular channel with inclined ribs at atmospheric pressure through visualization experiments. They discovered that the bubble diameter decreases as the mass flux increases and that the flow boiling heat transfer performance is best when the rib angle is 45 degrees. Thiagarajan et al. [28] used saturated HFE-7100 as the working fluid in nucleate boiling experiments on microporous copper surfaces and flat surfaces and discovered that at low heat flux levels, surfaces with thicker microporous coatings performed better than thinner surfaces. Deng et al. [29] used a solid-state sintering method to create a porous structure with a Ω-shape from sintered copper powder for a pool boiling cooling system. Their results show that the structure greatly reduces the degree of superheat at the beginning of the nucleate boiling stage, ensures the rapid replenishment of the liquid, and can effectively prevent heat transfer deterioration. Sun et al. [30] used the orthogonal plowing/extrusion (P/E) method to fabricate micro-grooved surfaces with concave cavities (MSRC) on pure copper substrates under atmospheric pressure with deionized water as the working fluid. Their results show that MSRC has a higher heat transfer coefficient (HTC) than a smooth copper sheet (SCS), and the lower wall superheat at the onset of nucleate boiling (ONB). Wen et al. [31] proposed a cost-effective hybrid wicking structure, mass-fabricated using copper micromesh and an etching process. The interconnected microchannels between the woven mesh layer and the substrate can become a low flow-resistance channel for the passage of high-volume, low-velocity liquids. Surface wettability can be increased, and liquid flow can be improved by creating nanoparticles and microcavities on multilayer microgrids (CHF). Wang et al. [32] used wire electrical discharge machining (WEDM) to create a T-shaped groove surface on a copper surface with a groove width of 0.3–1.2 mm and a groove depth of 0.6–1.5 mm and then investigated studied the effect of heat transfer area on heat transfer performance. They also used finite element simulation software to investigate the bubble growth process. They found that the effect of the groove width on the heat transfer performance is greater than that of the groove depth. Under a reasonable groove width, the larger the groove depth, the easier it is for the vaporization core to reach the required temperature. The heat transfer effect of the multi-scale T-shaped surface is the best, which is 1.31 times that of the single-scale surface, 2.38 times that of the smooth surface, and 2.83 times that of the laser-scanned surface.
Although considerable progress has been made in the enhancement of boiling heat transfer, numerical simulation and visual experiments have not been combined. There is little research on the effect of a certain size change on bubble behavior in fixed structures. This paper takes the copper boiling bottom plate as the research object. It uses numerical analysis and visual experiments to study the influence of structural factors (channel configuration, channel depth, and channel height-depth ratio) on boiling.
Fluid flow obeys the laws of the conservation of mass, momentum, and energy. These three basic fundamental principles correspond to three governing equations: the continuity equation expresses mass conservation, the N-S Equation expresses momentum conservation, and the energy equation expresses energy conservation.
(1) Continuity equation:
Substituting the vector
When the basic parameters of fluid motion in the flow field are all three-dimensional incompressible fluid parameters, the density of the fluid is constant, and Eq. (1) can be expressed as:
(2) Momentum equation:
If gravity is not considered and the physical force is simplified, Fx = 0, Fy = 0, Fz = 0. This is the Equation for the conservation of momentum, also known as the Navier-Stokes equation.
(3) Energy conservation equation:
To make Eq. (7) closed, the connection equation between P and ρ is supplemented:
If the fluid is an ideal gas, then:
The formation of bubbles must simultaneously meet two conditions: the core point of vaporization and the superheating of the liquid. Therefore, the density of the vaporization core point is a key factor affecting bubble formation. As Fig. 1 shows, grooves or cracks on the heated wall are prone to trapping residual gas, and these gases become the core of the naturally generated bubbles. The heating affects the liquid in the tank much more than the same volume of liquid on a flat surface.
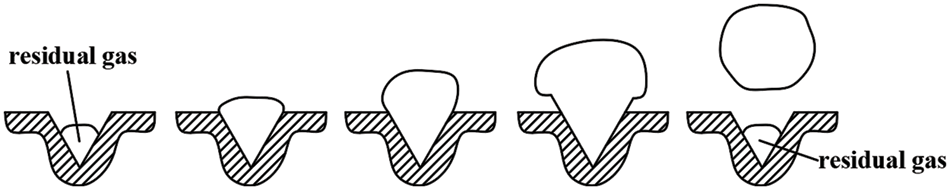
Figure 1: The process of bubble growth and detachment
Since the liquid on the heated wall surrounding the vaporization core is constantly evaporating, the temperature of the surrounding superheated liquid will be higher than the temperature inside the bubble at the vaporization core point, causing the surrounding superheated liquid to continuously transfer heat to the bubble, causing the bubble to grow. The buoyancy of the bubble increases as its volume increases, exceeding the surface tension generated between it and the heating wall. The bubble will then detach from the heating wall, allowing surrounding liquid to flow into the now-vacant nucleation point. This process also disturbs the liquid near the wall, greatly reducing the thermal resistance and improving the boiling heat transfer performance.
Both homogeneous and heterogeneous nucleation occur during the nucleation process. This paper considers only heterogeneous nucleation, so homogeneous nucleation will not be introduced. During the boiling process, non-condensable gas in the liquid, or residual gas in the pits or cracks on the heated wall, will become a natural vapor nucleus.
As Fig. 2 shows, if static pressure is ignored, the liquid phase pressure
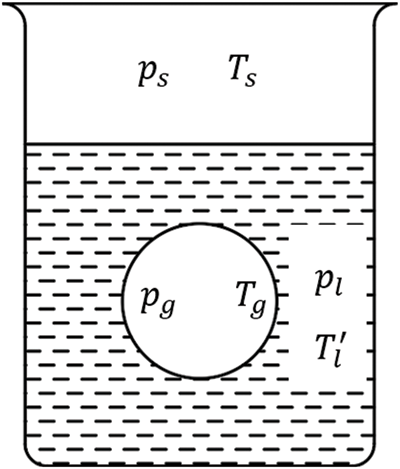
Figure 2: Schematic diagram of the force balance of a bubble
As a result, all bubbles are generated on the wall. That is, before the pit can become the vaporization core, its radius must satisfy the Eq. (10).
According to the Clausius-Clapeyron equation, the degree of superheating required to generate bubbles with radius R can be obtained as:
As superheating at the wall increases, the pressure difference
3.1 Preparation of Evaporation End Structure
This paper studies the influence of rectangular channels with different depths on boiling heat transfer performance. The microstructure dimensions are shown in Fig. 3.
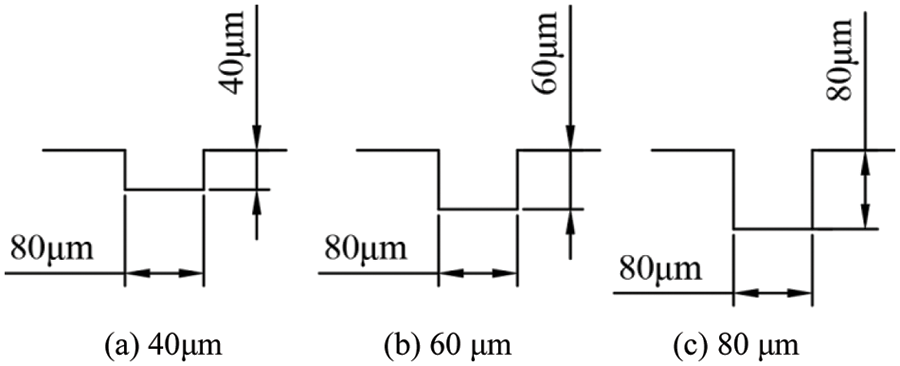
Figure 3: The three microchannel depth models
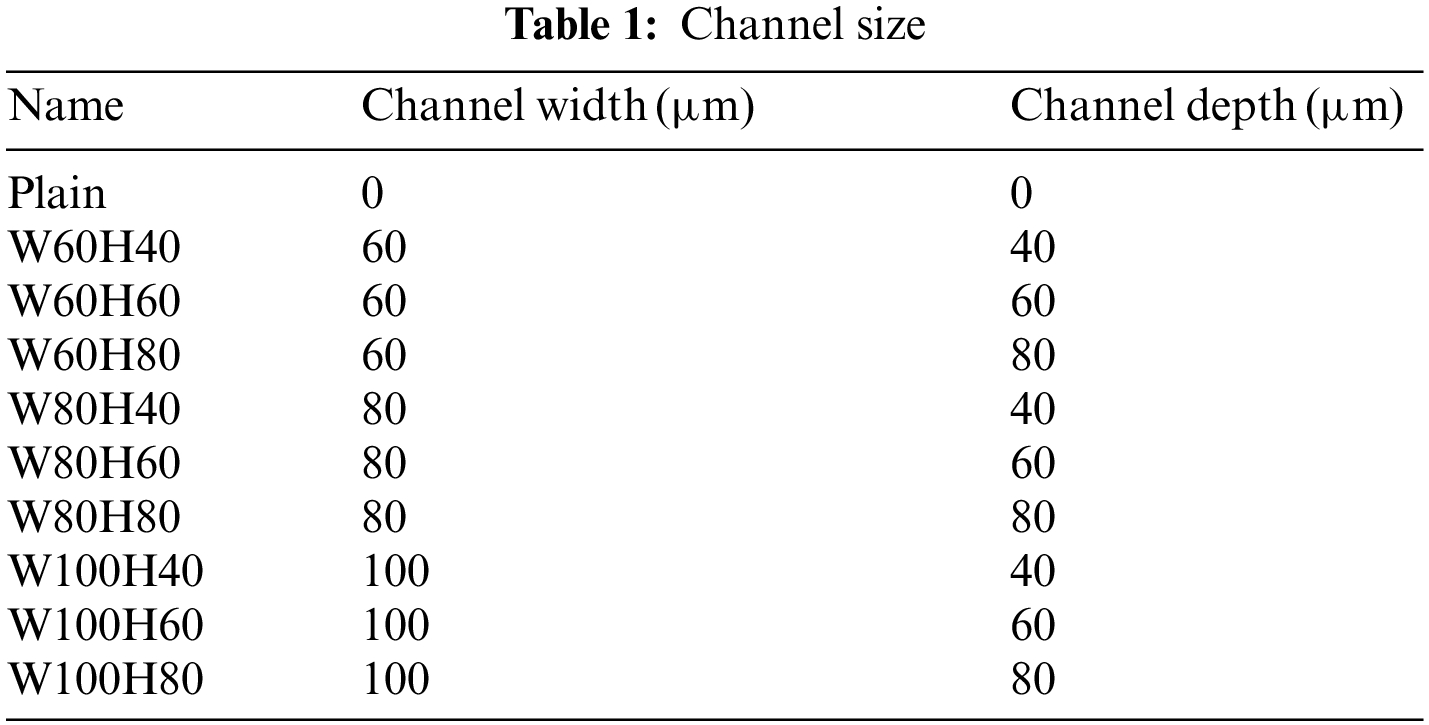
The evaporation end uses a rectangular copper plate with external dimensions of 100 mm × 100 mm × 2 mm. A comparative experiment is performed on the surface of the copper plate with nine groups of channels of different sizes. Fig. 4 depicts a schematic diagram of the test bottom plate. This experiment only considers the effect of a single channel’s size change on bubble behavior. To that end, the distance between the channels is 5 mm, and the width and depth of the channels range from 60 to 100 μm and 40 to 80 μm, respectively. As shown in Table 1, the different test bases are named after the width and depth of the grooves on the test base.
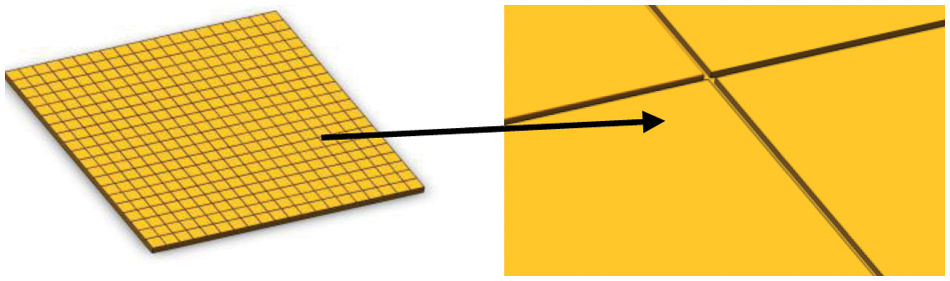
Figure 4: Schematic diagram of the test base plate
Micro-nano laser marking technology was used to prepare the test base plate, and the surface topography structure was obtained through a series of experiments. Taking the test base plate with a width of 80 μm and a depth of 40 μm as an example (Fig. 5), measurements of five measurement points selected at random at different sections, show an average depth of 42.233 μm and a width of 80.12 μm. There is a slight fluctuation at the junction of the cross groove, which is within an acceptable range and meets the required groove depth of 40 μm, and groove width of 80 μm, requirements.
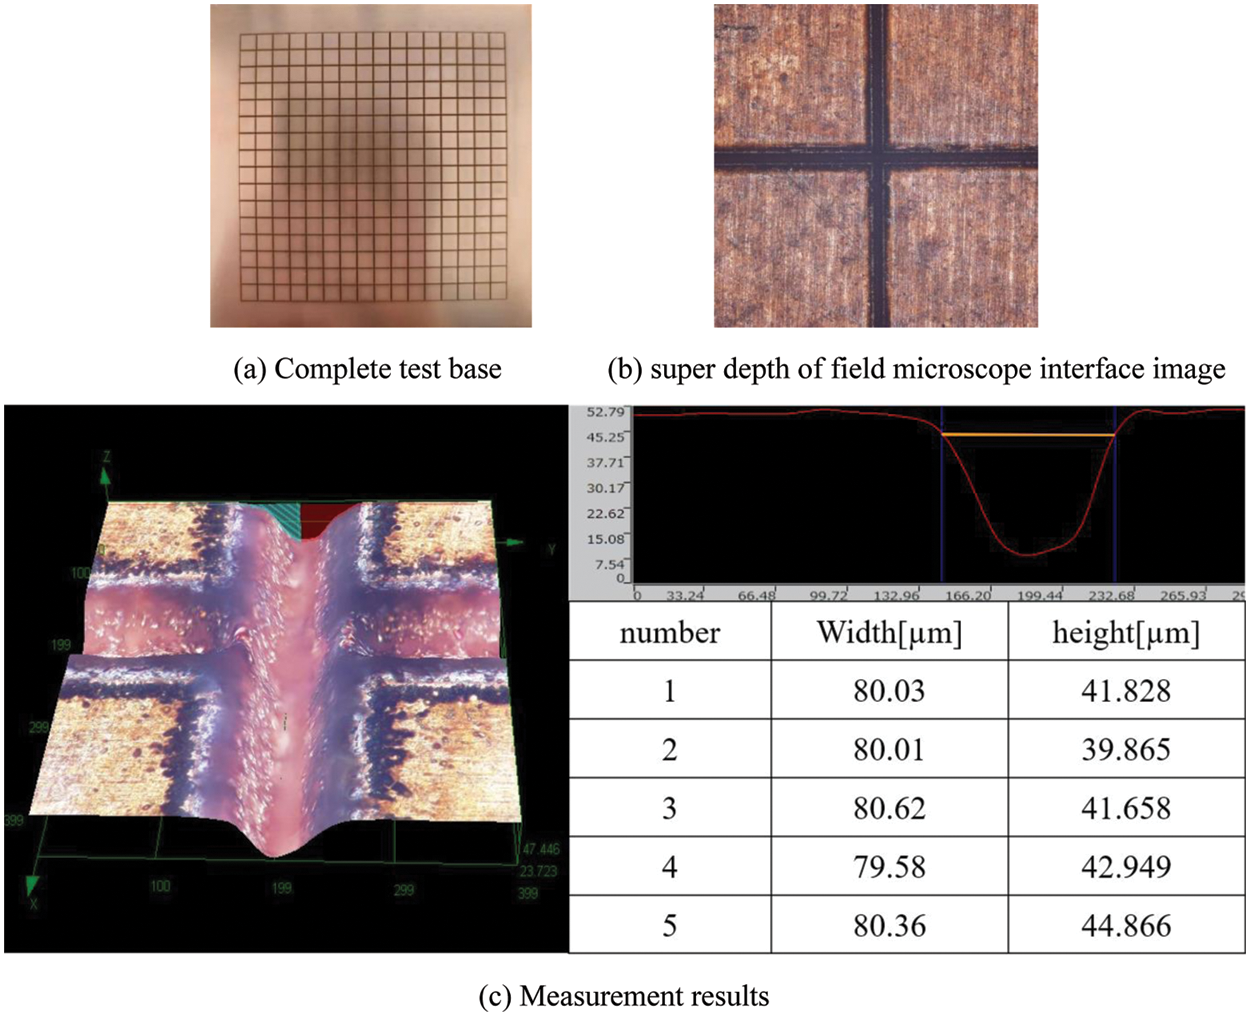
Figure 5: Laser processing preparation of the test base plate
The visual boiling test device consists of a heat source adjustment module, a temperature acquisition module, an image visualization module, and a boiling pool (Figs. 6 and 7). The heat insulation board is PTFE, which is fixed to the four walls of the heat conduction table. The heating copper block is made of thermally conductive red copper and has a maximum thermal conductivity of 386.4 W/(m⋅K). The heat transfer process of the heat conduction table is simulated using the Comsol software package. Five electric heating tubes control the temperature through a temperature controller, so they are heated at constant wall temperature. The surface temperature of each electric heating tube was defined as 100°C, the material was copper, and its thermal conductivity was set to 386.4 W/(m · K). The global initial temperature was set to 20°C. The temperature distribution cloud map of the heat conduction platform obtained using the simulation is shown in Fig. 8. Due to the high thermal conductivity of red copper, the maximum overall temperature difference in the cloud diagram is only 0.24°C. The temperature of each area on the upper surface of the heat conduction table is approximately equal, which meets the test’s control variable requirements.
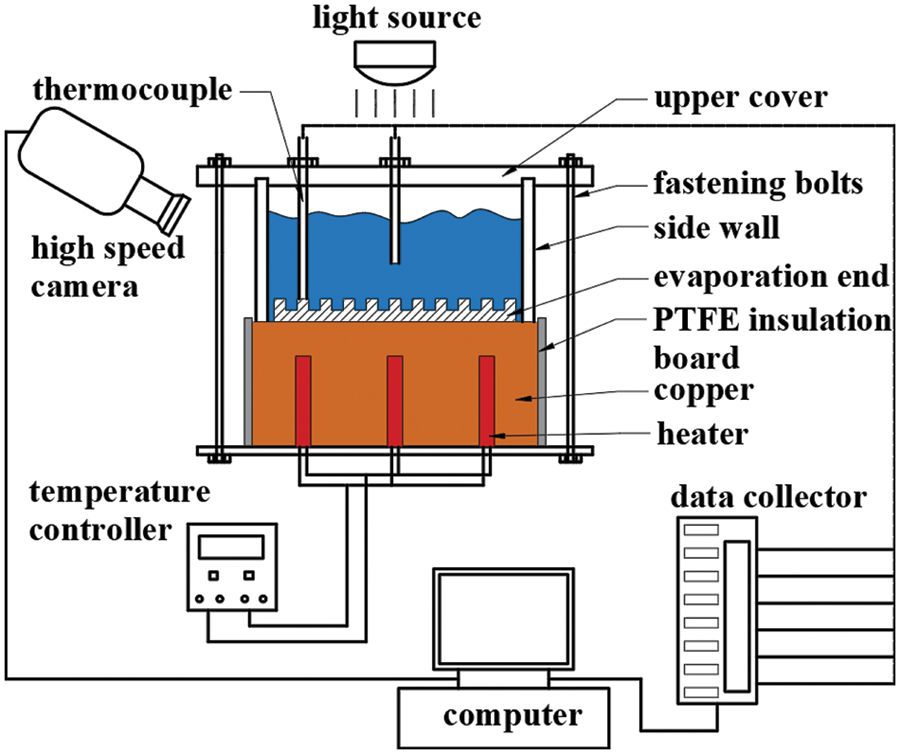
Figure 6: Schematic diagram of the visual boiling test device
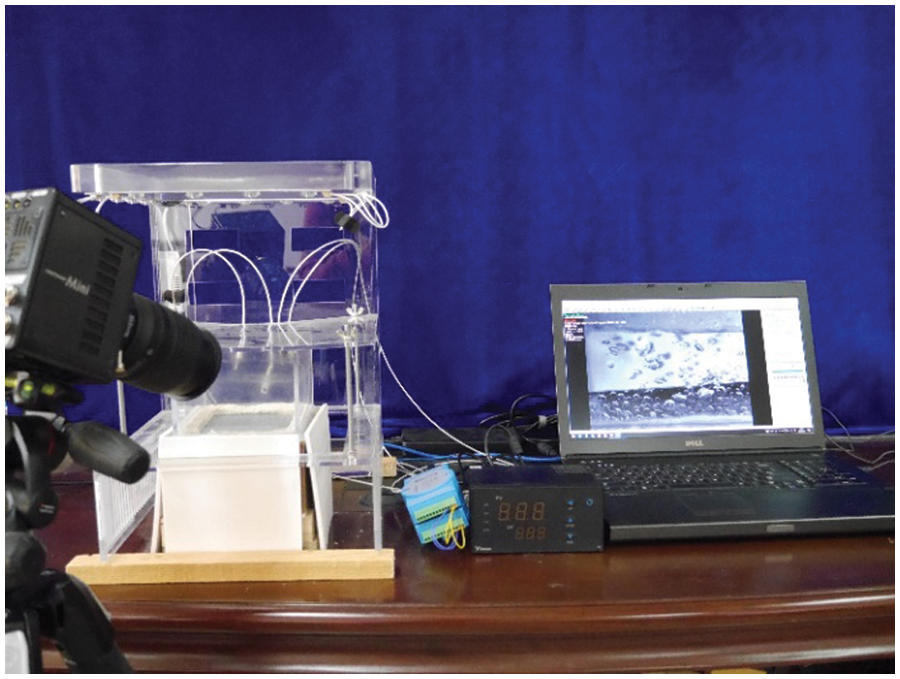
Figure 7: The actual visual boiling test device
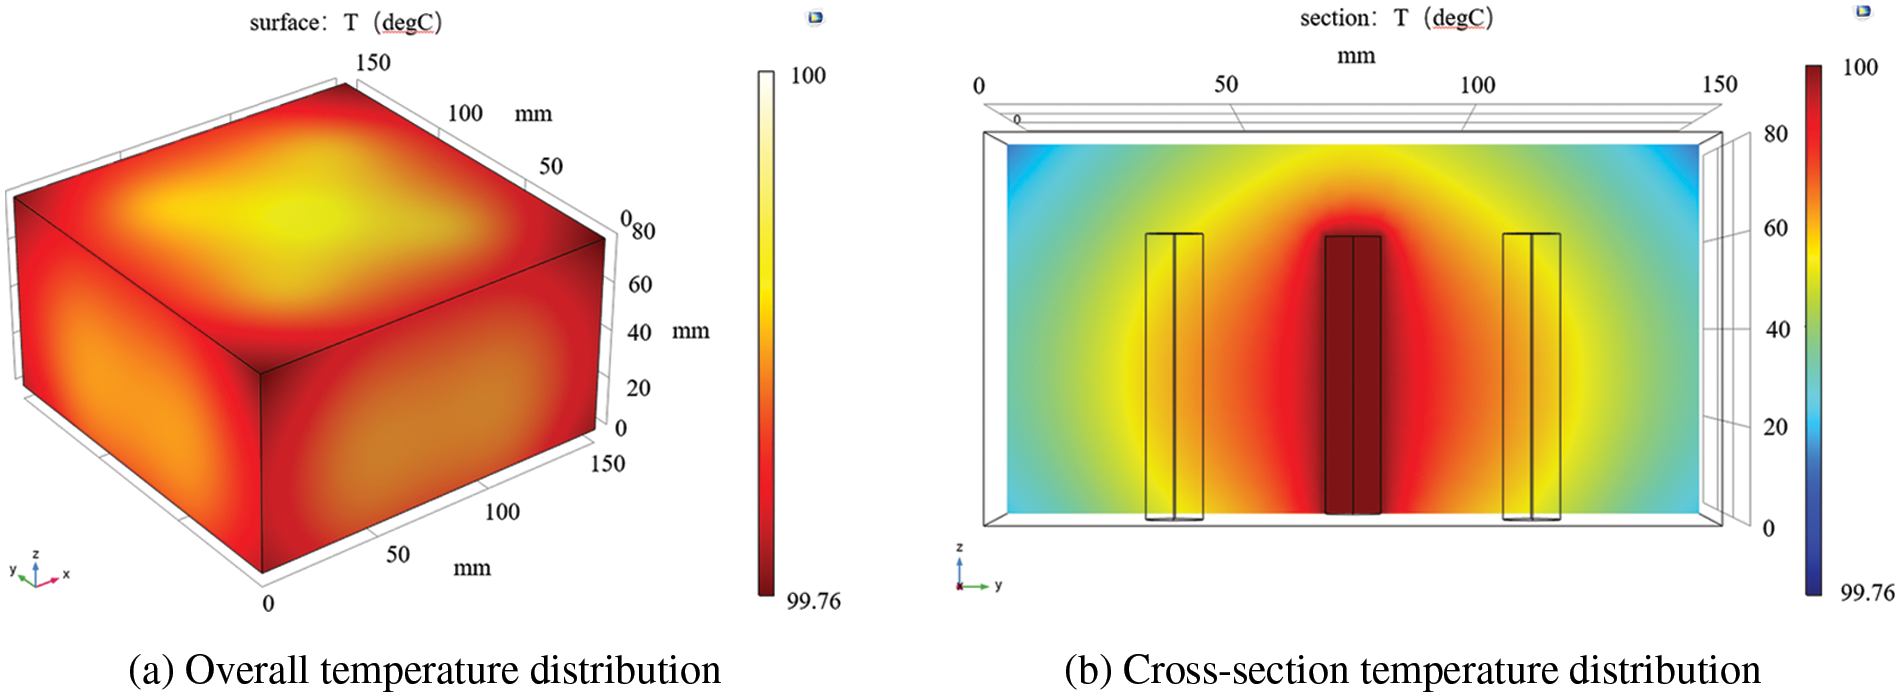
Figure 8: Simulation of heat transfer of the copper block
The average value of the readings of the thermal resistance temperature sensors on the test base plate is
In this experiment, the temperature only changes in a single direction-x-which can be obtained by integrating the expression of Fourier’s law:
where ΔT is the degree of wall superheating, defined as the difference between
The surface heat transfer coefficient, h is:
For image interpretation, the distance between two adjacent channels (5 mm) was used as a reference scale. Using the bubble picture captured by the high-speed camera, the number of bubble diameter pixels and the actual number of pixels of the reference scale were compared using image processing software. To compare, the bubble diameter was also calculated using Eq. (16):
4 Analysis of Experimental Results
4.1 Robustness Verification and Experimental Results
To investigate whether bubble nucleation in the same site could be stable, we randomly selected the result of three groups to verify the robustness. Fig. 9 shows the degree of superheat of 3, 6, 8 K, respectively, under the condition of the same nucleating sites from gasification emphasis to form, to grow out of, will generate new gasification again in original nucleation site core, after several cycles without interference. The reliability of bubble formation at the same point is verified.
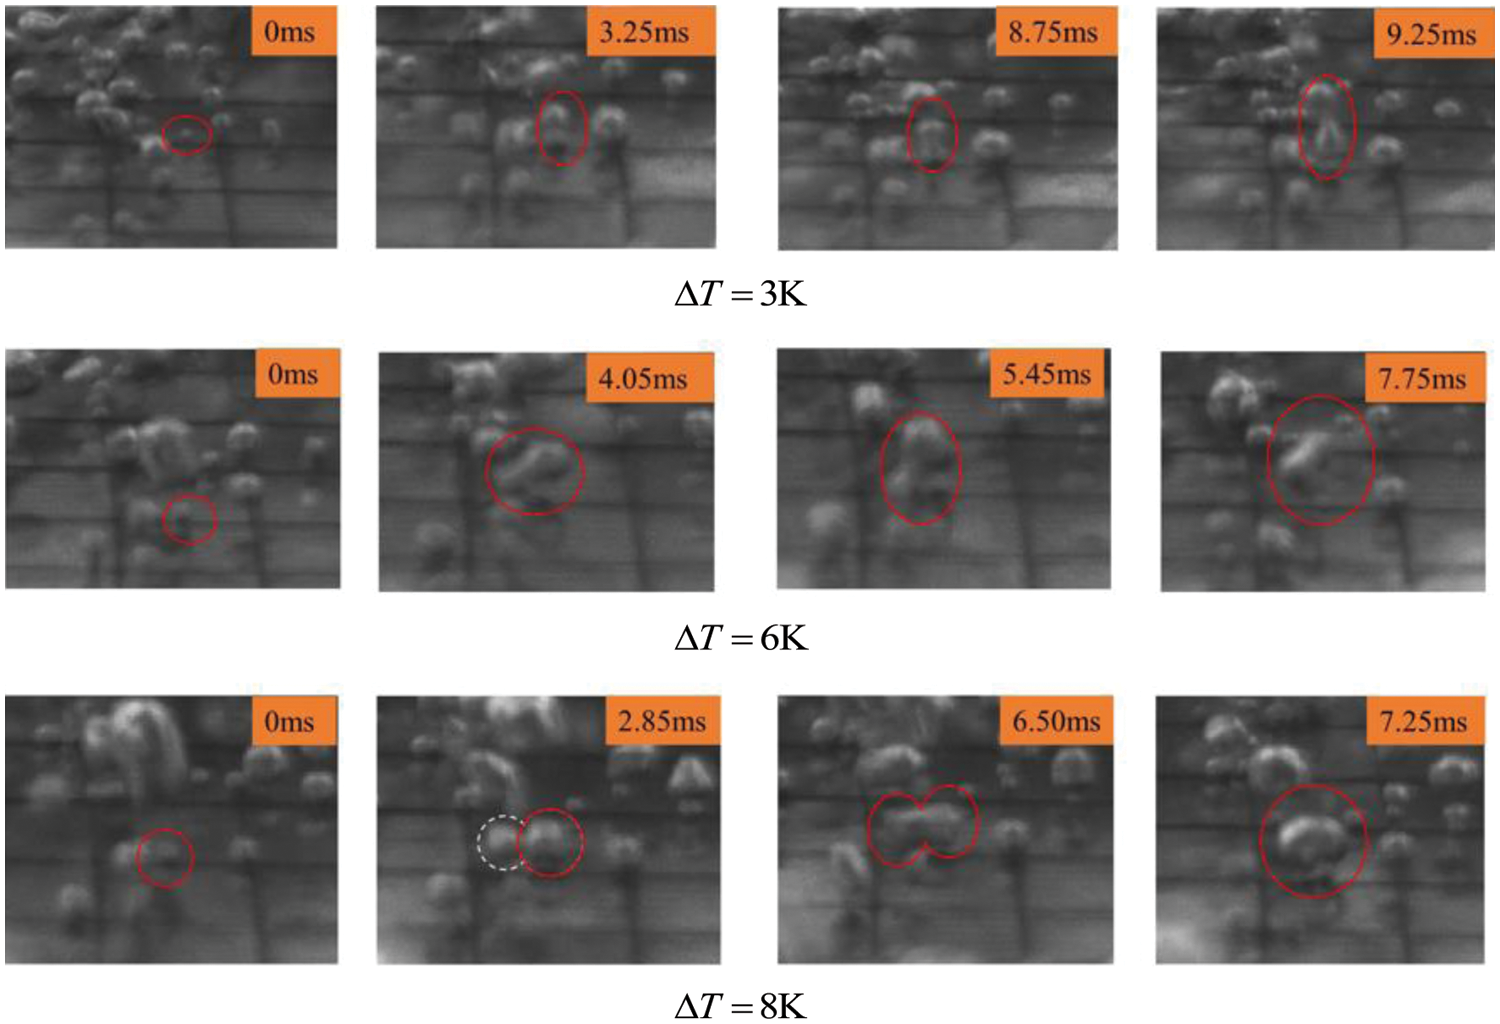
Figure 9: Visual image robustness verification of bubbles during microchannel surface boiling
Fig. 10 shows the process of bubble formation at the nucleation point, bubble growth, bubble aggregation, and finally, bubbles detaching from the heating surface under the action of buoyancy on the W100H80 test bottom plate under different degrees of superheating, ΔT. The results show that, as ΔT, increases, the bubble detachment diameter increases, and most of the bubbles do not grow and detach from the surface independently but combine to form lateral or vertical bubbles. This way, a larger bubble is formed, gradually breaking away from the heated wall. Furthermore, when the degree of superheating of the wall surface is low, the bubble growth and waiting periods are shorter, and the bubbles do not typically aggregate with surrounding bubbles. When the degree of superheating is high, the vaporization core point rises, bubble aggregation is more intensifies, and bubble detachment diameter rises significantly, but the frequency of bubble detachment falls.
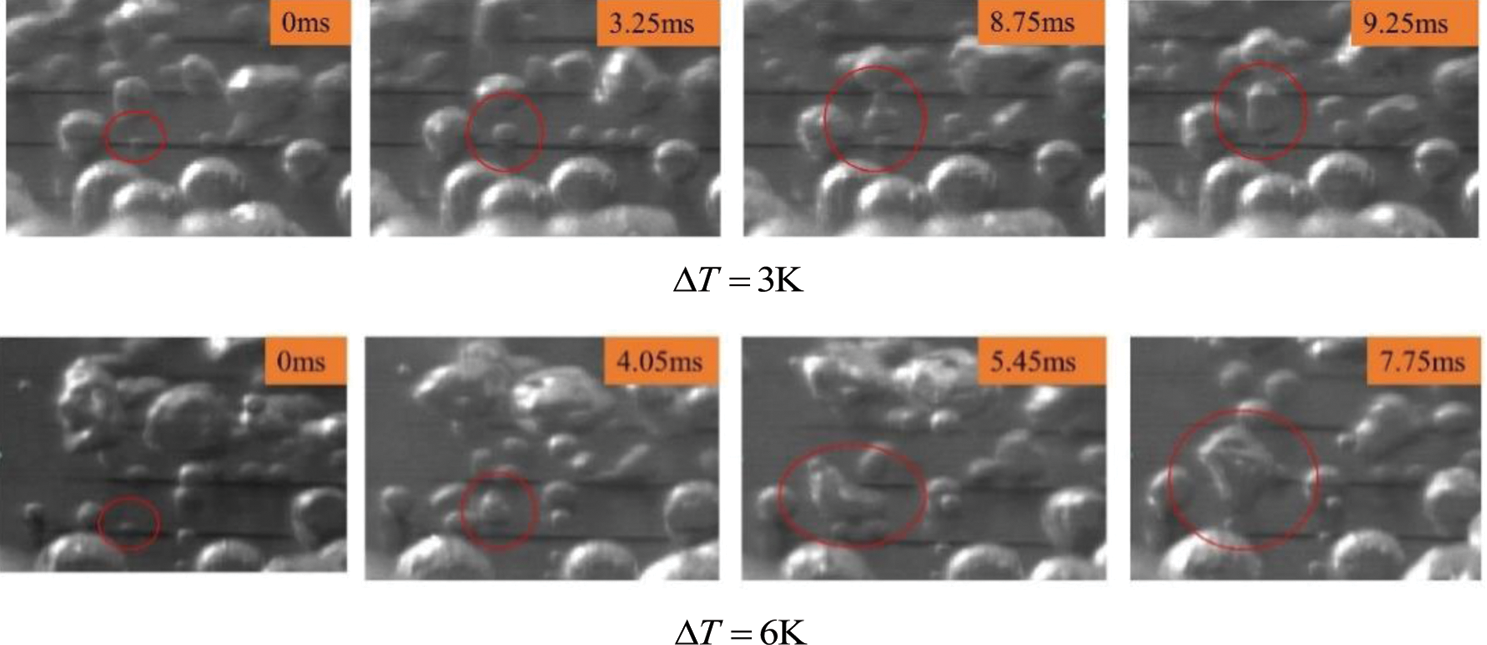
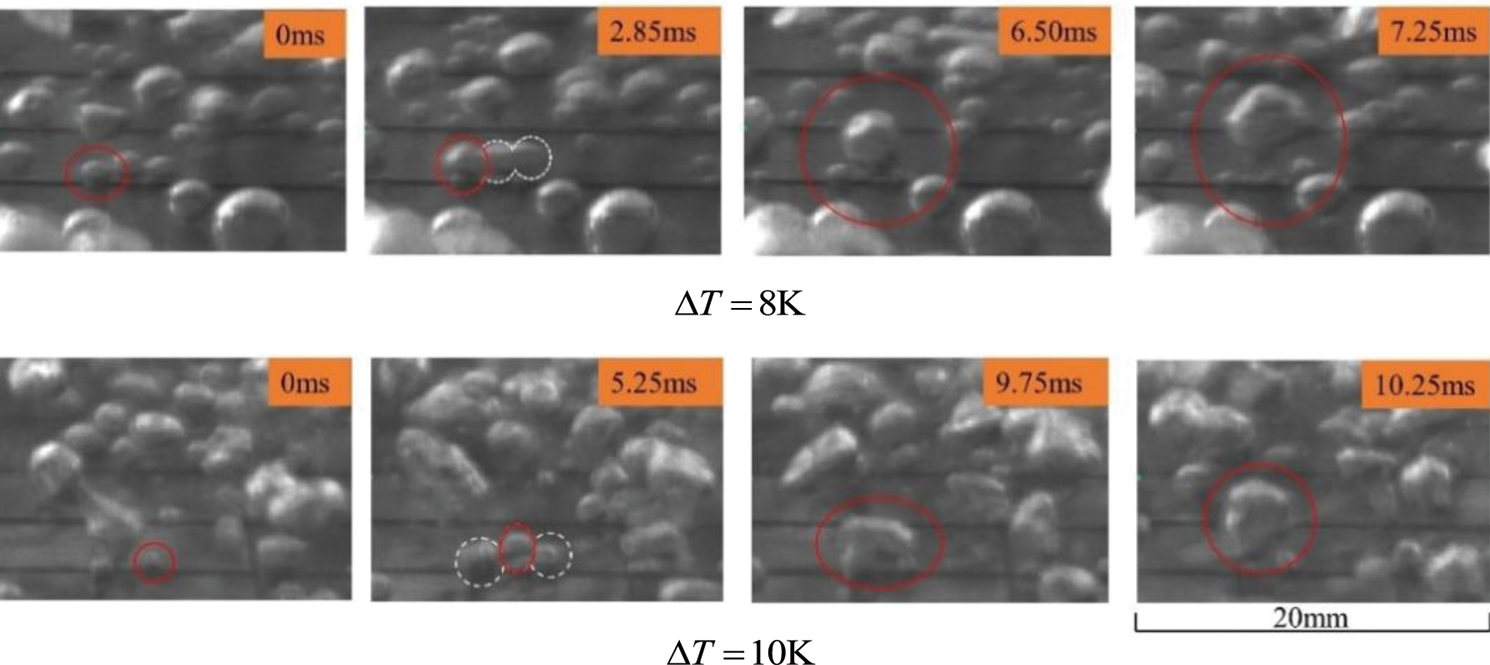
Figure 10: Photos of bubbles captured with the high-speed camera during the boiling process on the W100H80 microchannel surface
4.2 Analysis of the Influence of Channel Structure on Bubble Detachment Diameter
Differently sized channels have different effects on bubble detachment and boiling heat transfer. The variation of bubble detachment diameter (D) with the degree of wall superheating (ΔT) for different sizes of microchannel structures is shown in Fig. 11.
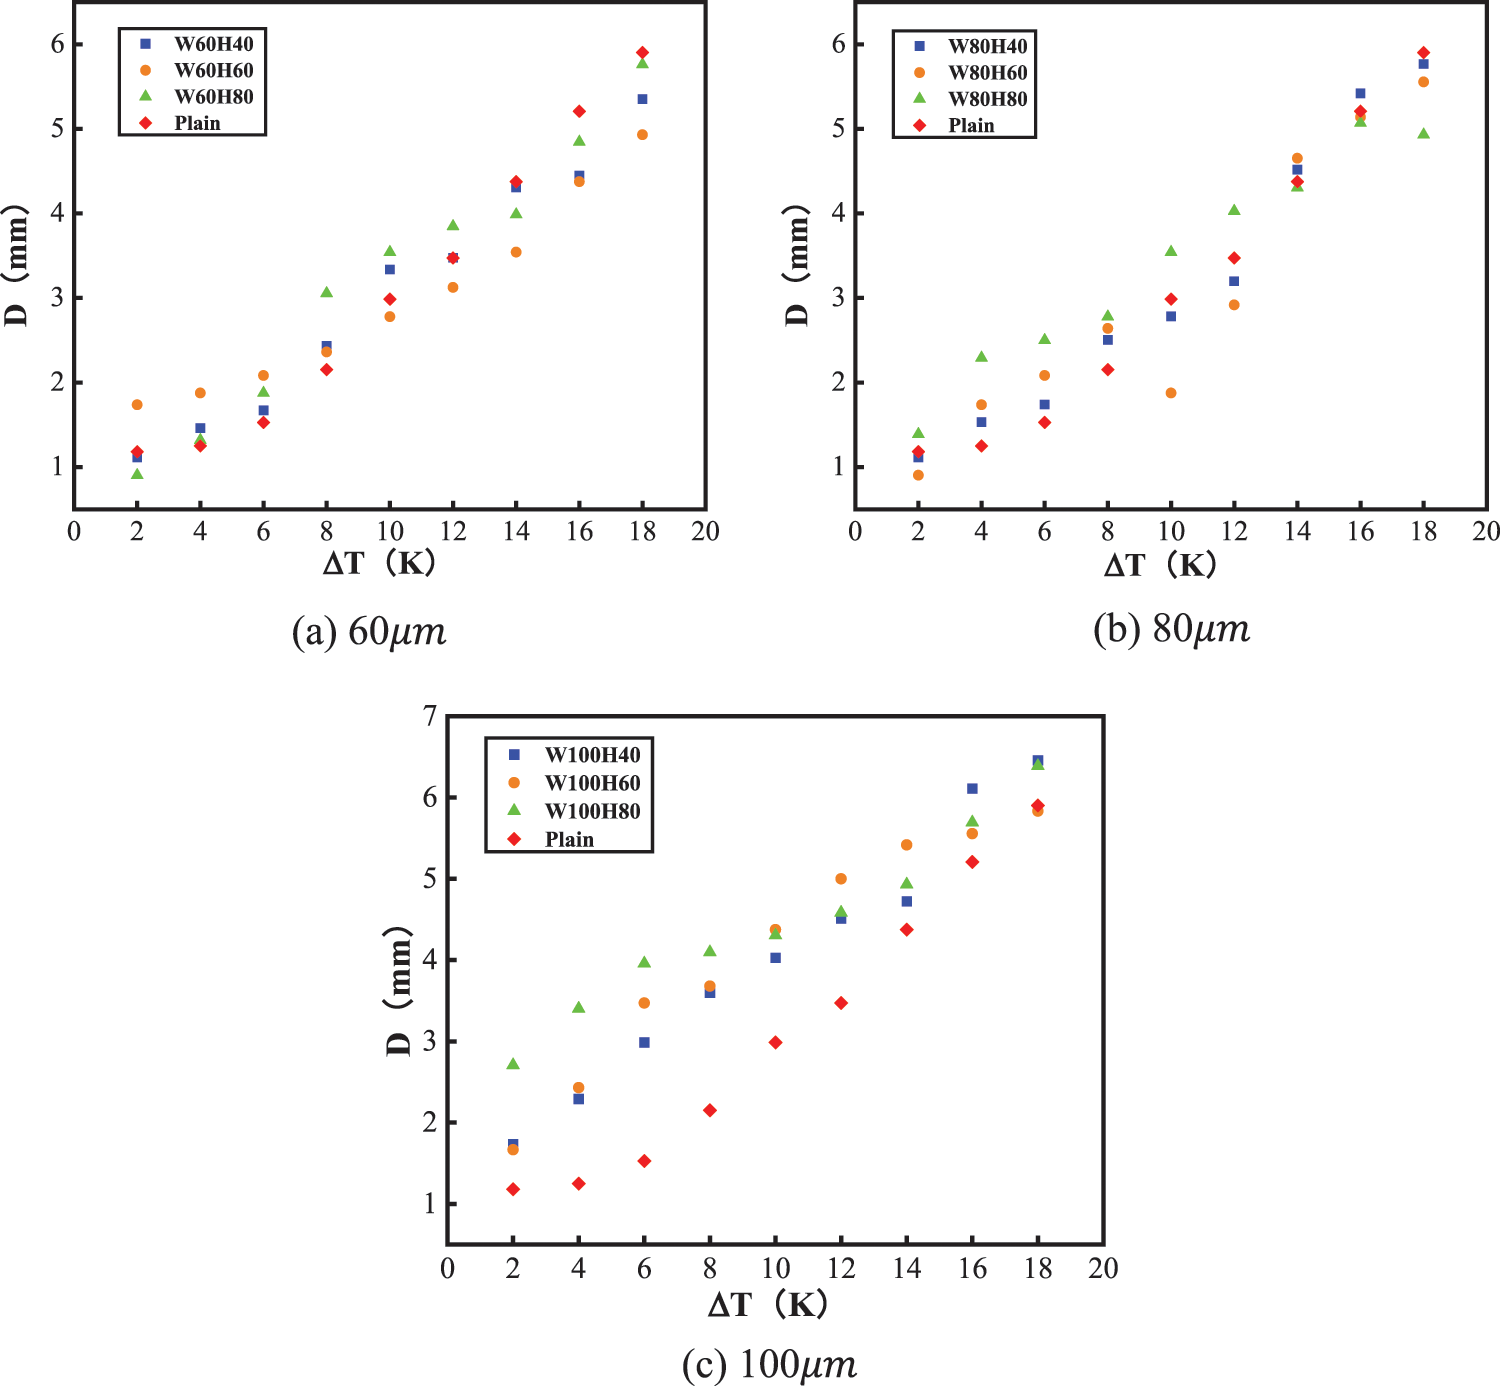
Figure 11: Variation of bubble detachment diameter with the degree of wall superheating under different microchannel widths
As shown in Fig. 11a, the presence of the microchannel alters the distribution of the liquid film near the heating wall. when compared to the flat bottom plate. When ΔT ≤ 14 K is used on the 60 μm-width microchannel bottom plate, the depth of the microchannel increases with depth, the diameter of the bubble detachment increases. However, when ΔT ≥ 14 K, the effect of increasing the bubble detachment diameter ceases to be significant. For the 80 μm-width microchannel bottom plate (Fig. 11b), the trend is similar. With the increase in the microchannel width the bubble detachment diameter increases to a certain extent. With a further increase in the microchannel width (Fig. 11c), the bubble detachment diameter on the microchannel test bottom plate further increased and was significantly higher than that of the flat bottom plate. For W100H40, the bubble detachment diameter increased the most at lower degrees of superheating, and the overall trend remained the same, which is consistent with the above analysis.
4.3 Analysis of the Influence of Channel Structure on the Frequency of Bubble Detachment
The variation of bubble detachment frequency (f) with the degree of wall superheating (ΔT) for different sizes of microchannel structures is shown in Fig. 12:
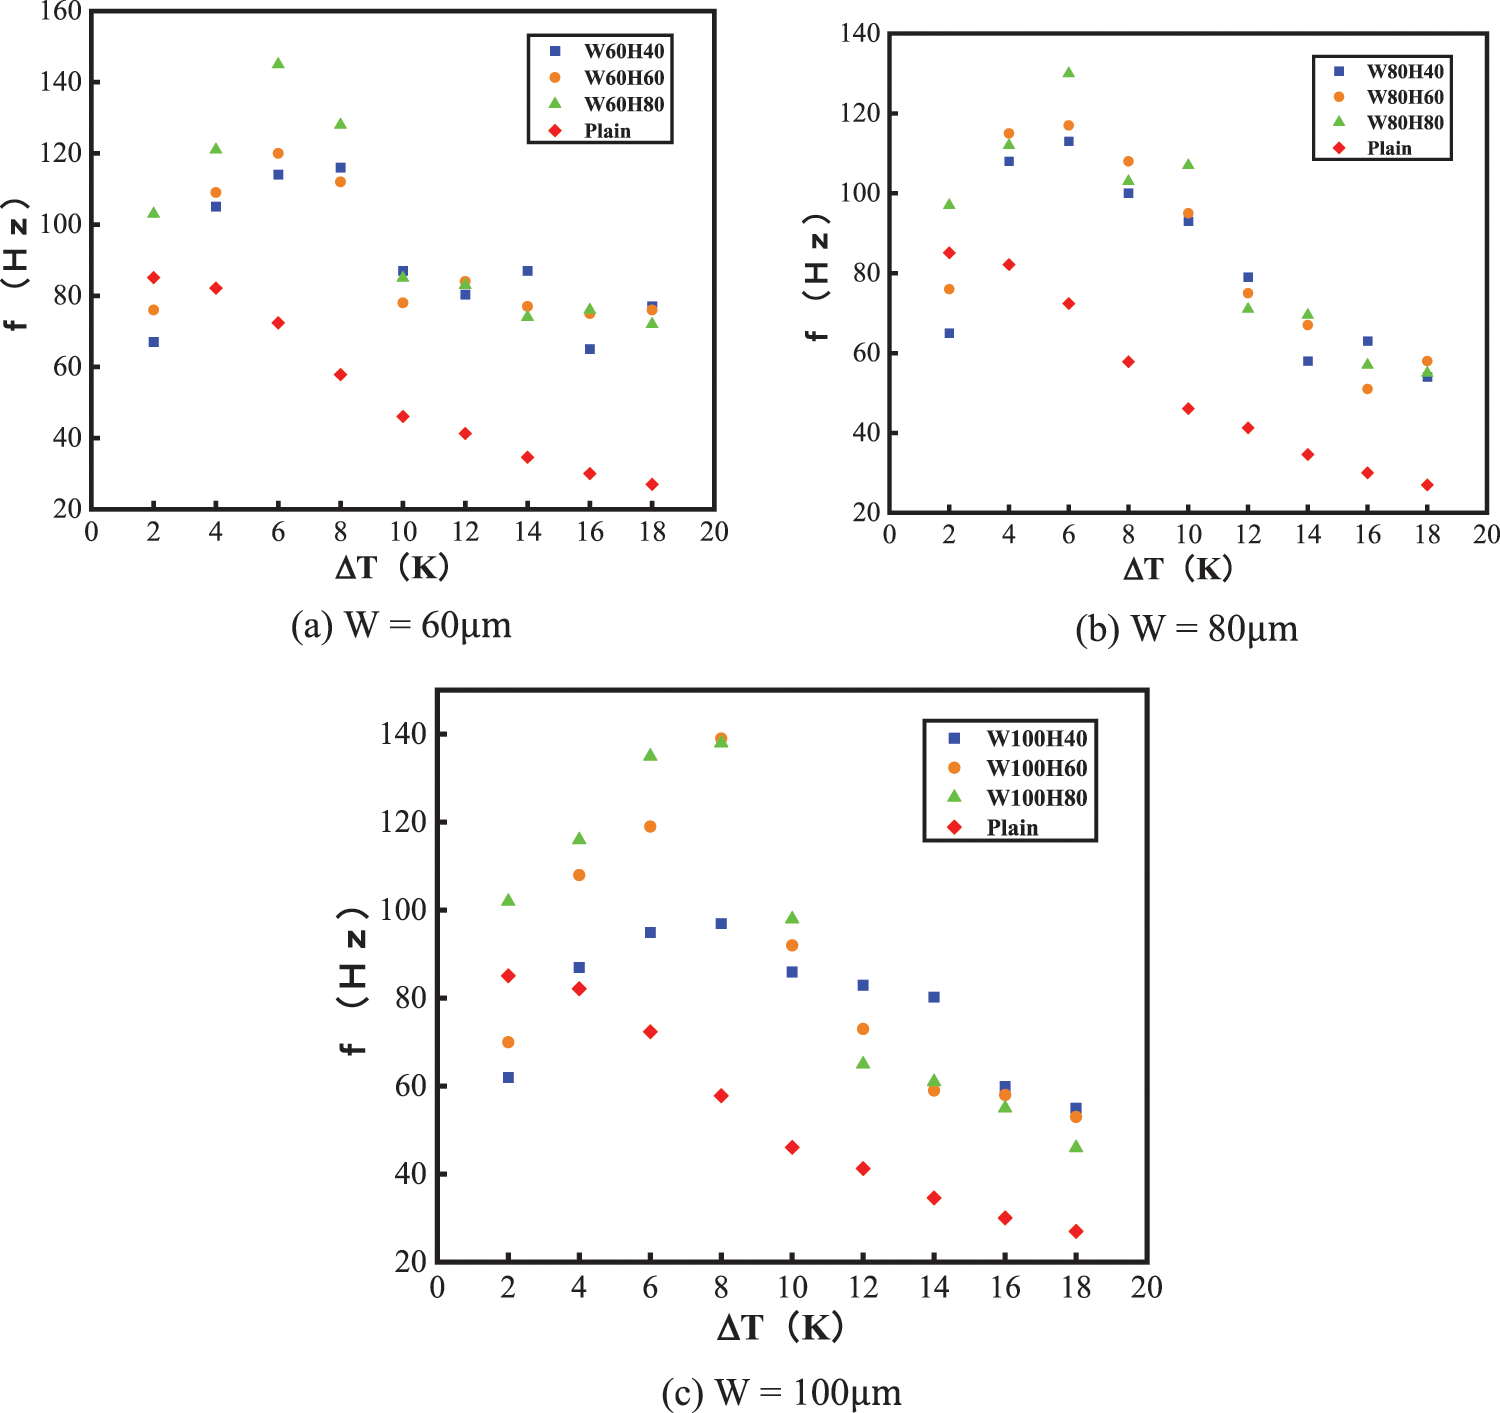
Figure 12: Variation of bubble detachment frequency with the degree of wall superheating under different microchannel widths
As Fig. 12a shows, when the channel width is 60 μm, under different channel depths, the average bubble detachment frequency of the bottom plate of the evaporation end is much higher than that of the flat evaporation end. The average bubble detachment frequency at the evaporation end of the microchannel is greater than 110 Hz when the degree of wall superheating is 4 K ≤ ΔT ≤ 8 K. However, once ΔT ≥ 8 K, f began to decrease. In addition, when ΔT ≤ 8 K, the bubble detachment frequency on the bottom plate varied greatly with different microchannel depths. When ΔT = 6 K, f at almost all widths reached a peak value and reached as high as 150 Hz for W60H80. However, once ΔT ≥ 8 K, the frequency of bubble detachment began to decrease. The overall trend was the same for the plate with 80 μm channels (Fig. 12b); however, for a given ΔT, f was lower than for the plate with 60 μm channels. As the channel width continued to increase (Fig. 12c), the overall bubble detachment frequency continued to decrease, and the overall change trend was the same, but the peak came later than with the narrower channels. This phenomenon is caused by an increase in channel width, which results in a decrease in capillary force.
4.4 Influence of Channel Structure on Boiling Heat Transfer Performance
The heating table temperature
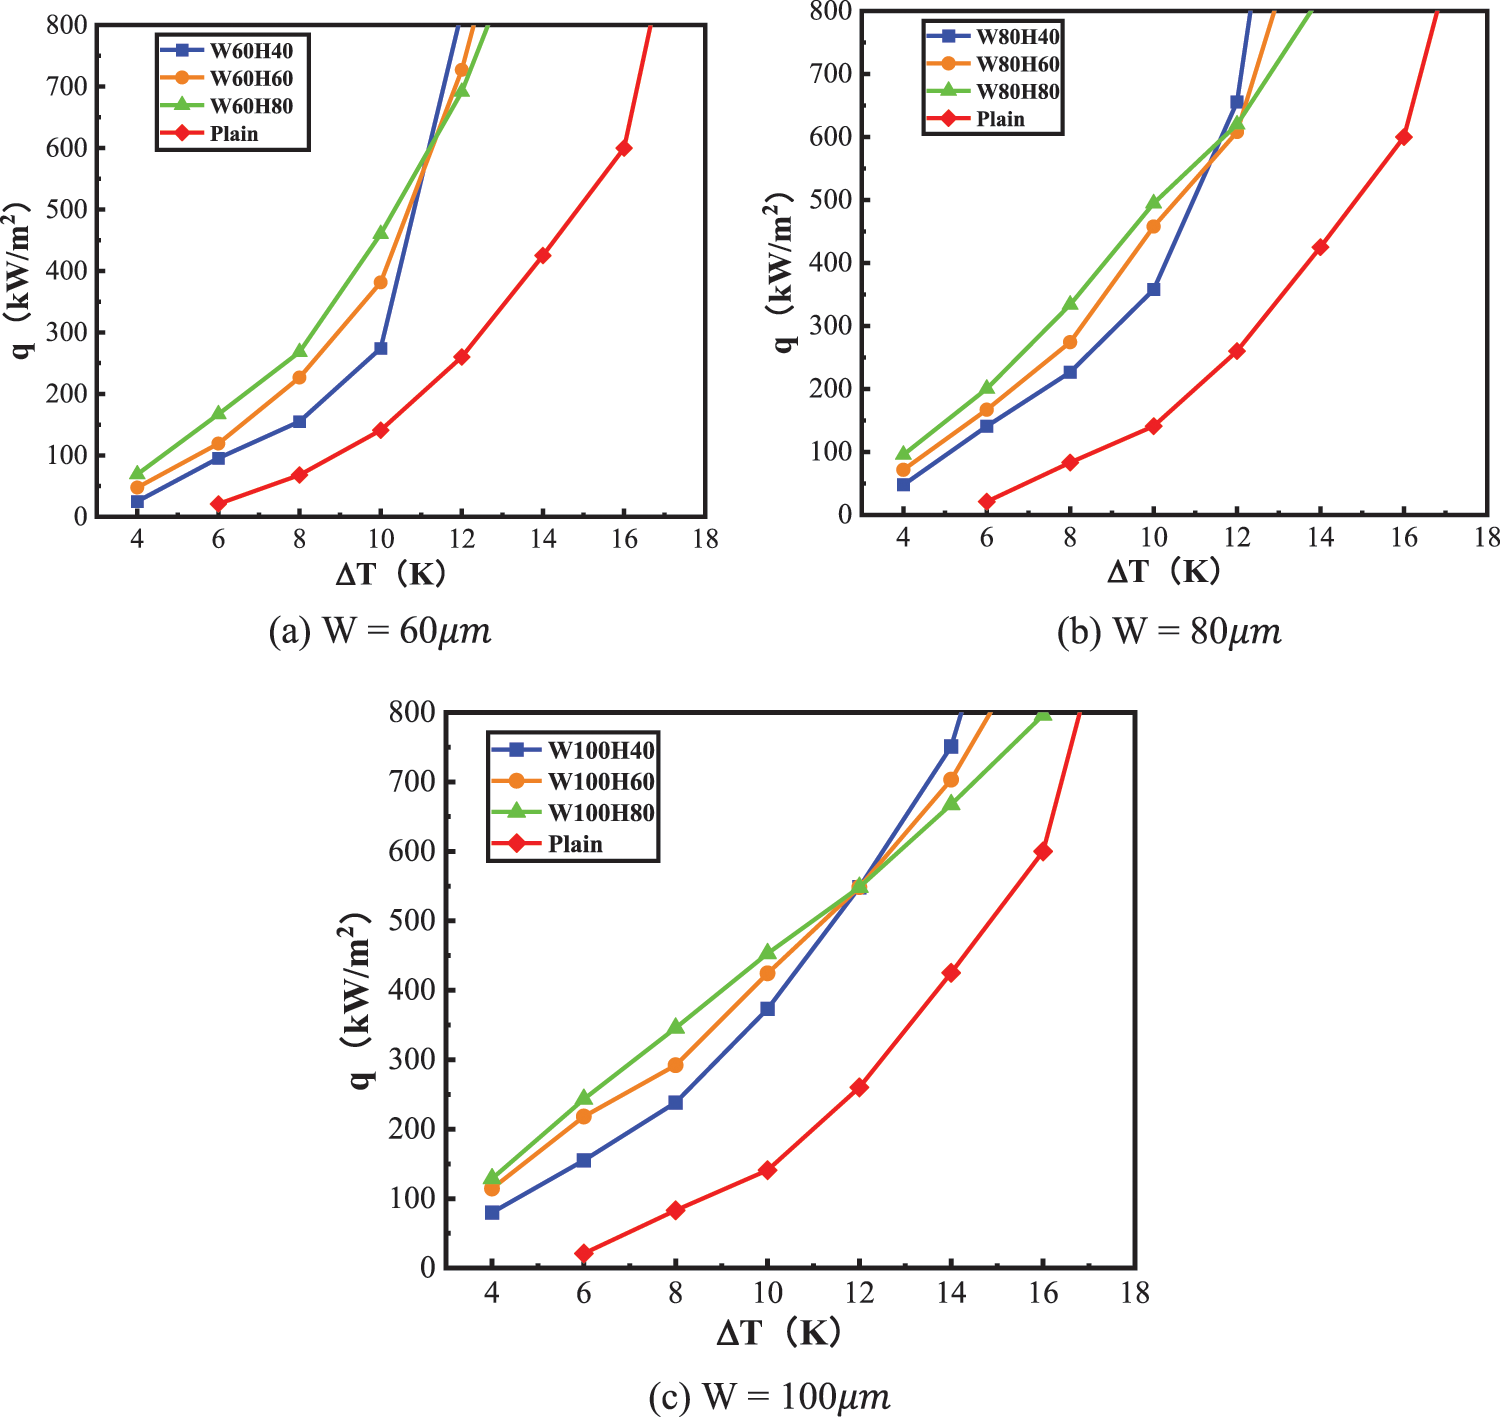
Figure 13: The heat flux density curves for plates with microchannels of different heights and widths
As Fig. 13a shows, under the same heat flux density, the degree of superheating of the surface of the evaporation end bottom plate with the microchannel structure is lower than that of the flat evaporation end bottom plate. When the heat flux density is, low, the greater the depth for the same width of the microchannel, the better the boiling heat transfer performance; when the heat flux density is high, the reverse is true. The overall trend is the same when the microchannel width is 80 μm (Fig. 13b), but when the heat flux density is higher, the boiling curve of the bottom plate of the evaporation end of the 80 μm microchannel is closer to the flat bottom plate than that of the 60 μm. When the microchannel width is 100 μm (Fig. 13c), the change of the boiling curve tends to expand further compared with the phenomenon. For example, when the degree of wall superheating, ΔT = 4 K, the heat flux density of W100H80 reached 128.736 kW/m², while that of W60H80 was only 69.136 kW/m².
In summary, for the scale of 40∼100 μm, the boiling heat transfer performance of the evaporation end bottom plate with the microchannel structure is greatly improved compared with that of the planar structure. For the microchannel evaporation end bottom plate, when the heat flux density is small, the larger the width and depth of the microchannel, the better the boiling heat transfer performance. When the heat flux density is high, however, increasing the width and depth of the microchannel has a negative impact on the boiling heat transfer performance.
5 Numerical Simulation Setup and Analysis of the Results
As the volume fraction of the discrete phase in this simulation is greater than 10%, the Euler-Eulerian method was used for the simulation [33]. The volume of fluid (VOF), mixture, and Eulerian Euler models are two-phase flow models in the Euler method. We wish to observe the behavior characteristics of bubbles and monitor the energy and mass transfer between the gas and liquid phases during the boiling process. Typical behavior characteristics include growth and detachment, as well as the disturbance phenomenon brought about by the bubbles detached from the heated wall to the fluid near the wall. Therefore, the VOF model was selected for this simulation.
The VOF model is based on the immiscibility between phases in the flow field. That is, the sum of the volumes of each phase is 1, so the obtained volume fraction equation is:
Our boiling simulation only involves gas-liquid two-phase flow, so the above Eq. (17) can be expressed as:
Using the volume fractions of the gas-liquid two-phase flow in Eq. (18), the continuity equation can be obtained as follows:
Taking gravity and continuous body force into account, the momentum equation is as follows:
The mixed-phase density ρ and the mixed-phase dynamic viscosity μ can be calculated from the following Eqs. (22) and (23). While the calculation of the body force
The energy equation is as follows:
where E is the total energy per unit mass (J/kg), which is defined as follows:
Q is the source term, which is divided into two items according to the direction of energy transfer, as follows:
5.2 Computational Domain Structure and Meshing
A two-phase flow was used in this simulation. The initial liquid phase was liquid water, which filled the entire 10 mm × 10 mm fluid domain. The heating wall’s solid material was copper, and its thickness was set to 2 mm. Fig. 14 depicts the entire structure.
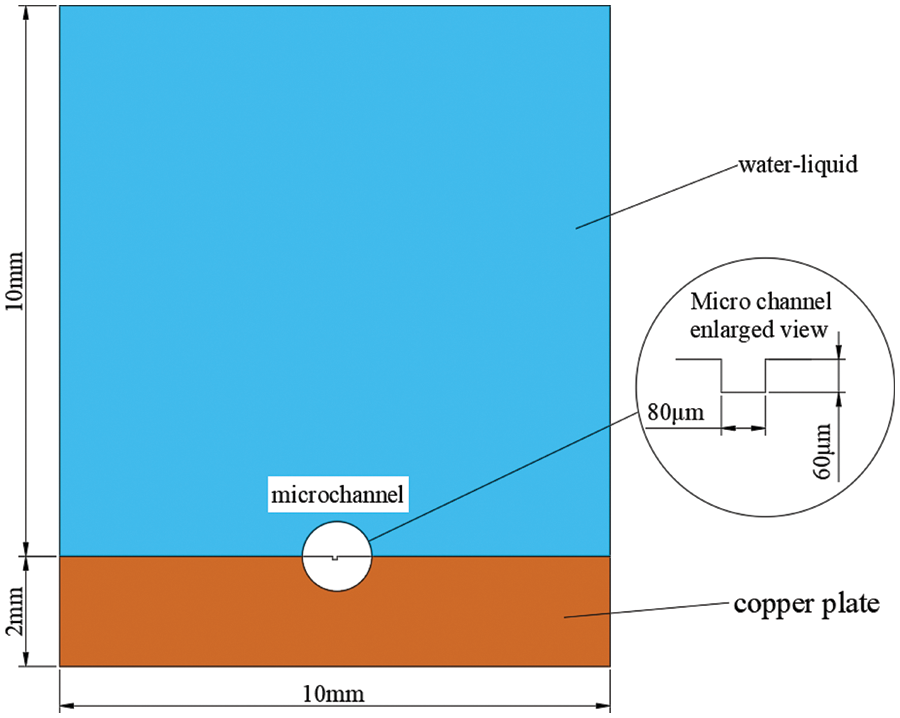
Figure 14: External geometry model for two-phase flow
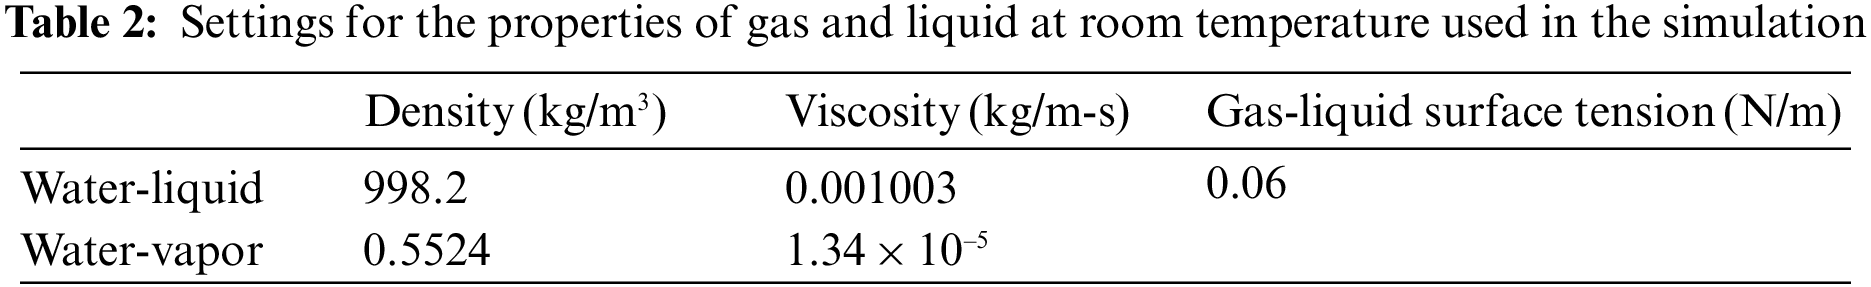
ICEM CFD software was used for mesh division, as shown in Fig. 15, and the entire computational domain was divided by hexahedral meshes. The meshes at the channel and the flow field were individually refined, and then the nodes were associated with each area. In addition to the liquid phase, which was set to liquid water (water-liquid), there was a vapor phase, which was set to water-vapor (water-vapor). Table 2 displays the settings for the physical properties of the two phases. In a multiphase flow setup, if one phase is a compressible gas, it is recommended that it be the primary phase, according to the Fluent software package handbook. So, we chose water vapor as the first phase and liquid water as the second.
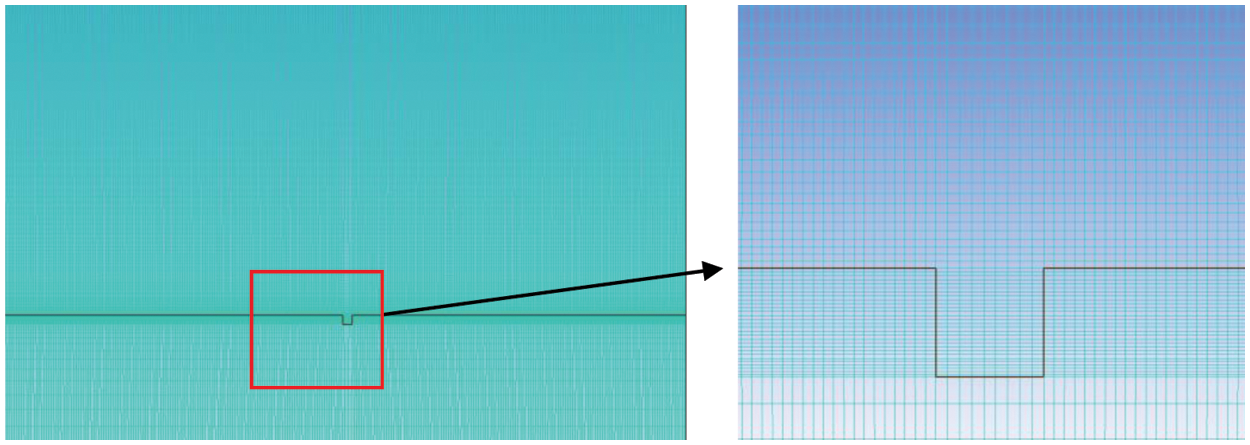
Figure 15: Schematic diagram of mesh division in ICEM
5.3 Analysis of Simulation Results
For the rectangular channel, numerical simulations were conducted for channels with the same width, but different depths and the heat transfer coefficient on the wall of the channel was monitored at the same time.
Fig. 16 shows the volume fraction of nephrograms during boiling of the gas phase under different channel depth structures. The depth of the microchannels of the top, middle, and bottom rows is 40, 60, and 80 μm, respectively. As time passes, the vaporization core point absorbs heat from the heating wall and expands, gradually covering the entire microchannel. When the bubble’s volume increases to a certain point, its buoyancy exceeds the surface tension of the bubble and the heating wall. When the bubbles detach from the heating wall, the surrounding supercooled liquid immediately fills the entire microchannel, forming a new vaporization core and initiating a new round of bubble growth. The bubbles on the 80 μm microchannel are the largest, which may be because the increase in the depth of the channel increases the contact surface between the bubbles and the heated wall, which is more conducive to the growth of the bubbles by heating. The microchannel with a depth of 80 μm takes the least time for bubble growth, which is 7.5 ms, followed by the groove with a depth of 60 μm, while the groove with a depth of 40 μm takes the most time (9.8 ms). This demonstrates that with a rectangular microchannel structure and an 80 μm width, the growth period of the bubbles decreases as the microchannel depth increases-that is, the frequency of bubble detachment is positively correlated with microchannel depth.
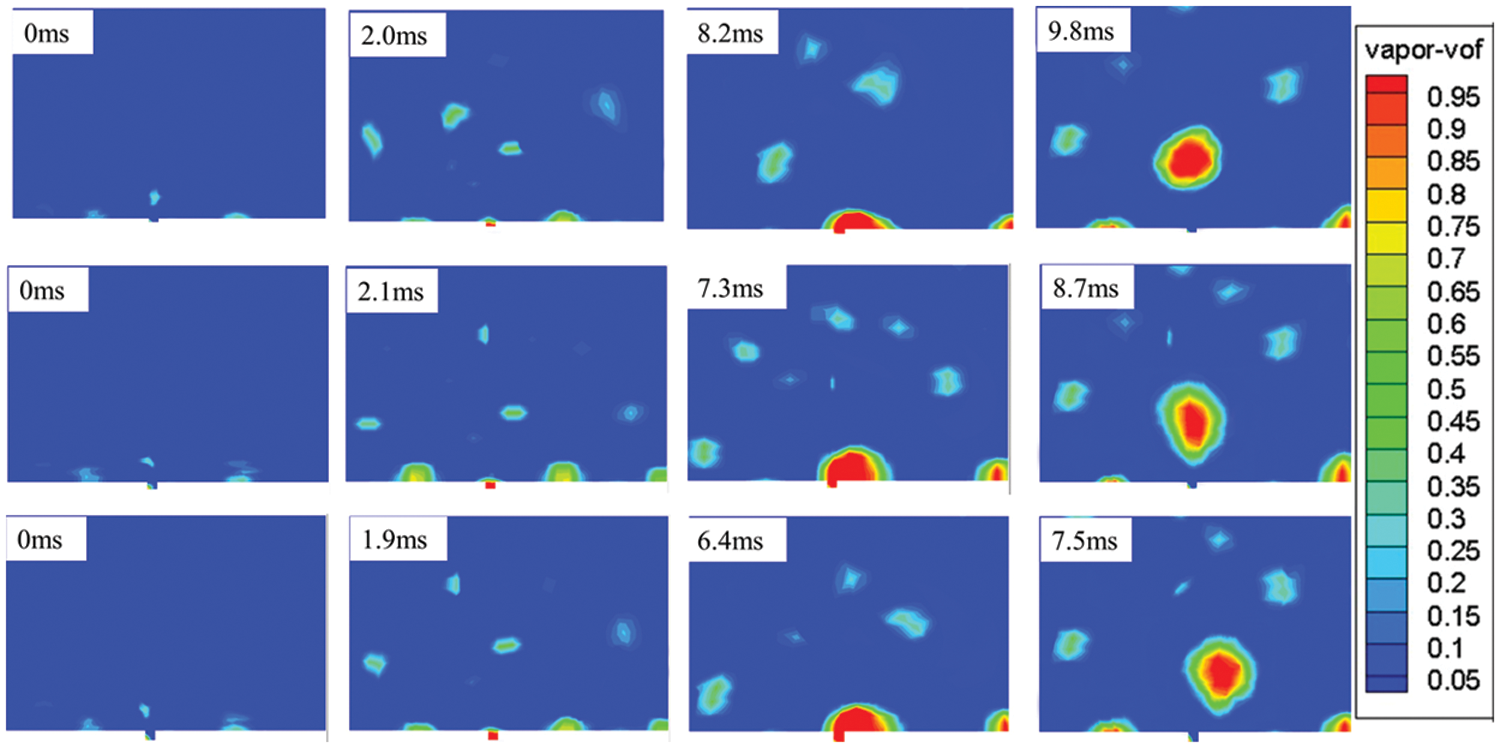
Figure 16: Bubble growth process on microchannels with different depths at a superheat of 6 K
The gas phase volume fraction nephrogram can visually represent the bubble growth process, and the heat transfer coefficient can directly indicate the heat transfer performance of the microchannel.
As Fig. 17 shows, at the beginning of boiling, the heat transfer coefficients at the three depths all reached the peak value and then showed a certain periodic change. This is caused by the nucleation, growth, aggregation, detachment, and other behavior of the bubbles at the channel.
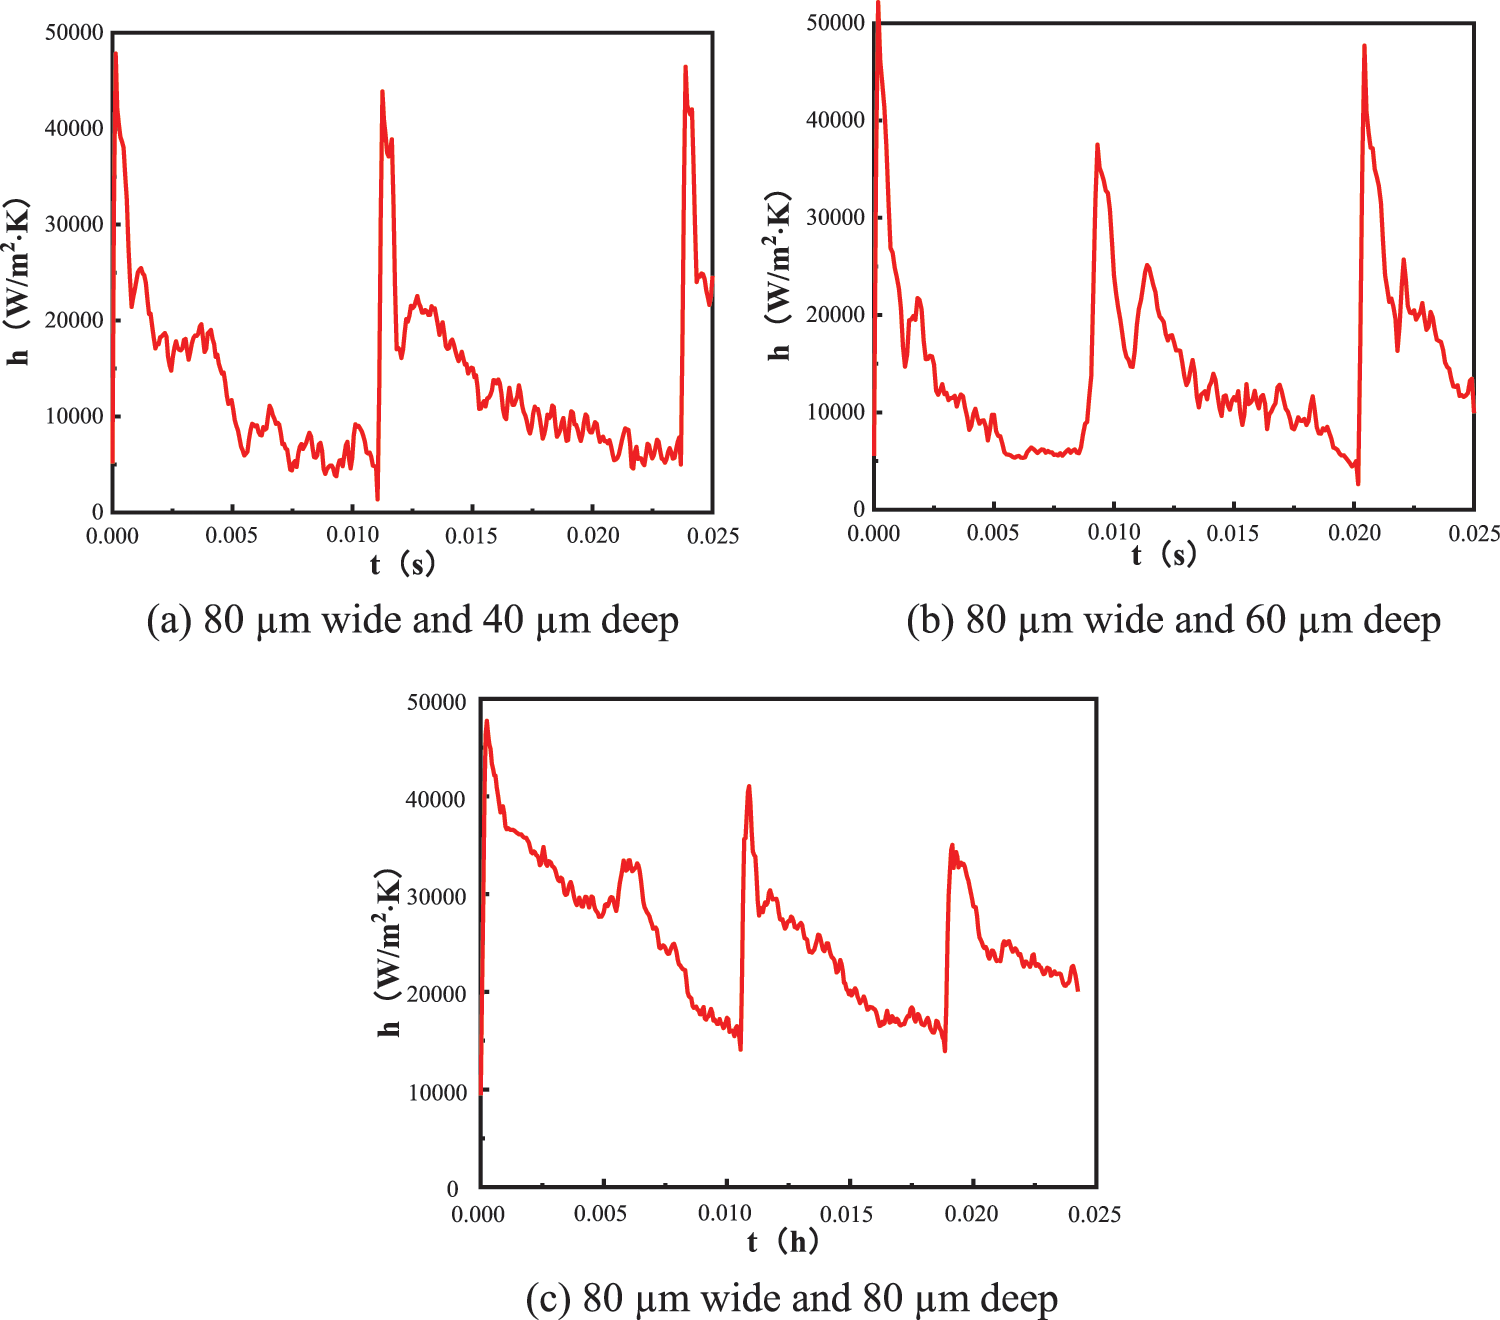
Figure 17: Heat transfer coefficients for channels of the same width but different depths with ΔT = 6 K
Comparing Figs. 17a–17c, it can be seen that the channel with a depth of 80 μm has a higher heat transfer coefficient than the 40 and 60 μm-depth structures, and the minimum heat transfer coefficient is also greater than 1000 W/m²⋅K. In terms of periodicity, the heat transfer coefficient of the 40 μm structure has only experienced 2 cycles in 0.25 s, while the change in the heat transfer coefficient of the 60 μm structure is already halfway through a third cycle, and that of the 80 μm structure is about to complete a third full cycle. This demonstrates that, for a given channel width, the deeper the microchannel, the greater the frequency of bubble detachment. This could be because when the superheat is low, the boiling on the heating wall is not violent, and many bubbles grow from the channel’s nucleation points. As the depth of the channel increases, the contact surface of the bubbles and the heating wall makes the bubbles grow rapidly to separate from the heating wall. Therefore, for the rectangular microchannel, at a low level of wall superheat, for a given width, the increase in depth is conducive to the growth and detachment of bubbles, which can effectively improve the heat transfer coefficient and enhance the heat transfer performance.
The heat transfer performance of three different shapes of microchannels–rectangular, V-shaped, and U-shaped (Fig. 18)–was also analyzed.
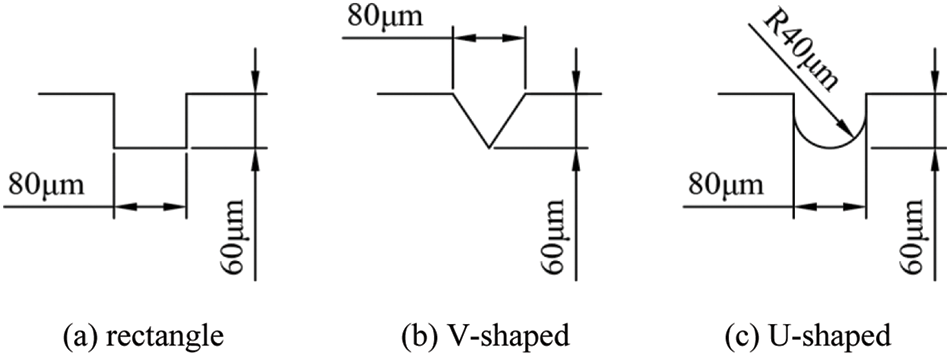
Figure 18: Schematic diagram of microchannels with different shapes
The analysis showed that the effect of the bubble behavior on the surface heat transfer coefficient during the boiling heat transfer process is basically the same for the V-shaped and U-shaped microchannels as for the rectangular microchannel and will not be repeated here. The analysis was focused on the variation of the heat transfer coefficient with time for the three different shapes under the condition of a superheat of 6 K.
Fig. 19 depicts the evolution of the surface heat transfer coefficient with time for microchannels of various geometries. The rectangular microchannel structure has a higher peak value of the surface heat transfer coefficient than the V-shaped and U-shaped microchannels, but its bubble growth period is longer. The evolution of the surface heat transfer coefficients and the bubble generation frequencies of the V-shaped and U-shaped structures are similar, but the heat transfer coefficient of the V-shaped structure is slightly larger than that of the U-shaped structure.
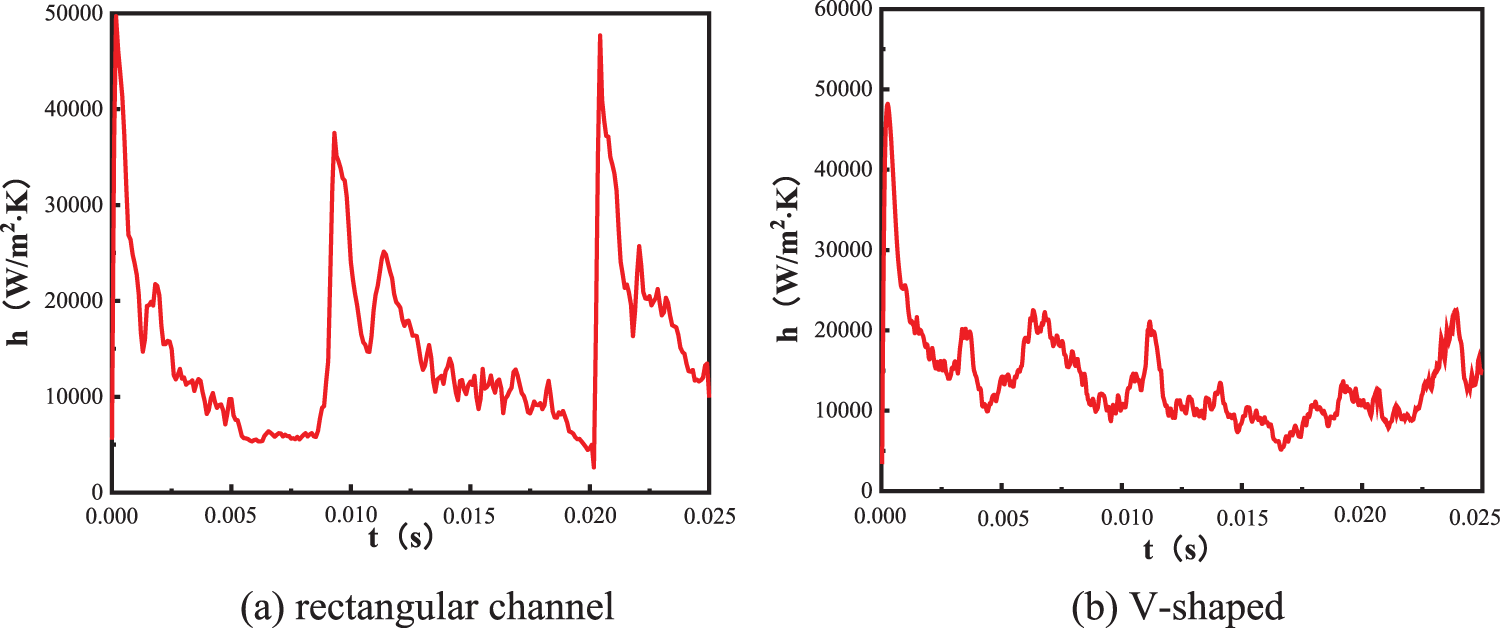
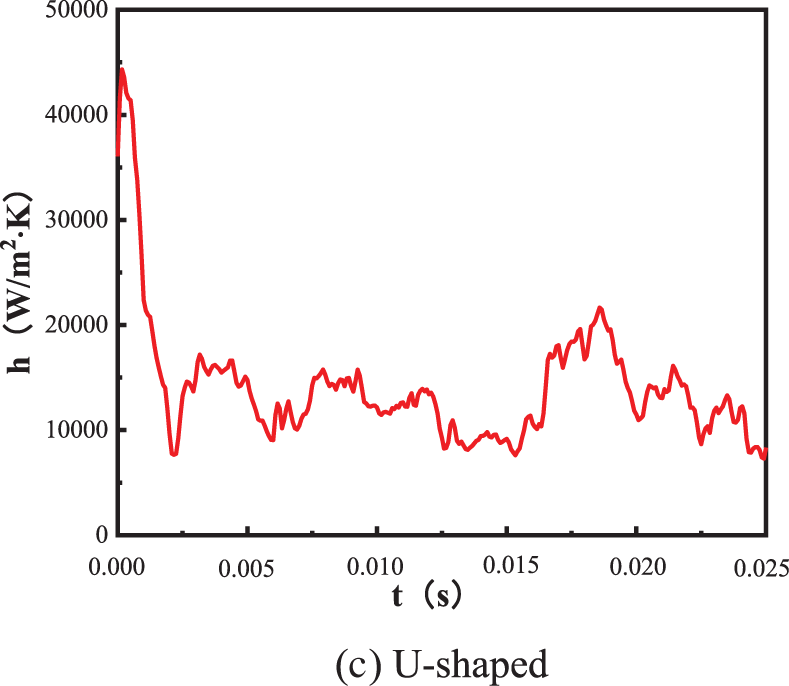
Figure 19: Heat transfer coefficients of the lower surface of microchannels with the same width and depth but different geometries
In this paper, the effect of microchannel structure on bubble detachment diameter, bubble detachment frequency, and boiling heat transfer performance was studied by a combination of simulation and experimental studies. The results of the study can be summarized as follows:
(1) A single bubble will go through three stages in the process of nucleation of microchannels, growth on the substrate, bubble growth and detachment, and complete detachment. When compared to a flat bottom plate, the presence of microchannels causes bubbles to expand to a larger diameter before detaching.
(2) The average level of bubble detachment frequency, f, at the bottom plate of the evaporation end is much higher than at the flat evaporation end due to the capillary force provided by the microchannel structure. However, when the degree of wall superheating, ΔT ≥ 8 K, the large superheat causes bubbles to merge on the heating surface, and the bubble detachment diameter increases, resulting in a decrease in f.
(3) The depth of the microchannel greatly influences the frequency of bubble detachment. When the microchannel is deeper, the capillary force is stronger, which is more conducive to the growth of bubbles.
(4) Under the same heat flux density, the degree of superheating of the surface of the evaporation end bottom plate with the microchannel structure is lower than that of the flat evaporation end bottom plate, which indicates that the microchannel structure significantly improves the boiling heat transfer performance.
(5) When the heat flux density is small, for microchannels of the same width, the greater the depth, the better the boiling heat transfer performance. When the heat flux density is high, the reverse is true. The smaller the depth, the better the boiling heat transfer performance.
(6) The peak value of the surface heat transfer coefficient of microchannels with different geometries follows the trend rectangular > V-shaped > U-shaped.
Funding Statement: This work was supported by the National Natural Science Foundation of China Youth Program (Grant No. 51905328).
Conflicts of Interest: The authors declare that they have no conflicts of interest to report regarding the present study.
References
1. Guo, Z. Y. (2000). Frontier of heat transfer–microscale heat transfer. Advances in Mechanics, 2000(1), 1–6. [Google Scholar]
2. Xie, H., Ali, A., Bhatia, R. (1998). The use of heat pipes in personal computers. Thermomechanical Phenomena in Electronic Systems-Proceedings of the Intersociety Conference, pp. 442–448. Seattle, WA, USA. [Google Scholar]
3. Connors, M. J., Zunner, J. A. (2009). The use of vapor chambers and heat pipes for cooling military embedded electronic devices. Proceedings-IEEE Military Communications Conference MILCOM, pp. 1–7. Piscataway, USA. [Google Scholar]
4. Nukiyama, S. (1966). The maximum and minimum values of the heat Q transmitted from metal to boiling water under atmospheric pressure. International Journal of Heat and Mass Transfer, 9(12), 1419–1433. https://doi.org/10.1016/0017-9310(66)90138-4 [Google Scholar] [CrossRef]
5. Li, S. W., Puragliesi, R., Yang, F., Yu, H. X., Shen, C. F. (2020). Simulation and application of subcooled boiling natural convection two-phase CFD. Atomic Energy Science and Technology, 54(1), 59–65. [Google Scholar]
6. Chen, H. X., Li, L. H., Gao, X., Wang, Y., Guo, Y. X. (2022). Subsection regulation of infiltration-enhanced nucleate boiling based on bubble dynamics. CIESC Journal, 73(4), 1557–1565. [Google Scholar]
7. Chen, Z. H., Wu, F. F., Utaka, Y., Chen, P., Liang, C. (2021). An improved treatment on the apparent contact angle of a single-bubble in consideration of microlayer for simulations of nucleate pool boiling. Journal of Thermal Science, 30(6), 1951–1959. https://doi.org/10.1007/s11630-021-1453-0 [Google Scholar] [CrossRef]
8. Zhou, S., Xu, X., Sammakia, B. G. (2013). Modeling of boiling flow in microchannels for nucleation characteristics and performance optimization. International Journal of Heat and Mass Transfer, 64, 706–718. https://doi.org/10.1016/j.ijheatmasstransfer.2013.05.031 [Google Scholar] [CrossRef]
9. Stutz, B., Lallemand, M., Raimbault, F., Passos, J. (2007). Nucleate and transition boiling in narrow horizontal spaces. Heat and Mass Transfer, 45(7), 929–935. https://doi.org/10.1007/s00231-007-0325-9 [Google Scholar] [CrossRef]
10. Ma, X., Cheng, P. (2018). Numerical simulation of complete pool boiling curves: From nucleation to critical heat flux through transition boiling to film boiling. Nuclear Science and Engineering, 1–13. https://doi.org/10.1080/00295639.2018.1504566 [Google Scholar] [CrossRef]
11. Nozawa, M., Kimura, N., Murakami, M., Takada, S. (2009). Thermo-fluid dynamics of several film boiling modes in He II in the pressure range between atmospheric pressure and saturated vapor pressure. Cryogenics, 49(10), 583–588. https://doi.org/10.1016/j.cryogenics.2008.10.022 [Google Scholar] [CrossRef]
12. Zhang, C., Wu, S., Yao, F. (2019). Evaporation regimes in an enclosed narrow space. International Journal of Heat and Mass Transfer, 138, 1042–1053. https://doi.org/10.1016/j.ijheatmasstransfer.2019.04.113 [Google Scholar] [CrossRef]
13. Ranjan, R., Murthy, J. Y., Garimella, S. V. (2012). Bubble dynamics during capillary-fed nucleate boiling in porous media. 13th InterSociety Conference on Thermal and Thermomechanical Phenomena in Electronic Systems, pp. 1114–1126. San Diego, CA, USA. [Google Scholar]
14. Vontas, K., Andredaki, M., Georgoulas, A., Miché, N., Marengo, M. (2021). The effect of surface wettability on flow boiling characteristics within microchannels. International Journal of Heat and Mass Transfer, 172, 121–133. https://doi.org/10.1016/j.ijheatmasstransfer.2021.121133 [Google Scholar] [CrossRef]
15. Raut, H. S., Bhattacharya, A., Sharma, A. (2021). Dual grid level set method based direct numerical simulations of nucleate boiling with oscillating base plate. International Journal of Thermal Sciences, 162, 106785. https://doi.org/10.1016/j.ijthermalsci.2020.106785 [Google Scholar] [CrossRef]
16. Zhang, L., Wang, T., Kim, S., Jiang, Y. (2020). The effects of wall superheat and surface wettability on nucleation site interactions during boiling. International Journal of Heat and Mass Transfer, 146, 118820. https://doi.org/10.1016/j.ijheatmasstransfer.2019.118820 [Google Scholar] [CrossRef]
17. Chen, H. X., Sun, Y., Li, L. H., Wang, X. D. (2020). Bubble dynamics and heat transfer performance on micro-pillars structured surfaces with various pillars heights. International Journal of Heat and Mass Transfer, 163, 120502. https://doi.org/10.1016/j.ijheatmasstransfer.2020.120502 [Google Scholar] [CrossRef]
18. Yazdani, M., Alahyari, A., Radcliff, T. (2016). A high-fidelity approach towards simulation of pool boiling. Physics of Fluids, 28, 012111. https://doi.org/10.1063/1.4940042 [Google Scholar] [CrossRef]
19. Alugoju, U. K., Dubey, S. K., Javed, A. (2020). 3D transient heat transfer analysis and flow visualization study in diverging microchannel for instability mitigated two-phase flow: A numerical study. International Journal of Heat and Mass Transfer, 160, 120212. https://doi.org/10.1016/j.ijheatmasstransfer.2020.120212 [Google Scholar] [CrossRef]
20. Ahmed, H. E., Ahmed, M. I. (2015). Optimum thermal design of triangular, trapezoidal and rectangular grooved microchannel heat sinks. International Communications in Heat and Mass Transfer, 66, 47–57. https://doi.org/10.1016/j.icheatmasstransfer.2015.05.009 [Google Scholar] [CrossRef]
21. Cao, H. L., Zhang, H. F., Zuo, Q. L., An, Q., Zhang, Z. Y. et al. (2021). Study on pool boiling heat transfer performance of trapezoidal microchannel surface. CIESC Journal, 72(8), 4111–4120. [Google Scholar]
22. Chen, H. X., Sun, Y., Xiao, H. Y., Liu, L. (2019). Numerical simulation of single bubble boiling on micro-pillar structure surface. Chemical Industry and Engineering Progress, 38(11), 4845–4855. [Google Scholar]
23. Mu, Y. T., Chen, L., He, Y. L., Kang, Q. J., Tao, W. Q. (2017). Nucleate boiling performance evaluation of cavities at mesoscale level. International Journal of Heat and Mass Transfer, 106, 708–719. [Google Scholar]
24. Zhou, P., Liu, Z., Liu, W., Duan, X. (2019). LBM simulates the effect of sole nucleate site geometry on pool boiling. Applied Thermal Engineering, 160, 114027. https://doi.org/10.1016/j.applthermaleng.2019.114027 [Google Scholar] [CrossRef]
25. Tiwari, N., Moharana, M. K. (2021). Conjugate effect on flow boiling instability in wavy microchannel. International Journal of Heat and Mass Transfer, 166, 120791. https://doi.org/10.1016/j.ijheatmasstransfer.2020.120791 [Google Scholar] [CrossRef]
26. Hutter, C., Sanna, A., Karayiannis, T. G., Kenning, D. B. R., Nelson, R. A. et al. (2013). Vertical coalescence during nucleate boiling from a single artificial cavity. Experimental Thermal and Fluid Science, 51, 94–102. [Google Scholar]
27. Yan, L., Li, H., Li, L., Wu, C. (2014). Bubble behavior of flow boiling in horizontal rectangular channels with inclined ribs. International Journal of Heat and Mass Transfer, 75, 514–522. [Google Scholar]
28. Thiagarajan, S. J., Yang, R., King, C., Narumanchi, S. (2015). Bubble dynamics and nucleate pool boiling heat transfer on microporous copper surfaces. International Journal of Heat and Mass Transfer, 89, 1297–1315. [Google Scholar]
29. Deng, D., Feng, J., Huang, Q., Tang, Y., Lian, Y. (2016). Pool boiling heat transfer of porous structures with reentrant cavities. International Journal of Heat and Mass Transfer, 99, 556–568. [Google Scholar]
30. Sun, Y., Chen, G., Zhang, S., Tang, Y., Zeng, J. et al. (2017). Pool boiling performance and bubble dynamics on microgrooved surfaces with reentrant cavities. Applied Thermal Engineering, 125, 432–442. [Google Scholar]
31. Wen, R., Xu, S., Lee, Y. C., Yang, R. (2018). Capillary-driven liquid film boiling heat transfer on hybrid mesh wicking structures. Nano Energy, 51, 373–382. https://doi.org/10.1016/j.nanoen.2018.06.063 [Google Scholar] [CrossRef]
32. Wang, L., Wang, Y., Cheng, W., Yu, H., Xu, J. (2021). Boiling heat transfer properties of copper surface with different microstructures. Materials Chemistry and Physics, 267, 124589. https://doi.org/10.1016/j.matchemphys.2021.124589 [Google Scholar] [CrossRef]
33. ANSYS, Inc. (2011). Multiphase flows. In: ANSYS fluent theory guide (Release 13). Canonsburg: ANSYS, Inc. [Google Scholar]
34. Brackbill, J. U., Kothe, D. B., Zemach, C. (1992). A continuum method for modeling surface tension. Journal of Computational Physics, 100(2), 335–354. https://doi.org/10.1016/0021-9991(92)90240-Y [Google Scholar] [CrossRef]
Cite This Article
 Copyright © 2023 The Author(s). Published by Tech Science Press.
This work is licensed under a Creative Commons Attribution 4.0 International License , which permits unrestricted use, distribution, and reproduction in any medium, provided the original work is properly cited.
 Downloads
 Citation Tools