
 Submit a Paper
 Propose a Special lssue
 Open Access
ARTICLE

SepFE: Separable Fusion Enhanced Network for Retinal Vessel Segmentation
1 College of Computer Science and Technology, Hengyang Normal University, Hengyang, 421002, China
2 Hunan Provincial Key Laboratory of Intelligent Information Processing and Application, Hengyang, 421002, China
* Corresponding Author: Ge Jiao. Email:
(This article belongs to the Special Issue: Artificial Intelligence for Mobile Edge Computing in IoT)
Computer Modeling in Engineering & Sciences 2023, 136(3), 2465-2485. https://doi.org/10.32604/cmes.2023.026189
Received 22 August 2022; Accepted 25 November 2022; Issue published 09 March 2023
 View Full Text
 Download PDF
Abstract
The accurate and automatic segmentation of retinal vessels from fundus images is critical for the early diagnosis and prevention of many eye diseases, such as diabetic retinopathy (DR). Existing retinal vessel segmentation approaches based on convolutional neural networks (CNNs) have achieved remarkable effectiveness. Here, we extend a retinal vessel segmentation model with low complexity and high performance based on U-Net, which is one of the most popular architectures. In view of the excellent work of depth-wise separable convolution, we introduce it to replace the standard convolutional layer. The complexity of the proposed model is reduced by decreasing the number of parameters and calculations required for the model. To ensure performance while lowering redundant parameters, we integrate the pre-trained MobileNet V2 into the encoder. Then, a feature fusion residual module (FFRM) is designed to facilitate complementary strengths by enhancing the effective fusion between adjacent levels, which alleviates extraneous clutter introduced by direct fusion. Finally, we provide detailed comparisons between the proposed SepFE and U-Net in three retinal image mainstream datasets (DRIVE, STARE, and CHASEDB1). The results show that the number of SepFE parameters is only 3% of U-Net, the Flops are only 8% of U-Net, and better segmentation performance is obtained. The superiority of SepFE is further demonstrated through comparisons with other advanced methods.Keywords
Fundus image contains several blood vessels, which is the only relatively deep microvascular system that can be directly observed in the human body, and contains a wealth of information [1]. Many diseases can be detected by examining the retinal vasculature, such as narrowed vessels or increased vascular tortuosity of the vascular can be observed in patients with hypertension [2]. Accordingly, accurate vessel segmentation can efficiently detect and diagnose early disease, limiting the progression of the disease in patients. In practice, clinicians must have extensive experience to ansure correct segmentation results, and there still is risk of subjectivity. Furthermore, there is a heavy workload in manual retinal vessel segmentation, and the process is laborious and time-consuming [3]. Many researchers have begun studying automated techniques for accurate retinal vessel segmentation to assist clinicians with this highly repetitive and subjective work [4,5].
Image segmentation algorithms based on full convolutional neural networks (FCNs) have recently received extensive research. U-Net is one of the most popular models, and many researchers have made a lot of attempts and improvements to it. Examples include incorporating residual blocks into the U-Net algorithm to alleviate gradient explosion [6], using dilated convolutions to expand the receptive field of the feature map [7,8], and employing attention mechanisms to improve the localization in region-of-interest (ROI) blood vessels [9,10]. Some cascade and multi-path structures have been proposed based on U-Net to further improve the performance [11,12]. Multiple network architectures are used in series or parallel to obtain more comprehensive semantics of target vessels. Although the U-shaped structures have achieved certain advances in research, these improvements also introduce a larger number of parameters and require excessive resources during the training and inference phases. This further limits model deployment on terminal devices, especially those that are embedded [13]. Secondly, the skip connection in each stage indiscriminately fuses local information. This introduces significant extraneous clutter [14,15] and makes it difficult to correctly distinguish between vascular pixels and complex noise. Therefore, it is valuable to construct a model that meets the required performance target while minimizing the number of parameters.
We propose a lightweight network called SepFE. The model uses depth-wise separable convolution [16] as the primary building block and achieves a performance comparable to standard convolution with fewer parameters. It is well known that feature extraction and selection significantly impact the performance of CNN models [17]. On the ImageNet dataset, it was demonstrated that MobileNet V2 [18] and VGG16 [19] have identical performance, with the number of parameters in MobileNet V2 only 3% of those from VGG16. Furthermore, direct transfer of the pre-trained backbone is regarded as an efficient method [20]. Based on this, we inject MobileNet V2 directly into the encoder of the model. This both improves the feature extraction capability and has a lower complexity. Ibtehaz et al. [15] and Peng et al. [21] strengthened the localization of features by integrating a deeper convolutional block and a larger convolutional kernel into the long connection module, respectively. Inspired by this, we propose a feature fusion residual module (FFRM), which employs inverted residual structures to learn two levels of features and uses the concatenation operation to enhance the complementary advantages. The main contributions of this paper are summarized as follows:
1) As an extension of U-Net, the proposed SepFE ingeniously introduces depth-wise separable convolutions to filter features, which decreases the computational complexity by reducing the number of parameters and calculations.
2) An FFRM is carefully designed to take full advantage of the complementarity by facilitating fusion of low-level and high-level features, which allows a more precise target location in complex backgrounds.
3) We propose a novel encoder-decoder model for retinal vessel segmentation that offers excellent performance with low complexity. Extensive tests on the DRIVE, STARE, and CHASEDB1 datasets reveal that the proposed model outperforms other methods and serves as a powerful new approach for computer-aided diagnosis in clinical practices.
Retinal vessel segmentation methods are generally classified as unsupervised and supervised as described below.
The unsupervised method does not require manually labeling samples and is roughly divided into four categories: matched filter-based, blood-vessel tracking, region growing, and mathematical morphology. Azzopardi et al. [22] proposed a retinal vessel segmentation algorithm based on the B-COSFIRF filter to select blood vessels and their ends. Zhang et al. [23] obtained vessel textons by responding to a multi-scale Gabor filter bank and accomplished the classification of vessel pixels with their help. Li et al. [24] proposed an approach to track blood vessels where candidate pixels are selected from the semi-ellipse region surrounding the optical disc and serve as a starting point for the vascular contour. The blood vessels are then traced by applying Bayesian theory to determine the corresponding vessel edge points. Unlike blood-vessel tracing, Shukla et al. [25] designed a fractional filter to remove artifacts from the input image. To sensitively detect low-contrast blood vessels, they also proposed an efficient centerline detection algorithm. Subsequently, they applied a region growing operation to locate blood vessels. The proposed algorithm is generalizable and can be extended to palm vein segmentation. To challenge the localization of blood vessels in color fundus imaging and scanning laser ophthalmoscopy (SLO) conditions, Pachade et al. [26] proposed a new segmentation framework. First, linear recursive filtering was used to enhance the vascular contrast. Morphological operations, background estimation and iterative thresholding were then combined to complete the vessel segmentation. After that, Tian et al. [27] proposed a morphology-based vessel segmentation method, which was divided into four steps. First, the contrast of the retinal image was amplified by histogram equalization. A modified Frangi filter was then used to enhance the blood vessels of the global image. Still, there were complications of weak contrast around the fine vessels. For that, they proposed again an improved mathematical morphology method to eliminate the interference noise around the fine vessels. Finally, the Otsu thresholding segmentation method completed the blood vessel segmentation. In general, unsupervised algorithms are convenient for generalization, but the performance of vessel segmentation is relatively poor.
Unlike unsupervised methods, supervised methods require manual annotation, are data-driven, and are superior for retinal vessel segmentation. Supervision methods include traditional machine learning and deep learning models based on convolutional neural networks (CNNs). In traditional machine learning, an image feature must be designed in advance to train the classifier for retinal vessel segmentation. Soares et al. [28] generated feature vectors using the 2D Morlet wavelet transform, which was then used to model and classify retinal blood vessels through Bayesian classifiers. Orlando et al. [29] employed a fully-connected conditional random field model to perform supervised learning. Akram et al. [30] enhanced blood vessel contrast through 2D Gabor wavelets and supervised retinal blood vessel segmentation with a proposed multi-layer threshold technique. Wang et al. [31] used matched filtering with multiwavelet kernels (MFMK) to enhance blood vessels and local adaptive threshold processing for segmentation. While these algorithms have produced improved segmentation results in specific situations, they cannot adapt to complex environments with large data volumes because the artificially designed underlying features cannot fully express the complex information of retinal vessels [32].
Researchers have recently introduced CNNs into medical image processing. Compared with traditional automatic segmentation algorithms, CNNs have advantages in dealing with complex environments [33]. Tang et al. [9] proposed a novel encoder-decoder architecture. The encoding used multi-scale channel importance sorting to identify valuable features while suppressing extraction from invalid features. The decoding introduced a spatial attention mechanism module to collect spatial vessel information, which improved the localization of blood vessel locations. Liu et al. [34] incorporated the concept of feature pyramids into the U-Net structure to obtain multi-scale semantic representations. To balance the importance of coarse and fine vessels, Yan et al. [35] used both pixel- and segment-level loss during training. Li et al. [36] designed a U-shaped architecture with the modulated deformable convolutional (MDC) block as the central element, and dual attention modules were used to emphasize the features. With developments in retinal vessel segmentation, many algorithms can encode and decode structures based primarily on cascade and multi-path structures as the underlying architecture. For example, Wang et al. [37] designed a dual-channel encoder based on U-Net, which retains a large receptive field and rich spatial information. Yang et al. [11] proposed a U-Net-based multitask segmentation network. They arranged two decoders to learn thin and thick vessels separately. Finally, they added a fusion-enhanced network to enhance the fusion between decoders. While these unsupervised and supervised methods have significant implications for the early detection of retinal diseases, it is still a challenge to propose a lower complexity and effective model in retinal vessel segmentation.
The framework of retinal vessel segmentation is shown in Fig. 1. The color fundus images are first pre-processed and patches are extracted, and the extracted patches are then trained with the SepFE model. Finally, the segmentation effectiveness of the model is tested. When the datasets lack masks, they need to be set manually using a threshold.

Figure 1: Framework for the retinal vessel segmentation. In the training stage, the pre-processed gray images are combined with masks to extract the blood vessels’ ROI. Then, a random extraction strategy is used to obtain training patches for the SepFE model to learn. In the testing stage, the same pre-processing methods are adopted. The overlapping extraction strategy fetches the test patches required for the model. After prediction, the results are regrouped to acquire complete segmentation maps
3.1 Pre-Processing and Patch Extraction
As color fundus images have significant noise and poor contrast, it is challenging to identify blood vessels from retinal images. We utilized three pre-processing strategies to better distinguish blood vessels from the background in fundus images. A comparison of the entire pre-processing method is illustrated in Fig. 2. The image is first converted from RGB to grayscale (

Figure 2: Comparison of different image enhancement methods. The first row represents the pre-processed images, the second row represents the corresponding histograms, and the third row represents the grayscale values of the same regions after pre-processing. The pre-processed images have increased contrast in the target regions by sacrificing the gray levels
As few retinal images are available, a patch-based learning strategy is used for training and testing, as shown in Fig. 3. During training, a random extraction strategy [40] is applied to extract patches of retinal images, which are used to train the model parameters. Each image is divided into 4000 patches with patch sizes of


Figure 3: Patch extraction showing (a) pre-processed image (top) and patches (bottom) along with (b) ground truth (top) and patches (bottom)
Fig. 4 depicts the proposed SepFE architecture based on the encoder-decoder. First, retinal patches of size (H, W) are fed into a depth-wise separable convolutional residual block. The pre-trained MobileNet V2 [18] structure is directly employed to generate semantically rich multi-scale features with shapes of (H/2, W/2, 16), (H/4, W/4, 24), (H/8, W/8, 32), and (H/16, W/16, 96). We then use the FFRM to progressively fuse the obtained multi-scale features with the up-sampled features. Improved semantic information is obtained by upgrading the effective fusion of the two feature levels. It is noted that we integrate the depth-wise separable convolution throughout the SepFE structure. Compared with standard convolution, our approach significantly minimizes the number of calculations and parameters.

Figure 4: Architecture of the proposed SepFE. It is based on a U-shaped structure and classified into three main modules: MobileNet V2 after pre-training, FFRM, and residual block
3.2.1 Depth-Wise Separable Convolution
Fig. 5 shows the depth-wise separable convolution, whose core principle is to divide the standard convolution into two parts: depth-wise convolution and point-wise convolution. First, the depth-wise convolution filters the data from the 2D feature maps on each input channel. The channel is then adjusted using a 1

Figure 5: Schematic of the standard convolution and depth-wise separable convolution
Depth-wise separable convolution is employed as the unit of the inverted residual block and residual block in SepFE due to its low computational cost. The inverted residual block acts as the core building block in both the MobileNet V2 [18] and FFRM, and its construction is given in Fig. 6a. The inverted residual blocks are divided into two categories. First is the residual structure with a shortcut of stride 1, which does not change the resolution of the input feature map. Second is a downsizing structure with a stride of 2, which halves the resolution of the input feature map. The feature map is then up-sampled using traditional convolution to acquire additional high-dimensional features during feature extraction. The depth-wise separable convolution is employed instead of standard convolutions, which substantially reduces the number of network parameters. A linear activation layer is then taken at the final step. Fig. 6b displays the residual units that replace the conventional convolution in the model. A shortcut is created when the dimensions of the input and output feature maps are the same. This allows training a deeper network while assuring accurate blood vessel information from the extraction.

Figure 6: Core building blocks in the SepFE structure with the (a) inverted residual block and (b) residual block
3.2.2 Feature Fusion Residual Module (FFRM)
The high-level information in the deeper network has rich semantic content, whereas the underlying information in the shallow network contains a wealth of spatial content. Low-level features can advantage from semantic information to abstract the target object globally, while high-level features can benefit from spatial information to reconstruct details. However, the traditional U-Net and its variants indiscriminately combine high-level features with lower-level features without taking full advantage of the complementary properties between them. Therefore, we propose a residual feature fusion module (FFRM), which relies on a low-complexity inverted residual block to facilitate fusion between the two feature levels.
This study compares four feature fusion blocks, which are shown in Figs. 7a–7d. Before fusion, part (a) performs one inverted residual operation on the low- and high-level feature maps, which represents the FFRM in SepFE. Part (b) depicts the traditional fusion of U-Net, in which the two feature levels are directly fused. Part (c) shows the concatenation after the inverted residual operation for the high-level feature map. Part (d) depicts the combination after the inverted residual operation for the low-level feature map. The ablation experiments show that the SepFE_a model has the best performance. This indicates that (a) is the globally optimal feature fusion block, which simultaneously retains more semantic information and recovers more spatial detail.
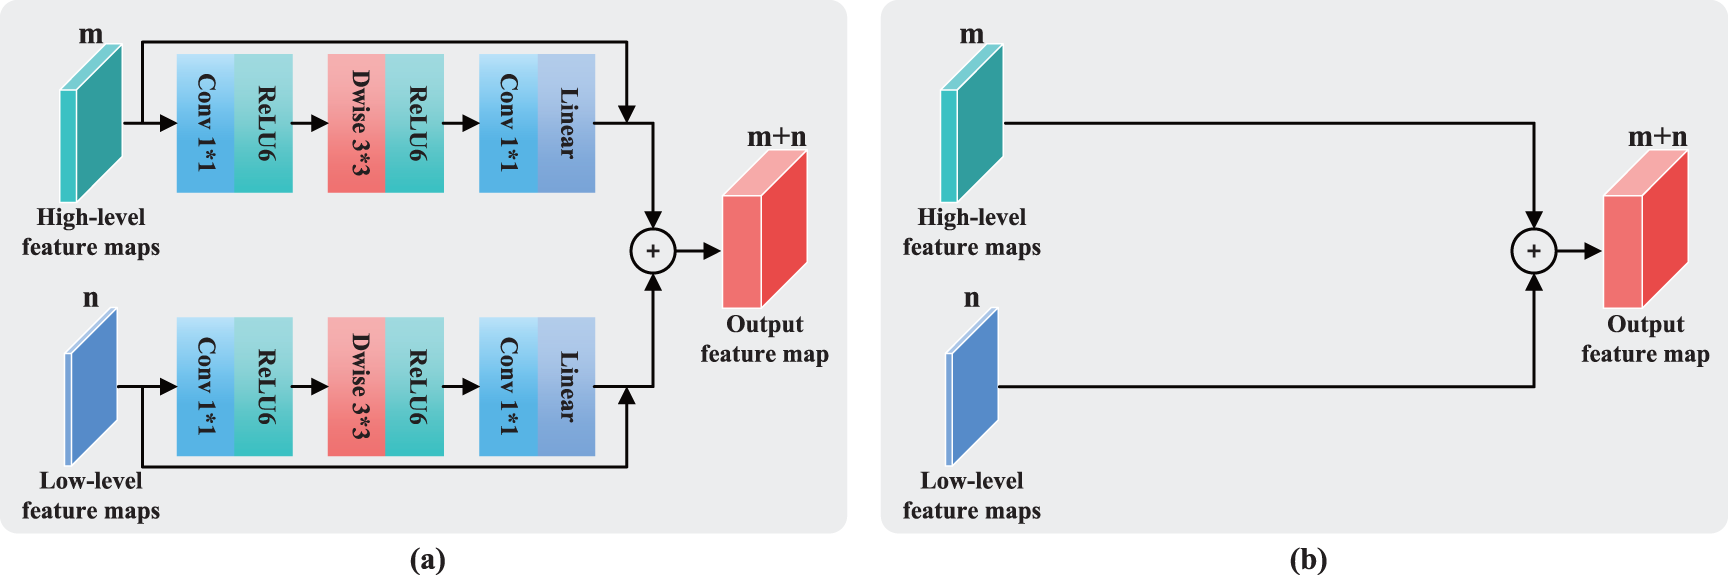

Figure 7: Feature fusion modules for the (a) FFRM, (b) standard U-Net concatenation operation, (c) concatenation operation after the inverted residual for high-level features, and (d) concatenation operation after the inverted residual for low-level features
The loss function is used to measure the consistency between the predicted and actual values. A good loss function may accelerate network training and increase model generalization. In this task, the dice loss and cross-entropy loss functions are hybridized as the blood vessel pixels in fundus images account for less than 10% of the image, and the blood vessel and the background are unevenly distributed. The dice loss function alleviates the problem of data imbalance in binary classification. Its formula is:
where A represents the blood vessel area as segmented by the model, B represents the blood vessel area as manually segmented by an expert, and
where
where
Three retinal image datasets (DRIVE [41], STARE [42], and CHASEDB1 [43]) are used in the experiments. DRIVE consists of 40 images with resolutions of
The experiments are performed on a Windows 10 operating system with hardware consisting of an i7-8700 CPU, an NVIDIA GeForce GTX 1080 GPU, 8 GB of video memory, and 32 GB of memory. The programming language is Python 3.8, and the deep learning framework is PyTorch. The initial learning rate is set to 0.0002, the batch size is set to 24, and Adam is used as the model optimizer during training. Our model is validated to achieve the desired segmentation results after less than 40 epochs.
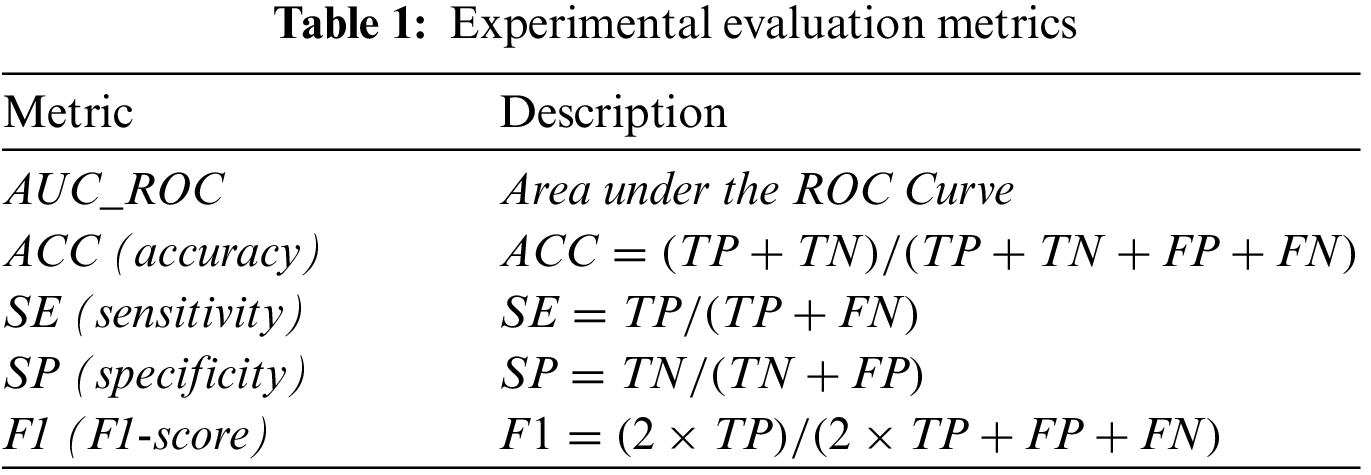
Retinal vessel segmentation is a binary classification problem that identifies whether each pixel in a fundus image is a blood vessel. We set the probability threshold to 0.5 during the experiments. The true positive (TP) represents blood vessel pixels in the fundus image that are judged as a blood vessel. Blood vessel pixels judged as non-vascular are a false negative (FN). The true negative (TN) represents non-vascular pixels in the fundus image that are determined as non-vascular. If these pixels are determined to be a blood vessel, it is a false positive (FP). Table 1 shows five evaluation metrics: area under the ROC curve (AUC_ROC), accuracy (ACC), sensitivity (SE), specificity (SP), and F1-score (F1). An AUC_ROC and F1-score of 1 suggest that it is a perfect classifier.
We evaluate the effectiveness of the proposed FFRM and hybrid loss function on the DRIVE dataset. The SepFE model is then systematically compared to U-Net and ResUnet [45] on the DRIVE, STARE, and CHASEDB1 datasets. The proposed SepFE is compared to other existing algorithms for retinal vessel segmentation to demonstrate its competitiveness. For better comparisons, we report the p-value for each set of comparison experiments using the
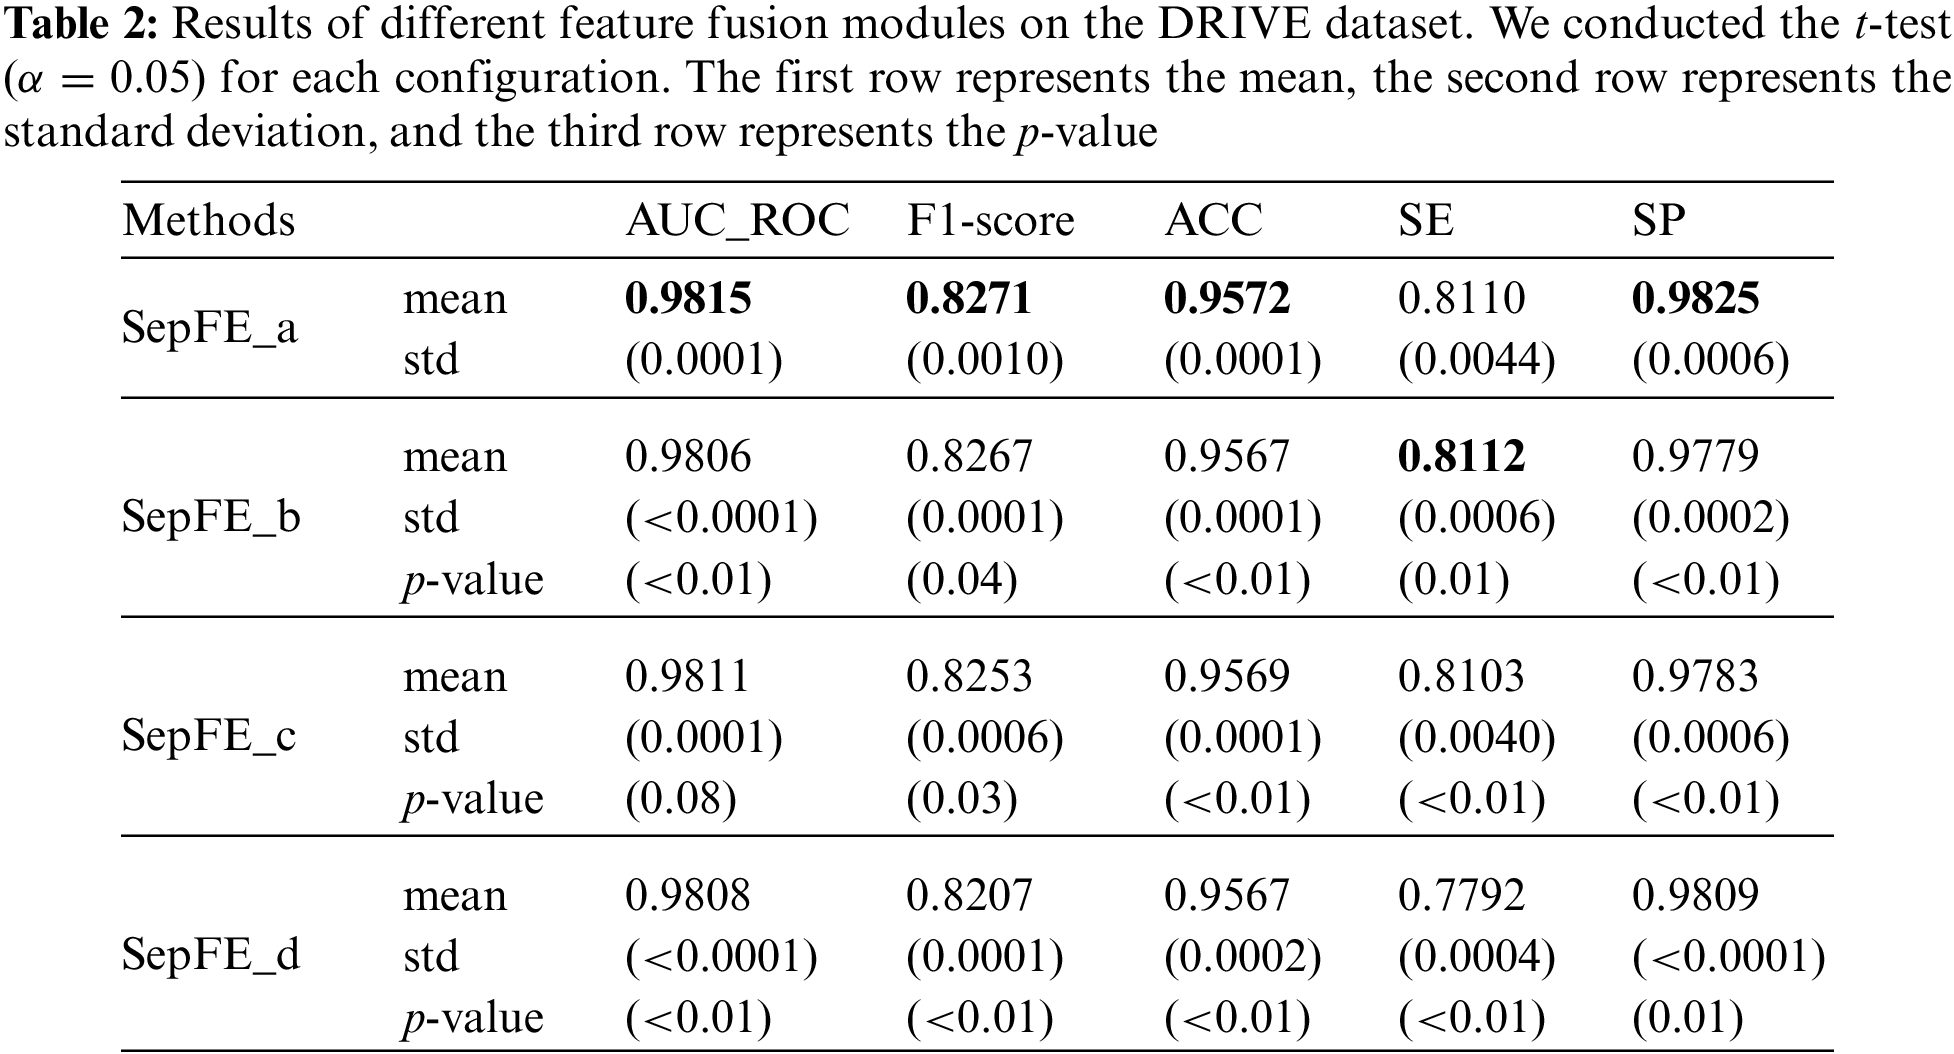
The following four structural variants are considered based on the different feature fusion modules shown in Figs. 7a–7d, which are labeled SepFE_a, SepFE_b, SepFE_c, and SepFE_d. In this study, AUC_ROC and the other indicators are evaluated for these four architectures using the DRIVE dataset, as shown in Table 2. The SepFE_a outperforms the other three structures in terms of the overall segmentation performance. As for SepFE_c and SepFE_d, their feature fusion modules only enhance one of the two levels of features before performing the fusion operation. This makes the captured topology not complete enough or the extracted target semantics relatively lacking, and the complementary nature of the shallow and deep features is not maximized. Thus, poor practical segmentation performance is achieved. The FFRM structure in SepFE_a uses inverted residual operations for both feature levels, which achieves more accurate localization and reconstruction of the semantic details. The comparison experiments in Table 2 show that the proposed FFRM is effective for vessel segmentation tasks.
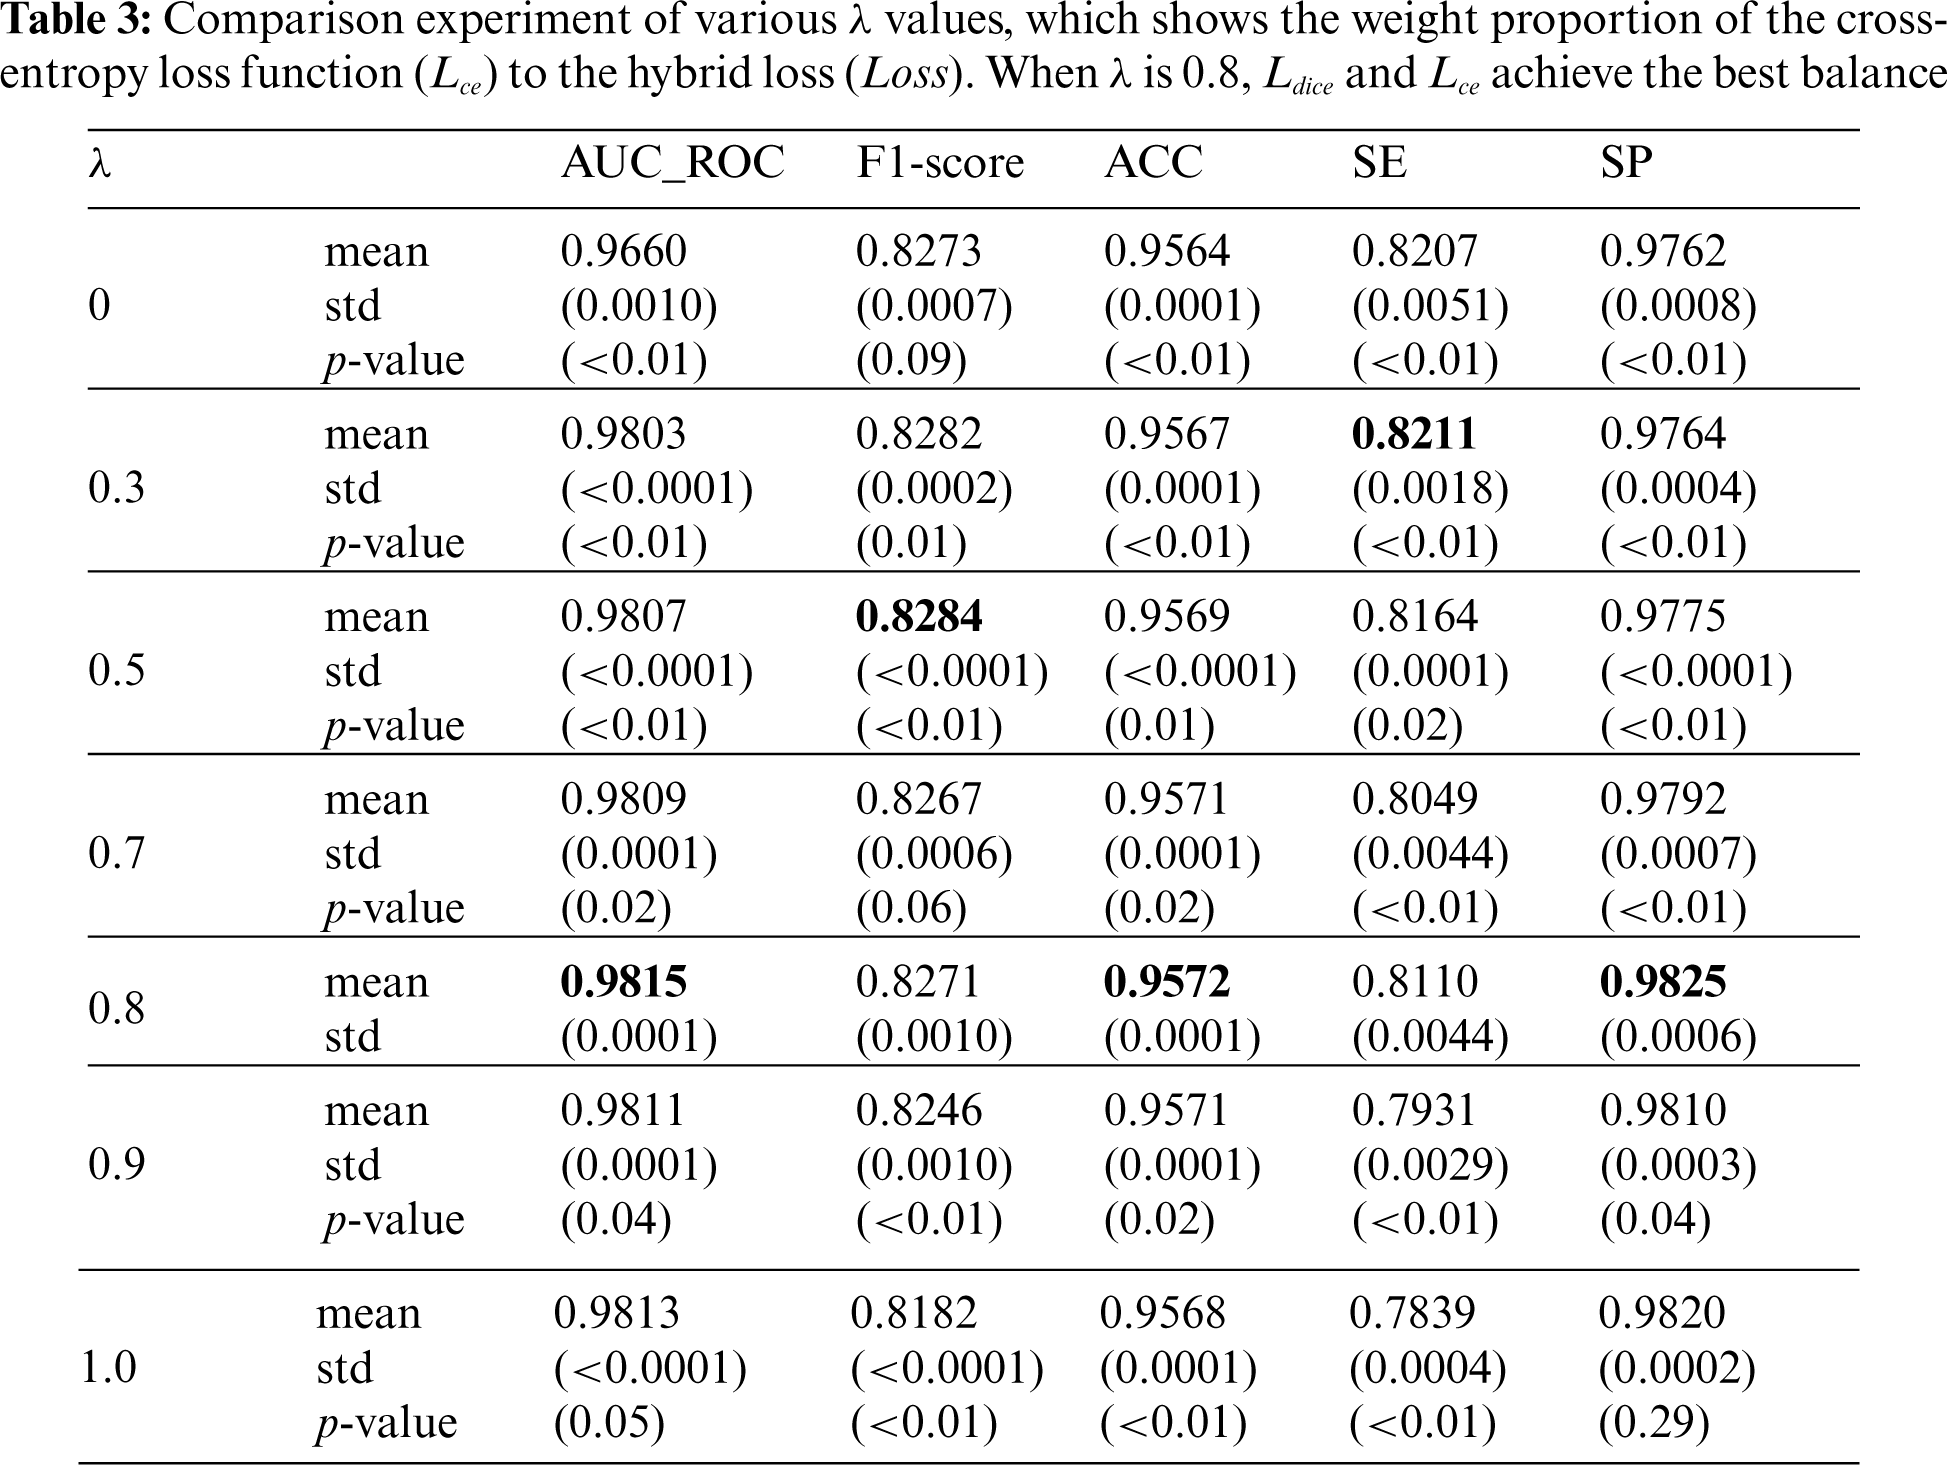
5.2 Effectiveness of the Hybrid Loss Function
This section analyzes the usefulness of the hybrid loss function and the value of the balance coefficient
5.3 Comparison with U-Net and ResUnet
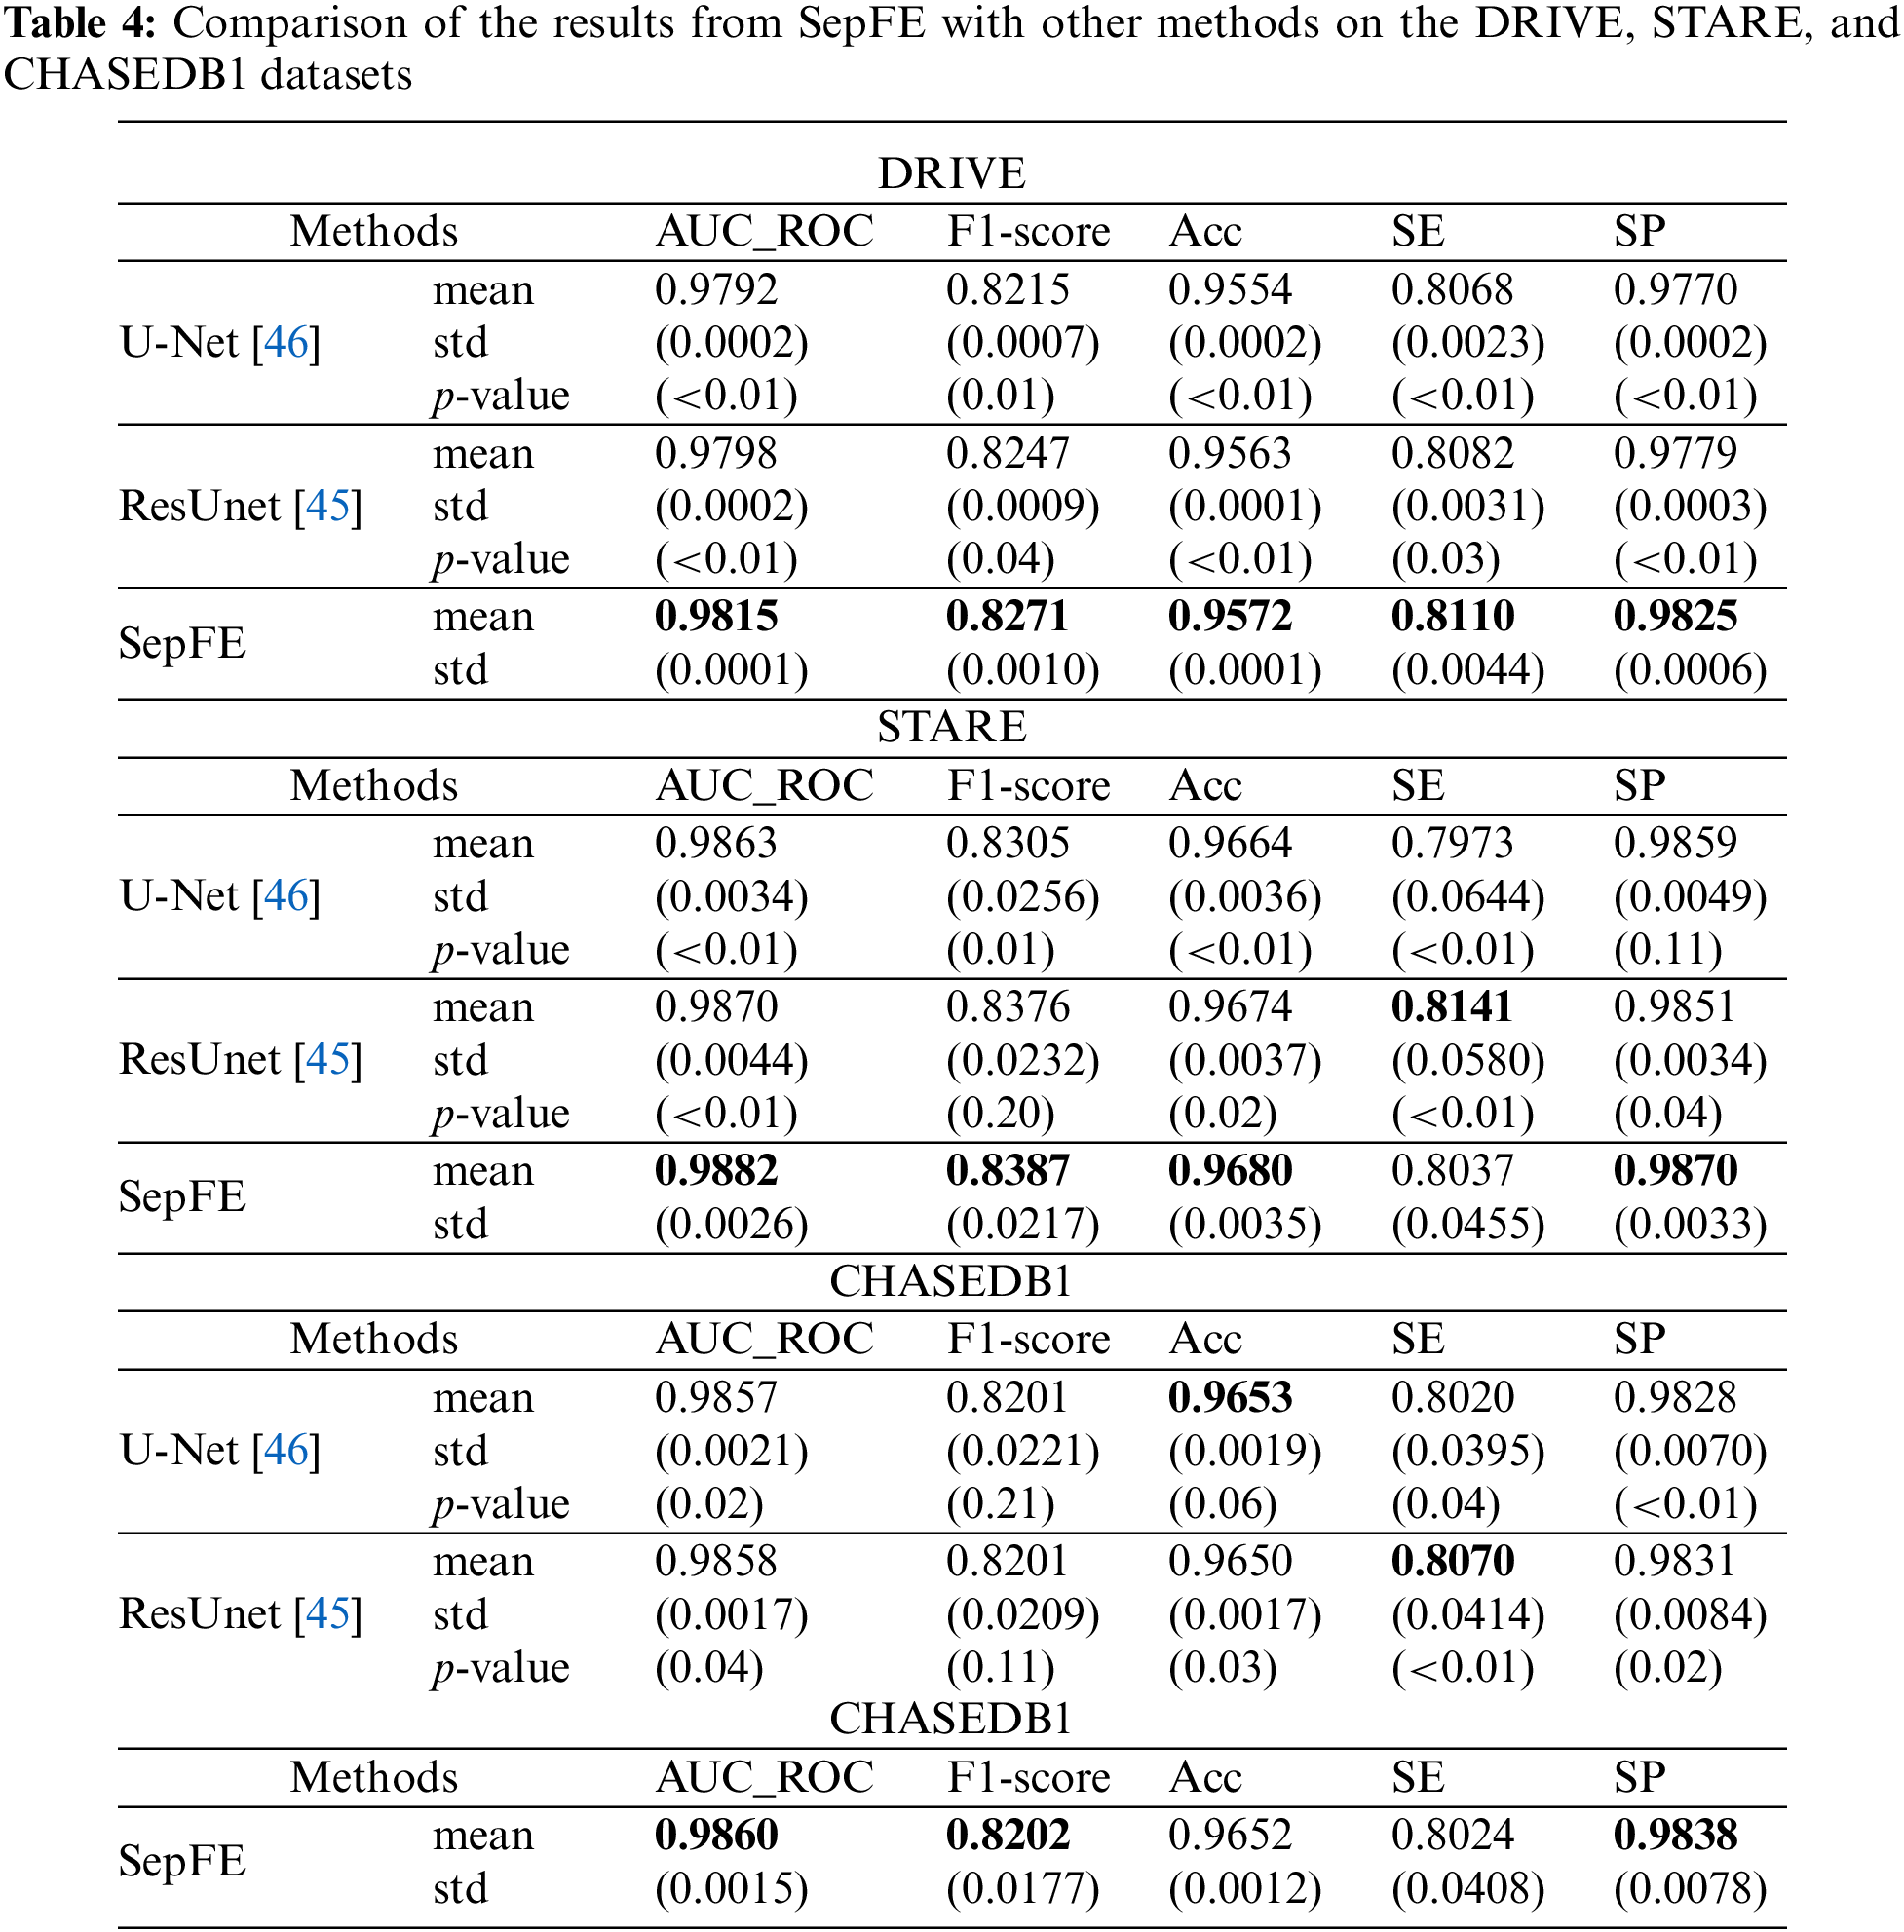
Table 4 compares the performance of the proposed model with two segmentation algorithms: U-Net and ResUnet [45]. The SepFE is optimal in most indicators. The AUC_ROC metrics for the U-Net, ResUnet, and SepFE are 0.9792, 0.9798, and 0.9815 on the DRIVE dataset; 0.9863, 0.9870, and 0.9882 on the STARE dataset; and 0.9857, 0.9858, and 0.9860 on the CHASEDB1 dataset. We also plot the ROC curve in Fig. 8. The closer the ROC curve is to the upper left corner, the better the proposed SepFE classifies blood vessel pixels. When comparing Figs. 8a–8c, our SepFE classifies blood vessel pixels more precisely than the other two models. In particular, the improved blood vessel segmentation is evidenced by the segmentation results of the three models in Fig. 9.

Figure 8: ROC curves of the different models on the (a) DRIVE, (b) STARE, and (c) CHASEDB1 datasets. The SepFE has the largest ROC curve areas with AUC_ROCs closest to 1


Figure 9: Segmentation results and their local enlargement areas using the different models on the DRIVE (left two columns), STARE (middle two columns), and CHASEDB1 (right two columns) datasets. The final outputs of the SepFE are closer to the ground truth than the other selected approaches
We analyze and compare the complexity of the three models, where the network inputs are (1, 48, 48). According to Fig. 10, the SepFE architecture has 0.74 M parameters, which is approximately 97% and 94% less than the 31.04 M and 13.04 M of the U-Net and ResUnet architectures, respectively. The SepFE architecture has 0.17 G Flops (floating-point operations per second), which is roughly 91% and 90% less than the 1.92 and 1.84 G of U-Net and ResUnet. The model size trained by the SepFE architecture is 15.3 M, which is nearly 89% and 95% less than the 355 M and 149 M of U-Net ResUnet. This means that the proposed architecture has fewer parameters and calculations, requires minimal memory resources, and is valuable in embedded devices.

Figure 10: Comparison of the parameters, Flops, and model size for the three considered models
When the performance and complexity of the three models are compared, the proposed SepFE model has the best performance and lowest complexity. Therefore, this study achieves its goal of designing a neural network with adequate performance with as few parameters as possible.
5.4 Comparison with the Existing Methods
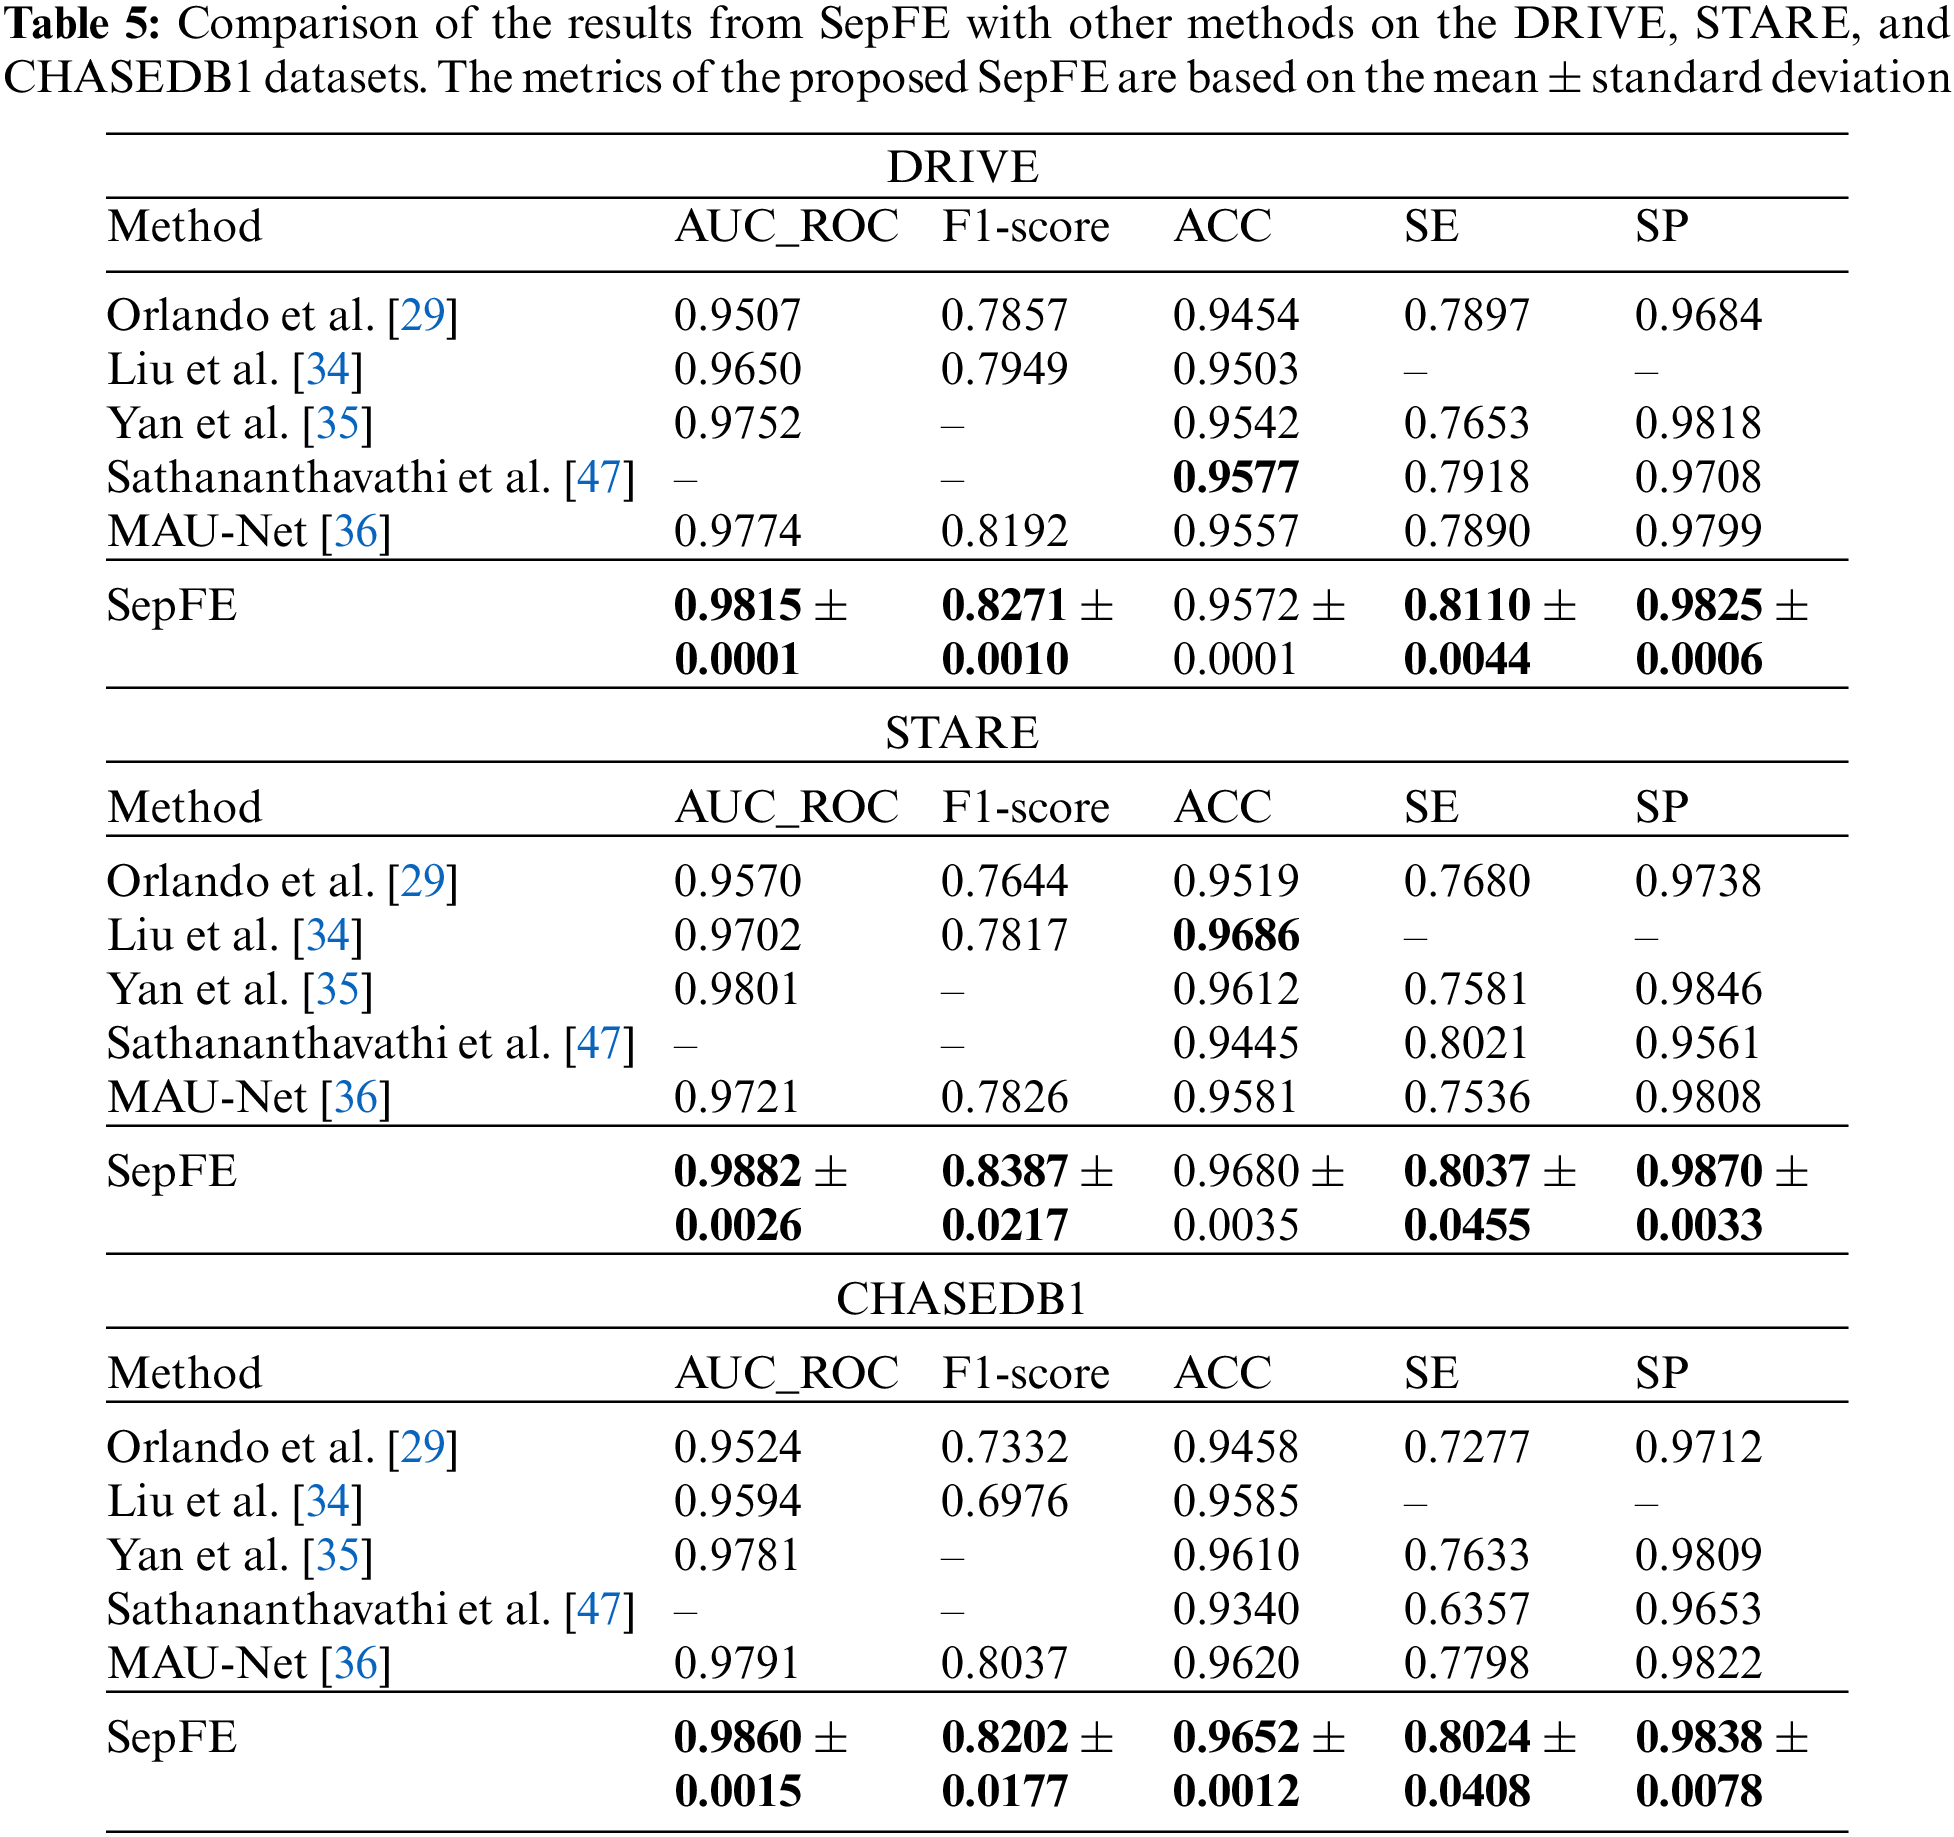
The proposed SepFE model is compared to Orlando et al. [29], Yan et al. [35], MAU-Net [36], Sathananthavathi et al. [47], and Liu et al. [34], which have been evaluated on the DRIVE, STARE, and CHASEDB1 datasets. The results are shown in Table 5. The proposed SepFE has the highest performance in the AUC_ROC, F1-Score, SE, and SP from the three datasets. On the DRIVE dataset, while the proposed model has a 0.05% lower ACC than Sathananthavathi et al. [47], the SE and SP improve by 2.42% and 1.21%, respectively. An AUC_ROC of 0.98 or above is obtained in automatic segmentation, which is close to the optimal results. On the STARE dataset, the SepFE is slightly inferior to Liu et al. [34] in the ACC metric but superior in the other metrics, where the AUC_ROC is 0.83% higher than Yan et al. [35] and 1.86% higher than Liu et al. [34]. Thus, the model has tremendous learning capability. Furthermore, the high sensitivity of the STARE dataset, which contains a high number of abnormal noise artifacts such as microaneurysms and hemorrhages, indicates that the model has an improved ability to distinguish between the foreground and background. The proposed SepFE performs best overall due to a low number of parameters(0.74 M) and outstanding performance.
We propose a lightweight network called SepFE to perform the challenging task of accurately and efficiently segmenting retinal vessels from fundus images. As an extension of U-Net, we substitute a portion of the conventional convolutional layers with depth-wise separable convolutions. Meanwhile, the U-shaped architecture is continued, and a pre-trained MobileNet V2 structure is introduced into the encoding portion of the model to fully capture contextual information. Then, the FFRMs are employed to gradually fuse high- and low-level features, which exploits the complementary nature of the two feature levels for more accurate blood vessel localization. We train the U-Net and SepFE from scratch to evaluate the proposed model. The proposed SepFE not only has a lower complexity but also outperforms U-Net in segmentation performance on three publicly-available datasets. We also demonstrate the leading performance compared to other existing retinal vascular algorithms.
The proposed method has excellent performance of both high performance and low resource consumption. However, the sensitivity is lower than that of U-Net when inference is performed on the test images of the DRIVE and STARE datasets. This may be because our method still produces some false negatives similar to those of other methods for typical regions with a large number of thin blood vessels. In retinal images, thin vessels contain only a few pixels, and segmenting thin vessels is much more difficult. Therefore, attaching higher weights to tiny targets is a topic for exploration in future work.
Funding Statement: This work is supported by the Hunan Provincial Natural Science Foundation of China (2021JJ50074), the Scientific Research Fund of Hunan Provincial Education Department (19B082), the Science and Technology Development Center of the Ministry of Education-New Generation Information Technology Innovation Project (2018A02020), the Science Foundation of Hengyang Normal University (19QD12), the Science and Technology Plan Project of Hunan Province (2016TP1020), the Subject Group Construction Project of Hengyang Normal University (18XKQ02), the Application Oriented Special Disciplines, Double First Class University Project of Hunan Province (Xiangjiaotong [2018] 469), the Hunan Province Special Funds of Central Government for Guiding Local Science and Technology Development (2018CT5001), the First Class Undergraduate Major in Hunan Province Internet of Things Major (Xiangjiaotong [2020] 248, No. 288).
Conflicts of Interest: The authors declare that they have no conflicts of interest to report regarding the present study.
References
1. Martínez, S. M. (2015). Fundus characterization for automatic disease screening through retinal image processing (Ph.D. Thesis). Universitat Politècnica de València. [Google Scholar]
2. Cheung, C. Y. L., Zheng, Y., Hsu, W., Lee, M. L., Lau, Q. P. et al. (2011). Retinal vascular tortuosity, blood pressure, and cardiovascular risk factors. Ophthalmology, 118(5), 812–818. https://doi.org/10.1016/j.ophtha.2010.08.045 [Google Scholar] [PubMed] [CrossRef]
3. Wang, J., Shao, W., Kim, J. (2020). Combining MF-DFA and LSSVM for retina images classification. Biomedical Signal Processing and Control, 60(1), 101943. https://doi.org/10.1016/j.bspc.2020.101943 [Google Scholar] [CrossRef]
4. Li, X., Wang, W., Hu, X., Yang, J. (2019). Selective kernel networks. Proceedings of the IEEE/CVF Conference on Computer Vision and Pattern Recognition, pp. 510–519. Long Beach, USA. [Google Scholar]
5. Li, Q., Feng, B., Xie, L., Liang, P., Zhang, H. et al. (2015). A cross-modality learning approach for vessel segmentation in retinal images. IEEE Transactions on Medical Imaging, 35(1), 109–118. https://doi.org/10.1109/TMI.2015.2457891 [Google Scholar] [PubMed] [CrossRef]
6. Li, D., Dharmawan, D. A., Ng, B. P., Rahardja, S. (2019). Residual U-Net for retinal vessel segmentation. 2019 IEEE International Conference on Image Processing (ICIP), pp. 1425–1429. Taipei, Taiwan, IEEE. [Google Scholar]
7. Lopes, A. P., Ribeiro, A., Silva, C. A. (2019). Dilated convolutions in retinal blood vessels segmentation. 2019 IEEE 6th Portuguese Meeting on Bioengineering (ENBENG), pp. 1–4. Lisbon, Portugal, IEEE. [Google Scholar]
8. Biswas, R., Vasan, A., Roy, S. S. (2020). Dilated deep neural network for segmentation of retinal blood vessels in fundus images. Iranian Journal of Science and Technology, Transactions of Electrical Engineering, 44(1), 505–518. https://doi.org/10.1007/s40998-019-00213-7 [Google Scholar] [CrossRef]
9. Tang, X., Zhong, B., Peng, J., Hao, B., Li, J. (2020). Multi-scale channel importance sorting and spatial attention mechanism for retinal vessels segmentation. Applied Soft Computing, 93(1), 106353. https://doi.org/10.1016/j.asoc.2020.106353 [Google Scholar] [CrossRef]
10. Wang, B., Wang, S., Qiu, S., Wei, W., Wang, H. et al. (2020). CSU-Net: A context spatial U-Net for accurate blood vessel segmentation in fundus images. IEEE Journal of Biomedical and Health Informatics, 25(4), 1128–1138. https://doi.org/10.1109/JBHI.2020.3011178 [Google Scholar] [PubMed] [CrossRef]
11. Yang, L., Wang, H., Zeng, Q., Liu, Y., Bian, G. (2021). A hybrid deep segmentation network for fundus vessels via deep-learning framework. Neurocomputing, 448(11), 168–178. https://doi.org/10.1016/j.neucom.2021.03.085 [Google Scholar] [CrossRef]
12. Yan, Z., Yang, X., Cheng, K. T. (2018). A three-stage deep learning model for accurate retinal vessel segmentation. IEEE Journal of Biomedical and Health Informatics, 23(4), 1427–1436. https://doi.org/10.1109/JBHI.2018.2872813 [Google Scholar] [PubMed] [CrossRef]
13. Yu, L., Qin, Z., Ding, Y., Qin, Z. (2021). MIA-UNet: Multi-scale iterative aggregation U-Network for retinal vessel segmentation. Computer Modeling in Engineering & Sciences, 129(2), 805–828. https://doi.org/10.32604/cmes.2021.017332 [Google Scholar] [CrossRef]
14. Feng, S., Zhao, H., Shi, F., Cheng, X., Wang, M. et al. (2020). CPFNet: Context pyramid fusion network for medical image segmentation. IEEE Transactions on Medical Imaging, 39(10), 3008–3018. https://doi.org/10.1109/TMI.2020.2983721 [Google Scholar] [PubMed] [CrossRef]
15. Ibtehaz, N., Rahman, M. S. (2020). MultiResUNet: Rethinking the U-Net architecture for multimodal biomedical image segmentation. Neural Networks, 121(11), 74–87. https://doi.org/10.1016/j.neunet.2019.08.025 [Google Scholar] [PubMed] [CrossRef]
16. Howard, A. G., Zhu, M., Chen, B., Kalenichenko, D., Wang, W. et al. (2017). Mobilenets: Efficient convolutional neural networks for mobile vision applications. arXiv preprint arXiv:1704.04861. [Google Scholar]
17. Zhong, W., Yu, N., Ai, C. (2020). Applying big data based deep learning system to intrusion detection. Big Data Mining and Analytics, 3(3), 181–195. https://doi.org/10.26599/BDMA.2020.9020003 [Google Scholar] [CrossRef]
18. Sandler, M., Howard, A., Zhu, M., Zhmoginov, A., Chen, L. C. (2018). MobileNetV2: Inverted residuals and linear bottlenecks. Proceedings of the IEEE Conference on Computer Vision and Pattern Recognition, pp. 4510–4520. Salt Lake City, USA. [Google Scholar]
19. Simonyan, K., Zisserman, A. (2014). Very deep convolutional networks for large-scale image recognition. arXiv preprint arXiv:1409.1556. [Google Scholar]
20. Liu, J., Zheng, J., Jiao, G. (2022). Transition Net: 2D backbone to segment 3D brain tumor. Biomedical Signal Processing and Control, 75(10), 103622. https://doi.org/10.1016/j.bspc.2022.103622 [Google Scholar] [CrossRef]
21. Peng, C., Zhang, X., Yu, G., Luo, G., Sun, J. (2017). Large kernel matters–improve semantic segmentation by global convolutional network. Proceedings of the IEEE Conference on Computer Vision and Pattern Recognition, pp. 4353–4361. Honolulu, USA. [Google Scholar]
22. Azzopardi, G., Strisciuglio, N., Vento, M., Petkov, N. (2015). Trainable COSFIRE filters for vessel delineation with application to retinal images. Medical Image Analysis, 19(1), 46–57. https://doi.org/10.1016/j.media.2014.08.002 [Google Scholar] [PubMed] [CrossRef]
23. Zhang, L., Fisher, M., Wang, W. (2015). Retinal vessel segmentation using multi-scale textons derived from keypoints. Computerized Medical Imaging and Graphics, 45(1), 47–56. https://doi.org/10.1016/j.compmedimag.2015.07.006 [Google Scholar] [PubMed] [CrossRef]
24. Li, H., Zhang, J., Nie, Q., Cheng, L. (2013). A retinal vessel tracking method based on bayesian theory. 2013 IEEE 8th Conference on Industrial Electronics and Applications (ICIEA), pp. 232–235. Melbourne, Australia, IEEE. [Google Scholar]
25. Shukla, A. K., Pandey, R. K., Pachori, R. B. (2020). A fractional filter based efficient algorithm for retinal blood vessel segmentation. Biomedical Signal Processing and Control, 59(7), 101883. https://doi.org/10.1016/j.bspc.2020.101883 [Google Scholar] [CrossRef]
26. Pachade, S., Porwal, P., Kokare, M., Giancardo, L., Meriaudeau, F. (2020). Retinal vasculature segmentation and measurement framework for color fundus and SLO images. Biocybernetics and Biomedical Engineering, 40(3), 865–900. https://doi.org/10.1016/j.bbe.2020.03.001 [Google Scholar] [CrossRef]
27. Tian, F., Li, Y., Wang, J., Chen, W. (2021). Blood vessel segmentation of fundus retinal images based on improved frangi and mathematical morphology. Computational and Mathematical Methods in Medicine, 2021(4), 1–11. https://doi.org/10.1155/2021/4761517 [Google Scholar] [PubMed] [CrossRef]
28. Soares, J. V., Leandro, J. J., Cesar, R. M., Jelinek, H. F., Cree, M. J. (2006). Retinal vessel segmentation using the 2-D Gabor wavelet and supervised classification. IEEE Transactions on Medical Imaging, 25(9), 1214–1222. https://doi.org/10.1109/TMI.2006.879967 [Google Scholar] [PubMed] [CrossRef]
29. Orlando, J. I., Prokofyeva, E., Blaschko, M. B. (2016). A discriminatively trained fully connected conditional random field model for blood vessel segmentation in fundus images. IEEE Transactions on Biomedical Engineering, 64(1), 16–27. https://doi.org/10.1109/TBME.2016.2535311 [Google Scholar] [PubMed] [CrossRef]
30. Akram, M. U., Khan, S. A. (2013). Multilayered thresholding-based blood vessel segmentation for screening of diabetic retinopathy. Engineering with Computers, 29(2), 165–173. https://doi.org/10.1007/s00366-011-0253-7 [Google Scholar] [CrossRef]
31. Wang, Y., Ji, G., Lin, P., Trucco, E. (2013). Retinal vessel segmentation using multiwavelet kernels and multiscale hierarchical decomposition. Pattern Recognition, 46(8), 2117–2133. https://doi.org/10.1016/j.patcog.2012.12.014 [Google Scholar] [CrossRef]
32. Xu, H., Zhu, Y., Zeng, T., Li, Z. (2021). Survey of image semantic segmentation methods based on deep neural network. Journal of Frontiers of Computer Science and Technology, 15(1), 47–59. [Google Scholar]
33. Chen, H., Zhang, Y., Cao, Y., Xie, J. (2021). Security issues and defensive approaches in deep learning frameworks. Tsinghua Science and Technology, 26(6), 894–905. https://doi.org/10.26599/TST.2020.9010050 [Google Scholar] [CrossRef]
34. Liu, Y. P., Rui, X., Li, Z., Zeng, D., Li, J. et al. (2021). Feature pyramid U-Net for retinal vessel segmentation. IET Image Processing, 15(8), 1733–1744. https://doi.org/10.1049/ipr2.12142 [Google Scholar] [CrossRef]
35. Yan, Z., Yang, X., Cheng, K. T. (2018). Joint segment-level and pixel-wise losses for deep learning based retinal vessel segmentation. IEEE Transactions on Biomedical Engineering, 65(9), 1912–1923. https://doi.org/10.1109/TBME.2018.2828137 [Google Scholar] [PubMed] [CrossRef]
36. Li, H., Wang, Y., Wan, C., Shen, J., Chen, Z. et al. (2020). MAU-Net: A retinal vessels segmentation method. 2020 42nd Annual International Conference of the IEEE Engineering in Medicine & Biology Society (EMBC), pp. 1958–1961. Montreal, Canada, IEEE. [Google Scholar]
37. Wang, B., Qiu, S., He, H. (2019). Dual encoding U-Net for retinal vessel segmentation. International Conference on Medical Image Computing and Computer-Assisted Intervention, pp. 84–92. Cham, Switzerland, Springer. [Google Scholar]
38. Priesnitz, J., Rathgeb, C., Buchmann, N., Busch, C. (2020). Touchless fingerprint sample quality: Prerequisites for the applicability of NFIQ2.0. 2020 International Conference of the Biometrics Special Interest Group (BIOSIG), pp. 1–5. Darmstadt, Germany, IEEE. [Google Scholar]
39. Pizer, S. M., Johnston, R. E., Ericksen, J. P., Yankaskas, B. C., Muller, K. E. (1990). Contrast-limited adaptive histogram equalization: Speed and effectiveness. Proceedings of the First Conference on Visualization in Biomedical Computing, vol. 337. Atlanta, Georgia. [Google Scholar]
40. Wang, C., Zhao, Z., Ren, Q., Xu, Y., Yu, Y. (2019). Dense U-Net based on patch-based learning for retinal vessel segmentation. Entropy, 21(2), 168. https://doi.org/10.3390/e21020168 [Google Scholar] [PubMed] [CrossRef]
41. Staal, J., Abràmoff, M. D., Niemeijer, M., Viergever, M. A., van Ginneken, B. (2004). Ridge-based vessel segmentation in color images of the retina. IEEE Transactions on Medical Imaging, 23(4), 501–509. https://doi.org/10.1109/TMI.2004.825627 [Google Scholar] [PubMed] [CrossRef]
42. Hoover, A., Kouznetsova, V., Goldbaum, M. (2000). Locating blood vessels in retinal images by piecewise threshold probing of a matched filter response. IEEE Transactions on Medical Imaging, 19(3), 203–210. https://doi.org/10.1109/42.845178 [Google Scholar] [PubMed] [CrossRef]
43. Owen, C. G., Rudnicka, A. R., Mullen, R., Barman, S. A., Monekosso, D. et al. (2009). Measuring retinal vessel tortuosity in 10-year-old children: Validation of the computer-assisted image analysis of the retina (CAIAR) program. Investigative Ophthalmology & Visual Science, 50(5), 2004–2010. https://doi.org/10.1167/iovs.08-3018 [Google Scholar] [PubMed] [CrossRef]
44. Oliveira, A., Pereira, S., Silva, C. A. (2018). Retinal vessel segmentation based on fully convolutional neural networks. Expert Systems with Applications, 112(1), 229–242. https://doi.org/10.1016/j.eswa.2018.06.034 [Google Scholar] [CrossRef]
45. Zhang, Z., Liu, Q., Wang, Y. (2018). Road extraction by deep residual U-Net. IEEE Geoscience and Remote Sensing Letters, 15(5), 749–753. https://doi.org/10.1109/LGRS.2018.2802944 [Google Scholar] [CrossRef]
46. Ronneberger, O., Fischer, P., Brox, T. (2015). U-Net: Convolutional networks for biomedical image segmentation. International Conference on Medical Image Computing and Computer-Assisted Intervention, vol. 9351, pp. 234–241. Munich, Germany, Springer. [Google Scholar]
47. Sathananthavathi, V., Indumathi, G. (2021). Encoder enhanced atrous (EEA) unet architecture for retinal blood vessel segmentation. Cognitive Systems Research, 67(3), 84–95. https://doi.org/10.1016/j.cogsys.2021.01.003 [Google Scholar] [CrossRef]
Cite This Article
 Copyright © 2023 The Author(s). Published by Tech Science Press.
This work is licensed under a Creative Commons Attribution 4.0 International License , which permits unrestricted use, distribution, and reproduction in any medium, provided the original work is properly cited.
 Downloads
 Citation Tools