
 Submit a Paper
 Propose a Special lssue
 Open Access
ARTICLE

Identifying Industrial Control Equipment Based on Rule Matching and Machine Learning
Cyberspace Institute of Advanced Technology (CIAT), Guangzhou University, Guangzhou, 510006, China
* Corresponding Author: Yu Jiang. Email:
(This article belongs to the Special Issue: Cyberspace Intelligent Mapping and Situational Awareness)
Computer Modeling in Engineering & Sciences 2023, 137(1), 577-605. https://doi.org/10.32604/cmes.2023.026791
Received 26 September 2022; Accepted 05 January 2023; Issue published 23 April 2023
 View Full Text
 Download PDF
Abstract
To identify industrial control equipment is often a key step in network mapping, categorizing network resources, and attack defense. For example, if vulnerable equipment or devices can be discovered in advance and the attack path can be cut off, security threats can be effectively avoided and the stable operation of the Internet can be ensured. The existing rule-matching method for equipment identification has limitations such as relying on experience and low scalability. This paper proposes an industrial control device identification method based on PCA-Adaboost, which integrates rule matching and machine learning. We first build a rule base from network data collection and then use single and multi-protocol rule-matching methods to identify the type of industrial control devices. Finally, we utilize PCA-Adaboost to identify unlabeled data. The experimental results show that the recognition rate of this method is better than that of the traditional Nmap device recognition method and the device recognition accuracy rate reaches 99%. The evaluation effect of the test data set is significantly enhanced.Keywords
Industrial control device identification technology refers to obtaining the corresponding device type through device-specific feature fingerprint information, such as operating system, communication port, communication protocol, etc. With the rapid development of intelligent devices, more and more devices are developing towards networking. Using these networking devices makes our lives more intelligent and convenient and promotes the development and progress of society. According to Strategy Analytics [1], the number of connected smart devices will reach 38.6 billion by 2025.
However, since traditional devices were not designed with security considerations, they may face great security threats after networking on the Internet. The 2017 “Report on the Security of Internet-connected Smart Devices” [2] pointed out that the China National Vulnerability Database (CNVD) included 2440 vulnerabilities in general Internet of Things (IOT) devices, involving Google, Cisco, Huawei, etc., multiple manufacturers, and network cameras, gateways, firewalls, and other device types.
At present, the identification of industrial control equipment has been applied to many fields of security. In 2018, Du [3] clarified from an industrial perspective that the association of device identification with vulnerabilities for early warning has a positive effect on promoting the establishment of a national-level threat perception and early warning platform. In 2020, Yang et al. [4] applied the identification of industrial control equipment to the security management and monitoring of the local area network and identified the types of devices connected to the local area network. If the devices were vulnerable, they were added to the whitelist for monitoring. Therefore, it is of great significance to study the identification of industrial control equipment for the field of network mapping, security monitoring, threat perception and early warning.
Industrial control equipment identification methods are roughly divided into two categories. One category is a relatively traditional method, which identifies industrial control equipment through rule matching. The rule base is constructed by existing experience or expert knowledge, and the industrial control equipment information is matched with the rule base to obtain the equipment type corresponding to the data. The other category is device identification through machine learning methods, by modelling the device data set, training the data through the machine learning model, and iteratively updating the data to obtain an industrial control equipment identification model.
The method based on rule matching is easy to understand, easy to operate, and fast to identify. However, the method based solely on rule matching has certain limitations. The recognition effect is related to the quality of the rule base, and the matching rules are limited by experience. Moreover, the recognition methods ignore the differences and connections between fields and have no autonomous learning and adaptability [5]. Rule-based methods are also used to identify honeypots in industrial Cyber–Physical Systems [6]. Due to the lack of scalability and adaptability, the rule base cannot be automatically updated with increased industrial control equipment. The new equipment data is unknown to the rule matching system, and the corresponding rules cannot be matched.
The method of rule matching cannot complete the identification of all industrial control equipment. The parts that cannot be identified by rule matching can only rely on other methods, such as machine learning. Song et al. [7] proposed to take the flow characteristics as device features and used the two-stage multi-class support vector machine classifier, which combined a two-stage multi-classification model and support vector machine (SVM) model, to identify the device. Sathyanarayan et al. [8] used a classifier based on a neural network algorithm to identify the device and get the device type. Cao et al. [9] used the cosine distance as the distance similarity, used the k-means clustering algorithm to divide the data, and pointed out that if the labeled samples are added before the model training, and the corresponding clusters are tagged after the clustering, the recognition effect will be better. Feng et al. [10] collected the product description related to the corresponding data of the device application layer from the network resources. Finally, they obtained the device description with the highest correlation degree with the feature through the association algorithm so as to achieve the purpose of identifying the device.
In addition, there are many network device search engines today, and these tools can help users to complete the detection, sniffing, and identification of target devices. The most popular device identification tools include Nmap [11], Shodan [12], ZoomEye [13], etc. These tools can help attackers to complete sniffing and scanning of the target device. However, at the same time, they can also help researchers to conduct network research on the identification of industrial control equipment. Nmap [11] is a popular network detection scanner, and its power lies in its simplicity, flexibility, open source, and portability [14].
In this paper, a method for identifying industrial control equipment based on rule matching and machine learning is designed. It is mainly divided into two parts. The first part is the device identification based on rule matching, which stores the device data that can be directly and indirectly recognized by Nmap according to the formatted rules, and builds a rule base for the data that Nmap cannot recognize by collecting network data; According to the single and multi-protocol rule matching method, the corresponding final type of the device data is obtained. The second part is machine learning based device recognition. Data preprocessing is performed on the device identification results matched by the rules. Then, the device identification effects of the COP-k-means [15] algorithm and the constrained seed k-means algorithm are compared and analyzed according to the evaluation criteria of precision rate, recall rate, and F1 value. The best classifier is selected as the single classification device. Finally, the recognition results of multiple single classifiers are used through ensemble learning Adaboost and Bagging to obtain the final device type result, find the best strategy for aggregating multiple single-classifier models according to the evaluation criteria, and obtain a multi-classifier suitable for industrial control equipment identification applications.
The contributions of this work are as follows:
1. We propose a method based on network data collection and single- and multi-protocol rule matching and fusion, build a rule base, and then match the device data with the rule base to obtain the results of industrial control equipment types. It is verified by experiments that the combination of automated data collection and rule matching can significantly improve the recognition rate of industrial control equipment.
2. We preprocess the data set successfully identified by rule matching to obtain the input data set of the ensemble learning training model. Experiments show that compared with other algorithms, using the principal component analysis (PCA) method and the integrated learning fusion method to identify industrial control equipment, the identification effect is significantly increased.
The remainder of the article is structured as follows. Related work is discussed in Section 2. In Section 3, the rule-matching-based device identification method is introduced in detail. In Section 4, the device recognition method based on ensemble learning is introduced. In Section 5, the experimental results and analysis are mainly introduced. Finally, the conclusion is given in Section 6.
The method based on rule matching is easy to understand, easy to operate, and fast to identify. The main researches on industrial control equipment identification based on rule matching include: In 2013, Karthik et al. [16] implemented the intelligence gathering tool W3Scrape, which realized the identification of Web server, operating system, and content management system (CMS) applications through regular expression and rule matching; In 2016, Husák et al. [17] matched the Web server information of the target device with the rule base and selected the result with the highest confidence as the final version and type of the target device according to the matching degree. However, the method based solely on rule matching has certain limitations. The identification method based on rule matching is relatively simple. The identification effect is related to the quality and quantity of the rule base. The matching rules are limited by experience, and the rule matching ignores the differences and connections between fields, and there is no self-learning and adaptability [5]. Aiming at the problem of single data and dependence on experience in the device identification rule matching method, this study proposes a device identification method that combines Network Data Collection (NDC) and rule matching and constructs rules through network data collection. Based on the collected data, the focus is on constructing the rule base so that the rule-based method can identify more devices. Unidentified devices are further identified using machine learning methods.
The process of device identification based on machine learning includes two parts: data preprocessing and device identification.
In the process of data preprocessing of the device data set, the extracted feature set is very important. Early studies are all using a single device fingerprint to identify the device, which can only use a unique deterministic feature to identify the type of device [18]. Due to the device characteristics being too simple, the device identification information is easy to be embezzled. Xiao et al. [19] set up an intelligent terminal feature set of the Internet of things in view of this phenomenon and used multi-dimensional comprehensive information for device identification. In this stage, we need to collect the relevant feature set of device identification in as many aspects as possible. Only in this way can we get a better device recognition effect.
Wu et al. [20] sent 15 kinds of abnormal hypertext transfer protocol (HTTP) requests to different Web servers, obtained the corresponding status codes of each malformed request, and then classified the Web server through the status code. The effect is better, but if the collection frequency is too high, this method of obtaining characteristic information by sending abnormal traffic will affect the normal operation of the target device.
The Modscan [21] tool for supervisory control and data acquisition (SCADA) and the PLCscan [22] tool for discovering Siemens programmable logic controller (PLC) devices are used to identify the device through the Banner information of selecting proprietary protocols. But this kind of characteristic information is easy to be modified and impersonated by attackers. On the other hand, the device behavior feature method [23] uses the time dimension information to extract the characteristics of the data packets sent by the device over a period of time, which is constantly changing and is not easy to be forged.
After processing and analyzing the data to get the feature set related to device recognition, it is necessary to classify and identify the feature set. In the process of device identification, through the classification method of machine learning, the sample data set is used to train the training model, and finally get the device type, version and other information. Machine learning methods can be divided into:
1. Supervised device recognition algorithm: the recognition model requires a lot of tagged data.
2. Unsupervised device recognition algorithm: the recognition model does not need to label data samples and models the data directly, but due to the lack of learning samples, the recognition effect is not very good.
3. Semi-supervised device recognition algorithm: the recognition model is trained by tagged data to identify untagged data. In previous studies, semi-supervised classification algorithm has the best recognition effect.
We use the Nmap tool to detect industrial control equipment, and different protocols have different detection scripts. The response data of the detection device according to the data format is shown in Fig. 1. Among them, app service corresponds to the SERVICE field in the Nmap probe response data, and appservice_ver corresponds to the VERSION field in the Nmap probe response data.
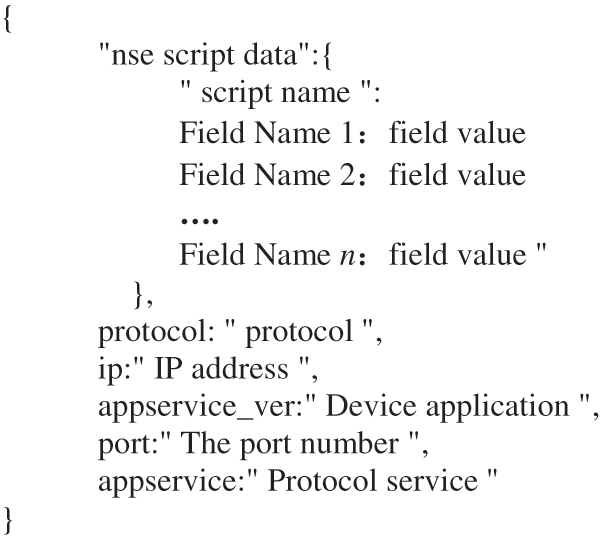
Figure 1: Data format of probe results
3 Device Identification Based on Rule Matching
This section describes the rule-matching part used for the identification method of industrial control equipment. Aiming at the problems of dispersion and dependence of the Nmap device identification method, we propose a fusion method of network data collection and rule matching. Fig. 2 shows an overview of the proposed method, including four basic modules, namely, device data classification, network data collection, single and multi-protocol matching, and device information storage.
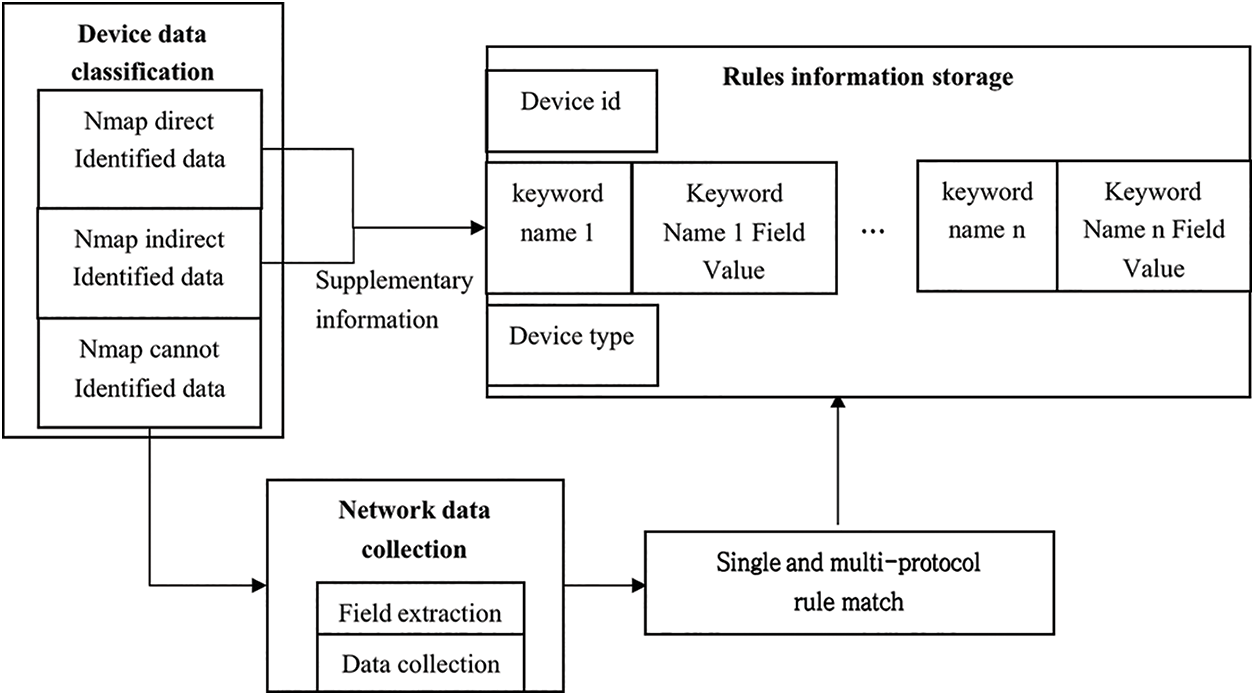
Figure 2: Rule matching process
3.1 Device Data Classification
The source of the data set is the device data set detected by Nmap. The data set can be divided into three categories: data directly recognized by Nmap, data indirectly recognized by Nmap, and data not recognized by Nmap. Different datasets will be processed differently.
(1) Data directly identified by Nmap. The appservice_ver field can unambiguously indicate the type of data the device belongs to. For example, through the appservice field, it can be determined that the protocol type of port 23 of the target device is TELNET, and through the appservice_ver field, it can be determined that the target device manufacturer is Moxa, and the device type is the industrial control device type Serial to Ethernet telnetd serial port server.
(2) Data indirectly identified by Nmap. Although the appservice_ver field does not explicitly indicate the data of the device type, the device type corresponding to the data can be obtained indirectly through the auxiliary information. For example, although appservice_ver does not clearly indicate which device type it belongs to, we can identify and enumerate Schneider Electric’s PLC devices according to the auxiliary information: modicon-info.nse. Therefore, it can be considered that the target device belongs to the Schneider PLC device.
(3) Data not be recognized by Nmap. According to the appservice_ver field and the auxiliary information, it is impossible to determine the type of data that the device belongs to.
3.2 Network Data Collection (NDC) Module
Industrial control equipment is complex and changeable, and the protocol response data is more and more diversity. For data that cannot be identified by Nmap, i.e., cannot be identified through empirical knowledge, it will increase the difficulty of identification by relying only on manual search to complete device identification through keyword rule matching. Therefore, this paper proposes a method of network data collection to construct a rule base. Data processing is first performed to extract key fields, and then a rule base is constructed by means of network data collection. Finally, the device type is obtained by matching the device data with the rule base.
The NDC-Rule Matching method is used to reduce the complexity of the work and improve efficiency. Key field selection refers to the process of filtering out features related to device identification, which are mainly divided into three types: Field Naming Rules, Protocol Specific Field, and Protocol Common Field
(1) Field Naming Rules. The S7 protocol is the communication protocol used by Siemens PCL devices. There are naming rules for the fields of Siemens PLC devices, such as product model and CPU model. Taking 6ES7221-2BD23-0XA0 as an example, the naming convention of Siemens PLC product model is shown in Table 1.
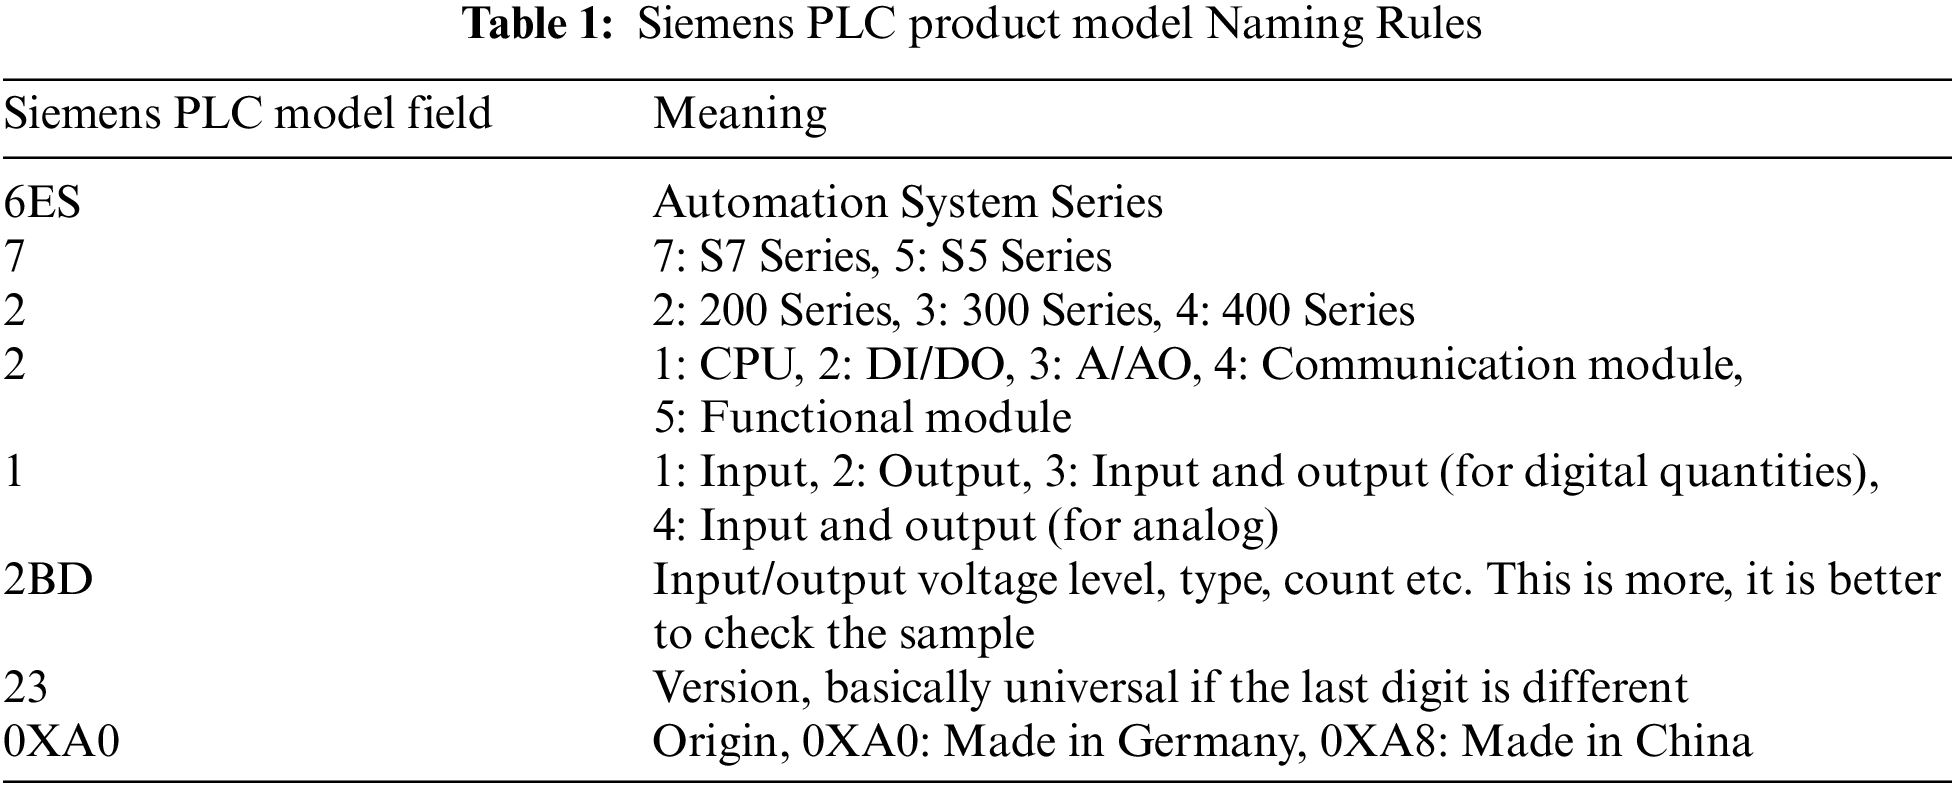
In addition, there are naming rules for the models of various devices, such as Omron PLC, and they are different from each other. Therefore, the naming rules of key fields such as model and CPU can also be used as device identification fields.
(2) Protocol Specific Field. Each protocol is composed of three parts, including syntax, semantics, and timing. The syntax specifies how the request, response and action are to be completed by both sides of the communication equipment; the semantics specify what response and action are to be completed between the communication equipment; and the time sequence specifies the communication order between the two sides of the communication equipment.
Convert the text to JSON format for the original data set, extracting different fields for different protocols. Some of the field extraction values for the HTTP protocol are shown in Table 2.
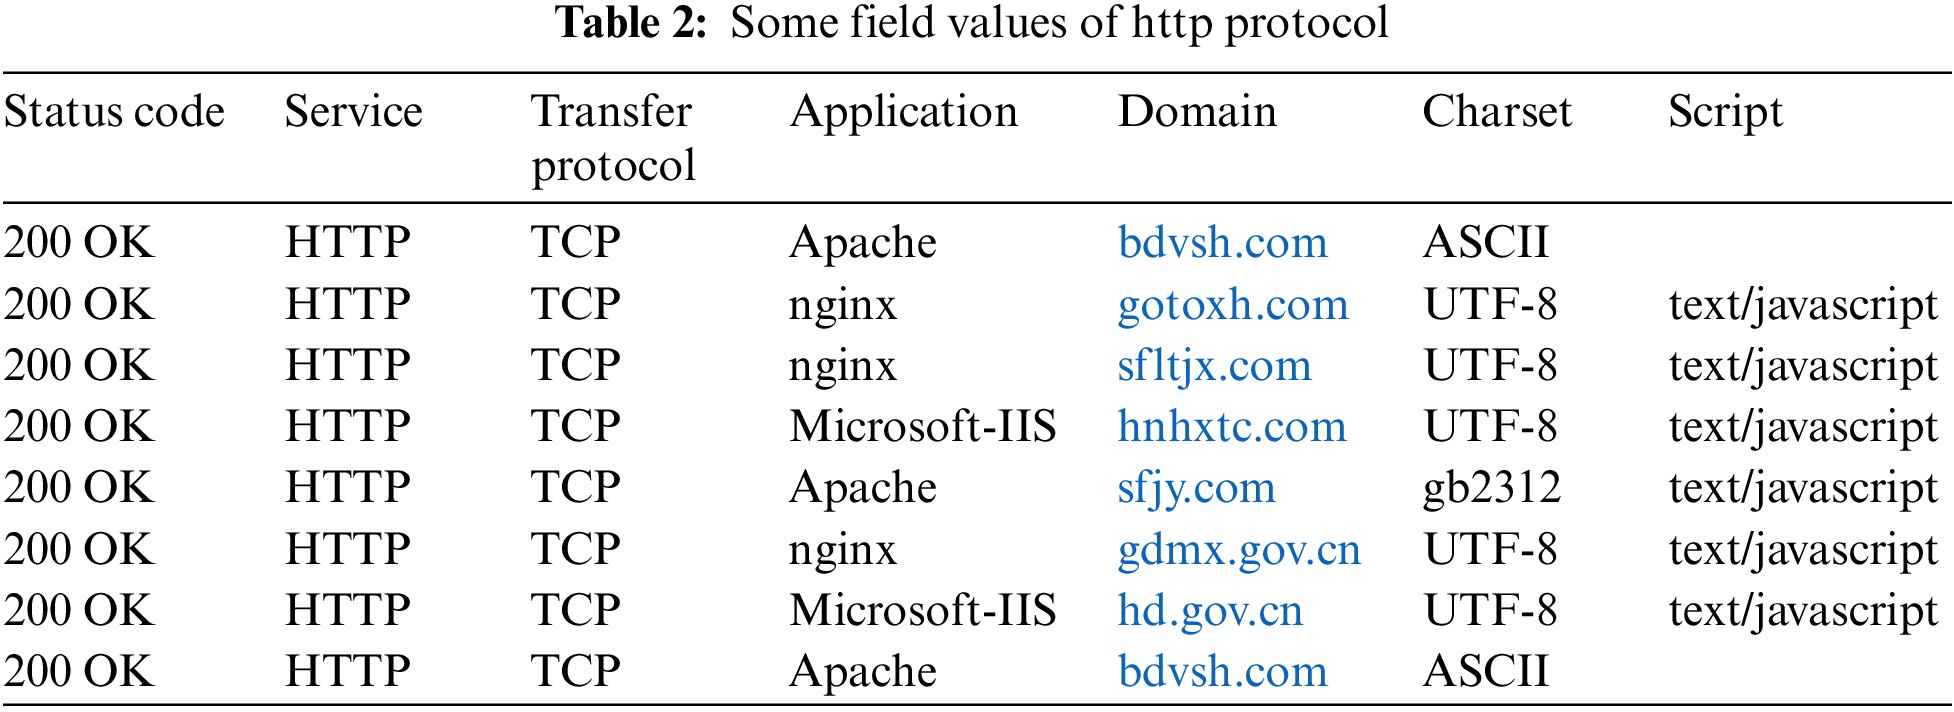
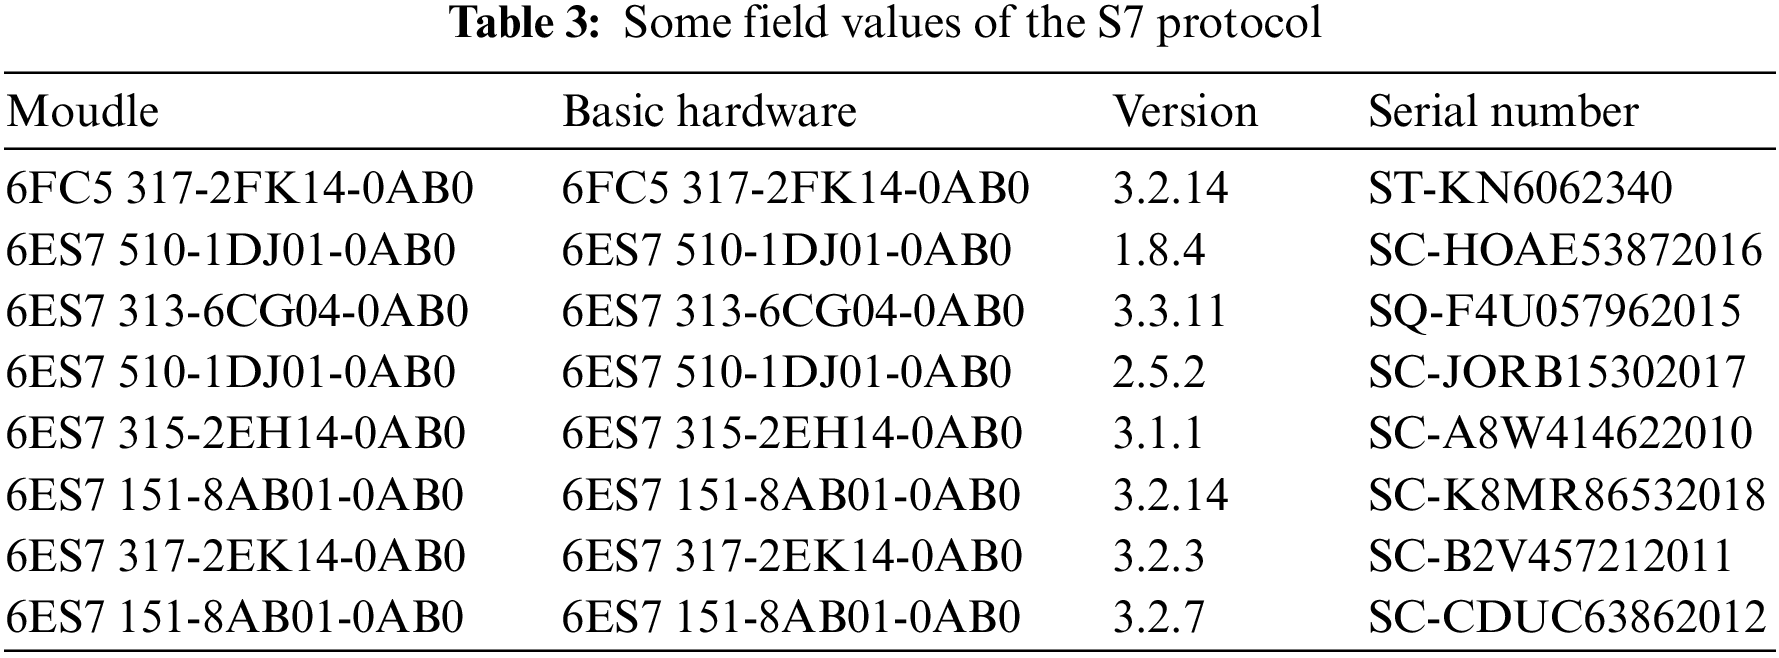
HTTP is a generic protocol, and there are private protocols in device data, as in the case of S7, whose extraction fields are shown in Table 3.
(3) Protocol Common Field. Common fields, such as vendor fields, also need to be extracted between multiple protocols.
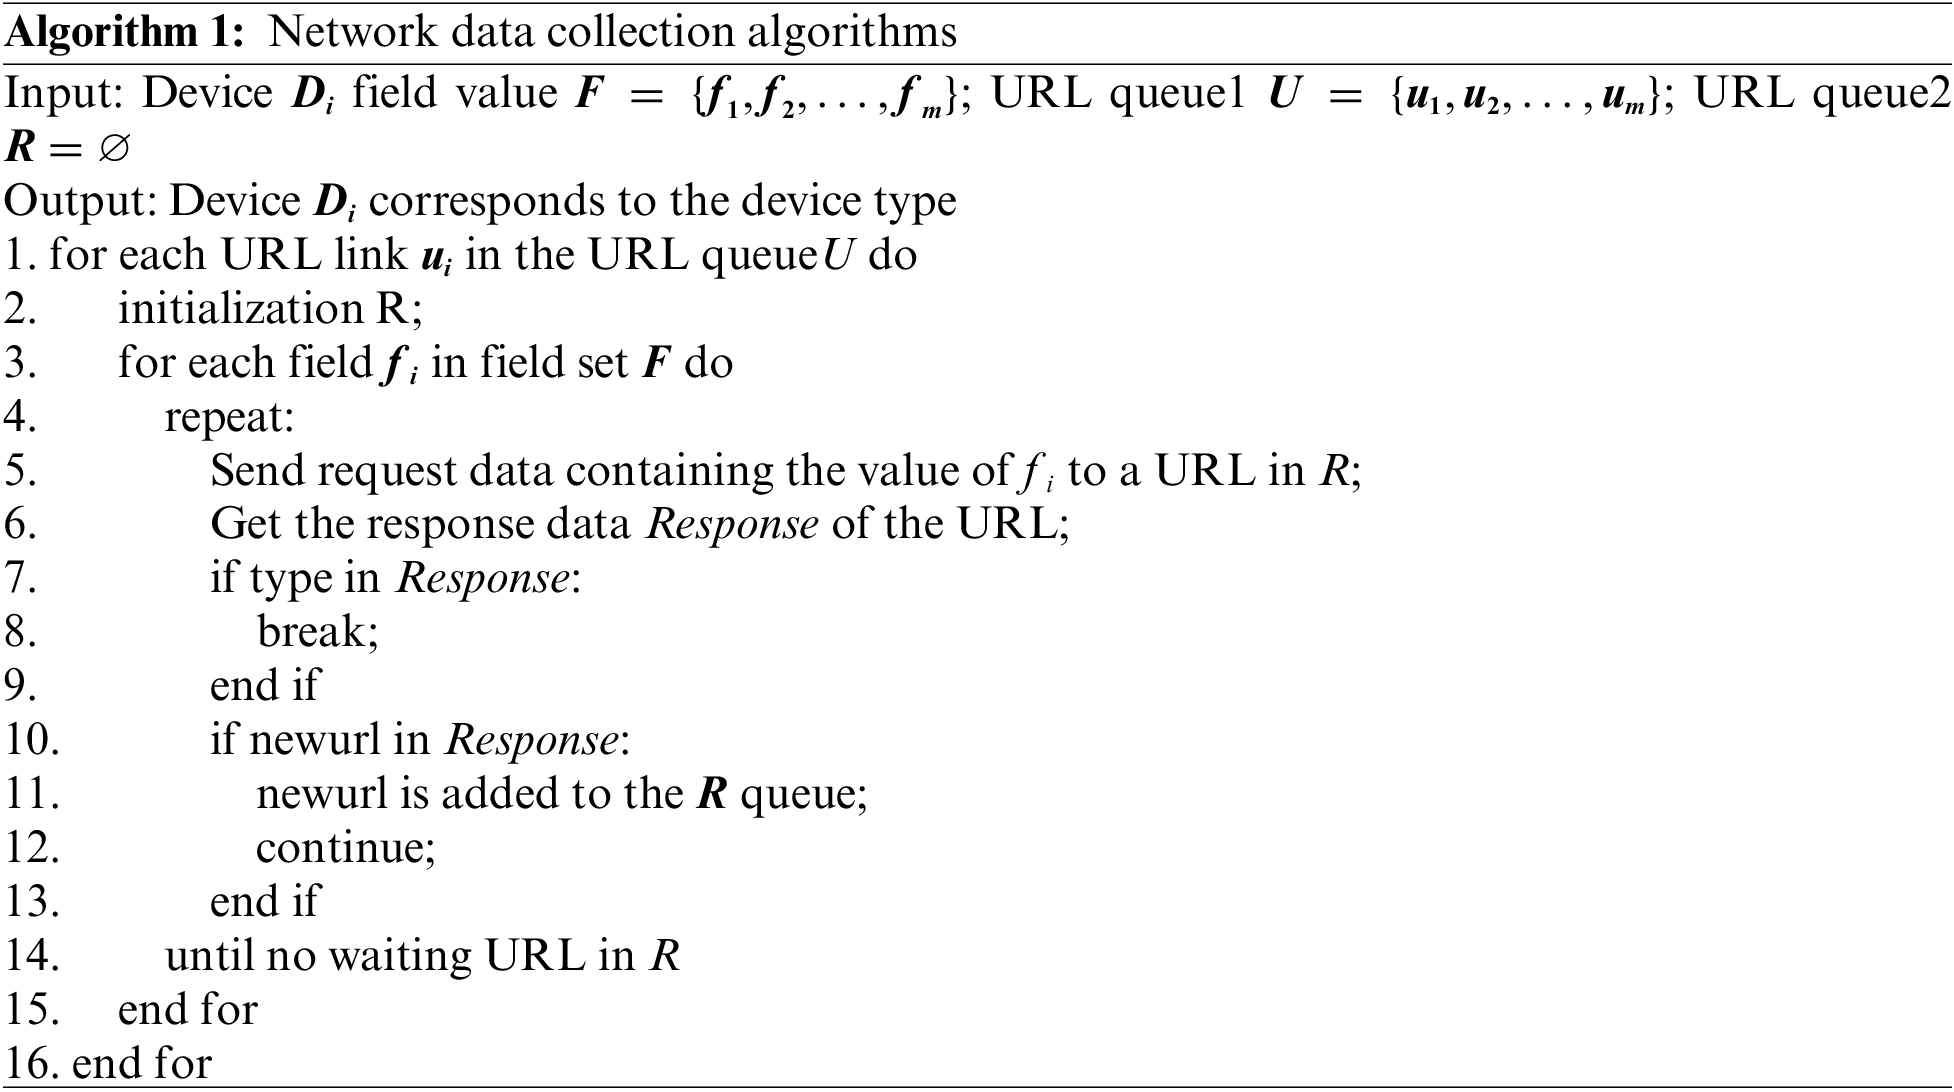
Network data collection (NDC) refers to the use of key fields of device data to automatically collect information in the network according to the set rules and policies and to process and analyze the obtained information to obtain the type of industrial control equipment. Network data collection is more powerful and flexible in device type data analysis. The process of network data collection is shown in Algorithm 1. The outermost loop lines 1 to 16 traverse the URLs in queue U; line 2 represents initializing the R queue; Inner loop lines 3 to 15 traverse the device key field value fi; lines 4 to 14 repeat as follows: Take out the key field fi and send it to the URL in the R queue to get the Response; If there is a device type in the URL’s Response, breaking the loop of the key field; If there is a new URL in the Response, adding the new URL to the R queue; Until there are no waiting URLs in the R queue.
3.3 Single and Multi-Protocol Matching Modules
Aiming at solving the problem of strong dispersion of Nmap device identification, because Nmap performs rule matching and identification for the data of each protocol of the target device in the identification process, it does not consider the relationship between different protocols of the same device. In this section, the single-protocol rule-matching method is used for device identification for industrial control equipment. For non-industrial control equipment, the multi-protocol rule matching method is used for device identification. The fusion, comparison, and analysis of different communication protocol information of the same target device can better identify industrial control equipment and improve the recognition rate of The fusion, comparison, and analysis of different communication protocol information of the same target device can better identify industrial control equipment and improve the recognition rate of industrial control equipment.
The industrial control equipment protocol adopts the single-protocol matching rule matching method. Because the real industrial control equipment feature information is based on hardware and cannot access the source code, it is difficult for the administrator to modify the fields of the industrial control equipment communication protocol. In addition, the industrial control scenario has extremely high requirements for industrial control equipment. The industrial control equipment host will not deploy other services on other ports. Otherwise, the high efficiency of the industrial control equipment will be reduced. Therefore, when there is an industrial control device communication protocol, the result of the industrial control device communication protocol is used as the final device identification result, and the non-industrial control protocol adopts a multi-protocol rule matching method.
3.4 Device Information Storage Module
The data stored in the rule base includes the basic information of the equipment, as well as the equipment manufacturer, type, and series information. The construction of the rule base can improve the recognition speed of industrial control equipment, which is conducive to further improvement and research of the rule matching module. The library will be updated, avoiding the problem that the existing identification rules are fixed, the adaptability is low, and it is difficult to adjust dynamically according to different needs.
The rules for building the rule base in this section are shown in Table 4. The key name is the name of the device communication protocol, and the Key Field I field value is the set of fields contained in the I communication protocol. The device type is the result of rule matching for device identification of industrial control equipment data.

The initial rule base is first constructed with the value of the data field recognized by Nmap and the corresponding device type, then the key field is extracted from the device data, and the keyword data is matched with the rule base. If the rule base contains the corresponding rule of data, the device type will be returned; Otherwise, the network data will be collected, adds the field name, field value, and corresponding networking device type to the rule library.
The rule base built from network data collection makes up for the lack of the researchers’ limited experience, and the rule base can be updated continuously by the method of data collection, which makes the rule base expand continuously, with the increasing trend of device networking, it is also expanding and updating, which makes up for the dispersion and dependence of Nmap tools.
4 Device Identification Based on Ensemble Learning
This section introduces the machine learning part used for industrial control equipment identification methods. Due to the lack of public data sets in the existing machine learning-based industrial control equipment identification methods, to overcome this deficiency, the data sets successfully identified by rule matching are used as labeled data sets for machine learning model training. To achieve a better network device identification effect, this section presents a fusion method of principal component analysis (PCA) and ensemble learning for network device identification. The framework is shown in Fig. 3. Fig. 3 is mainly composed of three parts, the first part is data preprocessing, the second part is single classifier construction, and the third part is ensemble learning. Each part will be elaborated in Sections 4.1–4.3, respectively.
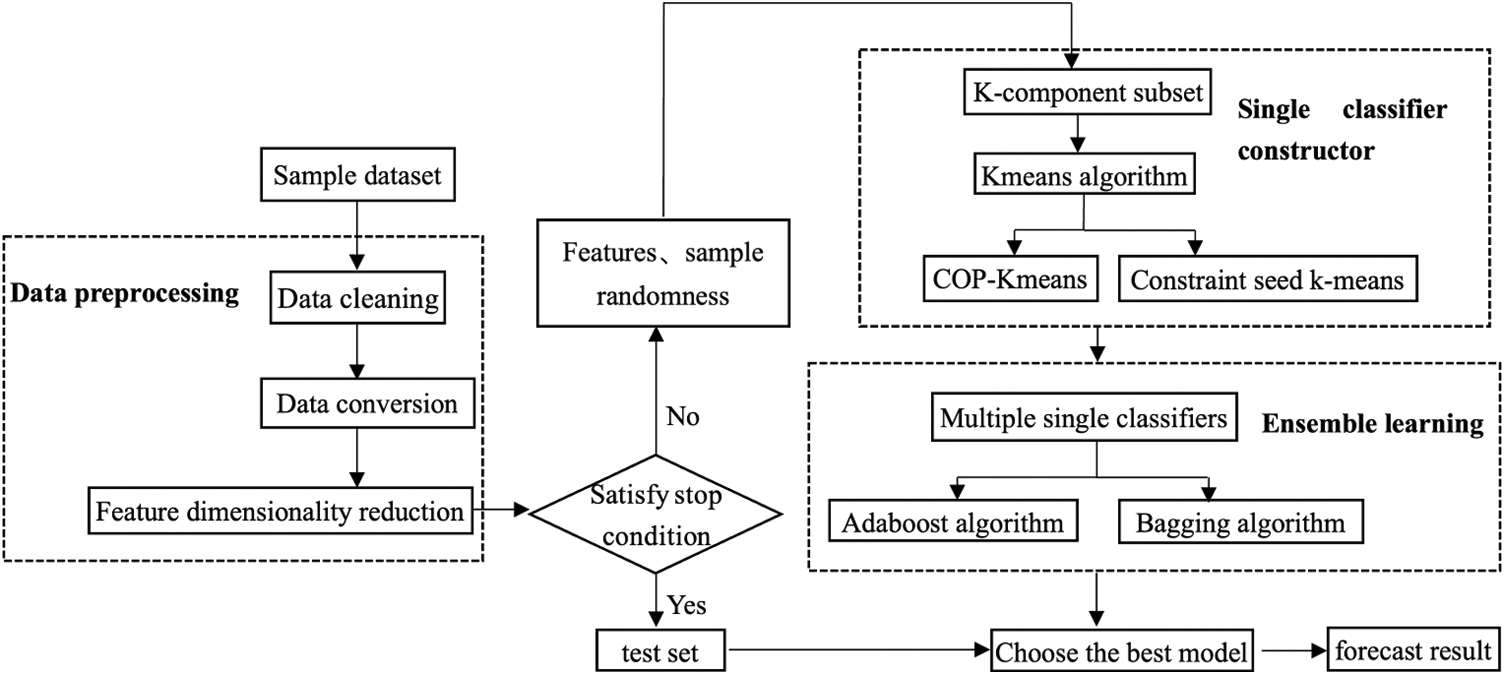
Figure 3: Industrial control equipment identification framework based on PCA-integrated learning fusion strategy
Due to different input data types and models, the data that is successfully identified by rule matching cannot be directly used as training data for the machine model. In the preprocessing process, data cleaning is used to select feature fields that are more relevant to the type of equipment from the data set to improve the accuracy of subsequent model training and reduce the time to obtain the optimal solution, and then convert the data through the one-hot encoding method, and finally reduce the dimension of sample data through principal component analysis. Relevant fields refer to some field values, such as device brand, version, model, etc., which may lead to differences due to the lack of specific specifications for different types of terminal devices.
The type of data set obtained through rule matching is not standardized, so we need to clean the data to eliminate erroneous, redundant noise data or useless, low-contribution variable values in the data, reduce the identification difficulty of the algorithm, and improve the accuracy of the model. The steps of data cleaning are as follows:
(1) Consistency Check
The consistency check checks whether the data is reasonable based on the semantic information and value range of each field. For example, in a computer network, the value range of the port field is 0-65535. If there is data that is not within the normal value range, it is considered abnormal data and needs to be deleted.
For semantic problems: remove meaningless information such as spaces and punctuation in field values; The upper and lower case are unified, for example, Printer and printer belong to the printer type, and are named Printer uniformly; The naming method is unified, for example, General Electric and GE belong to the description of General Electric Company.
(2) Remove Duplicate String Data for a Single Field
Single field data has two aspects. On the one hand, it means that the value of a field in the data set is fixed and does not change, and it does not contribute to the identification of industrial control equipment. This variable should be removed directly. On the other hand, it means that the value of a certain position in a variable data is single, as shown in Table 5. They are the original value and the modified value of some fields in the industrial control equipment data. Among them, 31C, 314V3, 3135BG04 and other mixed type data will be converted to numerical types in Section 4.1.2.

(3) Remove Variables with Low Variance
In addition to the fact that a single quantity does not contribute to the identification of industrial control equipment, if the variance of the variable is low, the contribution to the identification of industrial control equipment will also be low. By setting the minimum variance threshold, the variables with variance
In Eq. (1), the variable is x, xi represents the first value of variable x,
Data conversion converts the data of industrial control equipment into data suitable for machine learning models, but only converts the representation, but the data before and after conversion are still consistent in meaning without changing the semantics. In the process of industrial control equipment identification, because the data types of the data set are relatively chaotic and cannot meet the data input requirements of the machine learning model, data conversion is very important for the research of equipment identification. Most machine learning algorithms only support numeric types, so data conversion is required to convert alphanumeric variables into numeric variables.
(1) Type Conversion
One-Hot Encoding can be used for unordered variables. The N field values in a certain field are encoded by using N-dimensional data values. In the encoded value, there is only one dimension in which the number is 1, and the others are 0. The advantage of one-hot encoding is that it can convert unnecessary variables to numeric types, is simple and easy to implement, and can expand the data dimension [24]. The one-hot encoding method is used to make the feature values without any relationship mutually exclusive, which makes the distance between features more reasonable.
For ordered variables, if the one-hot encoding method is used, the original value information will be lost, and the Label Encoder method can be used for conversion. For each variable field value, a code between 0 and N is assigned, and N is the network backup. The total number of variable fields.
(2) Property Construction
In the process of realizing the industrial control equipment identification method, attribute construction is used to create new attribute fields from the existing fields of the original data set so that the data is more complete, the information is easier to mine and the identification results of the industrial control equipment are more accurate.
Build new attribute fields as label data for training and testing of machine learning methods. The label attribute field added in this article is the type of industrial control device, that is, the result of the device identification method.
Character data can be converted to numeric types according to the above type conversion method, but for complex mixed data, data conversion needs to be performed according to the method of attribute construction. The new attribute construction for the mixed data can ensure the integrity of the data without losing the valuable information of the data and can also ensure the accuracy of the training results of the device identification method.
4.1.3 Feature Dimensionality Reduction
After the original data set is cleaned and transformed, the feature dimension is too large, which will lead to overfitting of the data, which increases the computational difficulty and time in the classification process. This paper uses principal component analysis to map high-dimensional sample data into low-dimensional space.
PCA [25] is one of the most commonly used methods for feature linear dimensionality reduction. In order to retain more data information contained in the original features, PCA maps high-dimensional data to low-dimensional space through a certain mapping, and the variance between the data after dimensionality reduction is as large as possible. The PCA algorithm is described as follows:
(1) Sample Data Centralization
The sample set is recorded as D and contains data from n networked devices, known as
In Eq. (2), where xij is the value of the j column in row i of the original sample data, m is the number of the j dimension data, the new data matrix Y is obtained after the central processing of the original matrix, the value of the j column in row i of the Y is yij.
(2) Calculate the Covariance, the Covariance Matrix
The covariance represents the correlation between the two variables, and the formula is Eq. (3).
The covariance matrix formula is Eq. (4).
Y is the sample data matrix and YT is the transpose of the sample data matrix. That is, the rows and columns of matrix Y are transposed to each other.
(3) The Lagrange Multiplier Cannot Be Solved
The objective of PCA is to make the variance and maximum distance to the center projected by all data points of the sample in a certain direction:
Lagrangian, introducing parameter
The solution:
(4) Eigenvalue Decomposition and Generate Reduced-Dimension Data
The characteristic value
4.2 Single Classifier Construction
Since the k value of the k-means clustering method is difficult to determine, and because it is unsupervised training, the training model has no samples to learn, resulting in a low accuracy rate. This part uses COP-k-means and constrained seed k-means algorithm for device identification. The COP-k-means algorithm and the constraint seed k-means are compared and analyzed through the evaluation criteria of precision rate, recall rate and F1 value, and the optimal algorithm is selected as the single-classifier model, and iteratively runs to obtain k single classifiers as the input of the next part.
4.2.1 Feature Sample Random Sampling
In the ensemble algorithm, multiple different classifiers need to be constructed, and each classifier needs a different training data set. This section proposes the method of random selection of features and random samples to construct multiple classifiers. The randomness of samples means that each classifier adopts the random sampling method with replacement to select samples. There is no need to manually split the training set and the test set. Some samples will be selected multiple times, and some samples will never be selected. Assuming that the sample set is n, the formula for the probability that each sample is selected at least once as shown in formula (9).
Tibshirani et al. [26] pointed out that when n approaches infinity, about two-thirds of the sample will be selected, and the unselected sample data will be tested, making full use of all the sample data.
4.2.2 Semi-Supervised Clustering
Clustering k-means algorithm is the most commonly used algorithm in the classification algorithm, has certain advantages, simple and efficient, can deal with a large number of data, and can be used to clean up noise data, to achieve a better recognition effect. But the selection of k value has a great influence on the clustering effect, and because the k-means clustering algorithm belongs to unsupervised training, the training model has no samples to learn, which leads to low accuracy.
By using semi-supervised k-means clustering algorithm to identify and classify the device types of networked device data, the k-means algorithm can avoid the randomicity of the initialization center and the defect of the local optimal solution, and improve the effect of single classifier. Therefore, this paper uses semi-supervised k-means clustering algorithm as the base classifier algorithm.
The ensemble learning [27] classification algorithm needs to construct multiple different single classifiers for learning. In this study, feature attributes and sample data differences are used to ensure that the trained single classifiers are different. The multiple classifiers obtained in the previous section are combined by ensemble learning the fusion strategy of Adaboost and Bagging. The two fusion strategies are analyzed through the evaluation criteria, and the optimal k value of the Adaboost algorithm and Bagging algorithm is obtained. The two algorithms are compared and analyzed in the case of the optimal k value, and the optimal method is obtained. The optimal results are obtained by identifying the test data by the optimal method.
Sample variability refers to the random sampling method described in the previous section. Assuming that the ensemble learning classification algorithm needs to construct k base classifiers, each classifier adopts the method of replacement sampling to randomly select a sample subset for training, and obtain k different base classifiers. Feature difference means that in the process of constructing multiple classifiers, the feature attributes selected by each base classifier are different, and each base classifier randomly selects the feature attributes by sampling without replacement. Bias is the difference between the training model’s prediction of the input data and the actual result. Variance refers to the distribution of the predicted value of the training model for the input data. The larger the variance, the greater the impact of the training model on data changes.
The introduction of two differences makes the different base classifiers full of diversity and avoids the overfitting problem of the base classifier due to too small training error and too low generalization ability. The ensemble learning and fusion strategy make decisions by combining the results of multiple single classifiers, thereby reducing the variance and making the entire model more accurate in predicting the input data. Therefore, the ensemble learning and fusion strategy can balance bias and variance.
In this paper, the Adaboost algorithm and the Bagging algorithm have the same method of constructing multiple base classifiers, so the two algorithms use the same multiple base classifiers. The difference between the two algorithms is that the fusion strategies of multiple base classifiers are different. The Adaboost algorithm uses a weighting method to combine multiple base classifiers. The weights are not manually set, but update the formula based on the weights of the classifiers, thereby reducing human error. Bagging uses the voting method to obtain the final identification result of industrial control equipment.
The optimal k value is the minimum value that can achieve the convergence effect. When the number of single classifiers combined by two algorithms is obtained through experiments, the effect gradually converges, and the optimal k value of the two algorithms is 15.
In 2017, Li [28] used confusion matrix to calculate the accuracy of the classifier and evaluate the classification effect of the device classifier. The confusion matrix, also known as the error matrix, is mainly used to describe the performance of the classifier. In 2018, Zou et al. [29] not only used the general evaluation criteria recall rate, accuracy rate, and coverage rate but also increased the coverage verification of equipment models for system evaluation. We also use accuracy rate, recall rate, and F1 for comparison in the next section.
We use the precision rate, recall rate and F1 value as the evaluation indicators of the industrial control equipment recognition research algorithm. Assuming that the real category of the device is i, TPi means that the real device type is i, and the number of samples whose predicted type is also i; FPi indicates the number of samples whose real device type is i, but the predicted type is not i; FNi indicates the number of samples whose real device type is not i, the predicted type is i, and the number of samples whose predicted type is not i; TPi indicates the real device The number of samples whose type is not i and whose prediction type is not i.
Eq. (10) is the accuracy rate of the i-th category of equipment, which refers to the proportion of correct samples under the condition that the predicted equipment type is the i-th category.
Eq. (11) is the recall rate of the i-th category of equipment, which refers to the proportion of correct samples under the condition that the real equipment type is the i-th category.
The F1 value is an evaluation standard that takes precision and recall into consideration, and Eq. (12) is the formula for calculating the F1 value of the i-th category of equipment.
Machine learning has a very good effect on the identification of networked devices in cyberspace, but the existing networked device identification methods based on machine learning lack public data sets, so the data detected by Nmap is used as the initial data source. Through the data set and according to the results identified by the rule matching method in Section 3, the data set is marked with equipment types, including 11 kinds of routing switching equipment, PLC, video surveillance, building automation control equipment, network storage equipment, Nport equipment, ATG, firewall, etc., equipment type. The data set marked with the device type is called the labeled data set, which is used as the data source for machine learning training and testing models.
The experimental source data in total in this paper is 13540 pieces, containing a total of 27 protocols, including both industrial control equipment protocols and non-industrial control equipment protocols. All the experiments were conducted on a server with a Ryzen 7 4800H CPU@2.90 GHz × 8, one GTX 1650 GPU, 16 GB memory, and 500 GB SSD.
5.2 Rule Base Construction Experiment Results
Knowing the model, manufacturer, product type and other information of the device data, the device type can be obtained by searching the specific URL in the network and crawling the classification field in the page. However, network data collection needs to formulate a search strategy for URL network addresses. The search strategy is as follows:
(1) URL Link Controllability: The user can input the corresponding data of the industrial control device by changing the URL link accessed. In URL: “www.yesmro.cn/catalog/productlistbyattribute?keyword=DOP-107WV”, the keyword field corresponds to the device type information, and you can change the value of the keyword to get the page for that type.
(2) URL Content Availability: The page information corresponding to the URL needs to include the device type field.
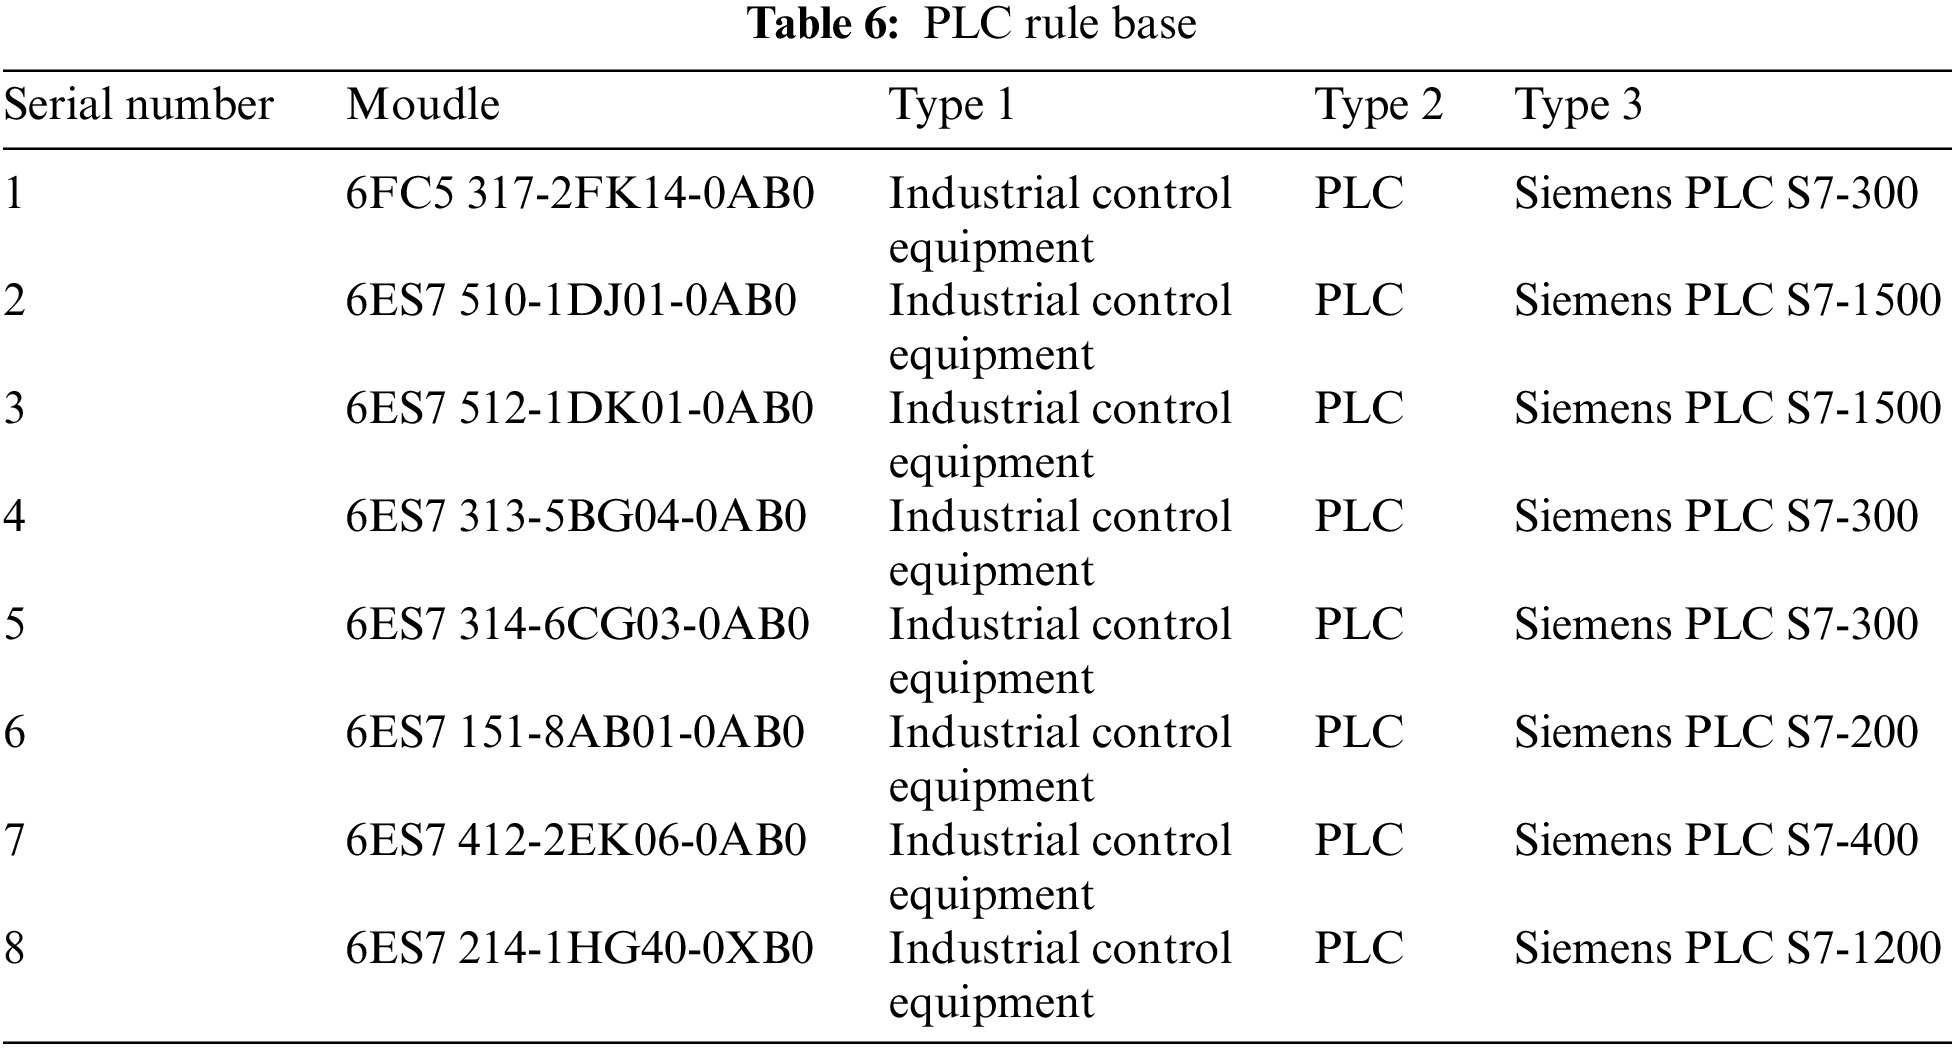
(3) URL Information Device Unique: Only one device type classification result can be obtained by analyzing the URL data. Before collecting network data, key fields need to be normalized according to the URL format, otherwise, the URL cannot recognize the input, so the data needs to be normalized and standardized before automatic data collection. The device type corresponding to the device data field can be obtained through network data collection. Table 6 shows the Siemens PLC model. Access the corresponding fields of the crawled device model and device type into the rule base. Table 7 shows the rules between the device protocol, port, manufacturer and device type.

5.3 Multi-Protocol Rule Matching Effect Analysis
Through the method of network data collection and multi-protocol rule matching and fusion, a total of 11561 industrial control devices were identified, including the data successfully identified by Nmap. Compared with the recognition effect of Nmap, the information obtained by the method used in this section is more detailed, and the device recognition rate is improved.
5.4 Data Preprocessing Effect Analysis
The initial data set has a total of 24 dimensions, of which the last column is label data, and the device type is represented by 0–10, respectively. Table 8 shows some of the original fields extracted from the data set and their meanings. The Script_Name field is detected by the Nmap tool to obtain the detection script name used by the receiver to respond.

The data is cleaned to obtain fields that are highly relevant to device identification, namely Protocol, Appservice, Script_Name, Model_Name, Vendor, Model_Name, timeZone, Http_Title and other fields.
After data cleaning, type conversion is performed on the data to meet the input conditions of the machine learning model. Type conversion of data to satisfy the input conditions of the machine learning model. Fields such as Model_Name and timeZone are represented by 0 and 1, because these fields are unique to a certain type of device. 0 means that the device does not have the field value, and 1 means that the field value exists.
The character types of the remaining fields are unordered variables. The four fields of Protocol, Script_Name, Vendor, and Device_Name use one-hot encoding for data conversion. Table 9 shows the values of the Script_Name field before and after conversion.

5.4.3 Feature Dimensionality Reduction
After data conversion, the industrial control equipment samples become 75-dimensional data. Ensemble learning needs to construct k multi-classifiers. In order to reduce time complexity and improve efficiency, this study uses the PCA algorithm for feature dimension reduction. After PCA feature dimensionality reduction, the cumulative contribution rate of principal components is shown in Fig. 4. With the increase of PCA algorithm dimensionality reduction, the cumulative contribution rate quickly approaches 1.
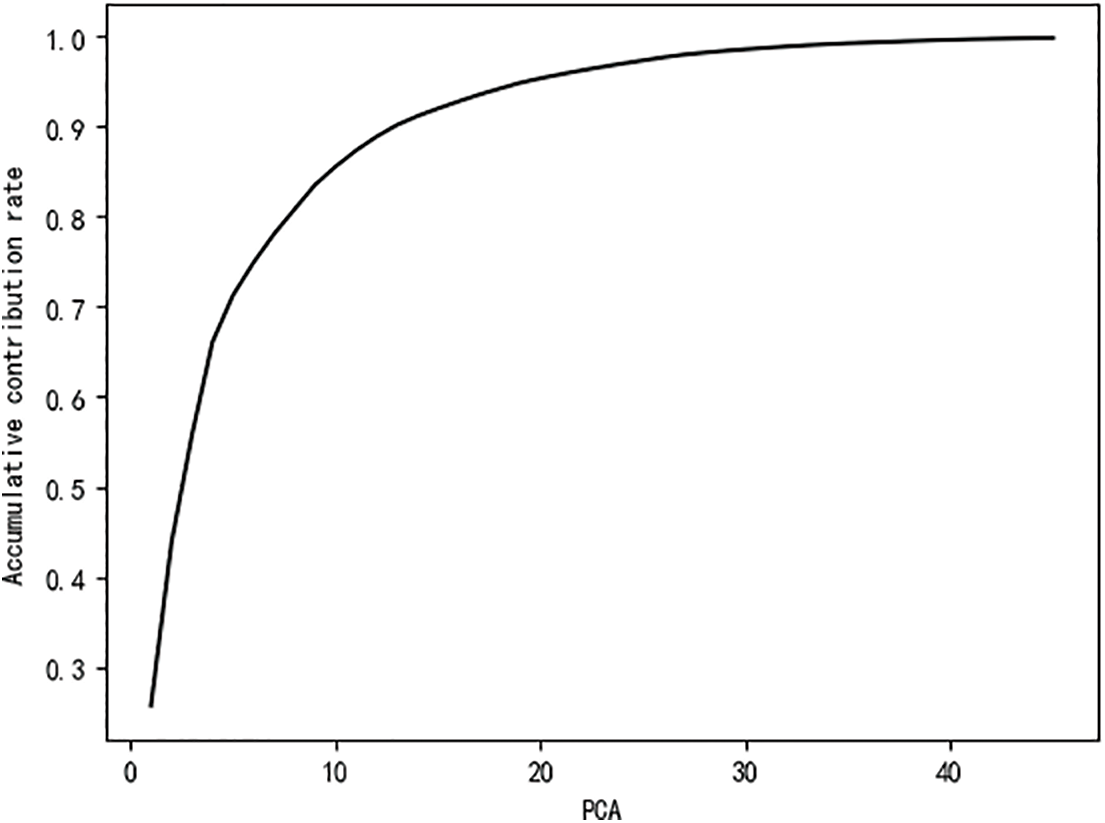
Figure 4: PCA principal component cumulative contribution rate
Through experiments, it is found that when the PCA algorithm is used to reduce the sample data set to 35-dimensional features, the cumulative contribution rate reaches 99%, so the first 35-dimensional data is selected as the training and testing data of the classifier.
5.5 Single Classifier Effect Analysis
In this paper, two clustering algorithms, the constrained seed k-means algorithm and COP-Kmeans algorithm, are used to analyze the effect of device identification, and the optimal single classifier is obtained. The comparison of the two algorithms follows the principle of the variable control method, and the input data remains the same.
The general evaluation standard of the k-means algorithm is the silhouette coefficient, so the silhouette coefficient is used to evaluate the clustering effect. Experiments show that the clustering effect of the k-means algorithm is better after adding PCA.
The value range of the silhouette coefficient is between (−1, 1), which is used to indicate the degree of cohesion within the cluster and the degree of separation between clusters after classification by the clustering algorithm. The larger the value of the silhouette coefficient, the better the classification effect of the clustering algorithm. The silhouette coefficient of the k-means algorithm without PCA feature dimensionality reduction is 0.751, and after using PCA feature dimensionality reduction, the silhouette coefficient is 0.818, so after adding PCA feature dimensionality reduction algorithm, the effect of clustering is increased.
Based on the k-means algorithm, the COP-k-means algorithm is used for device identification. The COP-k-means algorithm also needs to construct two sub-sets, which are the set of non-connected relationships and the set of must-connected relationships. This article stores these two relationships as files, and randomly selects two rows of data. If it is a class, the relationship is marked as 1; if it is not a class, the relationship is marked as −1.
We select 10% of the sample data by random sampling as the test set. The function classification_report (clusters, Y_train) is used for algorithm classification prediction evaluation. The advantage of this function is that it does not require the type of input data. The input parameters are the device data predicted value and the true category, respectively. Calculate the precision rate, recall rate, and F1 value of the 11 device types, respectively, and obtain the evaluation number of the COP-k-means algorithm. The results are shown in Fig. 5. The weighted average of the evaluation indicators has the highest precision, and the recall rate is similar to F1 and is lower than 0.6.
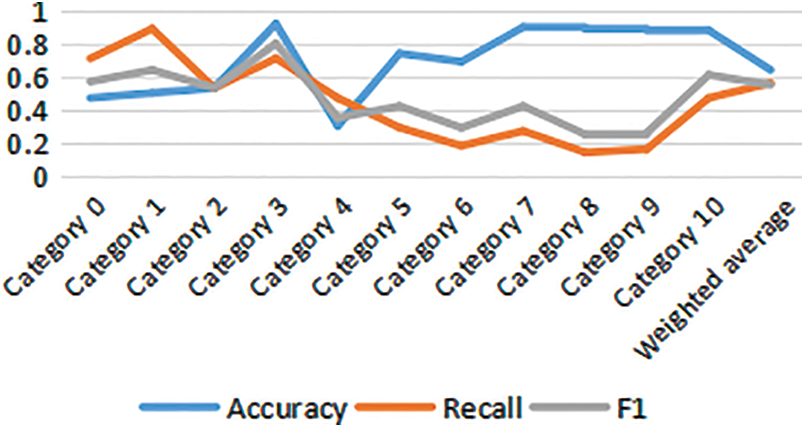
Figure 5: COP-k-means single classifier algorithm evaluation
The constrained seed k-means algorithm needs to randomly select 90% of the data sets from the 11 kinds of device data in the labeled data set as the seed set.
In addition to the seed set, the remaining sample data set is used as the test set. According to the function adopted by the COP-k-means algorithm, the evaluation values of the 11 device types and the constrained seed k-means algorithm are calculated according to the precision rate, recall rate, F1 value and the predicted value of the algorithm. The number of samples for each type, as shown in Fig. 6. The weighted average accuracy and recall rate of the evaluation index are similar to F1 and slightly higher than 0.8.
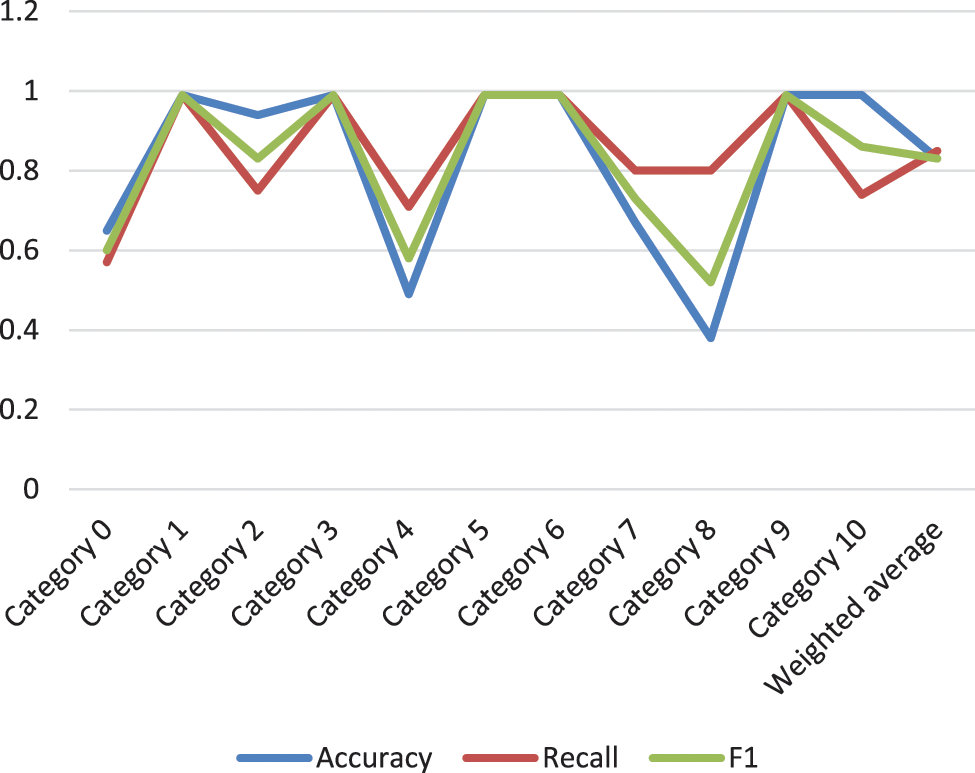
Figure 6: Constrained seed k-means single classifier algorithm evaluation
The constrained seed k-means algorithm and the COP-k-means algorithm are evaluated by the weighted evaluation method, as shown in Fig. 7. From Fig. 7, it can be known that the constrained seed k-means algorithm has higher accuracy and better effect, so the constrained-seed k-means algorithm is used as a single classifier.
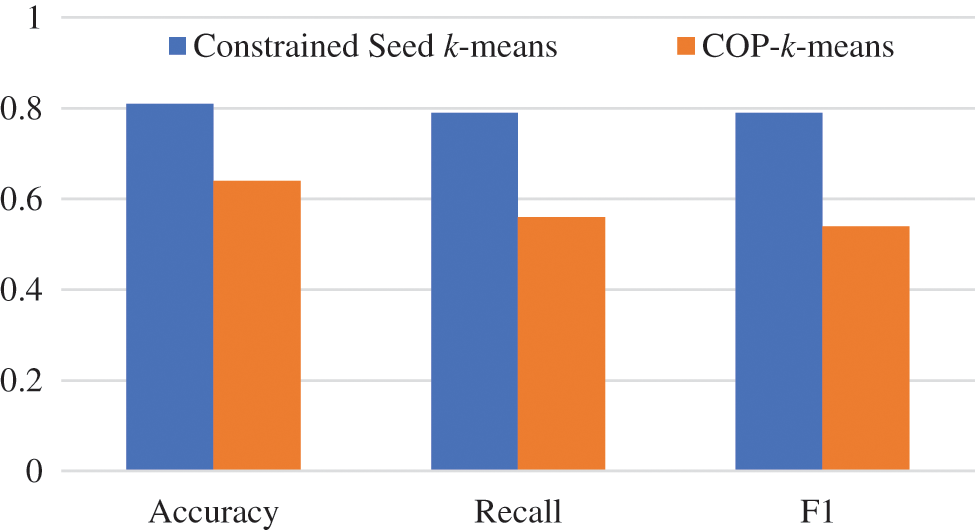
Figure 7: Comparison of single classifier algorithms
5.6 Ensemble Learning Effect Analysis
Ensemble learning fuses multiple single classifiers together through a certain combination strategy to form a strong classification, and the effect of strong classification is significantly stronger than that of single classifiers. Through the single classifier effect analysis experiment in the previous section, it can be known that the constrained seed k-means algorithm has the best effect. Therefore, the constrained seed k-means algorithm is used as the training model of the single classifier. When constructing multiple single classifiers, this paper adopts the feature attributes, The difference of sample data to ensure the difference between them.
Feature attributes, sample data sets need to maintain differences. This paper adopts the random sampling method of seed set when constructing the classifier constrained seed k-means algorithm. When k = 15, 15 single classifiers are constructed, and 15 seed sets are randomly selected for each device type in the training set as the training set of each single classifier, and the special attributes are randomly divided into 15 categories. The sample adopts the random replacement sampling method, and the feature adopts the random non-replacement sampling method.
5.6.1 Bagging Fusion Effect Analysis
Each classifier in Bagging is independent of each other, and each classifier can get the prediction result and evaluation value, and finally combine the results of multiple classifiers through Bagging. The device type value with the most occurrences in the classifier is used as the final device type. If there are equipment types with the same number of votes, a category is randomly selected as the final result.
We randomly extract 10% of the data set processed by PCA as the seed sets, randomly select 15 seed sets, and the remaining data as the test set. The method is the same as that of the single classifier to extract the seed set.
Although the test set used by each classifier and strong classifier is the same, the seed set changes every time the file is run. Therefore, the training set and test set will also change. Randomly select the results of a certain running file. Table 10 shows the accuracy test results of the first six single classifiers, including the accuracy of each category in each classifier and the weighted average of the accuracy of all categories; Table 11 shows the recall test results of each of the first six single classifiers; Table 12 shows the test results of the F1 value of each of the first six single classifiers; Taking the weighted average as the assessment results, Fig. 8 compares the evaluation results of each single classifier with the weighted average as the evaluation result.


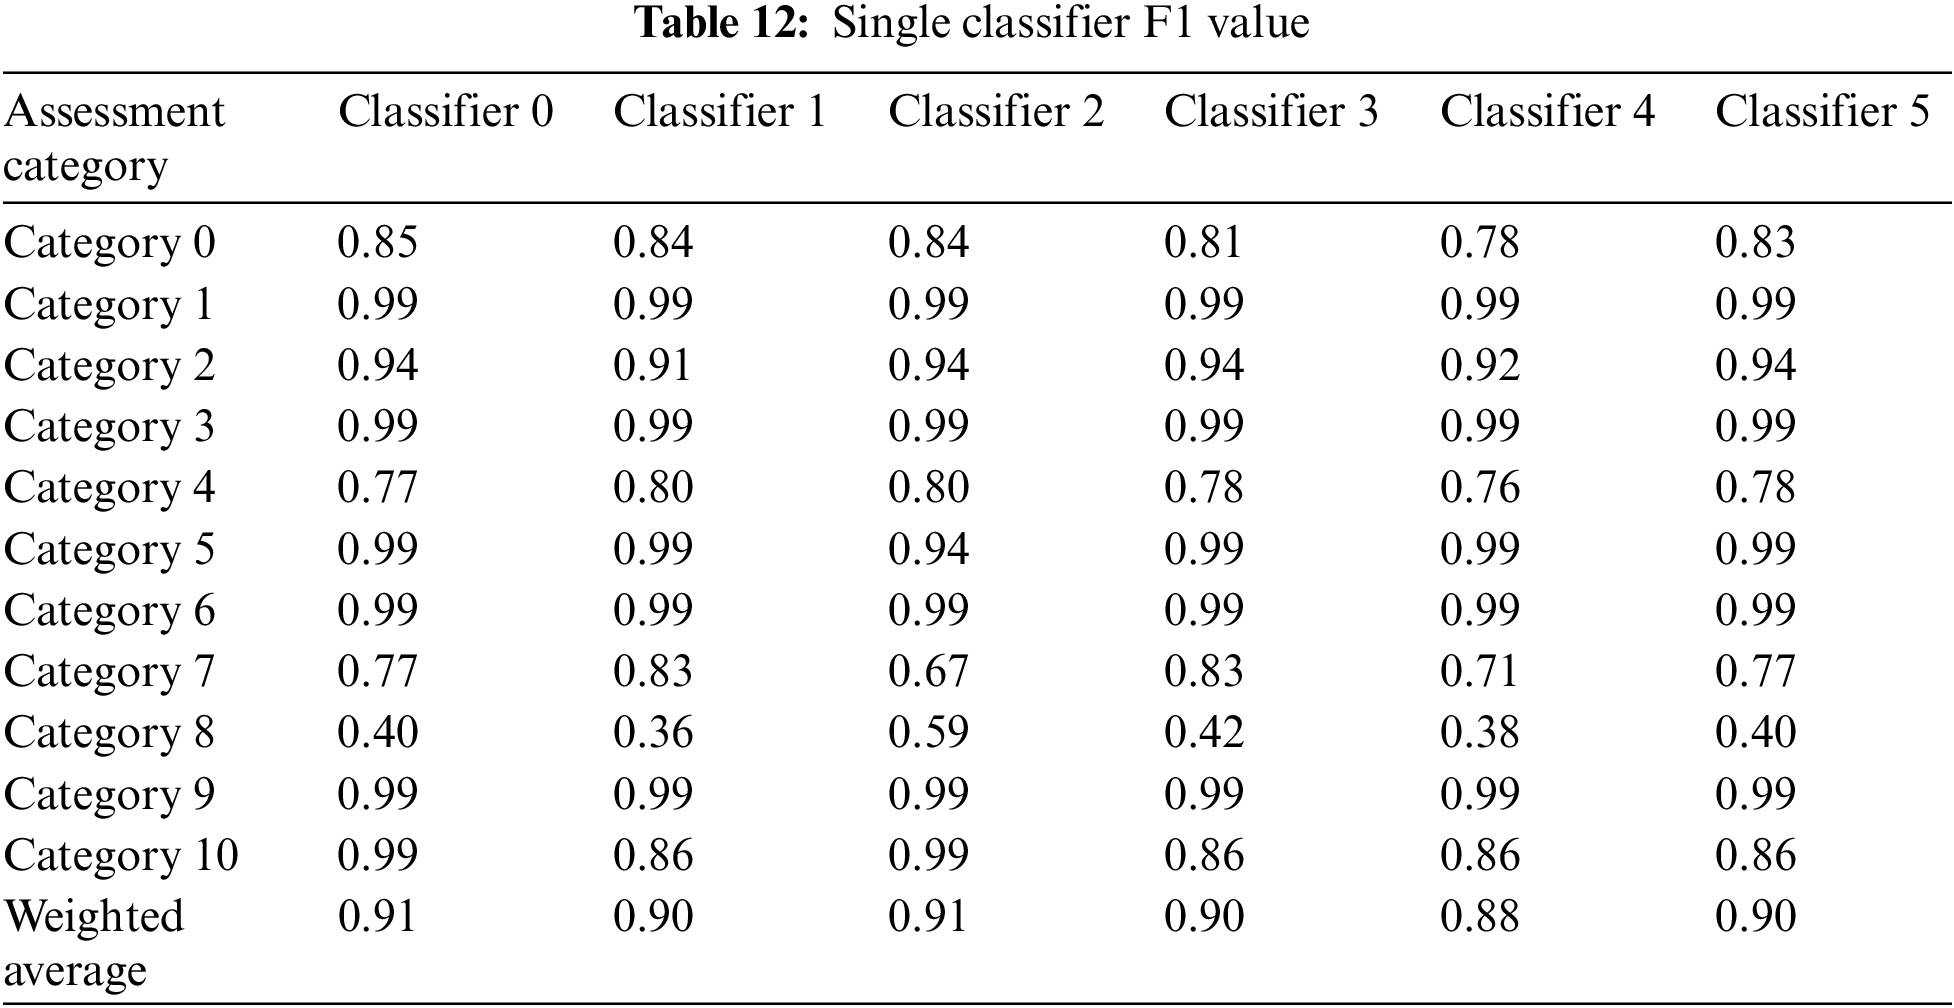

Figure 8: Comparison chart of single classifier evaluation
Fig. 9 is the effect diagram obtained by using the Bagging algorithm to fuse the prediction results of the 15 classifiers using the voting method. As can be seen from Fig. 9, a single classifier may have a high accuracy rate for a certain device type, but the effect of multiple classifiers is reduced due to the poor performance of other classifiers.
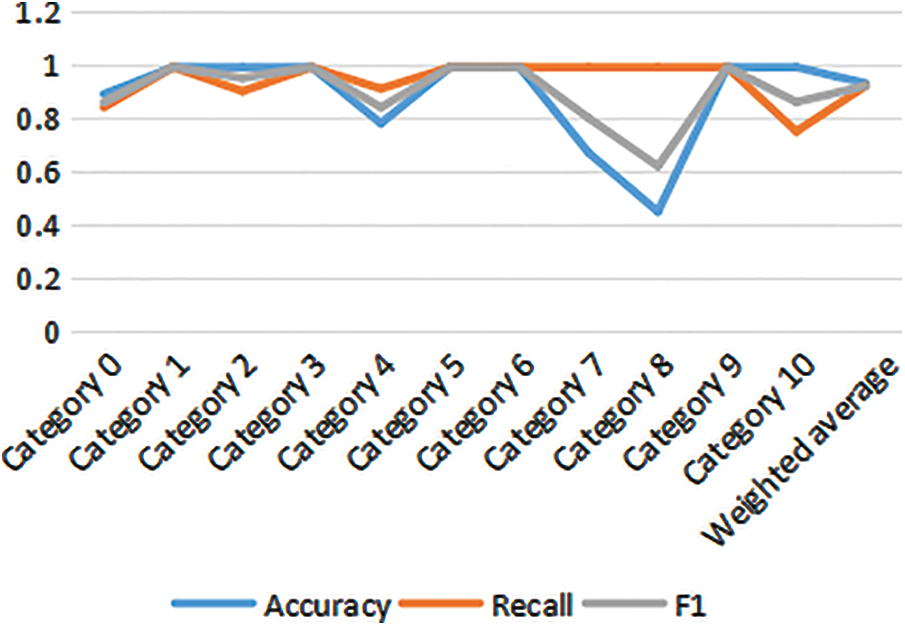
Figure 9: Bagging evaluation
As shown in Fig. 10, if the weak classifier is used, the recognition error of the weak classifier will be improved, but the overall effect of the multi-classifier will be significantly enhanced. And the recall rate and F1 value increase slowly initially, but with the increase of the number of classifiers, the effect of the multi-classifier is getting better and better.
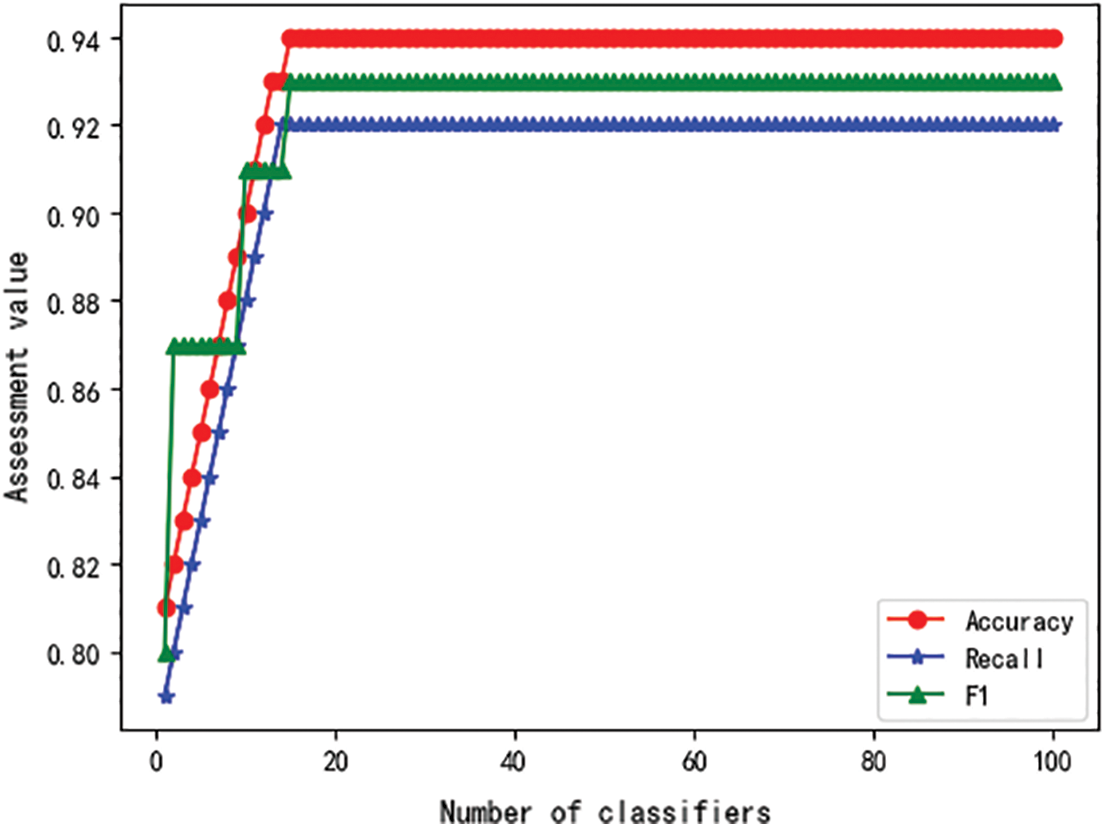
Figure 10: The relationship between Adaboost evaluation value and the number of classifiers
5.6.2 Adaboost Fusion Effect Analysis
The Adaboost algorithm calls the AdaBoostClassifier library function of the sklearn.ensemble module in python for device identification. Table 13 shows the evaluation values of the Adaboost algorithm when creating 15 weak classifiers.

Fig. 11 shows the effect of Adaboost on the identification of industrial control equipment when the number of single classifiers increases gradually. It can be found that when k = 15, the effect of the Adaboost algorithm is significantly higher than that of the Bagging algorithm. It can be seen from the figure that a classifier has a poor recognition effect. But when there are two classifiers, the second classifier increases the weight of the wrong samples of the first classifier, the recognition effect is significantly improved and finally reaches 99% accuracy. The algorithm efficiency is obviously improved, and it has a good effect in the identification and classification of industrial control equipment.
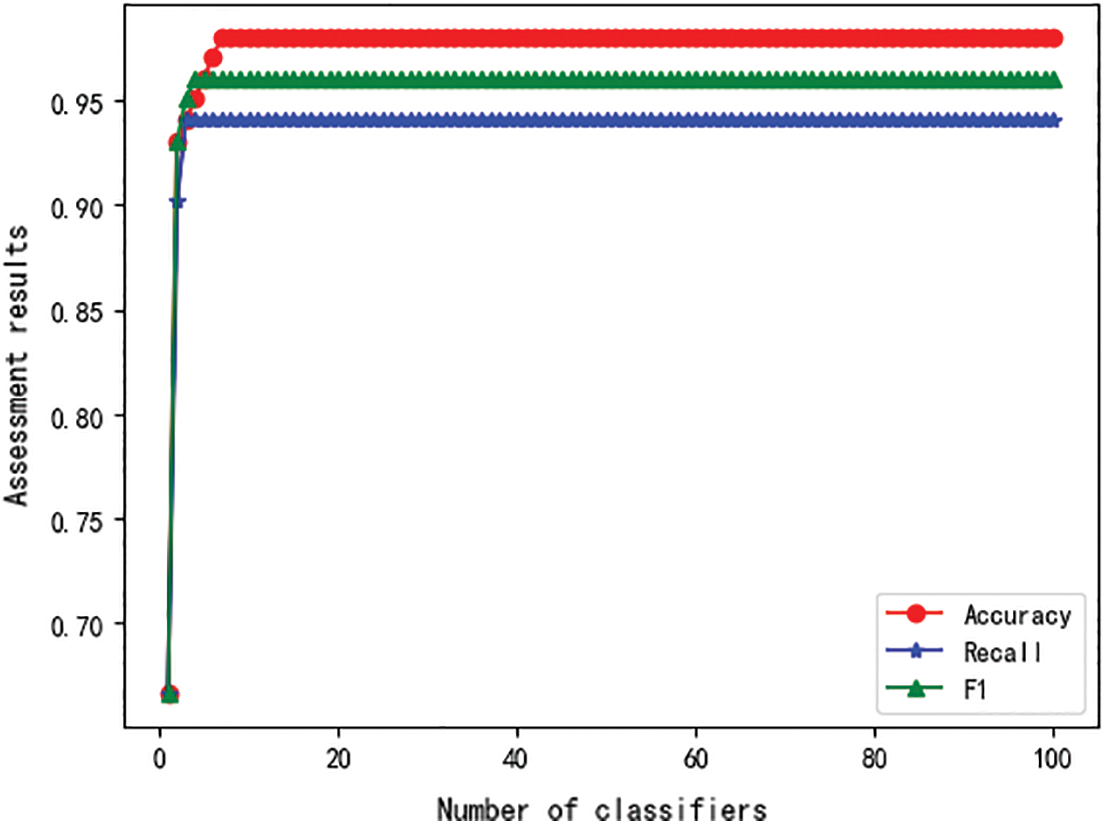
Figure 11: The relationship between the Adaboost evaluation value and the number of classifiers
5.6.3 Bagging and Adaboost Fusion Effect Comparison
The Adaboost and Bagging algorithms are compared, and the weighted average is used as the Assessment results. As shown in Fig. 12, it is a comparison chart of the two algorithms’ precision rate, recall rate, and F1.
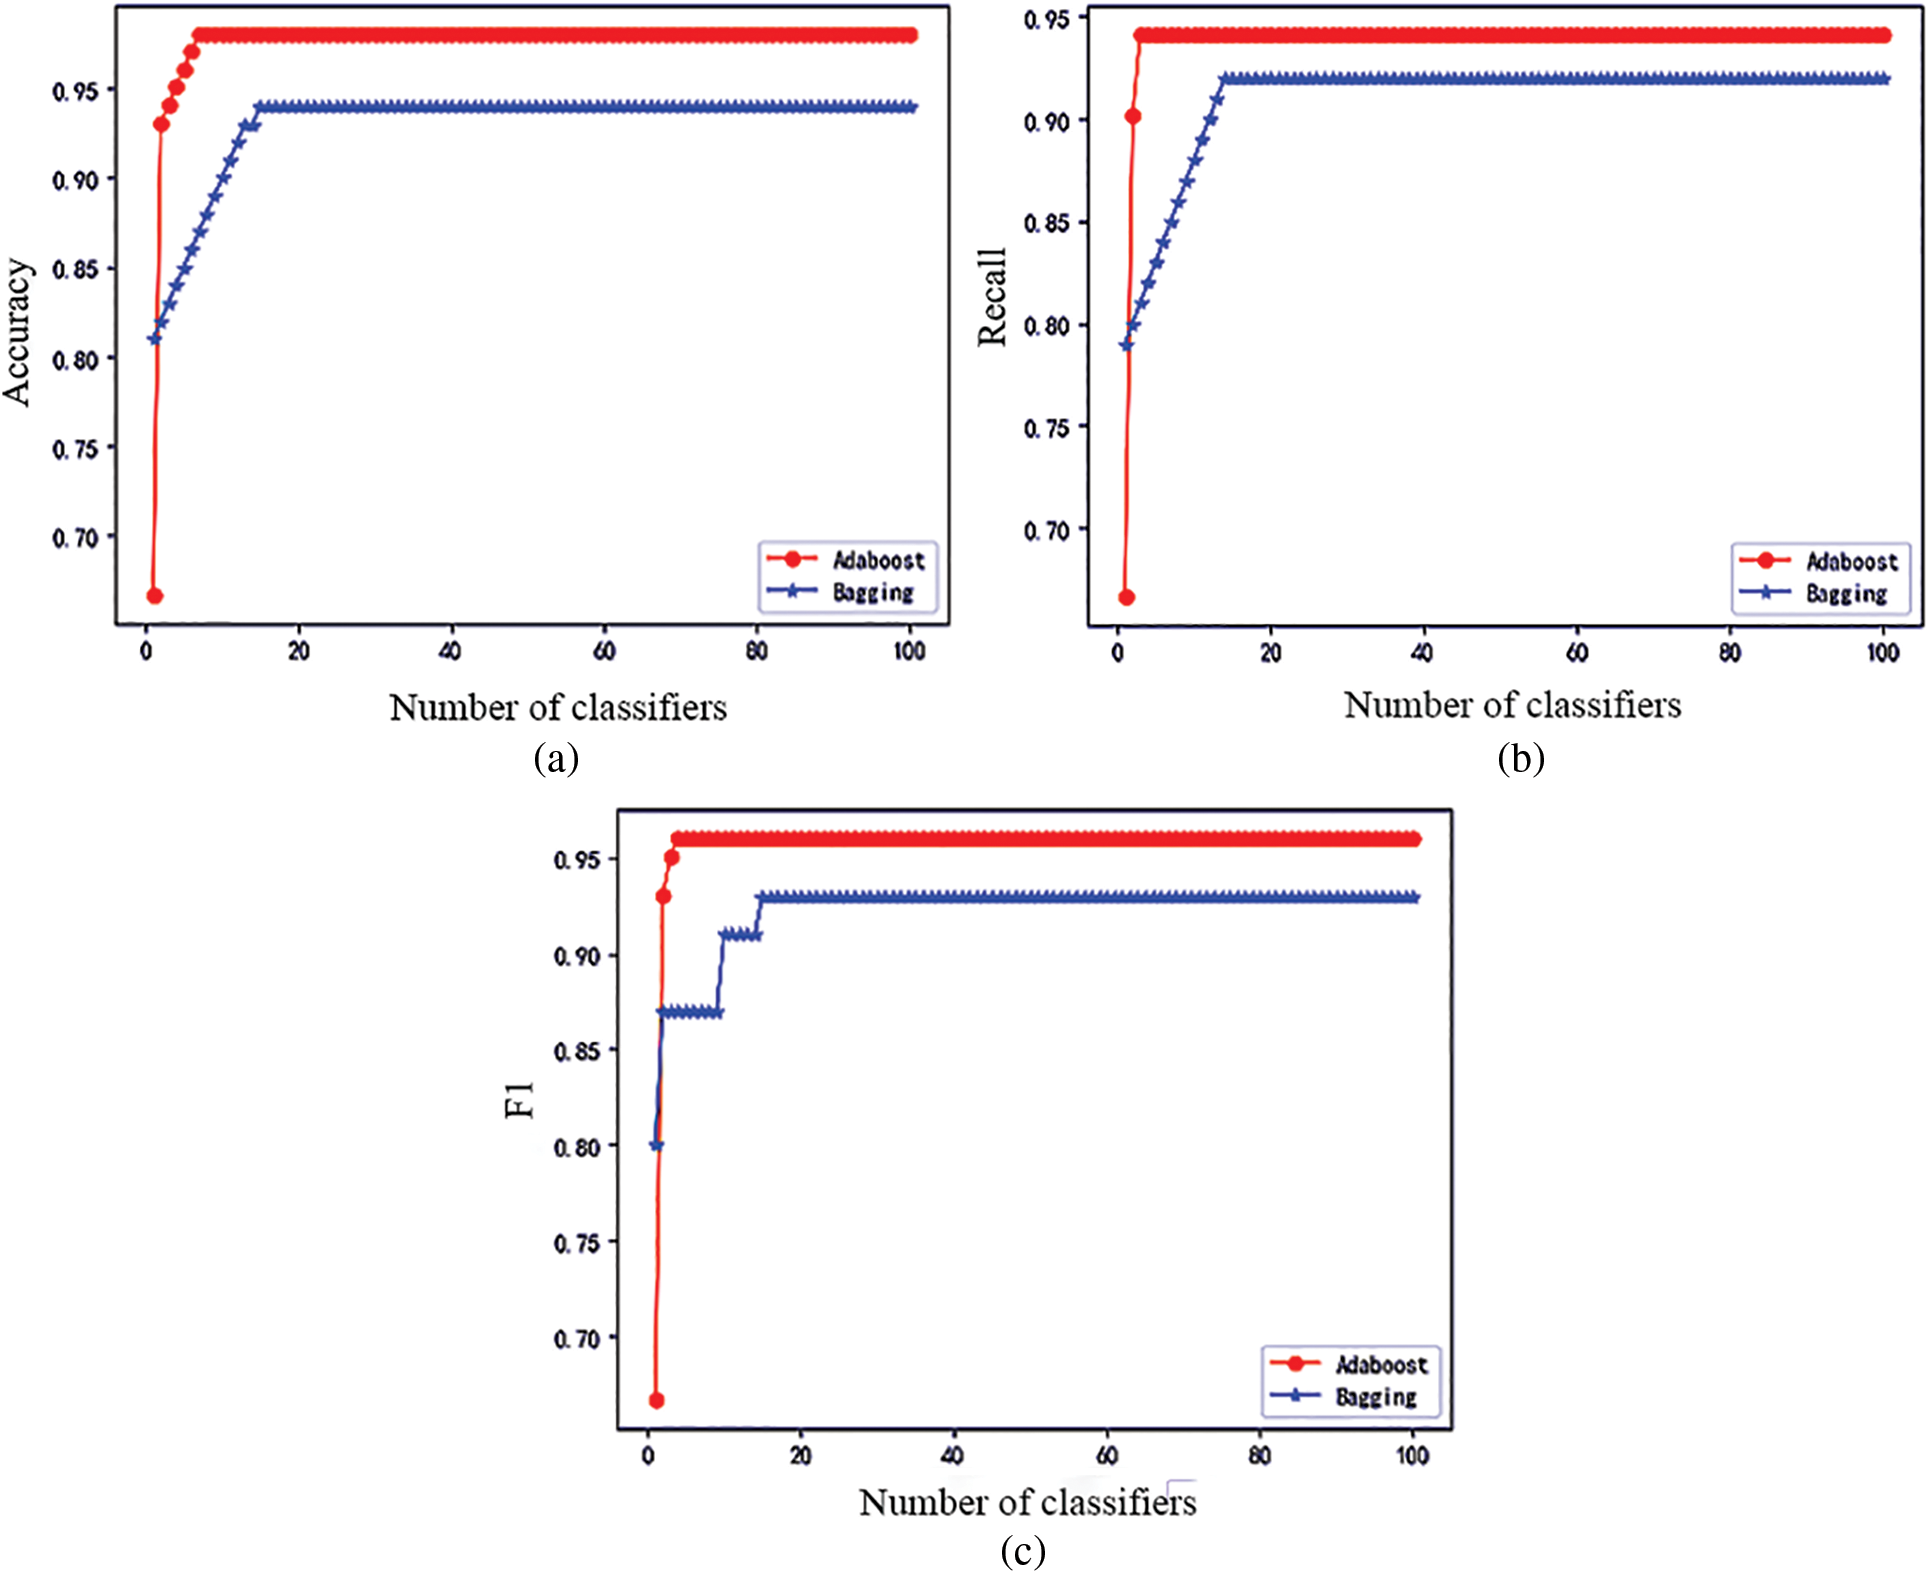
Figure 12: Comparison of the effects of Adaboost algorithm and Bagging algorithm
According to the two comparison charts of the ensemble algorithm, it can be seen that when a classifier is used, the effect of the Adaboost algorithm is not as good as that of Bagging due to the random seed set. However, the second classifier, the Adaboost algorithm, increases the weight of the wrong samples, so the precision, recall and F1 value are significantly improved, surpassing the Bagging algorithm, and as the number of iterations increases, the two reach stable values respectively. Among them, the precision, recall and F1 value of the Bagging algorithm are stable at 94%, 92% and 93%, respectively, and the precision, recall and F1 value of the Adaboost algorithm are stable at 99%, 94% and 96%, respectively. So Adaboost works better than Bagging.
Table 14 shows the evaluation and comparison of the COP-k-means, constrained seed k-means, Bagging, and adaboost classification algorithms.

The whole algorithm in this section can be obtained through the experimental comparison diagram. Data preprocessing is performed by one-hot encoding and PCA, and the constrained seed k-means algorithm is constructed as the base classifier. Three base classifiers are constructed by the Adaboost algorithm, which can be identified in industrial control equipment. Good results are obtained in application.
We propose PCA-Adaboost, a recognition method based on rule matching and ensemble learning, for industrial control device identification. For the data that cannot be recognized by the Nmap tool, the method of rule matching and network data collection fusion is used to identify equipment, and rules are constructed by network data collection method, and then single and multi-protocol rule matching is performed, which improves the recognition rate of industrial control equipment. The data set with successful rule matching and recognition is added to the device type label, which is called a labeled data set. Experimental results show that using the PCA-Adaboost method for industrial control equipment identification, the effect is significantly increased, and the accuracy rate, recall rate, and F1 value are higher. If the vulnerable devices can be found before the attack is launched, and the source of the attack can be cut off, the threat can be effectively avoided and the stable operation of the industrial control system can be ensured. With the arrival of the fifth-generation mobile communication technology, industrial control equipment identification technology can be used for future network research.
There are still some aspects that need to be improved. For the rule mining, relying on text code comparison combined with manual methods has not achieved full automation. Future work suggests applying connected device identification to applications in aspects such as device authentication, asset distribution, and anti-identification. On the basis of rule matching, different machine learning algorithms can be used to further identify devices that cannot be identified by rule matching.
Funding Statement: This work is funded in part by the National Key R&D Program of China (Grant No. 2022YFB3102901), the National Natural Science Foundation of China (Grant Nos. 61976064, 61871140, 62272119, 62072130), and the Guangdong Province Key Research and Development Plan (Grant No. 2019B010137004).
Conflicts of Interest: The authors declare that they have no conflicts of interest to report regarding the present study.
References
1. Yadav, P., Vishwakarma, S. (2018). Application of Internet of Things and big data towards a smart city. 2018 3rd International Conference on Internet of Things: Smart Innovation and Usages (IoT-SIU), pp. 1–5. Bhimtal, India, IEEE. [Google Scholar]
2. Gao, S., Jia, Z. X., Wang, S. W. (2017). Report on the security of internet-connected smart devices in China. China Internet, 2018(2), 53–59. [Google Scholar]
3. Du, J. (2019). Research on information security situational awareness technology of industrial control system (Thesis). Chongqing University of Posts and Telecommunications, China. [Google Scholar]
4. Yang, W. C., Guo, Y. B., Li, T., Zhu, B. Q. (2020). A method based on traffic fingerprint for IoT device identification and IoT security model. Computer Science, 47(7), 299–306. [Google Scholar]
5. Charyyev, B., Gunes, M. H. (2020). Locality-sensitive IoT network traffic fingerprinting for device identification. IEEE Internet of Things Journal, 8(3), 1272–1281. https://doi.org/10.1109/JIOT.2020.3035087 [Google Scholar] [CrossRef]
6. Sun, Y., Tian, Z., Li, M., Su, S., Du, X. et al. (2021). Honeypot identification in softwarized industrial cyber-physical systems. IEEE Transactions on Industrial Informatics, 17(8), 5542–5551. https://doi.org/10.1109/TII.2020.3044576 [Google Scholar] [CrossRef]
7. Song, Y. B., Qi, X. S., Huang, Q., Hu, A. Q., Yang, J. J. (2020). Two-stage multi-classification algorithm for internet of things equipment identification. Journal of Tsinghua University, 60(5), 365–370. [Google Scholar]
8. Sathyanarayana, S., Robinson, W. H., Beyah, R. A. (2013). A network-based approach to counterfeit detection. 2013 IEEE International Conference on Technologies for Homeland Security (HST), pp. 473–479. Waltham, USA. [Google Scholar]
9. Cao, L. C., Zhao, J. J., Cui, X., Li, K. (2016). Cyberspace device identification based on k-means with cosine distance measure. Journal of University of Chinese Academy of Sciences, 33(4), 562–569. [Google Scholar]
10. Feng, X., Li, Q., Wang, H., Sun, L. (2018). Acquisitional rule-based engine for discovering internet-of-things devices. 27th USENIX Security Symposium (USENIX Security 18), pp. 327–341. Baltimore, USA. [Google Scholar]
11. Nmap (2021). Nmap: The Network Mapper-Free Security Scanner. https://nmap.org [Google Scholar]
12. Shodan (2021). https://www.shodan.io [Google Scholar]
13. ZoomEye (2021). https://www.zoomeye.org [Google Scholar]
14. Shah, M., Ahmed, S., Saeed, K., Junaid, M., Khan, H. (2019). Penetration testing active reconnaissance phase-optimized port scanning with nmap tool. International Conference on Computing, Mathematics and Engineering Technologies, pp. 1–6. Sukkur, Pakistan. [Google Scholar]
15. Wagstaff, K., Cardie, C., Rogers, S., Schrödl, S. (2001). Constrained k-means clustering with background knowledge. International Conference on Machine Learning, vol. 1, pp. 577–584. USA, Morgan Kaufmann. [Google Scholar]
16. Karthik, R., Pramod, S., Kamath, S. (2013). W3-Scrape: A windows based reconnaissance tool for web application fingerprinting. arXiv preprint arXiv:1306.6839. [Google Scholar]
17. Husák, M., Čermák, M., Jirsík, T., Čeleda, P. (2016). HTTPS traffic analysis and client identification using passive SSL/TLS fingerprinting. EURASIP Journal on Information Security, 2016(1), 1–14. [Google Scholar]
18. Kohno, T., Broido, A., Claffy, K. C. (2005). Remote physical device fingerprinting. IEEE Transactions on Dependable and Secure Computing, 2(2), 93–108. https://doi.org/10.1109/TDSC.2005.26 [Google Scholar] [CrossRef]
19. Xiao, Q. W., Wang, J. H., Zhu, Y. X. (2017). Intelligent terminal device identification method of internet of things. Telecommunications Science, 33(2), 3–8. [Google Scholar]
20. Wu, S. H., Sun, D., Hu, Y. (2015). Web server identification based on bayesian theory. Computer Engineering, 41(7), 190–193. [Google Scholar]
21. Song, Z. P., Meng, X. Y., Xu, X. K., Gu, C. J. (2016). Development of redundant communication process control system based on Modbus and ZigBee. Electronic Technology Application, 42(1), 61–64. [Google Scholar]
22. Yu, F. W., Sun, H. Y., Zhang, S. J. (2013). A new timing method based on PLC scan cycle time and its application in automatic marine power station. Advanced Materials Research, 774–776, 1489–1492. https://doi.org/10.4028/www.scientific.net/AMR.774-776.1489 [Google Scholar] [CrossRef]
23. Miettinen, M., Marchal, S., Hafeez, I., Asokan, N., Sadeghi, A. R. et al. (2017). IoT sentinel: Automated device-type identification for security enforcement in IoT. IEEE 37th International Conference on Distributed Computing Systems (ICDCS), pp. 2177–2184. Atlanta, USA. [Google Scholar]
24. Liang, J., Chen, J. H., Zhang, X. Q., Zhou, Y., Lin, J. J. (2019). One-hot encoding and convolutional neural network based anomaly detection. Journal of Tsinghua University, 59(7), 523–529. [Google Scholar]
25. Wold, S., Esbensen, K., Geladi, P. (1987). Principal component analysis. Chemometrics and Intelligent Laboratory Systems, 2(1–3), 37–52. https://doi.org/10.1016/0169-7439(87)80084-9 [Google Scholar] [CrossRef]
26. Tibshirani, R. J., Tibshirani, B. (1993). An introduction to the bootstrap. Monographs on Statistics and Applied Probability, 57, 1–436. [Google Scholar]
27. Sagi, O., Rokach, L. (2018). Ensemble learning: A survey. Wiley Interdisciplinary Reviews: Data Mining and Knowledge Discovery, 8(4), 1249. https://doi.org/10.1002/widm.1249 [Google Scholar] [CrossRef]
28. Li, F. H. (2017). The design and implementation of network equipment identification system (Thesis). Beijing University of Posts and Telecommunications, China. [Google Scholar]
29. Zou, Y. C., Liu, S., Yu, N., Zhu, H. S., Sun, L. M. et al. (2018). IoT device recognition framework based on web search. Journal of Cybersecurity, 3(4), 25–40. [Google Scholar]
Cite This Article
 Copyright © 2023 The Author(s). Published by Tech Science Press.
This work is licensed under a Creative Commons Attribution 4.0 International License , which permits unrestricted use, distribution, and reproduction in any medium, provided the original work is properly cited.
 Downloads
 Citation Tools