
 Submit a Paper
 Propose a Special lssue
 Open Access
ARTICLE
A Restricted SIR Model with Vaccination Effect for the Epidemic Outbreaks Concerning COVID-19
1
Department of Mathematics and Statistics, College of Science, Imam Mohammad Ibn Saud Islamic University,
Riyadh, 11566, Saudi Arabia
2
School of Liberal Studies, Dr. B. R. Ambedkar University Delhi, Delhi, 110006, India
* Corresponding Author: Pranay Goswami. Email:
(This article belongs to the Special Issue: Recent Developments on Computational Biology-I)
Computer Modeling in Engineering & Sciences 2023, 137(3), 2409-2425. https://doi.org/10.32604/cmes.2023.028674
Received 31 December 2022; Accepted 09 March 2023; Issue published 03 August 2023
 View Full Text
 Download PDF
Abstract
This paper presents a restricted SIR mathematical model to analyze the evolution of a contagious infectious disease outbreak (COVID-19) using available data. The new model focuses on two main concepts: first, it can present multiple waves of the disease, and second, it analyzes how far an infection can be eradicated with the help of vaccination. The stability analysis of the equilibrium points for the suggested model is initially investigated by identifying the matching equilibrium points and examining their stability. The basic reproduction number is calculated, and the positivity of the solutions is established. Numerical simulations are performed to determine if it is multipeak and evaluate vaccination’s effects. In addition, the proposed model is compared to the literature already published and the effectiveness of vaccination has been recorded.Keywords
The World Health Organization (WHO) reports that COVID-19 was first reported in Wuhan, China, in December 2019 and was later designated a global pandemic on 11 March 2020. The beginning of the virus era can be traced back to 1965 when Tyrrell and Bynoe identified the B814 virus [1]. An adult’s respiratory system can contain the B814 virus, which causes the disease to spread [2]. Coronavirus antibody experiment [3], human coronavirus infections [4], and coronavirus isolation with some epidemiological studies [5] are some examples of early research on this disease. As a recent but common epidemic disease, the ability of COVID-19 to spread depends on the following:
• The inherent danger of viruses, such as their incubation period, infection rate, and recovery rate;
• The understanding of viruses in modern medicine and their therapeutic effects, such as the time it takes for patients to recover and the efficacy of vaccines;
• Countermeasures, such as travel bans, patient isolation, and importation restrictions.
Taking into account all of these factors, vaccination should be a primary goal of health administrators to protect people from these epidemic diseases. The invention of vaccines against pediatric infectious diseases has benefited civilization. Developing a system that could predict the ideal level of coverage of vaccines required to stop the spread of these diseases is essential because vaccination is considered the most successful therapy against pediatric infections.
Without considering antivirals or effective vaccines, mathematical models are crucial to understanding how epidemics spread and developing control tactics for their rapid development. Kermack et al. [6] investigated the SIR compartmental model in London during the Black Death. Kermack and McKendrick’s SIR model has contributed significantly to the study of infectious disease dynamics and is the most traditional and fundamental model used to research infectious diseases. The SIR model divides the total population into the following three populations: susceptible S, which represents those who are not infected but are likely to contract this type of disease; infectious I, which represents those who have been exposed to the disease as patients and are capable of spreading it; and removed R, which represents those who have been isolated from the infected. The traditional SIR model of Kermack et al. [6] is defined as follows:
where
To examine the spread of disease in human contact networks, the researchers presented several models that explain the underlying structure of the network [7]. Most infectious diseases are still studied using the well-documented SIR epidemic model, if not with the latency-based SEIR model, due to its simplicity and ease of access with many numerical schemes [8]. As a result, academics continue examining the SIR model using computational and theoretical tools with deterministic vs. stochastic aspects. Chronically, some epidemic diseases, such as tuberculosis, HIV, and fever, were numerically analyzed within the SIR framework in [9]. The theoretical analysis in [10] demonstrated, using an optimal control problem approach, that optimal vaccination policies are not unique, as studied using the extended SIR model. Also vaccination was proposed in [11] to eliminate infectious diseases, as was also mentioned in [10]. The SIR model was applied to vaccinated and reinfected after vaccination in order to represent the indirect and direct impacts of influenza vaccination within individuals exposed to the seasonal transmission of multiple influenza strains in [12], and it was observed that when the reproduction number is close to the endemic value, the indirect vaccination effects are stronger. References [13–15] provided an excellent overview of several fractional operators used in infectious disease. The consequences of vaccination on an epidemic with constant removal from the susceptible population were modeled in [16]. Reference [17] estimated the disease time history using both variational iteration and successive methods for a regular vaccination SIR epidemic model. The SEIR model was introduced in [18] to analyze and examine the evolution of COVID-19 in India using available data. Based on the SIR model, the simulation results in [19] indicated that timely identification and isolation of infected are more productive than those based on social distancing, which is an important premise in treating COVID-19. To understand the impact of network heterogeneity on epidemic propagation, Moreno et al. [20] suggested an epidemiological paradigm considering the network. By combining control mechanisms, Li et al. [21] investigated the effect of evolving small-world networks on epidemic transmission. Using a degree-based mean field technique, Pastor-Satorras et al. [22] elucidated the dynamics of epidemics in the complex network.
To illustrate how COVID-19 spread throughout Italy and the effects of emergency containment measures, Gatto et al. constructed a model. The authors took into account the mobility of people and used the spatial network of 107 Italian provinces. The author’s network is founded on the notion of community and incorporates both local and imported infections as a result of contacts within the neighborhood or linked to people’s mobility by considering the community-dependent force of infection. It is comparable to the movement of flux from one place to another, where the second place may be a community [23]. Until 1927, Hamer, Ross, and others have made a great effort to develop mathematical models of infectious diseases [24,25].
Several model assumptions are included below. A vulnerable person will join the infected group when they come into contact with an infected person. The interaction was recently applied as a product term
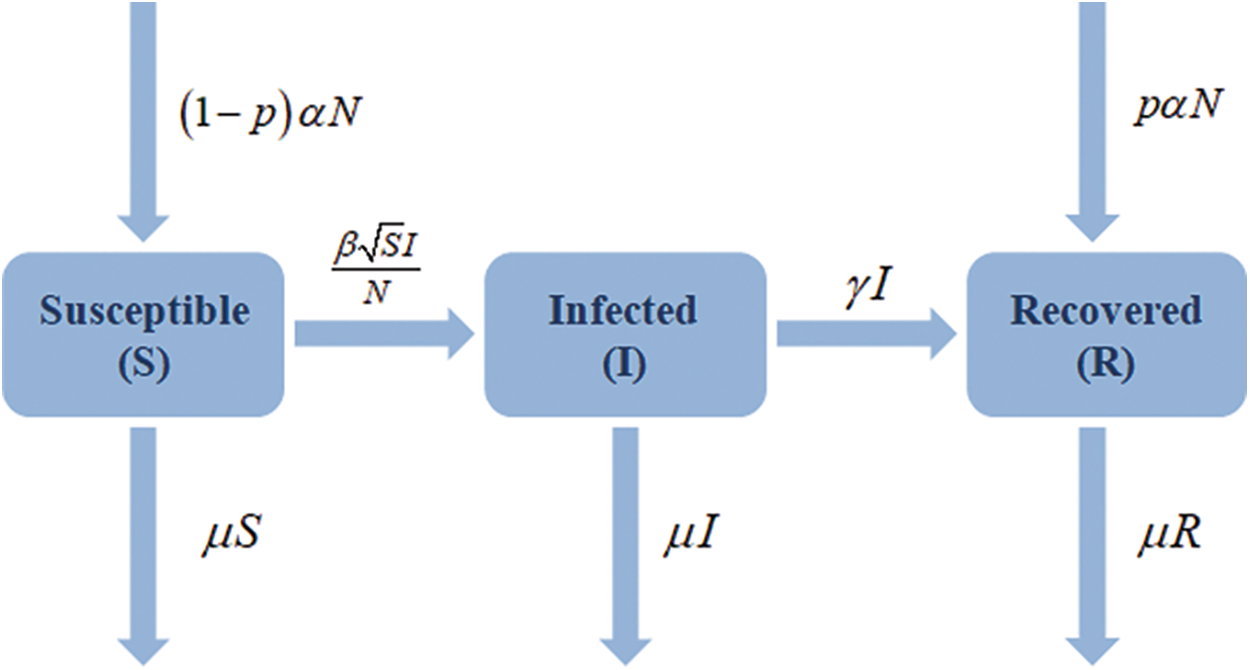
Figure 1: Flow chart of restricted SIR model with vaccination effect
The parameter
Liu et al. [27] and Mickens [30] have previously discussed square-root transition or interaction terms in the context of disease transmission models. The population of our SIR model is constant because
This new model focuses on two main concepts: first, it can present multiple waves of a given disease, and second, it analyzes how far an infection can be eradicated with the help of vaccination. The paper is structured as follows. Section 2 organizes the stability analysis of the equilibrium points for the suggested model, calculates the basic reproduction number, and establishes the positivity of the solutions. In Section 3, numerical simulations are performed to determine if it is multipeak and evaluate vaccination’s effects. In Section 4, the proposed model is compared to the literature already published, and the effectiveness of vaccination has been recorded. The consequences of vaccination are also discovered for a novel outstanding case of a disease. The conclusion is reached in Section 5, along with financial details.
2 Equilibrium Points and Stability Analysis
Consider the system (2)
The equilibrium point for a dynamic system is the value of the variables at which the variables do not vary over time. Derivatives in the mathematical model should be zero to identify the equilibrium points because they represent the change in the variables. Therefore, the equilibrium points are provided by solving the following set of equations:
implies
For disease free equilibrium points put
Hence
is the disease-free equilibrium point.
We can now solve the first two equations in (3) for the values of S and I for the epidemic equilibrium point, and then we can use I to find R. The only equilibrium for an epidemic is at
2.2 Stability at Equilibrium Points
We must calculate the eigenvalues of the Jacobian matrix related to the system (2) to evaluate the stability of the equilibrium points, at the locations of equilibrium evaluated. For the system of the type
the Jacobian matrix is defined as
From (2) it can be seen that
The disease-free equilibrium point described in (4) has the following Jacobian matrix:
with eigenvalues as
Again the Jacobian matrix associated with equilibrium point stated by (5) is
and eigenvalues are
Particularly for
Two cases are taken into account.
Case(I)
If
The system is asymptotically stable at equilibrium because there are two complex eigenvalues with negative real components or three negative eigenvalues.
Case(II)
If
thus the system will be asymptotically
and unstable on the opposite side.
2.3 Basic Reproduction Number and Positivity of the Solution
As we all know that mathematical modelling can help to accurately measure possible disease control schemes by putting emphasis on the crucial components of a disease, evaluating threshold quantities for disease survival, and evaluating the impact of specific control strategies. The basic reproduction number, usually denoted by
The positivity of the system will be proved by using the reference method stated in [32].
Theorem 2.1. (Positivity of Solutions) The Solutions
Proof.
Considering (2) and solving
3 Numerical Simulation Results and Discussions
On the Mathematica 12.0 software platform, numerical simulations are performed. The influence of vaccination has been observed, and multipeak has been recorded. From Fig. 2, the effects of vaccination on SIR variables are first shown in graphs 1a to 1d that possess an asymptotically stable equilibrium point as defined by (5) for
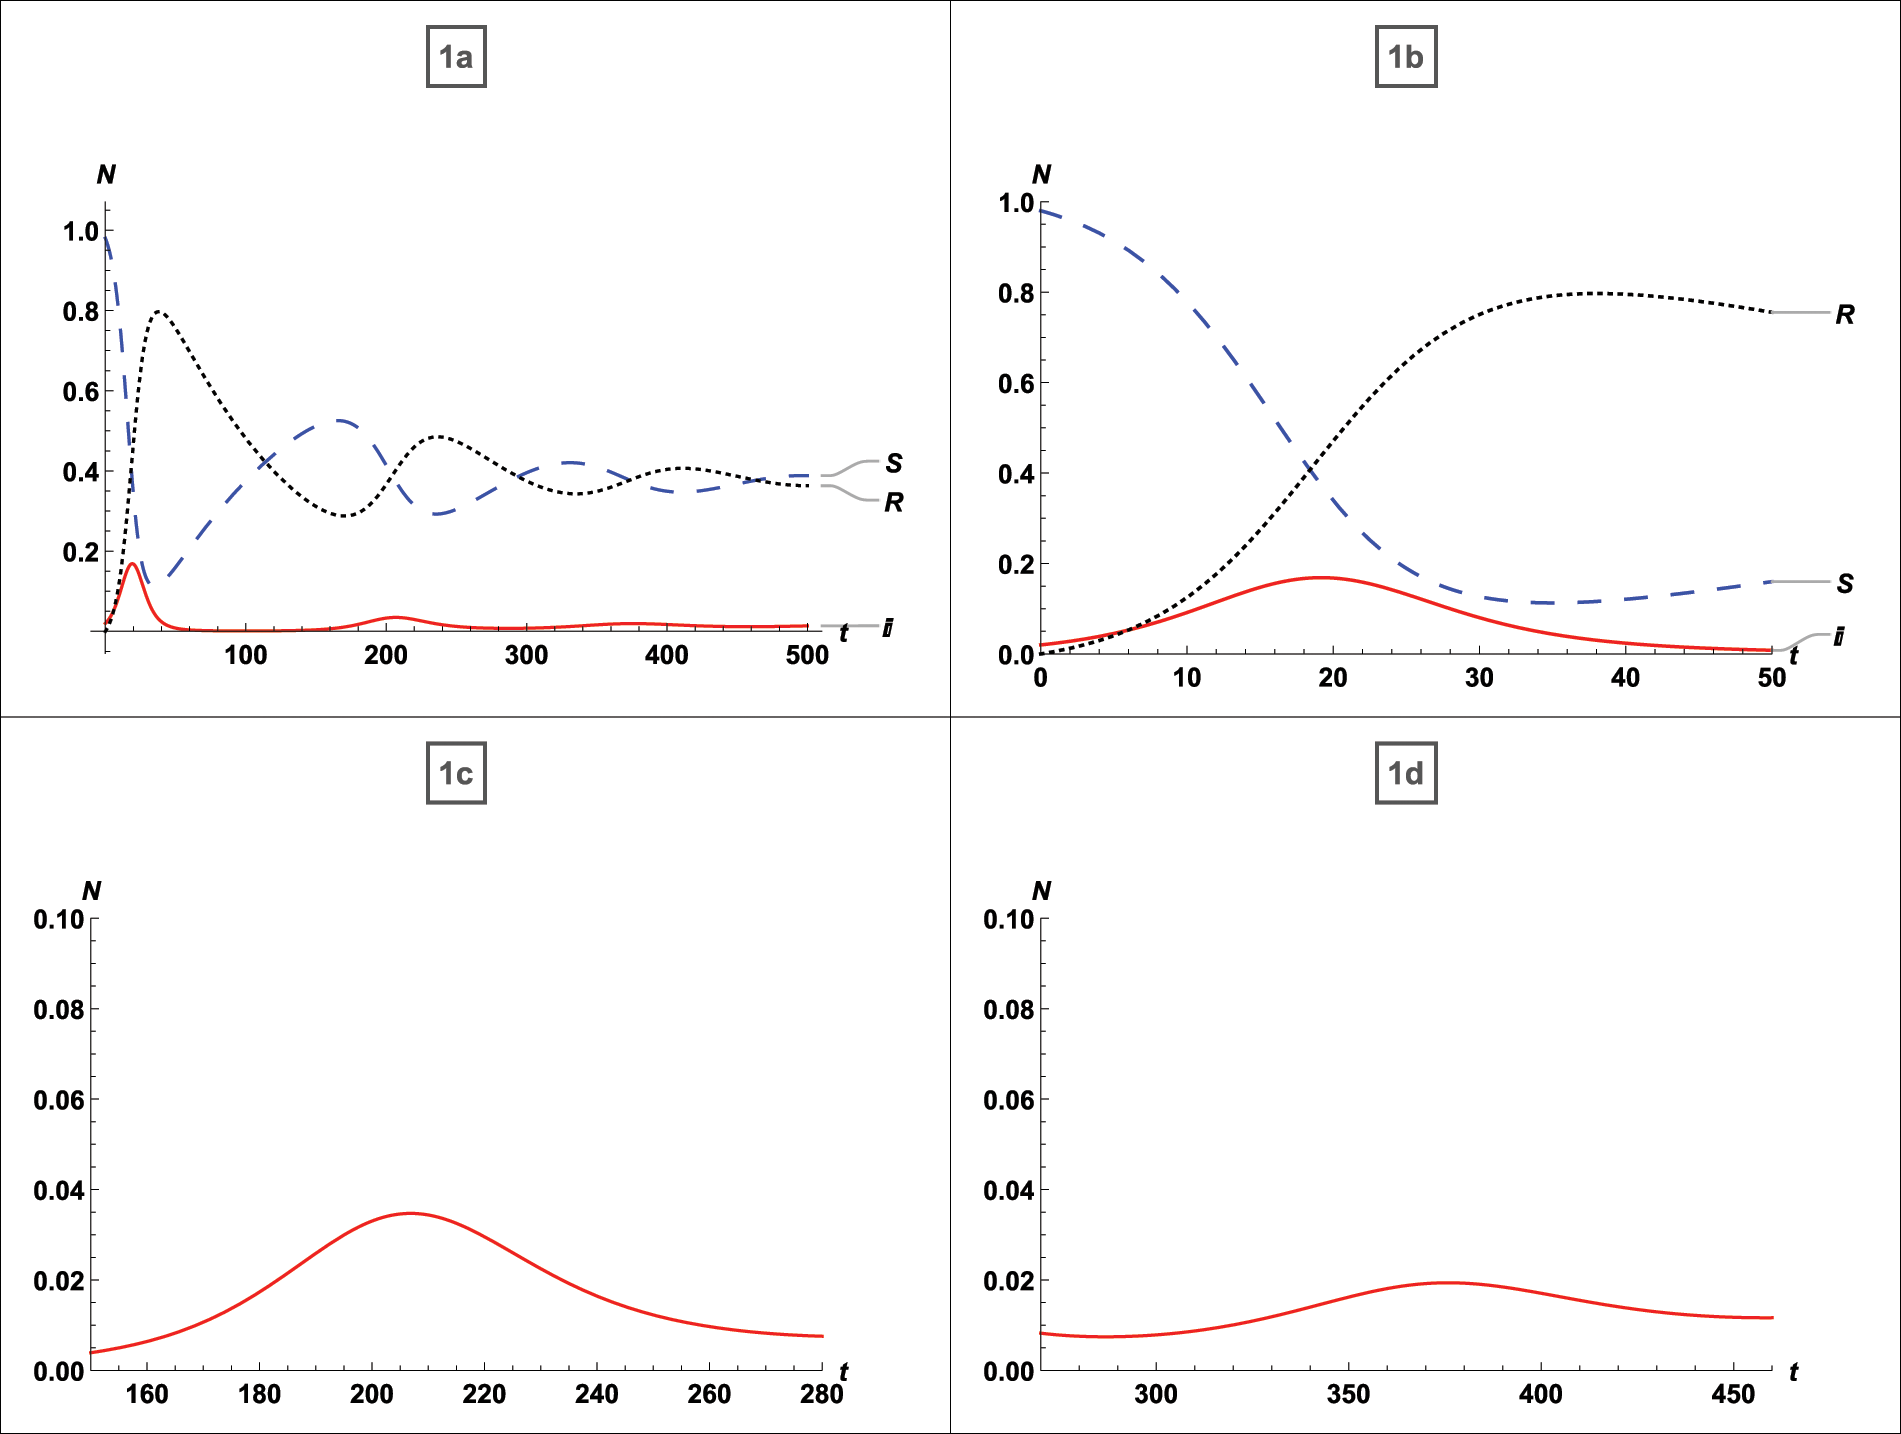
Figure 2: For
Additionally, it is evident that in the absence of vaccination, individuals who have recovered from infection relapse to susceptibility, and the density of susceptible and recovered individuals behaves incongruously, increasing and decreasing over time.
In Fig. 3 the effects on the density of the infected population have been studied while infection and recovery rates are constant and vaccination rates vary as follows:
• 35% population vaccinated
• 65% population vaccinated
• 90% population vaccinated
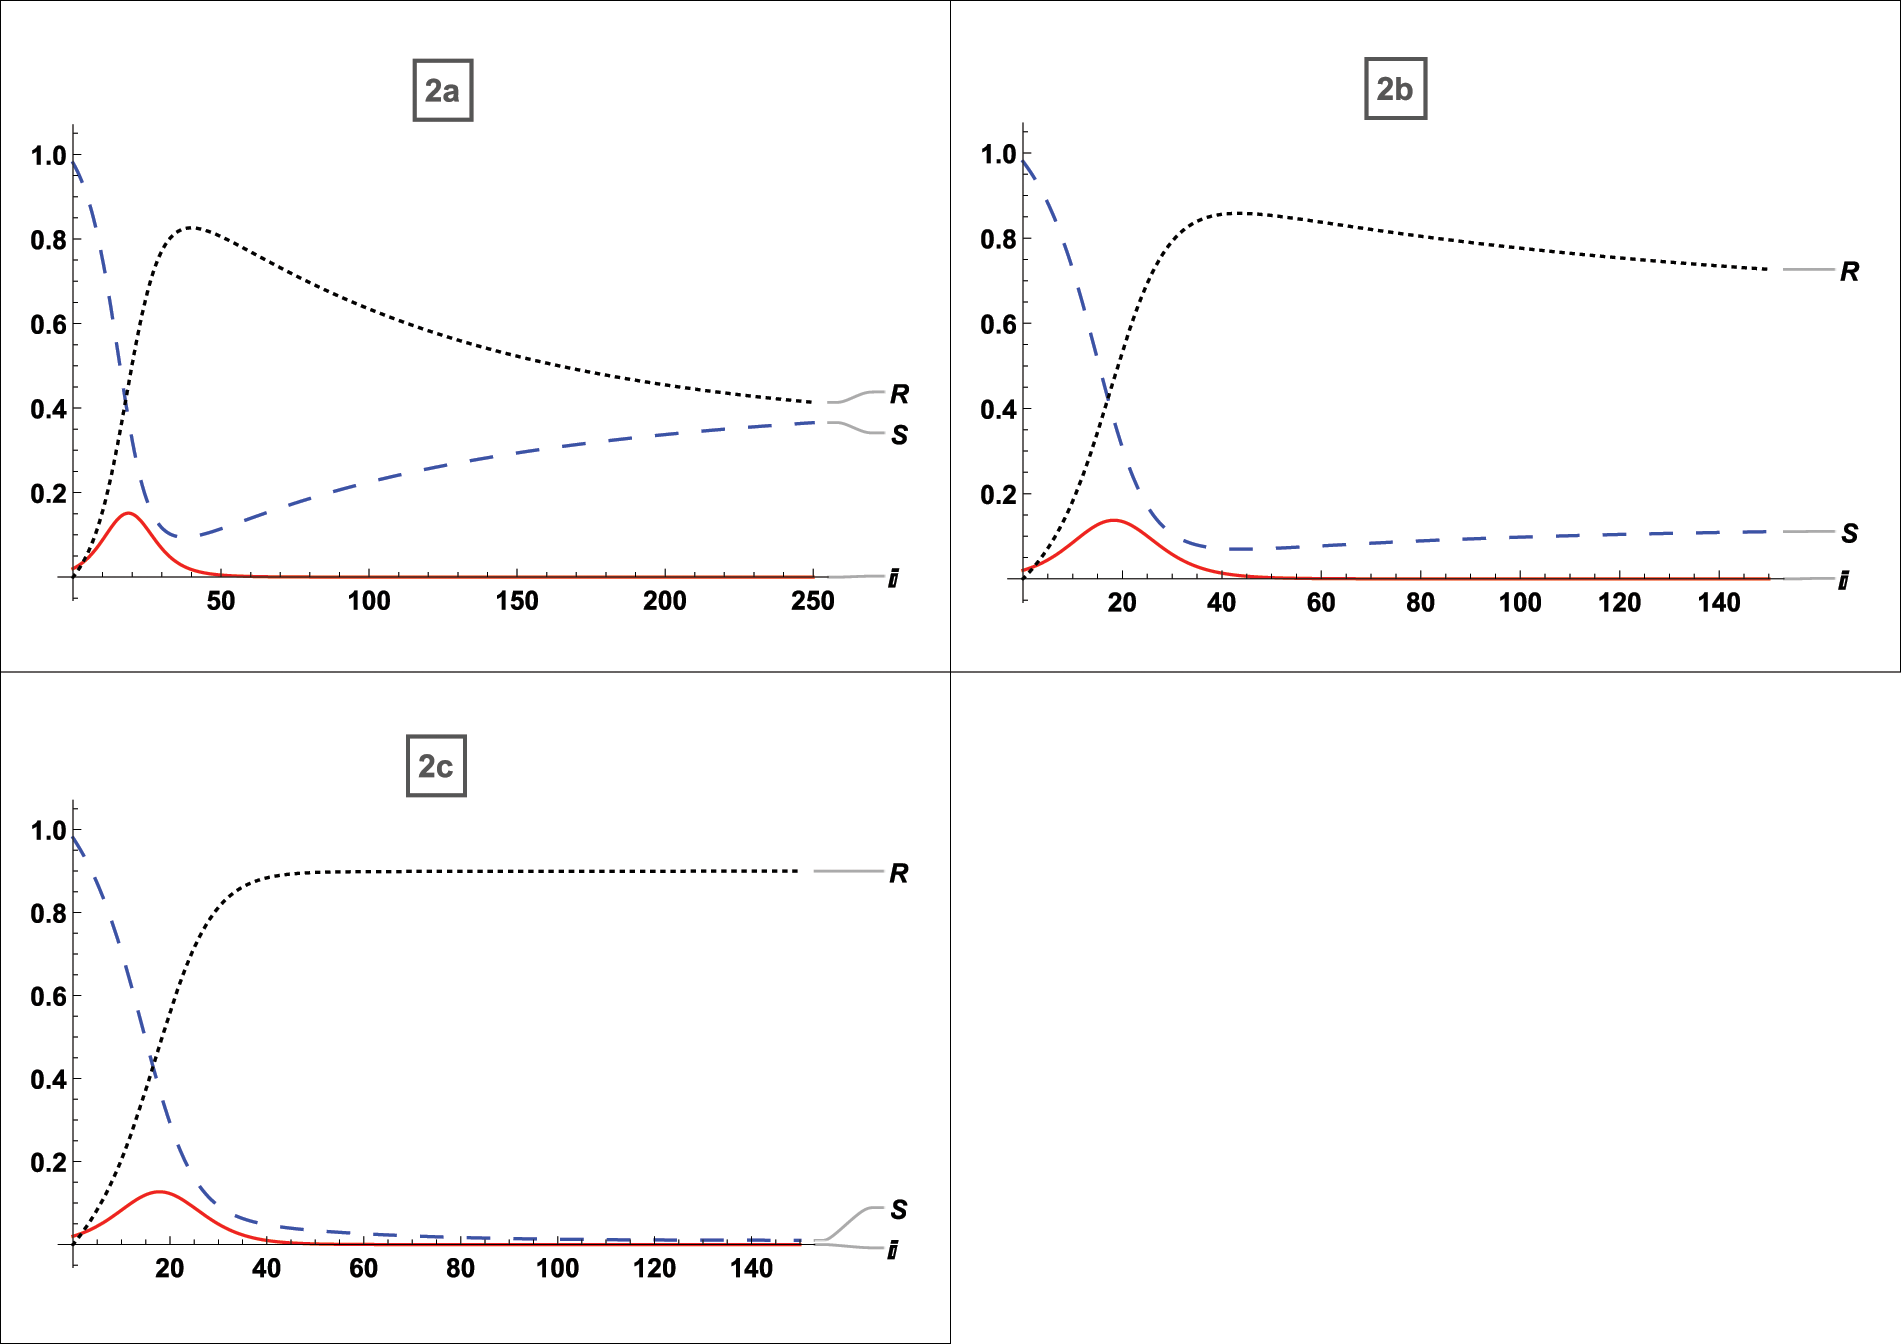
Figure 3: For
Fig. 2a refers to the asymptotically stable equilibrium point of type described by Eq. (5) and Figs. 2b and 2c uses the asymptotically stable equilibrium point of type stated in Eq. (4) as the reference point, all graphs demonstrate the effect of vaccination on SIR variables. The vaccination provides complete protection in this instance. The vaccination helps to reduce the number of infected persons over time; after an early rise with lower vaccination rates, the peak of infected substantially drops as more people are vaccinated, and the final peak time is also reduced. This vaccination behavior is consistent with the analytical findings in [33]. When vaccination is taken into account, it is seen that there will not be any multi-peaks, which is a significant benefit of immunization. Additionally, with 35% of the population vaccinated, the infected population drops from 18% to 15%, and with 60% to 90% of the population vaccinated, it falls from 18% to 90%. The time of infection is shortened from
We now examine how our approach performs when applied to some early literature and when the 80 percent vaccine is used. The goal is to foresee how vaccination-induced immunity reduction may change how the epidemiology of the population reacts.
By manipulating the typical parameters of a running epidemic, many significant inferences can be obtained from such a formula during an epidemic disease in real time; otherwise, complex computations from numerical simulations are needed. In particular, if the peak time calculation is needed as a subroutine in an iterative operation to estimate parameters, it will be called multiple times. Its numerical evaluation can become quite expensive. Therefore, the analytic substitution shown here can enable calculations to be performed more effectively. This section will look at how our approach performs when applied to some early published literature and when using the 80 percent vaccine. The goal is to predict how vaccination-induced immunity reduction will affect population epidemiology.
We compared our model to a large body of published and unpublished literature. The results of the comparison for the  published literature given in Table 1 are discussed below. In addition, we have given an example of a disease for which vaccination is ineffective. Fig. 4 depicts a graphical simulation with zero percent vaccination and eighty percent vaccination. The topic of stability, as well as the effect of vaccination, is discussed. We used the Jacobian matrix to examine stability at the equilibrium point for each graph and discussed the vaccine’s impact. It is clear from graphs 3a and 3b use the asymptotically stable equilibrium point of the type stated by Eq. (5) as the reference point and states that the disease peaks around t = 4 (where t stands for time; it might be a day, week, month, or year). Without a
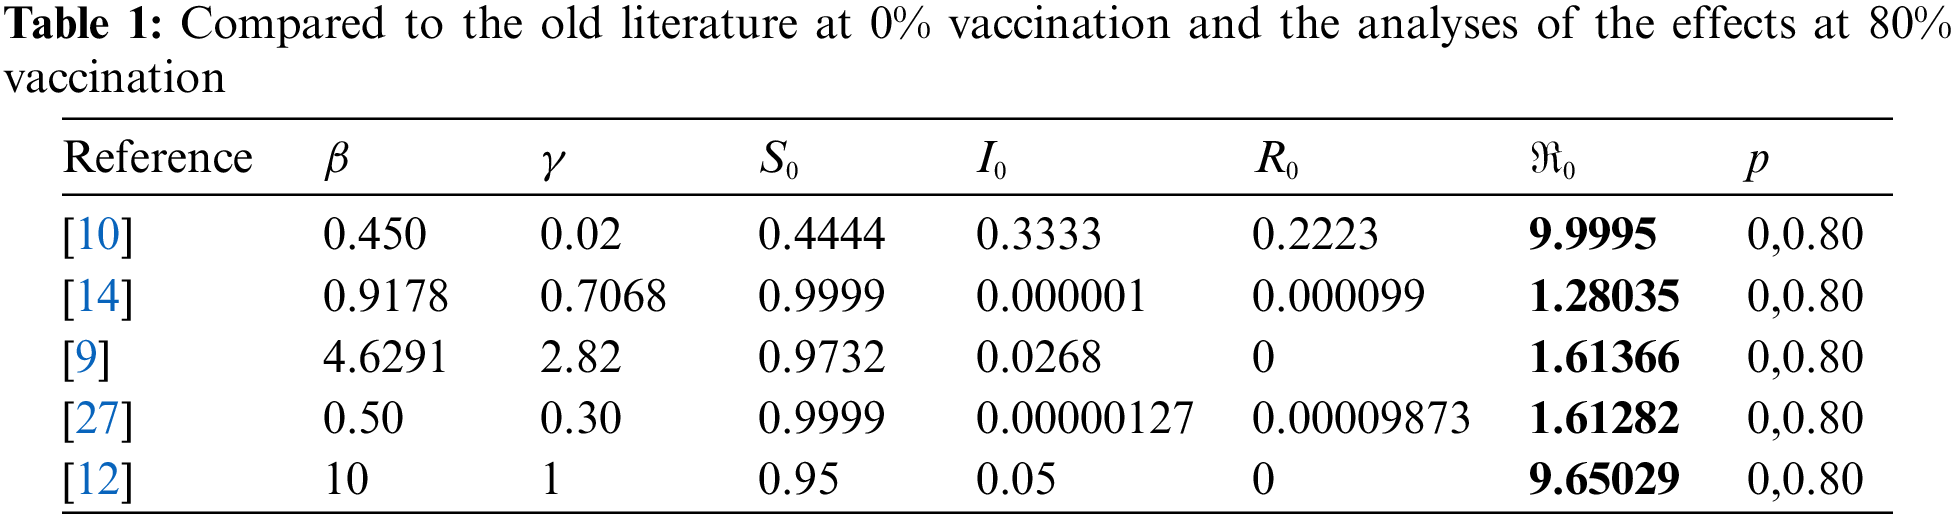
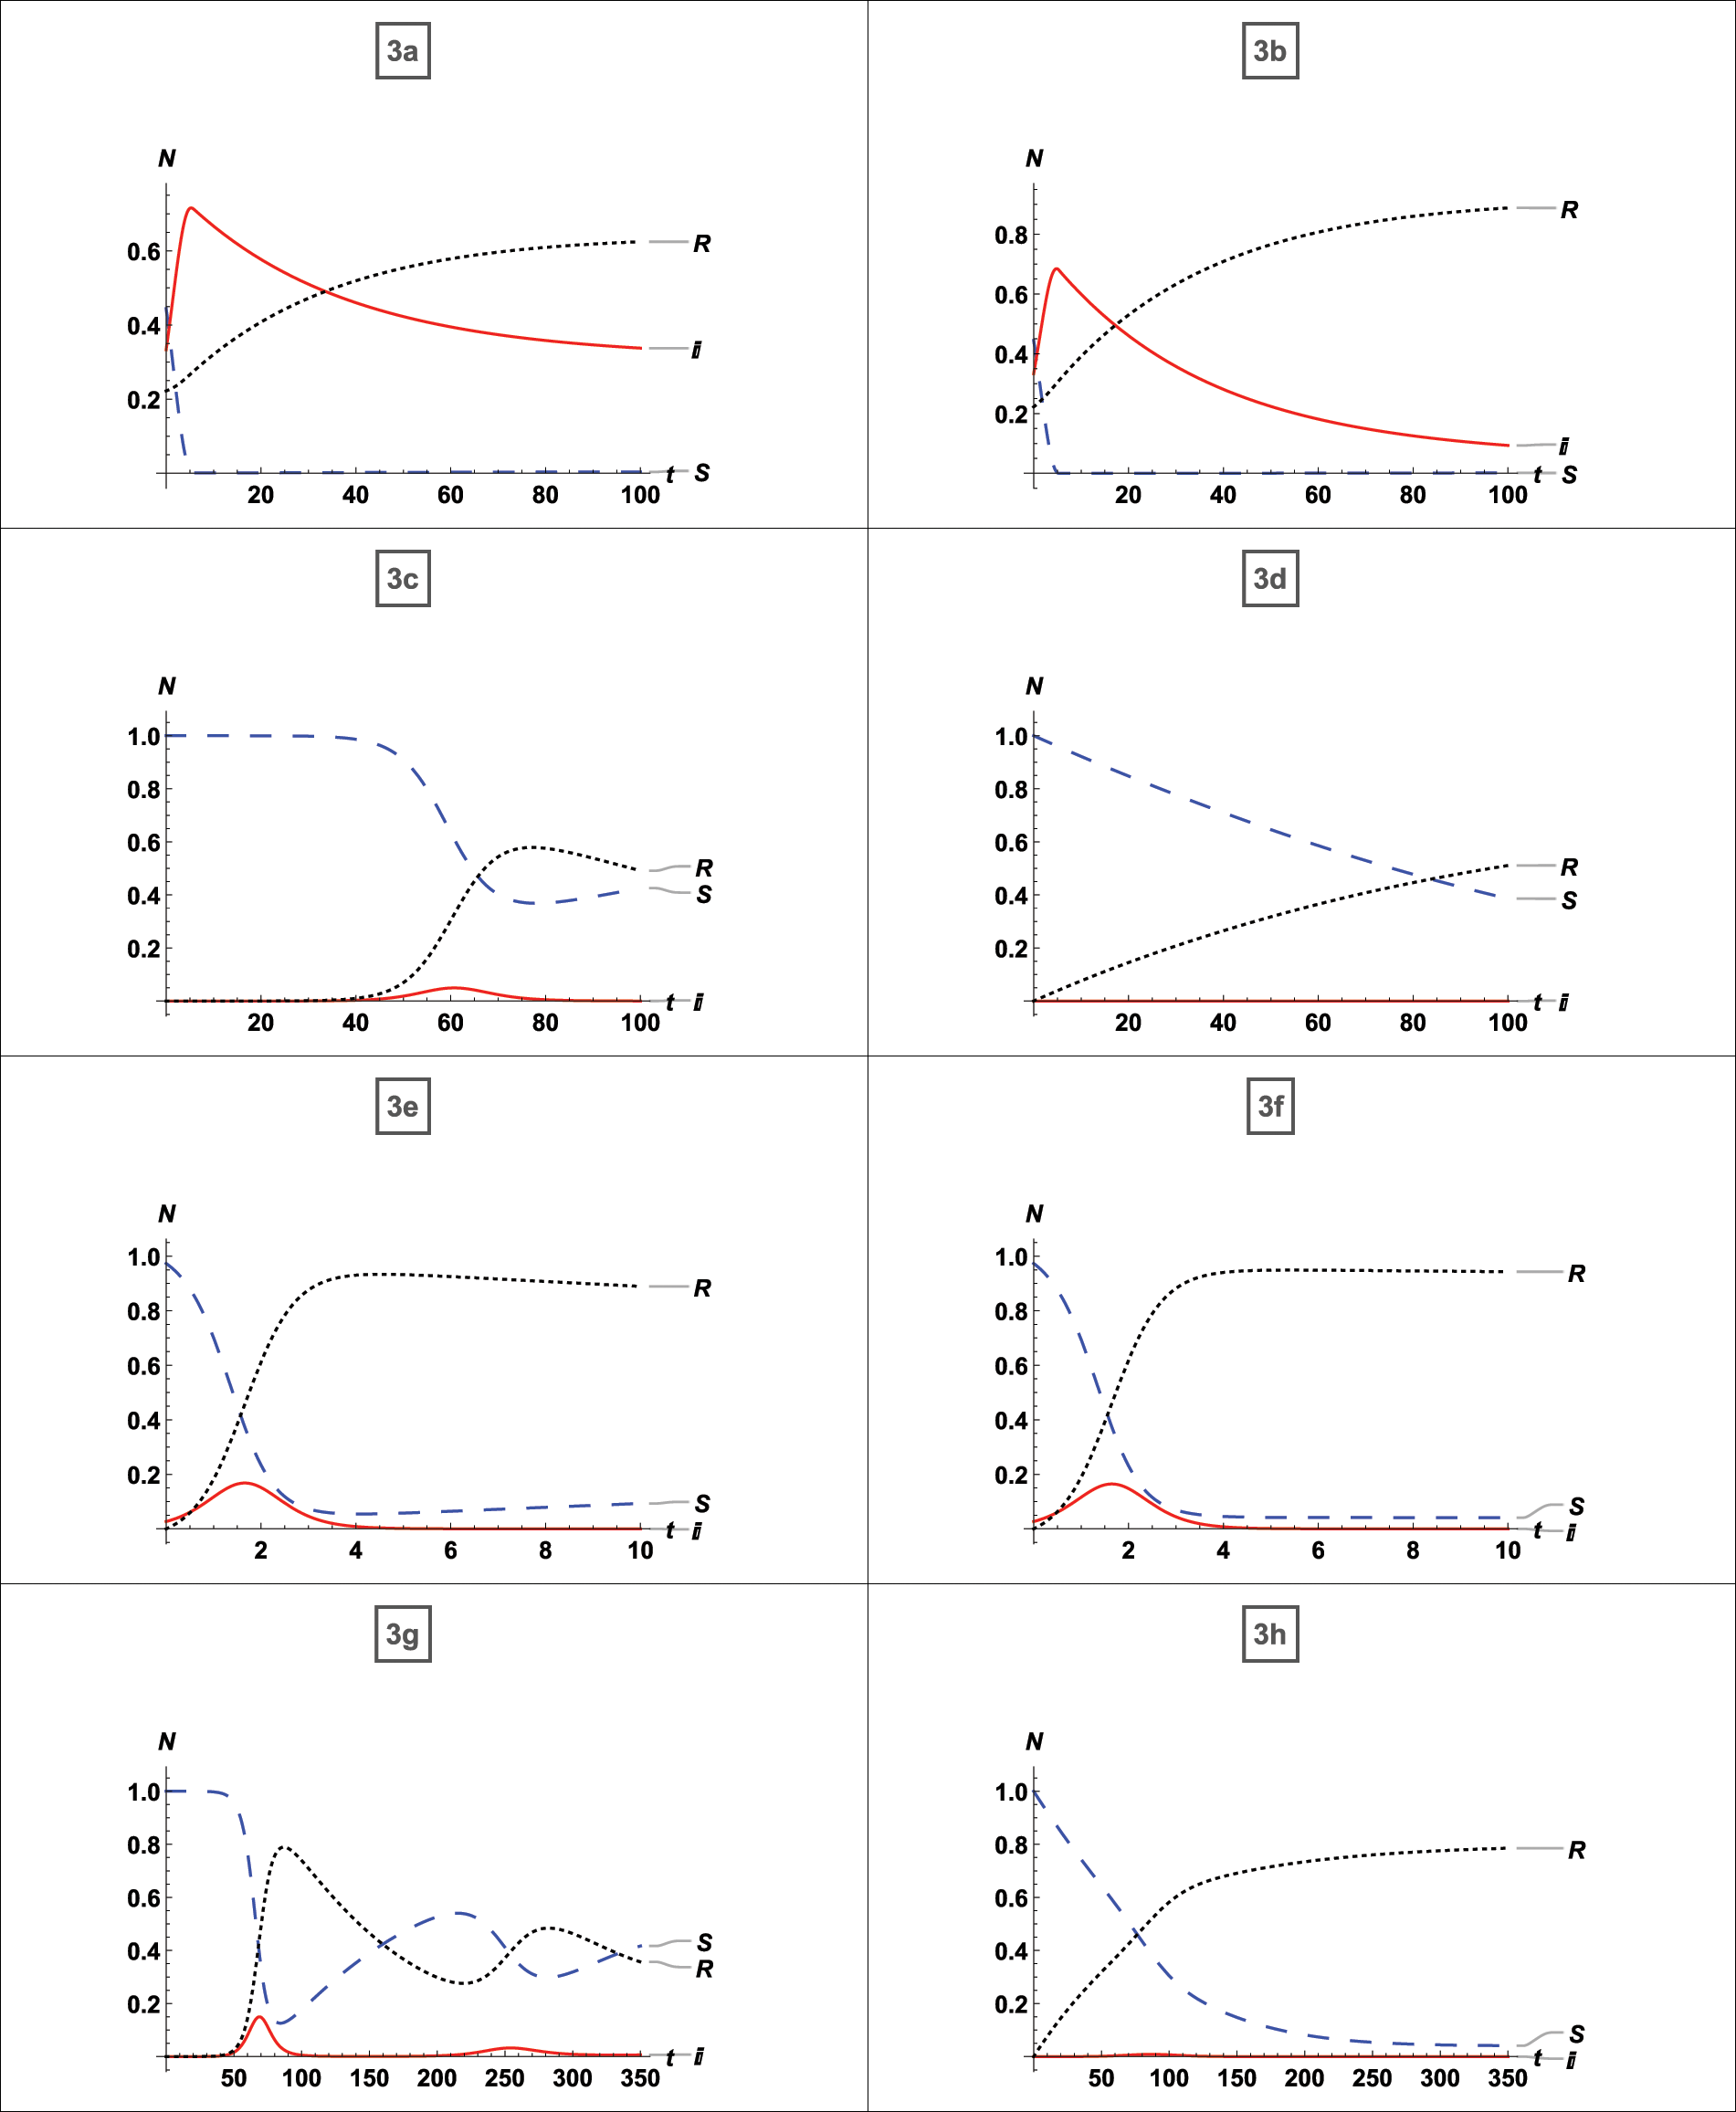
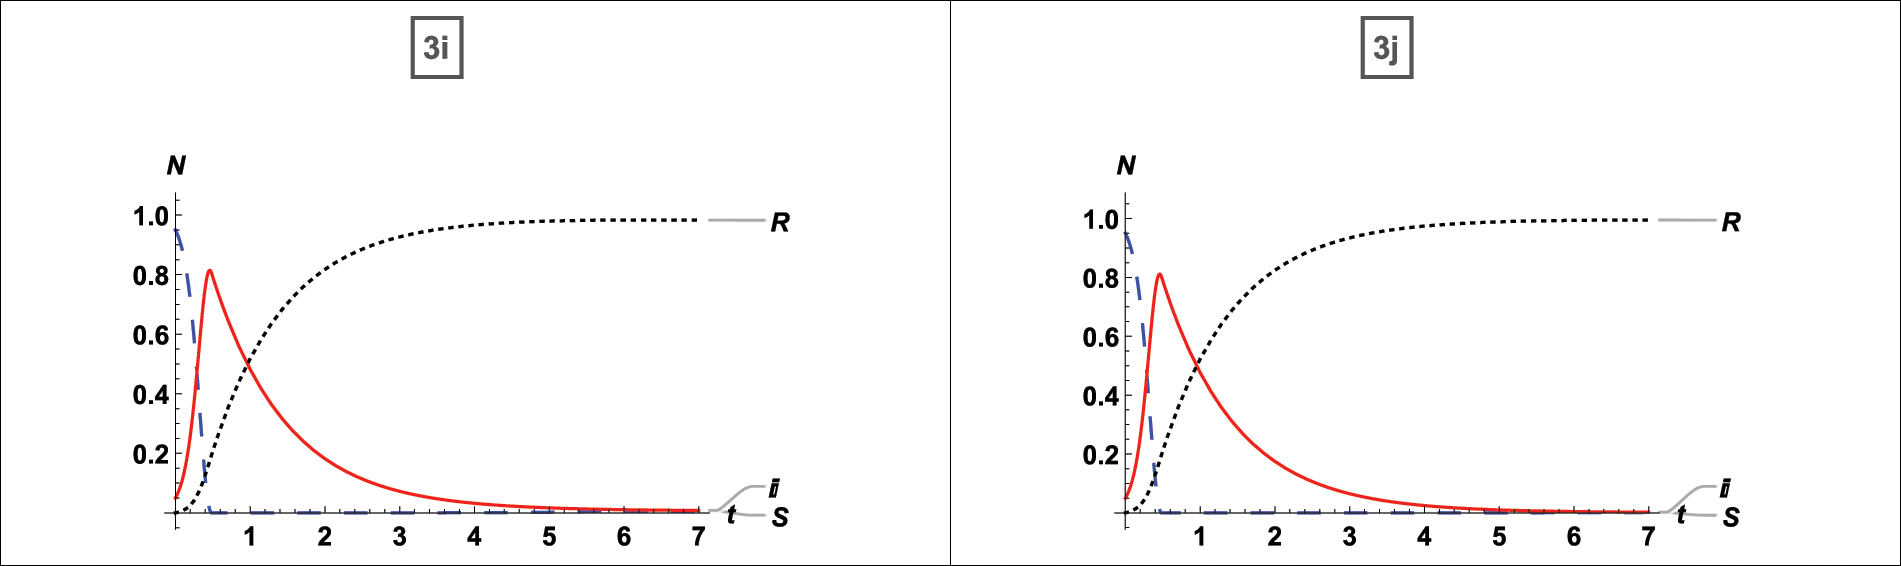
Figure 4: Comparison of the published literature with our model and analysis of the 80% vaccination
4.1 Influence of Vaccination on Endemic Infection
Here, we established the infection rate so that about 90% of the population contracted the disease. Then, we employed vaccination techniques to determine the results. Here, four different instances are considered, and numerical simulation is displayed in Fig. 5.
(i) No Vaccinations
(ii) 35% Vaccination
(iii) 65% Vaccination
(iv) 95% Vaccination
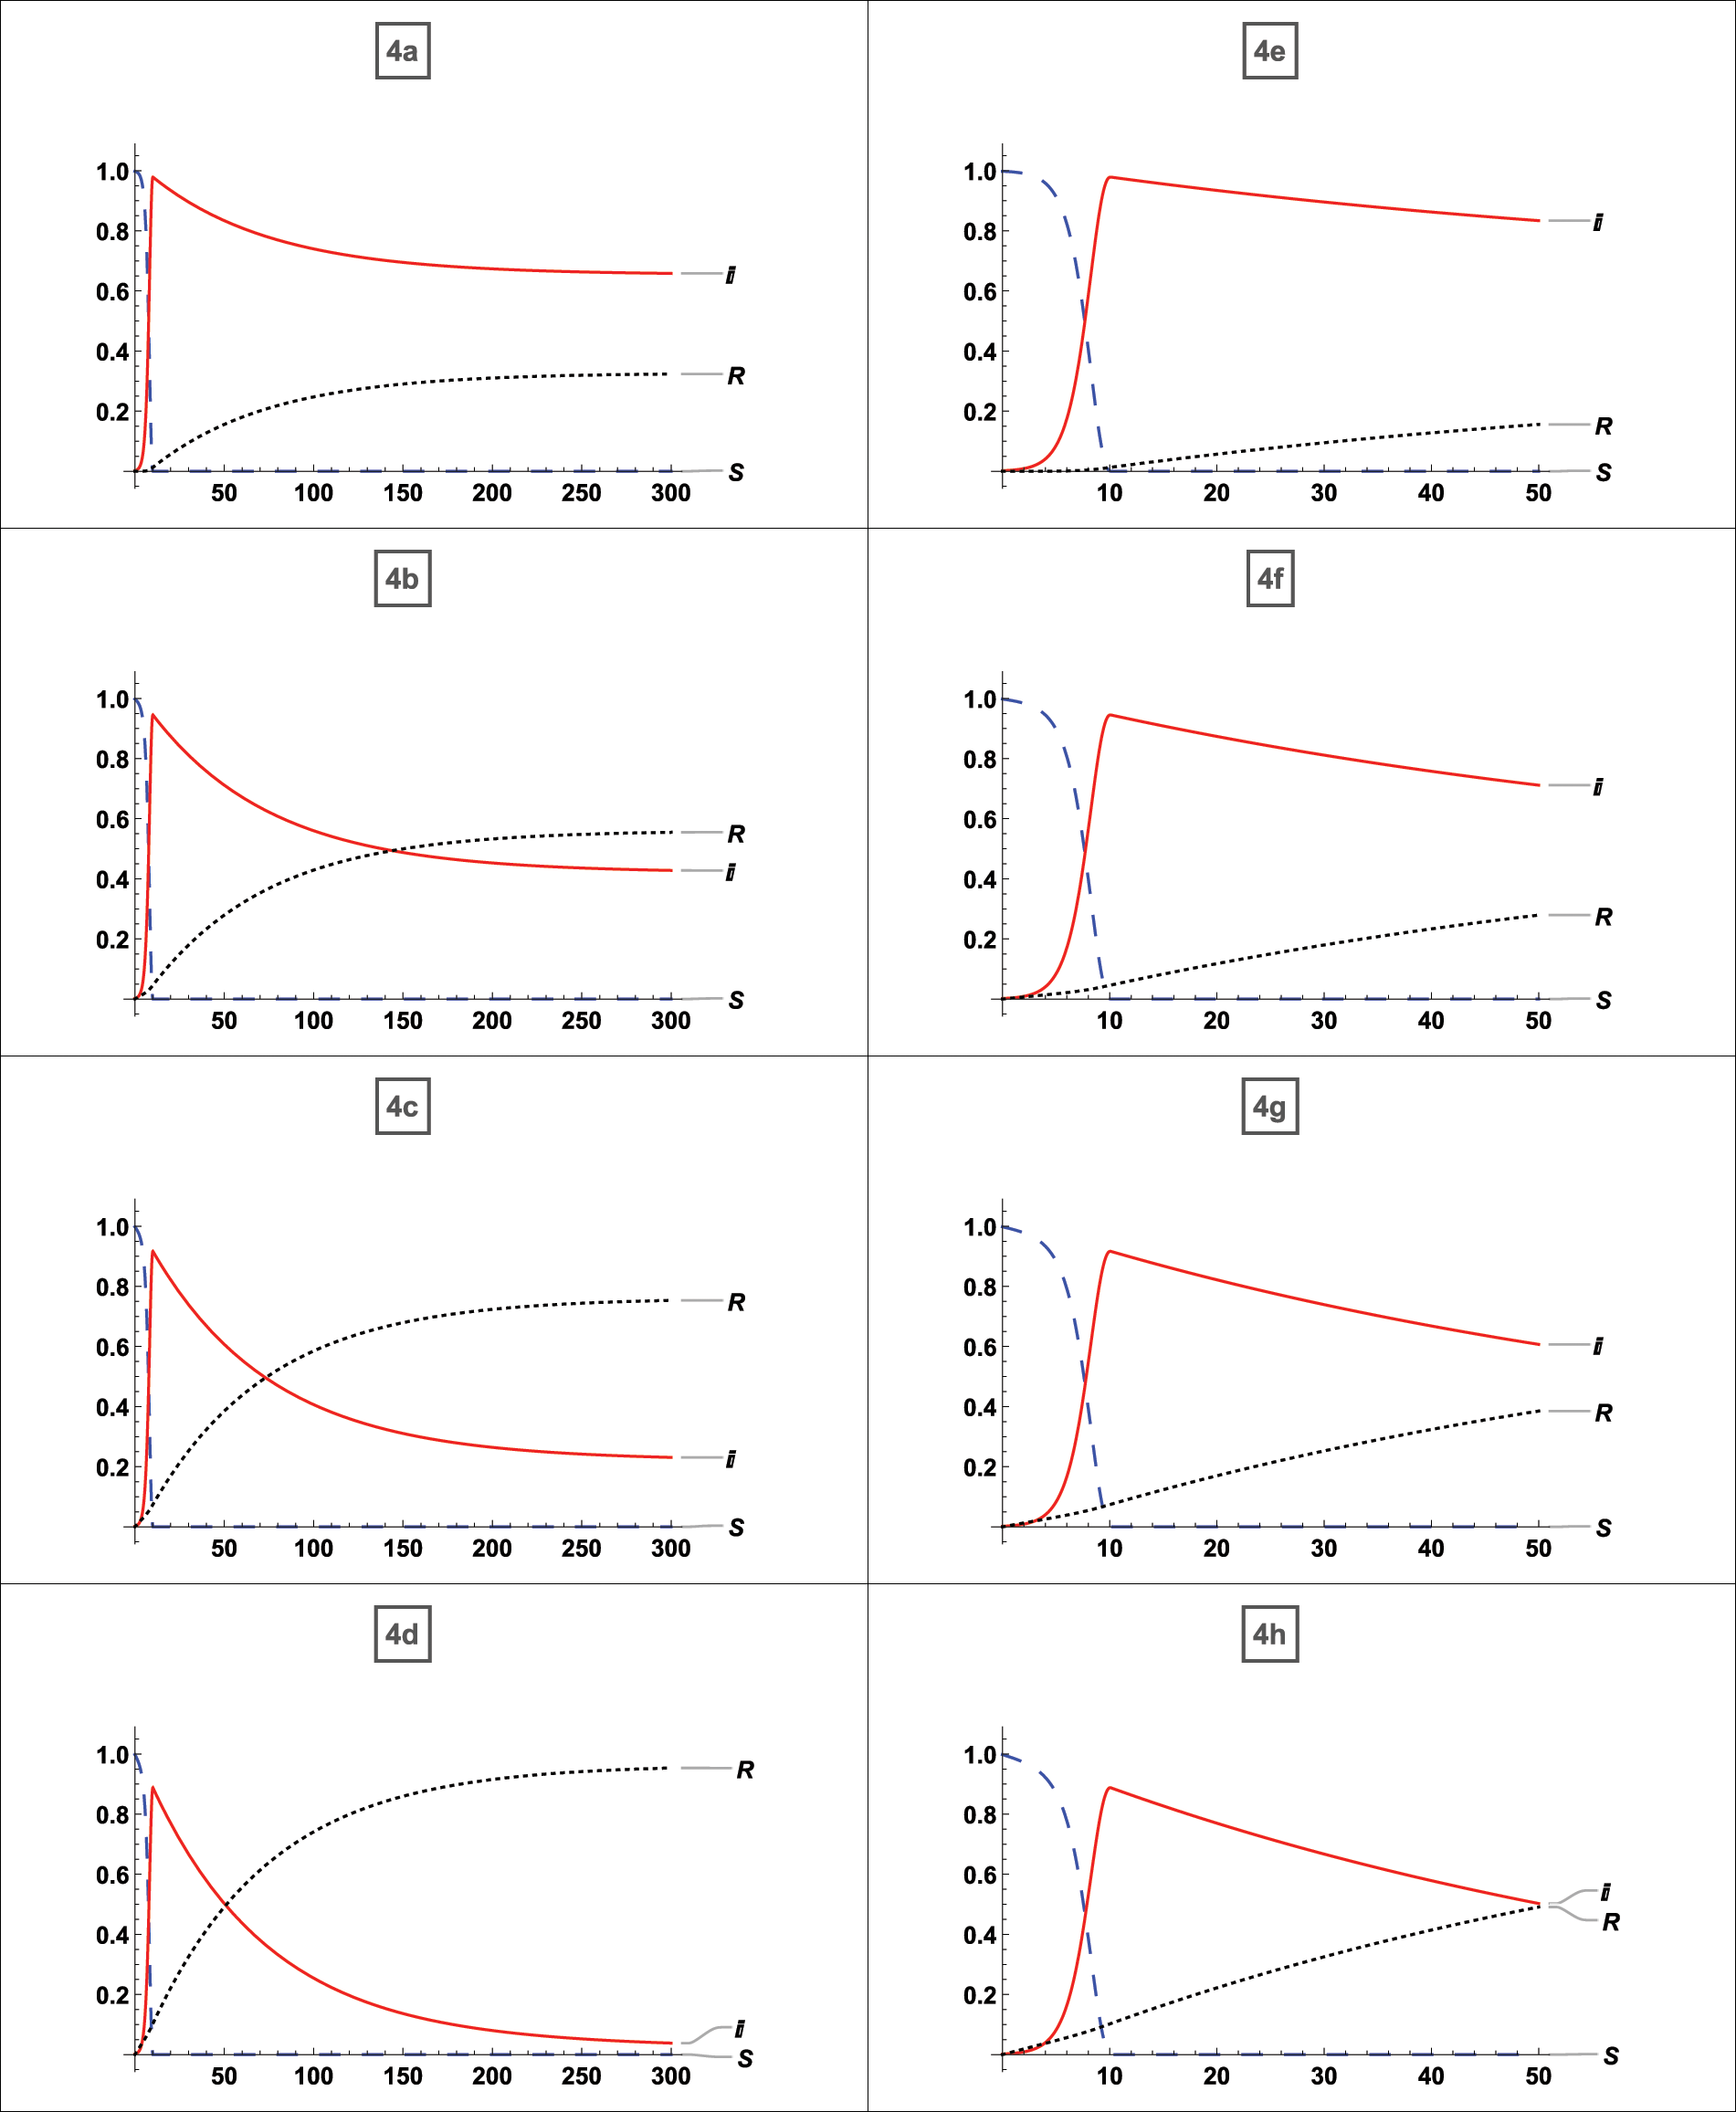
Figure 5: Effects of vaccination when 90% of the population is infected
First, whether the equilibrium point was stable for each case was determined, after which it was noted whether vaccination had any effects. And the effects of vaccination on a disease that has affected nearly the whole population have been determined. From Fig. 4a, which possesses a stable equilibrium point as defined by Eq. (5), it is clear that the disease expanded to up to 90% of the population without vaccination in the least amount of time and persisted for the entire time with 80% of the people infected. There is no doubt that 80% of the population will always be infected if no vaccination strategy is in place. According to graph 4b about the equilibrium-stable point of type (5), the virus can be reduced up to 50% of the population if just 35% of the population receives vaccinations. From Fig. 4c an equilibrium point with the asymptotically stable feature defined by (5), it can be seen that if up to 65% of persons receive vaccinations, the infection rate drops to 40%. From graph 4d possessing a stable equilibrium point as defined by (5), it is evident that the disease will be eradicated if 95% of the population receive the vaccination. According to Figs. 4e–4h, which are graph same as 4a–4d with restriction on
Applying for vaccination programs is one efficient way to manage and reduce the effects of a contagious infectious disease outbreak. On the other hand, the well-known pandemic SIR model is altered by vaccination, as recently applied in [33] using the SIRV model. The SIRV vaccination model described in [33] assumes complete immunity against infectious diseases. To accomplish the goal, the conventional SIR model is changed so that interactions between susceptible and infected compartments that result in new infection
Acknowledgement: The authors extend their appreciation to the Deanship of Scientific Research at Imam Mohammad Ibn Saud Islamic University (IMSIU) for funding and supporting this work through Research Partnership Program. Kuldeep Malik is also thankful to UGC for providing Junior Research Fellowship.
Funding Statement: Research Partnership Program no. RP-21-09-06 from the Deanship of Scientific Research of Imam Mohammad Ibn Saud Islamic University (IMSIU).
Author Contributions: Pranay Goswami led the study, interpreted the results, and organized the required literature. Kuldeep Malik wrote the manuscript, conducted all the numerical calculations, and made the graphs. K. S. Albalawi summarized the data for tables, created the study site map, and formatted the final document. All authors have read and agreed to the published version of the manuscript.
Conflicts of Interest: Researchers state that there are no disputes of interest to report regarding the presented article.
References
1. Tyrrell, D., Bynoe, M. (1965). Cultivation of a novel type of common-cold virus in organ cultures. British Medical Journal, 1(5448), 1467 [Google Scholar] [PubMed]
2. McIntosh, K., Dees, J. H., Becker, W. B., Kapikian, A. Z., Chanock, R. M. (1967). Recovery in tracheal organ cultures of novel viruses from patients with respiratory disease. Proceedings of the National Academy of Sciences of the United States of America, 57(4), 933–940 [Google Scholar] [PubMed]
3. Bradburne, A., Somerset, B. (1972). Coronavirus antibody titres in sera of healthy adults and experimentally infected volunteers. Epidemiology & Infection, 70(2), 235–244. [Google Scholar]
4. Myint, S., Siddell, S. (1995). The coronaviridae. In:Human coronavirus infections, pp. 389–401. Boston, MA: Springer. [Google Scholar]
5. Kapikian, A. Z., James Jr, H. D., Kelly, S. J., Dees, J. H., Turner, H. C. et al. (1969). Isolation from man of “avian infectious bronchitis virus-like” viruses (coronaviruses) similar to 229e virus, with some epidemiological observations. Journal of Infectious Diseases, 119(3), 282–290 [Google Scholar] [PubMed]
6. Kermack, W. O., McKendrick, A. G. (1927). A contribution to the mathematical theory of epidemics. Proceedings of the Royal Society A Mathematical Physical and Engineering Sciences, 115(772), 700–721. [Google Scholar]
7. Nekovee, M., Moreno, Y., Bianconi, G., Marsili, M. (2007). Theory of rumour spreading in complex social networks. Physica A: Statistical Mechanics and its Applications, 374(1), 457–470. [Google Scholar]
8. Heng, K., Althaus, C. L. (2020). The approximately universal shapes of epidemic curves in the susceptible-exposed-infectious-recovered (SEIR) model. Scientific Reports, 10(1), 19365 [Google Scholar] [PubMed]
9. Ergen, K., Çilli, A., Yahnıoğlu, N. (2015). Predicting epidemic diseases using mathematical modelling of SIR. Acta Physica Polonica A, 128(2B), B-273–B-276. [Google Scholar]
10. Laguzet, L., Turinici, G. (2015). Global optimal vaccination in the SIR model: Properties of the value function and application to cost-effectiveness analysis. Mathematical Biosciences, 263(6), 180–197 [Google Scholar] [PubMed]
11. Zhou, A., Sattayatham, P., Jiao, J. (2016). Dynamics of an SIR epidemic model with stage structure and pulse vaccination. Advances in Difference Equations, 2016, 1–17. [Google Scholar]
12. Eichner, M., Schwehm, M., Eichner, L., Gerlier, L. (2017). Direct and indirect effects of influenza vaccination. BMC Infectious Diseases, 17, 1–8. [Google Scholar]
13. Belmor, S., Ravichandran, C., Jarad, F. (2020). Nonlinear generalized fractional differential equations with generalized fractional integral conditions. Journal of Taibah University for Science, 14(1), 114–123. [Google Scholar]
14. Nisar, K. S., Logeswari, K., Vijayaraj, V., Baskonus, H. M., Ravichandran, C. (2022). Fractional order modeling the gemini virus in capsicum annuum with optimal control. Fractal and Fractional, 6(2), 61. [Google Scholar]
15. Veeresha, P., Ilhan, E., Baskonus, H. M. (2021). Fractional approach for analysis of the model describing wind-influenced projectile motion. Physica Scripta, 96(7), 075209. [Google Scholar]
16. Badoual, M., Grammaticos, B., Nakamura, G. (2021). Vaccination strategies for a seasonal epidemic: A simple SIR model. Open Communications in Nonlinear Mathematical Physics, 1, 20–40; [Google Scholar]
17. Mungkasi, S. (2021). Variational iteration and successive approximation methods for a SIR epidemic model with constant vaccination strategy. Applied Mathematical Modelling, 90, 1–10. [Google Scholar]
18. Safare, K. M., Betageri, V. S., Prakasha, D. G., Veeresha, P., Kumar, S. (2021). A mathematical analysis of ongoing outbreak COVID-19 in India through nonsingular derivative. Numerical Methods for Partial Differential Equations, 37(2), 1282–1298. [Google Scholar]
19. Cadoni, M. (2020). How to reduce epidemic peaks keeping under control the time-span of the epidemic. Chaos, Solitons & Fractals, 138, 109940. [Google Scholar]
20. Moreno, Y., Pastor Satorras, R., Vespignani, A. (2002). Epidemic outbreaks in complex heterogeneous networks. The European Physical Journal B–Condensed Matter and Complex Systems, 26(4), 521–529. [Google Scholar]
21. Li, X., Wang, X. (2006). Controlling the spreading in small-world evolving networks: Stability, oscillation, and topology. IEEE Transactions on Automatic Control, 51(3), 534–540. [Google Scholar]
22. Pastor-Satorras, R., Castellano, C., van Mieghem, P., Vespignani, A. (2015). Epidemic processes in complex networks. Reviews of Modern Physics, 87(3), 925. [Google Scholar]
23. Gatto, M., Bertuzzo, E., Mari, L., Miccoli, S., Carraro, L. et al. (2020). Spread and dynamics of the COVID-19 epidemic in Italy: Effects of emergency containment measures. Proceedings of the National Academy of Sciences of the United States of America, 117(19), 10484–10491 [Google Scholar] [PubMed]
24. Brauer, F. (2017). Mathematical epidemiology: Past, present, and future. Infectious Disease Modelling, 2(2), 113–127 [Google Scholar] [PubMed]
25. Hammer, W. (1906). Epidemic disease in England-the evidence of variability and the persistence of type. The Lancet, II, 733–739. [Google Scholar]
26. Turkyilmazoglu, M. (2022). A restricted epidemic SIR model with elementary solutions. Physica A: Statistical Mechanics and its Applications, 600, 127570. [Google Scholar]
27. Liu, W. M, Levin, S. A., Iwasa, Y. (1986). Influence of nonlinear incidence rates upon the behavior of SIRS epidemiological models. Journal of Mathematical Biology, 23(2), 187–204 [Google Scholar] [PubMed]
28. Mickens, R. E. (2012). An exactly solvable model for the spread of disease. The College Mathematics Journal, 43(2), 114–121. [Google Scholar]
29. Zeb, A., Zaman, G., Momani, S. (2013). Square-root dynamics of a giving up smoking model. Applied Mathematical Modelling, 37(7), 5326–5334. [Google Scholar]
30. Mickens, R. E. (2010). A SIR-model with square-root dynamics: An NSFD scheme. Journal of Difference Equations and Applications, 16(2–3), 209–216. [Google Scholar]
31. van den Driessche, P. (2017). Reproduction numbers of infectious disease models. Infectious Disease Modelling, 2(3), 288–303 [Google Scholar] [PubMed]
32. Alkahtani, B. S. T., Alzaid, S. S. (2021). A theoretical analysis of a SEAIJR model of Spanish flu with fractional derivative. Results in Physics, 26(12), 104236. [Google Scholar]
33. Schlickeiser, R., Kröger, M. (2021). Analytical modeling of the temporal evolution of epidemics outbreaks accounting for vaccinations. Physics, 3(2), 386–426. [Google Scholar]
Cite This Article
 Copyright © 2023 The Author(s). Published by Tech Science Press.
This work is licensed under a Creative Commons Attribution 4.0 International License , which permits unrestricted use, distribution, and reproduction in any medium, provided the original work is properly cited.
 Downloads
 Citation Tools