
 Submit a Paper
 Propose a Special lssue
 Open Access
ARTICLE

Sparsity-Enhanced Model-Based Method for Intelligent Fault Detection of Mechanical Transmission Chain in Electrical Vehicle
1
School of Aerospace Science and Technology, Xidian University, Xi’an, 710071, China
2
Guangzhou Institute of Technology, Xidian University, Guangzhou, 510555, China
3
Research Center for Applied Mechanics, Key Laboratory of Ministry of Education for Electronic Equipment Structure Design,
Xidian University, Xi’an, 710071, China
* Corresponding Author: Wangpeng He. Email:
(This article belongs to the Special Issue: AI and Machine Learning Modeling in Civil and Building Engineering)
Computer Modeling in Engineering & Sciences 2023, 137(3), 2495-2511. https://doi.org/10.32604/cmes.2023.027896
Received 20 November 2022; Accepted 23 March 2023; Issue published 03 August 2023
 View Full Text
 Download PDF
Abstract
In today’s world, smart electric vehicles are deeply integrated with smart energy, smart transportation and smart cities. In electric vehicles (EVs), owing to the harsh working conditions, mechanical parts are prone to fatigue damages, which endanger the driving safety of EVs. The practice has proved that the identification of periodic impact characteristics (PICs) can effectively indicate mechanical faults. This paper proposes a novel model-based approach for intelligent fault diagnosis of mechanical transmission train in EVs. The essential idea of this approach lies in the fusion of statistical information and model information from a dynamic process. In the algorithm, a novel fractal wavelet decomposition (FWD) is used to investigate the time-frequency representation of the input signal. Based on the sparsity of the PIC model in the Hilbert envelope spectrum, a method for evaluating PIC energy ratio (PICER) is defined based on an over-complete Fourier dictionary. A compound indicator considering kurtosis and PICER of dynamic signal is designed. Using this index, evaluations of the impulsiveness of the cycle-stationary process can be enabled, thus avoiding serious interference from the sporadic impact during measurements. The robustness of the proposed approach to noise is demonstrated via numerical simulations, and an engineering application is employed to validate its effectiveness.Keywords
In recent years, the rapid development of artificial intelligence and advanced signal processing technologies have attracted substantial attention in smart cities, which facilitate related fields from traditional ways to intelligent applications. Electrical vehicles (EVs) are of great importance to global environmental protection because of their zero exhaust emissions [1–3]. Compared with fuel vehicles, the mechanical transmission structure of electric vehicles has changed significantly [4,5]. Because of the use of a motor drive, EVs no longer use complex gearbox. However, gears, bearings and other mechanical components are retained [6]. These parts are still working under harsh conditions, and their condition monitoring is still important to guarantee the safe operation of EVs. Fortunately, in EVs, the arrangement of sensors is more convenient, which makes the acquisition of monitoring information more extensive [7–10]. On the other hand, the computing and processing capabilities of EVs are also increasing, which provides a good basis for the deployment of maintenance measures based on monitoring information [11,12].
Vibration monitoring is an important mean to prevent mechanical downtime [13–15], but how to obtain the weak fault information from the original monitoring data has been a major challenge in the scientific community [16,17]. In terms of kinematics, the damage to mechanical components corresponds to the periodic impact characteristics (PICs) in the vibration signal [18,19]. A large number of studies have shown that the multi-source vibration and random noise in the vehicle have caused great difficulties in PIC extraction. In order to identify faults at a low signal-to-noise ratio (SNR), many signal processing methods were proposed [20].
At present, scholars are working in two directions. One is the new signal decomposition method, the other is the intelligent identification method of fault characteristics. In terms of signal decomposition, wavelet transform [21–23], EMD [24–26], sparse representation [27–30], and their latest variants have been used to extract key features from noisy observations [31–33]. In order to reduce the dependence of diagnosis results on the experience of supervisors, many feature evaluation indexes have been invented, which are mainly used to correctly identify the components related to mechanical faults from the decomposition results [34]. A typical example of these indexes is spectral kurtosis [35,36]. Although new indicators emerge in an endless stream, the common shortcoming is that they rely too much on the statistical characteristics of the signal itself and ignore the model information behind it. For example, when the monitoring signal is accompanied by strong sporadic impulses, even if artificial intelligence [37–39] based methods are used, the correct feature extraction results cannot be guaranteed in many engineering scenarios.
In this paper, a novel model-based approach, enhanced by sparse representation, is proposed for mechanical fault diagnosis in EV. In the signal decomposition, the fractal wavelet representation is used, which is an efficient signal decomposition tool with centralized multi-resolution ability. In feature recognition and selection, the complex harmonic characteristics of PICs in the wavelet envelope domain are used, and a sparse representation enhancement method based on an over-complete Fourier dictionary (OFD) is proposed. The method realizes the quantitative evaluation of the proportion of PICs in the signal. Through the above measures, the robustness of the proposed method to multi-component coupling signal and noise is greatly enhanced. The superiority and effectiveness of the proposed method are verified by numerical simulation and engineering experiments.
2 Centralized Multi-Resolution Analysis
Wavelet transform is an effective tool for the multi-scale decomposition of signals. However, the center frequency of each subspace of the classical wavelet transform is different. In this section, a novel fractal wavelet decomposition (FWD), based on a dual tree wavelet basis [40], is introduced. FWD, an enhancement of wavelet packet transform, is a wavelet decomposition method with spectral focusing capability. FWD can realize multi-resolution analysis around some fixed center frequencies. For the convenience of discussion,
Translation sensitivity is a significant defect of classical discrete wavelet decomposition, which often results in false features in the decomposition results. Maximal overlap decomposition strategy can avoid this defect, but the computational efficiency is significantly reduced. Dual tree wavelet transform (DTWT), proposed by Kingsbury, achieves a good trade off between accuracy and efficiency and the merit of translation invariance (TI) is realized. The wavelet of DTWT is a complex-valued function, as follows.
where j is the imaginary number, defined as
2.2 Motor Fault Diagnosis Methods Based on Current Signal
Although DTWT can alleviate the distortion of TV to the extracted features, it cannot solve the problem of transition band feature extraction in dyadic wavelet subspace. To address this problem, centralized multiresolution (CMR) is proposed by Chen [33]. The essential idea of CMR is the construction of an implicit wavelet packet (IWP). Let
IWPs can be generated using
A

2.3 Fractal Wavelet Decomposition
As shown in Eq. (4), the wavelet generators of IWP are constructed based on those of WPs. Therefore, the property of TI can be preserved. The distribution of IWPs as the scale of analysis deepens is shown in Fig. 1. There are IWP sets in which the IWPs share an identical CF and their spectral resolutions are constantly refined. For example,
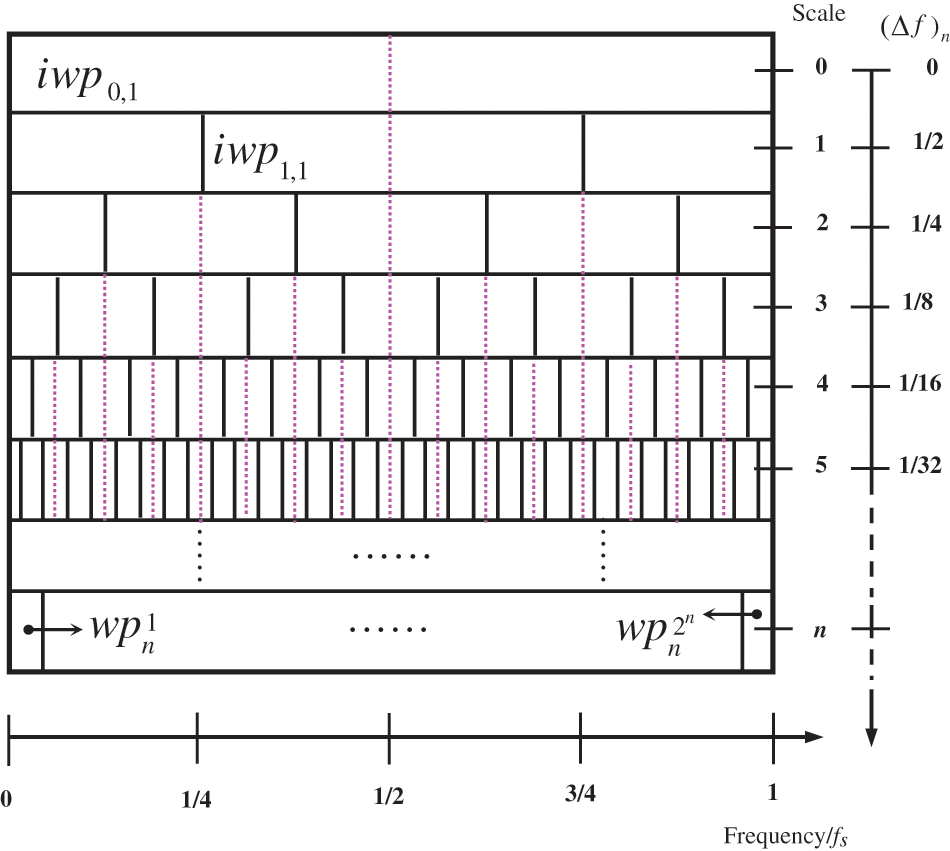
Figure 1: Centralized multiresolution analysis
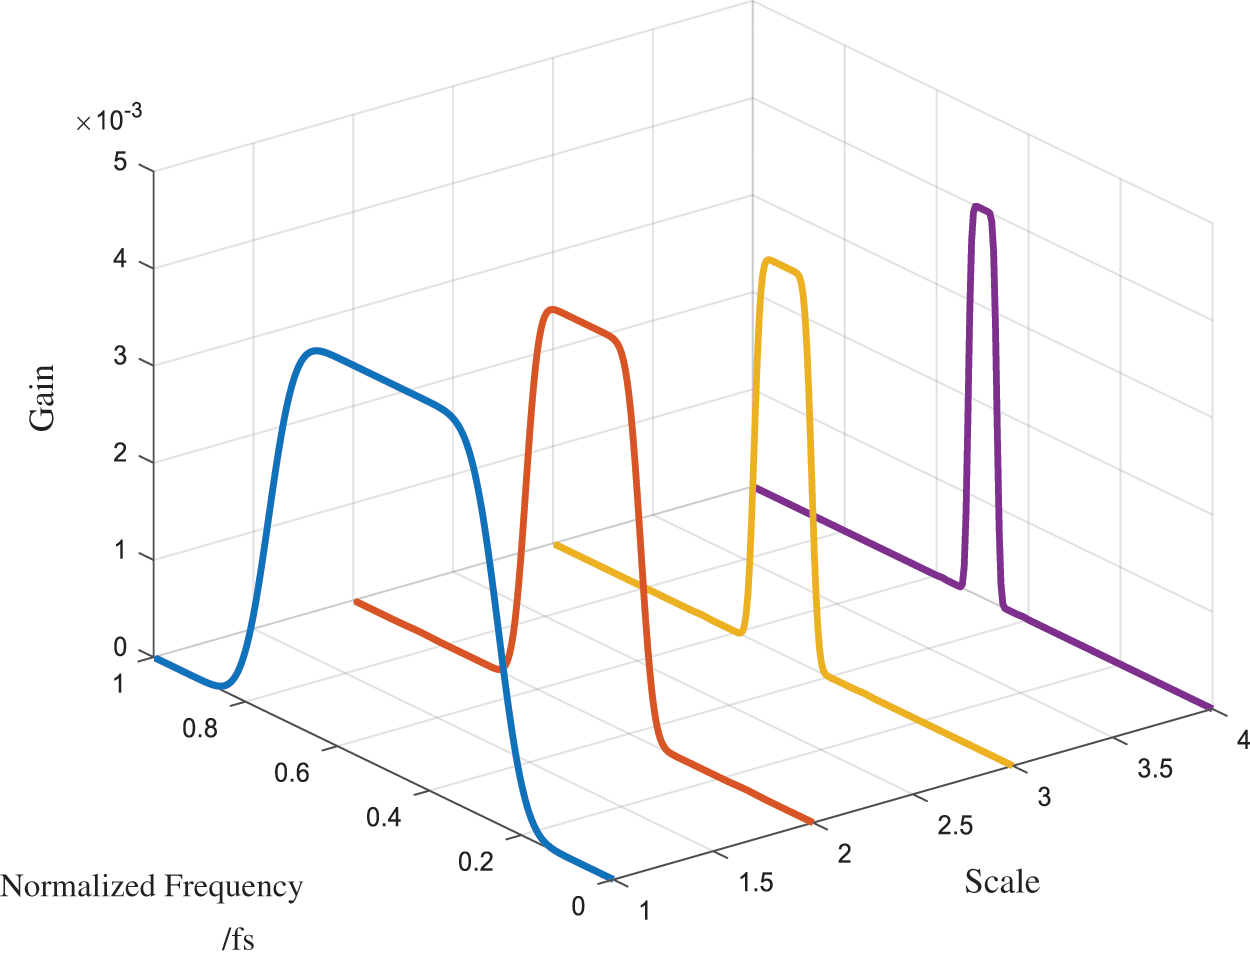
Figure 2: CMR provided by set of IWPs with identical CFs
3 Sparse Fourier Decomposition for Cycle-Stationary Process
3.1 Fundamentals of Sparse Representation
Compared with the classical basis expansion method, the sparse representation (SR) allows the addition of other optimization constraints, which can better suppress the monitoring noise. For a discrete signal
Let w be the representation coefficient vector to be solved, a typical optimization problem of SR is formulated as
where the matrix
where
3.2 Sparse Fourier Decomposition (SFD)
In fast Fourier transform (FFT), an orthonormal basis is used for decomposing the input signal. The spectral interval for adjacent sinusoidal atoms is
The column vector
where
On the basis of augmented Lagrangian theory, the above problem has an equivalent matrix form, given as:
where
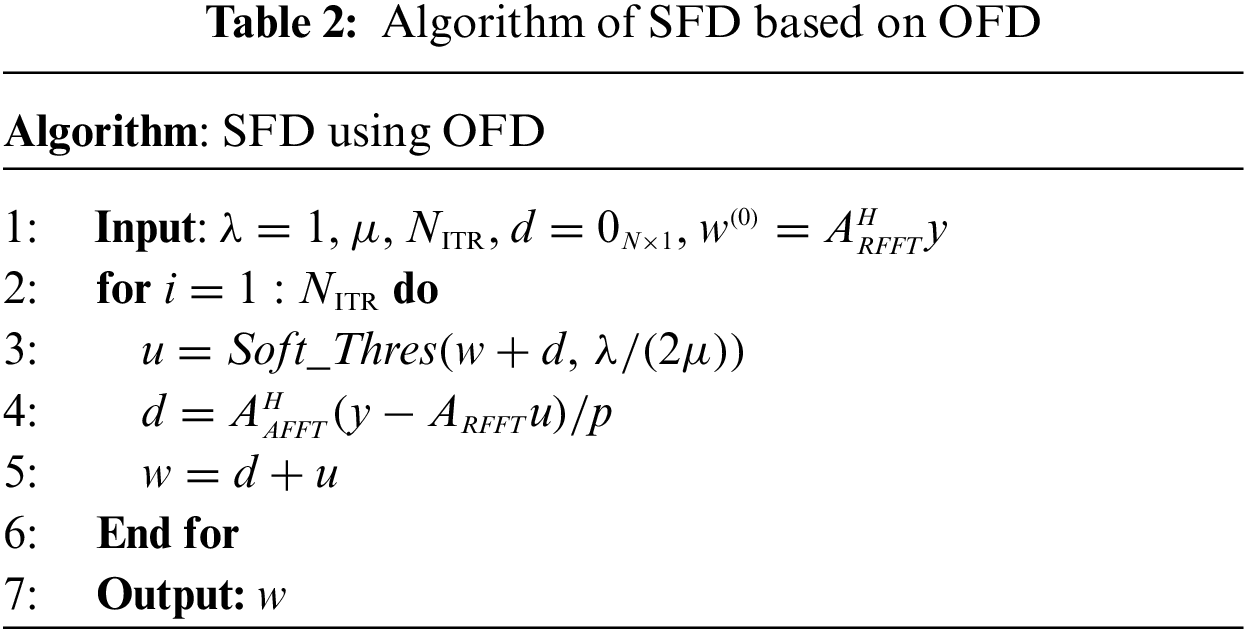
3.3 Numerical Implementation of SFD
Let H be the complex conjugate of a matrix and the thresholding function
4 Performance of SFD in Representation of Harmonic Component
When localized damage occurs in mechanical parts, periodic impacts are often generated in the monitoring signal, which causes multiple harmonics in the envelope spectrum. In order to evaluate the amount of PIC in the signal, it is necessary to calculate the sum of the energy of each harmonic.
4.1 SFD of Simple Harmonic Wave without Noises
A sinusoidal signal
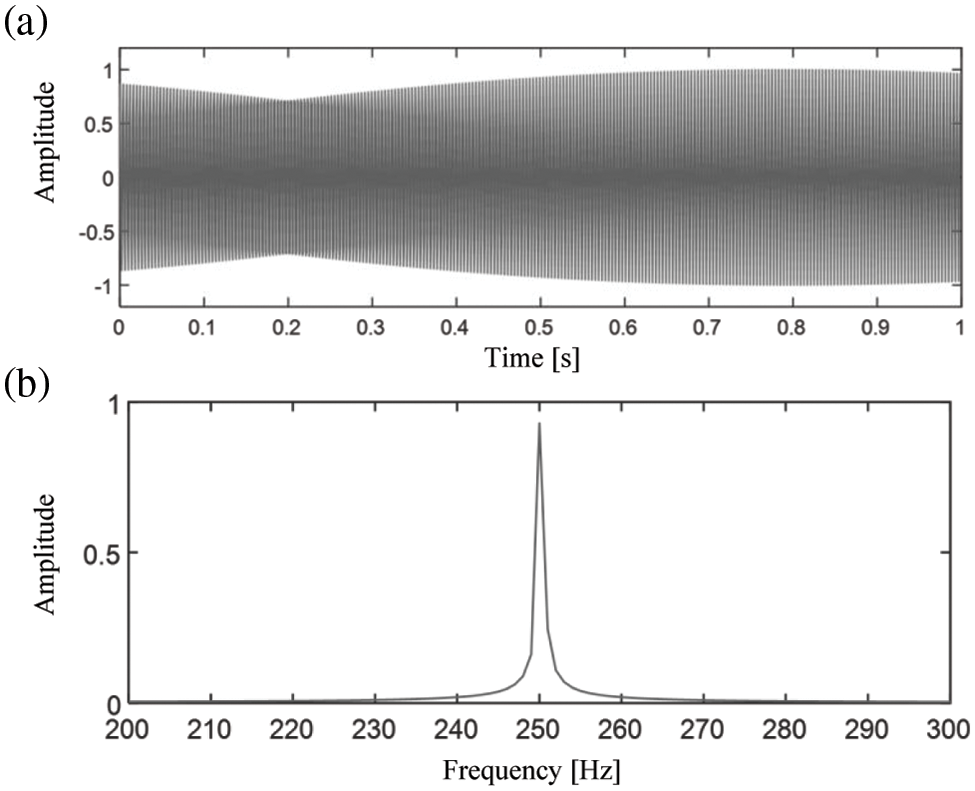
Figure 3: (a) Time domain waveform and (b) FFT spectrum of the synthesized noise-free signal
Applying the SFD algorithm on the synthesized signal by setting
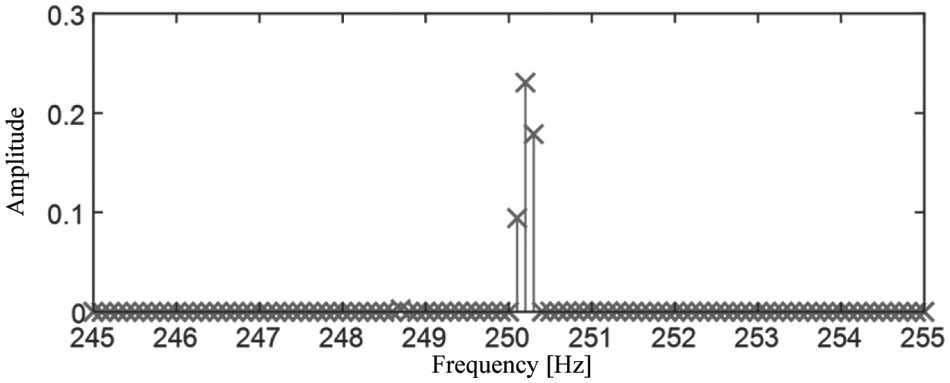
Figure 4: SFD spectrum of the synthesized signal
In contrast to the FFT spectrum where the energy of the harmonic components leaks in the entire frequency domain, the energy of the signal in the SFD spectrum is compressed in a narrow band with a bandwidth of only 0.2 Hz. An approximation signal
In order to demonstrate the performance of SFD, the spectrum is compared with the FFT spectrum and the FFT spectrum with Hanning window. As shown in Fig. 5, the bandwidth of the main lobe of the SFD spectrum is the smallest, and the decay rate is the fastest near the main lobe. On the other hand, it is found that the amplitude of the side lobe in the SFD spectrum is only about 1/1000 of that in the FFT spectrum. This shows that the SFD spectrum, based on the redundant Fourier dictionary, has a good sparse representation ability for the harmonic components.
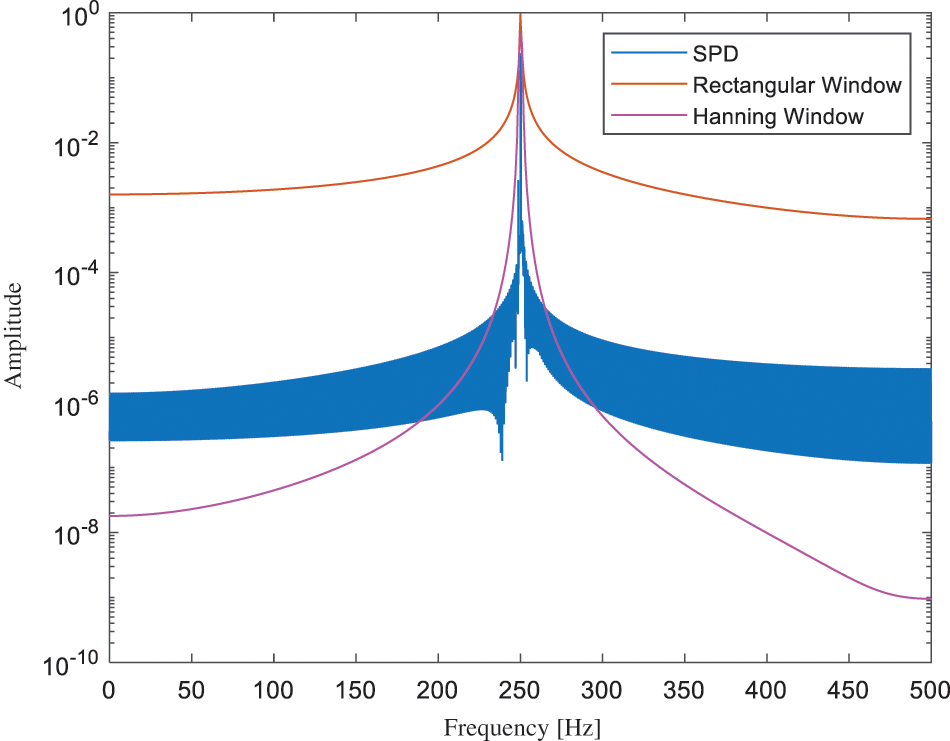
Figure 5: Comparison of SFD spectrum, FFT spectrum and windowed spectrum of signal
To analyze the impact of the redundancy of
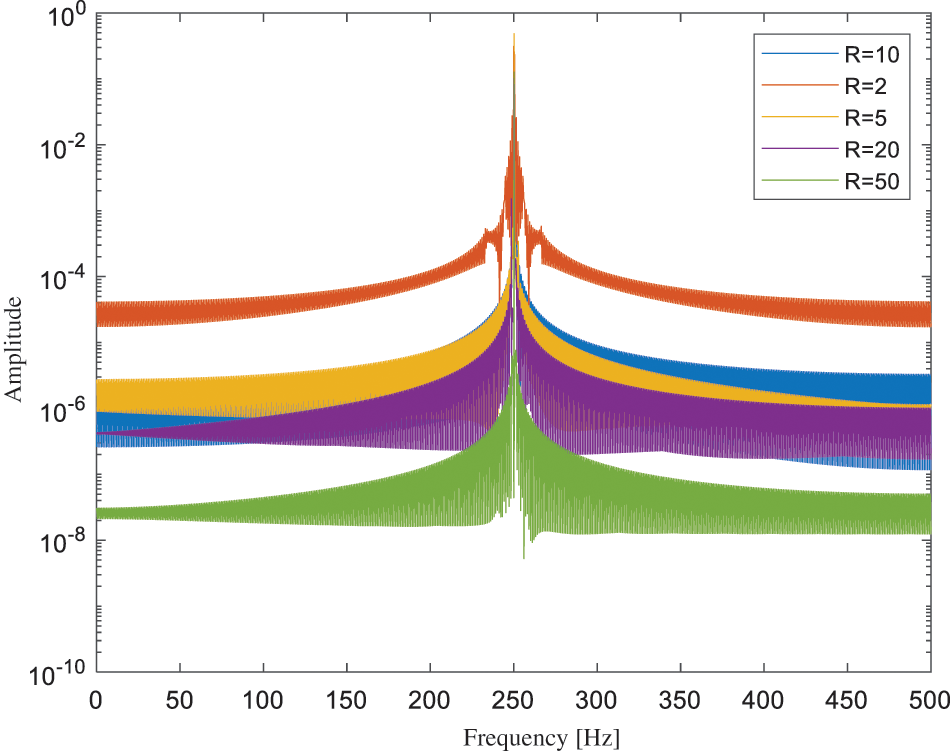
Figure 6: SFD spectra with different values of redundancy
4.2 SFD of Noisy Harmonic Component
In order to test the ability of SFD spectra to characterize noisy harmonic components, white noise is added to the simulation signal in the formula. The time domain waveform of a noisy signal
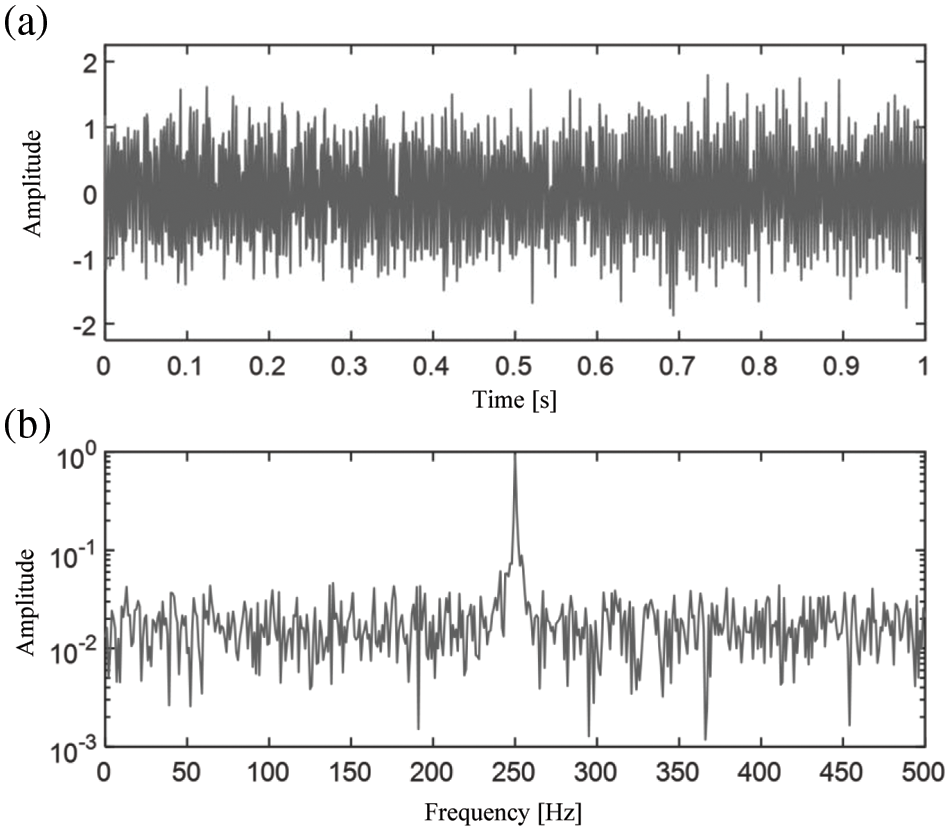
Figure 7: (a) Time domain waveform and (b) FFT spectrum of the noisy signal
The SFD spectrum, generated by the proposed method, is shown in Fig. 8. Due to the existence of white noise, there are some prominent energy concentration regions in the SFD spectrum (Fig. 8a). However, the spectral component of the harmonic component is still dominant, and there are only three spectral lines in the main lobe (Fig. 8b). Comparing the spectral lines of the main-lobes in Figs. 4 and 8b, they are almost the same. An approximation signal

Figure 8: (a) FFT spectrum with (b) zoom-in plot of the noisy signal
4.3 SFD of Periodic Impact Characteristics
In this subsection, the performance of SFD on PICs is validated. In the time domain, a typical PIC can be modeled as
where
where
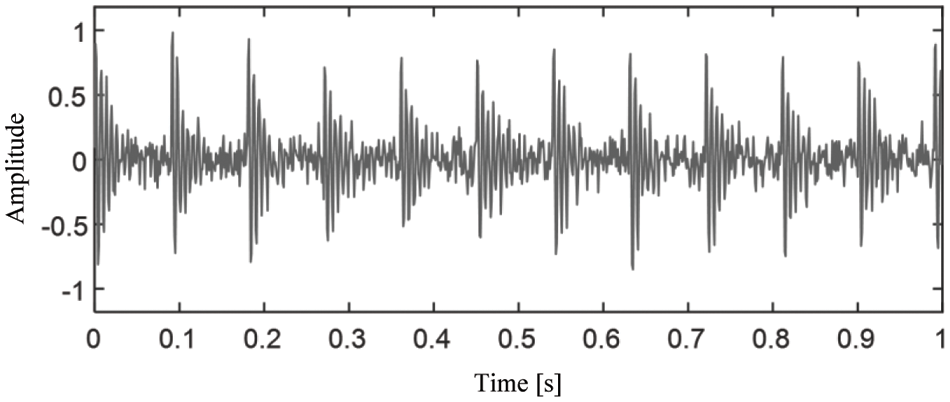
Figure 9: Time domain waveform of the simulated noisy signal
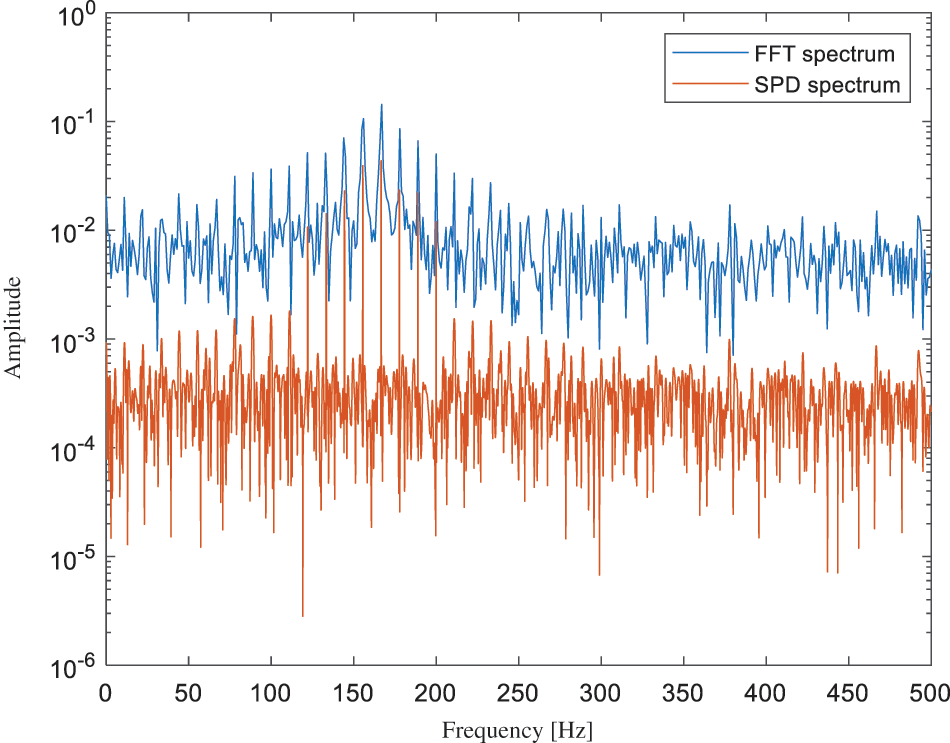
Figure 10: Comparison of PSD spectrum and FFT spectrum of the noisy signal
5 Proposed Fault Diagnosis Approach
In the condition monitoring of EV, the PIC caused by the local damage of mechanical parts can be regarded as a multi-harmonic signal with noise in the envelope demodulation spectrum. Combined with FWD and SFD introduced in this paper, an intelligent fault diagnosis method is proposed. Taking the mechanical transmission chain and fault frequency and speed as prior knowledge, the procedure of the algorithm is as below. For a wavelet packet
where the operator
6 Case Study of Fault Diagnosis
6.1 Descriptions of the Experiment
To verify the effectiveness of the proposed approach, a case study using actual signals from engineering experiments, is investigated. The tested mechanical part is a roller element bearing with slight peeling on the outer race. Specifications of the test bearing are shown in Table 3. This test bearing was removed from a certain type of electric drive vehicle. It provides mechanical support for the drive shaft of the AC motor and works under heavy load. In this test, the bearing was placed in a hydraulically driven loading device. Schematic diagrams of the test set-up are shown in Fig. 11.

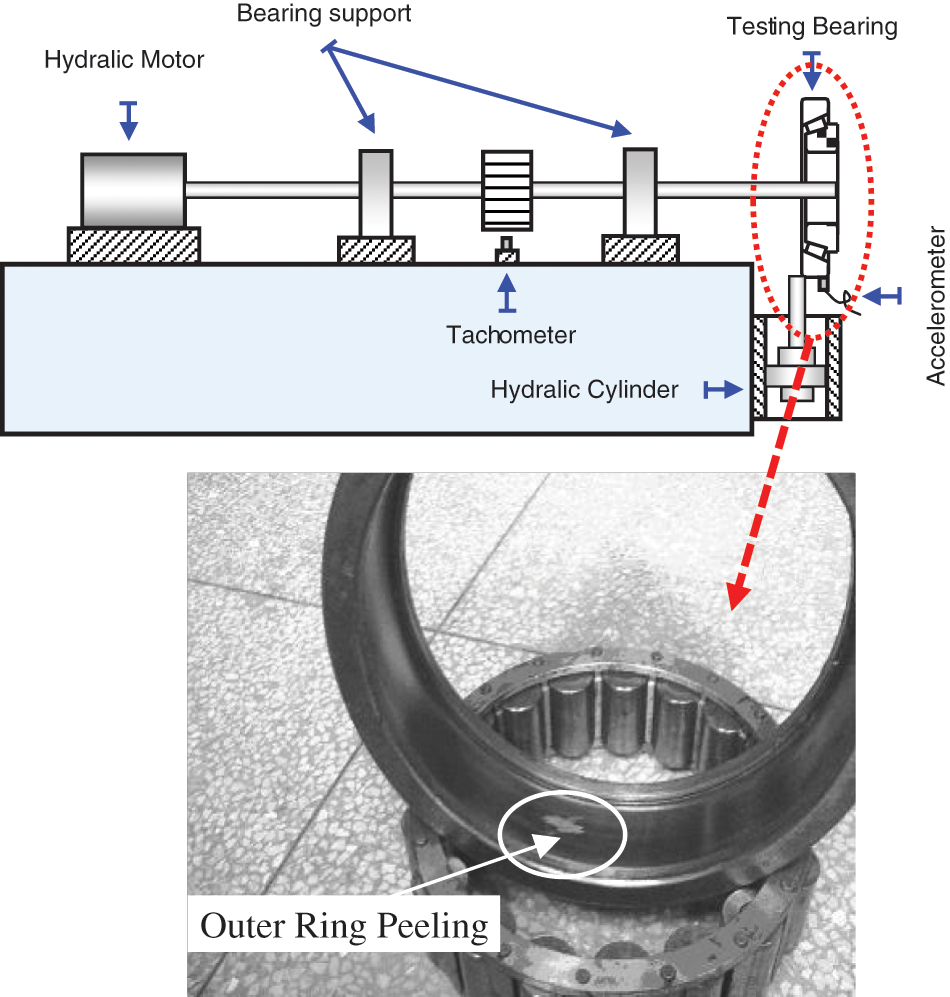
Figure 11: Schematic diagrams of the experimental set-up
6.2 Descriptions of the Experiment
The time domain waveform and the FFT spectrum of a record of vibration signals are shown in Fig. 12. It can be seen from the figure that there is a lot of noise, which complicates the identification of fault features. The proposed method is applied to the acceleration signal. In the fault diagnosis algorithm,
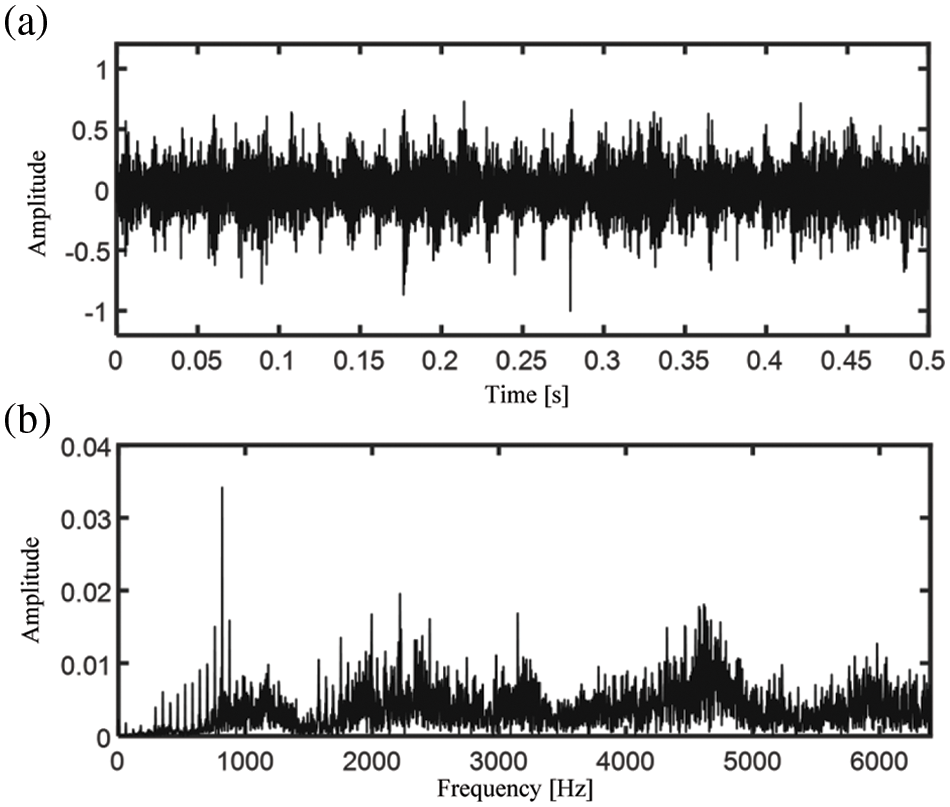
Figure 12: (a) Time domain waveform and (b) FFT spectrum of the noisy signal

Figure 13: The impulsiveness values of the decomposed wavelet subspaces by the proposed method
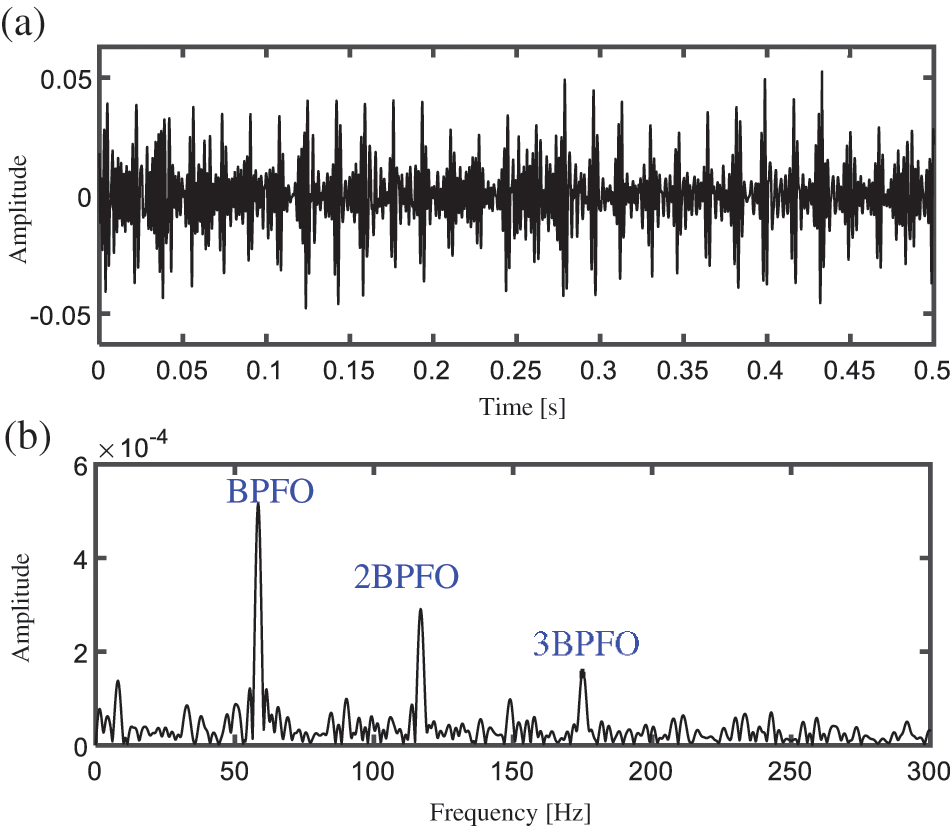
Figure 14: (a) Time domain waveform and (b) PSD spectrum of extracted by the proposed method
If the indicator of PER is not calculated in the algorithm, the processing results are shown in Fig. 15. The central frequency and the theoretical passband of the selected wavelet subspace are 5750 Hz and
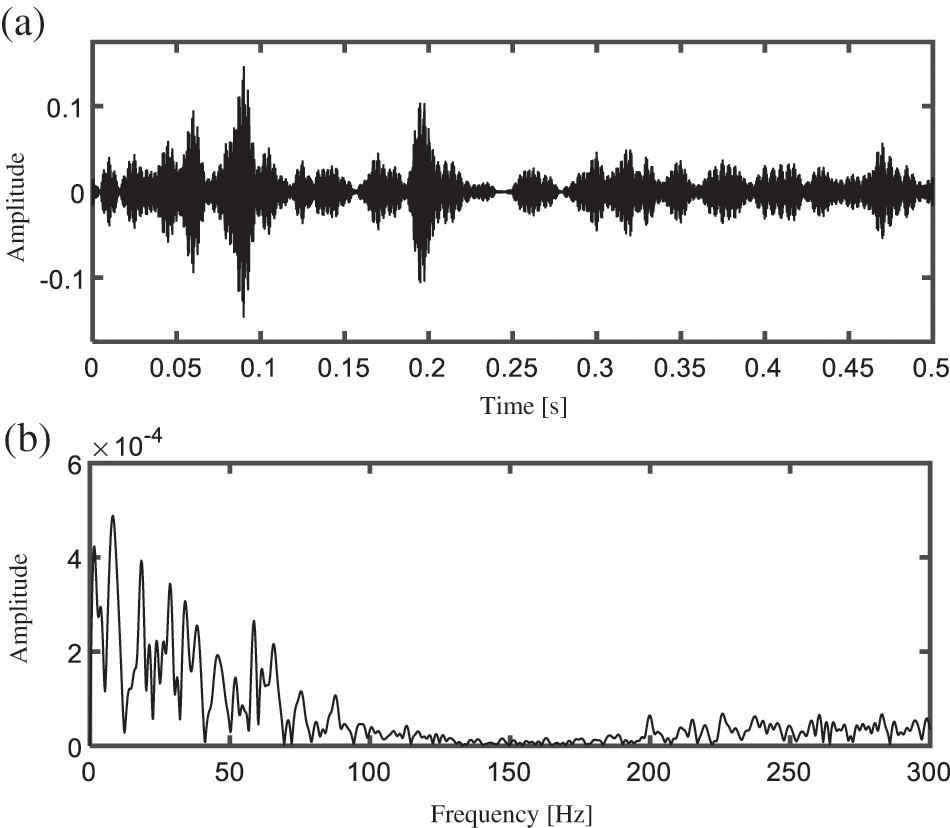
Figure 15: (a) Time domain waveform and (b) PSD spectrum of extracted features by the comparison method
7 Discussion on the Sharp Resolution of SFD Spectrum
From the materials given above, it is known that the SFD spectrum has an extremely high resolution. This is quite different from the classical windowed spectral analysis. According to the Heisenberg uncertainty principle, the main lobe resolution and the side lobe attenuation rate cannot be improved simultaneously. The SFD spectrum proposed in this paper is based on the principle of sparse representation and does not depend on the window function, which can ensure a very high resolution of the main lobe while accelerating the rate of side lobe attenuation. Nevertheless, it is also found that such improvements are limited and still cannot completely break through the constraints of the Heisenberg uncertainty principle.
In this paper, the problem of PICs extraction is studied, which is the core problem in the mechanical fault diagnosis of electric vehicles. In order to improve the accuracy and robustness of fault feature identification, statistical information and model information in the monitoring signal were combined comprehensively. A sparse Fourier decomposition method based on OFD is proposed, which realizes the quantitative evaluation of the energy proportion of fault feature components on the envelope spectrum in signal time-frequency representation. This model information plays an important role in eliminating the interference of measurement noise in the analysis signal. The effectiveness of the proposed sparsity-enhanced model-based fault diagnosis method is demonstrated by numerical simulations and case studies.
Funding Statement: This research is supported financially by the National Natural Science Foundation of China (Grant No. 51805398), the Natural Science Basic Research Program of Shaanxi (Grant No. 2023-JC-YB-289), the Project of Youth Talent Lift Program of Shaanxi University Association for Science and Technology (Grant No. 20200408), the Fundamental Research Funds for the Central Universities (Grant No. JB211303).
Conflicts of Interest: The authors declare that they have no conflicts of interest to report regarding the present study.
References
1. Wang, R., Sun, Q., Sun, C., Zhang, H., Gui, Y. et al. (2021). Vehicle-vehicle energy interaction converter of electric vehicles: A disturbance observer based sliding mode control algorithm. IEEE Transactions on Vehicular Technology, 70(10), 9910–9921. https://doi.org/10.1109/TVT.2021.3105433 [Google Scholar] [CrossRef]
2. Gan, N., Sun, Z., Zhang, Z., Xu, S., Liu, P. et al. (2021). Data-driven fault diagnosis of lithium-ion battery overdischarge in electric vehicles. IEEE Transactions on Power Electronics, 37(4), 4575–4588. https://doi.org/10.1109/TPEL.2021.3121701 [Google Scholar] [CrossRef]
3. Xiang, Y., Yang, J., Li, X., Gu, C., Zhang, S. (2021). Routing optimization of electric vehicles for charging with event-driven pricing strategy. IEEE Transactions on Automation Science and Engineering, 19(1), 7–20. https://doi.org/10.1109/TASE.2021.3102997 [Google Scholar] [CrossRef]
4. Kwon, K., Lee, J., Min, S. (2021). Motor and transmission multiobjective optimum design for tracked hybrid electric vehicles considering equivalent inertia of track system. IEEE Transactions on Transportation Electrification, 7(4), 3110–3123. https://doi.org/10.1109/TTE.2021.3081115 [Google Scholar] [CrossRef]
5. Helbing, M., Uebel, S., Matthes, C., Bäker, B. (2021). Comparative case study of a metamodel-based electric vehicle powertrain design. IEEE Access, 9, 160823–160835. https://doi.org/10.1109/ACCESS.2021.3131362 [Google Scholar] [CrossRef]
6. Palermo, A., Britte, L., Janssens, K., Mundo, D., Desmet, W. (2018). The measurement of gear transmission error as an NVH indicator: Theoretical discussion and industrial application via low-cost digital encoders to an all-electric vehicle gearbox. Mechanical Systems and Signal Processing, 110, 368–389. https://doi.org/10.1016/j.ymssp.2018.03.005 [Google Scholar] [CrossRef]
7. Wang, X., Lu, S., Chen, K., Wang, Q., Zhang, S. (2021). Bearing fault diagnosis of switched reluctance motor in electric vehicle powertrain via multisensor data fusion. IEEE Transactions on Industrial Informatics, 18(4), 2452–2464. https://doi.org/10.1109/TII.2021.3095086 [Google Scholar] [CrossRef]
8. Singh, R., Ushan, B. (2020). Condition monitoring based control using wavelets and machine learning for unmanned surface vehicles. IEEE Transactions on Industrial Electronics, 68(8), 7464–7473. https://doi.org/10.1109/TIE.2020.3001855 [Google Scholar] [CrossRef]
9. Cui, L., Sun, Y., Wang, X., Wang, H. (2021). Spectrum-based, full-band preprocessing, and two-dimensional separation of bearing and gear compound faults diagnosis. IEEE Transactions on Instrumentation and Measurement, 70, 1–16. https://doi.org/10.1109/TIM.2021.3063189 [Google Scholar] [CrossRef]
10. Ruan, H., Wang, Y., Li, X., Qin, Y., Tang, B. et al. (2021). A relation-based semisupervised method for gearbox fault diagnosis with limited labeled samples. IEEE Transactions on Instrumentation and Measurement, 70, 1–13. [Google Scholar]
11. Hong, J., Wang, Z., Ma, F., Yang, J., Xu, X. et al. (2021). Thermal runaway prognosis of battery systems using the modified multiscale entropy in real-world electric vehicles. IEEE Transactions on Transportation Electrification, 7(4), 2269–2278. https://doi.org/10.1109/TTE.2021.3079114 [Google Scholar] [CrossRef]
12. Wu, J., Cui, X., Zhang, H., Lin, M. (2021). Health prognosis with optimized feature selection for lithium-ion battery in electric vehicle applications. IEEE Transactions on Power Electronics, 36(11), 12646–12655. https://doi.org/10.1109/TPEL.2021.3075558 [Google Scholar] [CrossRef]
13. Zhao, B., Niu, Z., Liang, Q., Xin, Y., Qian, T. et al. (2021). Signal-to-signal translation for fault diagnosis of bearings and gears with few fault samples. IEEE Transactions on Instrumentation and Measurement, 70, 1–10. https://doi.org/10.1109/TIM.2021.3123433 [Google Scholar] [CrossRef]
14. Yan, S., Shao, H., Xiao, Y., Liu, B., Wan, J. (2023). Hybrid robust convolutional autoencoder for unsupervised anomaly detection of machine tools under noises. Robotics and Computer-Integrated Manufacturing, 79, 102441. https://doi.org/10.1016/j.rcim.2022.102441 [Google Scholar] [CrossRef]
15. Li, W., Zhong, X., Shao, H., Cai, B., Yang, X. (2022). Multi-mode data augmentation and fault diagnosis of rotating machinery using modified ACGAN designed with new framework. Advanced Engineering Informatics, 52, 101552. https://doi.org/10.1016/j.aei.2022.101552 [Google Scholar] [CrossRef]
16. Zhang, K., Chen, P., Yang, M., Song, L., Xu, Y. (2022). The harmogram: A periodic impulses detection method and its application in bearing fault diagnosis. Mechanical Systems and Signal Processing, 165, 108374. https://doi.org/10.1016/j.ymssp.2021.108374 [Google Scholar] [CrossRef]
17. He, W., Zi, Y., Chen, B., Wu, F., He, Z. (2015). Automatic fault feature extraction of mechanical anomaly on induction motor bearing using ensemble super-wavelet transform. Mechanical Systems and Signal Processing, 54, 457–480. https://doi.org/10.1016/j.ymssp.2014.09.007 [Google Scholar] [CrossRef]
18. Pang, X., Xue, X., Jiang, W., Lu, K. (2020). An investigation into fault diagnosis of planetary gearboxes using a bispectrum convolutional neural network. IEEE/ASME Transactions on Mechatronics, 26(4), 2027–2037. https://doi.org/10.1109/TMECH.2020.3029058 [Google Scholar] [CrossRef]
19. He, B., Qin, Y., Zhang, A. (2021). Rolling bearing fault diagnosis by using a new index: The compound weighted characteristic energy ratio. IEEE Transactions on Instrumentation and Measurement, 70, 1–9. https://doi.org/10.1109/TIM.19 [Google Scholar] [CrossRef]
20. Miao, J., Wang, J., Miao, Q. (2021). An enhanced multifeature fusion method for rotating component fault diagnosis in different working conditions. IEEE Transactions on Reliability, 70(4), 1611–1620. https://doi.org/10.1109/TR.2021.3117732 [Google Scholar] [CrossRef]
21. Wang, Y., Yang, M., Li, Y., Xu, Z., Wang, J. et al. (2021). A multi-input and multi-task convolutional neural network for fault diagnosis based on bearing vibration signal. IEEE Sensors Journal, 21(9), 10946–10956. https://doi.org/10.1109/JSEN.2021.3061595 [Google Scholar] [CrossRef]
22. Wan, L., Zhang, G., Li, H., Li, C. (2021). A novel bearing fault diagnosis method using spark-based parallel ACO-K-means clustering algorithm. IEEE Access, 9, 28753–28768. https://doi.org/10.1109/Access.6287639 [Google Scholar] [CrossRef]
23. Shah, A. A., Bhatti, N. A., Dev, K., Chowdhry, B. S. (2021). MUHAFIZ: IoT-based track recording vehicle for the damage analysis of the railway track. IEEE Internet of Things Journal, 8(11), 9397–9406. https://doi.org/10.1109/JIOT.2021.3057835 [Google Scholar] [CrossRef]
24. Dash, S., Tripathy, R. K., Panda, G., Pachori, R. B. (2022). Automated recognition of imagined commands from EEG signals using multivariate fast and adaptive empirical mode decomposition based method. IEEE Sensors Letters, 6(2), 1–4. https://doi.org/10.1109/LSENS.2022.3142349 [Google Scholar] [CrossRef]
25. Fan, X., Zhang, Y., Krehbiel, P. R., Zhang, Y., Zheng, D. et al. (2020). Application of ensemble empirical mode decomposition in low-frequency lightning electric field signal analysis and lightning location. IEEE Transactions on Geoscience and Remote Sensing, 59(1), 86–100. https://doi.org/10.1109/TGRS.36 [Google Scholar] [CrossRef]
26. Shi, J., Liu, Z. (2021). Harmonic detection technology for power grids based on adaptive ensemble empirical mode decomposition. IEEE Access, 9, 21218–21226. https://doi.org/10.1109/Access.6287639 [Google Scholar] [CrossRef]
27. Zhang, Z., Yang, Q., Wu, Z. (2020). Sparse filtering with adaptive basis weighting: A novel representation learning method for intelligent fault diagnosis. IEEE Transactions on Systems, Man, and Cybernetics: Systems, 52(2), 1019–1025. [Google Scholar]
28. Liu, Z., Yang, B., Wang, X., Zhang, L. (2021). Acoustic emission analysis for wind turbine blade bearing fault detection under time-varying low-speed and heavy blade load conditions. IEEE Transactions on Industry Applications, 57(3), 2791–2800. https://doi.org/10.1109/TIA.2021.3058557 [Google Scholar] [CrossRef]
29. Wang, Y., Zheng, Y., Wang, Z., Yang, W. (2021). Time-weighted kernel-sparse-representation-based real-time nonlinear multimode process monitoring. IEEE Transactions on Industrial Informatics, 18(4), 2411–2421. https://doi.org/10.1109/TII.2021.3104111 [Google Scholar] [CrossRef]
30. He, W., Hu, J., Chen, B., Guo, B. (2021). GMC sparse enhancement diagnostic method based on the tunable Q-factor wavelet transform for detecting faults in rotating machines. Measurement, 174, 109001. https://doi.org/10.1016/j.measurement.2021.109001 [Google Scholar] [CrossRef]
31. Sahani, M., Dash, P. K. (2020). FPGA-based semisupervised multifusion RDCNN of process robust VMD data with online kernel RVFLN for power quality events recognition. IEEE Transactions on Neural Networks and Learning Systems, 33(2), 515–527. https://doi.org/10.1109/TNNLS.2020.3027984 [Google Scholar] [PubMed] [CrossRef]
32. Xu, Y., Zhao, C., Xie, S., Lu, M. (2021). Novel fault location for high permeability active distribution networks based on improved VMD and S-transform. IEEE Access, 9, 17662–17671. https://doi.org/10.1109/ACCESS.2021.3052349 [Google Scholar] [CrossRef]
33. Huang, J., Chen, B., Li, Y., Sun, W. (2021). Fractal geometry of wavelet decomposition in mechanical signature analysis. Measurement, 173, 108571. https://doi.org/10.1016/j.measurement.2020.108571 [Google Scholar] [CrossRef]
34. Wang, Y., Xiang, J., Markert, R., Liang, M. (2016). Spectral kurtosis for fault detection, diagnosis and prognostics of rotating machines: A review with applications. Mechanical Systems and Signal Processing, 66, 679–698. https://doi.org/10.1016/j.ymssp.2015.04.039 [Google Scholar] [CrossRef]
35. Wang, X., Tang, G., Yan, X., He, Y., Zhang, X. et al. (2021). Fault diagnosis of wind turbine bearing based on optimized adaptive chirp mode decomposition. IEEE Sensors Journal, 21(12), 13649–13666. https://doi.org/10.1109/JSEN.2021.3071164 [Google Scholar] [CrossRef]
36. Zhang, L., Li, Y., Dong, L., Yang, X., Ding, X. et al. (2021). Gearbox fault diagnosis using multiscale sparse frequency-frequency distributions. IEEE Access, 9, 113089–113099. https://doi.org/10.1109/ACCESS.2021.3104281 [Google Scholar] [CrossRef]
37. Li, J., Huang, R., He, G., Liao, Y., Wang, Z. et al. (2020). A two-stage transfer adversarial network for intelligent fault diagnosis of rotating machinery with multiple new faults. IEEE/ASME Transactions on Mechatronics, 26(3), 1591–1601. https://doi.org/10.1109/TMECH.2020.3025615 [Google Scholar] [CrossRef]
38. Cao, X. C., Chen, B. Q., Yao, B., He, W. (2019). Combining translation-invariant wavelet frames and convolutional neural network for intelligent tool wear state identification. Computers in Industry, 106, 71–84. https://doi.org/10.1016/j.compind.2018.12.018 [Google Scholar] [CrossRef]
39. Liu, X., Miao, X., Jiang, H., Chen, J. (2021). Box-point detector: A diagnosis method for insulator faults in power lines using aerial images and convolutional neural networks. IEEE Transactions on Power Delivery, 36(6), 3765–3773. https://doi.org/10.1109/TPWRD.2020.3048935 [Google Scholar] [CrossRef]
40. Selesnick, I. W., Baraniuk, R. G., Kingsbury, N. C. (2005). The dual-tree complex wavelet transform. IEEE Signal Processing Magazine, 22(6), 123–151. https://doi.org/10.1109/MSP.2005.1550194 [Google Scholar] [CrossRef]
Cite This Article
 Copyright © 2023 The Author(s). Published by Tech Science Press.
This work is licensed under a Creative Commons Attribution 4.0 International License , which permits unrestricted use, distribution, and reproduction in any medium, provided the original work is properly cited.
 Downloads
 Citation Tools