
 Submit a Paper
 Propose a Special lssue
 Open Access
ARTICLE

Expert Experience and Data-Driven Based Hybrid Fault Diagnosis for High-Speed Wire Rod Finishing Mills
1 Institute of Intelligent Manufacturing, Nanjing Tech University, Nanjing, 210009, China
2 Beijing Gaohuahan Intelligent Technology Co., Ltd., Beijing, 100084, China
3 Beijing Wavelet Rhythm Technology Co., Ltd., Beijing, 100020, China
4 College of Mechanical and Power Engineering, Nanjing Tech University, Nanjing, 211816, China
* Corresponding Author: Quanling Zhang. Email:
(This article belongs to the Special Issue: Computer-Aided Uncertainty Modeling and Reliability Evaluation for Complex Engineering Structures)
Computer Modeling in Engineering & Sciences 2024, 138(2), 1827-1847. https://doi.org/10.32604/cmes.2023.030970
Received 06 May 2023; Accepted 29 June 2023; Issue published 17 November 2023
 View Full Text
 Download PDF
Abstract
The reliable operation of high-speed wire rod finishing mills is crucial in the steel production enterprise. As complex system-level equipment, it is difficult for high-speed wire rod finishing mills to realize fault location and real-time monitoring. To solve the above problems, an expert experience and data-driven-based hybrid fault diagnosis method for high-speed wire rod finishing mills is proposed in this paper. First, based on its mechanical structure, time and frequency domain analysis are improved in fault feature extraction. The approach of combining virtual value, peak value with kurtosis value index, is adopted in time domain analysis. Speed adjustment and side frequency analysis are proposed in frequency domain analysis to obtain accurate component characteristic frequency and its corresponding sideband. Then, according to time and frequency domain characteristics, fault location based on expert experience is proposed to get an accurate fault result. Finally, the proposed method is implemented in the equipment intelligent diagnosis system. By taking an equipment fault on site, for example, the effectiveness of the proposed method is illustrated in the system.Keywords
With the increasing demand for steel in social development, the iron and steel industry has achieved rapid growth in recent years. In particular, the large-scale application of modern information technology in the iron and steel industry has made the functions of steel processing equipment more and more powerful, and the types of equipment are also increasing. However, the probability of equipment failure has increased significantly, especially the failure of steel rolling equipment [1]. Once the rolling equipment fails, even if the fault is tiny, it may also bring significant economic losses to the steel processing enterprises [2]. Therefore, to ensure the regular operation of steel rolling equipment, it is necessary to monitor the running state of steel rolling equipment in real time. Significantly, some abnormal conditions can affect the safety of equipment and product quality [3].
In practical engineering, the gearbox is widely applied in rotating machinery transmission equipment, such as steel rolling mills. Its four main parts include shaft, gear, bearing, and box [4]. The empirical judgment method is the most commonly used in the steel rolling field. However, it belongs to post diagnosis and relies too much on subjective judgment. Yang et al. [5] proposed a fuzzy logic fault diagnosis method. Based on the fuzzy signs of the high-speed wire mill gearbox, fuzzy state recognition makes decisions and traces to the source of the failure. Zhang et al. [6] proposed a fault diagnosis method based on signal processing. The combination of empirical mode decomposition (EMD) and energy operator demodulation can effectively diagnose the fault of the rolling mill gearbox. The early fault characteristic signal of the gearbox bearing is weak and seriously affected by the environmental noise. Aiming at this problem, Wang et al. [7] proposed a diagnosis method based on dual-tree complex wavelet transform (DT-CWT) and minimum entropy deconvolution (MED). At present, there are many effective diagnosis methods for rolling mill components, such as multi-scale deep residual learning and stacked LSTM [8], deep sparse representation network (DSRNet) [9], multi-scale convolutional neural networks and thermal imaging [10], feature-fusion covariance matrix and multi-Riemannian kernel ridge regression [11]. However, the fault diagnosis of the whole system, especially the rolling mill, is still a great challenge due to its complicated structure.
More significantly, it is difficult for the rolling mill to realize online roll fault diagnosis. Chen et al. [12] proposed a method based on ensemble empirical mode decomposition (EEMD) and adaptive filtering for extracting characteristic signals of low-frequency rolling vibration. Besides this characteristic, the rolling mill unit also has continuous changes in rotating speed and large load fluctuation. Li et al. [13] proposed a stress wave technology to eliminate external interference factors and reflect actual fault conditions inside the equipment. Aiming at unknown disturbances on site, Luo et al. [14] gave a robust data-driven fault approach for rolling mills. In the recent literature, multi-source sensing data fusion and improved deep learning [15,16], time-frequency image, and dual attention-guided feature enhancement networks [17] are widely applied in rolling mill health state diagnosis and fault diagnosis under imbalanced and limited datasets. System-level fault diagnosis is a complex and challenging issue. The difficulties mainly include system complexity, data acquisition and processing, learning and generalization, hypothesis and reasoning, and system security. Jiang et al. [18] proposed an optimal fault detection and diagnosis (FDD) strategy for dynamic traction systems. Kouadri et al. [19] and Yan et al. [20], respectively proposed an intelligent fault diagnosis using hidden Markov model (HMM) based principal component analysis (PCA), a multichannel fault diagnosis using multivariate singular spectrum decomposition and improved Kolmogorov complexity, to realize fault diagnosis of wind energy system. For the rotor-bearing system, small labeled infrared thermal images and enhanced convolutional neural network transferred from convolutional auto-encoder [21], the multi-branch convolutional neural network with generalized shaft orbit [22], dimensional analysis and central composite rotatable design [23] are proposed. Besides, the digital twin is also a novel approach for system-level fault diagnosis [24]. However, existing fault diagnosis methods have some shortcomings. On the one hand, some of them cannot provide deterministic diagnosis results, due to the complexity of equipment and system. On the other hand, their cost is high. It is difficult to be widely used in small and medium-sized enterprises [25].
Model-based fault diagnosis needs an accurate model, and it is difficult to deal with unknown situations. In contrast, the data-driven fault diagnosis method has high model complexity and requires many labeled data. Aiming at high-speed wire rod finishing mills, this paper proposed a fault diagnosis approach based on expert experience and data-driven. At present, system-level fault diagnosis is rarely applied in the steel production field. Most of them only use monitoring systems. This paper introduces an equipment intelligent diagnosis system. The main contributions can be summarized as below:
(1) To revise the error of collected speed value error by the field sensor, a speed adjustment method is proposed in this algorithm procedure.
(2) Frequency doubling analysis and side frequency analysis is combined in this paper to obtain fault frequency characteristic.
(3) An expert experience and data-driven based fault location method is proposed to analyze the essential reason for finishing mill failure.
The remainder of this paper is organized as follows. Section 2 introduces the instruction and structure of the high-speed wire rod finishing mill group. A fault diagnosis method based on expert experience and data-driven for high-speed wire rod finishing mills is proposed in Section 3. Section 4 introduces an equipment intelligent diagnosis system in the steel production field. Section 5 makes case verification for an on-site fault. Section 6 proposes conclusions for this paper.
2 High-Speed Wire Rod Finishing Mill Group
2.1 Instruction of High-Speed Wire Rod Finishing Mill Group
A High-speed wire rod production line is a unique production equipment for producing carbon structural steel, low alloy structural steel, high strength steel, stainless steel and special steel. The production line uses continuous casting billets as raw materials. The main process flow includes raw material preparation, heating, rolling, controlled cooling, and finished product finishing. On the rolling line, the rolling mill is divided into rough rolling, medium rolling, and pre-finishing mills. And the rolling process of continuous automatic control is adopted. Fig. 1 describes the detailed procedure. And Fig. 2 shows part of the process in field production.
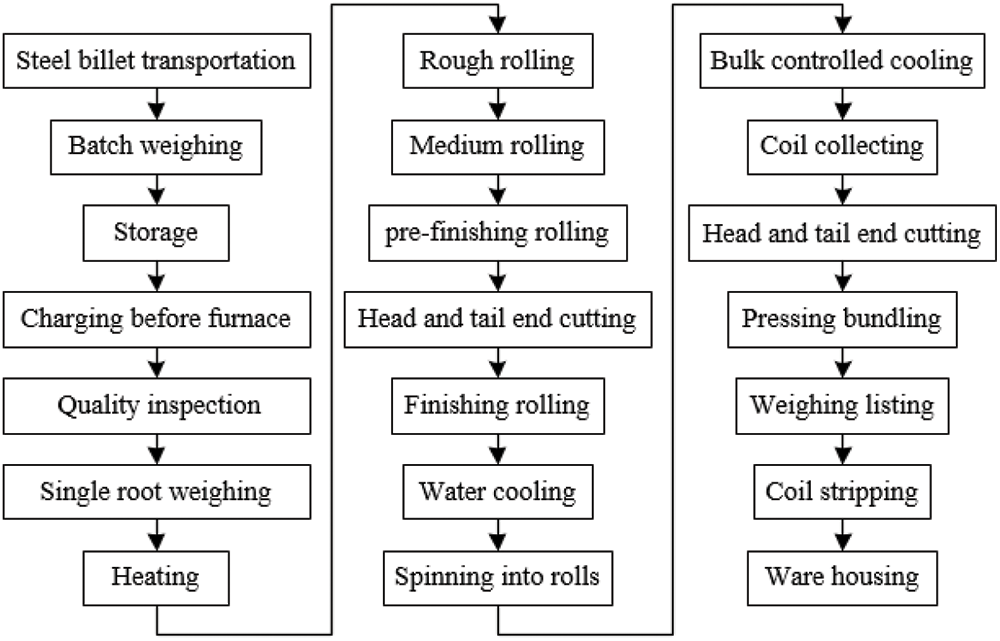
Figure 1: The process flow chart of high-speed wire rod production line
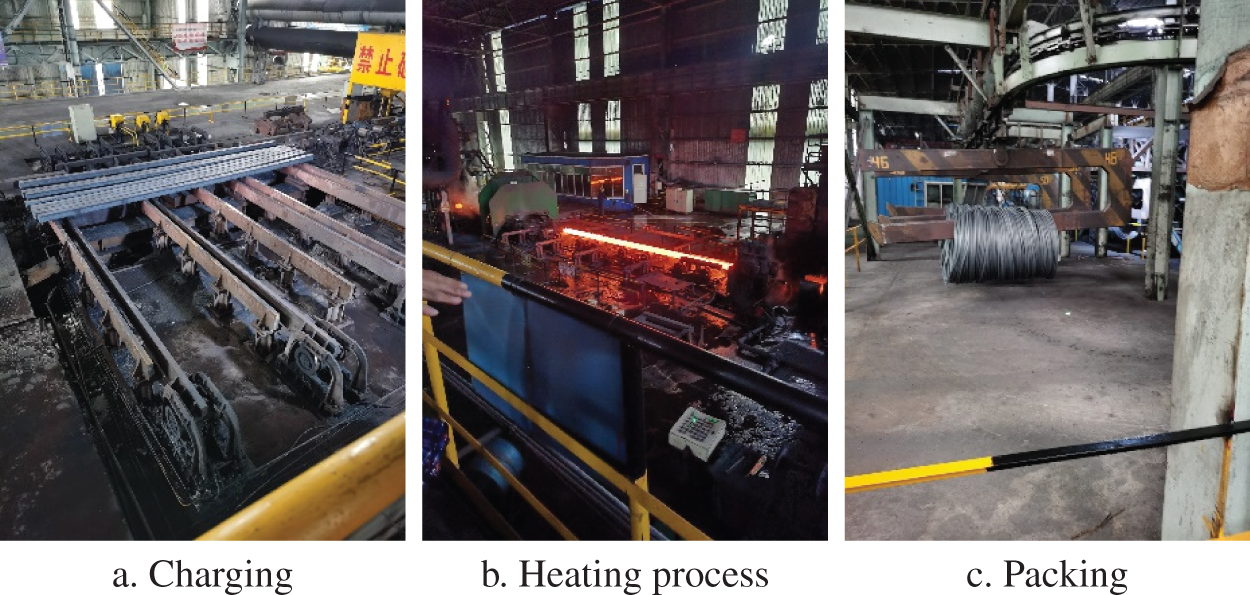
Figure 2: The process of field production
The no-twist finishing mill group is a significant piece of equipment in the high-speed wire rod workshop. The finishing mill group uses high precision, high-speed helical gear, bevel gear, oil film bearing, and rolling bearings. The machining accuracy, dynamic balance accuracy, and installation accuracy requirements of each part are very high. The research object is the super heavy top cross 45° high-speed wire rod finishing mill group. It is arranged in the high-speed wire rod production workshop. Through faint tension in a continuous rolling mill of ten frames, the
2.2 Structure of High-Speed Wire Rod Finishing Mill Group
The speed wire rod finishing mill group has 10 frames, mainly composed of 5
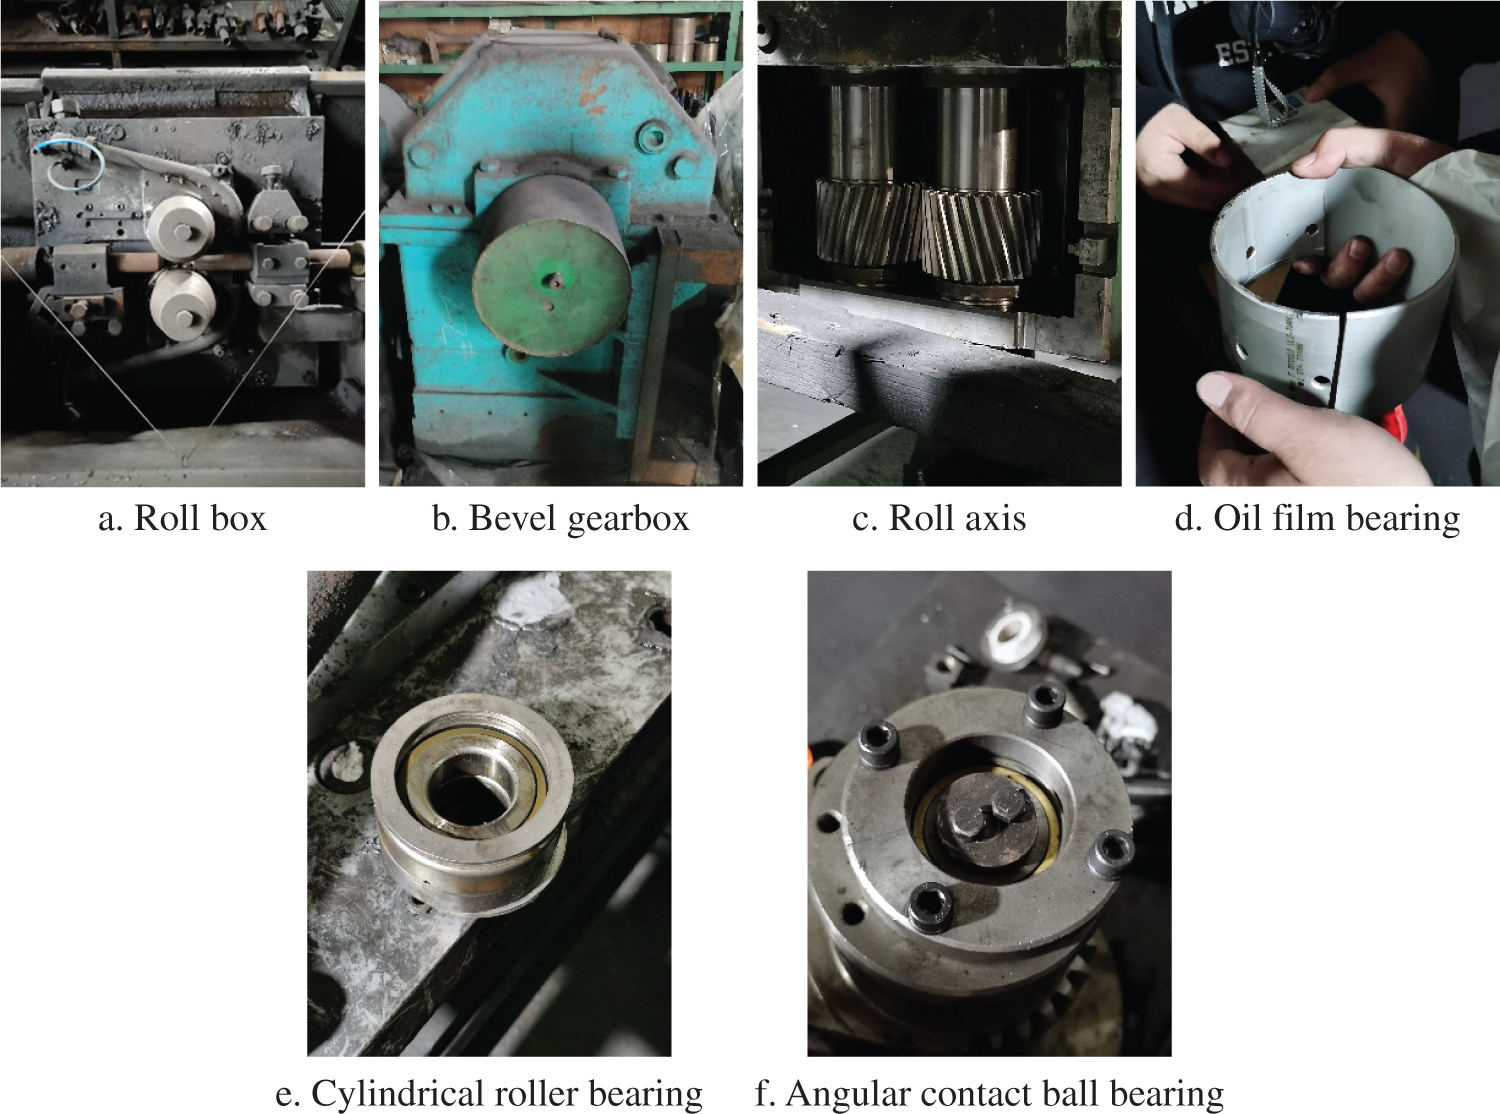
Figure 3: The components of high-speed wire rod finishing mills
In routine production of the rolling plant, the roll box and bevel gearbox are often shifted or regarded as repairing objects. They are major parts, also easily damaged parts in the finishing mill group. The roll box adopts an inserted structure with a cantilever roller ring. It is equipped with an eccentric sleeve mechanism to adjust the roll gap. There are oil film bearings and roll axis in the eccentric sleeve. And the roller ring is fixed with a tapered sleeve at the end of the cantilever roller axis. The bevel gearbox comprises box body, transmission shaft, spiral bevel gear pair, and synchromesh gear pair. All of them are hard tooth surface grinding gears with precision grade five, tooth surface modification, to ensure high speed and smooth operation. Fig. 4 describes the structure of the roller box and its sealing structure.

Figure 4: The structure of the roll box and its sealing structure
Fig. 5 shows the drive system diagram of 26# frame. It reflects the transmission relationship between the shaft, gear, and bearing. Therefore, it is the basis for obtaining component characteristic frequency calculation formulas. There are five transmission shafts, six oil film bearings, six high-precision gears, five angular contact ball bearings, and three cylindrical roller bearings. Among them, II axis, III axis, IV axis, V axis, VI axis represent transmission shaft. Z3, Z4, Z5, Z5, Z6, Z7, Z8 represent high precision gear. J, LB, Y represent angular contact ball bearings. HA, GA, G represent cylindrical roller bearings.
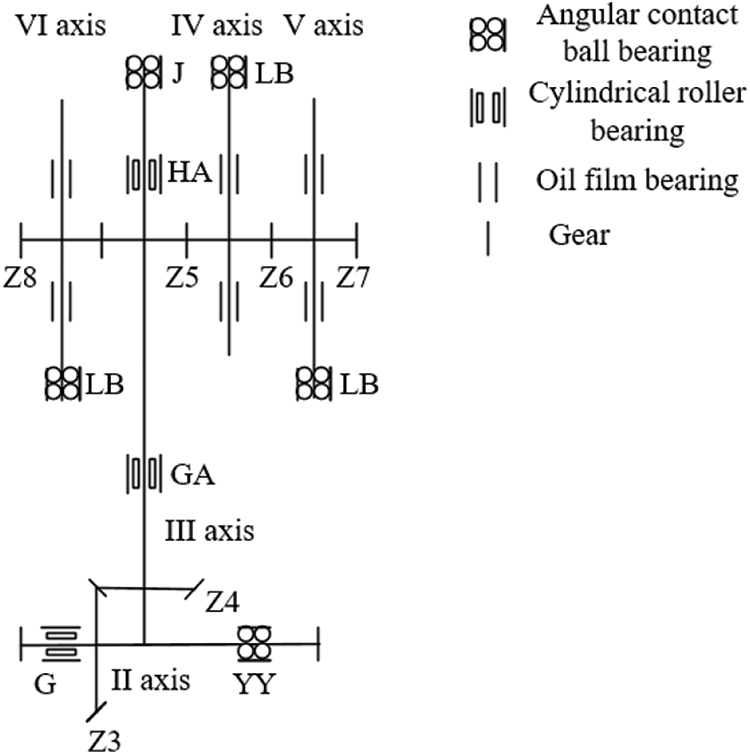
Figure 5: The drive system structure of the rolling mill frame
3 Expert Experience and Data-Driven Based Fault Diagnosis Method
Existing fault diagnosis methods can rarely be applied in actual production. In this section, a fault diagnosis method based on expert experience and data-driven is proposed for high-speed wire rod finishing mills. Based on the equipment transmission mechanism, the proposed method in this paper analyzes and calculates vibration data, and relies on expert experience to set the parameters and judgment criteria in the algorithm.
Fig. 6 consists of six parts, namely data acquisition, time domain analysis, frequency domain analysis, speed adjustment, frequency doubling and side frequency analysis, and fault location. Firstly, data is acquired from the wireless vibration sensor cloud server. Then, the virtual value, peak value, and kurtosis index are calculated and analyzed in the time domain. In the frequency domain, component characteristic frequency is calculated. And speed adjustment, frequency doubling analysis, and side frequency analysis are implemented. Finally, combining time and frequency domain characteristics with expert experience, the actual fault is located.
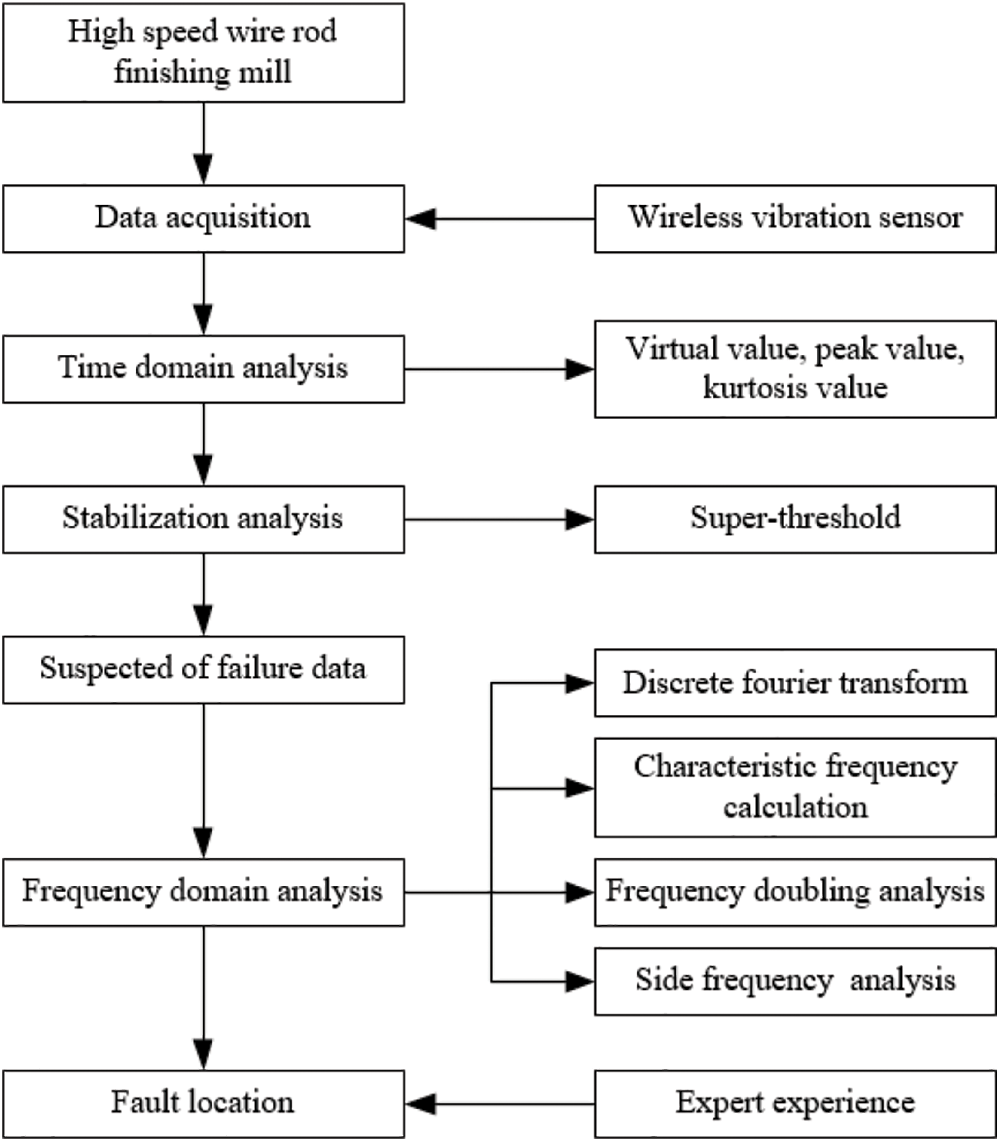
Figure 6: The flow chart of expert experience and data-driven based fault diagnosis method
Maintainers of steel rolling plants usually monitor equipment operation according to vibration signals. Fig. 7 shows the installation position of the wireless vibration sensor in the production field. This study uses a kind of wireless vibration sensor (iVS102) in Fig. 8. It is a Narrow Band Internet of Things (NB-IoT) vibration acquisition and analysis instrument specifically designed for industrial application. It supports the measurement acquisition of vibration acceleration, velocity, and displacement signals. Users can choose the sample interval, sample length, sample frequency, and signal type to complete the configurations of the sensor conveniently. Here are some configurations. The sample interval is 30 min. The sample length is 4096 data points. The sample frequency is divided into 1000, 8000, and 12000 Hz.
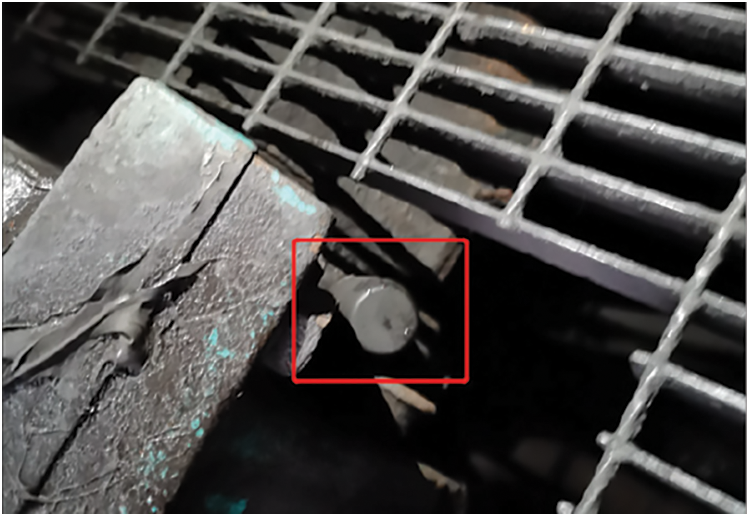
Figure 7: The installation position of wireless vibration sensor
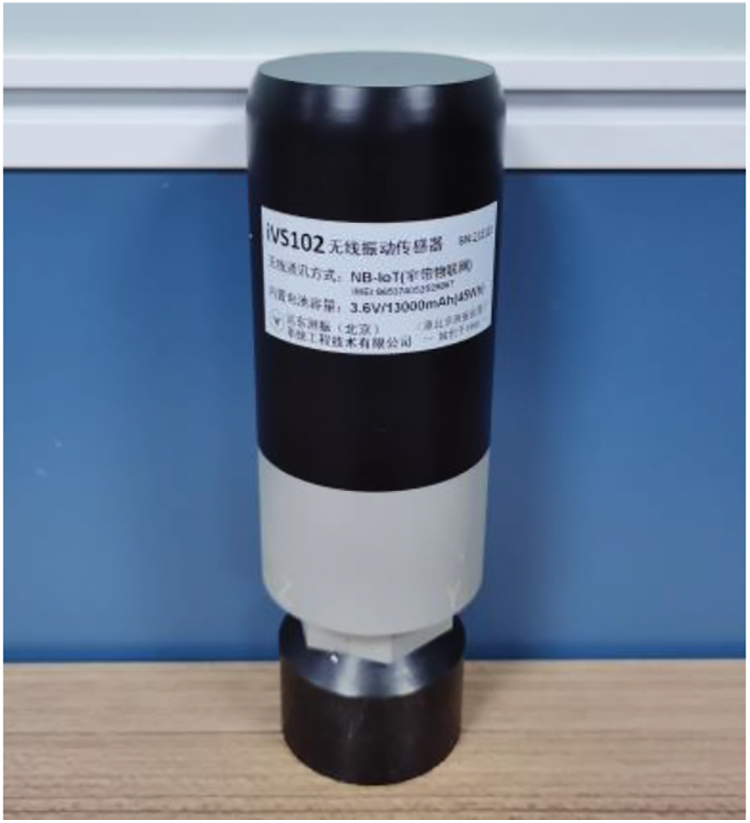
Figure 8: Wireless vibration sensor
As a method for preliminary judgment of equipment status, the purpose of time domain analysis is to extract vibration features from the time domain. According to expert experience, virtual value, peak value, and kurtosis value are chosen as time domain indexes and applied in the daily maintenance and repair.
Virtual value is the root mean square of the signal in a period. It characterizes the size of energy in the signal. And it is suitable for fault diagnosis of wear vibration amplitude slowly changing with time [26].
where,
Peak value is the maximum deviation of vibration to the equilibrium position. It reflects the maximum amplitude at a certain moment. And it is suitable for fault diagnosis of pitting damage with instantaneous impact [26].
where,
Kurtosis index represents the kurtosis of the distribution curve at the peak. In the analysis of mechanical vibration signals, kurtosis index can be used to describe the kurtosis or flatness of the signal waveform and analyze the energy distribution and frequency characteristics of the signal [26].
where,
3.3.1 Discrete Fourier Transform
The time domain signal collected on site must be discrete, and the data acquisition instrument with higher precision cannot sample without an interval in time. Discrete non-periodic time domain signals can be converted to continuous periodic frequency domain signals by Discrete Fourier Transform.
where,
3.3.2 Characteristic Frequency Calculation
The component characteristic frequency of high-speed wire rod finishing mills includes shaft rotation frequency, gear mesh frequency, and bearing characteristic frequency. And bearing characteristic frequency contains ball pass frequency inner race (BPFI), ball pass frequency outer race (BPFO), ball spin frequency (BSF), and fundamental train frequency (FTF). According to the equipment information table and system mechanism, the component characteristic frequency of each vibration data sample can be calculated in real time. Table 1 is the shaft characteristic information table. It includes the transmission shaft name, nickname, and frequency description. Table 2 is the gear characteristic information table. It includes gear name, symbol, tooth numbers, installation axis, and frequency description. Table 3 is bearing characteristic information table. It contains the bearing name, Parameter name (inner diameter, outer diameter, pitch diameter, number of rolling elements, diameter of rolling elements, and contact angle), value, installation axis, and frequency description.


According to the equipment drive system and component characteristic information, shaft rotation frequency, gear mesh frequency, and bearing characteristic can be obtained.
The calculation formulas of shaft rotation frequency are as follows:
where,
Take an angular contact ball bearing (162250Y) on II axis for example. The calculation formulas for bearing characteristic frequency are as follows:
where,
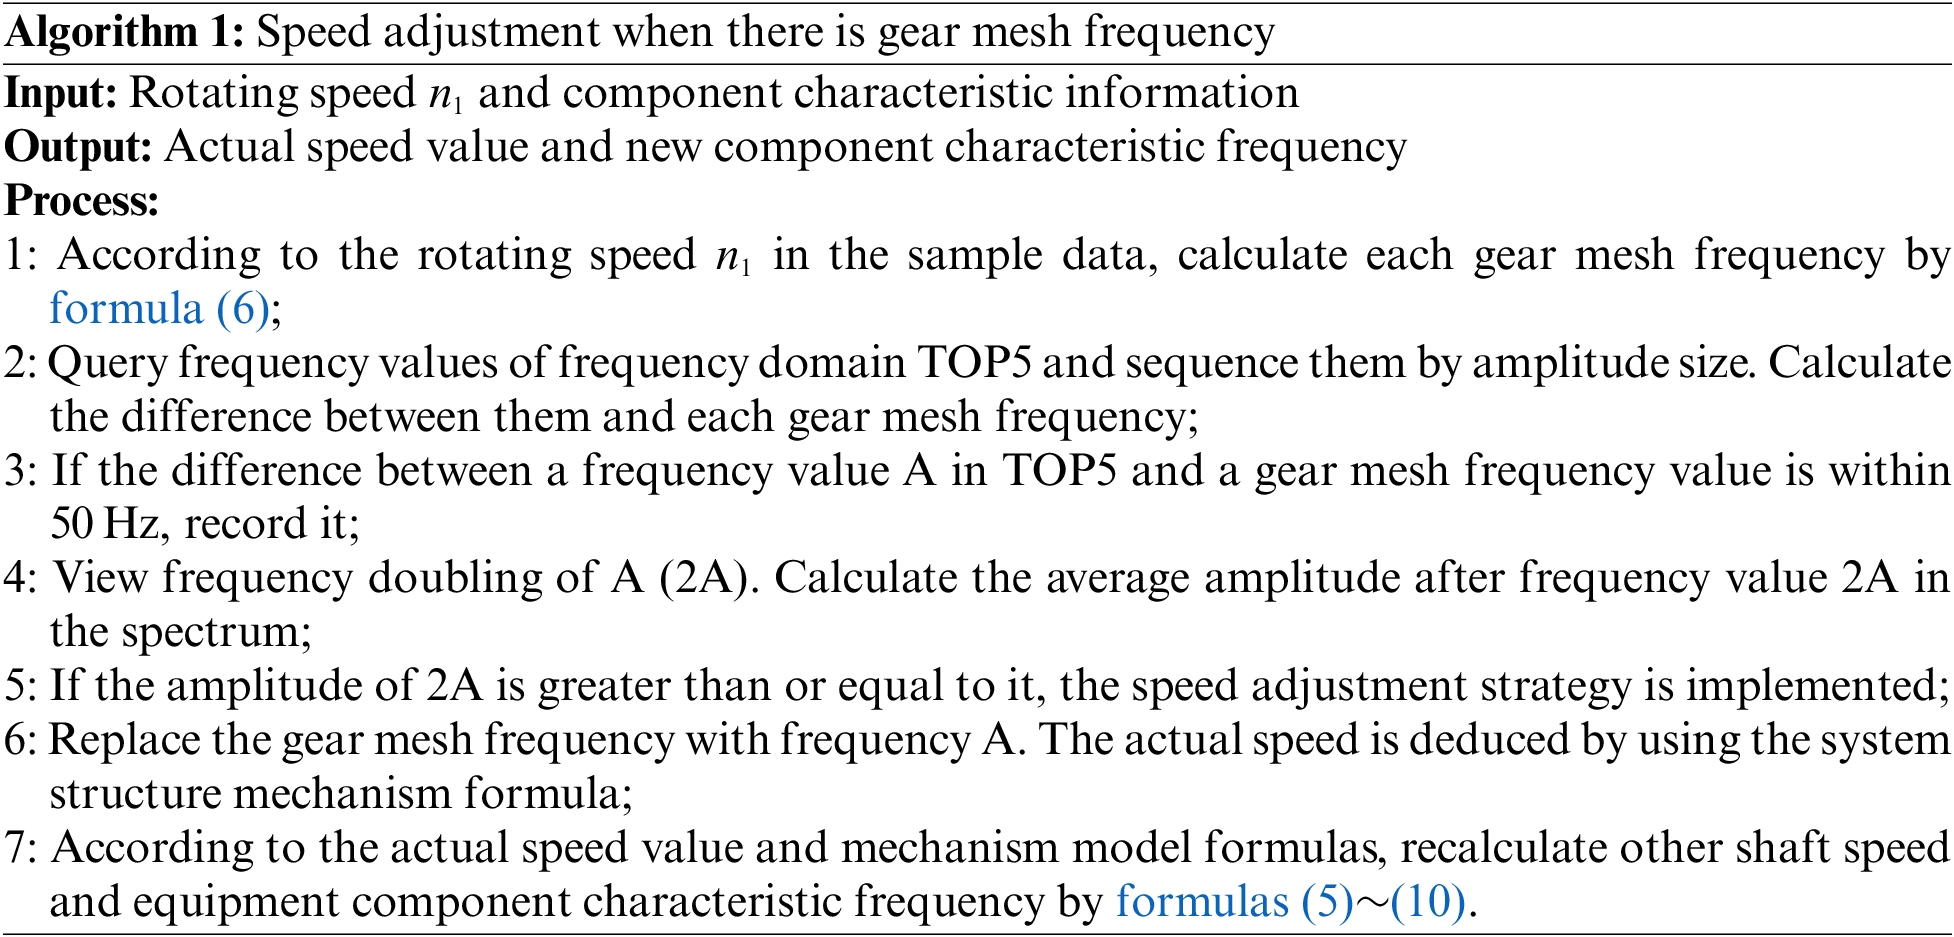
The speed value collected by the field sensor may have an error. Therefore, it needs to be automatically adjusted based on the field situation during fault detection. According to real-time operating parameters and environmental parameters of on-site equipment, corresponding speed adjustment is carried out. This technology can significantly improve the degree of automation and production efficiency of equipment, reduce dependence on manual intervention, and reduce labor costs and error rates. Fig. 9 shows the speed adjustment algorithm process. When there is gear mesh frequency, implement Algorithm 1.
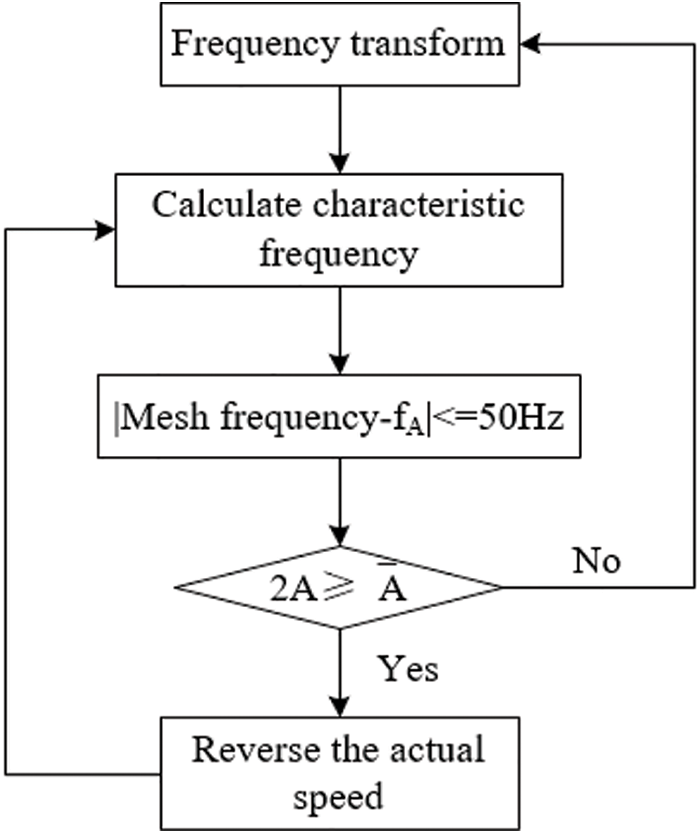
Figure 9: Speed adjustment algorithm process
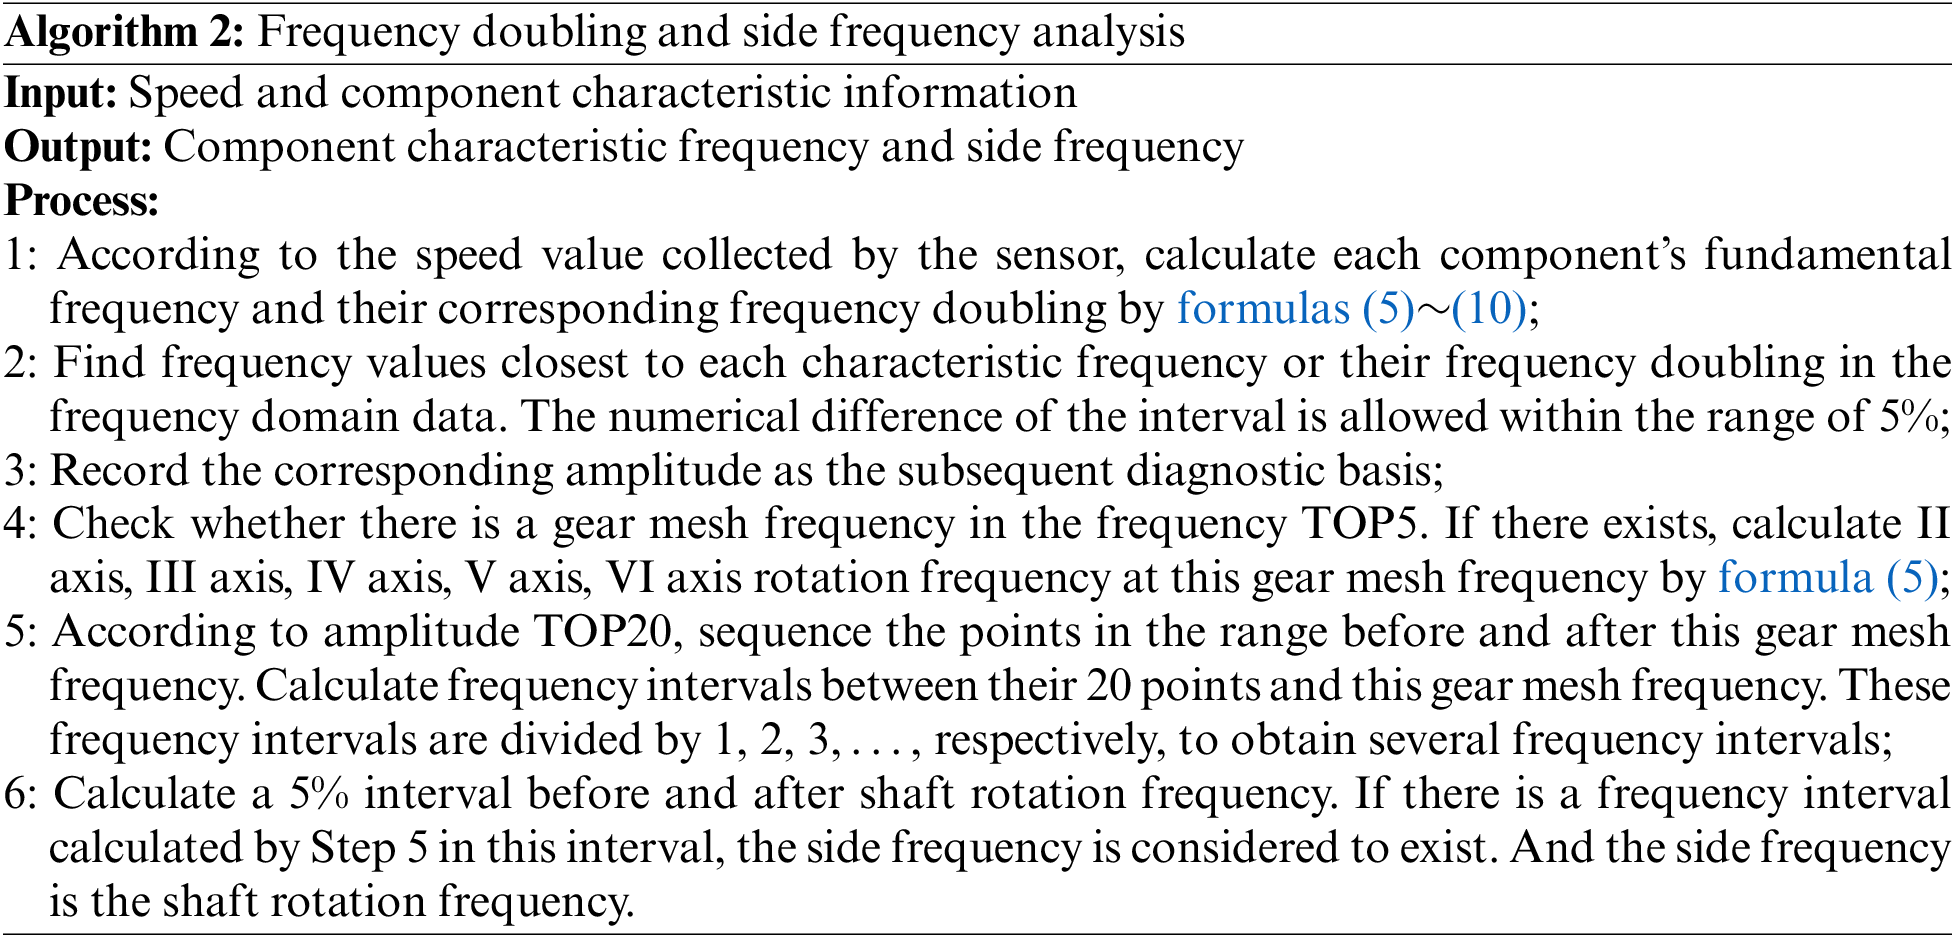
3.5 Frequency Doubling and Side Frequency Analysis
In this fault diagnosis method based on expert experience and data-driven, the fundamental frequency is shaft rotation frequency, gear mesh frequency, or bearing characteristic frequency. And frequency doubling is the multiple of the fundamental frequency. Based on frequency doubling analysis, judge whether side frequency exists on both sides of characteristic frequency. The mechanism of the sideband is that vibration of the gear mesh frequency is modulated by the gear rotation frequency. Fig. 10 shows the frequency doubling and side frequency analysis algorithm process.
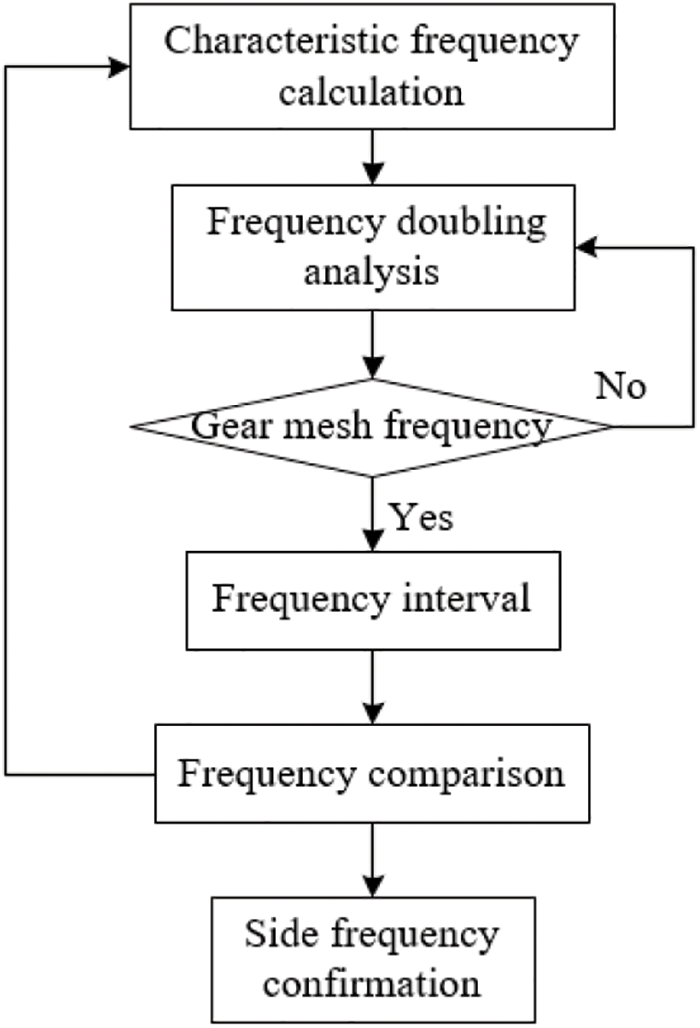
Figure 10: Frequency doubling and side frequency analysis algorithm process
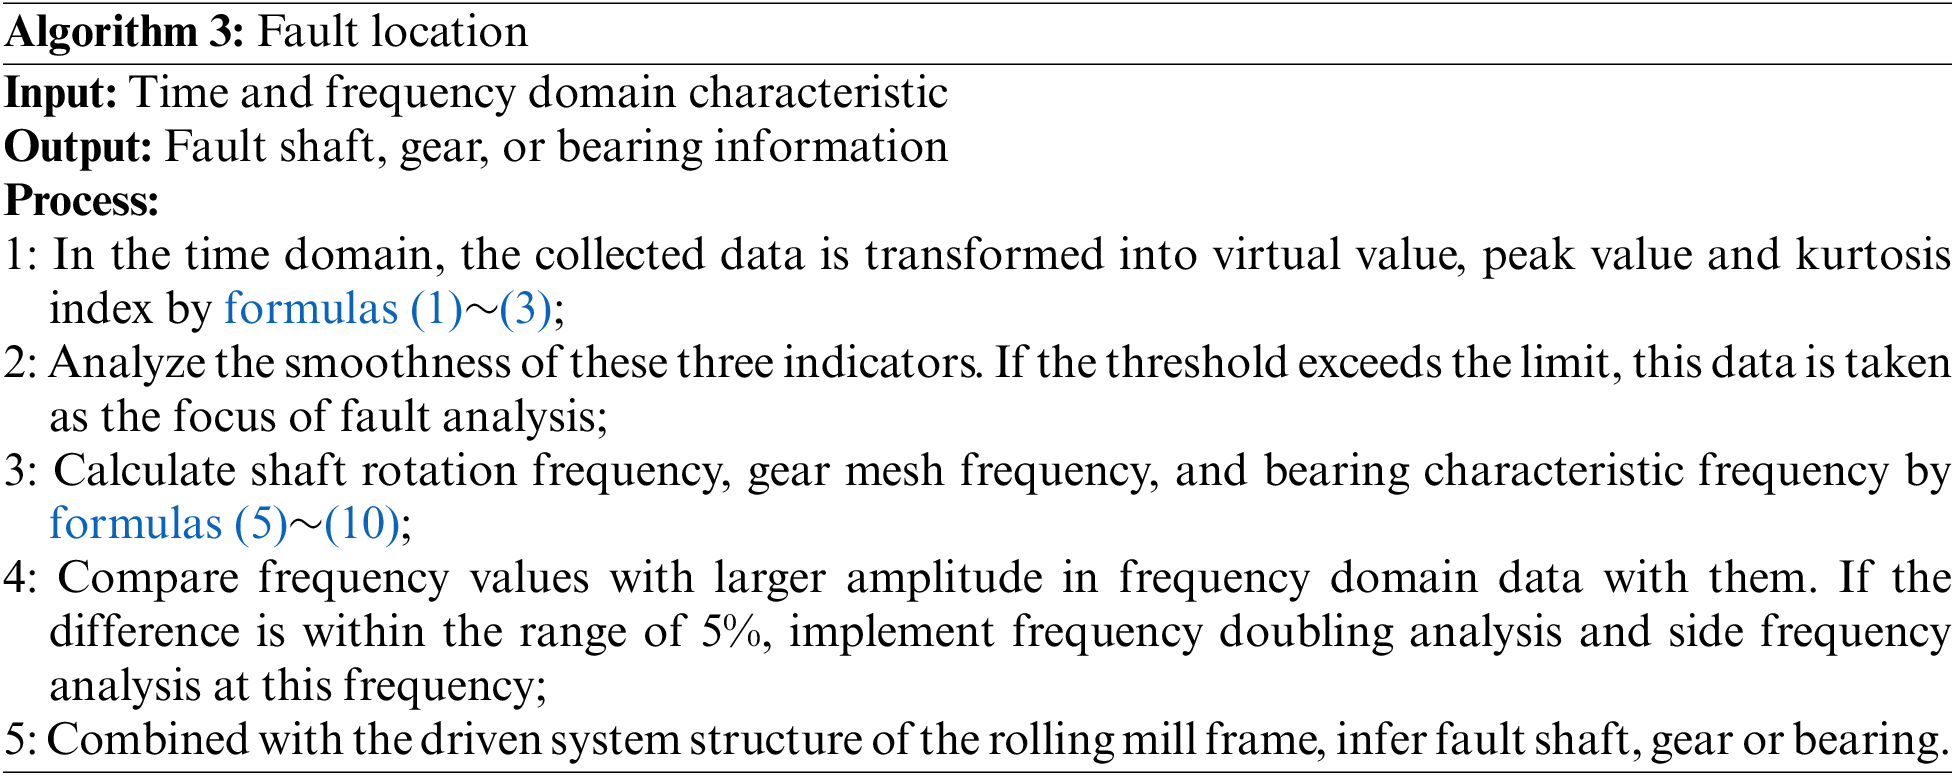
Fault location is a crucial issue under diagnosis framework. It is also an effective mean to guarantee safety production and obtain reliable product quality for industrial processes [27]. In the steel production field, a fault characteristic can lead to damage of different components. Fault location can provide an important maintenance basis for maintainers to avoid severe accidents.
4 Equipment Intelligent Diagnosis System
At present, most steel plants have only monitoring systems, relying on frequent maintenance and maintainers’ experience to reduce or avoid accidents. Some enterprises will hand over the monitoring data to professional analysts after the accident, and then their maintainers can get some guidance judgments for possible future faults. However, this simple manual judgment method has a large workload and low accuracy, and some complex situations are challenging to diagnose. As China’s industry begins to enter the 4.0 stage, the future manufacturing industry will inevitably develop toward intelligence and dehumanization. So it is necessary to develop equipment intelligent diagnosis systems. Fig. 11 shows the frame diagram of the equipment intelligent diagnosis system. It mainly consists of data source, database table design, and function design.
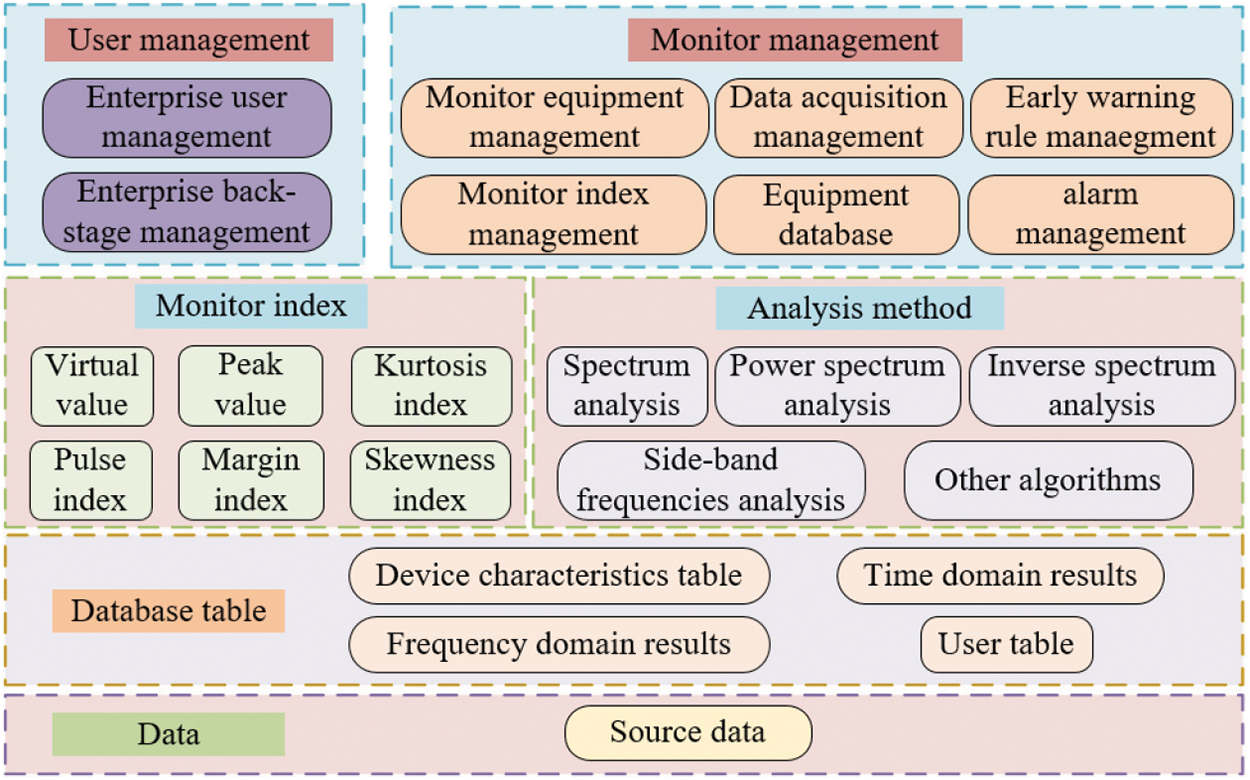
Figure 11: The frame diagram of the equipment intelligent diagnosis system
(1) Data source: The sensor directly has an NB-IoT module through China Mobile and China Unicom’s existing base stations to transmit data. Their base stations have supported the Internet of Things (IoT) spectrum and have wide network coverage. The data is received by the Aliyun IoT platform and stored in the Aliyun Internet platform. The data is transmitted and stored in the genealogy database by the NB-IoT network and OPC UA protocol in standard JSON format.
(2) Database table design: It is divided into source and calculated data. The source data includes a time domain table, part table, part parameter table, equipment classification table, and equipment table. The calculated data includes a spectrum table, sample analysis table, and characteristic frequency table.
(3) Function design: It comprises user management, monitor management, monitor index, and analysis method.
The parts of function design are as follows:
(1) User management: Enterprise user management, enterprise back-stage management;
(2) Monitor management: Monitor equipment management, data acquisition management, early warning rule management, monitor index management, equipment database, alarm management, etc.;
(3) Monitor index: Virtual value, peak value, kurtosis value, pulse index, margin index, skewness index, etc.;
(4) Analysis method: Spectrum analysis, power spectrum analysis, inverse spectrum analysis, side-band frequencies analysis, and other algorithms.
The 19–28# rolling mill is equipped with a wireless vibration sensor. One is on the input side of the increasing box. And three are on the output side of the increasing box. In Figs. 12, 14, vibration measuring points are monitored in real time on the steel site.
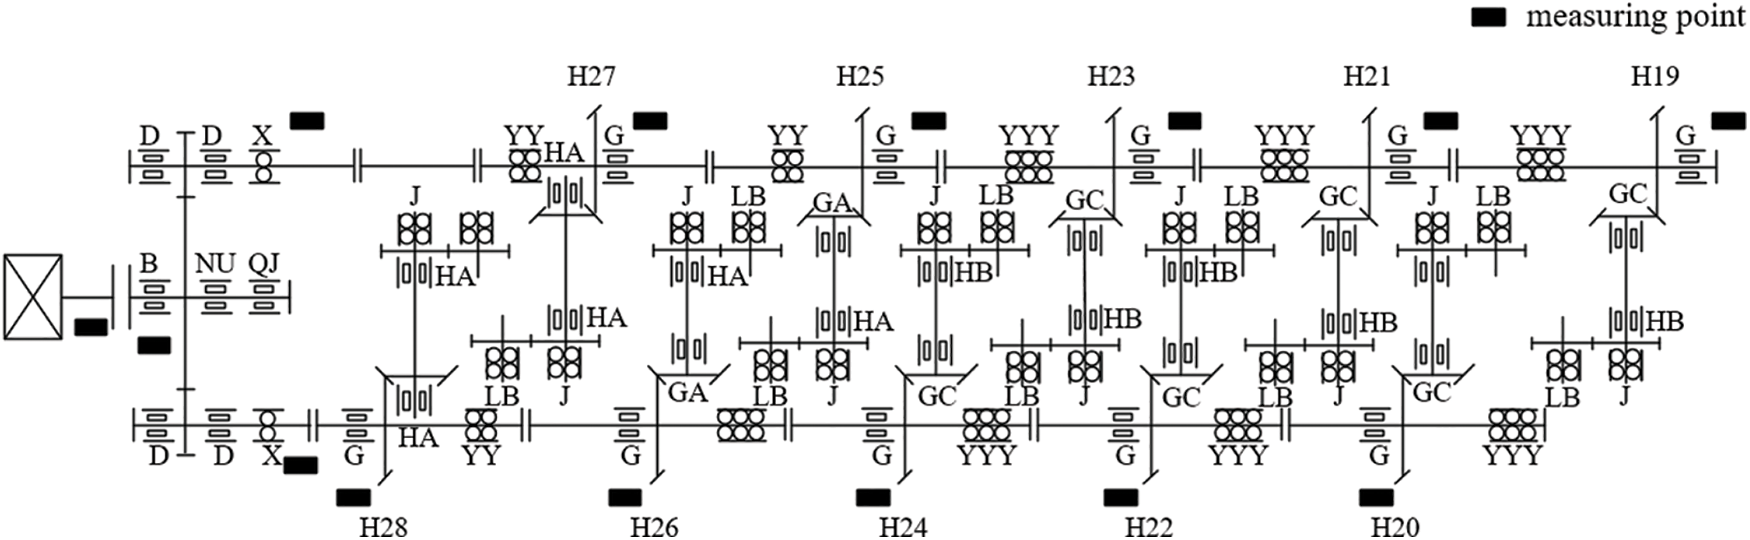
Figure 12: Measuring point distribution
Fig. 13 shows equipment intelligent diagnosis system network data flow. On-site monitoring equipment data is collected by NB sensor. NB base stations transmit with 4.5G signal. Then data is transmitted to the Aliyun IoT platform and finally stored to the Aliyun Internet platform. The fault diagnosis platform obtains data from the Aliyun IoT platform utilizing a subscription. After analysis and diagnosis, the platform sends alarm notifications to maintainers and realizes data interaction with the App and Web. Users can also download data from the Aliyun Internet platform on the App or Web.
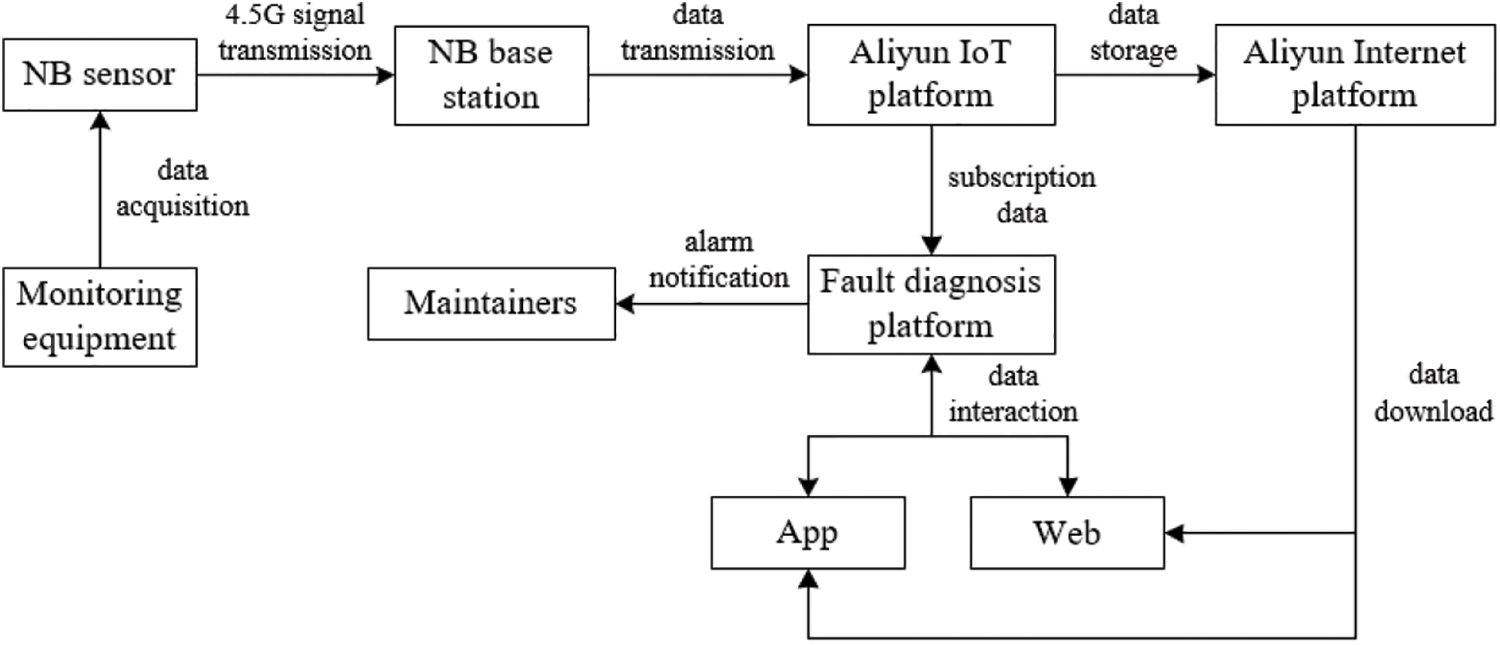
Figure 13: System network data flow
On February 11th, 2022, the high-speed wire rod finishing mill group was shut down for maintenance. Maintainer open bevel gearbox of 26# finishing mill. They find the broken bearing (cylindrical roller bearing, 162250HA) on the cone shaft. The situation of bearing damage includes cage fracture, inner ring wear, outer ring wear, and rolling element wear in Fig. 14.
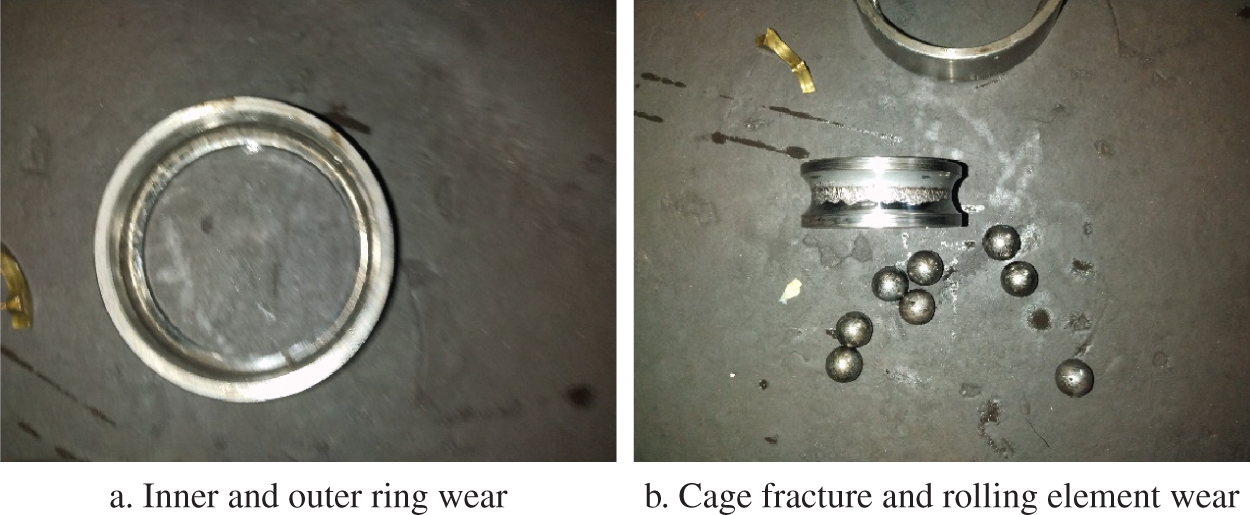
Figure 14: Broken bearing
5.3 Time Domain Characteristic
Vibration data of field equipment usually do not see abnormalities. Fig. 15 is a section of the on-site equipment vibration signal. Time domain transform and frequency domain transform can help to find equipment fault characteristics.
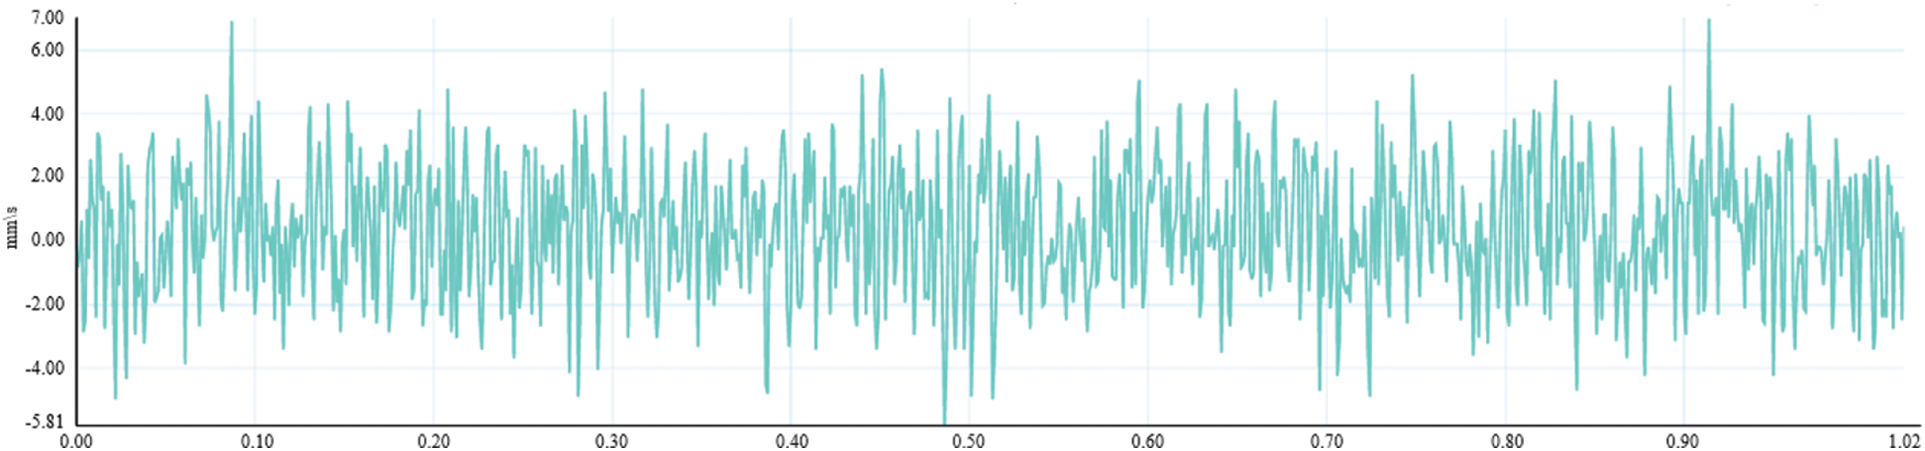
Figure 15: Raw vibration signal
This equipment’s intelligent diagnosis system transforms each section of vibration data in the time domain. Virtual value, peak value, and kurtosis index are calculated by formulas (1)∼(3). Figs. 16–18, respectively describe the distribution of virtual value, peak value, and kurtosis index of 26# finishing mill from January 11th to February 11th, 2022. From their pictures, there is no large fluctuation in virtual value, but peak value. Meanwhile, the kurtosis index has multiple shocks. Therefore, there may be fault characteristics in the frequency domain during the month.
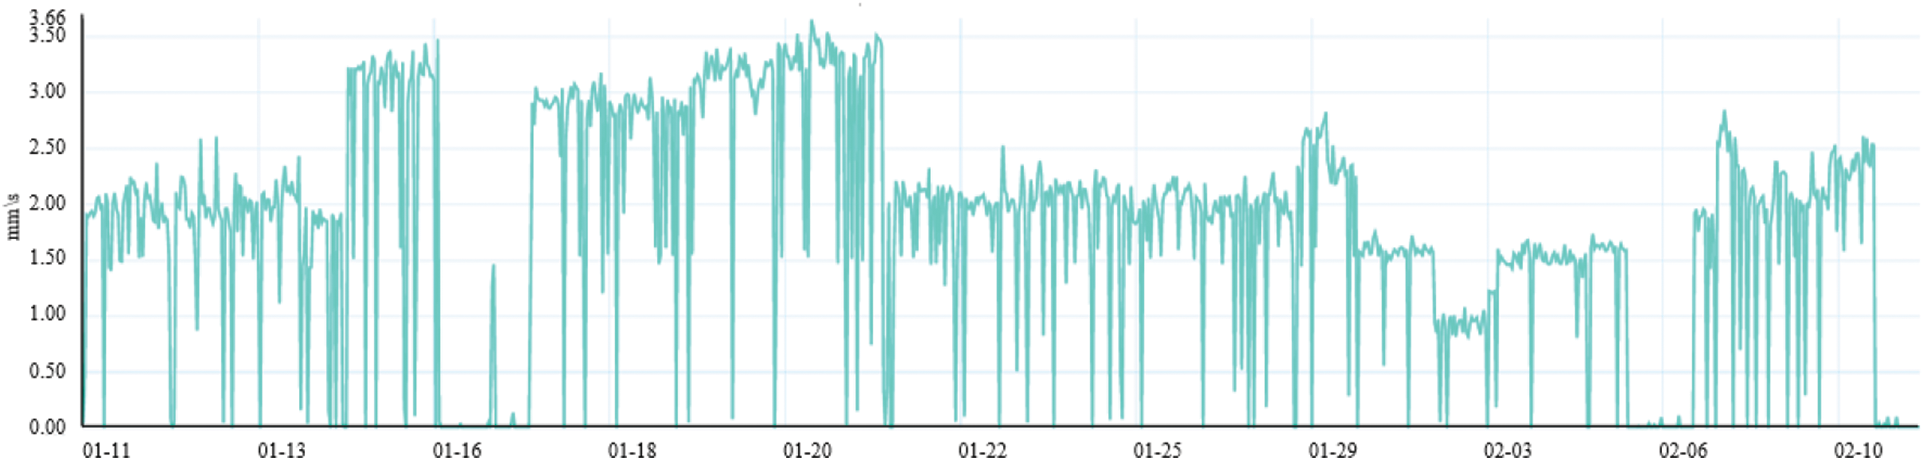
Figure 16: Virtual value distribution
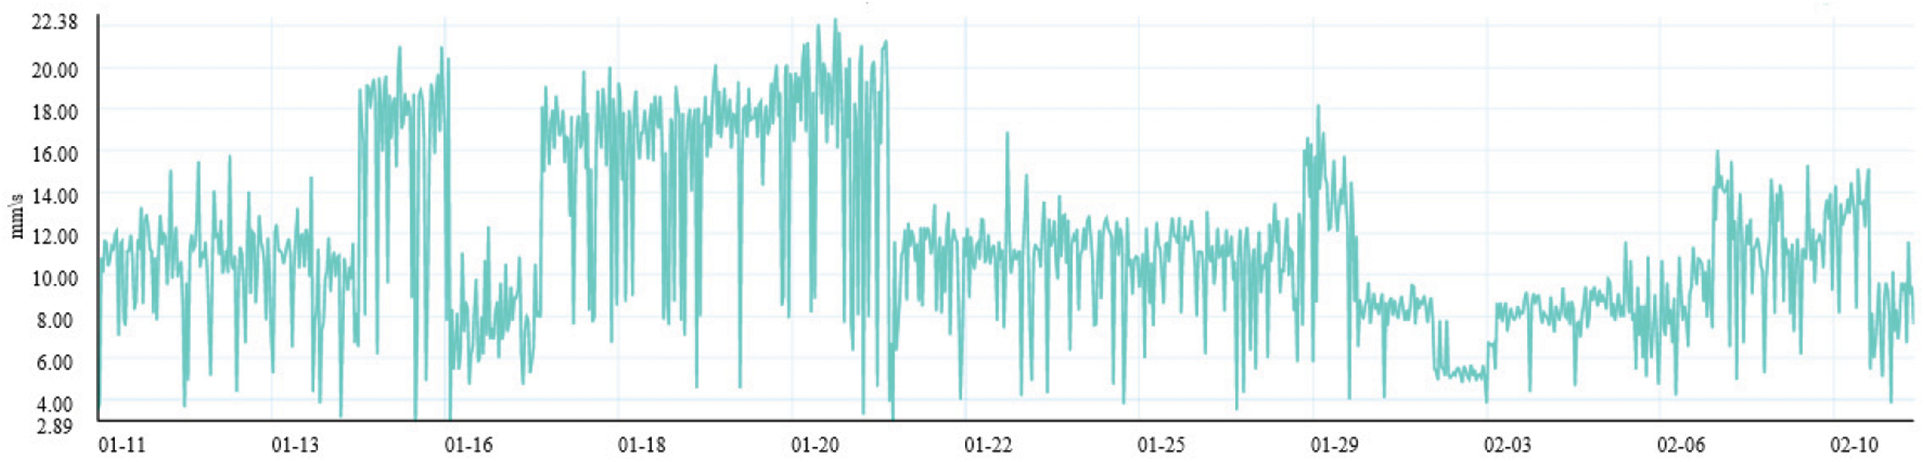
Figure 17: Peak value distribution
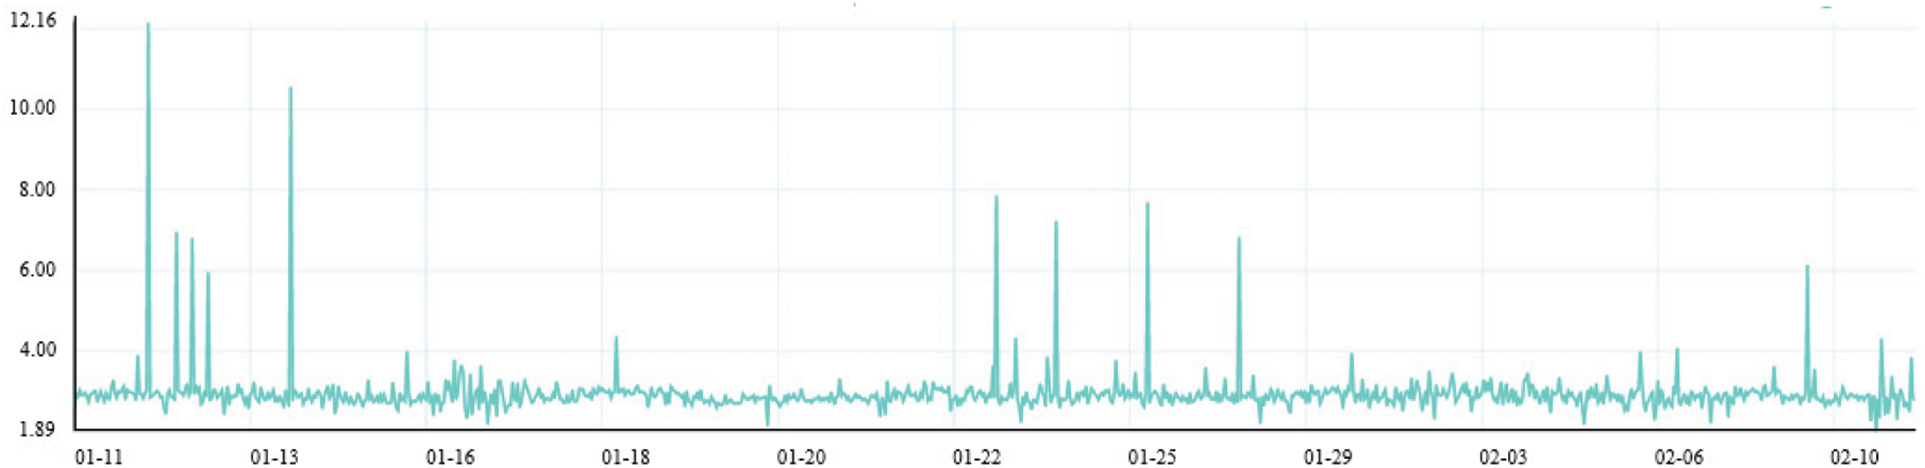
Figure 18: Kurtosis index distribution
5.4 Frequency Domain Characteristic
Aiming at this month’s data, the system performs frequency domain transform. In frequency doubling analysis, frequency values are closest to each characteristic frequency or their frequency doubling in the frequency domain data. The numerical difference of the interval is allowed within the range of 5%. In Fig. 19, there are fundamental frequencies and double frequency of gear mesh frequency of the cone shaft (III axis). The fundamental frequency is 2789.06 Hz, and the dual frequency is 5575.2 Hz. But the values of them are low.
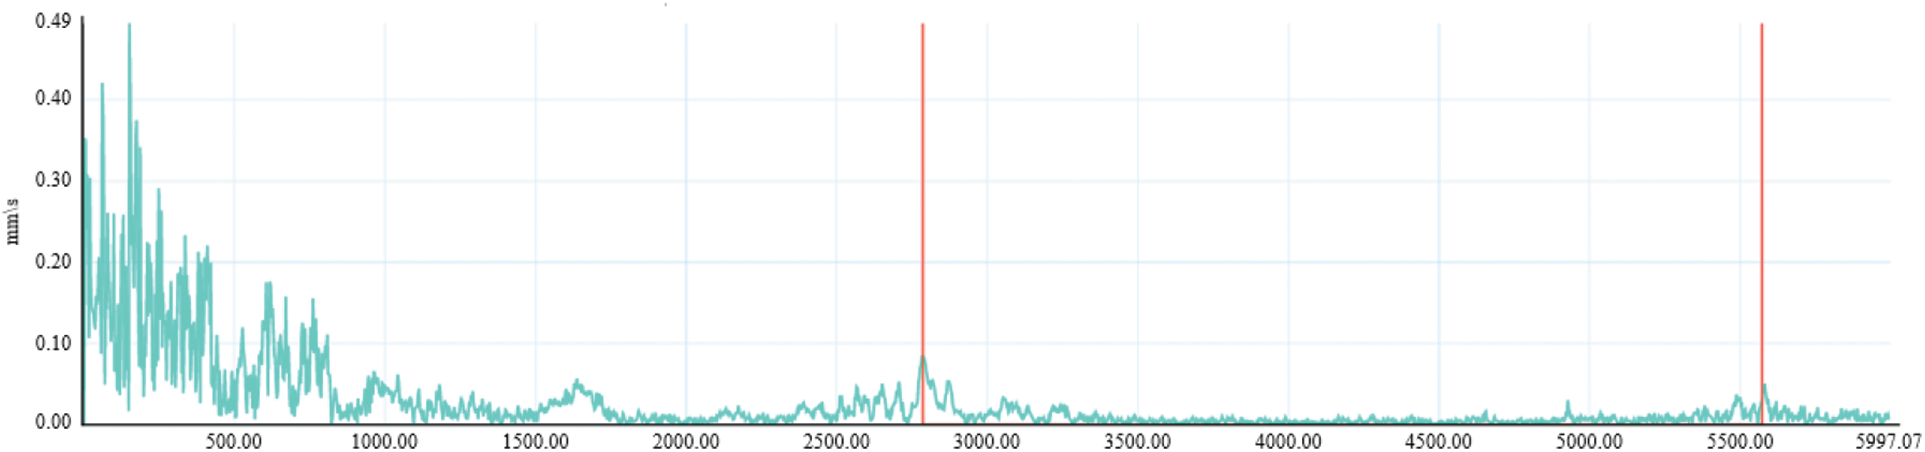
Figure 19: Spectrogram of 26# finishing mill at 12000 sampling frequency
In Fig. 20, there is the gear mesh frequency of the cone shaft (III axis) again. Then, speed adjustment is implemented. There is A frequency value meeting the conditions in Algorithm 1. The gear mesh frequency is replaced with the frequency A. The actual speed is deduced by using the formula (6). The speed value collected by the sensor is 1125 rpm. After speed adjustment, the actual speed value is 1149.04 rpm. Besides, side frequency analysis is carried out. There is an equally spaced side band on both sides of the gear mesh frequency of III axis. The interval is about 90 Hz. According to the calculation by formulas (5)∼(10), it belongs to the rotation frequency of the cone shaft. The value is 2812.5 Hz.
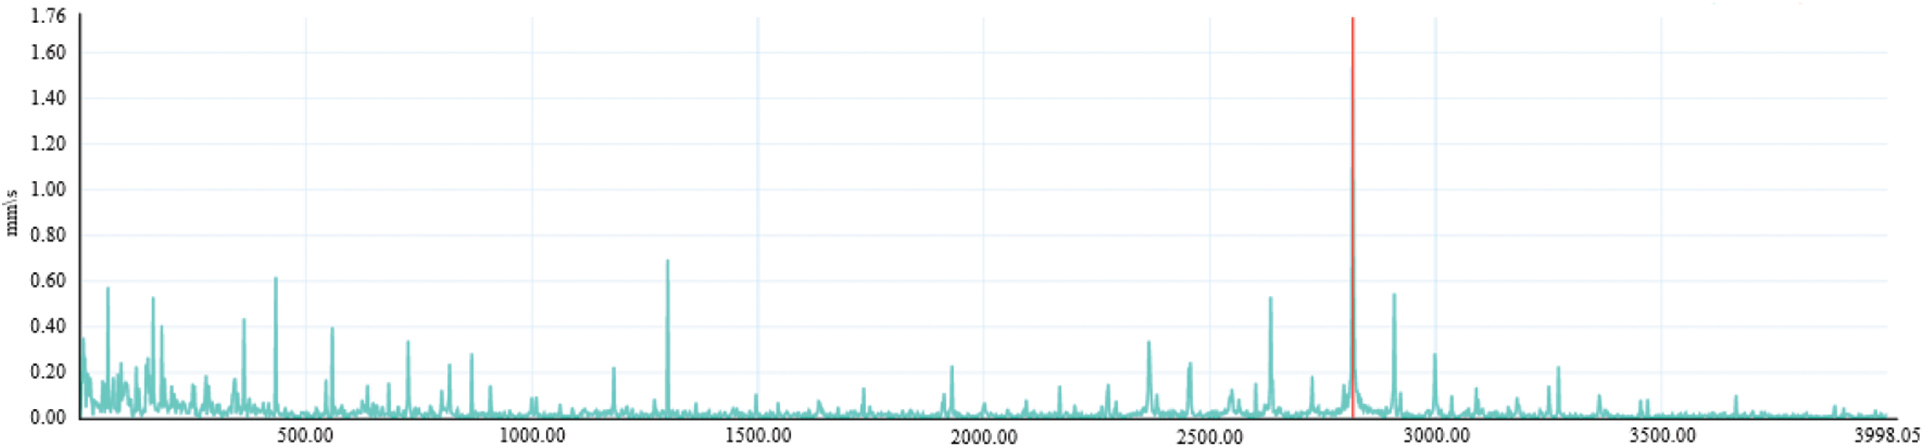
Figure 20: Spectrogram of 26# finishing mill at 8000 sampling frequency
Combining time domain and frequency domain characteristics, the result in Fig. 21 represents the gear mesh frequency of the cone shaft and its side frequency. It is consistent with cone shaft bearing damage on site.
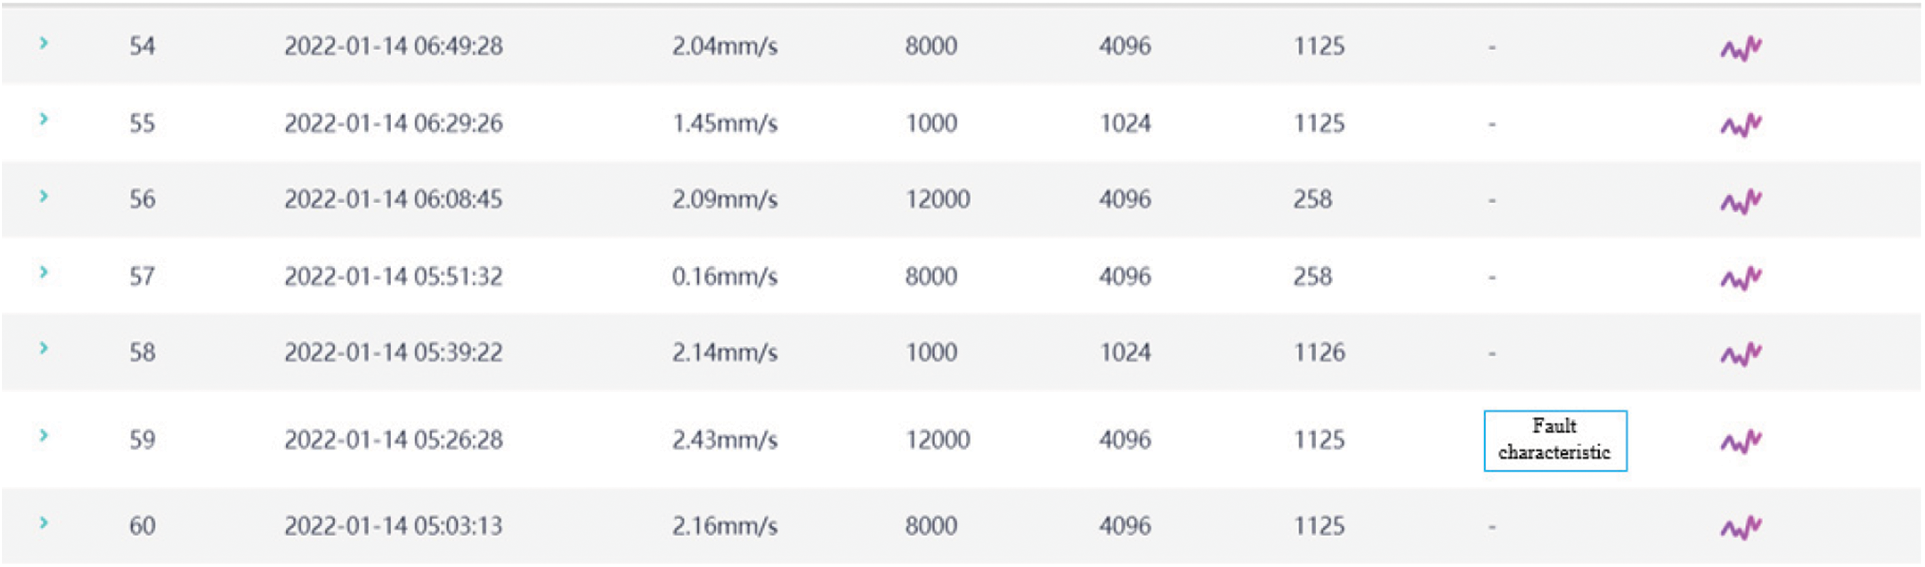
Figure 21: Fault characteristic record in the system
First, this paper analyzes the drive system of high-speed wire rod finishing mills. Then, aiming at the complexity of fault location and difficulty of real-time diagnosis in system-level fault diagnosis, an expert experience and data-driven-based hybrid fault diagnosis method for high-speed wire rod finishing mills is proposed in this work. According to the equipment transmission mechanism, the proposed method analyzes and calculates vibration data and relies on expert experience to set the parameters and judgment criteria in the algorithm. Finally, this paper uses a single equipment failure on site as an example for validation. The gear fault characteristic can be found one month in advance. It provides a practical and feasible choice of engineering application. However, sometimes there may be false alarms for complex problems. Besides, its adaptive ability needs to be improved. Future work will focus on solving them.
Acknowledgement: The authors would desire to express their gratitude to the equipment maintenance personnel and management personnel of Lengshuijiang Iron and Steel Co., Ltd., in Hunan Province. They provide research site and equipment parameters.
Funding Statement: This work was supported in part by the National Key Research and Development Program of China under Grant 2021YFB3301300; in part by the National Natural Science Foundation of China under Grant 62203213; in part by the Natural Science Foundation of Jiangsu Province under Grant BK20220332; and in part by the Open Project Program of Fujian Provincial Key Laboratory of Intelligent Identification and Control of Complex Dynamic System under Grant 2022A0004.
Author Contributions: The authors confirm their contribution to the paper as follows: study conception and design: C. W., N. T., Q. Z., and L. G.; data collection: N. T., L. G., and H. Y.; analysis and interpretation of results: C. W., N. T., and H. Y.; draft manuscript preparation: C. W., N. T. All authors reviewed the results and approved the final version of the manuscript.
Availability of Data and Materials: The data comes from the actual data of the enterprise site. If readers want to access the data, please contact with the authors.
Conflicts of Interest: The authors declare that they have no conflicts of interest to report regarding the present study.
References
1. Xu, X. (2021). Research on fault diagnosis and treatment measures for steel rolling machinery equipment. Machining and Application, 10, 97–98. [Google Scholar]
2. Xie, X., Li, W., Fu, W., Xie, F., Yan, B. (2020). Development of on-line monitoring and diagnosis system for rolling mill equipment status. Metallurgical Industry Automation, 44(6), 35–42. [Google Scholar]
3. Tang, W., An, H. (2018). Analysis of current situation and development trends of fault diagnosis for steel rolling equipment. Science and Technology Innovation Herald, 15(4), 36–37. [Google Scholar]
4. Li, W., Zhang, J. (2011). Application for fault diagnosis system of gearbox of rolling mill based on LabVIEW and MATLAB. Machinery Design and Manufacture, 4, 71–73. [Google Scholar]
5. Yang, J., Feng, L., Liu, F., Guo, D. (2015). High-speed wire mill gearbox fuzzy diagnosis. Machinery Design & Manufacture, 7, 20–22+26. [Google Scholar]
6. Zhang, H., Ren, X. (2016). Application of EMD and energy operator demodulation in rolling mill gearbox fault diagnosis. Inner Mongolia Science Technology & Economy, 23, 87–90. [Google Scholar]
7. Wang, C., Liu, T., Ren, X., Zhang, H., Ren, X. (2018). Application of the dual tree complex wavelet transform and minimum entropy deconvolution in incipient fault diagnosis of the gear box. Journal of Mechanical Strength, 40(2), 280–286. [Google Scholar]
8. Ravikumar, K. N., Yadav, A., Kumar, H., Gangadharan, K. V., Narasimhadhan, A. V. (2021). Gearbox fault diagnosis based on multi-scale deep residual learning and stacked LSTM model. Measurement, 186, 110099. [Google Scholar]
9. Miao, M., Sun, Y., Yu, J. (2022). Deep sparse representation network for feature learning of vibration signals and its application in gearbox fault diagnosis. Knowledge-Based Systems, 240, 108116. [Google Scholar]
10. Li, Y., Du, X., Wang, X., Si, S. (2022). Industrial gearbox fault diagnosis based on multi-scale convolutional neural networks and thermal imaging. ISA Transactions, 129, 309–320 [Google Scholar] [PubMed]
11. Li, X., Zhong, X., Shao, H., Han, T., Shen, C. (2021). Multi-sensor gearbox fault diagnosis by using feature-fusion covariance matrix and multi-riemannian kernel ridge regression. Reliability Engineering and System Safety, 216, 108018. [Google Scholar]
12. Chen, Z., Na, Z., Yang, H., Dong, F., Xiao, Y. (2018). Vibration feature extraction of roll wear based on EEMD and adaptive filtering. Journal of Electronic Measurement and Instrumentation, 32(1), 40–47. [Google Scholar]
13. Li, H., Gao, F. (2019). Research on application of stress wave technology in mechanical fault diagnosis of rolling mill unit. Process Automation Instrumentation, 40(7), 60–63. [Google Scholar]
14. Luo, H., Li, K., Kaynak, O., Yin, S., Zhao, H. (2020). A robust data-driven fault detection approach for rolling mills with unknown roll eccentricity. IEEE Transactions on Control Systems Technology, 28(6), 2641–2648. [Google Scholar]
15. Shi, P., Yu, Y., Gao, H., Hua, C. (2022). A novel multi-source sensing data fusion driven method for detecting rolling mill health states under imbalanced and limited datasets. Mechanical Systems and Signal Processing, 171, 108903. [Google Scholar]
16. Yu, Y., Shi, P., Tian, J., Xu, X., Hua, C. (2023). Rolling mill health states diagnosing method based on multi-sensor information fusion and improved DBNs under limited datasets. ISA Transactions, 134, 529–547 [Google Scholar] [PubMed]
17. Shi, P., Gao, H., Yu, Y., Xu, X., Han, D. (2022). Intelligent fault diagnosis of rolling mills based on dual attention-guided deep learning method under imbalanced data conditions. Measurement, 204, 111993. [Google Scholar]
18. Jiang, B., Chen, H., Yi, H., Lu, N. (2020). Data-driven fault diagnosis for dynamic traction systems in high-speed trains. Scientia Sinica Informationis, 50(4), 496–510. [Google Scholar]
19. Kouadri, A., Hajji, M., Harkat, M. F., Abodayeh, K., Mansouri, M. et al. (2020). Hidden Markov model based principal component analysis for intelligent fault diagnosis of wind energy converter systems. Renewable Energy, 150, 598–606. [Google Scholar]
20. Yan, X., Liu, Y., Xu, Y., Jia, M. (2021). Multichannel fault diagnosis of wind turbine driving system using multivariate singular spectrum decomposition and improved Kolmogorov complexity. Renewable Energy, 170, 724–748. [Google Scholar]
21. He, Z., Shao, H., Zhong, X., Yang, Y., Cheng, J. (2020). An intelligent fault diagnosis method for rotor-bearing system using small labeled infrared thermal images and enhanced CNN transferred from CAE. Advanced Engineering Informatics, 46, 101150. [Google Scholar]
22. Yan, X., Zhang, C. A., Liu, Y. (2021). Multi-branch convolutional neural network with generalized shaft orbit for fault diagnosis of active magnetic bearing-rotor system. Measurement, 171, 108778. [Google Scholar]
23. Patil, S. M., Malagi, R. R., Desavale, R. G., Sawant, S. H. (2022). Fault identification in a nonlinear rotating system using dimensional analysis (DA) and central composite rotatable design (CCRD). Measurement, 200, 111610. [Google Scholar]
24. Nguyen, T. N., Ponciroli, R., Bruck, P., Esselman, T. C., Rigatti, J. A. et al. (2022). A digital twin approach to system-level fault detection and diagnosis for improved equipment health monitoring. Annals of Nuclear Energy, 170, 109002. [Google Scholar]
25. Zhao, H., Lu, N., Jiang, B. (2011). Current situation and future trends of fault diagnosis methods for steel rolling processes. Steel Rolling, 28(2), 48–53. [Google Scholar]
26. Gao, L., Zhang, J., Cui, L. (2005). Analysis on time frequency feature of typical faults in high speed wire rolling mill. Iron and Steel, 40(9), 41–44. [Google Scholar]
27. Ma, L., Peng, K., Dong, J. (2022). Review of root cause diagnosis and propagation path identification techniques for faults in industrial processes. Acta Automatica Sinica, 48(7), 1650–1663. [Google Scholar]
Cite This Article
 Copyright © 2024 The Author(s). Published by Tech Science Press.
This work is licensed under a Creative Commons Attribution 4.0 International License , which permits unrestricted use, distribution, and reproduction in any medium, provided the original work is properly cited.
 Downloads
 Citation Tools