
 Submit a Paper
 Propose a Special lssue
 Open Access
ARTICLE
A Hybrid Classification and Identification of Pneumonia Using African Buffalo Optimization and CNN from Chest X-Ray Images
1 Computer Science Department, Community College, King Saud University, Riyadh, 11437, Saudi Arabia
2 Information System Department, Faculty of Computers and Information, Assiut University, Assiut, Egypt
3 Mathematics Department, Faculty of Science, Al-Azhar University, Cairo, Egypt
4 Cyber Technology Institute (CTI), De Montfort University, Leicester, UK
* Corresponding Author: Nasser Alalwan. Email:
(This article belongs to the Special Issue: Intelligent Biomedical Image Processing and Computer Vision)
Computer Modeling in Engineering & Sciences 2024, 138(3), 2497-2517. https://doi.org/10.32604/cmes.2023.029910
Received 14 March 2023; Accepted 01 August 2023; Issue published 15 December 2023
 View Full Text
 Download PDF
Abstract
An illness known as pneumonia causes inflammation in the lungs. Since there is so much information available from various X-ray images, diagnosing pneumonia has typically proven challenging. To improve image quality and speed up the diagnosis of pneumonia, numerous approaches have been devised. To date, several methods have been employed to identify pneumonia. The Convolutional Neural Network (CNN) has achieved outstanding success in identifying and diagnosing diseases in the fields of medicine and radiology. However, these methods are complex, inefficient, and imprecise to analyze a big number of datasets. In this paper, a new hybrid method for the automatic classification and identification of Pneumonia from chest X-ray images is proposed. The proposed method (ABO-CNN) utilized the African Buffalo Optimization (ABO) algorithm to enhance CNN performance and accuracy. The Weinmed filter is employed for pre-processing to eliminate unwanted noises from chest X-ray images, followed by feature extraction using the Grey Level Co-Occurrence Matrix (GLCM) approach. Relevant features are then selected from the dataset using the ABO algorithm, and ultimately, high-performance deep learning using the CNN approach is introduced for the classification and identification of Pneumonia. Experimental results on various datasets showed that, when contrasted to other approaches, the ABO-CNN outperforms them all for the classification tasks. The proposed method exhibits superior values like 96.95%, 88%, 86%, and 86% for accuracy, precision, recall, and F1-score, respectively.Keywords
Pathogens including viruses, bacteria, and fungus can bring on lung infection known as pneumonia. Everyone can experience it, including healthy and young individuals. Children, individuals with various illnesses, individuals with compromised immune systems, older people, individuals hospitalized and have been put on ventilation, individuals with chronic illnesses like asthmatic, and smokers face life-threatening situations [1]. The consequences of viral pneumonia develop more progressively. However, diagnosis may be challenging if bacterial illness and viral pneumonia appear simultaneously. The consequences of bacterial pneumonia, on the other hand, might present steadily or even abruptly, particularly in youngsters, and are more serious [2]. This pneumonia damages a sizable portion of the lungs and can potentially spread to several lung lobes. A patient has to be hospitalized if many lung lobes are impacted. Fungal pneumonia seems to be another type of pneumonia that can affect those with weakened immune systems. The patient needs time to recover from this sort of pneumonia, which has the potential to be deadly [3]. Research must be conducted to reduce child mortality in underdeveloped countries, and new techniques must be developed quickly.
Chest radiography analysis is necessary for illness diagnosis and therapy in medicine. Following the Centre for Definitive and Curative Medicine (CDCM), around 1.8 million US adults receive hospital treatment yearly for pneumonia, and approximately 60,000 Americans died in 2016 [4]. Chronic obstructive pulmonary disease is the main cause of death in the USA; by 2021, this number is expected to rise. According to the World Health Organization (WHO), it is among the main reasons for death for children under the age of five globally, killing approximately 1.5 million, or roughly 19% of all pediatric fatalities globally. More than 90% of all new pediatric pneumonia diagnoses occur in developing nations with limited access to healthcare. Therefore, creating affordable and reliable pneumonia diagnoses is necessary [5].
Clinicians use various imaging techniques, such as computerized tomography, and chest X-rays, to detect pneumonia. A chest radiograph is the most commonly utilized technology for detecting pneumonia globally because of its minimal price and accessibility [6]. One of the most complicated jobs confronted by research groups is classifying pneumonia’s subcategories: Viral Pneumonia (VP) and Bacterial Pneumonia (BP), where VP demands emotional support and various medication processes for rehabilitation while BP necessitates antibiotics treatment. Radiologists with the appropriate training have historically classified and identified pneumonia [7]. Because pneumonia may sometimes be undetected by the human eye in situations referred to as false positives, it is highly usual for radiologists to make a mistake. In other instances, radiologists could declare an individual to have pneumonia when they do not. However, people need specialized expertise and knowledge to correctly examine X-ray images. Because of this, diagnosing pneumonia by viewing X-ray images can be laborious and inaccurate. The cause is that several different medical diseases, like lung cancer, too much fluid, etc., can produce comparable image opacities [8]. Consequently, it is quite essential to analyze images accurately. The ability of computers to perform complex calculations is well known, and creating a model for identifying pneumonia causes in clinical imaging can help in the more precise interpretation of X-ray images. For radiology professionals, X-ray image processing is one of the most time-consuming and important responsibilities. To evaluate X-ray images, academics have suggested several computer techniques. Additionally, several computer-assisted diagnostic tools have been created to offer an understanding of X-ray images [9]. The aforementioned information clarifies that creating affordable and reliable pneumonia diagnoses is necessary. Therefore, to make the pneumonia diagnosis procedure simpler, a deep learning technique was created in this study.
Deep learning research on illness detection and prediction has lately been intensively pursued in Computer-Assisted Diagnosis (CAD) and has shown promising results in several medical specialties. In medicine, especially radiology, it was effective [10]. Although CAD cannot take the position of medical specialists, it could be employed as an adjunct tool to help them save energy and time. Instead of being applied to diagnose pneumonia, computer-aided diagnosis can enhance the reliability and accuracy of a special diagnosis when utilized as a decision support system. The major processes in CAD systems include image pre-processing, identifying areas of interest and associated characteristics, and classifying the illness based on its characteristics. Rapid advancements in machine learning create new possibilities for developing CADs powered by artificial intelligence (AI) in healthcare settings [11]. The primary factor influencing Deep Learning’s (DL) great performance is neural networks’ aptitude for understanding high-level abstraction from supplied raw input through a learning process [12]. In conclusion, DL is a popular study area since it can classify chest abnormalities by automatically learning the image attributes [13].
Modern deep-learning algorithms can analyze and segment images with human-level accuracy. One of the most widely recognized areas where deep learning may be quite useful is the medical sector, particularly in imaging [14,15]. With all those developments, deep learning has become a significant force in the medical sector. To develop decision support for the assessment of an individual’s health, deep learning can be used in a wide range of fields, including the detection of diseases and nodules, the evaluation of digital information related to health, and narcotic consumption, environmental acknowledgment, and brain-computer functionality [16]. The capacity of the neural networks to acquire high-level abstraction from raw which is given as input data through a special-purpose learning technique is the crucial factor that determines the success of deep learning. Fig. 1 represents the different categories of pneumonia.

Figure 1: Pneumonia’s different categories and subcategories
The technique of choice for analyzing medical images is deep learning. The use of deep learning for object recognition, segmentation, and categorization is thoroughly examined in this work. It also focuses on research into deep learning-based segmentation and diagnosing techniques for pneumonia. Various methods have been used to diagnose pneumonia up to this point. These methods are ineffective and inaccurate in handling numerous datasets. There is a need for a solution because the earlier strategies did not work to solve these issues. The study aimed to assess how well deep CNN algorithms identified and classified pneumonia on X-ray images. In this article, the artificial intelligence-based CNN approach is utilized.
The contributions of the research are as follows:
• Apply a sophisticated weinmed filter model to remove undesired noise from the patients’ chest X-ray images.
• Perform segmentation using Otsu thresholding, which separates the image into different regions. Then, apply the Grey Level Co-Occurrence Matrix (GLCM) method to extract features from the segmented images.
• Propose the African Buffalo Optimization-Convolutional Neural Network (ABO-CNN) model to classify the affected and unaffected regions in the chest X-ray images. The ABO-CNN model utilizes the ABO algorithm to select relevant features from the dataset, which are then used to optimize the ABO-CNN training.
The remaining sections are arranged as follows: The literature study is covered in Section 2, the suggested ABC-CNN methodology is discussed in Section 3, the results and discussion are presented in Section 4 with tables and graphs, and the proposed strategy is concluded in Section 5.
The methodology for identifying pneumonia in chest X-ray images employing Earth Mover’s Distance (EMD) was suggested by Khatri et al. [17]. The prevalent chronic illness known as pneumonia causes a person’s alveoli to swell with fluids and have a hazy appearance. Clinicians still have trouble accurately identifying patients and determining the degree of their infection. The study demonstrates how to utilize EMD to distinguish between normal, non-infected lungs and pneumonia-infected lungs. The EMD is the separation among two probabilities distribution over a given region D. To create a set of lung X-rays with a consistent size and shape; researchers pre-processed the images to exclude everything except the images of the lungs. Next, they performed basic resizing, rotations, and intensity normalization. Lastly, they computed EMD and compared the findings. However, fine-tuning the created system can aid in improving the accuracy of the finding [17].
Chandra et al. utilized the machine learning paradigm to recognize pneumonia in chest images [18]. The internationally recognized standard for analyzing pulmonary disorders is chest radiography. The study describes a Machine Learning (ML) framework for the automated identification of pneumonia in segmented lungs. The characteristics of the segmented lung Region of Interest (ROI) limited areas are retrieved because the study concentrates on pixels in the segmented lung ROI that are significantly more helpful towards pneumonia identification than the nearby areas. Utilizing benchmarked classifiers, the effectiveness of the new technique is contrasted with the conventional strategy. The employed technique outperformed the current strategy, according to experimental data. Moreover, the strategy requires thorough testing on thousands of real-world test cases and more dependable characteristic analysis tools.
The effectiveness of ML classification algorithms for Pneumonia Diagnosis in chest X-ray images is examined by Al Mamlook et al. [19]. One of the major illnesses that might have devastating repercussions quickly is pneumonia, which is brought on by an infection of the lungs. Early recognition is necessary for a successful course of therapy [19]. The research aims to create a framework that will aid in categorizing chest X-ray images into normal and pathological conditions. The paper presents the deep learning approach for the classification problem, developed on changed images using several pre-processing processes. Experimental findings revealed that, when contrasted with the seven machine learning approaches, the deep learning methodology performs the best for the categorization task. However, gathering X-ray images from medical facilities with big data for training and testing the algorithm could forecast outcomes more accurately.
Viral Pneumonia Diagnosis on Chest X-Ray Utilizing Confidence-Aware Anomaly Detection was proposed by Zhang et al. [20]. Short-term clustering of viral pneumonia cases might indicate a pandemic or epidemic. Chest X-rays could be a valuable tool for the precise and quick diagnosis of viral pneumonia during mass screenings for epidemic management, especially since more advanced imaging techniques are not widely available. Furthermore, the appearance of a new viral mutation results in a significant dataset change, significantly reducing the effectiveness of categorization methods. The goal of distinguishing between viral pneumonia, non-viral pneumonia, and normal subjects was presented in the study as a one-class categorization anomaly detection issue. As a result, researchers suggest confidence-aware detection techniques, which combine an anomalous detection module, a confidence forecast module, and a common feature extractor. The main benefit of the method over binary classification is that all confirmed instances of viral pneumonia are treated as an anomaly to enhance the one-class system without explicitly modeling distinct viral pneumonia categories. Techniques for binary classification are outperformed by the suggested method but the fast negative rate is higher which decreases the false positives of the method [20].
A deep feature selection technique utilizing local search and the sine cosine algorithm was presented by Chattopadhyay et al. to identify pneumonia from lung X-ray images [21]. Children under the age of five worldwide commonly die from pneumonia. Although radiological examinations—typically X-ray scans—are performed to identify pneumonia, they are subject to subjective variation and may result in discrepancies between radiologists. Hence, a much more reliable technique is needed to identify signs of pneumonia from X-ray images. Using deep learning and optimization techniques, researchers create two-stage architecture in the study that is both precise and quick. The suggested framework utilizes a customized DenseNet-201 deep learning model in its initial phase to extract the features to deal with the limited information available. In the second phase, researchers use an enhanced sine-cosine algorithm and an adaptable beta hill climbing-based local search strategy to minimize the characteristics dimensions. Utilizing a Support Vector Machine (SVM) classifier, the optimized feature subset is applied to categorize “Pneumonia” and “Healthy” X-ray images. The suggested approach shows the maximum accuracy after being tested on a publicly accessible data set. Still, somehow it necessitates a great deal of effort and a huge number of datasets.
Pneumonia Identification in Chest X-Ray Image Utilizing an Enhanced Restricted Boltzmann Machine (RBM) was proposed by Wahid et al. Studies have concentrated on the pneumonia detection procedure since it has emerged as one of the most serious diseases that can be fatal [22]. However, none have been particularly effective in achieving the greatest accuracy. In a related effort, researchers suggest an improved variant of the limited Boltzmann machine, the enhanced RBM. The randomized weight initialization utilized in the typical RBM format is one of the main downsides since it causes the model to understand its features improperly during the training phase, which harms the machine’s effectiveness. The study attempts to solve this issue by identifying discrepancies between the means of a particular characteristic vector and the mean of all characteristics supplied to the machine as input. The procedure increases the rebuilding of the real features, eventually minimizing the error produced during the model’s training stage. Consequently, a considerable improvement in the RBM’s operation has been seen by employing a novel way of weight initialization during the training stage. Moreover, it does not apply to many dataset formats.
Ayan et al. utilized Deep Learning to diagnose pneumonia from chest X-ray images [23]. A bacterial infection is the source of lung illness known as pneumonia. For the therapy procedure to be effective, an earlier diagnosis is essential. Typically, a skilled radiologist can identify the illness from chest X-ray scans. Computer-aided diagnostic systems are therefore required to direct the physicians. Researchers employed the well-known convolutional neural network models Vgg16 and Xception to diagnose pneumonia. In the training phase, researchers applied fine-tuning and transfer learning. The Xception network, however, had better effectiveness in identifying pneumonia infections. Consequently, researchers discovered that every network on the same dataset had unique specific skills. The technology will produce more accurate findings for identifying pneumonia by merging the characteristics of two or more networks.
CNN was employed by Sharma et al. to identify and categorize characteristics from chest X-ray images to recognize pneumonia. If not treated promptly, pneumonia is an illness that inflames the lungs. Chest X-rays frequently detect pneumonia; a specialist must carefully examine these images. Having a professional diagnose pneumonia utilizing chest X-ray images is less precise and time-consuming. Researchers suggest several deep convolution neural network structures in the research. Researchers train the suggested CNNs utilizing both the initial and the enhanced dataset, and the outcomes are presented to assess the effect of dataset size on the effectiveness of CNN. The classification accuracy of the suggested CNN architecture will increase as it incorporates various optimization techniques and other data augmentation approaches [24].
For detecting pneumonia utilizing chest X-rays, Rahman et al. employed Deep CNN and Transfer Learning [25]. Lung infections from either bacteria or viruses can produce the potentially fatal condition known as pneumonia. Early recognition of pneumonia is crucial since it can be life-threatening if not treated. The article uses digital X-ray images to automatically identify bacterial and viral pneumonia. It gives a thorough report on improvements in the timely identification of pneumonia before outlining the researcher’s approach. In preparation for the classification job based on transfer learning, the chest X-ray images of bacteria, viruses, and normal tissue were pre-processed and trained. The article presents three categorization schemes: bacterial pneumonia vs. viral pneumonia, normal, pneumonia vs. viral pneumonia, and bacterial pneumonia. The suggested approach achieves more precision. As a result, the planned research may aid in the quicker diagnosis of pneumonia by the radiologist whereas the proposed approach takes a lot of time to process the data.
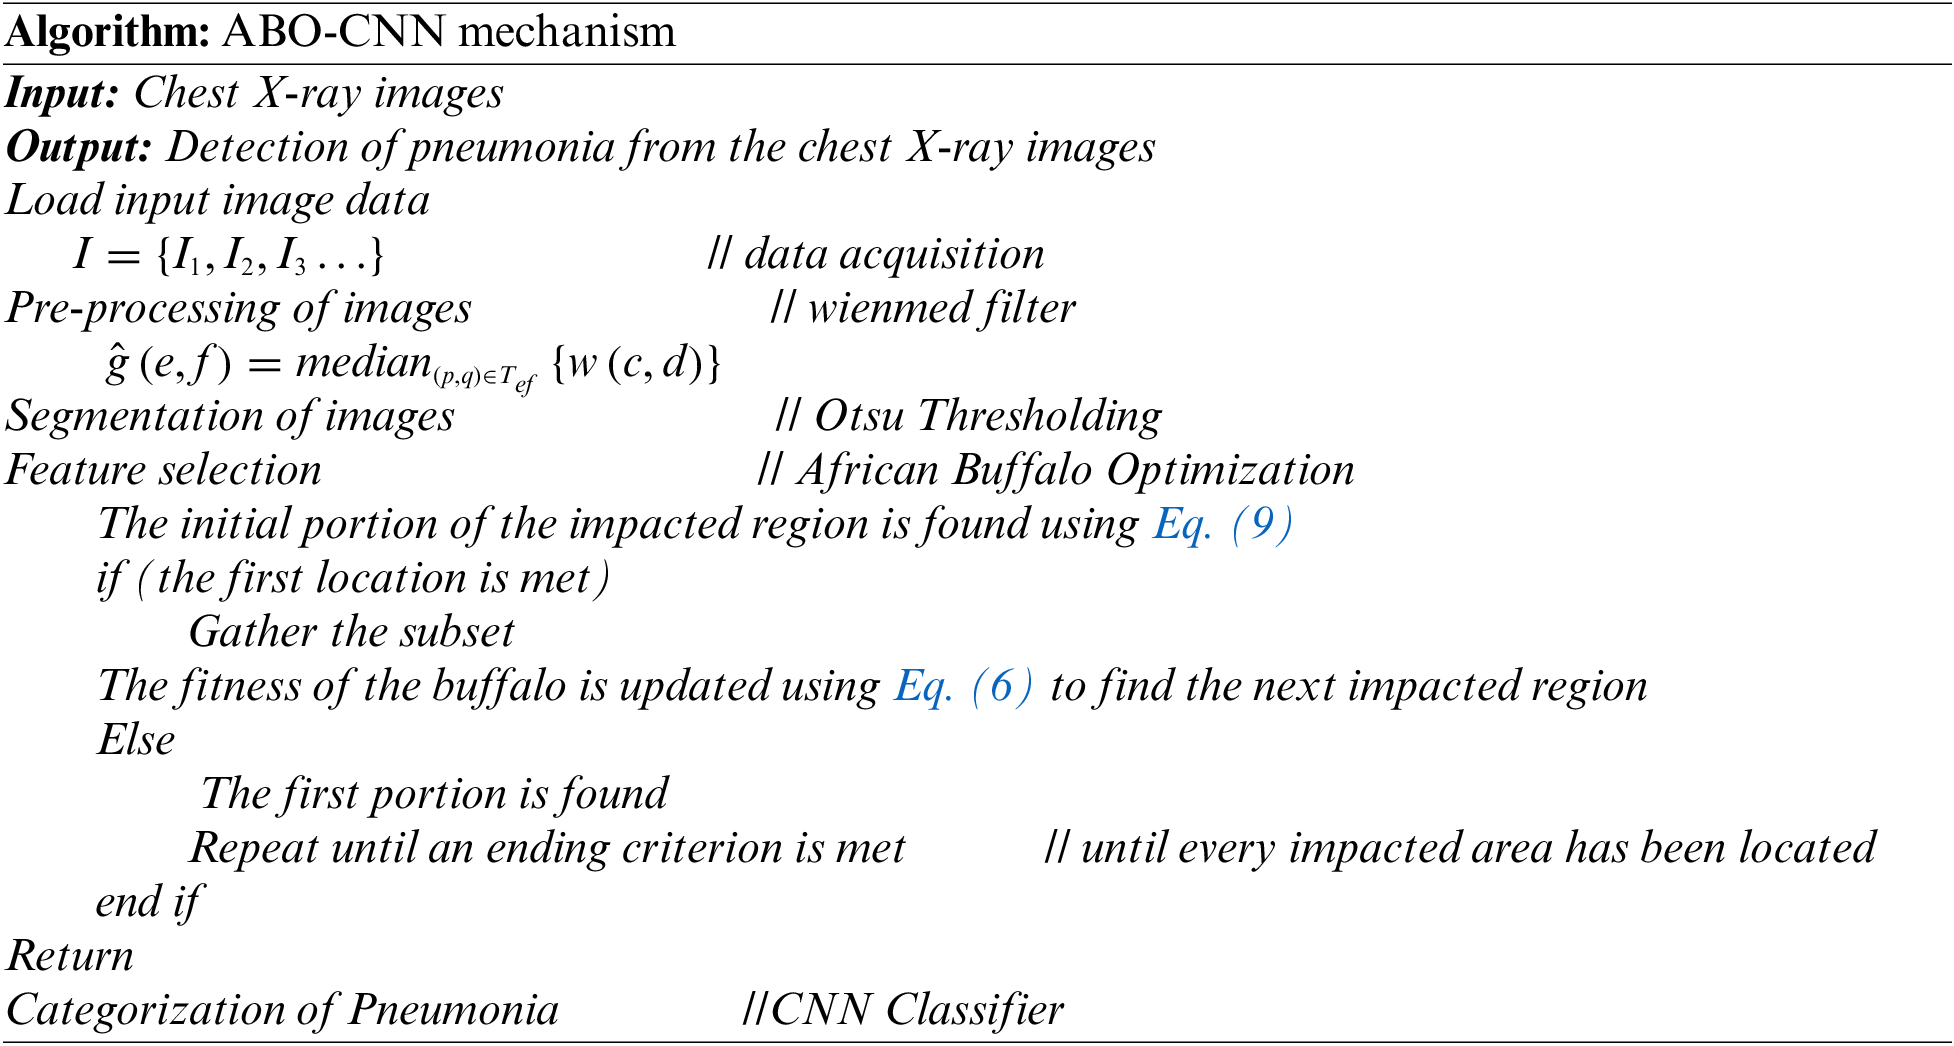
For the study, images from a chest X-ray collection that includes normal and pneumonia images were made available to the public. Preprocessing is done on the dataset, and training, validation, and test sets are created. Weinmed filter is used for preprocessing, and Otsu thresholding is subsequently used for segmentation. The relevant characteristics are chosen using GLCM, and the CNN model is optimized utilizing the ABO algorithm, which takes its cues from the social behavior of African buffalos. The algorithm’s parameters are specified, including the population size, maximum iteration, and search space. Convolutional, pooling, and fully connected layers are only a few of the layers that make up a CNN model. The architecture is chosen using data from earlier research and testing. The model’s effectiveness is assessed using common assessment measures including accuracy, sensitivity, specificity, precision, and F1-score.
Fig. 2 depicts the recommended approach. In the research, a CNN based on African Buffalo Optimization is used. For training and testing, several datasets are supplied into the system. The Weinmed filter is then used during pre-processing to remove unwanted noises from the images that have already undergone processing. Accordingly, pneumonia and its types are classified using the recognized ABO-CNN technique. A sophisticated African Buffalo Optimization-based CNN achieves a higher precision value. As a result, the technique used considers and classifies pneumonia.

Figure 2: The proposed ABO-CNN model
To produce an image with noticeable graphical clarity, pre-processing is used. One of the most typical noises that images encounter is salt and pepper noise, which complicates the detecting process. A global and local analysis-based classification process is proposed to identify the affected regions precisely. In contrast to a global analysis, which looks at the image’s color characteristics, a local analysis contrasts the image’s brightness and sharpness. Noise is any occurrence of unexpected indicators and inconsistency in the brightness and hue of the image. It is essential to remove the noises because the particles would degrade the image quality. To minimize the noise in the images, a hybrid filter termed the Wienmed filter—a blend of the Wiener and median—is utilized in this study. The median filter will recover each pixel’s grey level and is particularly good at eliminating spiky noises while maintaining the image’s sharp edges. On the contrary, the wiener filter uses a linear filter to blur the noise in the image. Therefore, it is proven to be quite successful in combining the median and wiener filters used in this paper. To achieve a higher image quality, it is necessary to eliminate the changed pixels from the surrounding area. As a result, the ABO-CNN model for identifying pneumonia uses the produced noise-free images. The chest X-ray images before and after pre-processing are shown in Fig. 3.

Figure 3: Architecture of CNN
The wiener filter mathematical formula is given in Eq. (1).
Here the variance of Gaussian noise is denoted by σ2, c and d are pixel dimensions of each image, n is the noise features.
The median filter equation is given in Eq. (2).
Here
The combined formula of the proposed Wienmed filter is in Eq. (3).
Here c and d are the pixel dimensions of each image. The notation a indicates each image.
It appears that segmentation is a key element that directly influences the categorization result. A subpar segmentation could result in a subpar categorization. Even though the research does not produce good results, it is the best classifier ever reported. A correct segmentation will surely enable us to achieve the acceptable performance of the classifier even with a very basic classifier [26]. This study does not need a complex method to segment the information as it eliminated all sorts of noise by pre-processing with the un-sharp filter. The damaged area must be segregated from the nearby healthy area to identify and produce an accurate categorization. The fundamental technique for segmenting images was thresholding. As a result, Otsu Thresholding was used in this study to describe the foreground and background images using a distribution. Eq. (4) carried out this procedure.
where
Making a specific feature extraction from attributes is the main challenge in image processing. Design, contents, and image recognition are the fields of image processing that involve feature extraction. Shape, color shift, disparity, group outgrowth, the connection among areas, etc. are potential X-ray features. The goal of feature extraction in image processing is to lessen computational complexity by removing pointless and unneeded properties. The feature extraction technique determines the characteristics of the images using microanalysis and macroanalysis. The quirky dataset’s original data is converted into digital characteristics during feature extraction without even being changed, and it is then classed based on its pixel content.
The Grey Level Co-Occurrence Matrix (GLCM) is employed in feature extraction. The frequency with which a set of pixels with specific values and spatial connections appear together in an image is taken into account by the GLCM factor to account for the pattern of the image.
Energy: The total of squares in an image that regularly has higher grayscale values and directly has an unstable quality is referred to as energy. Calculating the energy of the supplied data is Eq. (5).
The images are designated as M and the image squares with a grey level are labelled as (a, b).
Contrast: Using features, the regional contrast of an image is calculated, and it is predicted to be low at even beginning concentration. The original image’s entire grayscale quality is then projected by Eq. (6), followed by the contrast.
I stand for an image’s grayscale, M for an image, and (a, b) for an image’s grayscale square.
Correlation: The linear dependence of grey value on pixels and the numeric relationships between the parts can be considered using the correlation features in Eq. (7).
The standard deviation and mean in the row and column are represented as μc, μd,
Entropy: Entropy stands out in Eq. (8), which is depicted as the predicted increased value of the uncertainty of the dispersion of grey levels.
The value of characteristics in the image analysis is produced during feature selection, which may start with desired data and is typically connected to reduced dimensionality. To select features and generate additional properties, the training data is converted and the relevant features are selected using African Buffalo Optimization (ABO) algorithm. The primary goal of feature selection was to decrease the original datasets using various attributes and features. It highlights how image patterns interact with other patterns. The features selected from the X-ray image are the minimum intensity, intensity slope, maximum intensity, standard deviation, mean gradient, median intensity, mean curvature, and mean intensity.
African Buffalo Optimization Algorithm (ABO)
To improve classification accuracy, the major goal of feature selection is to exclude these kinds of characteristics. The ABO feature selection model analyses the feature set to decrease the number of features while concurrently increasing classification accuracy. This study used the ABO algorithm because there weren’t many studies that used it for feature selection. The African buffalo’s ability is modernized by their location of seeking in the African Buffalo Optimization mechanism. Buffalos are often gathered by their “waa” and “maa” sounds, which are also employed to identify their location. Additionally, the learning aspects will assist in the mobility of the buffalo. The letters un and pn represent the sounds waa and maa, respectively. Through the formula, collaborative efficiency is clearly defined in Eq. (9).
where, pn and un stand for the nth buffalo’s an exploration and exploitation movements, respectively (n = 1,2, 3, …, N). The variables for learning are le1 and le2. In Eq. (9), Cemax is the group with the best fitness, and cdmaxn is the fitness of a single buffalo.
Utilizing Eq. (10), update the location of the buffalo n (cemax and cdmaxn).
In Eq. (9), there are three main components: (pn + 1) the recall part, in which the animals pay attention to being moved from their former location (pn). Broad memory ability is shown in their wandering behavior, an important tool for buffalos. The collaborative qualities of buffalo le1 are represented in the following section (cemax-un). Buffalos can trail the locations and are effective communicators in every repetition. The final equation, le2, highlights the buffaloes’ superior intelligence (cdmaxn-un). They can contrast their present role to their old, most productive job.
Visual data that displays human emotion is categorized using Convolution Neural Network (CNN) classifiers. It analyses graphical images and eliminates any unnecessary elements with the assistance of its multiple co-designs. Before CNN training, image pixel values fell inside the dataset’s bounds. CNN is the network that advances the greatest during training. If possible, the input images should all be the same size. The formula in Eq. (11) was used to normalize all of the images from the training set.
The convolution layer uses the scant number of input images it has gathered to assess the difficulty of each layer. It most obviously relates to the characteristics depicted in the original images. The mathematical formulation of the convolutional layer is given in Eq. (12).
The input options are represented by the number
This layer decreases the down-sampling layer’s flexibility and cell size. The pooling layer reduces the number of parameters, processing speed, convolution layer size, training, and generalization. The grouping definition shows 50% of the test and 100% of the training data.
The map
The categorization of images has made use of the fully linked layer. The FC layers are placed after the Convolutional layers. Using the FC layer makes mapping an image between input and output easier. Fully connected layers make up the system’s top levels.
The Softmax layer converts the results into normalized ratio dispersion. The output is fed into the classifiers as an input. Pneumonia is a feature of the Softmax layer, and the Softmax classifier is a typical participating classifier. It is depicted in Eq. (14).
Fig. 4 illustrates the entire flowchart for diagnosing pneumonia using an X-ray image. The X-ray images are loaded first in the flowchart. After that, the images used as input were trained. The Weinmed filter is added during the pre-processing stage to remove any undesirable noise from the image. The segmentation procedure takes advantage of these noise-free images. The segmentation procedure makes use of the otsu thresholding. The feature extraction employs the suggested African Buffalo Optimization. To determine the initial impacted region, apply Eq. (9). If the first impacted region is located, Eq. (10) is used to locate the subsequently affected region. Return to Eq. (9) until the initially affected region is located if the initially affected region cannot be located. Repeat Eq. (10) and classify using CNN.

Figure 4: Flow diagram of ABO-CNN model
The effectiveness of the proposed system throughout all categories is assessed utilizing accuracy. It is, generally speaking, the notion that every observation would be correctly predicted. The accuracy is stated in Eq. (15).
Precision is determined by counting the precise positive ratings that differ from the total positive evaluation. You may calculate the exact detection of pneumonia using Eq. (16).
The recall is the ratio of the total amount of positive samples to the number of real positives accurately classified as positives. The percentage of predictions made using Eq. (17) to identify pneumonia is described.
Calculating the F1-score combines recall and accuracy. Precision and recall determine the F1-score stated in Eq. (18).
AUC is an abbreviation for Area under the ROC Curve, a popular evaluation metric for binary classification tasks in machine and deep learning. The AOC calculates the area under the ROC (Receiver Operating Characteristic) curve, a visual representation of a binary classification algorithm’s performance. The classifier in a binary categorized issue seeks to identify whether the supplied data belongs to a negative or positive category. The ROC curve compares the
This section contains the experimental findings and explains how well our proposed model performed. We compare the performance of the proposed ABO-CNN with previously related methods.
Retrospective cohorts of pediatric patients collected from Guangzhou Women and Children’s Medical Center, Guangzhou, China [27]. The dataset comprises 5,863 chest X-ray images in JPEG format, divided into three folders: train, test, and val. The images belong to two categories: Pneumonia and Normal. They were obtained from pediatric patients aged one to five at Guangzhou Women and Children’s Medical Center in Guangzhou (“Chest X-Ray Images (Pneumonia) | Kaggle” 2018). The X-ray scans were conducted as part of routine clinical care, and all images underwent initial quality control screening to remove low-quality or unreadable scans. Two expert physicians then assessed the diagnoses for the images, and a third expert reviewed the evaluation set to account for any potential grading errors. Here are the 8 X-ray samples of pneumonia-affected and normal image samples of patients in Fig. 5.

Figure 5: X-ray images of pneumonia and normal from KAGGLE
The second public dataset, which included posteroanterior (PA) chest X-ray images, was classified into three categories (COVID-19, pneumonia, and normal) [28]. The experiment included a total of 6,939 samples, with 2,313 samples from each class as Table 1 shows. Fig. 6 depicts samples from the dataset, including Normal (Healthy), Pneumonia, and COVID-19.
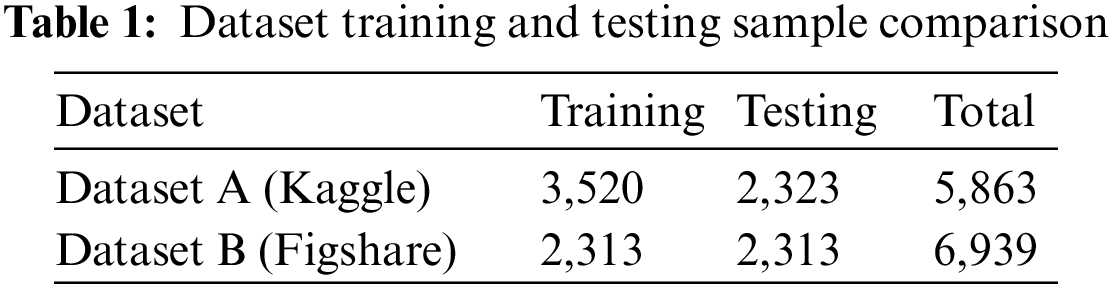

Figure 6: X-ray images of pneumonia and normal from fig-share dataset
Table 2 represents evaluation metrics for a classification task related to pneumonia and normal classes. The metrics include precision, recall, and F1-score, commonly used to assess the performance of a classification model. These metrics provide insights into the performance of the classification model for distinguishing between pneumonia and normal classes.
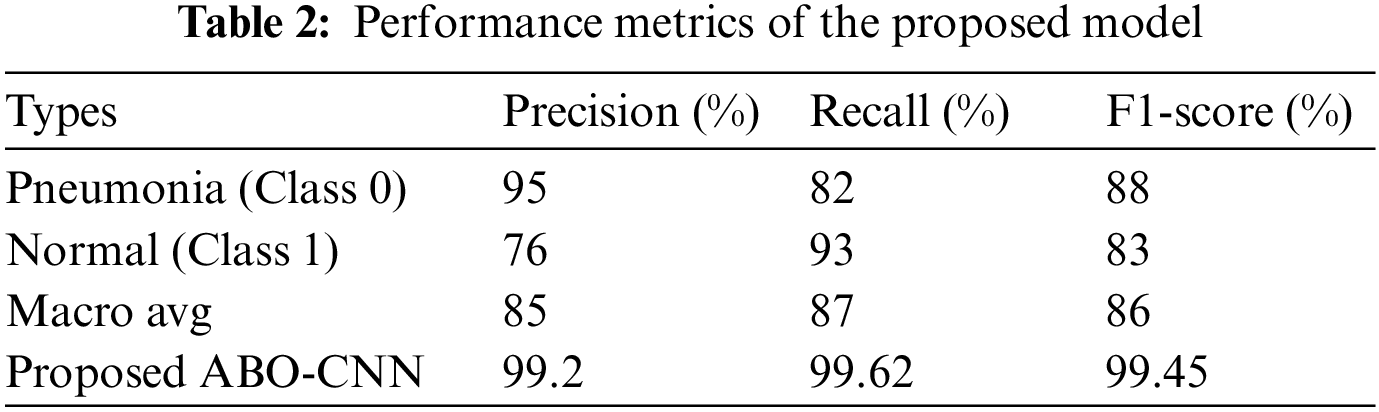
Fig. 7 represents a classification model’s performance metrics, specifically for distinguishing between pneumonia and normal cases. The metrics used to evaluate the model are precision, recall, and F1-score. According to Table 1, the ABO-CNN model achieved a precision of 99.2%, recall of 99.62%, and F1-score of 99.45%. These values indicate that the ABO-CNN model performed significantly better than the average metrics obtained from the other approach.

Figure 7: Performance evaluation of the proposed model
Fig. 8 shows the training and validation accuracy of the proposed model and the testing accuracy and loss are represented in Fig. 9. Table 3 summarizes the performance evaluations of the approaches using AUC-ROC curves.
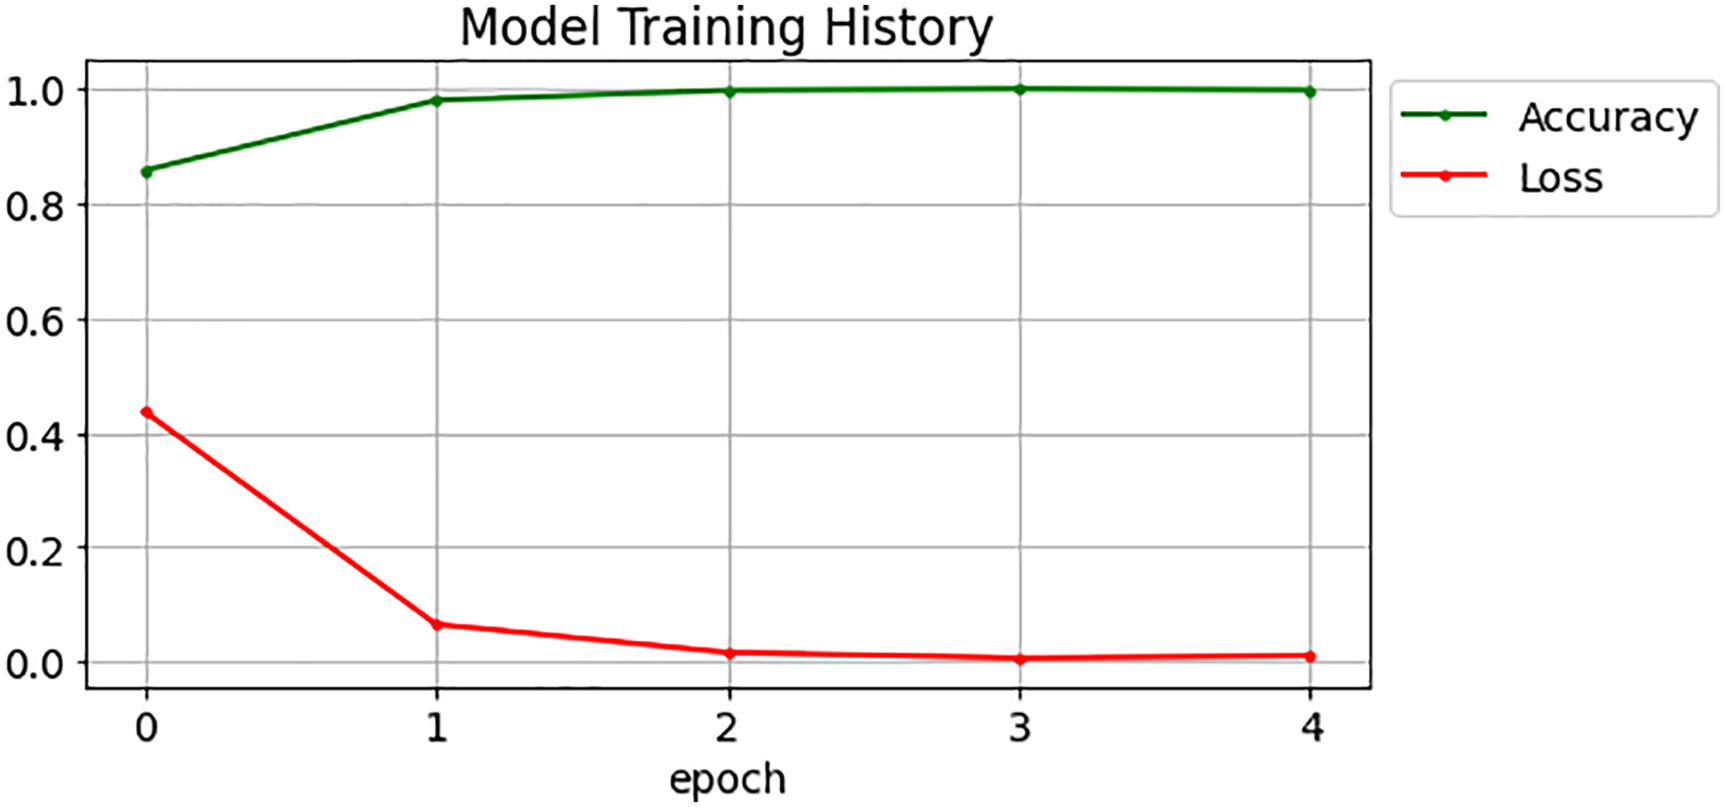
Figure 8: Training and validation accuracy

Figure 9: Testing accuracy and loss
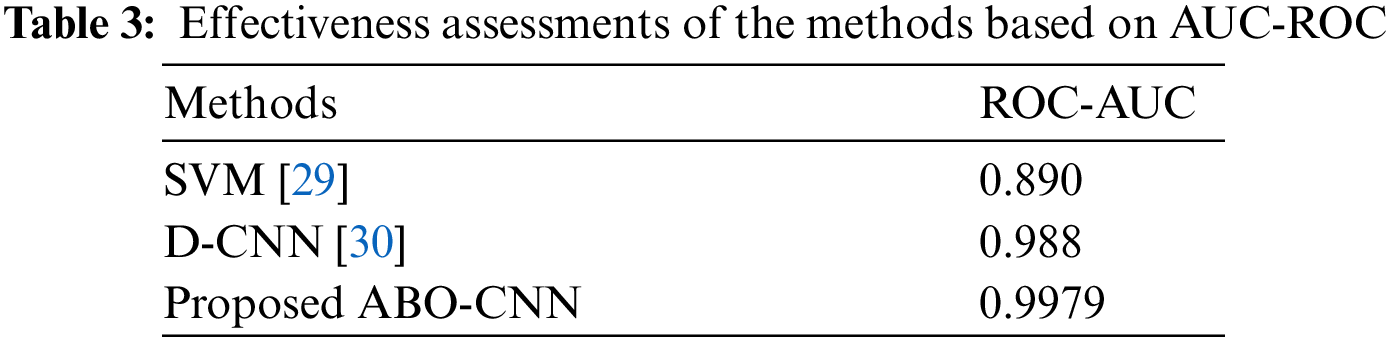
The AUC-ROC scores of the ABO-CNN are larger than those of all other existing models, according to the test results in Table 2. Fig. 10 gives a comparison of AUC-ROC curves.

Figure 10: Comparison of AUC-ROC curve
4.4 Comparison with the State-of-the-Art Methods
Table 4 presents the performance metrics of different classification models for various research papers. The SVM model achieved high precision 96.12%, recall 96.96%, accuracy (96.96%), and F1-score (96.54%). It demonstrates strong performance across all metrics. The stacking classifier model achieved a higher precision of 98.99% and recall of 99.53% compared to SVM. It also had a high accuracy of 98.62% and an F1-score of 99.26%. The LBP-CNN model achieved high precision 98.8%, recall 98.9%, accuracy 98.3%, and F1-score 99.0%. The hybrid deep learning model achieved high precision 97.29%, recall (97.29%), and F1-score 97.29%. It had a slightly higher accuracy of 98.19%. These results suggest the effectiveness of combining different deep-learning techniques in this hybrid model. The proposed ABO-CNN model achieved the highest precision 99.2%, recall 99.62%, accuracy 99.79%, and F1-score 99.45% among all the models. These results indicate the superior performance of the proposed model in the classification task.

The graph in Fig. 11 compares evaluation metrics (precision, recall, and accuracy) for SVM, stacking classifier, LBP-CNN, deep hybrid learning and the proposed ABO-CNN methods. The x-axis of the graph represents the types of models being compared, while the y-axis represents the values of the evaluation metrics.

Figure 11: Comparison with the state-of-the-art methods
Fig. 12 presents a precision-recall curve in the graphical representation of the trade-off between precision and recall for a binary classification model. It illustrates how the model’s performance varies as the classification threshold changes.
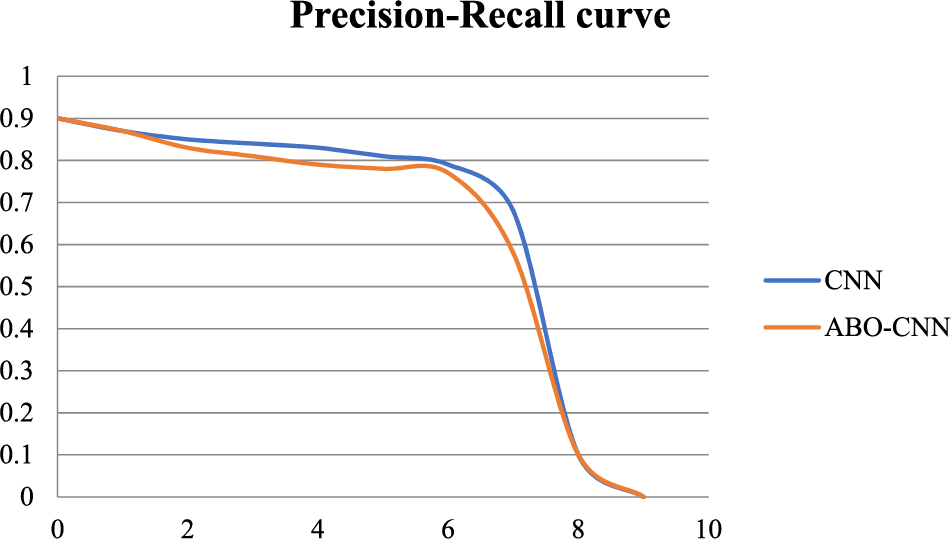
Figure 12: Precision-recall curve
The experimental results cover several key aspects. Firstly, the dataset used in the research consists of 5,863 chest X-ray images categorized into Pneumonia and Normal, obtained from pediatric patients at Guangzhou Women and Children’s Medical Center. The dataset was carefully curated by removing low-quality or unreadable scans. Next, Figs. 7 and 8 present important findings regarding the training and validation accuracy, as well as the testing accuracy and loss of the model. Fig. 7 illustrates the improvement in accuracy throughout the training process, giving insights into the learning progress and the model’s ability to generalize. Fig. 8 provides information on the model’s performance on unseen data, helping to identify overfitting or underfitting. Then, the study includes a performance comparison to assess the effectiveness of the proposed ABO-CNN model compared to existing models. Among all models, the proposed ABO-CNN model had the highest precision 99.2%, recall 99.62%, accuracy 99.25%, and F1-score 99.45%. These findings demonstrate the suggested model’s higher performance in the classification challenge.
Despite the rapid expansion of image processing in medical technology today, there are some instances when the diversity of the images makes it difficult to categorize and diagnose diseases. The affected or damaged component is classified, located, and segmented using the indicated methodology. Mostly, it concentrates on locating pneumonia. Images of chest X-rays taken of people with various types of pneumonia are first used to offer information about individuals. A wienmed filter is then used in the pre-processing stage to remove any undesirable effects or noise from the X-ray images. The Otsu thresholding technology is applied to segment the affected area. Additionally, the suggested African Buffalo Optimization is used to extract the attributes during the feature extraction stage, and a CNN is used to classify pneumonia. High classification and accuracy are also reached with ABO-CNN. Therefore, this model’s prediction accuracy was 96.95%. The proposed technique will detect the mandatory features without any supervision of humans and they are faster than Recurrent Neural Network (RNN). The CNN’s number of parameters is low, decreasing the computational time. Even though the CNN is very effective, the position and orientation of the objects are not encoded properly. To offer a more accurate evaluation of pneumonia, the work can be enhanced by improving the size of the data utilized. Hybrid DL techniques and other transfer learning models can increase efficiency and give a more accurate evaluation of pneumonia.
Acknowledgement: This work is funded by the Researchers Supporting Project Number (RSP2023R157), King Saud University, Riyadh, Saudi Arabia.
Funding Statement: This work is funded by the Researchers Supporting Project Number (RSP2023R157), King Saud University, Riyadh, Saudi Arabia.
Author Contributions: The authors confirm contribution to the paper as follows: study conception and design: Nasser, Ahmed I. Taloba, Amr, Ahmed Alzahrani; data collection: Nasser, Ahmed I. Taloba, Amr; analysis and interpretation of results: All Authors; draft manuscript preparation: Nasser, Ahmed I. Taloba, Amr. All authors reviewed the results and approved the final version of the manuscript.
Availability of Data and Materials: The data that support the findings of this study are available from the corresponding author upon reasonable request.
Conflicts of Interest: The authors declare that they have no conflicts of interest to report regarding the present study.
References
1. Lanks, C., Musani, A., Hsia, D. (2019). Community-acquired pneumonia and hospital-acquired pneumonia. Medical Clinics, 103(3), 487–501. [Google Scholar] [PubMed]
2. Stephen, O., Sain, M., Maduh, U. J., Jeong, D. U. (2019). An efficient deep learning approach to pneumonia classification in healthcare. Journal of Healthcare Engineering, 2019, 1–7. [Google Scholar]
3. Guo, L., Wei, D., Zhang, X., Wu, Y., Li, Q. et al. (2019). Clinical features predicting mortality risk in patients with viral pneumonia: The MuLBSTA score. Frontiers in Microbiology, 10, 2752. [Google Scholar] [PubMed]
4. Agrawal, T., Choudhary, P. (2022). Segmentation and classification on chest radiography: A systematic survey. The Visual Computer, 1–39. [Google Scholar]
5. Varshni, D., Thakral, K., Agarwal, L., Nijhawan, R., Mittal, A. (2019). Pneumonia detection using CNN based feature extraction. 2019 IEEE International Conference on Electrical, Computer and Communication Technologies (ICECCT), pp. 1–7. Coimbatore, Tamil Nadu, India. [Google Scholar]
6. Kundu, R., Das, R., Geem, Z. W., Han, G. T., Sarkar, R. (2021). Pneumonia detection in chest X-ray images using an ensemble of deep learning models. PLoS One, 16(9), e0256630. [Google Scholar] [PubMed]
7. El Asnaoui, K., Chawki, Y. (2021). Using X-ray images and deep learning for automated detection of coronavirus disease. Journal of Biomolecular Structure Dynamics, 39(10), 3615–3626. [Google Scholar] [PubMed]
8. Hammoudi, K., Benhabiles, H., Melkemi, M., Dornaika, F., Arganda-Carreras, I. et al. (2021). Deep learning on chest X-ray images to detect and evaluate pneumonia cases at the era of COVID-19. Journal of Medical Systems, 45(7), 75. [Google Scholar] [PubMed]
9. Murphy, C. N., Fowler, R., Balada-Llasat, J. M., Carroll, A., Stone, H. et al. (2020). Multicenter evaluation of the BioFire FilmArray pneumonia/pneumonia plus panel for detection and quantification of agents of lower respiratory tract infection. Journal of Clinical Microbiology, 58(7), e00128–00120. [Google Scholar] [PubMed]
10. Xu, S., Wu, H., Bie, R. (2018). CXNet-m1: Anomaly detection on chest X-rays with image-based deep learning. IEEE Access, 7, 4466–4477. [Google Scholar]
11. Que, Q., Tang, Z., Wang, R., Zeng, Z., Wang, J. et al. (2018). CardioXNet: Automated detection for cardiomegaly based on deep learning. 2018 40th Annual International Conference of the IEEE Engineering in Medicine and Biology Society (EMBC), pp. 612–615. Honolulu, HI, USA. [Google Scholar]
12. Abiyev, R. H., Ma’aitaH, M. K. S. (2018). Deep convolutional neural networks for chest diseases detection. Journal of Healthcare Engineering, 2018, 1–11. [Google Scholar]
13. Cha, S. M., Lee, S. S., Ko, B. (2021). Attention-Based transfer learning for efficient pneumonia detection in chest X-ray images. Applied Sciences, 11(3), 1242. [Google Scholar]
14. Alalwan, N., Abozeid, A., ElHabshy, A., Alzahrani, A. (2021). Efficient 3D deep learning model for medical image semantic segmentation. Alexandria Engineering Journal, 60(1), 1231–1239. [Google Scholar]
15. Miyashita, N., Nakamori, Y., Ogata, M., Fukuda, N., Yamura, A. et al. (2022). Early identification of novel coronavirus (COVID-19) pneumonia using clinical and radiographic findings. Journal of Infection Chemotherapy, 28(5), 718–721. [Google Scholar] [PubMed]
16. Sirazitdinov, I., Kholiavchenko, M., Mustafaev, T., Yixuan, Y., Kuleev, R. et al. (2019). Deep neural network ensemble for pneumonia localization from a large-scale chest X-ray database. Computers Electrical Engineering, 78, 388–399. [Google Scholar]
17. Khatri, A., Jain, R., Vashista, H., Mittal, N., Ranjan, P. et al. (2020). Pneumonia identification in chest X-ray images using EMD. Trends in Communication, Cloud, and Big Data: Proceedings of 3rd National Conference on CCB, pp. 87–98. Majitar, India. [Google Scholar]
18. Chandra, T. B., Verma, K. (2020). Pneumonia detection on chest x-ray using machine learning paradigm. Proceedings of 3rd International Conference on Computer Vision and Image Processing, vol. 1, pp. 21–33. Jabalpur, India. [Google Scholar]
19. Al Mamlook, R. E., Chen, S., Bzizi, H. F. (2020). Investigation of the performance of machine learning classifiers for pneumonia detection in chest X-ray images. 2020 IEEE International Conference on Electro Information Technology (EIT), pp. 98–104. Naperville, IL, USA. [Google Scholar]
20. Zhang, J., Xie, Y., Pang, G., Liao, Z., Verjans, J. et al. (2020). Viral pneumonia screening on chest X-rays using confidence-aware anomaly detection. IEEE Transactions on Medical Imaging, 40(3), 879–890. [Google Scholar]
21. Chattopadhyay, S., Kundu, R., Singh, P. K., Mirjalili, S., Sarkar, R. (2022). Pneumonia detection from lung X-ray images using local search aided sine cosine algorithm based deep feature selection method. International Journal of Intelligent Systems, 37(7), 3777–3814. [Google Scholar]
22. Wahid, F., Azhar, S., Ali, S., Zia, M. S., Almisned, F. A. et al. (2022). Pneumonia detection in chest X-ray images using enhanced restricted Boltzmann machine. Journal of Healthcare Engineering, 2022, 1–17. [Google Scholar]
23. Ayan, E., Ünver, H. M. (2019). Diagnosis of pneumonia from chest X-ray images using deep learning. 2019 Scientific Meeting on Electrical-Electronics & Biomedical Engineering and Computer Science (EBBT), pp. 1–5. Istanbul, Turkey. [Google Scholar]
24. Sharma, H., Jain, J. S., Bansal, P., Gupta, S. (2020). Feature extraction and classification of chest X-ray images using cnn to detect pneumonia. 2020 10th International Conference on Cloud Computing, Data Science & Engineering (Confluence), pp. 227–231. Noida, India. [Google Scholar]
25. Rahman, T., Chowdhury, M. E., Khandakar, A., Islam, K. R., Islam, K. F. et al. (2020). Transfer learning with deep convolutional neural network (CNN) for pneumonia detection using chest X-ray. Applied Sciences, 10(9), 3233. [Google Scholar]
26. Ben Atitallah, S., Driss, M., Boulila, W., Koubaa, A., Ben Ghezala, H. (2022). Fusion of convolutional neural networks based on Dempster–Shafer theory for automatic pneumonia detection from chest X-ray images. International Journal of Imaging Systems Technology, 32(2), 658–672. [Google Scholar]
27. Giełczyk, A., Marciniak, A., Tarczewska, M., Lutowski, Z. (2022). Pre-processing methods in chest X-ray image classification. PLoS One, 17(4), e0265949. [Google Scholar] [PubMed]
28. Asraf, A. (2023). COVID19 with Pneumonia and Normal Chest Xray (PA) Dataset. https://www.kaggle.com/datasets/amanullahasraf/covid19-pneumonia-normal-chest-xray-pa-dataset [Google Scholar]
29. Saha, P., Sadi, M. S., Islam, M. M. (2021). EMCNet: Automated COVID-19 diagnosis from X-ray images using convolutional neural network and ensemble of machine learning classifiers. Informatics in Medicine Unlocked, 22, 100505. [Google Scholar] [PubMed]
30. Hou, J., Gao, T. (2021). Explainable DCNN based chest X-ray image analysis and classification for COVID-19 pneumonia detection. Scientific Reports, 11(1), 16071. [Google Scholar] [PubMed]
31. Arun Prakash, J., Asswin, C., Ravi, V., Sowmya, V., Soman, K. (2023). Pediatric pneumonia diagnosis using stacked ensemble learning on multi-model deep CNN architectures. Multimedia Tools Applications, 82(14), 21311–21351. [Google Scholar] [PubMed]
32. Nneji, G. U., Cai, J., Deng, J., Monday, H. N., James, E. C. et al. (2022). Multi-channel based image processing scheme for pneumonia identification. Diagnostics, 12(2), 325. [Google Scholar] [PubMed]
33. Ukwuoma, C. C., Qin, Z., Heyat, M. B. B., Akhtar, F., Bamisile, O. et al. (2023). A hybrid explainable ensemble transformer encoder for pneumonia identification from chest X-ray images. Journal of Advanced Research, 48, 191–211. [Google Scholar] [PubMed]
Cite This Article
 Copyright © 2024 The Author(s). Published by Tech Science Press.
This work is licensed under a Creative Commons Attribution 4.0 International License , which permits unrestricted use, distribution, and reproduction in any medium, provided the original work is properly cited.
 Downloads
 Citation Tools