
 Submit a Paper
 Propose a Special lssue
 Open Access
REVIEW
An Insight Survey on Sensor Errors and Fault Detection Techniques in Smart Spaces
1 Chitkara University Institute of Engineering and Technology, Chitkara University, Punjab, 140401, India
2 PG Department of Information Technology, Goswami Ganesh Dutta Sanatan Dharma College, Chandigarh, 160030, India
3 Department of Computer Science, Government Bikram College of Commerce, Patiala, India
4 Department of Electrical and Computer Engineering, Lebanese American University, Byblos, Lebanon
5 University Centre for Research and Development, Department of Computer Science and Engineering, Chandigarh University, Mohali, 140413, India
6 Department of Computer Science and Engineering, Graphic Era Deemed to be University, Dehradun, 248002, India
7 Division of Research and Development, Lovely Professional University, Punjab, 144001, India
* Corresponding Authors: Shalli Rani. Email: ; Gaurav Dhiman. Email:
Computer Modeling in Engineering & Sciences 2024, 138(3), 2029-2059. https://doi.org/10.32604/cmes.2023.029997
Received 17 March 2023; Accepted 10 August 2023; Issue published 15 December 2023
 View Full Text
 Download PDF
Abstract
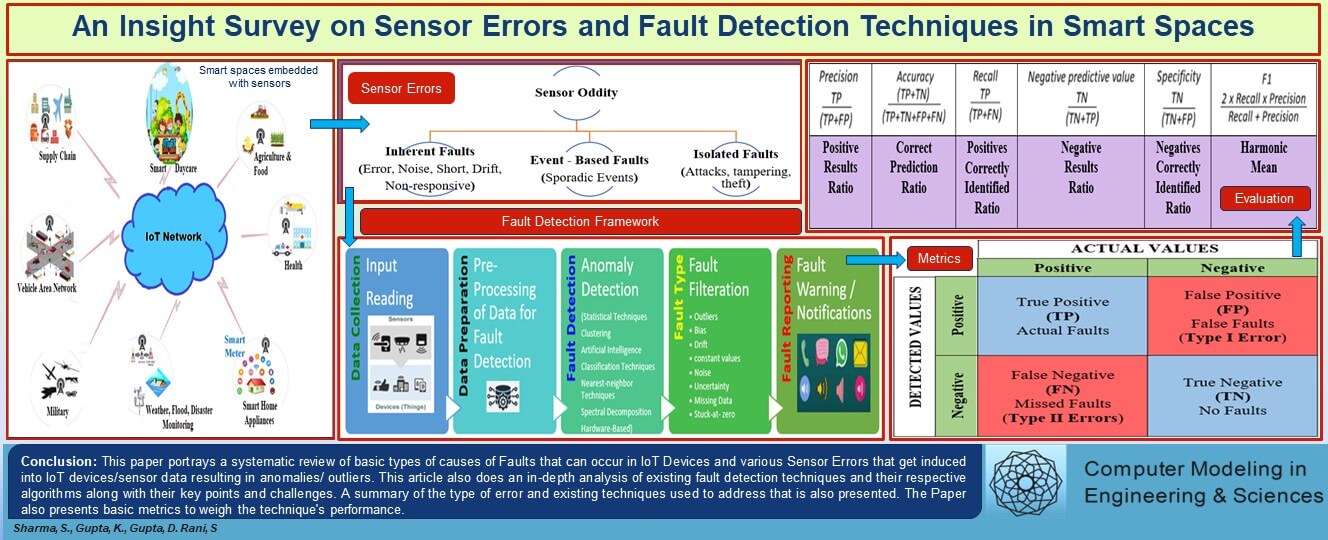
The widespread adoption of the Internet of Things (IoT) has transformed various sectors globally, making them more intelligent and connected. However, this advancement comes with challenges related to the effectiveness of IoT devices. These devices, present in offices, homes, industries, and more, need constant monitoring to ensure their proper functionality. The success of smart systems relies on their seamless operation and ability to handle faults. Sensors, crucial components of these systems, gather data and contribute to their functionality. Therefore, sensor faults can compromise the system’s reliability and undermine the trustworthiness of smart environments. To address these concerns, various techniques and algorithms can be employed to enhance the performance of IoT devices through effective fault detection. This paper conducted a thorough review of the existing literature and conducted a detailed analysis. This analysis effectively links sensor errors with a prominent fault detection technique capable of addressing them. This study is innovative because it paves the way for future researchers to explore errors that have not yet been tackled by existing fault detection methods. Significant, the paper, also highlights essential factors for selecting and adopting fault detection techniques, as well as the characteristics of datasets and their corresponding recommended techniques. Additionally, the paper presents a methodical overview of fault detection techniques employed in smart devices, including the metrics used for evaluation. Furthermore, the paper examines the body of academic work related to sensor faults and fault detection techniques within the domain. This reflects the growing inclination and scholarly attention of researchers and academicians toward strategies for fault detection within the realm of the Internet of Things.Graphic Abstract
Keywords
In recent times, IoT has registered a frantic shift in lifestyles, which has raised the quality of life. IoT developments have accelerated in almost all areas, including manufacturing, production, agriculture, home, and office automation [1–3], etc., as shown in Fig. 1. The growing demand and pace of IoT-enabled technology have also raised a challenge to swiftly handle fault detection and recovery [4]. Fault-tolerant and robust IoT solutions add a positive impact on the customer’s experience. Timely detection and correction of faults play a crucial role in quality measurement and also reduce the cost and time of maintenance. Fault detection is an essential aspect to consider because it helps determine the system’s volatility toward failures and safeguards the hassle-free driving of IoT devices. The timely correction of flaws improves quality, lowers costs, and increases the overall efficacy of the system, allowing it to become a sustainable infrastructure. Techniques based on machine learning are promising because of the mechanism of classifiers. The data collected by sensors can be supplied to varied fault detection techniques or Machine Learning (ML) models; thus, applying fault detection techniques can enhance the IoT utility, performance, and efficiency [5].
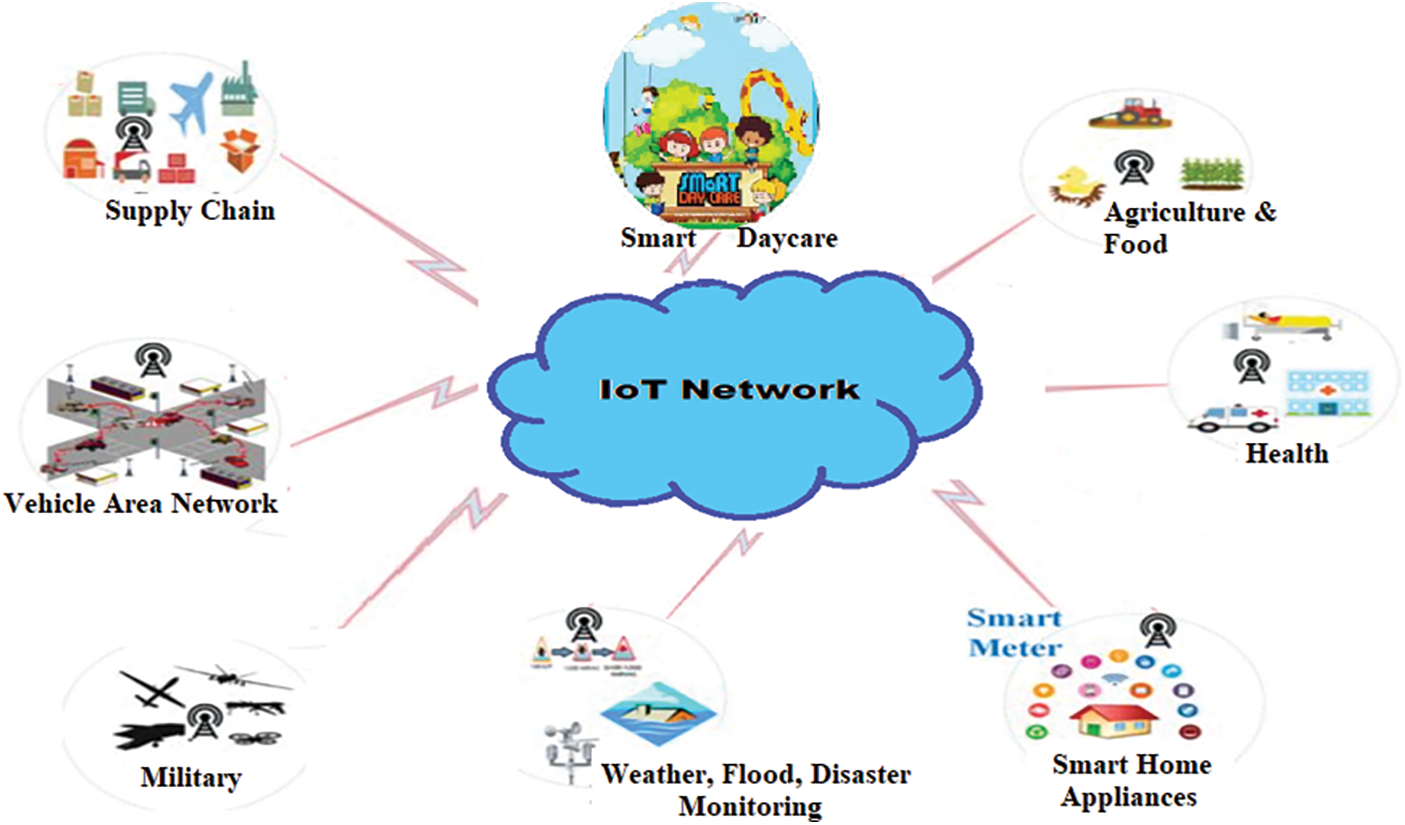
Figure 1: IoT and its application areas [1–3,11–18]
Many algorithms and techniques like Naive Bayes, Artificial Neural Networks, Genetic Algorithms, Hardware Redundancy, Multi-Layer Perceptron, Limit Checking, and many more can be used to identify faults [6–10], which can increase efficiency and save time. Even so, different methods can be distinguished based on various factors like presumptions, the accuracy and strengths and flaws of statistical models, and others. Because of the halt-free services currently available, systems that are reliable and fault-tolerant are becoming more important. If faults are left unresolved for an extended period, they can have fatal and expensive consequences [10].
The integrity, accuracy, and performance of IoT systems are dependent on the fidelity of sensor data. Sensors are often installed and exposed to harsh conditions, tampering, nasty attacks, attrition, etc., resulting in sensors malfunctioning, erroneous readings, and even failures. This erroneous or corrupt sensor data can be termed sensor faults or oddities. Thus, it becomes critical to detect these faults or oddities in sensors to ensure the proper functioning of IoT workplaces.
The paper has done an extensive literature survey and a very refined observatory analysis is performed that maps the sensor errors with the prominent fault detection technique that can handle them. The work is novel as it opens directions for future researchers to understand the errors that are still untouched to be addressed by various fault detection techniques, factors crucial for adopting any fault detection technique, and Dataset characteristics with their recommended technique are the major contribution. Besides, the paper provides a systematic overview of fault detection techniques in smart devices along with their evaluation metrics. The paper also exhibits an analysis of academic work done in the domain of sensor faults and fault detection techniques.
This article is structured as follows:
• The importance of fault detection in an IoT space is briefly discussed in Section 2.
• Section 3 discusses the basic causes of faults, their types, and various existing fault detection techniques. It also presents a basic framework and pseudo-code for implementing fault detection. Major conclusions are drawn from the study.
• Metrics for the evaluation of fault detection techniques are presented in Section 4.
• Section 5 presents an academic analysis of publications on the current topic.
• Lastly, Section 6 summarizes the complete paper while highlighting limitations and some future directions.
The next section testifies to the importance of fault detection in a smart space.
2 The Vitality of Fault Detection in IoT
Adopting the concept of smart spaces like smart cities, smart offices, and smart homes is always hindered by many societal and technical challenges [19]. On the other hand, the construction of smart settings is frequently hampered by technical apprehensions against robustness, fault tolerance, and dependability on IoT. This is because of errors or faults resulting from manifold threats such as routing hassles such as heterogeneous devices, sensors deployment, multihop communications, etc., transmission link volatility, environmental effect, hardware component failure, radio interference, and battery/energy depletion. Sensor nodes can also fail for a variety of reasons, including hardware failure, software failure, and purposeful attacks [20,21].
Fault detection is an important aspect to address because it aids in identifying the system’s susceptibility toward failure and assures the smooth operation of all appliances in smart environments. The timely correction of flaws improves quality, lowers costs, and increases the overall system’s efficacy. IoT technology has increased the quality of life by providing comfort, flexibility, and security. There is a necessity in IoT contexts to create a model that can help users solve real-world issues. The struggle is to keep a trail of defective appliances in a smart space. Many businesses do monitor manually, which makes it hard to explore each bend for any damaged appliances while performing strenuous tasks. There can be numerous diverse appliances deployed in a smart setup. Individuals are prone to making errors and may fail to notify and fix faulty appliances on time. Consider a health monitoring system for senior care, in which smart gadgets monitor the elder’s overall health. If an oxygen sensor fails, it will either halt reporting or indicate an incorrect oxygen level, which could be lethal. Human-based errors can thus be reduced by limiting human intervention. A flexible, scalable, dependable, and user-friendly atmosphere must be established. IoT solutions that are fault-tolerant and dependable boost the user experience. Detection of faults and timely rectification is crucial for controlling quality, in addition to reducing maintenance outlays and time. The necessity for fault-tolerant smart space has prompted several authors to devote their energies in this direction [19–37]. The next section discusses types of faults that surface in sensors and different techniques to handle them.
Sensor fault or oddity can be seen as deviation, inconsistency from normal behavior, or regular sensor readings [38–40].
In the Internet of Things context, the following are the main causes that can lead to the occurrence of faults as shown in Fig. 2.
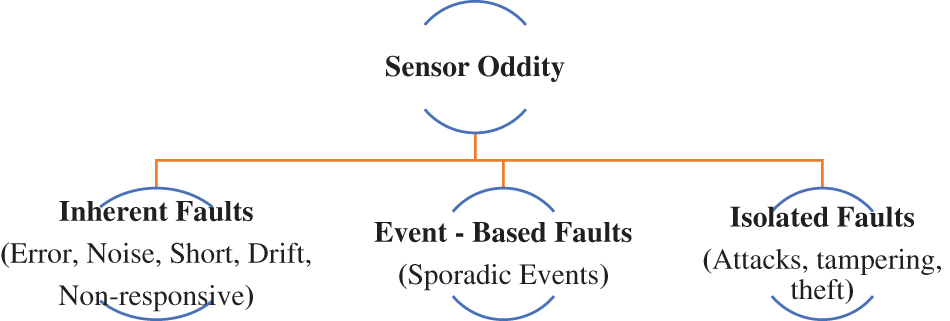
Figure 2: Sensor faults [43–47]
1. Inherent Faults: Conflicting or inconsistent readings gathered from faulty sensors compared to one from a healthy device can be referred to as inherent or intrinsic errors [40–43]. It is also taken as a noise-related error [43]. In this case, the sensor can give binary values which are either null value readings or no reading at all, thus called binary failure. Inherent errors can also be further categorized as [38]:
a) Constant: Unhealthy sensor reports a constantly very high or very low conflicting value.
b) Short: Faulty sensor feeds in a high-pitched reading between pairs of successive readings.
c) Noise: This fault affects several successive readings, increasing the overall variance of sensor readings.
d) Drift: Readings that deviate from the true value over time due to sensing material degradation, also called energy Depletion. Error in sensor readings due to aging [23,24].
2. Event-Based Faults: Sudden events or situations or sporadic events that can potentially affect the real-world state and sensor readings, forcing them to produce outliers like fire, floods, chemicals, etc., usually long-lasting [43,44].
3. Isolated Faults: Faults caused owing to scattered events like malicious attacks, tampering with sensors [43], theft, eavesdropping, or traffic monitoring, jamming, modification, sparse data, etc., can be categorized as Passive Attacks or Active Attacks [44–47]. Intermittent connectivity issues in the routing of sensors’ data can also give rise to faults like missing data, sparsity, and uncertainty.
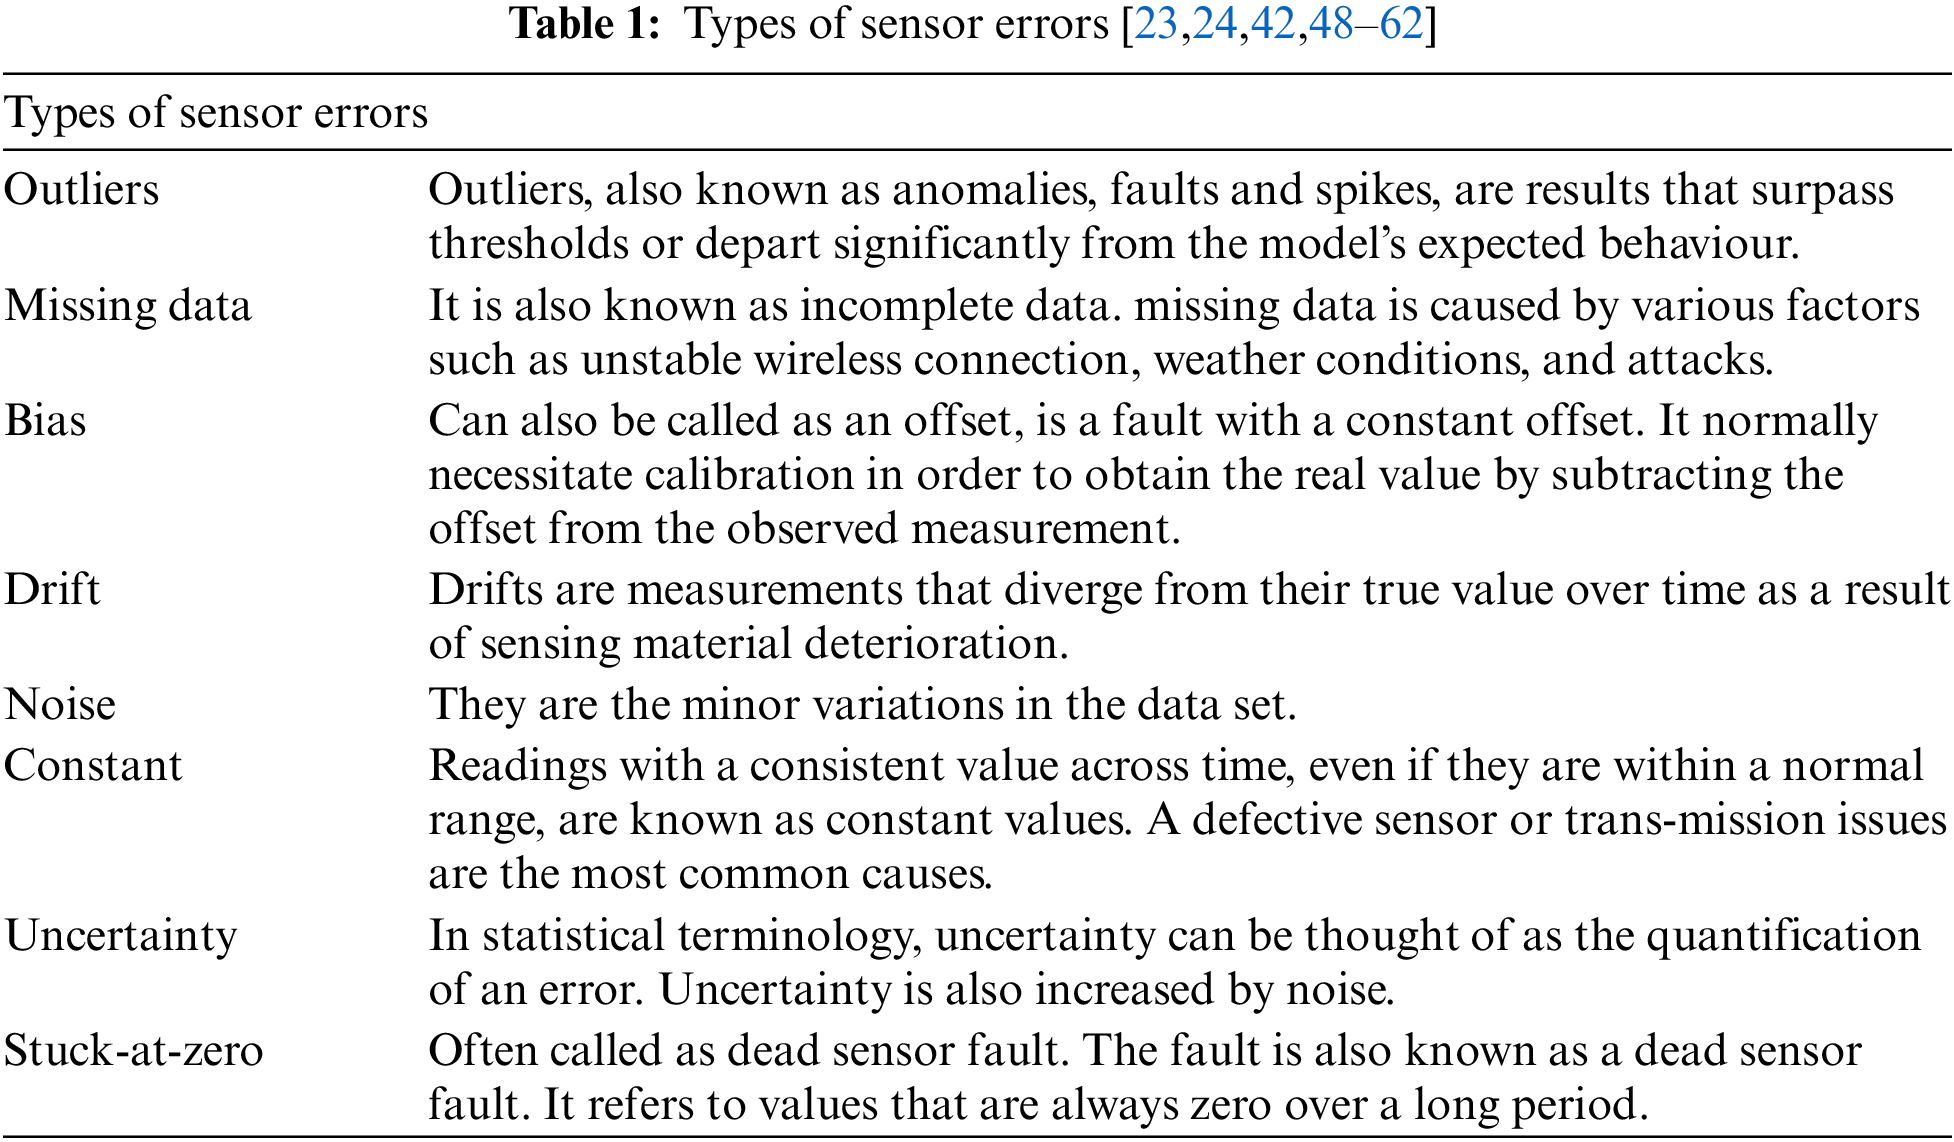
Faults can be the result of various errors in sensor data. These errors can be broadly categorized into different types of sensor errors as elaborated in the next section.
An IoT application may have numerous sensors producing huge volumes of data. This version of the data extracted becomes unusable if it contains errors. This is because the data quality induced by sensor errors can lead to inappropriate decision-making. There are several kinds of sensor errors or faults. Table 1 lists the variety of faults that were discovered.
Outliers are being addressed by many researchers using various fault detection techniques. Some of the important techniques are deliberated on in the following segment.
3.2 Fault Detection Techniques
Detection of faults is critically significant for a real-life smart workplace like health monitoring, childcare, environment monitoring, etc., as its smartness is justified on smart devices or sensors. Sensors, being electronic devices, can go out of order, leading to faulty readings. Faults can be detected by identifying oddities or outliers from the data supplied by sensors. Outlier detection techniques track the drift, noise, sparsity, duplicate values, anomaly, or deviation of sensor data from regular patterns.
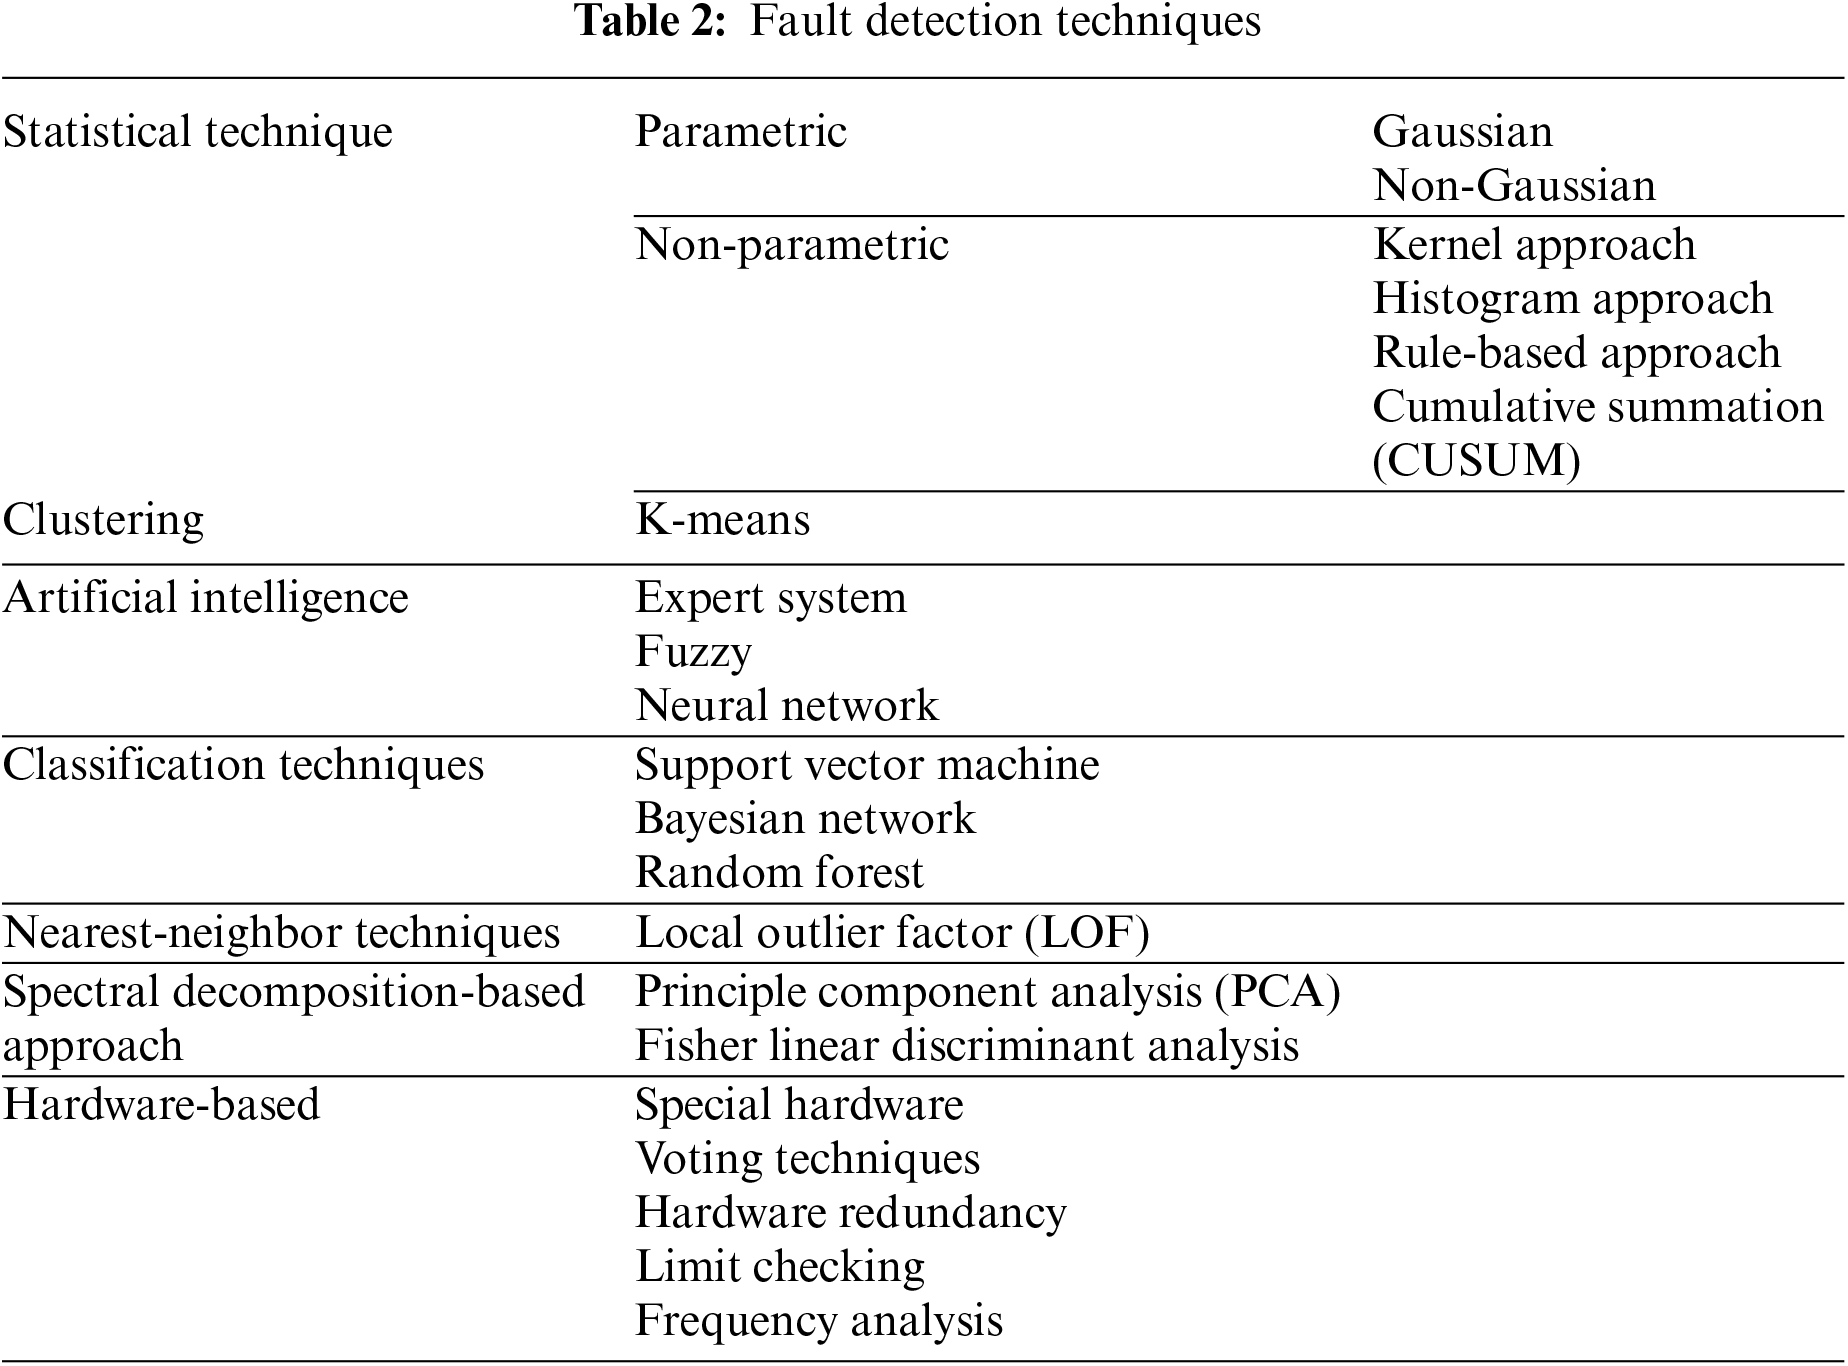
This oddity affects the quality and performance of the smart system. Many fault detection techniques/models can be applied in varied branches as shown in Table 2 [38,42,44,63–70].
Statistical techniques are the most used and former method for detecting sensor anomalies and faults. First, the distribution parameters are calculated. This technique then assumes that the data points obtained from sensors being analyzed can be recognized as anomalies if the likelihood of those data instances is very low [42,55,71–75]. Using past sensor measurements, this method approximates and builds a model of a sensor’s accurate behavior. When a fresh measurement from the same sensor is recorded, the data points are compared to the model to see if it is statistically discordant with the model. If the model is not well-suited to the new sensor readings, it is labeled as an outlier or a bad measurement. Statistical models are useful for dealing with real-valued quantitative data. But if the complexity and volume of sensor data grow, as it does in the case of IoT, this approach will elongate to analyze and transform the complex data.
All statistical techniques operate in two stages [70–75].
• Training: It involves constructing a statistical model based on the data available.
• Testing: Data instances are tested against the model built for oddities or outliers.
Statistical techniques can be of two types: parametric-based approach and non-parametric-based approach [43,45,55] as shown in Fig. 3.
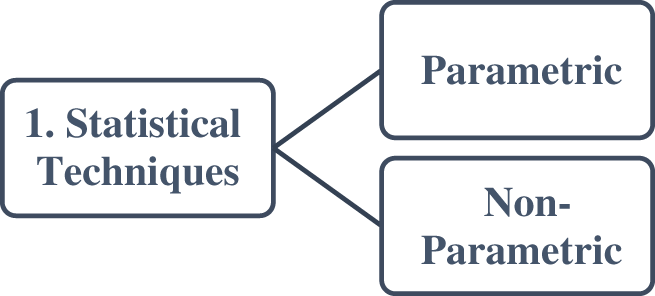
Figure 3: Statistical techniques
Parametric techniques are appropriate when the data’s underlying distribution type is fully understood. For provided data, a distribution or probability model(s) is explicitly undertaken. The parametric method’s primary premise is that a collection of pre-set parameters is used to determine a probability model. Parametric approaches are quite application-specific. Parametric techniques can be classified further as Gaussian and non-gaussian models [43,44,74–82], as shown in Fig. 4 below.
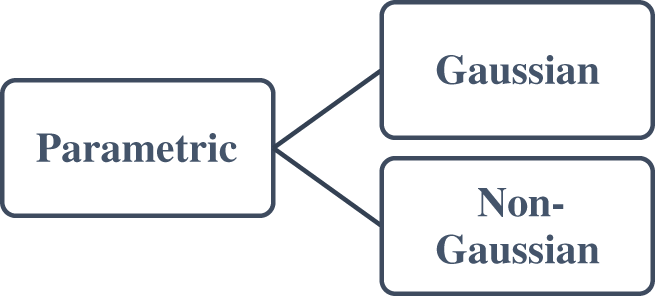
Figure 4: Parametric techniques
a) Gaussian Model: The data in a Gaussian-based model are considered to be regularly distributed [44,53,77–82]. Firstly, the mean and variance of the normal distribution are calculated based on maximum likelihood estimations. Then, as per the parameters of the datasets and distribution and the desired number of outliers, various anomaly tests are performed. Outliers are defined as a small percentage of points in a population that have a low probability of occurrence.Regression can be used to build a model if the probabilistic model is uncertain [68]. Time-series data is subjected to extensive outlier detection utilizing regression algorithms [80]. Firstly, a data-fitting regression model is built (linear or non-linear). Afterward, each data point is tested against the build model. If there is a substantial difference between the basic value and the regression model’s predicted value, the data point is labeled as an outlier [53,71,83–87].
Highlights:
• It is possible to employ a combination of probabilistic models called the Gaussian mixture model for both labeled and unlabelled data.
• With proper probability distribution, it can efficiently detect the sensor’s oddity and faults.
Challenges:
• It can only handle one-dimensional outlier data.
• It consumes a lot of memory for a node to store old values.
• If a large number of parameters are there, the correlation becomes complex, and a high computational cost is involved.
• Because much data does not come from a Gaussian-distributed source, it is not useful for many modeling applications.
• In the context of smart workplaces, the historical distribution of sensor data is not available. In that case, the parametric statistical method becomes irrelevant.
b) Non-Gaussian Model: Data are not ordinarily distributed in a non-gaussian model. The spatial-temporal correlation of sensor data is used in this technique to detect outliers locally [88–90].
Highlights:
• Historical correlation can be used to detect outliers. Any anomaly or conflicting reading will affect the correlation negatively. Outliers can be traced easily.
• Local transmission lowers communication costs.
Challenges:
• Non-parametric statistical techniques cannot handle data scalability as in the real-time smart workplace.
• For sensor data and cluster-based models, this form of distribution is unsuitable.
• It is also vulnerable to network topology changes that happen in real-time.
Non-parametric fault detection algorithms make no assumptions about the data’s distribution [68]. These strategies are appropriate for asset-compelled sensor networks where information dissemination might change habitually. For instance, these progressions can be brought about by the energy consumption of sensors over the lifetime, which influences the stability and would thus be able to control inconsistency-based interruption discovery [62]. Fig. 5 shows further types of non-parametric techniques.
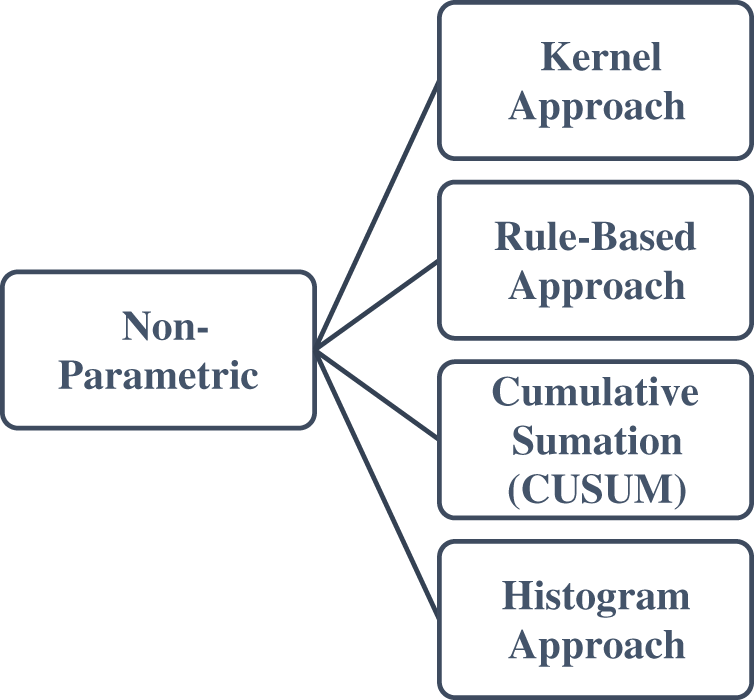
Figure 5: Non-parametric techniques
a) Kernel Approach: This includes utilizing Kernel capacities to surmise the real thickness dissemination. Any instance that lies in the low likelihood space of this thickness is announced to be an anomaly [62,71,91,92].
Highlights:
• The probability distribution function of the kernel approach applies to both univariate and multivariate data.
Challenges:
• The Probability distribution function assessment for multivariate information is considerably more computationally costly than for univariate information.
• The kernel thickness assessment strategies used get fairly inefficient in outlier locations in the case of high-dimensional data.
b) Rule-Based Approach: The anomaly detector in rule-based detection develops heuristics to recognize and classify data points as an outlier or normal using predefined rules or expert knowledge. These rules are nominated suitably and applied to the watched data. An anomaly is proclaimed when the rules describing an abnormal state are met [42,71,93–95].
Highlights:
• This strategy works best when the kinds of issues can happen and the techniques to distinguish them are known and deduced.
• This methodology predominantly cleans the information and relieves the strain on domain specialists before undertaking any data analysis.
• Parallel sensor inconsistency or binary anomaly can be detected using the rule-based method.
Challenges:
• The detection performance strongly relies on the rules defining what constitutes a significant deviation from being chosen correctly.
• When many sensors are put in a given environment, it becomes less feasible and error-prone.
• Specifying all of the valid rules for number sensors is tough.
c) Cumulative Summation (CUSUM): CUSUM calculations identify changes in mean qualities without expecting any information about the fundamental information conveyance. It consecutively gathers data points greater than the mean worth recorded under ordinary conditions. When this CUSUM value is compared to a pre-set threshold, an anomaly is discovered [62,74,75,85,86,96].
Highlights:
• Simple to implement.
• No prior information regarding the distribution is needed to implement this technique.
• Efficient in detecting network attacks like sinkholes, jamming, denial of services flooding, etc.
Challenges:
• A compromise between the false positive rate and detection rate needs to be examined additionally by playing on CUSUM calculation boundaries.
• The CUSUM approach can just screen each component or variable in seclusion and is not appropriate for observing the relationship between elements.
d) Histogram Approach: Histogram methods essentially depend on the recurrence or counting of information. The histogram-based anomaly identification approach is commonly applied when the information has a solitary element. Data profiles are maintained using histograms. These profiles can represent normal data, outliers data, or mixed. These methods normally characterize an action between a new test occurrence and the histogram-based profile to decide whether it is an exception or not [38,53,71,87,95–98].
Highlights:
• Histogram-based location techniques are easy to execute and, subsequently are very famous in the area of outliers’ discovery.
• The histogram model works well for discrete sensor values and sensors with a subjective number of modes.
Challenges:
• This approach demands a large volume of data to operate efficiently and accurately.
• The histogram is not capable of underpinning the correlation of varied attributes in the case of multivariate data.
• Inefficient with high dimension data.
In this approach, clusters of similar data points are created and the readings that stand out remotely from the regular cluster are identified as abnormal values or outliers [43,45,99–101]. Clustering also includes K-means clustering as depicted in Fig. 6.

Figure 6: Clustering techniques
a) K-means: It is used where information is not labeled. It forms clusters of objects of similar nature. K in regards to “K-means” is the number of groups formed. K random data points are selected as centroids. Afterward, all data points are assigned to the centroid nearest to them. Datapoint not assigned to any centroid is considered an outlier. K-means are mostly used for feature selection [6,102,103].
Highlights:
• The clustering model is easily adaptable to incremental form once clusters are formed and data points are fed in and tested for outliers.
• It can be utilized to reduce space complexity for detection.
• Data lost from IoT sensors can also be recovered using clustering.
• Best suited for detecting outliers in IoT historical data.
• Supervision is not required.
Challenges:
• It proves to be costly with multivariate data.
• Not adaptable to changes in IoT data.
Artificial Intelligence branches knowledge systems, neural networks, and fuzzy logic are the latest area of research for anomaly or outlier detection in the field of IoT presented in Fig. 7.
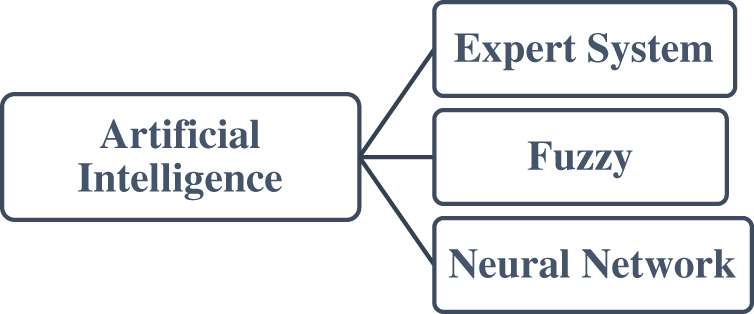
Figure 7: Artificial techniques
a) Expert System: These are the systems that integrate facts/knowledge of a particular instance with the expert information available in the knowledge base. The knowledge base is dynamically built with each data point. And inferences from the knowledge base are used to detect outliers [104–106].
Highlights:
• Expert systems are very easy to build and implement.
• Explanation and reasoning are transparent and easy to understand.
Challenges:
• They are domain and system dependent.
• A knowledge base takes gradual time to build efficiently.
• Data points beyond the knowledge base cannot be correctly diagnosed.
b) Neural Network and Fuzzy: It is a concept rendering a logical model that analyses the entire sensor data for making a decision [43,53,107,108]. On the contrary, fuzzy logic defines correct/standard sensor readings based on transition values like yes/no, right/wrong, or high/low. The Fuzzy logic technique can be utilized to recuperate decision-making, and quality of service and, ultimately, discover sensor faults and oddities.
Highlights:
• The inherent model generalizes the sensor data points and thus can work even if the sensor feeds in noisy, poor, or fragmented data.
• Re-training of the model is often not required when a new smart device or sensor is added to the system.
Challenges:
• The model must be trained on a simulated dataset before being implemented in a real-life smart setup.
• An increase in the count of variables will also increase the number of rules that are employed to infer the decision.
Classification techniques are an integral part of data mining and machine learning. No prior knowledge of the dataset is required. Using a set of predefined sensor data points or training points, classification approaches try to find a classification model termed a classifier and then organize obscure data items into either of two learned groups viz normal or outliers [43]. Whenever a new sensor is added, these techniques require updates to accommodate new sensor data in the normal class. These techniques are well-suited for the detection of faults and outliers [109]. These techniques operate in two-phase training: the model where labeled data is utilized for classifier learning and the testing or experimenting where instances are tested for normal data or faults [62,110–113]. Further classification can be viewed in Fig. 8.
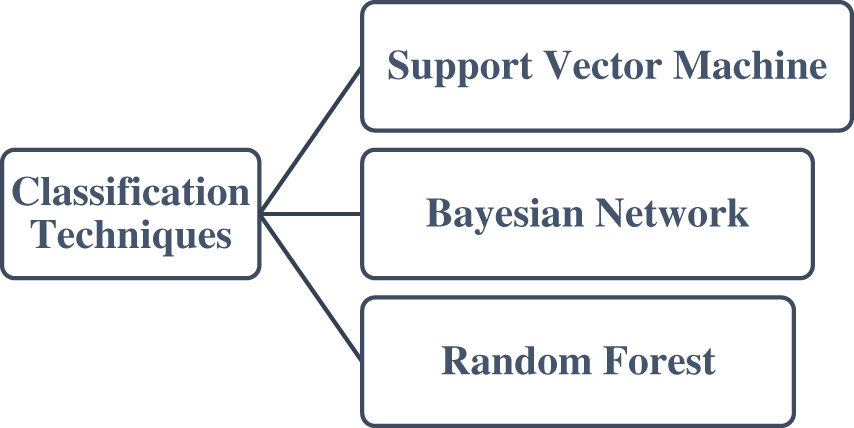
Figure 8: Classification techniques
a) Support Vector Machine (SVM): The SVM approach assigns new variables to one of two categories based on non-probabilistic bilinear classification. Vectors of data points are transformed from their input space into a space with greater dimensions based on the observed features. SVM models separate data as points in space, ensuring a wide distance between their respective classes. The normal data is located in the feature space, while the anomalous feature deviates from the normal model in the feature space [6,62,114–117].
Highlights:
• No dependency on any statistical model.
• Quite accurate.
• The algorithm is optimized for smaller datasets that are cleaner.
• By maximizing the decision boundary margin, an optimal classification solution may be found.
• Dimensionality issues can be avoided.
Challenges:
• For training purposes, obtaining error-free or labeled data is essential.
• It is more complex as compared to statistical or clustering techniques.
• It is not appropriate for large data sets because much time is needed to train the data model.
• For loud datasets with covering classes, this strategy is less effective.
b) Bayesian Network (BN): A Bayesian organization, otherwise called a belief network/casual network, is a probabilistic graphical model. It utilizes a non-cyclic directed graph to show a bunch of factors and their contingent conditions dependent on Bayesian deduction. BN is a simplified representation of the interdependencies inside a collection of measured values described by variables of interest, such as cause occurrence, symptoms, or faults, with nodes and directed edges representing the causal links between them. The fitted Bayesian network model is utilized to get an estimate for fault detection. This is accomplished by creating a specific sensor as a theory and the other associated sensors as evidence. The posterior probability distribution of the specific variable, which is the output, is used to evaluate the likelihood of measuring the recorded sensor data value. It is distinguished as odd or as anomalous if the likelihood is less than a user-defined threshold [6,107,118–121].
Highlights:
• It can deal with uncertainty and make causal deductions.
• Understanding and updating the model is made easier by graphical representations of causes, flaws, and their interconnections.
• This method proves to be efficient for small datasets.
• It can handle high dimensionality in data.
• A significant issue that can be addressed by utilizing the Bayesian network is taking care of noise in IoT gadgets.
Challenges:
• The disadvantage of Bayesian networks is that constructing a probabilistic model of the relationships between the variables necessitates expert knowledge.
c) Random Forest: A random forest is a collaborative approach by constructing decision trees of varied samples. It then records widely held votes in case of classification and considers the average for regression to make suggestions. Models are built by employing random forests to track the abnormality in data points [6,122–125].
Highlights:
• Multi-dimensionality can be managed easily.
• The method is quite stable.
• It is effective in handling missed data.
• The problem of overfitting can be solved.
• Large datasets can be tackled efficiently.
Challenges:
• It is quite slower as compared to other techniques.
• It required a quality resource number to train the model.
3.9 Nearest Neighbor Technique
The nearest neighbor technique is based on proximity. It is a frequently used method for analyzing sensor data points concerning its closest neighbors. To distinguish between anomalous and accurate readings, the nearest-neighbor technique relies on the distances between sensor data measures. It can be implemented as LOF, as shown in Fig. 9.

Figure 9: Nearest neighbor techniques
a) The Local Outlier Factor (LOF): LOF is an excellent illustration of the nearest-neighbor method that assigns a defect or outlier score to each sensor reading based on the number of measurements surrounding its k-nearest-neighbors and the number of measurements around the sensor reading. The density surrounding a local data point is compared to the density around its k closest neighbors in this method. A minimal radius surrounding each data point’s values is calculated, ensuring that at least k closest neighbors are included. The outlier factor of a data point is determined by the ratio between the local radius and the average neighborhood radius [43,126–129], or readings with high scores are considered outliers.
Highlights:
• LOF can be easily applied to a variety of data supplied by heterogeneous types of sensors.
• It is a density-based technique that can help detect local outliers easily.
• It can be left unattended once a sufficient distance metric has been defined for the data.
Challenges:
• The cost of computation increases with multivariate complex data generated by IoT.
• There are scalability issues with this method.
• When it comes to sensor problems and outlier detection, it frequently provides a high false-negative rate.
3.10 Spectral Decomposition-Based Approach
These approaches are used to deal with the challenges associated with high data dimensionality. This category of techniques performs feature selection and can be thought of as outlier identification pre-processing. If a point is located in a local region of exceptionally low density in a lower-dimensional projection, it is considered an outlier. As a result, outliers in these lower-dimensional projections can be found simply by looking for projections with lower density [43,71,130]. It is further classified as shown in Fig. 10.
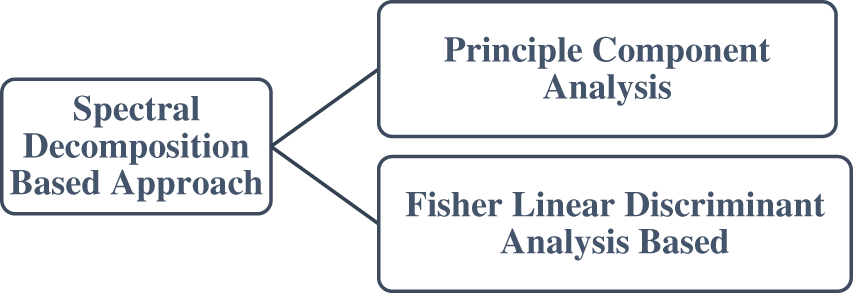
Figure 10: Spectral decomposition techniques
a) Principle Component Analysis (PCA): PCA is a versatile technique that can be used for various tasks, including defect identification. This method aims to use principal components to uncover normal modes of behavior in the data. It is a mathematical approach that uses an orthogonal transformation to reduce many correlated variables to a smaller number of uncorrelated variables known as principal components. The first principal component accounts for as much variability as feasible in the data, and each subsequent component accounts for as much variability as possible in the remaining data. The data is projected in the highest variance direction. Outliers are data points that deviate from these rules [44,53,63,131–135].
Highlights:
• In a lower-dimensional space, it finds the most precise data representation.
• It is a useful tool for analyzing data points in high-dimensional data.
• It can operate in an unsupervised mode also.
Challenges:
• PCA necessitates fault-free training data, which is uncommon and difficult to come by.
• There is also an issue of determining the ideal number of primary components, which varies depending on the application.
b) Fisher Linear Discriminant Analysis Based: This technique is a classification algorithm that projects high-dimensional data onto a line and performs classification in that space. Fisher’s basic notion is to maximize the separability of two known groups by constructing a new linear axis and projecting data points along with it, to make the best classification decision possible. Thus, the projection maximizes the distance between the means while minimizing the variance within each class. The data is shielded in the direction of maximum variance, just as in PCA. Outliers are data points that deviate from the norm [41,133–136].
Highlights:
• We can identify an ideal threshold for binary classification and classify the data based on it.
Challenges:
• Distance between the projected means is not an optimal measure as a standard deviation within the classes is not considered.
• Fisher requires supervised data to determine the best direction to project the input data.
3.11 Hardware-Based Techniques
Hardware-based techniques are not model-based, which means they do not base their fault detection on any model. Rather, they deploy various hardware-based techniques as mentioned in Fig. 11, to diagnose abnormalities in data [104,137–145].
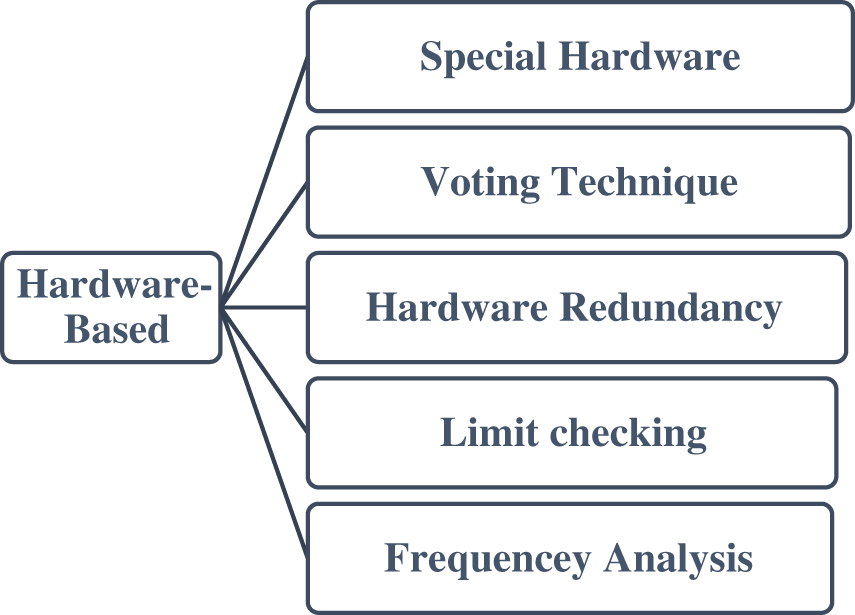
Figure 11: Hardware-based techniques
a) Special Hardware: A special sensor is integrated with devices to record measurements as data values. These data values can be further checked again for normal/expected values or an outlier.
b) Vote Checking: This technique is regularly utilized in frameworks consolidating a high level of equal equipment overt repetitiveness. An odd value coming from a sensor, along with other parallel sensor values deployed to measure any particular variable, is considered faulty.
c) Hardware Redundancy: Multiple sensors are incorporated to measure a single variable. The data point from any sensor falling apart from other data points is considered an outlier.
d) Limit Checking: Data points or device readings are checked against a valid threshold.
e) Frequency Analysis: Some kind of data point pattern may sometime take as abnormal behavior, even if the data point individually shows normal behavior. If the frequency of such a pattern can be analyzed and isolated to detect the fault.
Combinations of various hardware techniques can also be used. For example, special hardware can be integrated with limit checking. Or, Redundant data points can be filtered as faulty or non-faulty based on voting technique, etc.
Highlights:
• Hardware-based techniques are easy to implement and understand.
• No mathematical model or model training is required.
• They have comparatively fast runtime.
Challenges:
• In the case of hardware redundancy, extra cost and space for implementing and managing the redundant device are involved.
• In the case of special hardware, additional costs must be incurred.
• If thresholds are not calculated properly, the false alarm rate increases.
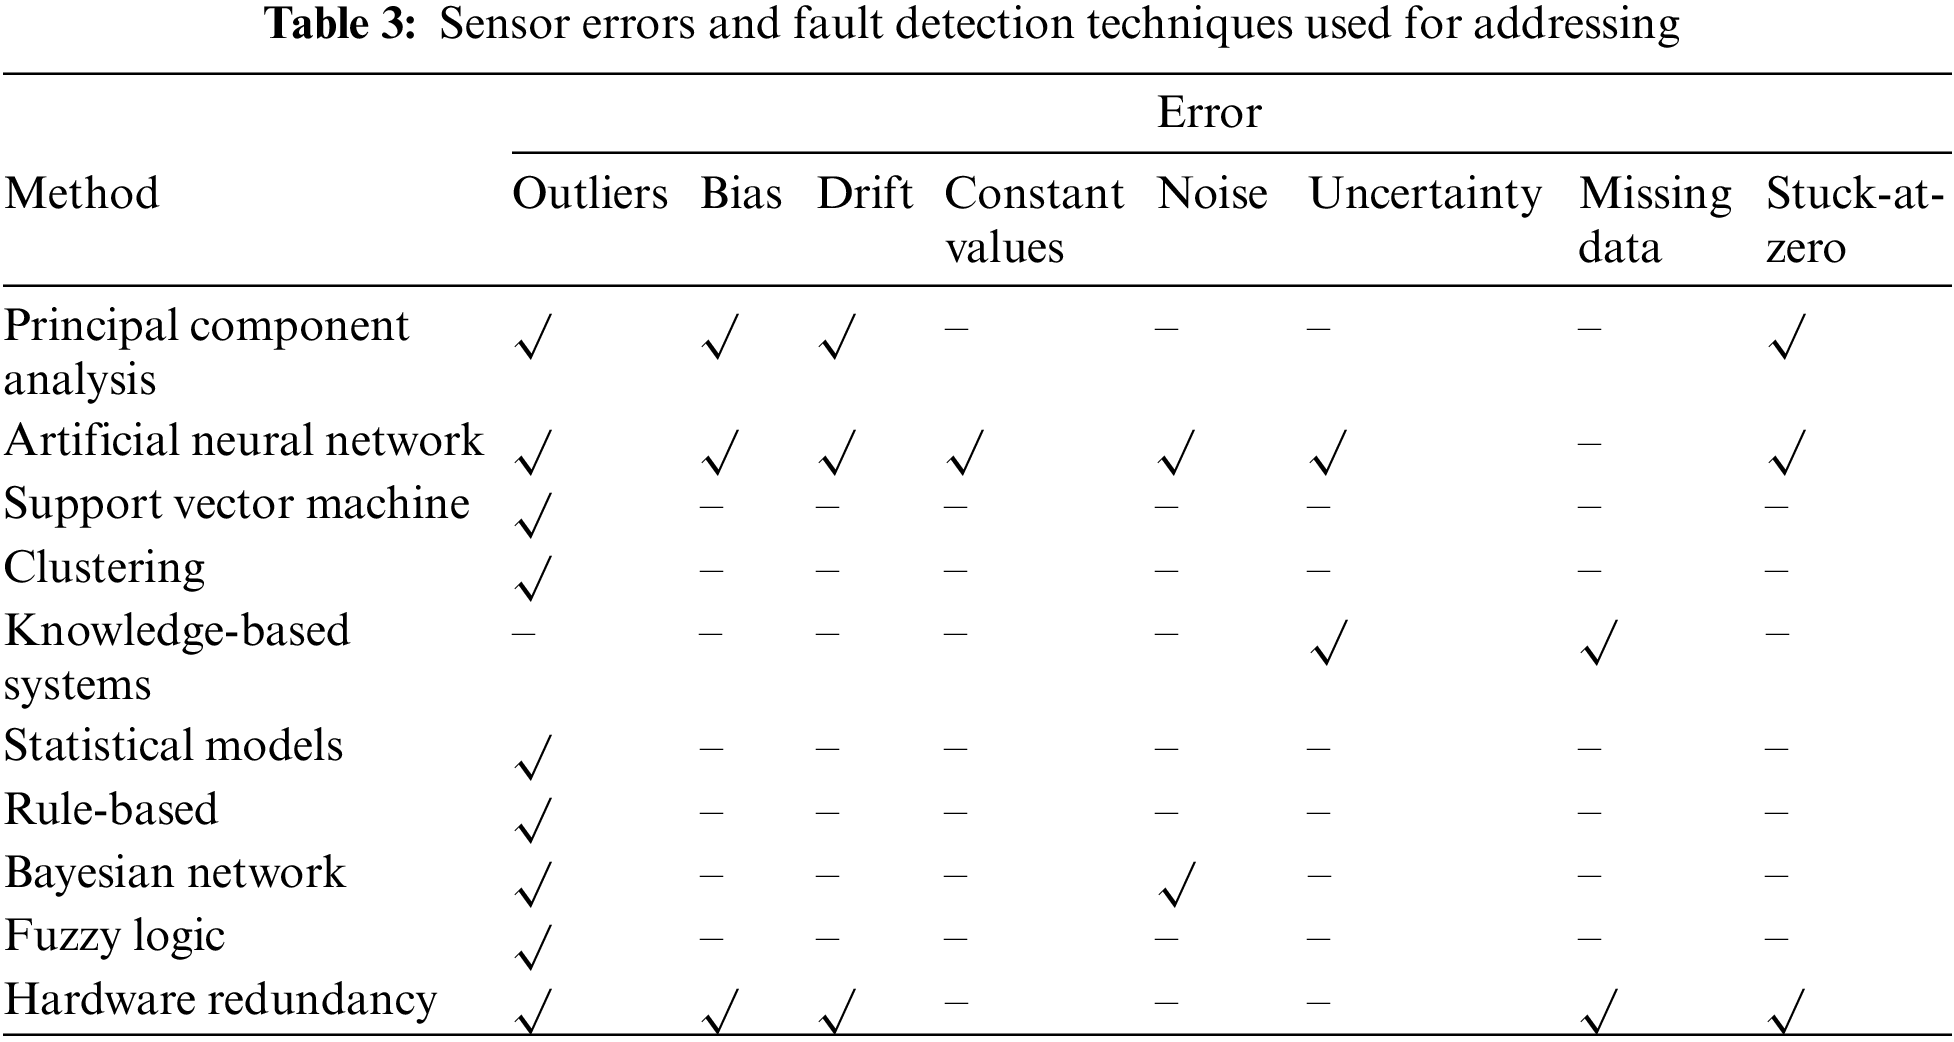
All the fault detection methods can be employed to address different types of sensor faults according to the literature surveyed described above as shown in Table 3 [51–53,87,126,127,146–150].
The basic framework and pseudo-code for applying any fault detection technique are shown in Figs. 12 and 13, respectively.
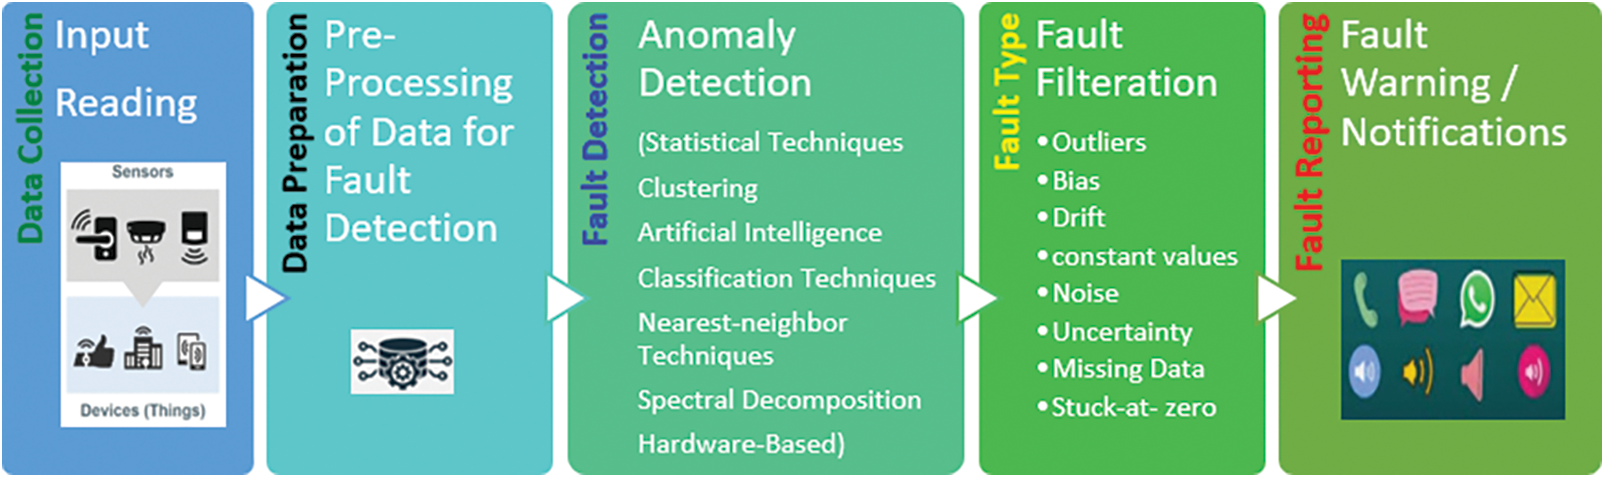
Figure 12: Fault detection framework
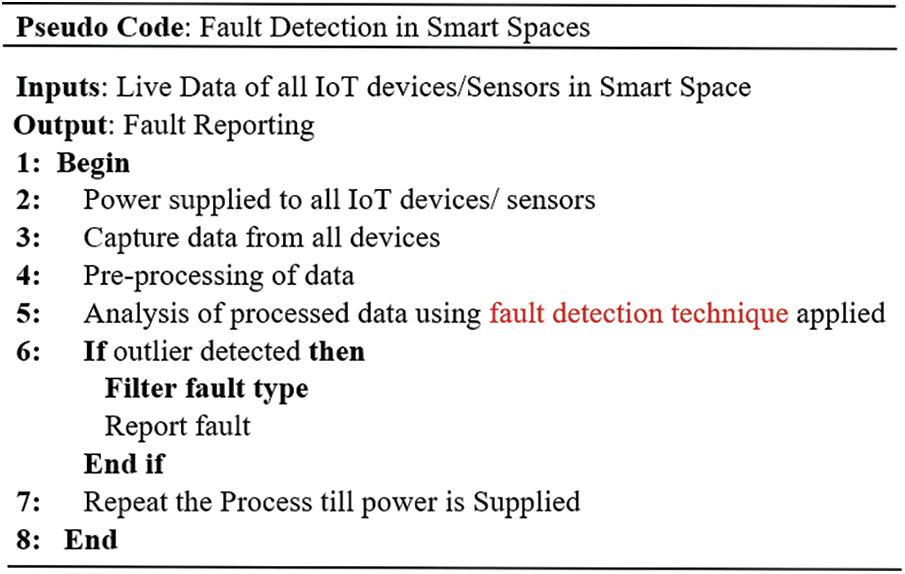
Figure 13: Pseudo-code for fault detection
Subsequent to the extensive survey carried out above, the following are the observed gaps/future directions for aspiring researchers:
1. No paper up till now can exhibit all the existing fault detection approaches along with their working methodology and key features, challenges, and evaluation metrics in one place.
2. It assists the researchers in comprehending the faults that are still not addressed by any fault detection techniques.
3. Hardware-based methods are not widely researched or developed. Hardware replication/redundancy is an outmoded tactic for detecting faults. It includes additional heft, expanse, space, and upkeep of redundant devices. The detection of truthful and odd measurements is based on the estimate of redundant data, which might be impacted briefly and is unreliable. Fault detection is solely based on varied limits calculated using various techniques. Drift and gadget conditions are not considered when determining threshold limits. The indicator only evaluated the device’s current levels.
4. Timely current variations/spikes were not given much thought.
5. Other variables influencing the device’s current consumption, such as device aging and the frequency of repairs, were never considered.
6. Unplugged sensors were not expected or taken into account.
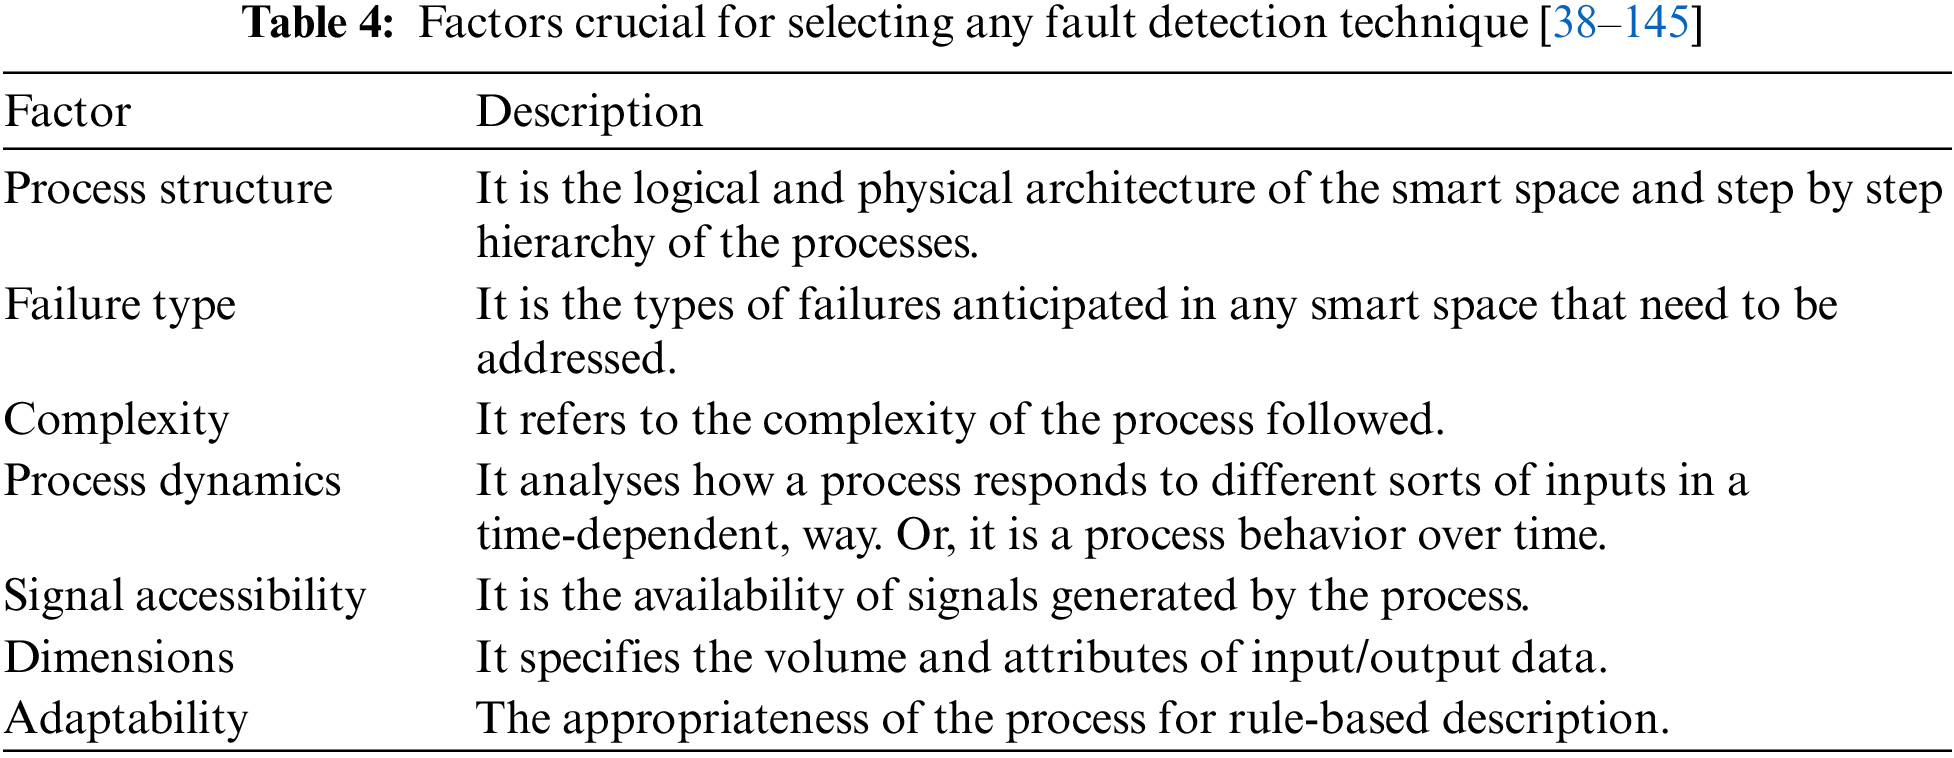
Early problem identification may save production costs, lengthen equipment life, decrease downtime, and boost safety. Some more conclusions can be drawn from the study conducted proceeding two tables. When selecting a certain defect detection technique, several factors mentioned in Table 4, must be considered.
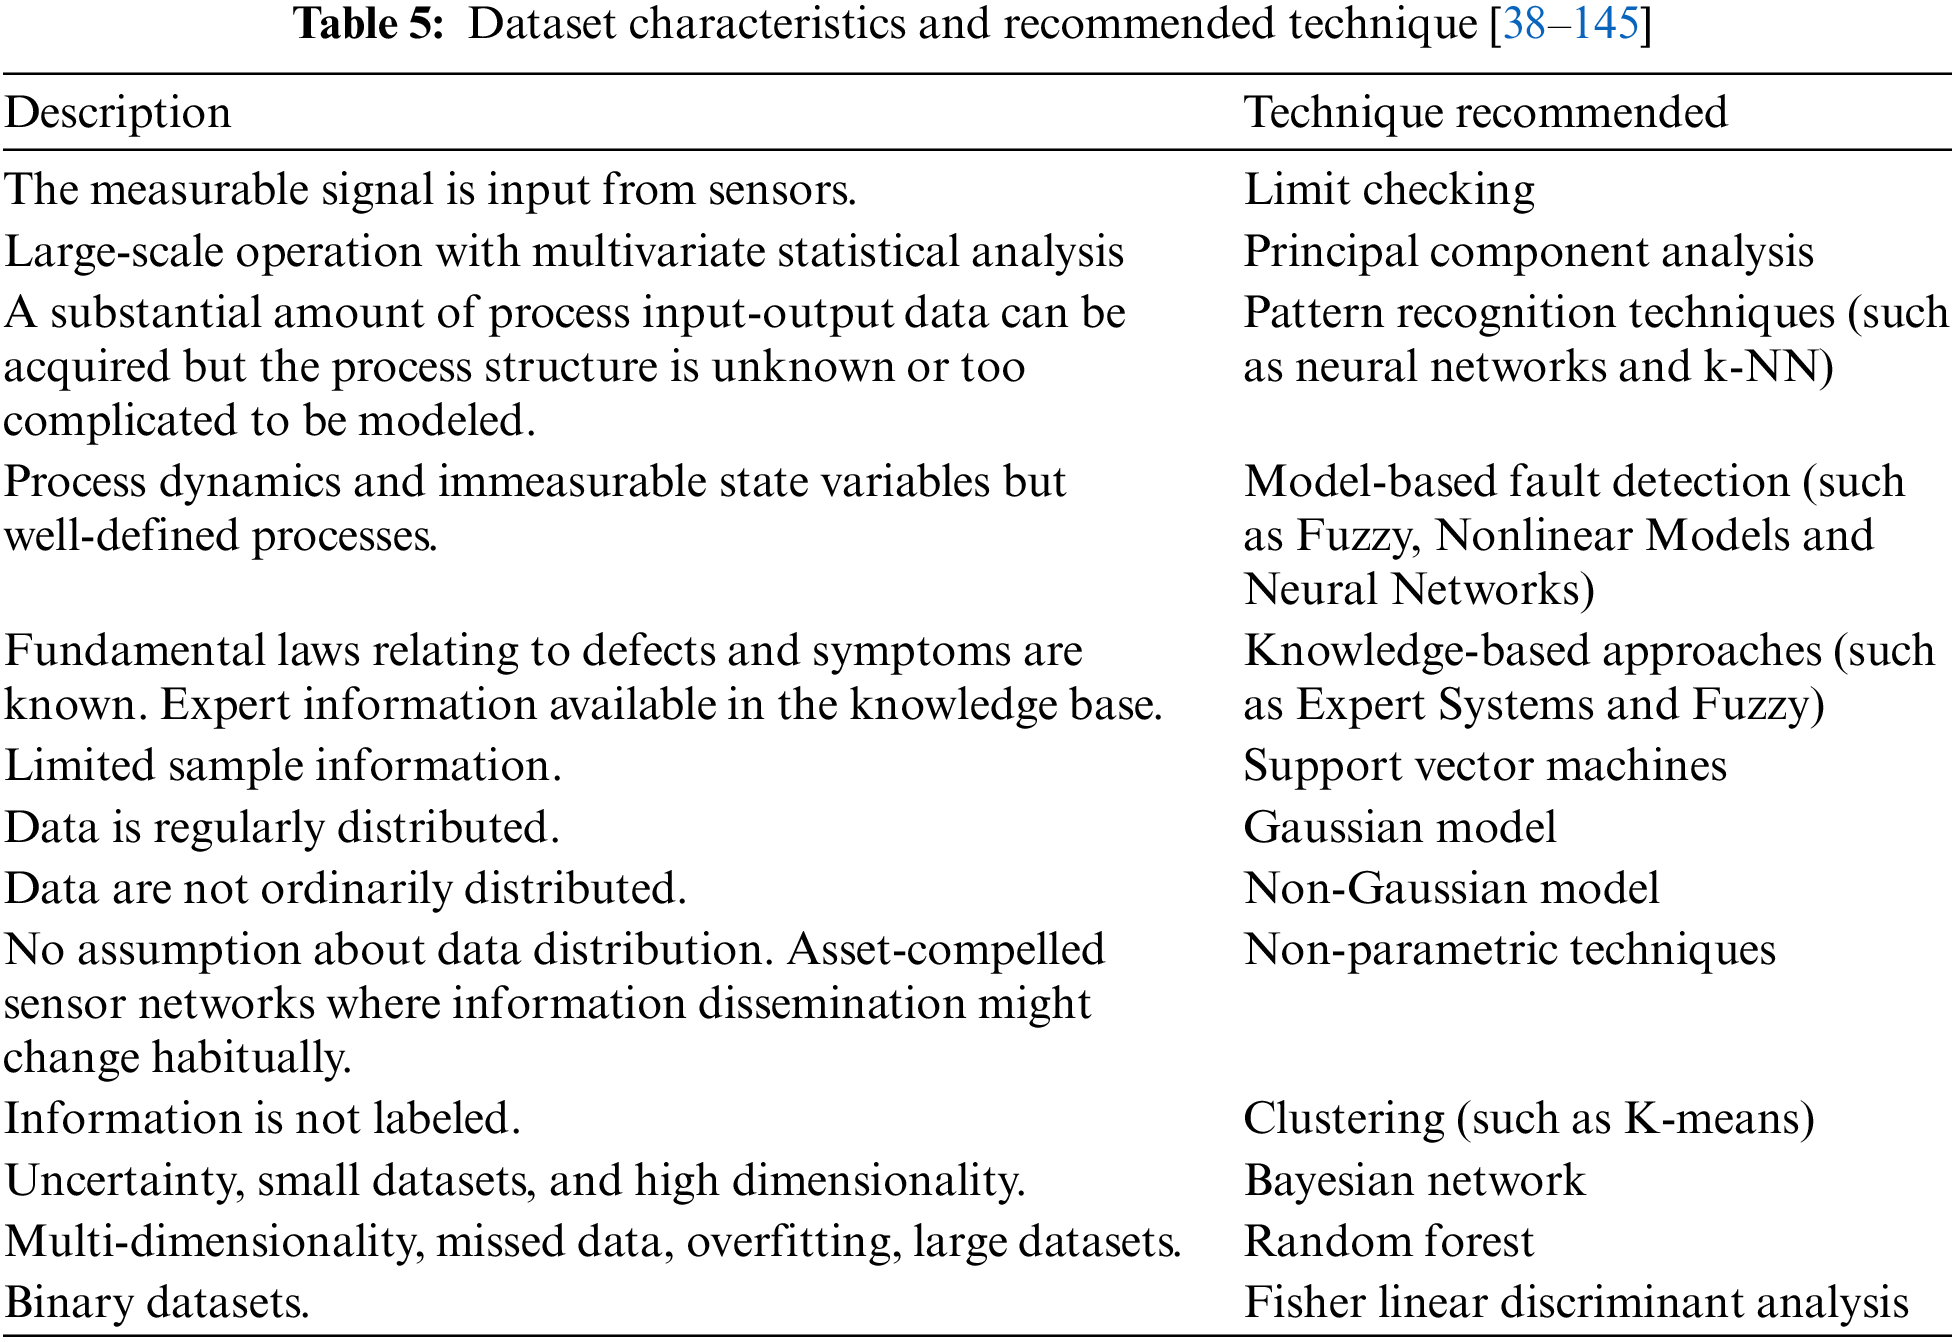
The type of fault detection technique utilized can be based on varied dataset characteristics as discussed in Table 5.
The next section states various metrics commonly used for the performance evaluation of a fault detection technique.
4 Metrics for Evaluation of Fault Detection Techniques
Performance metrics for any fault detection technique verify how good the technique is. A confusion matrix [119,151–154] can be taken as the basis for evaluating the outcomes of a fault-detecting technique as given away in Fig. 14.
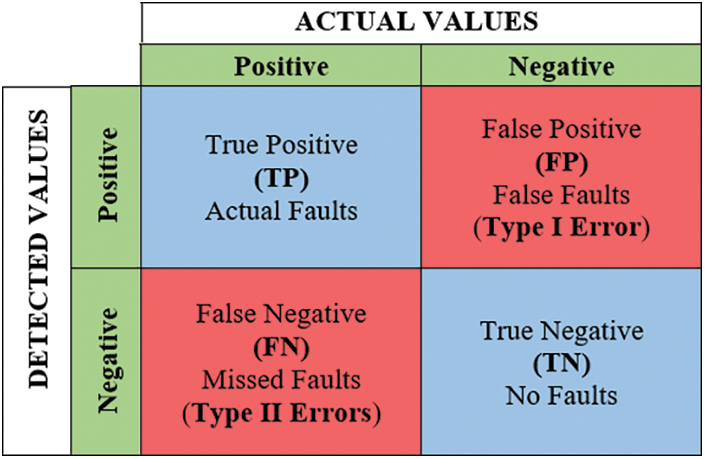
Figure 14: Confusion matrix
Fault detection may result in any of the following results based on ground truth readings:
True Positive (TP): If a fault appears and the technique reports a fault.
False Negative (FN): If a fault appears, but the technique reports no fault.
False Positive (FP): A false alert is a term used to describe a false alarm the minute no fault appears, but the technique reports faults.
True Negative (TN): If no fault appears and the technique reports no faults.
No Detection (ND): The technique reports no fault.
Following are basic metrics [119,151–154] that utilize the confusion matrix for validating any fault detection technique as shown in Table 6.
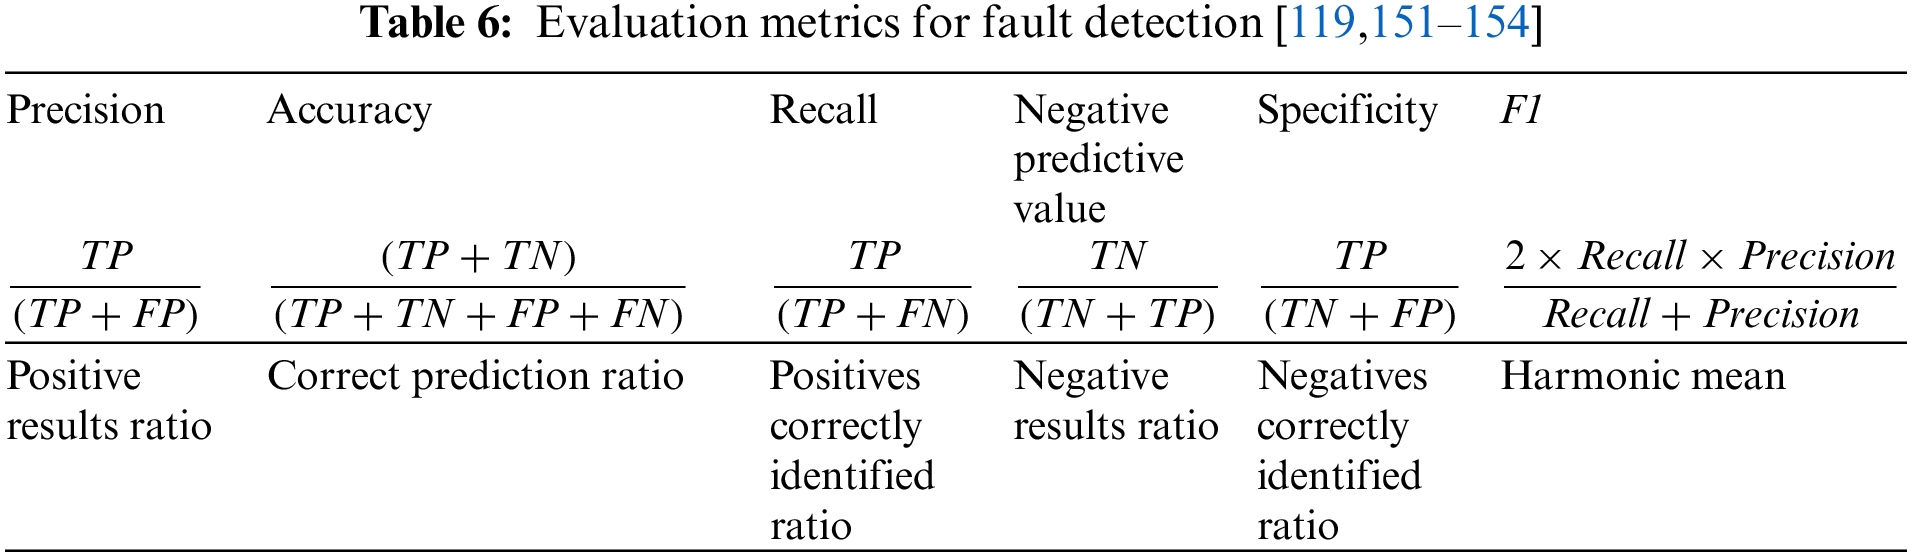
Precision: It produces a percentage of positive outcomes.
Accuracy: It calculates the percentage of accurate detection.
Recall: It computes the data’s completeness.
Negative Predictive Value: It produces the percentage of negative outcomes.
Specificity: It produces the percentage of faults that are correctly identified.
F1-measure: It determines the efficacy of the suggested technique.
The range for these metrics is between 0 and 1. These ratios assess the performance of a fault detection algorithm where 1 is considered the best value, and 0 is the worst.
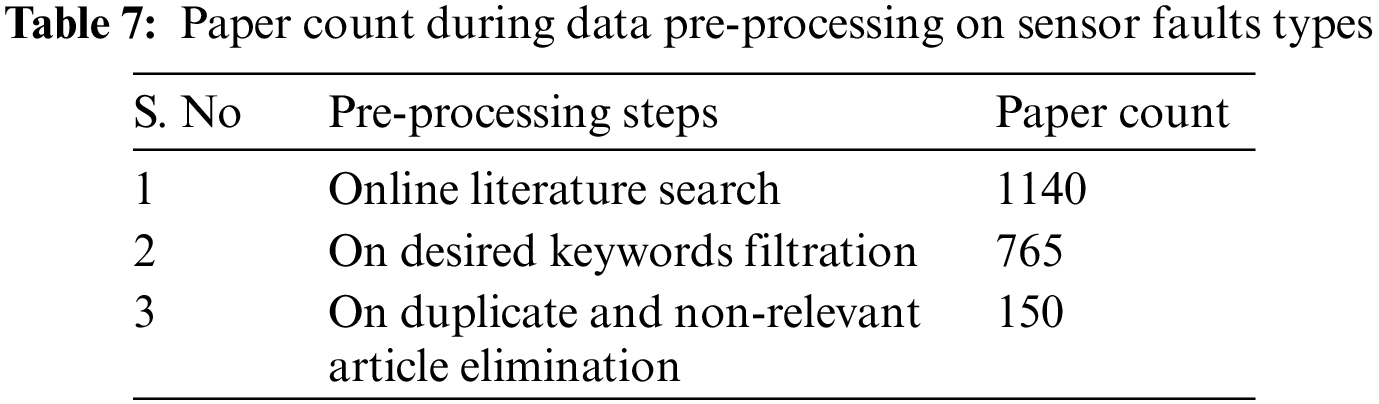
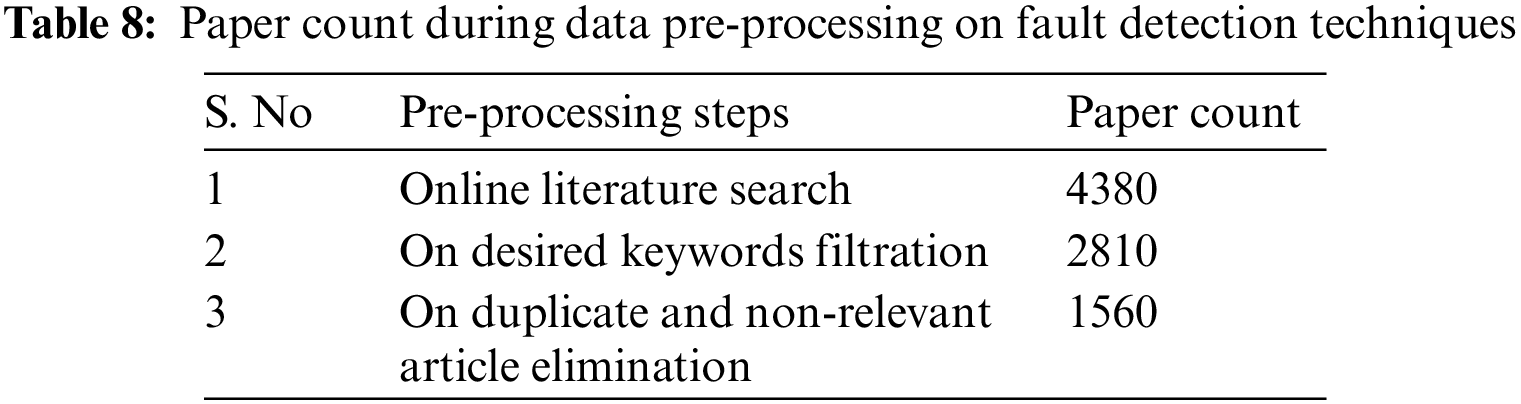
A bibliographic dataset is analyzed for over a decade since 2011 after referring to literature datasets like IEEE Xplore, Elsevier, ScienceDirect, Hindawi, Google Scholar, Taylor and Francis, Directory of Open Access Journals (DOAJ), Mendeley, Wiley, Association for Computing Machinery Digital Library (ACM DL), SPIE, Journal of Eye Movement Research, MDPI and CiteSeerX. Tables 7 and 8 show how the datasets were pre-processed to get the most relevant publications for analysis of Sensor fault types and Fault detection techniques.
The following results can be concluded after analyzing the dataset processed in the above step. Fig. 15 shows that maximum work of about 30% and 37% have been done on outliers/anomalies and noise sensor faults. Also, faults like Stuck-at-Zero and Constant Value are somewhat unattended and need to be worked on.
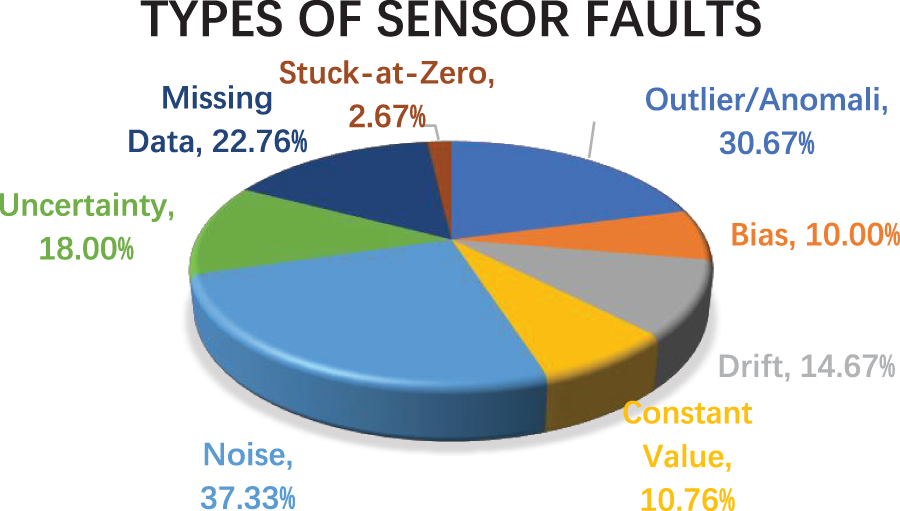
Figure 15: Academic work done on varied types of sensor faults since 2011
Whereas, as far as fault detection techniques are concerned, fuzzy logic, artificial intelligence, and statistical parametric techniques were the most preferred techniques of academicians in the last decade as seen in Fig. 16. It can be clinched that knowledge-based, bayesian networks, and hardware-based can be better explored to get a robust fault-handling technique.
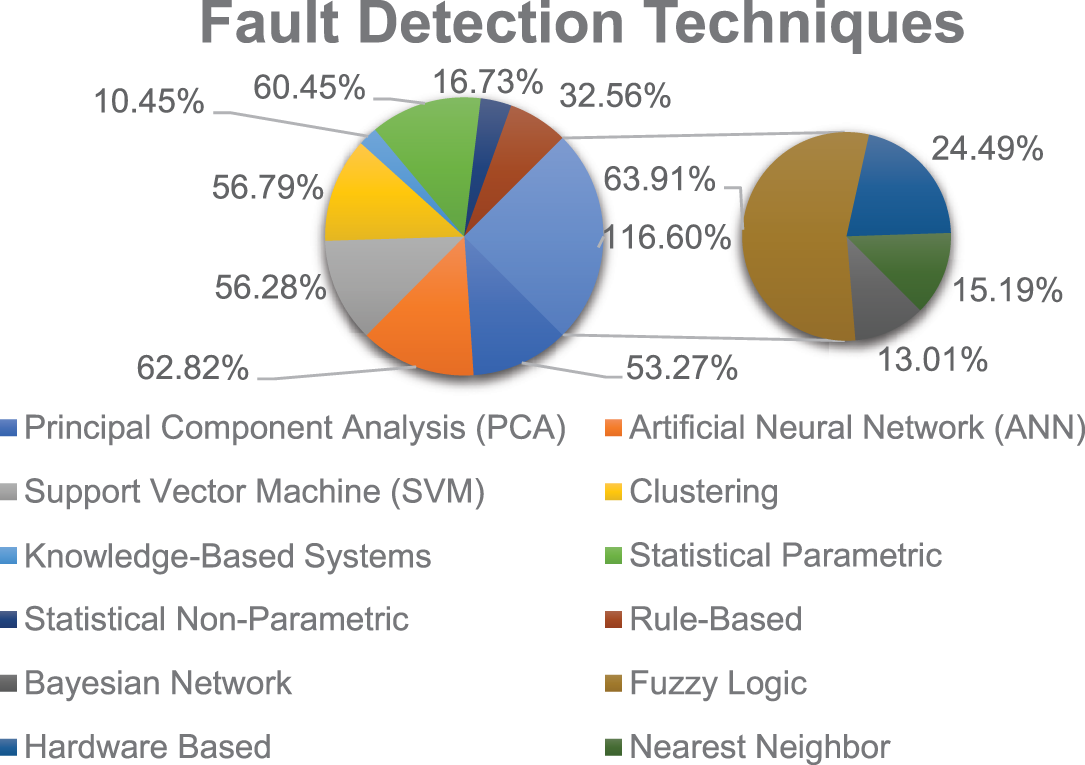
Figure 16: Academic work done on varied types of Fault Detection Techniques since 2011
Figs. 17 and 18 depict that the most relevant sources of publications on fault detection techniques and sensor faults are Lecture Notes in Computer Science, IEEE Internet of Things journal, and Proceedings of SPIE-The International Society For Optical Engineering, Sensors (Switzerland), respectively.
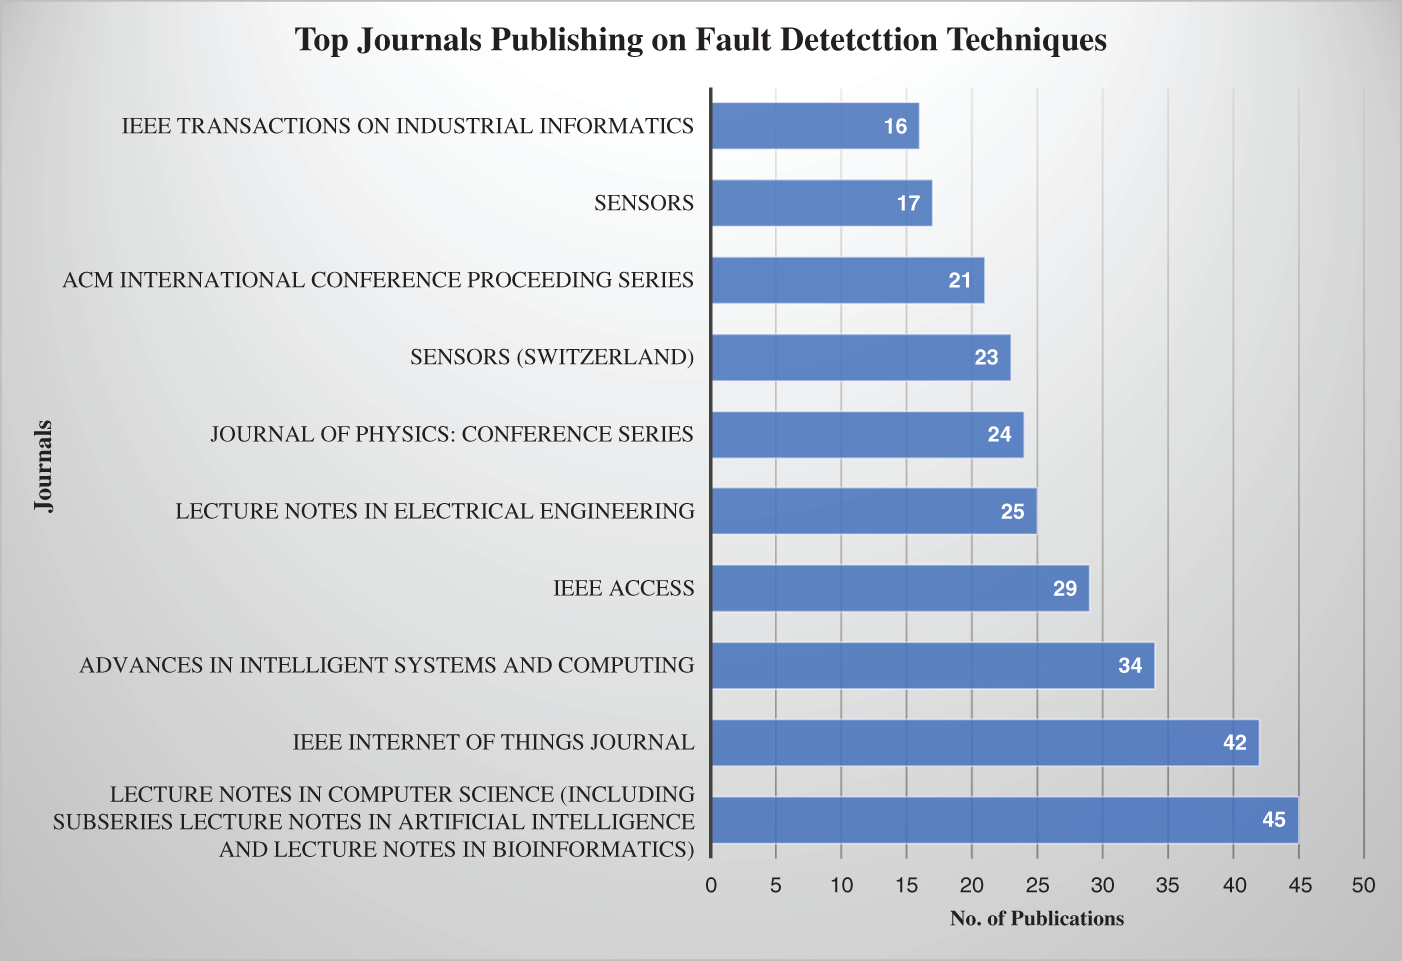
Figure 17: Top 10 journals publishing on fault detection techniques
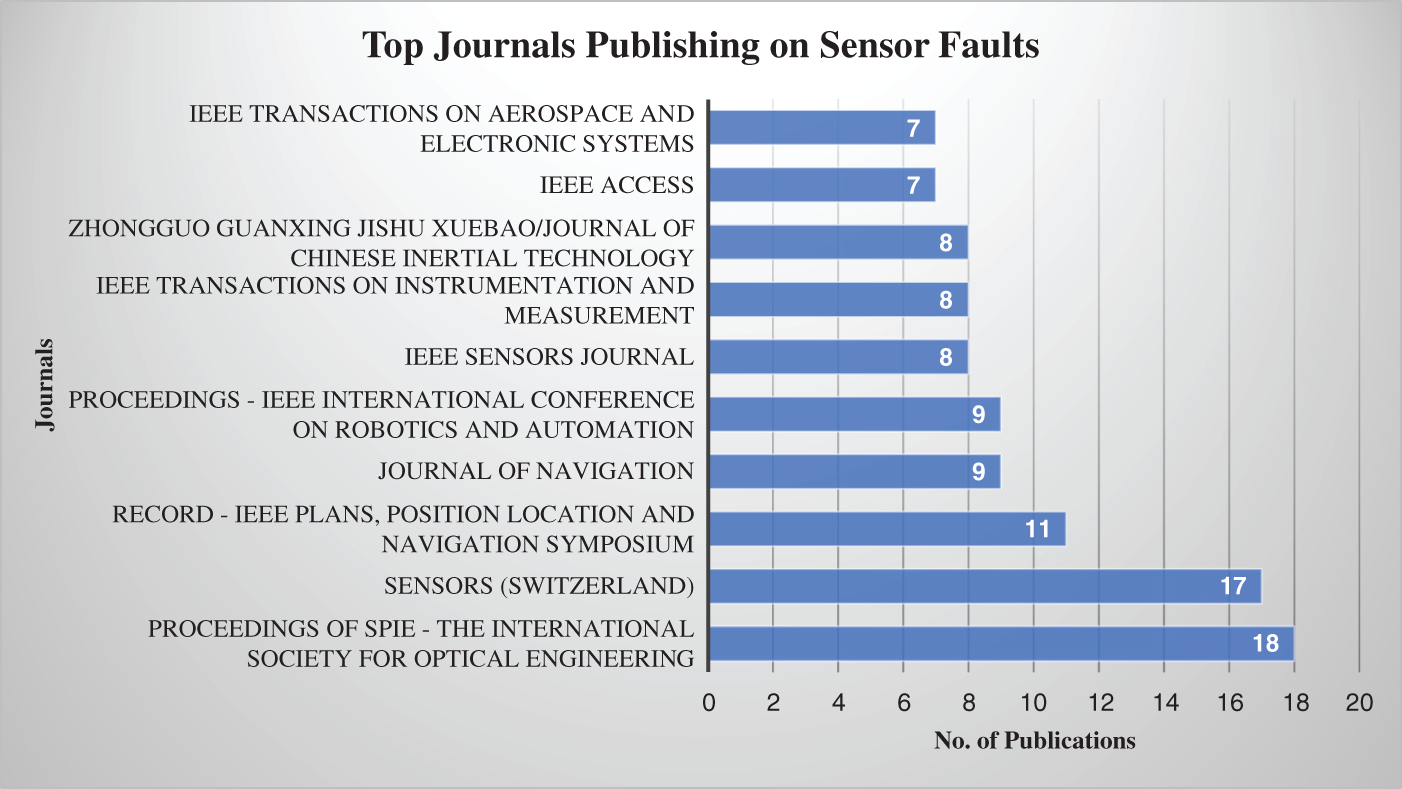
Figure 18: Top 10 journals publishing on sensor faults
Lastly, Fig. 19 shows publication distribution on sensor fault handling techniques over the last ten years. It manifests the increasing trend and interest of researchers and academicians towards fault handling techniques in the arena of the Internet of Things.
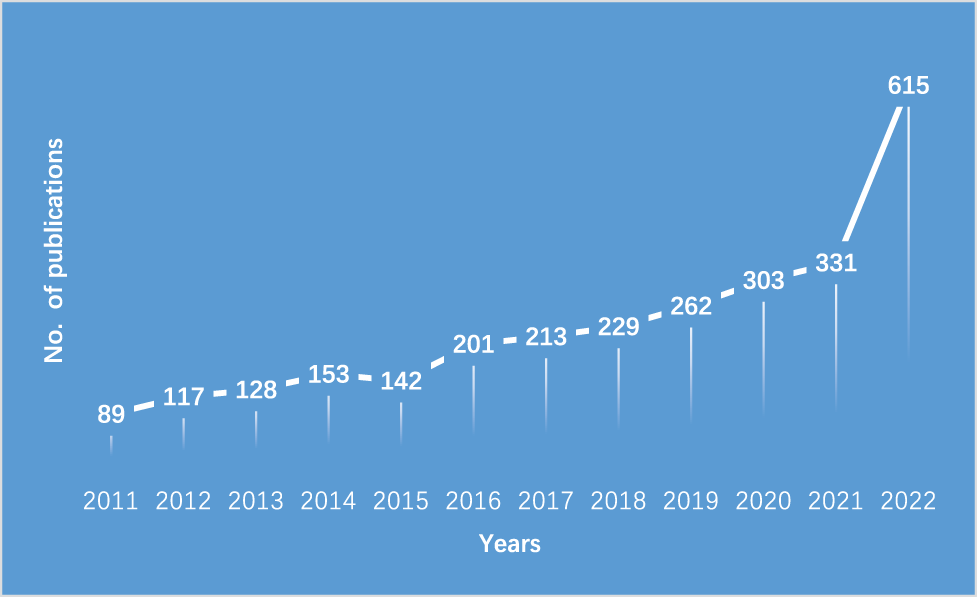
Figure 19: Year-wise distribution of publications on fault detection in sensors during 2011–2022
The Internet of Things has recharged the working of pretty much every working environment all over the planet. Not just how tasks were being performed but also the state of affairs. However, the reliance on the presentation of brilliant space on IoT gadgets has likewise raised worry about the framework’s shortcomings of open-minded methodology and power. Brilliant gadgets or sensors are mainstays of shrewd arrangement. Their glitch can have deadly results and debasing impacts on the general exhibition. To guarantee trouble-free and effortless working recognition of deficiencies and disappointments in the brilliant framework timely is essential. This paper portrays a systematic review of basic types of causes of Faults that can occur in IoT Devices and various Sensor Errors that get induced into IoT devices/sensor data, resulting in anomalies/outliers. An in-depth analysis of existing fault detection techniques and their respective algorithms along with their key points and challenges. A summary of the various types of error and the existing techniques used to address them is also presented. The paper also presents basic metrics to weigh each technique’s performance. This study aims to provide insight into the sensor’s faults and fault detection mechanisms that are in place to deal with them. The limitation of the survey conducted is that all the faults and detection techniques discussed in the article concern the outliers/oddity in sensors’ reading. The failures owing to other factors like software failure, computational faults, communication faults, and unplugged devices are not considered. ondly, fault detection techniques can also be categorized as heuristic/meta-heuristic and hybrid, which is not presented in the paper and can be seen as future coverage. The analysis of processed academic datasets pose the future possibilities of research on unattended sensor faults like Stuck-at-Zero and Constant Value and underworked fault detection techniques like Knowledge-Based and Hardware-Based. Later, new advancements like BCI, XR technologies, and a blend of BCI and VR/AR/MR [155] technologies for applications like smart space control along with fault detection algorithms could be explored to enhance the exhibition and unwavering quality of IoT machines.
Acknowledgement: Authors acknowledge the Chitkara University for their support in research.
Funding Statement: The authors received no specific funding for this study.
Author Contributions: The authors confirm their contribution to the paper as follows: Sheetal Sharma: Study conception and design, analysis, and interpretation of results. Kamali Gupta: Review & editing. Deepali Gupta: Review & editing. Shalli Rani: Supervision. Gaurav Dhiman: Supervision. All authors reviewed the results and approved the final version of the manuscript.
Availability of Data and Materials: Data sharing is not applicable—no new data is generated.
Conflicts of Interest: The authors declare that they have no conflicts of interest to report regarding the present study.
References
1. Sharma, S., Gupta, K., Gupta, D. (2021). The amalgamation of Internet of Things and recommender systems. Journal of Physics: Conference Series, 1969(1), 012040. https://doi.org/10.1088/1742-6596/1969/1/012040 [Google Scholar] [CrossRef]
2. Seth, I., Panda, S. N., Guleria, K. (2021). The essence of smart computing: Internet of Things, architecture, protocols, and challenges. 2021 9th International Conference on Reliability, Infocom Technologies and Optimization (Trends and Future Directions) (ICRITO), pp. 1–6. Amity University, Noida, Uttar Pradesh, India, IEEE. [Google Scholar]
3. Seth, I., Panda, S. N., Guleria, K. (2021). IoT based smart applications and recent research trends. 2021 6th International Conference on Signal Processing, Computing and Control (ISPCC), pp. 407–412. Waknaghat, Solan, Himachal Pradesh, India, IEEE. [Google Scholar]
4. Liu, Y., Yang, Y., Lv, X., Wang, L. (2013). A self-learning sensor fault detection framework for industry monitoring IoT. Mathematical Problems in Engineering, 2013, 1–8. https://doi.org/10.1155/2013/712028 [Google Scholar] [CrossRef]
5. Qian, B., Su, J., Wen, Z., Jha, D. N., Li, Y. et al. (2020). Orchestrating the development lifecycle of machine learning-based IoT applications: A taxonomy and survey. ACM Computing Surveys, 53(4), 1–47. https://doi.org/10.1145/3398020 [Google Scholar] [CrossRef]
6. Bhatnagar, A., Shukla, S., Majumdar, N. (2019). Machine learning techniques to reduce error in the Internet of Things. Proceedings of the 9th International Conference on Cloud Computing, Data Science and Engineering, Confluence 2019, pp. 403–408. Noida, Uttar Pradesh, India. https://doi.org/10.1109/CONFLUENCE.2019.8776619 [Google Scholar] [CrossRef]
7. Borda, D., Bergagio, M., Amerio, M., Masoero, M. C., Borchiellini, R. et al. (2023). Development of anomaly detectors for HVAC systems using machine learning. Processes, 11(2), 535. [Google Scholar]
8. Soni, D., Kumar, N. (2023). Artificial intelligence in cloud computing. In: Artificial intelligence in cyber-physical systems, pp. 51–73. Taylor & Francis, Wales, London: CRC Press. [Google Scholar]
9. Zemali, Z., Cherroun, L., Hadroug, N., Hafaifa, A., Iratni, A. et al. (2023). Robust intelligent fault diagnosis strategy using Kalman observers and neuro-fuzzy systems for a wind turbine benchmark. Renewable Energy, 205(C), 873–898. [Google Scholar]
10. Sarı, A., Tosun, A., Alptekin, G. I. (2019). A systematic literature review on software fault prediction and fault tolerance in software engineering. Journal of Systems and Software, 153(2), 200–219. https://doi.org/10.1016/j.jss.2019.04.027 [Google Scholar] [CrossRef]
11. Gardašević, G., Veletić, M., Maletić, N., Vasiljević, D., Radusinović, I. et al. (2017). The IoT architectural framework, design issues and application domains. Wireless Personal Communications, 92, 127–148. [Google Scholar]
12. Ray, P. P. (2018). A survey on Internet of Things architectures. Journal of King Saud University-Computer and Information Sciences, 30(3), 291–319. [Google Scholar]
13. Atzori, L., Iera, A., Morabito, G. (2010). The Internet of Things: A survey. Computer Networks, 54(15), 2787–2805. [Google Scholar]
14. Kumar, N. M., Mallick, P. K. (2018). The Internet of Things: Insights into the building blocks, component interactions, and architecture layers. Procedia Computer Science, 132, 109–117. https://doi.org/10.1016/j.procs.2018.05.170 [Google Scholar] [CrossRef]
15. Mandal, S. (2020). Internet of Things (IoT)—Part 2 (Building Blocks & Architecture). https://www.c-sharpcorner.com/UploadFile/f88748/internet-of-things-part-2/ [Google Scholar]
16. Calum, M. (2017). IoT Explained—How Does an IoT System Actually Work?. https://www.leverege.com/blogpost/iot-explained-how-does-an-iot-system-actually-work [Google Scholar]
17. Siraj, S. (2019). ARCTIC: An IoT-based system for child tracking in day care. Luleå University of Technology, Sweden. [Google Scholar]
18. Srithar, S., Ravindran, R., Prasad, S., Kumar, K. P., Santhosh, K. (2020). A continuous infant monitoring system using IoT. International Journal of Future Generation Communication and Networking, 13(3), 2407–2431. [Google Scholar]
19. Mohapatra, H. (2021). Socio-technical challenges in the implementation of smart city. 2021 International Conference on Innovation and Intelligence for Informatics, Computing, and Technologies (3ICT), pp. 57–62. Bahrain, IEEE. [Google Scholar]
20. Mohapatra, H., Rath, A. K. (2020). Survey on fault tolerance-based clustering evolution in WSN. IET Networks, 9, 145–155. https://doi.org/10.1049/iet-net.2019.0155 [Google Scholar] [CrossRef]
21. Dhumane, A., Prasad, R. (2015). Routing challenges in Internet of Things. CSI Communications, 19–20. [Google Scholar]
22. Tupe, K., Jandrao, V., Chappe, S., Bhusalwad, P., College, P. E. S. (2017). Child health care monitoring using sensor technology. International Research Journal of Engineering and Technology (IRJET), 4(3), 3–6. https://irjet.net/archives/V4/i3/IRJET-V4I389.pdf [Google Scholar]
23. Jeong, C. M. R. (2018). A study on safety management of day care center using disaster management system. The Journal of the Institute of Internet, Broadcasting and Communication, 18(1), 29–35. https://doi.org/10.7236/JIIBC.2018.18.1.29 [Google Scholar] [CrossRef]
24. Xu, L. D., He, W., Li, S. (2014). Internet of Things in industries: A survey. IEEE Transactions on Industrial Informatics Informatics, 10(4), 2233–2243. https://doi.org/10.1109/TII.2014.2300753 [Google Scholar] [CrossRef]
25. Paramshetti, P., Phalke, D. A. (2014). On software defect prediction using machine learning. International Journal of Science and Research (IJSR), 2014(12), 1–8. [Google Scholar]
26. Rathore, S. S., Kumar, S. (2017). A decision tree logic based recommendation system to select software fault prediction techniques. Computing, 99(3), 255–285. https://doi.org/10.1007/s00607-016-0489-6 [Google Scholar] [CrossRef]
27. Cicirelli, F., Fortino, G., Guerrieri, A., Spezzano, G., Vinci, A. (2017). Metamodeling of smart environments: From design to implementation. Advanced Engineering Informatics, 33, 274–284. https://doi.org/10.1016/j.aei.2016.11.005 [Google Scholar] [CrossRef]
28. Kokane, P., Sivakumar, P. B. (2019). Online model for suspension faults diagnostics using IoT and analytics, vol. 870. Singapore: Springer Singapore. [Google Scholar]
29. Xenakis, A., Karageorgos, A., Lallas, E., Chis, A. E., González-Vélez, H. (2019). Towards distributed IoT/Cloud based fault detection and maintenance in industrial automation. Procedia Computer Science, 151(2018), 683–690. https://doi.org/10.1016/j.procs.2019.04.091 [Google Scholar] [CrossRef]
30. Kapitanova, K., Hoque, E., Stankovic, J. A., Whitehouse, K., Son, S. H. (2012). Being SMART about failures. Proceedings of the 2012 ACM Conference on Ubiquitous Computing—UbiComp’12, pp. 51–60. Pittsburgh, Pennsylvania, USA. https://doi.org/10.1145/2370216.2370225 [Google Scholar] [CrossRef]
31. Wang, C., Vo, H. T., Ni, P. (2015). An IoT application for fault diagnosis and prediction. 2015 IEEE International Conference on Data Science and Data Intensive Systems, pp. 726–731. Sydney, NSW, Australia. https://doi.org/10.1109/DSDIS.2015.97 [Google Scholar] [CrossRef]
32. Mundada, D., Murade, A., Vaidya, O., Swathi, J. N. (2016). Software fault prediction using artificial neural network and resilient back propagation. International Journal of Computer Science Engineering, 5(3), 173–179. [Google Scholar]
33. Chakraborty, A., Nambi, U., Chandra, R., Sharma, R., Swaminathan, R. et al. (2018). Sensor identification and fault detection in IoT systems. Proceedings of the 16th ACM Conference on Embedded Networked Sensor Systems, pp. 375–376. Shenzhen, China. https://doi.org/10.1145/3274783.3275190 [Google Scholar] [CrossRef]
34. Vibhute, D. S., Gundale, P. A. S. (2019). Early detection of sensors failure using IoT. International Research Journal of Engineering and Technology (IRJET), 6(5), 7787–7791. [Google Scholar]
35. Oh, W. (2015). A simple sensor fault detection algorithm. IIE Conference Calendar, no. 2, pp. 135–137. Bangkok (ThailandInternational Institute of Engineers. https://doi.org/10.15242/IIE.E0415072 [Google Scholar] [CrossRef]
36. Gouthaman, P., Sankaranarayanan, S. (2018). Agile software risk management architecture for IoT-Fog based systems. 2018 International Conference on Smart Systems and Inventive Technology (ICSSIT), pp. 48–51. Tirunelveli, India. https://doi.org/10.1109/ICSSIT.2018.8748457 [Google Scholar] [CrossRef]
37. Jia, M., Komeily, A., Wang, Y., Srinivasan, R. S. (2019). Adopting Internet of Things for the development of smart buildings: A review of enabling technologies and applications. Automation in Construction, 101, 111–126. https://doi.org/10.1016/j.autcon.2019.01.023 [Google Scholar] [CrossRef]
38. Sharma, A. B., Golubchik, L., Govindan, R. (2010). Sensor faults: Detection methods and prevalence in real-world datasets. ACM Transactions on Sensor Networks, 6(3), 1–34. https://doi.org/10.1145/1754414.1754419 [Google Scholar] [CrossRef]
39. Branch, J. W., Giannella, C., Szymanski, B., Wolff, R., Kargupta, H. (2009). In-network outlier detection in wireless sensor networks. Knowledge and Information Systems, 34(1), 23–54. https://doi.org/10.1007/s10115-011-0474-5 [Google Scholar] [CrossRef]
40. Pachauri, G., Sharma, S. (2015). Anomaly detection in medical wireless sensor networks using machine learning algorithms. Procedia Computer Science, 70, 325–333. https://doi.org/10.1016/j.procs.2015.10.026 [Google Scholar] [CrossRef]
41. Ye, J., Stevenson, G., Dobson, S. (2016). Detecting abnormal events on binary sensors in smart home environments. Pervasive and Mobile Computing, 33, 32–49. https://doi.org/10.1016/j.pmcj.2016.06.012 [Google Scholar] [CrossRef]
42. Afsar, M. M., Tayarani-N, M. H. (2014). Clustering in sensor networks: A literature survey. Journal of Network and Computer Applications, 46, 198–226. https://doi.org/10.1016/j.jnca.2014.09.005 [Google Scholar] [CrossRef]
43. Gaddam, A., Wilkin, T., Angelova, M., Gaddam, J. (2020). Detecting sensor faults, anomalies and outliers in the Internet of Things: A survey on the challenges and solutions. Electronics, 9(3), 511. https://doi.org/10.3390/electronics9030511 [Google Scholar] [CrossRef]
44. Ghorbel, O., Jmal, M. W., Ayedi, W., Snoussi, H., Abid, M. (2013). An overview of outlier detection technique developed for wireless sensor networks. 10th International Multi-Conferences on Systems, Signals & Devices 2013 (SSD13), pp. 1–6. Hammamet, Tunisia. https://doi.org/10.1109/SSD.2013.6564165 [Google Scholar] [CrossRef]
45. Li, X., Huang, S., Yin, S., Zhou, Y., Zhang, M. et al. (2016). Design of K-node (Edge) content connected optical data center networks. IEEE Communications Letters, 20(3), 466–469. https://doi.org/10.1109/LCOMM.2016.2517646 [Google Scholar] [CrossRef]
46. Hida, Y., Huang, P., Nishtala, R. (2003). Aggregation query under uncertainty in sensor networks, 1–17. Department of Electrical Engineering and Computer Science, University of California, Berkeley. [Google Scholar]
47. Hnat, T. W., Srinivasan, V., Lu, J., Sookoor, T. I., Dawson, R. et al. (2011). The hitchhiker’s guide to successful residential sensing deployments. Proceedings of the 9th ACM Conference on Embedded Networked Sensor Systems—SenSys’11, pp. 232–245. Seattle, Washington, USA. https://doi.org/10.1145/2070942.2070966 [Google Scholar] [CrossRef]
48. Harkat, M. F., Mourot, G., Ragot, J. (2000). Sensor failure detection of air quality monitoring network. IFAC Proceedings Volumes, 33(11), 529–534. https://doi.org/10.1016/S1474-6670(17)37413-X [Google Scholar] [CrossRef]
49. Seisen, T., Roupret, M., Cancel-Tassin, G., Leon, P., Comperat, E. et al. (2015). 1056 detection of FGFR3 mutations from urine sediment DNA to predict the risk of intravesical recurrence after radical nephroureterectomy for upper tract urothelial carcinoma. European Urology Supplements, 14(2), e1056-e1056a. https://doi.org/10.1016/S1569-9056(15)61044-2 [Google Scholar] [CrossRef]
50. Bosman, H. H. W. J., Iacca, G., Tejada, A., Wörtche, H. J., Liotta, A. (2015). Ensembles of incremental learners to detect anomalies in ad hoc sensor networks. Ad Hoc Networks, 35, 14–36. https://doi.org/10.1016/j.adhoc.2015.07.013 [Google Scholar] [CrossRef]
51. Bamgboye, O., Liu, X., Cruickshank, P. (2018). Towards modelling and reasoning about uncertain data of sensor measurements for decision support in smart spaces. International Computer Software and Applications Conference, vol. 2, pp. 744–749. Tokyo, Japan. https://doi.org/10.1109/COMPSAC.2018.10330 [Google Scholar] [CrossRef]
52. Kuka, C., Nicklas, D. (2014). Enriching sensor data processing with quality semantics. 2014 IEEE International Conference on Pervasive Computing and Communication Workshops (PERCOM WORKSHOPS), pp. 437–442. Budapest, Hungary. https://doi.org/10.1109/PerComW.2014.6815246 [Google Scholar] [CrossRef]
53. Sallans, B., Bruckner, D., Russ, G. (2006). Statistical model-based sensor diagnostics for automation systems. In: Fieldbus systems and their applications 2005, vol. 7, no. 1, pp. 239–246. Austria: Elsevier. [Google Scholar]
54. Lo, N. G., Flaus, J. M., Adrot, O. (2019). Review of machine learning approaches in fault diagnosis applied to IoT systems. 2019 International Conference on Control, Automation and Diagnosis (ICCAD), pp. 1–6. Grenoble, France. https://doi.org/10.1109/ICCAD46983.2019.9037949 [Google Scholar] [CrossRef]
55. Koushanfar, F., Potkonjak, M., Sangiovanni-Vincentelli, A. (2003). On-line fault detection of sensor measurements. Sensors, 2, 974–979. [Google Scholar]
56. Yang, C., Liu, C., Zhang, X., Nepal, S., Chen, J. (2014). A time efficient approach for detecting errors in big sensor data on cloud. IEEE Transactions on Parallel and Distributed Systems, 26(2), 329–339. [Google Scholar]
57. Bychkovskiy, V., Megerian, S., Estrin, D., Potkonjak, M. (2003). A collaborative approach to in-place sensor calibration. In: Information processing in sensor networks, pp. 301–316. Berlin, Heidelberg: Springer. [Google Scholar]
58. Koushanfar, F., Potkonjak, M., Sangiovanni-Vincentell, A. (2002). Fault tolerance techniques for wireless ad hoc sensor networks. Sensors, 2, 1491–1496. [Google Scholar]
59. Wilson, J. S. (2004). Sensor technology handbook. USA: Elsevier. [Google Scholar]
60. Lu, X., O'Neill, Z., Li, Y., Niu, F. (2020). A novel simulation-based framework for sensor error impact analysis in smart building systems: A case study for a demand-controlled ventilation system. Applied Energy, 263, 114638. [Google Scholar]
61. Hou, H. (2004). Modeling inertial sensors errors using Allan variance. University of Calgary, Department of Geomatics Engineering, Calgary, AB, Canada. [Google Scholar]
62. Shenoy, A. P., Ameer, P. M. (2019). Anamoly detection in wireless sensor networks. 2019 IEEE Region 10 Conference (TENCON), pp. 1504–1508. Kochi, India.https://doi.org/10.1109/TENCON.2019.8929554 [Google Scholar] [CrossRef]
63. Miljković, D. (2016). Fault detection methods: A literature survey. MIPRO 2011—34th International Convention on Information and Communication Technology, Electronics and Microelectronics, Opatija, Croatia. [Google Scholar]
64. Isermann, R. (1997). Supervision, fault-detection and fault-diagnosis methods—An introduction. Control Engineering Practice, 5(5), 639–652. [Google Scholar]
65. Mehranbod, N., Soroush, M., Panjapornpon, C. (2005). A method of sensor fault detection and identification. Journal of Process Control, 15(3), 321–339. [Google Scholar]
66. Gharamaleki, M. M., Babaie, S. (2020). A new distributed fault detection method for wireless sensor networks. IEEE Systems Journal, 14(4), 4883–4890. [Google Scholar]
67. Park, J., Rizzoni, G., Ribbens, W. B. (1994). On the representation of sensor faults in fault detection filters. Automatica, 30(11), 1793–1795. [Google Scholar]
68. Yang, X. B., Jin, X. Q., Du, Z. M., Zhu, Y. H. (2011). A novel model-based fault detection method for temperature sensor using fractal correlation dimension. Building and Environment, 46(4), 970–979. [Google Scholar]
69. Worden, K., Burrows, A. P. (2001). Optimal sensor placement for fault detection. Engineering Structures, 23(8), 885–901. [Google Scholar]
70. Dong, H., Wang, Z., Ding, S. X., Gao, H. (2014). A survey on distributed filtering and fault detection for sensor networks. Mathematical Problems in Engineering, 2014, 1–7. [Google Scholar]
71. Zhang, J. (2013). Advancements of outlier detection: A survey. ICST Transactions on Scalable Information Systems, 13(1), e2. https://doi.org/10.4108/trans.sis.2013.01-03.e2 [Google Scholar] [CrossRef]
72. Zhang, J., Martin, E. B., Morris, A. J. (1996). Fault-detection and diagnosis using multivariate statistical techniques. Chemical Engineering Research & Design, 74(1), 89–96. [Google Scholar]
73. Liu, K., Huang, K. L., Sfarra, S., Yang, J., Yi, L. et al. (2023). Factor analysis thermography for defect detection of panel paintings. Quantitative InfraRed Thermography Journal, 20(1), 25–37. [Google Scholar]
74. Venkatasubramanian, V., Rengaswamy, R., Kavuri, S. N., Yin, K. (2003). A review of process fault detection and diagnosis: Part III: Process history based methods. Computers & Chemical Engineering, 27(3), 327–346. [Google Scholar]
75. Hwang, I., Kim, S., Kim, Y., Seah, C. E. (2009). A survey of fault detection, isolation, and reconfiguration methods. IEEE Transactions on Control Systems Technology, 18(3), 636–653. [Google Scholar]
76. Dixon, W. E., Walker, I. D., Dawson, D. M., Hartranft, J. P. (2000). Fault detection for robot manipulators with parametric uncertainty: A prediction-error-based approach. IEEE Transactions on Robotics and Automation, 16(6), 689–699. [Google Scholar]
77. Fang, L., Dobson, S. (2013). In-network sensor data modelling methods for fault detection. International Joint Conference on Ambient Intelligence, pp. 176–189. Cham, Springer. [Google Scholar]
78. Rajaraman, S., Hahn, J., Mannan, M. S. (2006). Sensor fault diagnosis for nonlinear processes with parametric uncertainties. Journal of Hazardous Materials, 130(1–2), 1–8. [Google Scholar] [PubMed]
79. Patan, M., Uciński, D. (2008). Configuring a sensor network for fault detection in distributed parameter systems. International Journal of Applied Mathematics & Computer Science, 18(4), 513–524. [Google Scholar]
80. Xu, C., Zhao, S., Liu, F. (2019). Sensor fault detection and diagnosis in the presence of outliers. Neurocomputing, 349, 156–163. [Google Scholar]
81. Samuelsson, O., Björk, A., Zambrano, J., Carlsson, B. (2017). Gaussian process regression for monitoring and fault detection of wastewater treatment processes. Water Science and Technology, 75(12), 2952–2963. [Google Scholar] [PubMed]
82. Liu, Y., Xiao, H., Pan, Y., Huang, D., Wang, Q. (2016). Development of multiple-step soft-sensors using a Gaussian process model with application for fault prognosis. Chemometrics and Intelligent Laboratory Systems, 157, 85–95. [Google Scholar]
83. Li, X., Han, J. (2007). Mining approximate top-K subspace anomalies in multi-dimensional time-series data. 33rd International Conference on Very Large Data Bases, VLDB, 2007, pp. 447–458. Vienna, Austria. https://doi.org/10.5555/1325851.1325904 [Google Scholar] [CrossRef]
84. Fogarty, J., Hudson, S. E., Lai, J. Y., Bruckner, Q. D., Russ, G. (2006). Examining the robustness of sensor-based statistical models of human interruptibility. Proceedings of the SIGCHI Conference on Human Factors in Computing, Montréal Québec Canada, ACM Press. [Google Scholar]
85. Kouicem, D. E., Bouabdallah, A., Lakhlef, H. (2018). Internet of Things urity: A top-down survey. Computer Networks, 141, 199–221. https://doi.org/10.1016/j.comnet.2018.03.012 [Google Scholar] [CrossRef]
86. Van Phuong, T., Hung, L. X., Cho, S. J., Lee, Y. K., Lee, S. (2006). An anomaly detection algorithm for detecting attacks in wireless sensor networks. In: Mehrotra, S., Zeng, D. D., Chen, H., Thuraisingham, B., Wang, F. Y. (Eds.Intelligence and security informatics, vol 3975. Berlin, Heidelberg: Springer. https://doi.org/10.1007/11760146_111 [Google Scholar] [CrossRef]
87. Fawzy, A., Mokhtar, H. M. O., Hegazy, O. (2013). Outliers detection and classification in wireless sensor networks. Egyptian Informatics Journal, 14(2), 157–164. https://doi.org/10.1016/j.eij.2013.06.001 [Google Scholar] [CrossRef]
88. Ge, Z., Kruger, U., Lamont, L., Xie, L., Song, Z. (2010). Fault detection in non-Gaussian vibration systems using dynamic statistical-based approaches. Mechanical Systems and Signal Processing, 24(8), 2972–2984. [Google Scholar]
89. Kim, M., Liu, H., Kim, J. T., Yoo, C. (2013). Sensor fault identification and reconstruction of indoor air quality (IAQ) data using a multivariate non-Gaussian model in underground building space. Energy and Buildings, 66, 384–394. [Google Scholar]
90. Ge, Z., Xie, L., Kruger, U., Lamont, L., Song, Z. et al. (2009). Sensor fault identification and isolation for multivariate non-Gaussian processes. Journal of Process Control, 19(10), 1707–1715. [Google Scholar]
91. Jamil, F., Abid, M., Adil, M., Haq, I., Khan, A. Q. et al. (2018). Kernel approaches for fault detection and classification in PARR-2. Journal of Process Control, 64, 1–6. [Google Scholar]
92. El Youssef, M., Guarino, F., Sibilio, S., Rosato, A. (2023). Experimental assessment of a preliminary rule-based data-driven method for fault detection and diagnosis of coils, fans and sensors in air-handling units. In: Sustainability in energy and buildings 2022, pp. 359–370. Singapore: Springer Nature Singapore. [Google Scholar]
93. Fernando, H., Surgenor, B. (2017). An unsupervised artificial neural network versus a rule-based approach for fault detection and identification in an automated assembly machine. Robotics and Computer-Integrated Manufacturing, 43, 79–88. [Google Scholar]
94. He, W., Qiao, P. L., Zhou, Z. J., Hu, G. Y., Feng, Z. C. et al. (2018). A new belief-rule-based method for fault diagnosis of wireless sensor network. IEEE Access, 6, 9404–9419. [Google Scholar]
95. Boem, F., Ferrari, R. M., Keliris, C., Parisini, T., Polycarpou, M. M. (2016). A distributed networked approach for fault detection of large-scale systems. IEEE Transactions on Automatic Control, 62(1), 18–33. [Google Scholar]
96. Van Wyk, B. J., van Wyk, M. A., Qi, G. (2009). Difference histograms: A new tool for time series analysis applied to bearing fault diagnosis. Pattern Recognition Letters, 30(6), 595–599. [Google Scholar]
97. Sharma, A., Golubchik, L., Govindan, R. (2007). On the prevalence of sensor faults in real-world deployments. 2007 4th Annual IEEE Communications Society Conference on Sensor, Mesh and Ad Hoc Communications and Networks, pp. 213–222. San Diego, CA, USA, IEEE. [Google Scholar]
98. Kumar, D. P., Muralidharan, V., Ravikumar, S. (2022). Histogram as features for fault detection of multi point cutting tool—A data driven approach. Applied Acoustics, 186, 108456. [Google Scholar]
99. Bharti, S., Pattanaik, K. K., Pandey, A. (2020). Contextual outlier detection for wireless sensor networks. Journal of Ambient Intelligence and Humanized Computing, 11(4), 1511–1530. https://doi.org/10.1007/s12652-019-01194-5 [Google Scholar] [CrossRef]
100. Akbari, A., Dana, A., Khademzadeh, A., Beikmahdavi, N. (2011). Fault detection and recovery in wireless sensor network using clustering. International Journal of Wireless & Mobile Networks (IJWMN), 3(1), 130–138. [Google Scholar]
101. Venkataraman, G., Emmanuel, S., Thambipillai, S. (2007). A cluster-based approach to fault detection and recovery in wireless sensor networks. 2007 4th International Symposium on Wireless Communication Systems, pp. 35–39. Trondheim, Norway, IEEE. [Google Scholar]
102. Sasikumar, P., Khara, S. (2012). K-means clustering in wireless sensor networks. 2012 Fourth International Conference on Computational Intelligence and Communication Networks, pp. 140–144. Phuket, Thailand, IEEE. [Google Scholar]
103. Zhou, J., Guo, A., Celler, B., Su, S. (2014). Fault detection and identification spanning multiple processes by integrating PCA with neural network. Applied Soft Computing, 14, 4–11. [Google Scholar]
104. Mouzakitis, O. (2013). Classification of fault diagnosis methods for control systems. Measurement and Control, 46(10), 303–308. https://doi.org/10.1177/0020294013510471 [Google Scholar] [CrossRef]
105. Qu, H., Zhang, W., Zhang, G. (2023). A novel fault diagnosis scheme for a ballast system. Automatica, 148, 110773. [Google Scholar]
106. Angeli, C. (2008). Online expert systems for fault diagnosis in technical processes. Expert Systems, 25(2), 115–132. [Google Scholar]
107. Munir, S., Stankovic, J. A. (2015). FailureSense: Detecting sensor failure using electrical appliances in the home. 11th IEEE International Conference on Mobile Ad Hoc and Sensor Systems (MASS), pp. 73–81. Dallas, USA. https://doi.org/10.1109/MASS.2014.16 [Google Scholar] [CrossRef]
108. Jun, H. B., Kim, D. (2017). A Bayesian network-based approach for fault analysis. Expert Systems with Applications, 81, 332–348. https://doi.org/10.1016/j.eswa.2017.03.056 [Google Scholar] [CrossRef]
109. Miljković, D. (2011). Fault detection methods: A literature survey. 2011 Proceedings of the 34th International Convention (MIPRO), pp. 750–755. Opatija, Croatia, IEEE. [Google Scholar]
110. Muhammed, T., Shaikh, R. A. (2017). An analysis of fault detection strategies in wireless sensor networks. Journal of Network and Computer Applications, 78, 267–287. [Google Scholar]
111. Dzaferagic, M., Marchetti, N., Macaluso, I. (2022). Fault detection and classification in industrial IoT in case of missing sensor data. IEEE Internet of Things Journal, 9(11), 8892–8900. https://doi.org/10.1109/JIOT.2021.3116785 [Google Scholar] [CrossRef]
112. Zheng, H., Feng, Y., Gao, Y., Tan, J. (2018). A robust predicted performance analysis approach for data-driven product development in the industrial Internet of Things. Sensors, 18(9), 2871. https://doi.org/10.3390/s18092871 [Google Scholar] [PubMed] [CrossRef]
113. Choi, J., Jeoung, H., Kim, J., Ko, Y., Jung, W. et al. (2018). Detecting and identifying faulty IoT devices in smart home with context extraction. 2018 48th Annual IEEE/IFIP International Conference on Dependable Systems and Networks (DSN), pp. 610–621. Luxembourg. https://doi.org/10.1109/DSN.2018.00068 [Google Scholar] [CrossRef]
114. Banerjee, T. P., Das, S. (2012). Multi-sensor data fusion using support vector machine for motor fault detection. Information Sciences, 217, 96–107. [Google Scholar]
115. Deng, F., Guo, S., Zhou, R., Chen, J. (2015). Sensor multifault diagnosis with improved support vector machines. IEEE Transactions on Automation Science and Engineering, 14(2), 1053–1063. [Google Scholar]
116. Demetgul, M. (2013). Fault diagnosis on production systems with support vector machine and decision trees algorithms. The International Journal of Advanced Manufacturing Technology, 67(9), 2183–2194. [Google Scholar]
117. Zhang, Y., Meratnia, N., Havinga, P. (2009). Adaptive and online one-class support vector machine-based outlier detection techniques for wireless sensor networks. International Conference on Advanced Information Networking and Applications (AINA), pp. 990–995. Bradford, UK. https://doi.org/10.1109/WAINA.2009.200 [Google Scholar] [CrossRef]
118. Bhavana, K., Nekkanti, V., Jayapandian, N. (2020). Internet of Things enabled device fault prediction system using machine learning. Lecture Notes in Networks and Systems, 98, 920–927. [Google Scholar]
119. Teh, H. Y., Kempa-Liehr, A. W., Wang, K. I. K. (2020). Sensor data quality: A systematic review. Journal of Big Data, 7(1), 1–49. https://doi.org/10.1186/s40537-020-0285-1 [Google Scholar] [CrossRef]
120. Yu, J., Rashid, M. M. (2013). A novel dynamic bayesian network-based networked process monitoring approach for fault detection, propagation identification, and root cause diagnosis. AIChE Journal, 59(7), 2348–2365. [Google Scholar]
121. Li, T., Zhou, Y., Zhao, Y., Zhang, C., Zhang, X. (2022). A hierarchical object oriented Bayesian network-based fault diagnosis method for building energy systems. Applied Energy, 306, 118088. [Google Scholar]
122. Aldrich, C., Auret, L. (2010). Fault detection and diagnosis with random forest feature extraction and variable importance methods. IFAC Proceedings Volumes, 43(9), 79–86. https://doi.org/10.3182/20100802-3-ZA-2014.00020 [Google Scholar] [CrossRef]
123. Onesmus, M. (2020). Introduction to Random Forest in Machine Learning. https://www.section.io/engineering-education/introduction-to-random-forest-in-machine-learning/ [Google Scholar]
124. Noshad, Z., Javaid, N., Saba, T., Wadud, Z., Saleem, M. Q. et al. (2019). Fault detection in wireless sensor networks through the random forest classifier. Sensors, 19(7), 1568. [Google Scholar] [PubMed]
125. Wang, H., Feng, D., Liu, K. (2021). Fault detection and diagnosis for multiple faults of VAV terminals using self-adaptive model and layered random forest. Building and Environment, 193, 107667. [Google Scholar]
126. Ahmed, M., Mahmood, A. N., Hu, J. (2016). A survey of network anomaly detection techniques. Journal of Network and Computer Applications, 60(1), 19–31. https://doi.org/10.1016/j.jnca.2015.11.016 [Google Scholar] [CrossRef]
127. Bosman, H. H., Iacca, G., Tejada, A., Wörtche, H. J., Liotta, A. (2017). Spatial anomaly detection in sensor networks using neighborhood information. Information Fusion, 33, 41–56. https://doi.org/10.1016/j.inffus.2016.04.007 [Google Scholar] [CrossRef]
128. Alghushairy, O., Alsini, R., Soule, T., Ma, X. (2020). A review of local outlier factor algorithms for outlier detection in big data streams. Big Data and Cognitive Computing, 5(1), 1. [Google Scholar]
129. Xu, L., Yeh, Y. R., Lee, Y. J., Li, J. (2013). A hierarchical framework using approximated local outlier factor for efficient anomaly detection. Procedia Computer Science, 19, 1174–1181. [Google Scholar]
130. Gao, Z., Cecati, C., Ding, S. X. (2015). A survey of fault diagnosis and fault-tolerant techniques—Part I: Fault diagnosis with model-based and signal-based approaches. IEEE Transactions on Industrial Electronics, 62(6), 3757–3767. [Google Scholar]
131. Abaei, G., Selamat, A. (2014). A survey on software fault detection based on different prediction approaches. Vietnam Journal of Computer Science, 1(2), 79–95. https://doi.org/10.1007/s40595-013-0008-z [Google Scholar] [CrossRef]
132. Zhu, D., Bai, J., Yang, S. X. (2009). A multi-fault diagnosis method for sensor systems based on principle component analysis. Sensors, 10(1), 241–253. [Google Scholar] [PubMed]
133. Harkat, M. F., Djelel, S., Doghmane, N., Benouaret, M. (2007). Sensor fault detection, isolation and reconstruction using nonlinear principal component analysis. International Journal of Automation and Computing, 4(2), 149–155. [Google Scholar]
134. Zhang, K., Chen, Z., Yang, L., Liang, Y. (2023). Principal component analysis (PCA) based sparrow search algorithm (SSA) for optimal learning vector quantized (LVQ) neural network for mechanical fault diagnosis of high voltage circuit breakers. Energy Reports, 9, 954–962. [Google Scholar]
135. Benaicha, A., Mourot, G., Benothman, K., Ragot, J. (2013). Determination of principal component analysis models for sensor fault detection and isolation. International Journal of Control, Automation and Systems, 11(2), 296–305. [Google Scholar]
136. Thalles, S. (2019). An illustrative introduction to Fisher’s Linear Discriminant. Towards Data Science. https://towardsdatascience.com/an-illustrative-introduction-to-fishers-linear-discriminant-9484efee15ac [Google Scholar]
137. Mendoza, M., Tsvetkov, P. V. (2023). An intelligent fault detection and diagnosis monitoring system for reactor operational resilience: Power transient identification. Progress in Nuclear Energy, 156, 104529. [Google Scholar]
138. Ye, H., Wu, P., Huo, Y., Wang, X., He, Y. et al. (2022). Bearing fault diagnosis based on randomized fisher discriminant analysis. Sensors, 22(21), 8093. [Google Scholar] [PubMed]
139. Alcantara, L., Miera, J., Ariun-Erdene, B., Teng, C. C., Lundrigan, P. (2020). The hitchhiker’s guide to successful remote sensing deployments in Mongolia. 2020 Intermountain Engineering, Technology and Computing (IETC), pp. 1–6. Orem, UT, USA. https://doi.org/10.1109/IETC47856.2020.9249214 [Google Scholar] [CrossRef]
140. Sadeghi, M., Soltani, H., KHayyambashi, M. (2015). The study of hardware redundancy techniques to provide a fault tolerant system. Cumhuriyet Science Journal (CSJ), 36(4), 236–245. http://dergi.cumhuriyet.edu.tr/ojs/index.php/fenbilimleri [Google Scholar]
141. Isermann, R. (2006). Fault detection with limit checking. Fault-Diagnosis Systems, 24, 95–110. https://doi.org/10.1007/3-540-30368-5_7 [Google Scholar] [CrossRef]
142. Miljkovic, D. (2021). Fault detection using limit checking: A brief introductory review. 44th International Convention on Information, Communication and Electronic Technology (MIPRO), pp. 908–913. Opatija, Croatia. https://doi.org/10.23919/MIPRO52101.2021.9596786 [Google Scholar] [CrossRef]
143. Lacaille, J. (2009). An automatic sensor fault detection and correction algorithm. 9th AIAA Aviation Technology, Integration and Operations (ATIO) Conference, Aircraft Noise and Emissions Reduction Symposium (ANERS), Hilton Head, South Carolina, USA. https://doi.org/10.2514/6.2009-7081 [Google Scholar] [CrossRef]
144. Swartzendruber, R. W., Feight, L. V., Salewske, T. J. (2012). US8159362B2. Method of detecting faults using graduated fault detection levels. https://portal.unifiedpatents.com/patents/patent/US-20070086135-A1 [Google Scholar]
145. Wu, L., Yao, B., Peng, Z., Guan, Y. (2017). An adaptive threshold algorithm for sensor fault based on the grey theory. Advances in Mechanical Engineering, 9(2), 168781401769319. https://doi.org/10.1177/1687814017693193 [Google Scholar] [CrossRef]
146. Dunia, R., Qin, S. J., Edgar, T. F., McAvoy, T. J. (1996). Use of principal component analysis for sensor fault identification. Computers and Chemical Engineering, 20(SUPPL. 1), 713–718. https://doi.org/10.1016/0098-1354(96)00128-7 [Google Scholar] [CrossRef]
147. Ahmad, S., Lavin, A., Purdy, S., Agha, Z. (2017). Unsupervised real-time anomaly detection for streaming data. Neurocomputing, 262, 134–147. https://doi.org/10.1016/j.neucom.2017.04.070 [Google Scholar] [CrossRef]
148. Ibargiengoytia, P. H., Sucar, L. E., Vadera, S. (2001). Real time intelligent sensor validation. IEEE Transactions on Power Systems, 16(4), 770–775. https://doi.org/10.1109/59.962425 [Google Scholar] [CrossRef]
149. Tsang, K. M., Chan, W. L. (2010). Data validation of intelligent sensor using predictive filters and fuzzy logic. Sensors and Actuators, A: Physical, 159(2), 149–156. https://doi.org/10.1016/j.sna.2010.03.013 [Google Scholar] [CrossRef]
150. Yu, Z., Bedig, A., Montalto, F., Quigley, M. (2018). Automated detection of unusual soil moisture probe response patterns with association rule learning. Environmental Modelling and Software, 105, 257–269. https://doi.org/10.1016/j.envsoft.2018.04.001 [Google Scholar] [CrossRef]
151. Sharma, S., Gupta, K., Gupta, D., Juneja, S., Turabieh, H. et al. (2022). SWOT: A hybrid hardware-based approach for robust fault-tolerant framework in a smart day care. Security and Communication Networks, 2022, 1–16. [Google Scholar]
152. Frank, S., Lin, G., Jin, X., Singla, R., Farthing, A. et al. (2019). Metrics and methods to assess building fault detection and diagnosis tools. National Renewable Energy Laboratory. https://www.nrel.gov/docs/fy19osti/72801.pdf [Google Scholar]
153. Naderi, E., Khorasani, K. (2018). Data-driven fault detection, isolation and estimation of aircraft gas turbine engine actuator and sensors. Mechanical Systems and Signal Processing, 100, 415–438. [Google Scholar]
154. Pinto, R., Cerquitelli, T. (2019). Robot fault detection and remaining life estimation for predictive maintenance. Procedia Computer Science, 151, 709–716. [Google Scholar]
155. Kohli, V., Tripathi, U., Chamola, V., Rout, B. K., Kanhere, S. S. (2022). A review on virtual reality and augmented reality use-cases of brain computer interface based applications for smart cities. Microprocessors and Microsystems, 88, 104392. [Google Scholar]
Cite This Article
 Copyright © 2024 The Author(s). Published by Tech Science Press.
This work is licensed under a Creative Commons Attribution 4.0 International License , which permits unrestricted use, distribution, and reproduction in any medium, provided the original work is properly cited.
 Downloads
 Citation Tools