
 Submit a Paper
 Propose a Special lssue
 Open Access
ARTICLE

Research on Cavitation Characteristics and Influencing Factors of Herringbone Gear Pump
Department of Mechanical Engineering of Inha University, Incheon, 22212, South Korea
* Corresponding Author: Chul-Hee Lee. Email:
Computer Modeling in Engineering & Sciences 2024, 139(3), 2917-2946. https://doi.org/10.32604/cmes.2024.046740
Received 13 October 2023; Accepted 29 December 2023; Issue published 11 March 2024
 View Full Text
 Download PDF
Abstract
Cavitation is a common issue in pumps, causing a decrease in pump head, a fall in volumetric efficiency, and an intensification of outlet flow pulsation. It is one of the main hazards that affect the regular operation of the pump. Research on pump cavitation mainly focuses on mixed flow pumps, jet pumps, external spur gear pumps, etc. However, there are few cavitation studies on external herringbone gear pumps. In addition, pumps with different working principles significantly differ in the flow and complexity of the internal flow field. Therefore, it is urgent to study the cavitation characteristics of external herringbone gear pumps. Compared with experimental methods, visual research and cavitation area identification are achieved through computation fluid dynamic (CFD), and changing the boundary conditions and shape of the gear rotor is easier. The simulation yields a head error of only 0.003% under different grid numbers, and the deviation between experimental and simulation results is less than 5%. The study revealed that cavitation causes flow pulsation at the outlet, and the cavitation serious area is mainly distributed in the meshing gap and meshing area. Cavitation can be inhibited by reducing the speed, increasing the inlet pressure, and changing the helix angle can be achieved. For example, when the inlet pressure is 5 bar, the maximum gas volume fraction in the meshing area is less than 50%. These results provide a reference for optimizing the design and finding the optimal design parameters to reduce or eliminate cavitation.Keywords
Nomenclature
| CFD | Computational fluid dynamics |
| N–S | Navier–Stokes |
| RNG | Renormalization Group |
| SST | Shear–Stress Transport |
| e.g. | |
| Porosity | |
| s | Skin factor |
| Fluid pressure | |
| The saturated vapor pressure of a liquid at a given temperature | |
| Density of a liquid | |
| ν∞ | Flow rate of a fluid |
| σ | Cavitation number |
| Turbulent kinetic energy | |
| Dissipation rate | |
| μt | Turbulent viscosity |
| Gk | Average velocity turbulent kinetic energy |
| Gb | Buoyancy turbulent kinetic energy |
| YM | Total dissipation rate |
| SK | User-defined conditions (Term generated by turbulent kinetic energy) |
| S | User-defined conditions (Term generated by turbulent dissipation) |
| ρv | The density of the vapor |
| ρl | Density of the liquid |
| f | Steam mass fraction |
| α | Steam volume fraction |
| Re | Steam generation rate |
| Rc | Steam condensation rate |
| RB | The radius of the bubble |
| рB | The internal pressure of the drum |
| р | Pressure around the bubble in the liquid |
| R | Net phase transition rate |
| n | Number of vacuoles |
| Vch | Characteristic velocity |
| Ce (Cc) | Empirical coefficients |
| The square root of the local turbulent kinetic energy | |
| β | Gear helix angle |
Cavitation in hydraulic systems occurs when air separates from the gas in a region where the fluid’s partial pressure is lower than the air separation pressure [1]. This results in the occurrence of gas-liquid two-phase flow [2,3]. Cavitation is one of the most challenging fluid flow anomalies affecting the flow behavior and physical characteristics of pumps [4,5]. During the operation of the system, the formation and collapse of vapor bubbles in the liquid due to low-pressure conditions [6] disrupt the smooth flow of fluid [7] and reduce the ability of the liquid to provide the required flow and pressure [8], decreasing the pump efficiency [9] and performance [10]. Simultaneous rupture produces shock waves that cause pitting, erosion, and wear, resulting in vibration and noise [11]. Experimental methods have been conducted to examine pump cavitation [12,13], allowing direct measurement and collection of data on essential parameters, such as pressure fluctuations, noise levels, vibrations, and flow patterns. On the other hand, cavitation usually occurs inside the impeller or in areas that are not easily observed directly. Moreover, the internal flow is difficult to visualize, limiting understanding of the internal flow behavior. These defects have placed some obstacles to the research on the cavitation mechanism and the optimization of pump structure and materials. With the improvement of computer performance, computational fluid dynamics (CFD) analysis allows an in-depth study of the pump cavitation phenomenon [14,15]. Initially, detailed and comprehensive data can be provided, allowing the visualization and analysis of internal flow phenomena, enhancing the understanding of cavitation mechanisms, and helping identify potential problems. Second, parameter sensitivity can be performed, systematically varying the different parameters and evaluating their impact on cavitation. Finally, the parameters and boundary conditions within the virtual model can be modified easily, enabling the rapid iteration and exploration of different design options helping optimize the design of hydraulic systems to minimize or eliminate the effects of cavitation. Therefore, CFD analysis can provide an effective tool for studying the mechanism and impact of cavitation, particularly for the visualization of internal flow conditions. The inside of the pump involves complex flow and hydraulic characteristics, and liquid flow simulation requires a finer mesh quality. A high-resolution grid is necessary to describe the flow field boundary layer flow and interstitial flow to reduce oscillation or numerical dissipation and improve the simulation quality. On the other hand, a high-quality hexahedral grid is required to represent the complex geometries accurately, avoid shape distortion and node irregularities caused by tetrahedral grids, and describe the direction and gradient of flow more accurately, which is particularly important for simulations involving complex flow phenomena, such as turbulence. To ensure simulation accuracy, a volumetric rotating machinery meshing tool developed by CFX-Berlin–TwinMesh can be utilized. This tool can automatically generate high-quality hexahedral meshes. Users can define mesh parameter properties such as the number of meshes, height of the first layer grid, and change ratio. Advanced front-back smoothing technology can be employed to achieve a smaller internal angle (perpendicular to the wall) and volume change ratio. By integrating with the CFX solver, a comprehensive solution can be obtained [16]. The automation level of simulation and the simulation quality can be improved as a result [17]. Therefore, this study uses an analysis method combining TwinMesh with CFX.
The current leading research uses CFD to simulate the process of forming bubbles and air pockets and to predict the possibility of cavitation and the impact of cavitation. Regarding pump cavitation research, scholars have studied the cavitation generation mechanisms and effects of different types of pumps. For mixed-flow pumps, Li et al. [18] found that cavitation reduces the output power of the impeller, resulting in a decrease in head and unstable operation. For external gear pumps, Del Campo et al. [19] used a simplified two-dimensional numerical method to conduct simulations to study the impact of cavitation on volumetric efficiency. Fu et al. [20] studied the cavitation characteristics under steady and transient cavitation conditions for centrifugal pumps. When cavitation is severe, cavitation affects the impeller radial force and impeller channel—the flow pattern within the flow pattern. Wang et al. [21] studied the characteristics of irreversible energy loss caused by cavitation flow in centrifugal pumps by the entropy production theory with CFD. For jet pumps, Cunningham et al. [22] studied the reasons for cavitation in jet pumps, resulting in decreased efficiency. In addition, Ouyang et al. [23] studied cavitation caused by vibration during high-speed gear transmission, considering the gear cavitation mechanism of pitting corrosion and cracks. These studies mainly focus on the generation mechanism of cavitation and the impact of cavitation on efficiency, head, energy loss, and flow, providing a reference for the design of different types of pumps.
This study examines the effects of cavitation on the pump operation process and simulates the internal flow through the visualization tool (CFD). The simulation results are verified experimentally. On the other hand, the research results have limited effects on the optimal design of certain types of pumps because most studies only study the influence of one or several factors. The influence of fluid characteristics [24–26], boundary conditions [27,28], and internal structure [29,30] on cavitation should be comprehensively considered. Regarding fluid characteristics, for example, high-viscosity liquids make it difficult and dangerous to expel air bubbles. For boundary conditions, for example, a low inlet pressure will cause the liquid pressure to reach below the gas saturation vapor pressure, quickly generating bubbles. The internal structure, such as the shape of the rotor, directly affects the liquid's flow and pressure distribution, which will significantly impact cavitation. Pumps with different working principles differ significantly in the flow and complexity of the internal flow field [31]. The fluid chamber for suction and discharge produces positive meshing and side gushing, while the spur gear pump realizes the suction and discharge of fluid in the pump chamber through the meshing of spur gears. During the meshing process of the herringbone gear, cavities of different sizes are formed when moving from the root to the tip. Consequently, cavitation characteristics vary depending on the type of pump. External meshing herringbone gear pumps exhibit robust resistance to high working pressures, adapt well to high-viscosity fluids, possess self-priming capabilities, and are easily maintainable, making them indispensable in production processes. However, limited research has been conducted on cavitation in external meshing herringbone gear pumps. Given this context, it becomes imperative to conduct a dedicated study on the cavitation characteristics of external herringbone gear pumps.
Therefore, this study takes the external meshing herringbone gear pump as the research object and studies the cavitation mechanism of the external meshing herringbone gear pump at high speed and the method to reduce the occurrence of cavitation by CFD. The reason is that the CFD method provides a visualization tool that is difficult to achieve through experiments, which helps understand the mechanism of cavitation and identify the area where cavitation occurs. Compared with the experimental method, it is easier to change the boundary conditions, which is beneficial to studying the external meshing herringbone gear pump. Explore the suitable operating conditions of the pump; the parameters of the gear rotor are easy to change, shortening development time and reducing development costs. The advantage of the study lies in the choice of the TwinMesh + CFX tool to obtain a more accurate solution based on the current simulation problems and the principle of cavitation, focusing on the transient changes in the gas volume fraction and pressure in the meshing area during the meshing process to observe the influence of cavitation more directly. Unlike other types of pumps, this study also selects helix angle as the main influencing factor in addition to exploring conditions such as speed and inlet pressure. The helix angle significantly affects the meshing and disengagement of the gear during rotation, thus affecting the pressure distribution in the pump; the flow pattern is affected by the smoothness of the meshing, and a suitable helix angle can ensure continuous and even flow of liquid due to the influence of pressure changes along the gear teeth. Therefore, an inappropriate helix angle will lead to uneven pressure distribution and quickly form vapor bubbles in the liquid, leading to cavitation and other occurrences. This supplements the research on cavitation characteristics of external meshing herringbone gear pumps. Targeted research on external meshing herringbone gear pumps can help reduce or eliminate the effects of cavitation.
Cavitation significantly impacts the flow of liquids and the performance of fluid equipment [32], mainly when it occurs at high speed and high pressure. Liquids are usually mixed with a certain proportion of gas. For example, the air content in water is approximately 1.87% at standard atmospheric pressure and temperature. When the pressure is lower than the cavitation separation pressure, the air dissolved in the liquid will separate from the liquid and gather into bubbles to dissociate in the liquid. This phenomenon is called gas cavitation. The liquid will vaporize to produce many steam bubbles when the pressure is lower than the saturated vapor pressure, resulting in severe steam cavitation [33]. The precipitated gas exists in the liquid in the form of voids and moves forward with the flow of the liquid. The volume of the cavity increases continuously as the pressure of the fluid continues to decrease. On the other hand, the external pressure is higher than the pressure inside the pit when the cavity moves to a place with higher pressure, and the hole volume will continue to shrink until it is crushed. The strong impact force, high temperature, and high-speed jet generated during the crushing process will damage the surface of various parts, contaminate the liquid, and affect the performance parameters of the pump, such as the head, flow rate, and efficiency [34].
The cavitation number is an important parameter that describes whether cavitation occurs in a liquid, and it is defined as [35]:
where
The size of the σ value represents different cavitation states; a smaller σ value means easier cavitation generation. Therefore, a smaller (
2.2 Basic Equations of Cavitation Numerical Simulation
The key to a mathematical solution to cavitation phenomena is to establish a suitable cavitation model that can simultaneously describe the characteristics of cavitation at two different time scales and the mass exchange between gas–liquid two-phase flow [36]. The free-stream-line theory and the Hodograph method are first proposed as a mathematical solution to cavitation phenomena. On this basis, cavitation theoretical calculation methods, such as mapping and reflux models, are derived. These methods are attributed to fluid simplification (incompressible and no viscosity, assuming that the internal pressure of the cavity is constant, and the surface of the hole is a free streamline). Therefore, studying the development and collapse process of a bubble is challenging. The shortcomings of the above-mentioned potential flow theory models are overcome using a cavitation model based on the N–S (Navier–Stokes) equation, which fully considers the influence of fluid viscosity on the formation, development, and collapse of cavitation. This model is combined with the turbulence model to analyze unsteady cavitation. On the other hand, there are certain limitations in studying fluid viscosity, turbulent flow, and fluid compressibility. The influence of the two-phase flow phase change rate, bubble dynamics, and turbulent fluctuations on cavitation is considered using the gas phase mass fraction transport equation based on the Full cavitation model of the two-phase flow idea. The cavitation numerical simulation method based on the N–S equation is relatively mature and used widely. Therefore, follow-up studies will use this method as the theoretical basis for research.
CFD is based on classical fluid mechanics and numerical analysis and mainly on three significant equations (continuity equation, momentum conservation equation, and energy conservation equation) to solve and analyze fluid motion.
In cavitation research, the turbulence model predicts the complex gas–liquid flow in the external meshing herringbone gear pump [37]. Commonly used turbulence models include the standard κ–
The standard κ–
The turbulent viscosity μt [39] is proportional to the ratio of the second power of the turbulent kinetic energy κ2 to the rough dissipation rate
where Gk is the average velocity turbulent kinetic energy; Gb is the buoyancy turbulent kinetic energy; YM is the total dissipation rate; SK and S
The standard κ–
Based on the standard κ–
The RNG κ–
In addition, the κ–ω turbulence model uses the pulsation frequency ω (Turbulent Frequency) to replace the
On the other hand, the κ–ω turbulence model is challenging when dealing with complex flows with severe eddies and significant separations. At the same time, the simulation accuracy is also affected by the choice of turbulence model constants and grid quality [44]. Therefore, simulations that rely on simulator experience are unsuitable for this study.
The SST κ–ω turbulence model [45,46] combines the κ–ω turbulence model in the inner layer of the boundary layer, with the standard κ–
The cavitation model is mainly a mathematical model proposed based on fluid mechanics, cavitation dynamics, and other knowledge. The cavitation model based on the potential flow theory does not consider the viscosity of the liquid and is only suitable for the study of some particular cavitation problems. The model cannot accurately solve the cavitation problem in the hydraulic system; the cavitation model is based on the N–S equation. On the other hand, there are some difficulties in studying turbulent flow and fluid compressibility, particularly in solving three-dimensional void flow problems. Singhal et al. proposed the Full cavitation model based on two-phase flow. This model established the transport equation of the vapor phase volume fraction, considering the phase transition rate of the two-phase flow, cavitation dynamics, and turbulent fluctuations [47]. The Full cavitation model is used widely in cavitation simulations because it can provide more accurate predictions of cavitation behavior and is suitable for more complex cavitation flow calculations.
The Full cavitation model uses the Rayleigh–Plesset equation to solve the dynamic process of bubble changes [48,49] and comprehensively considers the influence of liquid compressibility, non-condensable gas, and vapor evaporation and condensation on the simulation results. The following derivation process refers to the Full cavitation model that Singhal et al. proposed based on a two-phase flow [47].
The density of the fluid in this model is related to the vapor mass fraction i as follows:
where ρ is the density of the mixed liquid, ρv is the density of the vapor, and ρl is the density of the liquid.
The relationship between steam volume fraction α and steam mass fraction f is as follows:
f is determined by the transport equation:
where Re is the steam generation rate, and Rc is the steam condensation rate. Eq. (9) adopts the homogeneous flow method without considering cavitation movement after steam generation. Therefore, the Rayleigh–Plesset equation is used to describe the growth of bubbles in the liquid and correctly explain the growth and collapse process of bubbles. The bubble dynamics equation is promoted as follows:
where RB is the radius of the bubble; рB is the internal pressure of the drum (assumed to be the vapor pressure at the liquid temperature when no other gas exists); р is the pressure around the bubble in the liquid; σ is the surface tension coefficient between the liquid and the vapor.
The two-phase continuity equations (liquid phase Eq. (11) and vapor phase Eq. (12)) are used to obtain an expression for the net phase change rate:
where R is the net phase transition rate, and its value is Re − Rc.
According to Eqs. (11) and (12), the mixed flow equation is obtained as follows:
According to Eqs. (11)–(13), the relationship between the mixing density ρ and the steam volume fraction α can be obtained:
The vapor volume fraction α is
where n is the number of vacuoles. Therefore, substituting Eq. (15) into Eq. (14),
For Eq. (10), if the surface tension term and the viscous damping term are combined with Eqs. (11), (12), (14), and (16), the expression of the net phase change rate R can be obtained as follows:
Combining Eqs. (9) and (17) (ignoring the second derivative of RB mainly in the initial bubble acceleration process), the new steam transport equation can be expressed as:
The right half of Eq. (18) is expressed as the steam generation rate.
When PB − P < 0,
When the saturated vapor pressure PB equals the saturated vapor pressure when there is no dissolved gas, mass transport, and viscous damping, PB = Pv, Eq. (18) is called the Foam reduction kinetic formula. In Eq. (18), except for n, the other phases are known or are dependent variables. When ignoring the general model of the bubble number density, the phase transition rate formula is expressed by the bubble radius RB as follows:
For simplicity, let RB be the maximum possible cavity radius; RB is determined by the balance between aerodynamic drag and surface tension:
Vrel is usually approximately 5% –10% of the fluid velocity using the limit parameters, e.g., RB→0 as α→0. The phase change rate per unit volume is proportional to the parent term of the phase change, and the steam generation rate Re and the condensation term Rc can be obtained by expressing the steam mass fraction i as follows:
In Eqs. (21) and (22), Vch is the characteristic velocity (relative velocity between liquid and vapor); Ce and Cc are empirical coefficients. These relationships are based on certain assumptions: 1) in the bubble flow state, the phase change rate is proportional to the square of the characteristic velocity Vch, but the phase change rate and the velocity are linearly related in most practical conditions of two-phase flow; 2) the relative velocity between the liquid phase and the atmosphere is 1%–10% of the average velocity. The local turbulent velocity fluctuations are also around this range in most turbulent flows. Therefore, Vch can be approximated as a practical substitute for the square root
Through cavitation coefficient analysis, the main factors affecting cavitation, such as fluid pressure, velocity, etc., are determined to provide a theoretical basis for optimizing boundary operating conditions. Based on the basic equations of fluid dynamics and turbulence models (standard κ-
Table 1 lists the external meshing herringbone gear pump of main parameters, and Fig. 1a shows the 3D model and the section view. The calculation area is depicted in Fig. 1b, comprising primarily the inlet and outlet regions, as well as the rotating fluid area. The external meshing herringbone gear pump is simplified, and the flow path area is obtained using Ansys software, as shown in Fig. 2. The calculation area of the simulation is divided mainly into stator area (A1 and A2) and rotor area (A3 and A4). The monitoring points at the inlet channel (Points 1 and 2), meshing area (Points 3 and 4), and outlet channel (Points 5 and 6) are set to obtain various parameters more intuitively, as shown in Fig. 2.


Figure 1: (a) 3D model and section view of the external herringbone gear pump and (b) Fluid calculation area of the external herringbone gear pump
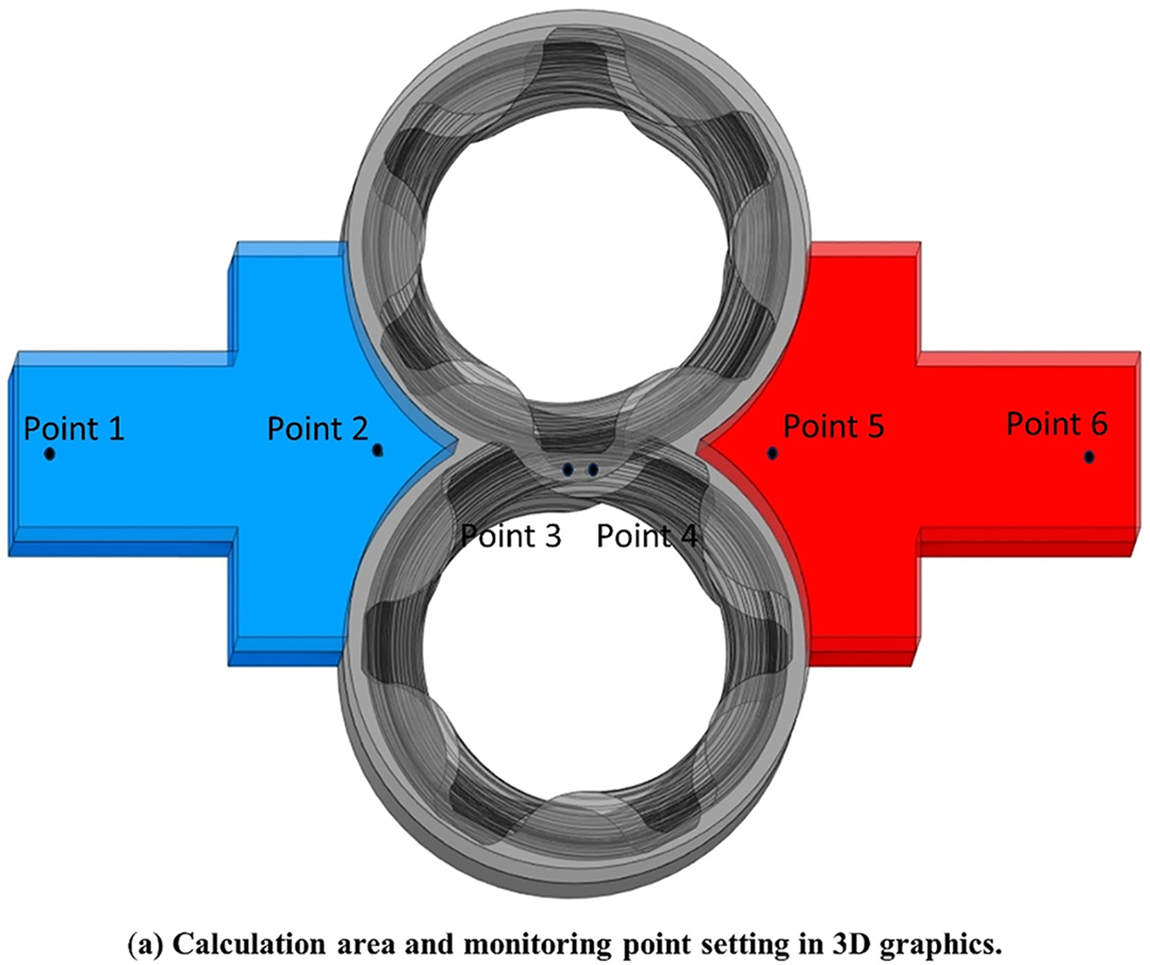

Figure 2: Calculation area and monitoring point setting of the external meshing herringbone gear pump in 3D graphics (a) and at center section in xy plane (b)
For the grid division of the rotor area, TwinMesh software is used to obtain high-quality hexahedral grids, improve grid resolution, and describe flow field boundary layer flow and gap flow. The meshing process using TwinMesh is as follows:
① Use Ansys SpaceClaim to obtain the rotor curve (IGES or ASCII file) from the rotor end face and import it into TwinMesh.
② Use TwinMesh first to obtain the meshing curve (as shown in Fig. 3a) and then generate a 2D grid (as shown in Fig. 3b).

Figure 3: (a) Pre-processing of TwinMesh meshing and (b) 2D mesh of external herringbone gear pump rotors
③ Check the grid quality–the minimum grid angle needs to be greater than 18° to meet the requirements (as shown in Fig. 4a), generate a 3D grid, and check the grid quality (as shown in Fig. 4b). Table 2 lists its main parameter settings.


Figure 4: (a) Mesh quality check of external herringbone gear pump rotors and (b) 3D mesh of external herringbone gear pump rotors

The mesh of the stator area uses Ansys meshing software, and the maximum mesh size is 2 mm. Combining the divided stator area mesh with the rotor area mesh, Table 3 lists the export settings, and the cavitation model is set to the Rayleigh–Plesset model. Fig. 5 shows the derived computational domain grid.


Figure 5: 3D mesh of external herringbone gear pump
3.2 Grid Independence Verification
Grid quality and quantity significantly influence the CFD simulation results. Therefore, independence verification is required to ensure the simulation accuracy. “Grid independence” means that in numerical simulation, the simulation results are unaffected by grid resolution and shape; the simulation results obtained on different grids are similar. Grid independence verification is performed by changing the grid size [50–52]. Only the grid size is reversed, keeping other conditions unchanged, and the number of grids obtained in turn is 3,998,126, 4,430,126, 5,150,126, and 6,350,126. Additional information is listed in Table 3. The simulation is carried out under different grid numbers, and the head of the external meshing herringbone gear pump is obtained, as shown in Fig. 6. The head of the water pump is approximately 204.593 m, and the maximum head error of the four simulations is 0.003% (the error is less than 3%, so the simulation can be considered valid). Hence, the simulation results have nothing to do with the number of grids. The simulation results are quite different from the other three groups when the maximum grid size is 3.2 mm (the number of grids is 3,998,126) (Fig. 6). Thus, the grid accuracy does not meet the simulation requirements. To save simulation time and reduce simulation cost, the maximum grid size is 2 mm, and the number of grids is 4,430,126 for cavitation simulation.

Figure 6: Verification of grid independence of the external meshing herringbone gear pump simulation
The computational domain mesh is generated using a meshing method with a maximum mesh size of 2 mm. The speed used in the simulation was 5000 RPM, with the inlet and outlet pressures set to 1 bar and 20 bar, respectively. The inlet temperature was set to 293.15 K. The RNG κ-
The simulated head and experimental head changes of the external meshing herringbone gear pump at different speeds are shown in Fig. 7. As shown in Fig. 7, the errors between the simulated and experimental displacements at four different speeds are 4.9%, 4.8%, 3.6%, and 2.6%, respectively. The simulation results are lower than the calculation results because the calculation results do not consider lateral clearance leakage [53,54]. The error between the experiment and simulation results is less than 5%. The calculation model is valid, and the simulation results are credible.

Figure 7: Experimental displacement and simulated displacement at the outlet
4.1 Effect of Cavitation on External Meshing Herringbone Gear Pump
The cavitation simulation results of the external meshing herringbone gear pump indicate that the most serious cavitation phenomenon occurs in the meshing area (Fig. 8). Fig. 8a provides an overview of the cavitation situation in the herringbone external gear pump. Figs. 8b–8d show section views along the axial direction and the changes are consistent. The severe cavitation areas are mainly distributed in the meshing area. Fig. 9 shows the change in gas volume fraction at the monitoring point around the meshing area. The gas volume fraction of Points 3 and 4 in the meshing area is above 70% (Fig. 9), which is consistent with the analysis results in Fig. 8. In other monitoring points with the regular operation of the external mesh herringbone gear pump, the pressure tends to be stable, and the gas volume fraction tends to be zero. Fig. 10 shows the pressure distribution diagram of the central section obtained at a particular moment. The pressure distribution of the flow channel is uniform, and the pressure change area is distributed near the meshing area.

Figure 8: Gas volume fraction in the internal flow field of the external meshing herringbone gear pump

Figure 9: Changes in the gas volume fraction at each monitoring point

Figure 10: Central cross-sectional pressure distribution map at 0.026 s
Figs. 11a and 11b show the pressure pulsation and speed change of Points 1, 4, and 6. Fig. 11 shows that the pressure pulse at Point 4 is large, and the speed changes quickly. Hence, it will impact the rotor, resulting in vibration and noise. Based on the above analysis, Point 4 is an important monitoring point for the following cavitation research.

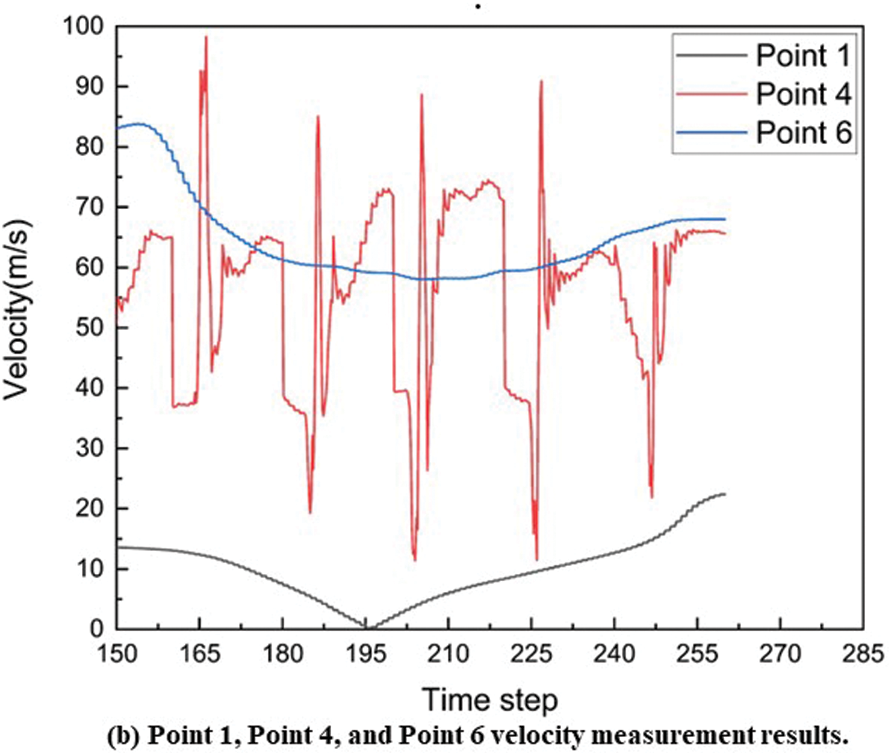
Figure 11: Point 1, Point 4 and Point 6 pressure and velocity monitoring results
Based on the above analysis, in the case of a high-speed external meshing herringbone gear pump, cavitation occurs mainly in the meshing and meshing gap areas (as shown in Fig. 8). Pressure shocks (as shown in Fig. 11a, pressure changes at Point 4) may cause abnormal meshing of the gear teeth and increase wear, whereas cavitation can also cause wheel corrosion and tooth surface erosion [55]. Therefore, more wear-resistant and corrosion-resistant materials should be selected in the manufacturing process of rotor gears. Cavitation causes flow pulsation at the outlet, as shown in Fig. 7.
Among the basic parameters of externally meshing herringbone gears, the helix angle is one of the critical factors affecting the pressure distribution in the pump and the liquid flow mode. Therefore, the helix angle is selected as the primary research object in terms of the influence of the gear shape on cavitation. In addition, the operating conditions (mainly fluid temperature, pressure, properties, gas content, speed, load, and working conditions) should be optimized to reduce the impact of cavitation on the external gear pump. The pump must have a high speed and outstanding displacement characteristics because the external meshing herringbone gear pump is a flood discharge type, and it is difficult to change the working conditions and various parts of the fluid. Therefore, this study chooses the speed and inlet pressure as the research object of the optimized working condition.
4.2 Influence of Rotational Speed on Cavitation
The rotational speed is changed, with the other conditions unchanged. Different speeds (3000 RPM, 5000 RPM, and 7000 RPM) are set to study the cavitation characteristics of the external meshing herringbone gear pump, and Fig. 12 shows the simulation results. Cavitation is more serious when the speed increases [56,57], as shown in Figs. 12a–12c. A comparison of Figs. 12b and 12c show that the rate increased to 7000 RPM. Moreover, in addition to the meshing gap area, the cavitation phenomenon at the inlet channel is intensified; Fig. 13a shows the pressure change. The gas volume fraction of Point 4 increases as the speed increases, as shown in Fig. 13b. Therefore, the cavitation in the meshing area becomes serious, which is consistent with the simulation results in Fig. 12. For the external meshing herringbone gear pump, the speed and the fluid flow rate are increased, keeping the other parameters unchanged. According to Eq. (1), a smaller cavitation value σ means that it is easier to cause cavitation. At the same time, a higher velocity will lead to a more obvious pressure drop in the fluid system, making it easier for the local pressure to drop below the vapor pressure of the liquid, and the formation and rupture of cavitation bubbles are more frequent and intense. Therefore, the pressure drop between the rotor area and the inlet channel increases, and the cavitation phenomenon in the inlet channel intensifies.

Figure 12: Cavitation simulation results at different speeds


Figure 13: Point 4 Pressure and gas volume fraction at different speeds
4.3 Influence of Inlet Pressure on Cavitation
The inlet pressure is changed, with the other conditions unchanged. The inlet pressure is set to 1 bar, 3 bar, and 5 bar. Fig. 14 shows the simulation results. Figs. 14a–14c show that the severe cavitation area is reduced significantly. According to Eq. (1), the cavitation number σ increases as the pressure of the fluid increases, and cavitation is less likely to occur. Increasing the inlet pressure of the pump can reduce the gas entering the pump [58] and increase the pressure difference between the saturated vapor pressure of the liquid and the gas so that the fluid pressure is not quickly lower than the saturated vapor pressure. Figs. 15a and 15b show the change in pressure and gas volume fraction of Point 4 in the meshing region. According to Figs. 15a and 15b, the inlet pressure increases, and the pressure at Point 4 does not change significantly, but the gas volume fraction decreases. When the inlet pressure is 5 bar, the gas volume fraction after 0.0105 s (Step time = 0.0001 s) is <50%, suggesting that the cavitation phenomenon is weakened at an inlet pressure of 1 and 3 bar.

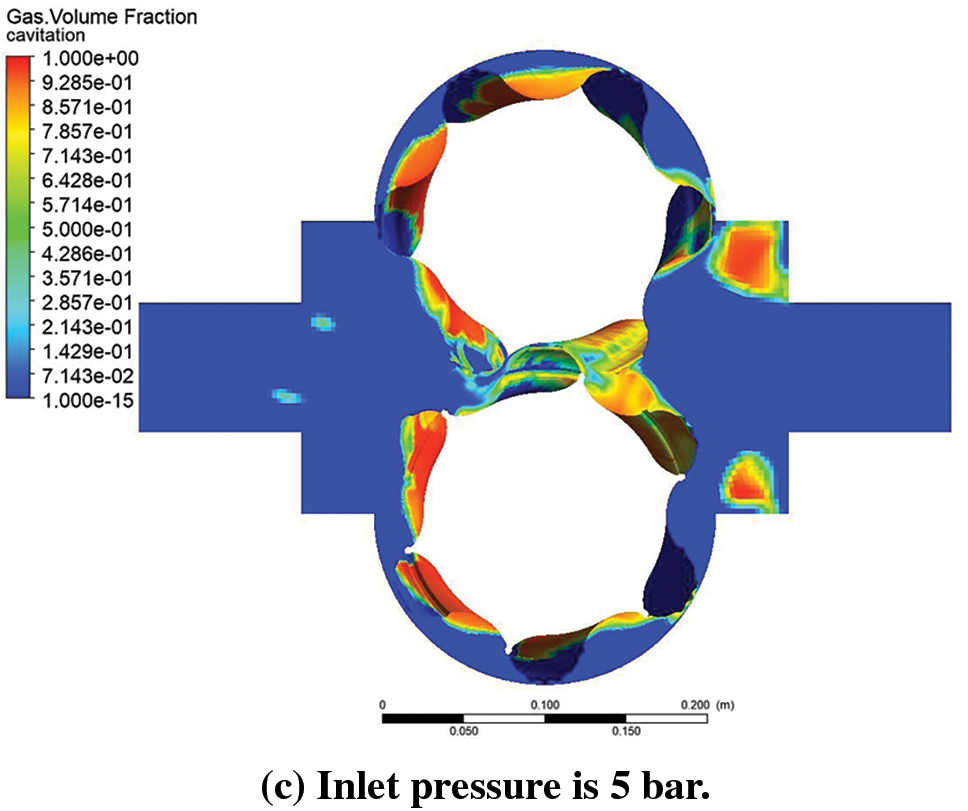
Figure 14: Cavitation simulation results of external herringbone gear pumps under different inlet pressures
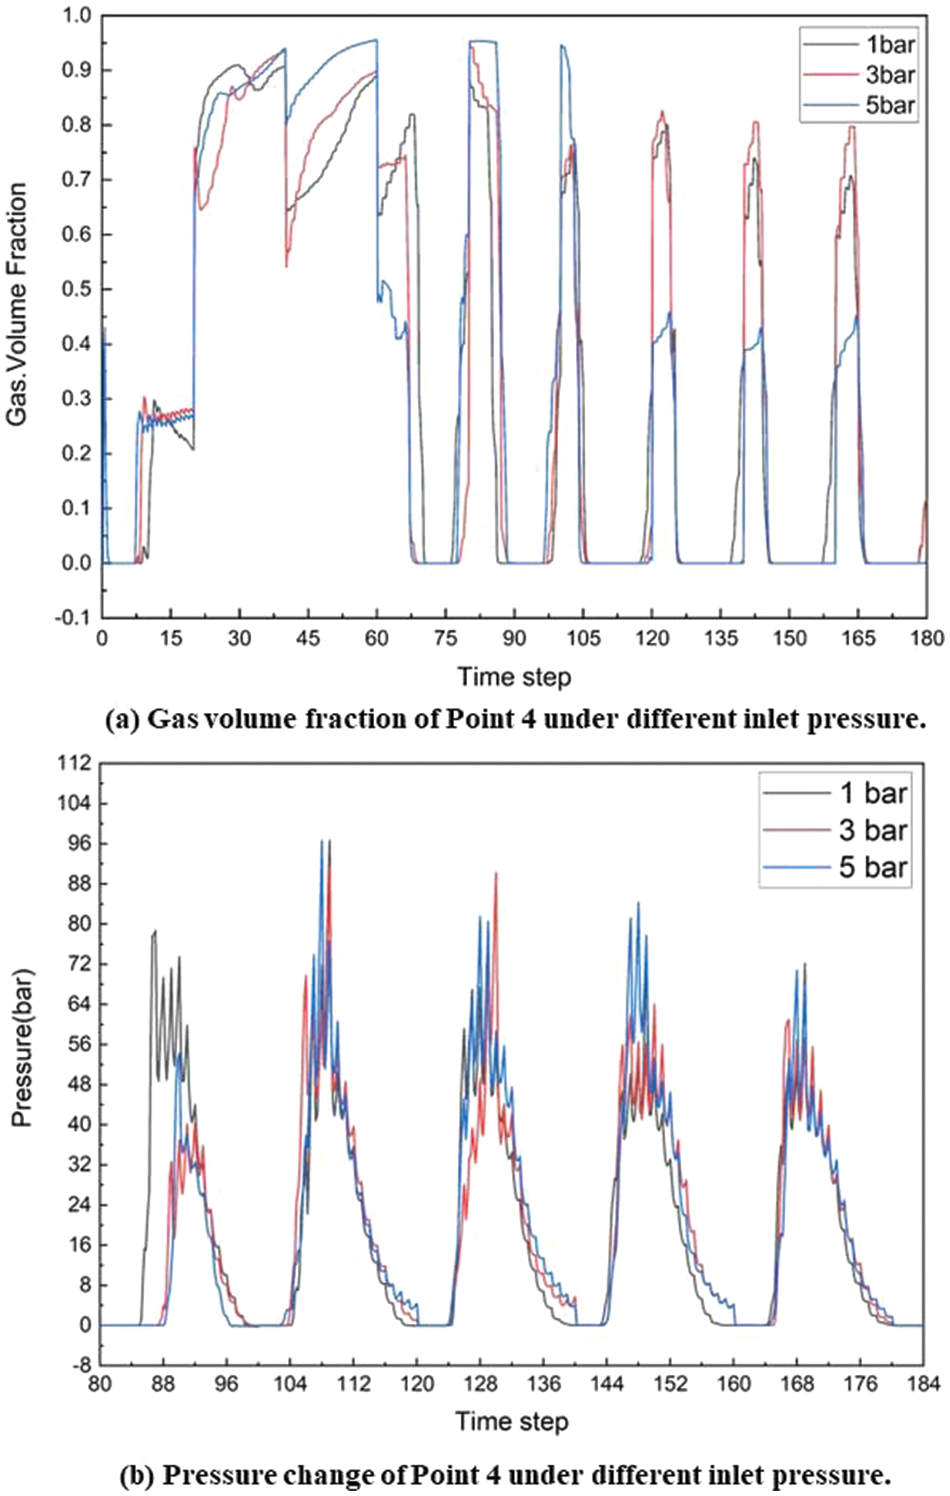
Figure 15: Pressure and gas volume fraction of Point 4 at different inlet pressures
4.4 Influence of Helix Angle on Cavitation
The helix angle of the rotor gear is changed with the other conditions kept constant. Figs. 16a–16c show the cavitation simulation results at helix angles of 24°, 27°, and 30°, respectively. According to Figs. 16a–16c, in the external meshing herringbone gear pump meshing clearance area, the helix angle and the degree of cavitation decrease. According to Fig. 17b, it can be seen that the pressure change trend of the meshing point Point 4 is the same under different helix angles, but the pressure impact intensity is different. It can be seen from Fig. 17a that in the stable operation stage (t = 0.0165 s), the gas volume fraction at Point 4 is more significant than 70%, but the smaller the spiral angle, the more serious the cavitation phenomenon. When the helix angle is 24°, the gas volume fraction is approximately 90%. To analyze pressure changes and gas volume fraction, we selected the maximum and minimum pressure values to determine the maximum pressure difference and average gas volume fraction at Point 4 for different helix angles (refer to Fig. 18). As the helix angle increases, the overall pressure change within the same period gradually decreases. This indicates a smaller difference between the maximum and minimum pressure values, suggesting a gradual decrease in maximum pressure impact. This is advantageous for improving the meshing process, enhancing fluidity and lubricity, and reducing the squeezing effect. For different helix angles, the average gas volume fractions at Point 4 during one rotation of the rotor are 34.4% (24°), 23.1% (27°), and 19.0% (30°). Consequently, as the helix angle increases, the average gas volume fraction decreases, resulting in a weakening of cavitation. This can be attributed to the fact that a higher gear helix angle β leads to a greater tooth surface coincidence degree


Figure 16: Cavitation simulation results of external herringbone gear pump with different helix angles

Figure 17: Pressure and gas volume fraction of Point 4 at different helix angles

Figure 18: Average gas volume fraction and maximum pressure difference at Point 4 under different spiral angles during the same period
CFD (Computational Fluid Dynamics) is a valuable tool for researchers to gain a better understanding of fluid systems and optimize their performance [59–61]. In this particular study, cavitation is observed primarily in the meshing area and the meshing gap area of the external meshing herringbone gear pump, as depicted in Fig. 8. The occurrence of cavitation is found to be significantly influenced by factors such as speed, inlet pressure, and helix angle, as illustrated in Figs. 13–17. By utilizing CFD, researchers can visually investigate cavitation, gain insights into its underlying mechanism, and identify the specific regions where it occurs. Moreover, CFD analysis provides valuable guidance for optimizing the performance of the external meshing herringbone gear pump. Simulation results for various design schemes demonstrated that appropriate adjustment of design parameters can effectively reduce or eliminate cavitation.
For the research on the cavitation characteristics of the external meshing herringbone gear pump, TwinMesh is first used to obtain a high-quality hexahedral mesh to reduce the oscillation or numerical dissipation caused by the mesh quality, improve the simulation quality, and avoid the shape caused by the tetrahedral mesh distortion and node irregularities. TwinMesh is combined with the CFX solver to complete the simulation. An analysis of the principle of cavitation is determined in a numerical simulation using the RNG κ–
① The severe cavitation area of the external meshing herringbone gear pump is distributed mainly in the meshing gap and meshing area. After t = 0.0165 s, the gas volume fraction in the meshing area (Points 3 and 4) is higher than 80%, resulting in cavitation. The volume fraction of inlet channels (Points 1 and 2) and outlet channels (Points 5 and 6) is less than 10%. Cavitation causes a specific pulsation in the outlet flow.
② In the case of high speed (3000 RPM, 5000 RPM, and 7000 RPM), cavitation is reduced significantly when the rate is reduced. In particular, in the case of 7000 RPM, the place where the gas volume fraction of the inlet channel is more significant than 50% increases significantly. The gas volume fraction in the meshing area (Point 4) is above 65% at three speeds, and cavitation occurred. Cavitation can be reduced by reducing the rotational speed.
③ Under different inlet pressures (1 bar, 3 bar, and 5 bar), cavitation is reduced significantly when the inlet pressure is increased. In particular, for the meshing area (Point 4), when the inlet pressure is 5 bar, after t = 0.0105 s, the gas volume fraction is lower than 45%, which reduces cavitation. Increasing the inlet pressure is an effective way of reducing the occurrence of cavitation.
④ Under different helix angles (24°, 27°, and 30°), reducing the helix angle can effectively reduce the area where cavitation occurs. In the stable operation stage (t = 0.0165 s), the gas volume fraction at Point 4 is more significant than 70%, but the smaller the spiral angle, the more serious the cavitation phenomenon. When the helix angle is 24°, the gas volume fraction is approximately 90%. This is different from the cavitation simulation results in other areas. As the helix angle increases, the tooth surface coincidence becomes larger. Within the same rotation period, the average gas volume fraction and maximum pressure difference at Point 4 are reduced, and the cavitation imagination is improved. Therefore, the selection of the helix angle needs to consider the influence of cavitation during the gear meshing process. In the selection of parameters and boundary conditions for the external meshing herringbone gear pump, several factors need to be considered. These include the rotation speed, inlet pressure, and helix angle. It is important to choose a lower speed to minimize the occurrence of cavitation during the meshing process and in the meshing area, while ensuring the desired outlet flow and pressure. Increasing the inlet pressure can also help reduce the occurrence of cavitation by reducing the areas where it can happen. The helix angle plays a dual role in cavitation prevention. Lowering the helix angle can help reduce cavitation in the meshing area, while increasing it can help reduce cavitation during the meshing process. Therefore, increasing the helix angle can improve fluidity and lubricity, reduce decompression, and reduce cavitation generation during the meshing process. However, it is necessary to balance this with the need to increase inlet pressure or decrease rotation speed to mitigate the impact of cavitation around the meshing area. To enhance stability and extend the service life of the outer meshing herringbone gear rotor, a synthetic material coating that can withstand changes in pressure, speed, and liquid properties can be applied to the material surface. It is important to note that factors such as fluid temperature, viscosity, and flow path also influence cavitation, but were not separately studied in this research. These factors should be considered in future studies. The findings of this research provide valuable insights for selecting parameters and boundary conditions for the external meshing herringbone gear pump, to minimize the impact of cavitation.
Acknowledgement: The authors thank the support from the Grant (2024-MOIS35-005) of Policy-linked Technology Development Program on Natural Disaster Prevention and Mitigation funded by Ministry of Interior and Safety (MOIS, Korea).
Funding Statement: This research was supported by a Grant (2024-MOIS35-005) of Policy-linked Technology Development Program on Natural Disaster Prevention and Mitigation funded by Ministry of Interior and Safety (MOIS, Korea).
Author Contributions: The authors confirm contribution to the paper as follows: study conception and design: Chul-Hee Lee, Jinlong Yang; data collection: Jinlong Yang, Kwang-Hee Lee; analysis and interpretation of results: Jinlong Yang, Kwang-Hee Lee, Chul-Hee Lee; draft manuscript preparation: Jinlong Yang, Kwang-Hee Lee, Chul-Hee Lee. All authors reviewed the results and approved the final version of the manuscript.
Availability of Data and Materials: Data and materials can be obtained through the corresponding author’s email address.
Conflicts of Interest: The authors declare that they have no conflicts of interest to report regarding the present study.
References
1. Kranenburg, C. (1974). Gas release during transient cavitation in pipes. Journal of the Hydraulics Division, 100(10), 1383–1398. [Google Scholar]
2. Christopher, S., Kumaraswamy, S. (2013). Identification of critical net positive suction head from noise and vibration in a radial flow pump for different leading edge profiles of the vane. Journal of Fluids Engineering, 135(12), 121301. [Google Scholar]
3. Liu, X., Chen, X., Kang, R., Shen, X., Ni, B. (2020). A coupled cavitation model in an oscillatory oil squeeze film. Computer Modeling in Engineering Sciences, 123(1), 129–152. https://doi.org/10.32604/cmes.2020.07836 [Google Scholar] [CrossRef]
4. Kan, K., Binama, M., Chen, H., Zheng, Y., Zhou, D. et al. (2022). Pump as turbine cavitation performance for both conventional and reverse operating modes: A review. Renewable and Sustainable Energy Reviews, 168, 112786. [Google Scholar]
5. Binama, M., Muhirwa, A., Bisengimana, E. (2016). Cavitation effects in centrifugal pumps–A review. International Journal of Engineering Research and Applications, 6(5), 52–63. [Google Scholar]
6. Abbas, M. K. (2010). Cavitation in centrifugal pumps. Diyala Journal of Engineering Sciences, 3, 170–180. [Google Scholar]
7. Lin, P., Hu, D., Lu, J. M., Wang, S. (2021). CFD numerical simulation of sand-contained cavitation characteristics of axial-flow pump. Advances in Mechanical Engineering, 13(7), 16878140211032785. [Google Scholar]
8. Chao, Q., Zhang, J., Xu, B., Huang, H., Zhai, J. (2019). Effects of inclined cylinder ports on gaseous cavitation of high-speed electro-hydrostatic actuator pumps: A numerical study. Engineering Applications of Computational Fluid Mechanics, 13(1), 245–253. [Google Scholar]
9. Kang, C., Mao, N., Zhang, W., Gu, Y. (2017). The influence of blade configuration on cavitation performance of a condensate pump. Annals of Nuclear Energy, 110, 789–797. [Google Scholar]
10. Long, Y., Zhang, Y., Chen, J. P., Zhu, R. S., Wang, D. Z. (2021). A cavitation performance prediction method for pumps: Part2-sensitivity and accuracy. Nuclear Engineering and Technology, 53(11), 3612–3624. [Google Scholar]
11. Yang, W., Xiao, R., Wang, F., Wu, Y. (2014). Influence of splitter blades on the cavitation performance of a double suction centrifugal pump. Advances in Mechanical Engineering, 6, 963197. [Google Scholar]
12. Peng, C., Tian, S., Li, G. (2018). Joint experiments of cavitation jet: High-speed visualization and erosion test. Ocean Engineering, 149, 1–13. [Google Scholar]
13. Zhang, S., Tian, R., Ding, K., Chen, H., Ma, Z. (2022). Numerical and experimental study in pressure pulsation and vibration of a two-stage centrifugal pump under cavitating condition. Modern Physics Letters B, 36(1), 2150501. [Google Scholar]
14. Zhou, L., Hang, J., Bai, L., Krzemianowski, Z., El-Emam, M. A. et al. (2022). Application of entropy production theory for energy losses and other investigation in pumps and turbines: A review. Applied Energy, 318, 119211. [Google Scholar]
15. Ouyang, T., Mo, X., Lu, Y., Wang, J. (2022). CFD-vibration coupled model for predicting cavitation in gear transmissions. International Journal of Mechanical Sciences, 225, 107377. [Google Scholar]
16. Wang, B., Wu, X., Wang, C., Zhang, Z., Sun, S. et al. (2023). Study on non-uniform internal pressure distribution of twin-screw refrigeration compressor. International Journal of Refrigeration, 152, 214–222. [Google Scholar]
17. Tsao, C. C., Lin, W. K., Lai, K. Y., Yavuzkurt, S., Liu, Y. H. (2023). Numerical investigation of compression and expansion process of twin-screw machine using R-134a. Energies, 16(8), 3599. [Google Scholar]
18. Li, W., Liu, M., Ji, L., Li, S., Song, R. et al. (2023). Study on the trajectory of tip leakage vortex and energy characteristics of mixed-flow pump under cavitation conditions. Ocean Engineering, 267, 113225. [Google Scholar]
19. Del Campo, D., Castilla, R., Raush, G. A., Gamez Montero, P. J., Codina, E. (2012). Numerical analysis of external gear pumps including cavitation. Journal of Fluids Engineering, 134(8), 081105. [Google Scholar]
20. Fu, Q., Zhang, F., Zhu, R., He, B. (2016). A systematic investigation on flow characteristics of impeller passage in a nuclear centrifugal pump under cavitation state. Annals of Nuclear Energy, 97, 190–197. [Google Scholar]
21. Wang, X., Wang, Y., Liu, H., Xiao, Y., Jiang, L. et al. (2023). A numerical investigation on energy characteristics of centrifugal pump for cavitation flow using entropy production theory. International Journal of Heat and Mass Transfer, 201, 123591. [Google Scholar]
22. Cunningham, R. G., Hansen, A. G., Na, T. Y. (1970). Jet pump cavitation. Journal of Fluids Engineering, 92(3), 483–492. [Google Scholar]
23. Ouyang, T., Wang, J., Mo, X., Li, Y. (2023). Vibration and cavitation in high-speed gears caused by faults. International Journal of Mechanical Sciences, 250, 108322. [Google Scholar]
24. Garcia, R., Hammitt, F. G. (1967). Cavitation damage and correlations with material and fluid properties. Journal of Fluids Engineering, 89(4), 753–763. [Google Scholar]
25. Wei, A., Yu, L., Qiu, L., Zhang, X. (2022). Cavitation in cryogenic fluids: A critical research review. Physics of Fluids, 34(10), 101303. [Google Scholar]
26. Spraker, W. A. (1965). The effects of fluid properties on cavitation in centrifugal pumps. Journal of Engineering for Gas Turbines and Power, 87(3), 309–318. [Google Scholar]
27. Aminoroayaie Yamini, O., Mousavi, S. H., Kavianpour, M. R., Safari Ghaleh, R. (2021). Hydrodynamic performance and cavitation analysis in bottom outlets of dam using CFD modelling. Advances in Civil Engineering, 2021, 1–14. [Google Scholar]
28. Yin, F., Kong, X., Ji, H., Nie, S., Lu, W. (2022). Research on the pressure and flow characteristics of seawater axial piston pump considering cavitation for reverse osmosis desalination system. Desalination, 540, 115998. [Google Scholar]
29. Song, Y., Hou, R., Liu, Z., Liu, J., Zhang, W. et al. (2022). Cavitation characteristics analysis of a novel rotor-radial groove hydrodynamic cavitation reactor. Ultrasonics Sonochemistry, 86, 106028. [Google Scholar] [PubMed]
30. Silva, P. A. S. F., Shinomiya, L. D., de Oliveira, T. F., Vaz, J. R. P., Mesquita, A. L. A. et al. (2017). Analysis of cavitation for the optimized design of hydrokinetic turbines using BEM. Applied Energy, 185, 1281–1291. [Google Scholar]
31. Zhu, G., Dong, S. M. (2020). Analysis on the performance improvement of reciprocating pump with variable stiffness valve using CFD. Journal of Applied Fluid Mechanics, 13(2), 387–400. [Google Scholar]
32. Li, G., Ding, X., Wu, Y., Wang, S., Li, D. et al. (2022). Liquid-vapor two-phase flow in centrifugal pump: Cavitation, mass transfer, and impeller structure optimization. Vacuum, 201, 111102. [Google Scholar]
33. Ren, Z., Li, D., Fu, X., Wang, H., Liu, J. et al. (2023). Synergistic effects of vapor and gaseous cavitation and mass-transfer mechanism in a mechanical pump. Physics of Fluids, 35(5), 053335. [Google Scholar]
34. Sreedhar, B. K., Albert, S. A., Pandit, A. B. (2017). Cavitation damage: Theory and measurements-A review. Wear, 372, 177–196. [Google Scholar]
35. Šarc, A., Stepišnik-Perdih, T., Petkovšek, M., Dular, M. (2017). The issue of cavitation number value in studies of water treatment by hydrodynamic cavitation. Ultrasonics Sonochemistry, 34, 51–59. [Google Scholar] [PubMed]
36. Jian, W. (2015). Numerical calculation and experimental research on cavitation erosion of hydraulic equipment (Doctoral dissertation). Jiangsu University, China (In Chinese). [Google Scholar]
37. Guo, G., Zhang, R., Yu, H. (2020). Evaluation of different turbulence models on simulation of gas-liquid transient flow in a liquid-ring vacuum pump. Vacuum, 180, 109586. [Google Scholar]
38. Ahsan, M. (2014). Numerical analysis of friction factor for a fully developed turbulent flow using k–
39. Zhang, S., Yao, Z., Wu, H., Zhong, Q., Tao, R. et al. (2022). A new turbulent viscosity correction model with URANS solver for unsteady turbulent cavitation flow computations. Journal of Fluids Engineering, 144(9), 091403. [Google Scholar]
40. Chen, W., Luo, Z., Li, X., Lu, S., Guo, F. (2023). Numerical study of temperature separation characteristics of vortex tubes: Effects of structural parameters and modeling of cooling performance correlations. Thermal Science and Engineering Progress, 39, 101715. [Google Scholar]
41. Habchi, C., Oneissi, M., Russeil, S., Bougeard, D., Lemenand, T. (2021). Comparison of eddy viscosity turbulence models and stereoscopic PIV measurements for a flow past rectangular-winglet pair vortex generator. Chemical Engineering and Processing-Process Intensification, 169, 108637. [Google Scholar]
42. Xie, S. F., Wang, Y., Liu, Z. C., Zhu, Z. T., Ning, C. et al. (2015). Optimization of centrifugal pump cavitation performance based on CFD. IOP Conference Series: Materials Science and Engineering, 72, 032023. [Google Scholar]
43. Ahn, S. H., Xiao, Y., Wang, Z., Luo, Y., Fan, H. (2018). Unsteady prediction of cavitating flow around a three dimensional hydrofoil by using a modified RNG k-
44. You, Y., Seibold, F., Wang, S., Weigand, B., Gross, U. (2020). URANS of turbulent flow and heat transfer in divergent swirl tubes using the k-ω SST turbulence model with curvature correction. International Journal of Heat and Mass Transfer, 159, 120088. [Google Scholar]
45. Menter, F. R. (1994). Two-equation eddy-viscosity turbulence models for engineering applications. AIAA Journal, 32(8), 1598–1605. [Google Scholar]
46. Menter, F. (1993). Zonal two equation kw turbulence models for aerodynamic flows. 23rd Fluid Dynamics, Plasmadynamics, and Lasers Conference. Orlando, Florida, USA. [Google Scholar]
47. Singhal, A. K., Athavale, M. M., Li, H., Jiang, Y. (2002). Mathematical basis and validation of the full cavitation model. Journal of Fluids Engineering, 124(3), 617–624. [Google Scholar]
48. Franc, J. P. (2007). The Rayleigh-Plesset equation: A simple and powerful tool to understand various aspects of cavitation. Fluid Dynamics of Cavitation and Cavitating Turbopumps, 496, 1–41. [Google Scholar]
49. Shah, Y. G., Vacca, A., Dabiri, S. (2018). Air release and cavitation modeling with a lumped parameter approach based on the Rayleigh-Plesset equation: The case of an external gear pump. Energies, 11(12), 3472. [Google Scholar]
50. Rong, G., Cheng, M., Sheng, Z., Liu, X., Zhang, Y. et al. (2022). Investigation of counter-rotating shock wave and wave direction control of hollow rotating detonation engine with Laval nozzle. Physics of Fluids, 34(5), 056104. [Google Scholar]
51. Zhang, R., Cong, T., Tian, W., Qiu, S., Su, G. (2015). Prediction of CHF in vertical heated tubes based on CFD methodology. Progress in Nuclear Energy, 78, 196–200. [Google Scholar]
52. Lu, H., Zhao, W. (2019). CFD prediction of dust pollution and impact on an isolated ground-mounted solar photovoltaic system. Renewable Energy, 131, 829–840. [Google Scholar]
53. Murali-Girija, M., Koukouvinis, F., Karathanassis, I. K., Gavaises, M. (2019). Numerical simulation of three-phase flow in an external gear pump using immersed boundary approach. Applied Mathematical Modelling, 72, 682–699. [Google Scholar]
54. Yoon, Y., Park, B. H., Shim, J., Han, Y. O., Hong, B. J. et al. (2017). Numerical simulation of three-dimensional external gear pump using immersed solid method. Applied Thermal Engineering, 118, 539–550. [Google Scholar]
55. McNulty, P. J., Pearsall, I. S. (1982). Cavitation inception in pumps. Journal of Fluids Engineering, 104, 99–104. [Google Scholar]
56. Jing, T., Cheng, Y., Wang, F., Bao, W., Zhou, L. (2020). Numerical investigation of centrifugal blood pump cavitation characteristics with variable speed. Processes, 8(3), 293. [Google Scholar]
57. Lin, Z., Ruan, X., Zou, J., Fu, X. (2014). Experimental study of cavitation phenomenon in a centrifugal blood pump induced by the failure of inlet cannula. Chinese Journal of Mechanical Engineering, 27(1), 165–170. [Google Scholar]
58. Zhang, B., Zhao, C., Hong, H., Cheng, G., Yang, H. et al. (2022). Optimization of the outlet unloading structure to prevent gaseous cavitation in a high-pressure axial piston pump. Proceedings of the Institution of Mechanical Engineers, Part C: Journal of Mechanical Engineering Science, 236(7), 3459–3473. [Google Scholar]
59. Peng, H., Zhang, P. (2018). Numerical simulation of high speed rotating waterjet flow field in a semi enclosed vacuum chamber. Computer Modeling in Engineering Sciences, 114(1), 59–73. https://doi.org/10.3970/cmes.2018.114.059 [Google Scholar] [CrossRef]
60. Alsedrani, M. Q., Chala, G. T. (2023). Investigation of the effects of silica nanofluid for enhanced oil recovery applications: CFD simulation study. Arabian Journal for Science and Engineering, 48(7), 9139–9158. [Google Scholar]
61. Yin, F. L., Nie, S. L., Xiao, S. H., Hou, W. (2016). Numerical and experimental study of cavitation performance in sea water hydraulic axial piston pump. Proceedings of the Institution of Mechanical Engineers, Part I: Journal of Systems and Control Engineering, 230(8), 716–735. [Google Scholar]
Cite This Article
 Copyright © 2024 The Author(s). Published by Tech Science Press.
This work is licensed under a Creative Commons Attribution 4.0 International License , which permits unrestricted use, distribution, and reproduction in any medium, provided the original work is properly cited.
 Downloads
 Citation Tools