
 Submit a Paper
 Propose a Special lssue
 Open Access
ARTICLE

Influence of Various Earth-Retaining Walls on the Dynamic Response Comparison Based on 3D Modeling
1 Institute of Mountain Hazards and Environment, Chinese Academy of Sciences, Chengdu, 610299, China
2 University of Chinese Academy of Sciences, Beijing, 100049, China
3 Institute of International Rivers and Eco-Security, Yunnan University, Kunming, 650500, China
4 Department of Structural Engineering, Faculty of Civil Engineering, Doctoral School, Akademicka 2, Silesian University of Technology, Gliwice, 44-100, Poland
* Corresponding Author: Huali Pan. Email:
Computer Modeling in Engineering & Sciences 2024, 139(3), 2835-2863. https://doi.org/10.32604/cmes.2024.046993
Received 21 October 2023; Accepted 26 December 2023; Issue published 11 March 2024
A correction of this article was approved in:
Correction: Influence of Various Earth-Retaining Walls on the Dynamic Response Comparison Based on 3D Modeling
Read correction
 View Full Text
 Download PDF
Abstract
The present work aims to assess earthquake-induced earth-retaining (ER) wall displacement. This study is on the dynamics analysis of various earth-retaining wall designs in hollow precast concrete panels, reinforcement concrete facing panels, and gravity-type earth-retaining walls. The finite element (FE) simulations utilized a 3D plane strain condition to model full-scale ER walls and numerous nonlinear dynamics analyses. The seismic performance of different models, which includes reinforcement concrete panels and gravity-type and hollow precast concrete ER walls, was simulated and examined using the FE approach. It also displays comparative studies such as stress distribution, deflection of the wall, acceleration across the wall height, lateral wall displacement, lateral wall pressure, and backfill plastic strain. Three components of the created ER walls were found throughout this research procedure. One is a granular reinforcement backfill, while the other is a wall-facing panel and base foundation. The dynamic response effects of varied earth-retaining walls have also been studied. It was discovered that the facing panel of the model significantly impacts the earthquake-induced displacement of ER walls. The proposed analytical model’s validity has been evaluated and compared with the reinforcement concrete facing panels, gravity-type ER wall, scientifically available data, and American Association of State Highway and Transportation Officials (AASHTO) guidelines results based on FE simulation. The results of the observations indicate that the hollow prefabricated concrete ER wall is the most feasible option due to its lower displacement and high-stress distribution compared to the two types. The methodology and results of this study establish standards for future analogous investigations and professionals, particularly in light of the increasing computational capabilities of desktop computers.Keywords
Earth-retaining (ER) walls have grown increasingly popular in road construction projects since the 20th century. As a direct result, many iterations of these structures are now included in contemporary transportation networks [1,2]. A widely recognized technique for constructing ER walls involves the utilization of discontinuous incremental concrete-facing panels. Geogrid or steel mesh is the most frequently employed backfill soil-reinforcement component [3,4]. Geogrid granular backfill soil-reinforced and porous precast concrete-facing panels are the subject of this paper. The design of the seismic response of these structures frequently relies on nonlinear dynamics techniques, wherein well-known principles are modified empirically. In the case of ER walls that are built with continuous facing panels along the backfill facing direction, the most suitable approach is to utilize 3D numerical modeling with the finite element method (FEM) and ABAQUS-V 6.14.3 [5]. The 2005 Pakistan earthquake caused considerable harm to earth-retaining structures, bridges, and highways near the epicenter. The greatest recorded peak ground acceleration (PGA) was 0.6 g, which was accompanied by excessive sliding and deformation of conventional earth-retaining walls [6]. The ER wall underwent substantial sliding and rotation due to the 2019 assault earthquake, which measured 0.4 g [7] for its utmost peak ground acceleration.
Embedded earth-retaining walls must account for internal forces and permanent displacements throughout the seismic design process. Since fully dynamic numerical studies are time-consuming and need specialized knowledge, they are generally accomplished using simplified approaches, such as pseudo-static and pseudo-dynamics methods [8]. In order to determine the internal stability and seismic performance of an ER wall, nonlinear dynamics methods are frequently employed, supplemented with empirical corrections that adhere to established principles of seismic pressure on structures [9,10]. Shaking table experiments and finite element FE simulations are commonly employed in evaluating lateral pressure, reinforcement settlements, deflection, and displacement in ER walls [11]. The accuracy of the FE technique in predicting backfill pressure on earth-retaining walls was established by the researchers in [12] through their numerical simulations of various varieties of ER walls. A study [13] determined that the lateral force exerted on quay walls is substantially affected due to the wall’s height and the lateral seismic coefficient. The study employed finite element analysis to simulate the lateral pressure induced by earthquakes on quay walls and apply seismic pressure from the wall. The findings of FE analysis and comparative experiments between rigid and flexible retaining walls demonstrated that the flexibility of ER walls significantly influenced the backfill pressure [14].
The focus of an extensive analytical investigation of the seismic behavior of rigid ER walls [15] was the importance of wall height in earth shackling. The investigation of the passive response of a rigid concrete retaining wall was conducted utilizing the FE method. The failure domain’s magnitude grew when base excitation was maximum implemented [16]. According to the study, FE analysis could calibrate a nonlinear distribution of backfill pressure behind a flexible ER wall [17]. Shaking tables and finite element analysis have been employed in many research endeavors to enhance understanding of the force-dynamic positions of backfill on ER walls and the diverse mechanisms of failure they entail [18,19]. It was determined that the backfill soil could substantially affect the seismic performance of ER walls. Assessing the displacement of ER walls caused by earthquakes is a critical aspect of contemporary performance-based seismic design [20]. Ling et al. [21] adjusted the Newmark sliding block model to predict the displacement of retaining walls caused by earthquakes. Nimbalkar et al. [22] discovered a nonlinear dynamic soil pressure along the height of the basement wall and determined that when numerically evaluating basement walls, the standard Mononobe-Okabe method (MO) produces conservative seismic force estimates.
FE analysis determined how backfill affected the earth-retaining ER wall seismic response. Backfill cohesiveness is shown to have a minimal effect on thrust placement. They understood earthquake-induced retaining wall deterioration [23,24]. The nonlinear FE method overestimates earthquake-induced displacement of failure earth-retaining walls [25]. In order to enhance comprehension of the displacement of freestanding structures caused by earthquake ER walls in near-fault ground excitations, a comprehensive computational analysis identified significant retaining wall displacements for PGA-0.4 g [26]. The traditional earth-retaining wall was more detrimental to the environment than the prefabricated wall. As per the findings of the study, the prefabricated earth-retaining wall demonstrated superior performance in terms of essential material cost, CO2 emissions, and embodied energy when compared to the conventional ER wall [27,28].
Prior researches [29,30] showed that a comprehensive evaluation of the influence of geosynthetic reinforcement on the stability of built buildings is rare. This is yet to be done using a dependable strategy that does not rely on assumptions about the failure surface. Furthermore, in examining the stability of such ER walls, inherent anisotropy in the soil medium has yet to be taken into consideration [31,32]. Finite element limit analysis evaluates the lateral earth pressure imposed on a retaining wall backfilled with geosynthetic-reinforced soil mass [33,34]. The influence of intrinsic anisotropy of the backfill soil on the stability of geosynthetic-reinforced ER walls is accounted for by adopting the method established by [35,36]. The impacts of internal friction angle, soil-wall and soil-reinforcing interface friction angles, inherent anisotropy, and surface loading are thoroughly researched and addressed, in addition to the length and number of reinforcement layers [37].
This research paper proposes to investigate the seismic response outcomes of lateral displacement of the wall, backfill plastic strain, wall acceleration, stress distribution, lateral pressure after construction, and deflection of the wall. This investigation aims to examine the seismic performance of hollow precast reinforced earth-retaining walls using nonlinear dynamic finite element analysis. This will be executed with the motivations above and considerations in mind. This research is the first to examine the impacts of earthquakes on several types of hollow precast earth-retaining walls. Various wall models may aid academics and policymakers in understanding the effects of earthquake-induced development in many countries. Concurrent with the investigations above, the present study examines many factors: lateral displacement, backfill plastic strain, lateral pressure, wall deflection, and stress distribution. As a result, the researchers assumed that this goal was achievable. While the variables' impact on the retaining wall’s performance may vary in comparison to the seismic force, these groups remain robust irrespective of geographical placement. Table 1 details the variables that affect the seismic performance of ER walls.

In order to investigate the seismic response of three-dimensional models of ER walls, FE analysis was performed. The seismic response of three distinct earth-retaining walls—PC-W (5 m), GM-W (5 m), and CR-W (5 m)—was investigated and analyzed parametrically about the effects of hollow precast concrete, second gravity-type, and third reinforcement concrete panel ER walls. The findings of the FE study were used in nonlinear dynamic analysis to better understand the model’s seismic response. As a result, the input base accelerations, or accelerograms, have been scaled to 0.4 g times the peak ground acceleration PGA [6]. Based on the findings of finite element simulations, the reactions of the ER walls to stress distribution, wall deflection, acceleration across the wall height, lateral wall displacement, lateral wall pressure, and backfill plastic strain have all been examined. The numerical modeling revealed that the boundary conditions, zone dimensions, and property assignment substantially influence the seismic response behavior of these wall types; these parameters play a critical role in the simulations of the models [5]. The connections comprise the following: (1) the horizontal and vertical connection of the bottom of the foundation soil; (2) the horizontal connection of the retained soil on both sides; and (3) the horizontal connection of the retained soil on its left side. The confines of the FE model were established using the acceleration and displacement-controlled boundary option in ABAQUS [5,39].
As indicated in Table 2, the Abaqus FE model for analysis is built using three classes of materials in this research. The reinforcing geogrid was built using the Abaqus [43] wire element feature, and the walls were made using the concrete-damaged plasticity (CDP) model. Utilizing the Mohr-Coulomb (MC) material model, the constitutive behavior of the backfill was determined. It has been assumed that the plane strain conditions played a role in the formation of the three-dimensional model [38,43]. Furthermore, gravitational forces have been incorporated throughout the entire finite element model. The foundation of the finite element model was subjected to seismic loading through the utilization of acceleration along the x-axis. In large-deformation numerical analysis, the nonlinear dynamic explicit solution method implemented in the finite element program Abaqus is widely utilized [43]. Regarding boundary condition concerns, Abaqus’ dynamic explicit analyses employ an explicit central difference integration rule and several short-time steps.

The research simulates three distinct ER walls: a hollow precast concrete panel, a gravity-type, and a reinforced concrete ER wall. Figs. 1–3 show the geometry specification details. The components of the hollow precast concrete wall are illustrated in Fig. 1. The numerical model depicts an idealized repeating unit that is 1 meter wide and runs along the length of the wall, consisting of panels that are 1 meter tall. The steel reinforcement rebar is positioned at a vertical spacing of 250 mm rebar stripe and is 150 mm wide by 14 mm thick; these are standard dimensions for hollow precast concrete ER walls. The numerical model depicts a wall measuring 5 meters in height and comprising six modules stretching along its length. L = 4 m represents the length of the reinforced zone, which is equivalent to 1 m H for the wall height H. The L/H ratio of 1 is generally regarded as the optimal value for design purposes [3]. No surcharge loading was applied to the model’s upper boundary in the numerical simulations. Table 2 lists the rebar specifications utilized in this investigation. The gravity-type and reinforcement concrete rigid ER wall running length is 6 m and height is 5 m, as shown in Figs. 2 and 3.

Figure 1: 3D model overview and structural components of the precast hollow concert ER wall

Figure 2: 3D model overview and structural components of the gravity-type ER wall

Figure 3: 3D overview and structural components of the reinforcement concrete ER wall
2.2 Constitutive Modeling of Base Foundation and Reinforcement Backfill
A complete parametric study for granular backfill types was conducted to understand the function of backfill in the overall seismic performance of the ER wall. Tables 3 and 4 indicate the mechanical parameters of the backfill materials. According to research by Damians et al. [5], ER wall performance is influenced by the reinforcement global stiffness, calculated by dividing the wall height (H/h) by the total reinforcement stiffness from all reinforcement layers. For example, an increase in global reinforcement stiffness will result in higher wall reinforcement stresses despite all other parameters remaining constant. Damians et al. [7], utilizing data obtained from operational full-scale instrumented earth-retaining reinforced soil walls, determined the global rigidity range to be 35–380 MPa, with reinforcement stiffness amounting to 56 MPa (Table 3). These walls were determined to be of inextensible reinforcement. The greatest reinforcement stresses in the present investigation were less than 0.03% for all instances and layers, significantly below the steel yield strain of 0.2%. In contrast, Bakr et al. [9] reported up to 0.08% stresses after construction on a monitored 17-m-high production ER wall. The maximum strains calculated for the steel straps in this study were approximately 0.2%. This value is considerably lower than the strains observed in actual geogrid earth-retaining walls. It is certainly not above the 1% strain recommended that is keep to maintain working stress levels [44] and guarantee sufficient safety margins against tensile failure [8].

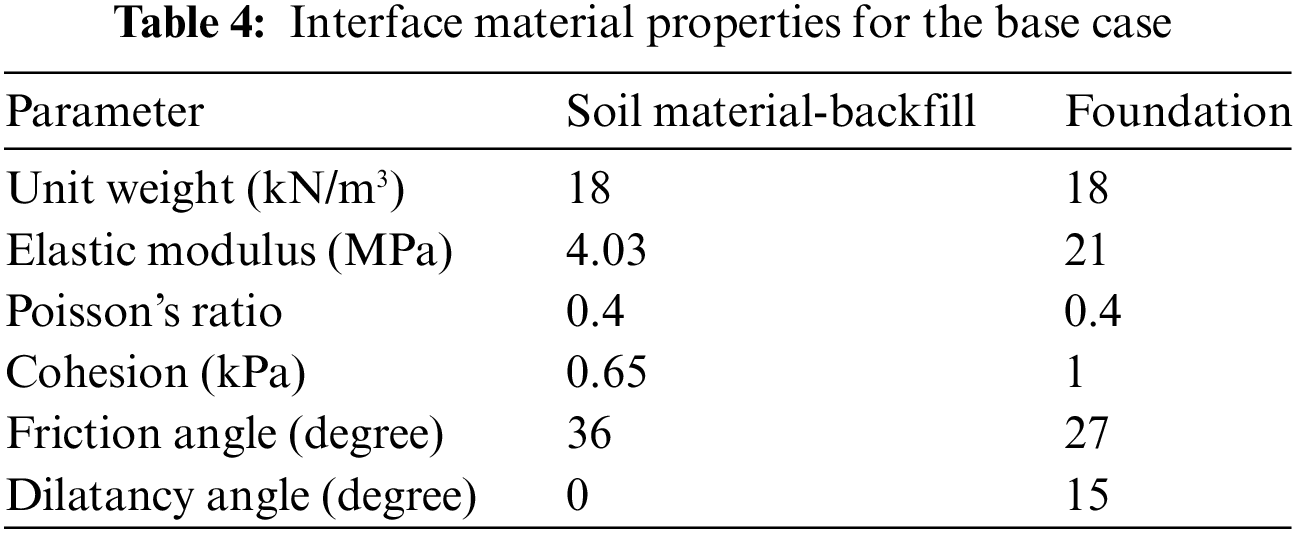
The peak plane strain friction angles most accurately characterize the shear strength of the granular soils. Determining plane strain friction angles for granular soil is possible using a “plane strain” test apparatus, consisting of a block of soil between two frictionless parallel plates that inhibit deformations at the plate boundaries that occur out of the plane. Therefore, the soil is constrained by this testing apparatus in a manner analogous to the y–z boundaries implemented in the numerical model utilized in this research. For compact granular soils, the peak friction angles calculated using plain strain tests are greater in magnitude than the values obtained using triaxial tests. By applying the correlation between triaxial tests and the maximal plane strain friction angle of 44 [33], it is possible to determine that 38 represents the latter. This value is typical for AASHTO (American Association of State Highway and Transportation Officials)-specified granular fill materials of superior quality intended for earth-retaining walls [3]. A cohesion value of 1 kPa was chosen in order to guarantee numerical stability at the unrestricted boundaries of the soil zone (top) throughout the construction process [5]. As shown in Fig. 4, the backfill-reinforced zone is approximately L = 4 meters long, or 1 H, where H is the wall height. No surcharge loadings were applied to the model’s upper boundary in the numerical simulations. By conducting the consolidated-drained (CD) triaxial test, the constitutive behavior of soils is observed [45]. In order to simulate the constitutive behavior of granular backfill, the MC material model was applied. Several studies [39] utilized the MC material model to simulate the behavior of backfill before and after yield.

Figure 4: Modeling of the backfill and backfill reinforcement (A and B) modeling of the precast concrete, reinforcment concrete, and gravity-type ER wall backfill
It is essential to acknowledge that the simulation of soil post-yield behavior is also possible by extending the MC material model [36]. In light of this, the FE investigations conducted in this study have been analyzed using the MC model of granular backfills. Using the outcomes of triaxial tests, Song [46] has described the MC material model and calibrations in detail. The laboratory triaxial results of granular backfills were compared to the triaxial test outcomes of the calibrated MC material model, specifically the hardening and softening behaviors. In an investigation [39], the authors detailed the intricacies of MC material modeling, triaxial test data calibrations of the post-yield response of backfill, and backfill Rayleigh damping modeling. The wire components of the geogrid mesh utilized for backfill reinforcing were modeled in Abaqus [43] for this investigation. For structural support, thin reinforcing geogrid is layered into the backfill soil. The tensile failure strain of the geogrid components can be quantified, and these components are susceptible to failure in both tension and compression conditions. The nonlinear shear failure enveloping at the geogrid-soil interface exhibits a shape-variable behavior in response to the confining pressure. Table 5 summarizes the characteristics of the geogrid components, facilitating the replication of the primary and secondary reinforcement laid in the geogrid. Within the reinforced zone, the geogrid elements were arranged horizontally. The length of the geogrid embedded in the backfill stratum matched that of the backfill material. As illustrated in Fig. 4, the geogrid soil was composed of five distinct strata, with each layer being spaced at a distance of 1 meter.

The reduction factor connected the interfaces’ modulus and friction angle characteristics to the nearby soil. The facing-soil interface was assigned the value 0.6, while the soil-reinforcement interface was assigned the value 0.52. The soil-facing interface was intended to be non-dilatant and seamless. Despite this, it was presumed that the soil-reinforcement interface was uneven and assigned the same dilatancy angle as the adjacent soil. The soil and interface characteristics utilized in this study were determined by the numerical modeling experience of Damians et al. [14] with steel mesh-reinforced walls. The friction coefficient was assumed to be 0.4 for the base scenario, which is a conservative (safe) approximation for the design of corrugated steel strips [1] and on the low end for steel strips [5,8]. Based on its mechanical properties, the horizontal junction between adjacent panels was selected to transform bearing pads featuring internal cavities and a corrugated geometry into zones comprising uninterrupted thin solid rectangular strips possessing equivalent one-dimensional compressive rigidity. In the base case models, a row of high-density soil-bearing patches is employed as the joint material [23]. In order to modify the bearing pads from hollow interiors and corrugated morphologies to continuous, narrow, solid rectangular zones with the same one-dimensional compressive rigidity, the mechanical properties of the horizontal junction between two panels were selected. The joint material of base case models is identical to that of a row of high-density bearing pads [23].
2.3 Concrete and Steel Constitutive Modeling
The concrete was simulated using the Abaqus FE software and the concrete-damaged plasticity (CDP) model. Many researchers have employed the CDP model to investigate the constitutive behavior of concrete [47,48]. Eqs. (1) and (2) of the CDP model describe concrete’s constitutive behavior under tension and compression.
The tensile and compressive stress vectors are correspondingly denoted as ßt and ßc. The εtem and εcem represent the tensile and compressive plastic strain equivalents. The initial undamaged elastic modulus (E0em) was determined by analyzing the strain and stress responses during a uniaxial compressive strength test conducted on concrete. The dependent variables in the damage equation [49] are plastic strains. The initial iteration of the yield function for the CDP model was developed by Lubliner et al. [50]. Subsequently, Lee et al. [51] revised this function. Regarding the CDP yield function, consult the Abaqus/Explicit User’s Manual [43]. As measured in the deviatoric stress plane, eccentricity and dilation angle govern the plastic potential process.
The technical characteristics of modeling concrete using the (CDP) model are presented in Table 2. A method for generating the stress-strain response of concrete with a compressive strength (Cfp) of 25 MPa was proposed by Carreira et al. [52]. It is postulated that concrete will exhibit elastic behavior (concrete under compression) when the stresses exceed 0.3 Cfp. When exposed to uniaxial stress, the fracture energy approach predicted the concrete’s tensile behavior [9]. The linear softening model was employed to quantify the concrete’s tensile failure. We determined Cf, representing the tensile strength of the concrete, and Fg, denoting the fracture energy, by utilizing Eqs. (3) and (4). The Cf and Fg have been calculated using the maximal aggregate size (ag) and the concrete compressive strength Cfp [53,54].
2.4 Load and Boundary Conditions
The boundary conditions, zone dimensions, and property assignment substantially influence the facing behavior of these wall types, as demonstrated by the numerical modeling; these parameters play an essential role in the model simulations. In 3D FE simulations, the boundary of the bottom domain was fixed. It was determined that the foundation boundary, which is located 2 m below the wall, is sufficiently far to have no discernible impact on numerical results. Every element comprising the finite element mesh had ten nodes, including the zones employed to model the interfaces of dissimilar materials. There were 14,888 nodes and 13,128 elements in the finite element mesh. The connections comprise the following: (1) the horizontal and vertical connection of the bottom of the foundation soil; (2) the horizontal connection of the retained soil on both sides; and (3) the horizontal connection of the retained soil on its left side. Acceleration and displacement-controlled boundary options in ABAQUS defined the limits of the FE model. The FE model is based on a pinned support that allows horizontal x-axis motion but imposes y-axis limitations [8,38]. Moreover, the backfill and base rock zones have been determined to contain geostatic stresses. The principal objective behind furnishing an elaborate account of the geostatic pressures was to validate the precision of the FE values and the force distribution [13]. The x-axis acceleration was used to apply the seismic loading to the FE model’s base. The domain boundaries exhibited unrestricted vertical mobility in the front foundation zone and the retained fill zones. It was a pragmatic compromise to determine the wall-facing distance from the domain’s rear boundary in order to minimize the effects of far-field boundaries on ER wall deformations and duration.
The principal objective of furnishing an elaborate account of the geostatic pressures was to validate the precision of the finite element analysis and the force distribution [43]. The vertical y–z boundaries were immobile along the x-axis of the cross-plane. Therefore, the vertical (y) boundaries of the soil and panels, y–z, were unrestricted in their motion. The domain boundaries were available vertically at the front of the foundation zone and the rear of the retained fill zone. The seismic loading was implemented on the foundation of the FE model by utilizing the x-axis acceleration. The domain boundaries exhibited unrestricted vertical mobility in both the retained fill zones and the front foundation zone. The boundaries of the model were constrained regarding all degrees of freedom system (Dof’s) [38]. The spring and dashpot system was also implemented to represent the FE model’s vertical (viscous) boundaries. Implementing viscous boundaries has demonstrated efficacy in diminishing boundary effects and computational time.
2.5 Mesh Sensitivity Analysis and Effect of the Soil Domain Size
Mesh sensitivity analyses were conducted in order to examine the impact of mesh size on the seismic response of the ER wall. The FE model was constructed utilizing plane strain elements with reduced integration and hourglass control (CPE4R), with the exception of the steel reinforcement. The steel reinforcement (rebar) was mesh-integrated utilizing a beam element (B31) [39]. Many researchers have examined the relationship between mesh size and structural response and have observed that finite element analysis results are susceptible to variations in mesh size. Furthermore, research has demonstrated that determining the ideal mesh size can achieve more accurate finite element FE outcomes while decreasing computation time [16,20]. FE investigations conducted by Tiwari et al. [38] revealed that the backfill in the vicinity of the heel slab and ER wall stem substantially affected the earth-retaining wall’s seismic response.
As a result, mesh sensitivity analyses have been performed to determine the impact of different mesh sizes on the precision of the computational model at the interfaces where the ER wall and the backfill material come into contact (see Fig. 5A). In order to conduct the mesh sensitivity evaluations, the mesh dimensions of the stem and heel of the model were modified. In order to mitigate the shear-locking effects, the finite element analysis employed a medium-density mesh. The mesh sensitivity analysis utilized four distinct mesh sizes: 25, 50, 75, and 100 mm. Analyses of mesh sensitivity were performed utilizing the FE model. A negligible differentiation has been noted in the results obtained from different mesh sizes of the models. Considering mesh sensitivity analyses, a 25 mm mesh size was selected for the exhaustive FE investigations.

Figure 5: Mesh sensitivity and backfill domain size analysis for ER wall model
The outcomes of FE simulations may be greatly influenced by boundary conditions [5,39]. A thorough parametric analysis has been carried out for various backfill domain lengths behind the ER wall-facing panels to determine the ideal domain length of backfill. Four models with backfill domain lengths of 4, 5, 7, and 8 m were considered for the domain size investigation. In place of backfill, granular soil has been utilized in the four earth-retaining variants. As described in Section 2.2, the backfill was modeled using the MC model. A spring and dashpot system representing the FE software Abaqus illustrated boundary conditions [43]. For the backfill domain size investigation, the input base excitation for the nonlinear time history finite element analyses was the Taft accelerogram (United States Station). The relative displacement time history at the summit of the earth-retaining wall, as observed from various backfill domain lengths, is depicted in Fig. 5B. Higher active state displacement was observed in the ER with backfill domains of 8, 7, and 5 m in length compared to the ER with a backfill domain of 4 m. The disparity in question may be explained by the increased amount of stress wave reflection from the boundaries of the backfill domains measuring 8 and 7 m in length, respectively. The computational time for the earth-retaining wall featuring backfill domains measuring 7 and 8 m was significantly longer than that of the wall featuring backfill domains measuring 5 and 4 m, respectively.
Earth-retaining ER wall models are utilized in FE studies to estimate earthquake-induced displacement. Full-scale ER wall investigations require FE simulation and constitutive modeling expertise. A force-based displacement verification model has computed the maximal elastic displacement.
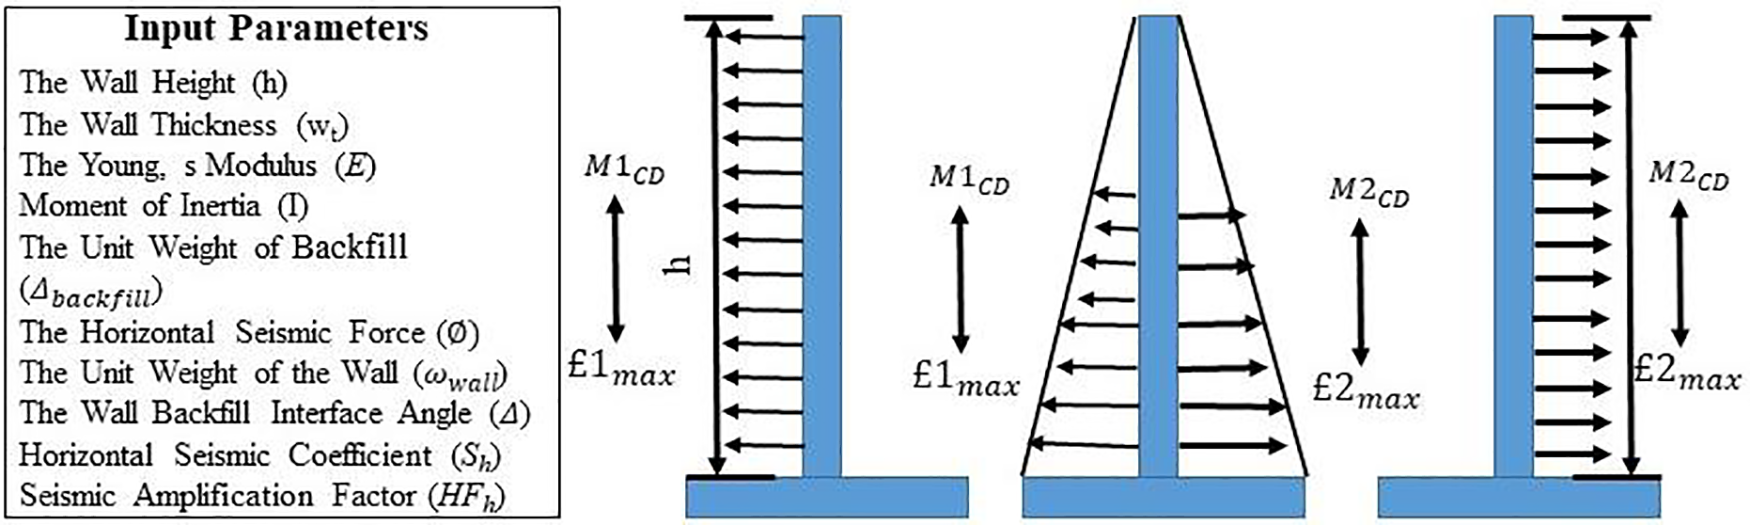
Figure 6: Input estimating ER wall maximum elastic seismic displacement
Fig. 6 depicts the seismic body force (M1CD) and dynamic soil force per unit width of the ER (M2CD) along the wall height (assuming a triangular distribution) for the ER wall stem. Behind the ER wall is a homogenous, horizontal, granular backfill, which should be emphasized. The backfill contact angle (ø) have been considered as ø/2. Seismic pressure can be predicted by the MO equation [45] behind the stem of an ER wall. As the MO equation indicates, the pseudo-static pressure exerted on the ER wall stem increases continuously with wall depth. 100% Sh was determined to be the pseudo-static lateral pressure coefficient (SAE) value. Eq. (6) calculates the dynamic pressure seismic coefficient (KAE) along the ER wall.
Backfill horizontal acceleration amplification is denoted as HFA. The following formula was applied to calculate the maximal displacement caused by the inertia forces of the ER wall (
By employing a finite element analysis, this study investigates the seismic behavior of ER walls under earthquake conditions that are comparable to those utilized in the base movements analysis. Harmonic excitations of changing amplitudes but constant frequency were used as the basis for the model’s initial movements [32]. From low peak acceleration amplitudes for fleeting periods to high peak acceleration amplitudes for a specific time, the intensity of these stimulations was progressively increased [34,39]. The first earthquake occurred on September 24, 2019, at approximately 16:02 local time, with a focal depth of 10 and 34.8 kilometers. On the Richter scale, the magnitude of this earthquake was estimated to be 6–6.5, its maximal ground acceleration was approximately 4 m/sec2, and the major frequency components are up to 15 and 10 Hz, as shown in Table 6. The second earthquake, Taft wave, simulates the ER walls model to understand the seismic response better. The acceleration time series utilized in the FE model for seismic evaluation is illustrated in Fig. 7. Additionally, the frequency components of the time series are presented [GSP, PEER (6, 7)].

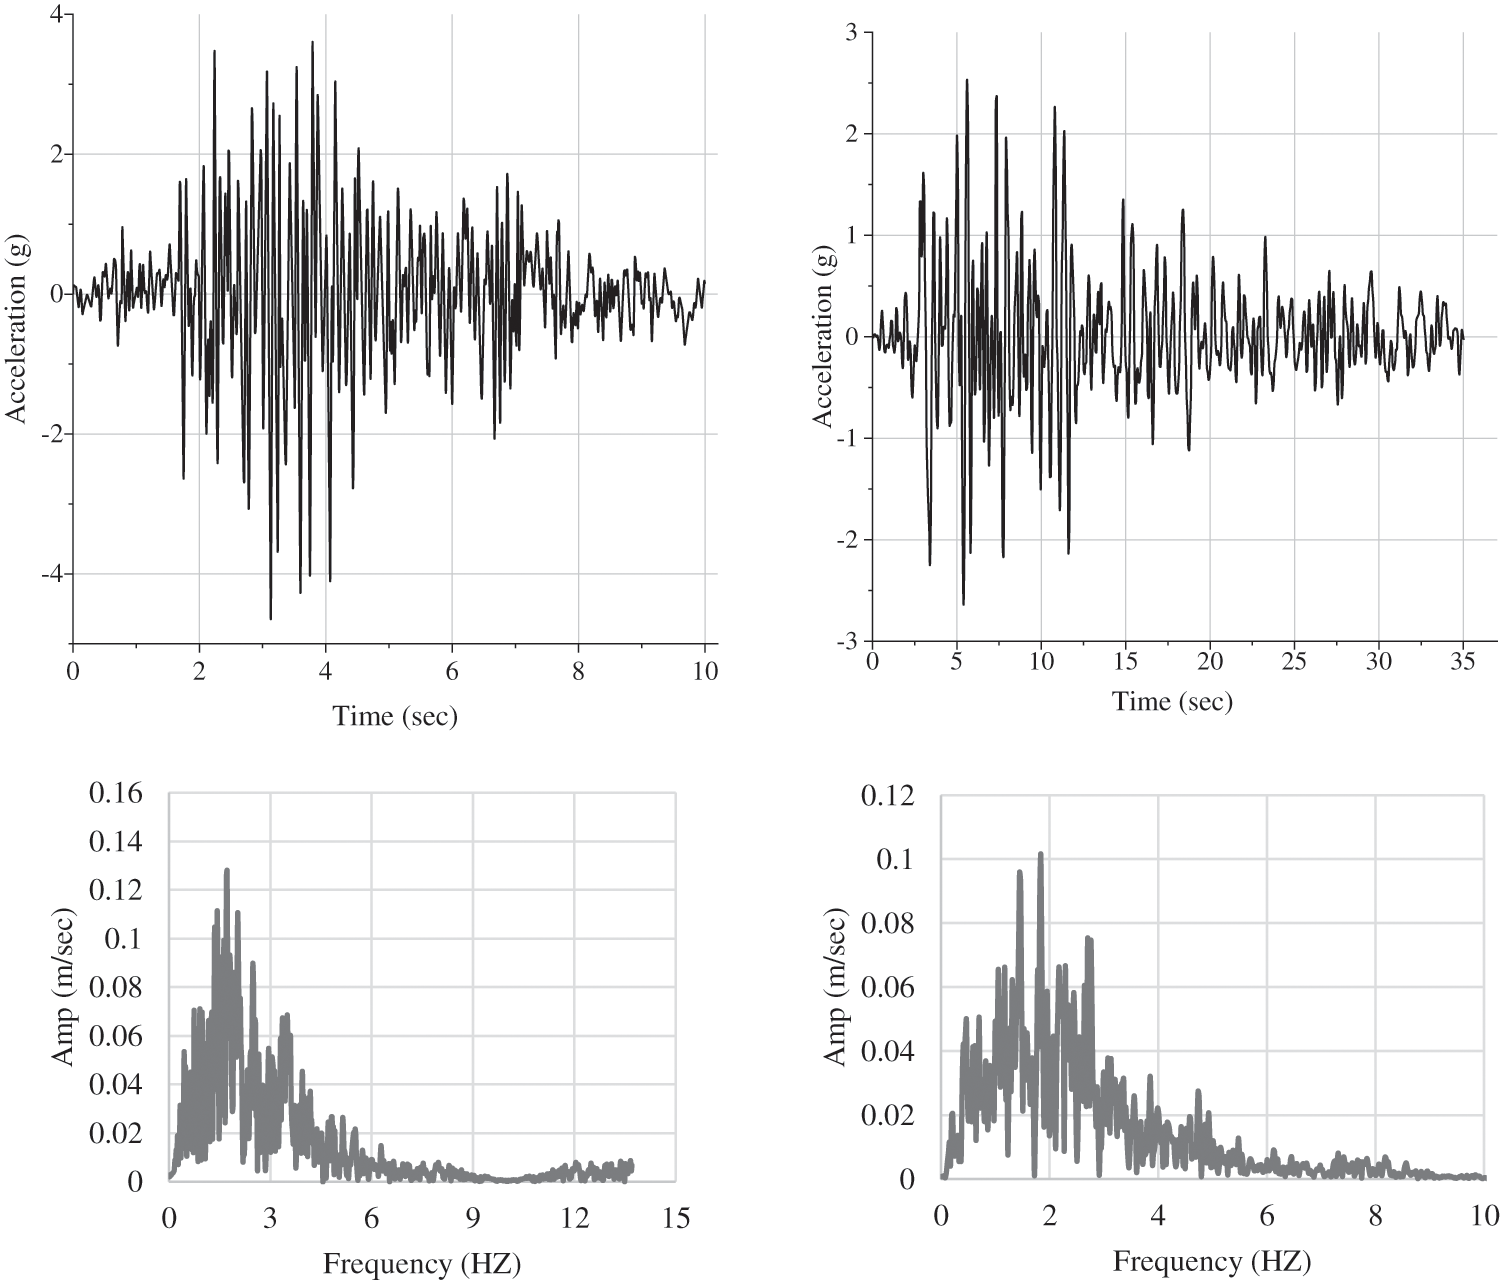
Figure 7: Seismic input motion [5,6]
3.2 Model Approach Applied to Case Study
The baseline model parameters were sourced from the study conducted by [5], which focused on modeling the instrumented reinforcement ER wall at the Public Works Department (PWD), as documented by [6]. To establish a higher confidence level in the 3D model created for this investigation, the authors and their colleagues reexamined the deflection and lateral pressure to load observed and numerically predicted in a previous study [47]. The above Tables 2 and 3 have determined the material characteristics used for the numerical analysis of the ER wall. It is essential to acknowledge that the ER wall served as a prototype wall designed to maintain a rather slender embankment subjected to an angled surcharge. The wall was built using cruciform-shaped facing panels. Therefore, the overall configuration was more intricate than the three-dimensional wall segment, the primary subject of investigation in the present work.
The situation of conventional concrete and gravity-type stone masonry retaining walls after an earthquake is depicted in Figs. 8a, 8b. In light of the complexity of the physical system, the 3D numerical and measured outcomes are reasonably consistent. By increasing the structural elastic modulus beyond its initial value, the overall agreement between measured and predicted values was enhanced in this investigation utilizing the 3D FE model. Yu et al. [42] reported the 2D numerical model results using the program Fast Lagrangian Analysis of Continua (FLAC) 2D, and the current study’s authors performed the 3D modeling using the program ABAQUS. Because comparisons are only made between reinforcing stresses, the 3D model is similar to the 2D models. The problem with the two-dimensional method is that strengthening loads that do not follow a straight line must be seen as continuous parts along the strain plane (x). This makes it hard for ER walls with different amounts of horizontal space between the layers of reinforcement backfill, like the Minnow Creek wall in the US, which was studied by [55,56].

Figure 8: Case study of earth-retaining structures current situation (A) reinforcement concrete earth-retaining wall: (B) Gravity type earth-retaining wall
A thorough investigation of multiple factors was done to analyze and design the working of (PC-W, GM-W, and CR-W) exposed to ground excitation over time with ER walls; extensive research has been conducted on numerous parameters. The input ground excitation exhibits a peak ground acceleration (0.4-PGA) of rough acceleration (+3.60 to −3.80 m/sec2), and the duration is 35 and 10 s, as depicted in Fig. 8. The finite element analyses (FE) of the PC-W, GM-W, and CR-W, all of which stand at the height of 5 m, considered an extensive array of parameters, including wall lateral displacement, backfill plastic strain, wall lateral pressure, wall stress distribution, wall deflection, and cost-benefit analysis. The subsequent segment delineates the findings.
4.1 Wall’s Lateral Displacement
A seismic input motion was applied to the ER wall to compare the lateral displacement of hollow precast concrete PC-W reinforcement concrete and gravity-type stone masonry GM-W and CR-W. As shown in Fig. 9, the lateral displacement of the ER walls increases as PGA rises. As the PGA increases, the lateral displacement of each case increases progressively from the bottom to the top, with the maximal displacement occurring at the top. Under seismic conditions, the upper portion of the lower-tiered wall experiences a greater displacement than the lower portion of the upper-tiered wall. The lateral displacement of each type of wall was measured and plotted against the wall’s height, as illustrated below. The curves represent the lateral displacement values for the same heights of ER walls PC-W, GM-W, and CR-W. After stimulation, the ER wall’s lateral displacement increased linearly with height. Notably, a 5 m tall gravity-type ER wall GM-W exhibited a more significant maximum lateral displacement than the PC-W and CR-W, which had a lower displacement value. Fig. 9 illustrates the relationship between displacement and wall height induced by dynamic forces acting on the ER wall. FE simulation results emphasize the significant influence of ground motion, particularly when considering the earth-retaining wall’s height Tiwari et al. [38].

Figure 9: Lateral displacement of the wall (A) shacking time 10-s (B) shacking time 35-s
Based on the findings of the conducted FE investigations, which focused on analyzing the impact of lateral displacement on reinforced ER walls under seismic loading conditions, it was determined that PC-W exhibits superior performance compared to reinforcement rigid concrete and gravity-type earth-retaining walls such as CR-W and GM-W. This is attributed to the fact that PC-W displays lower levels of lateral displacement, as illustrated below. The lateral displacement of the hollow precast concrete wall PC-W was observed to be approximately 30% lower than that of the reinforcement rigid concrete and stone masonry ER walls CR-W and GM-W. The results of this research are corroborated by studies that have observed a decrease in incremental active lateral displacement to values corresponding to seismic loads, as illustrated in numerical simulations and experimental trials [5,8]. At the same location, the reduced lateral displacement illustrated in Figs. 9A and 9B corresponds to the behavior of PC-W. In contrast, the lateral displacement compression of CR-W and GM-W was greater, consistent with the results reported by Ling et al. [21]. The post-earthquake damage assessment of the two ER walls is illustrated in Fig. 8. This finding is consistent with the results of post-earthquake investigations [6,7]. The primary cause is the substantial lateral displacement of the upper portion of the ER wall, which results in backfill material infiltration and localized upper wall settlement. In practical engineering applications, enhancing the joint strength between the reinforcement and the ER wall is imperative to prevent the detrimental effects of excessive local deformation.
4.2 Acceleration Factor of Wall
Fig. 10 illustrates the acceleration profiles of hollow precast reinforced earth-retaining walls and conventional concrete and gravity-type stone masonry ER walls as a function of wall height. The study considered ER walls with heights of 5 m, respectively. During the initial stage of excitation, a notable reduction in ground acceleration was observed for all the ER walls to keep the soil in place. Specifically, these walls with a height of 5 m exhibited higher initial and final ground acceleration, whereas the 5 m precast reinforced ER wall displayed lower values. Therefore, the height of the precast reinforced earth-retaining wall influences the required level of ground acceleration.

Figure 10: Acceleration of wall-facing (A) shacking time 10-s (B) shacking time 35-s
It is widely accepted that block sliding occurs when the seismic acceleration, serving as the main driving force, equals or exceeds the resisting force, represented by the yielding acceleration. This relationship establishes a direct correlation between the safety factor and the inclination angle, as supported by previous research [8]. The behavior of changing acceleration is directed by different factors, including the height of the soil and the structure’s capacity. The structural response of soil is known to be altered during earthquakes, and the width between the footing and the epicenter also performs a significant role, as discussed by [44,46]. The height and mass of the structure are directly associated with inertial forces during seismic events. Higher and more massive systems experience greater inertial forces, which can impact the intensity of the earthquake’s effect [27]. The mass and height of the structure play a role since both factors involve inertial forces during earthquake scenarios. It is assumed that in taller and heavier structures, soil-structure interaction weakens, compromising the overall reliability and integrity of the systems.
The stress distributions along the height of different types of ER walls were examined with CR-W, GM-W, and PC-W earth-retaining walls. The stress distribution for the ER wall is shown in Fig. 11, where the top was recorded with the lowest stress and the bottom with the largest stress. The highest stress distribution was observed at the bottom, whereas the lowest stress occurs at the top of the wall, as shown in Fig. 11. For CR-W and GM-W earth-retaining walls, the maximum stress distribution was observed at the bottom arm along the wall’s height, with a gradual increase in stress along the bottom arm of the wall. With respect to PC-W, a progressive rise in strain against the wall’s arm was observed, with the upper arm flexing the most. The results indicate that the stress decreased with increasing wall height, with the maximum stress observed at the lowermost section. The height of the wall is proportional to the stress distributions in ER walls [28,37]. This indicates that the greatest stress-induced damage occurs in the lower portion of the walls. In contrast, the behavior of stress distribution in PC-W was distinct from that of GM-W and CR-W walls. Along the wall height, there is a discernible rising trend in the dynamic stress distribution from low to high. The friction coefficient of the reinforced soil interface has the greatest impact on the stress-distribution properties of the reinforced earth wall ER, followed by the length of the reinforcement material and the change in the modulus of the reinforcement material. It is important to choose the parameters of the reinforcement material carefully when building the ER wall. Along the wall height, there is a discernible rising trend in the dynamic stress distribution from low to high.
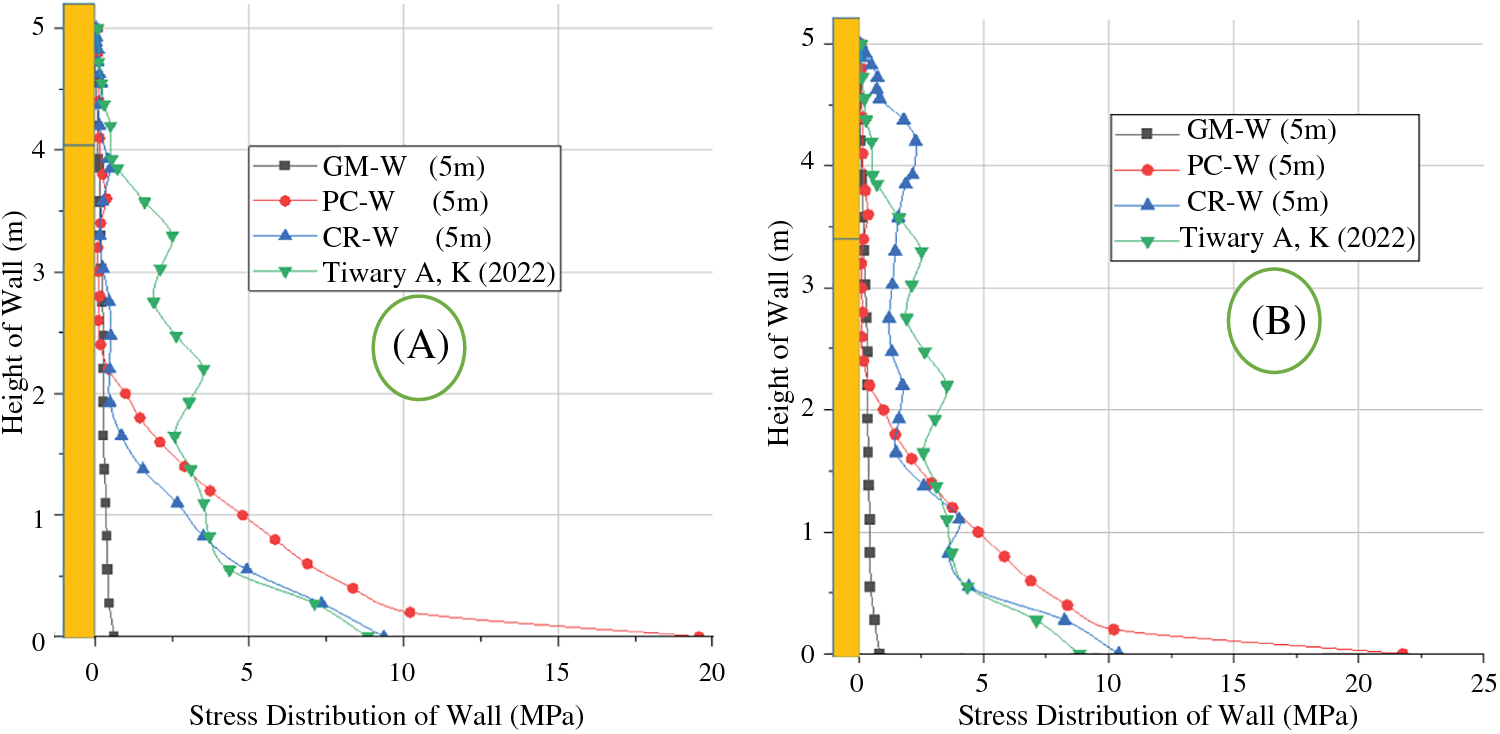
Figure 11: Stress distribution of wall (A) shacking time 10-s (B) shacking time 35-s
The seismic responses of the backfill strain during the two ground motions, which occurred in the reinforced zone from the bottom to top layers, are illustrated in Fig. 12. The distribution characteristics of the strain amplitudes of the backfill along the wall height, along with the impacts of (A) various seismic intensities and (B) distinct seismic waves, are illustrated in Fig. 12. The backfill strain increased with increasing earthquake intensities. It shows that the length of time that the high acceleration values of seismic waves appeared had an impact on the backfill’s strain as well. The highest strain was about 0.4%, which was less than the 0.25% strain. The backfill layers at the bottom had the smallest strains, and the layers at the top had the largest strains. This showed that the geogrid mesh in the middle layers was important in keeping the earth-retaining wall stable during earthquakes. The backfill strain distributions PC-W, GR-W, and CR-W along the wall height ratio for the geogrid backfill of each model under various seismic conditions are depicted in Fig. 12. The backfill strains of the PC-W were found to be comparatively lower than those of the GR-W and CR-W. Notably, the backfill strains were lowest at the tails, suggesting that the geogrid internal force was greatest at the connection position with the wall. As a result, the position of the connection was a critical component of the earth-retaining wall’s seismic design.

Figure 12: Backfill plastic strain (A) shacking time 10-s (B) shacking time 35-s
Fig. 13 presents the deflection on a vertical line along the earth-retaining wall’s height. The findings indicate that the wall’s height increased, deflection increased, and it became highest at the top of the ER wall. The amount of deflection in the hollow precast concrete ER wall PC-W grew from lowest to highest as the wall rose in height. It indicates that the upper area of the wall experiences the highest deflection. Similar deflection behavior in conventional retaining walls is depicted in Fig. 13. However, the deflection distribution behavior in the precast retaining wall differed from that of the CR-W and GR-W. The findings display the continuous deflection in the earth-retaining walls after 1.5 m of wall height, whereas they display the progressive rise in deflection with the wall’s height.

Figure 13: Deflection of wall (A) shacking time 10-s (B) shacking time 35-s
In order to establish the validity of our results and make a scholarly contribution, we conducted a comparative analysis of our findings with those of prior researchers who have examined the deflection behavior of retaining walls subjected to seismic loading. An investigation was carried out by Tiwary et al. [28] concerning the dynamic behavior of retaining walls, which encompassed an analysis of deflection. Their study emphasized the importance of accurately predicting and controlling displacement in order to keep ER walls stable and working well during earthquakes. Similarly, Vlcek [37] investigated the behavior of different types of ER walls under seismic loading, focusing on evaluating deflection behavior characteristics. Their study provided valuable information on the factors that influence the response to deflection and offered design recommendations to improve the performance of the ER walls.
Nevertheless, there were notable differences in the deflection distribution patterns between PC-W walls and GM-W and CR-W walls. The distributions of wall deflection, namely PC-W, GM-W, and CR-W, are measured to be around 50 to 62 mm, 215 to 244 mm, and 103 to 115 mm, respectively. Figs. 14A and 14B provide a comparison of stress distribution and deflection deviations among different types of ER walls PC-W, GM-W, and CR-W. The stress distribution and deflection deviations in GM-W and CR-W walls were significant, requiring substantial resources and making them uneconomical. The GM-W wall exhibited more considerable deflections and minimized stress values. On the other hand, the PC-W ER wall showed more minor deviations and had lower deflection compared to GM-W and CR-W ER walls.

Figure 14: Height along earth-retaining wall behavior. (A) Stress distribution (B) Deformation of wall
4.6 Lateral Pressure of the Wall
The precast reinforced PC-W was bound to earthquake load. After that, lateral pressure was evaluated to compare the lateral pressure exerted by the precast reinforced and that exerted by conventional concrete and stone masonry retaining walls. Fig. 15 illustrates the variations in lateral pressure exerted by the earth-retaining wall over time. The comparison includes hollow precast earth-retaining walls measuring 5 and 5 m of conventional concrete and gravity-type stone masonry earth-retaining walls. Generally, wall structures consider both horizontal and vertical vibrations during construction. At various peak bases, acceleration amplitudes display incremental lateral wall pressure distributions across wall height.
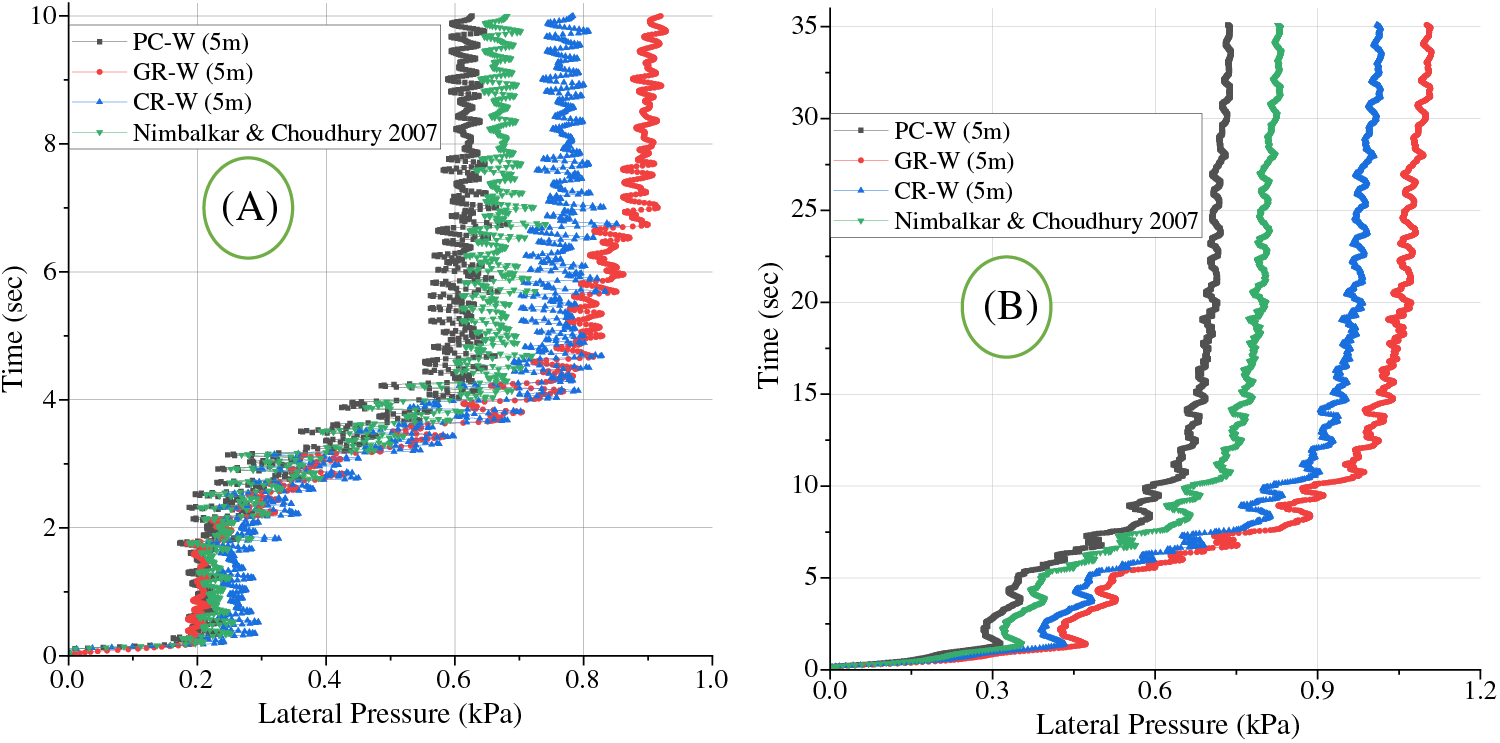
Figure 15: Lateral pressure of the wall (A) shacking time 10-s (B) shacking time 35-s
The results show that the total active lateral wall forces changed from positive to negative up to the middle of the wall and slowly went down to zero as they increased. Precast-reinforced ER walls outperform traditional retaining walls in dynamic stress studies. Reinforced ER walls work better because they apply less lateral pressure. Up to around 35 and 10 s into the seismic event, there are notable variations in the lateral pressure throughout the early phases. After this, however, the lateral pressure on the five-meter-tall precast ER walls grows gradually and with little change in magnitude. The 5 m precast reinforced ER wall’s lateral pressure stabilizes almost fully after 0.4 s of excitation. Notably, in the investigation conducted by [27], it was found that precast reinforced ER walls outperform conventional retaining walls under dynamic loading conditions. This is because precast reinforced soil retaining walls exert less lateral pressure than traditional ER walls, contributing to superior performance. Both horizontal and vertical vibrations are considered while designing the ER wall.
4.7 Cost Benefit Analysis Comparison
Prefabricated structures have emerged as the predominant advancement trajectory within the global construction industry. By incorporating overlapping walls, the hollow prefabricated ER wall structure system, a novel prefabricated structure system, possesses the same benefits as the conventional ER wall structure system. Presently, the construction industry’s approach to developing prefabricated structures is predominantly top-down, primarily due to the marginally lower cost of prefabricated structures compared to conventional structural construction. This cost differential somewhat impedes the market promotion of prefabricated buildings. The majority of construction units’ comprehension of engineering costs is preoccupied with the preponderant cost of the engineering entity, which isolates the project’s organismic integrity [57]. To optimize the overall benefit of the endeavor, it is necessary to broaden the scope of costs further. In addition to the explicit costs of the endeavor, the scope of costs also encompasses environmental costs, concealed benefits, and hidden construction costs, as shown in Table 7. Consequently, in addition to the engineering cost of the project, we disclose the cost difference between the traditional ER wall structure system and the hollow prefabricated ER wall structure, which represents the project’s concealed cost or benefit. The distribution type of the prefabricated structures and material cost comparison of prefabricated structures and conventional structural systems are shown in Fig. 16.


Figure 16: (A) Distribution type of the prefabricated structures (B) Material cost comparison of prefabricated structures and conventional structural system
4.8 Economic Benefits of the Construction Period
Designed the structural components in the factory, manually transferred the wet operation from the site to the factory, and improved work efficiency through intelligent manufacturing. The needed parts are finished early, according to the building plan, which cuts down on the time needed for construction. The prefabricated buildings can cut the time to build by about 30% compared to standard cast-in-place building projects of the same size and the prefabricated concrete housing projects with a prefabricated rate of about 50% [58].
In contrast to the conventional cast-in-place method, prefabricated structures operate under a factory production mode, which enhances control over the manufacturing process, minimizes refuse generation, and prevents the wastage of energy and materials [59]. In addition to conserving energy and resources, the prefabricated structure reduces environmental contamination caused by construction debris, pollen, and commotion. Particular information is detailed in the Table 8 that follows.

Consistent with the national sustainable development strategy, the advantages of prefabricated buildings in energy conservation and environmental protection are evident in the table above; however, the precise magnitude of these benefits is beyond quantification. Temporarily, the environmental benefits of prefabricated buildings compared to cast-in-place structures are not considered. The environmental benefit comparison of prefabricated structures and conventional structural systems is shown in Fig. 17.

Figure 17: Environmental benefit comparison of prefabricated structures and conventional structural system
5 Conclusion, Policy Recommendations and Future Research Direction
A detailed seismic response analysis of an earth-retaining wall with various facing-panel constraints and granular backfill was executed. The examination focused on the seismic performance of three models with different walls, reinforcement concrete, gravity type, and hollow precast earth-retaining walls using full-scale finite element analysis. This research compared the worldwide performance of conventional and hollow prefabricated ER walls under identical environmental and seismic load conditions. The highlighted findings of the study are given below:
• The research findings demonstrate a significant reduction of around 21% in the lateral pressure applied to the valve stem using the porous prefabricated ER wall. A notable decrease in wall displacement, with values ranging from 25% to 20%, has also been detected. In terms of seismic response, it is concluded that prefabricated ER walls are considerably more stable than reinforced concrete and gravity-type ER walls. With increasing wall height, the lateral displacement of earth-retaining walls exhibited an upward trend. On the contrary, the wall’s lateral displacement positively correlated with its height, peaking at the uppermost segment.
• The walls experienced increased acceleration due to the extended periods of high acceleration values observed in the entire time histories of the ground motions induced by seismic waves. PC-W’s acceleration and seismic responses were comparatively lesser than those of CR-W and GM-W in the face of all ground motions.
• The vertical dimension of the backfill influenced the plastic strain experienced by its surface. Effectively reducing the seismic plastic strain of the backfill surfaces was the capability of the geogrid. The backfill surface plastic strain was significantly less in the PC-W reinforced zone than in the GR-W and CR-W zones. Using the geogrid, the reinforced ER walls were equipped with seismic settlement resistance capability. The research above findings may serve as benchmarks for the seismic design and implementation of ER walls incorporating geogrid backfill.
• The stress level in the bottom valve stem of the prefabricated retaining wall has lowered by approximately 25%, and the deflection has decreased by 15%–20%. Prefabricated retaining walls are more stable than conventional ER walls in seismic performance due to better results in stress and deflection levels. While the stress distribution decreases with increasing wall height, deflection increases, and the high deflection is seen at the top of cantilever-type and gravity-type retaining ER walls.
• Upon conducting an extensive analysis encompassing construction cost, construction period, environment, and other pertinent factors, it is possible to deduce that the overall economic benefits of the hollow prefabricated ER wall structure system surpass those of the conventional ER walls system. Furthermore, the comprehensive advantages of the prefabricated structure system are essentially better than those of the conventional structure system.
5.2 Policy Recommendations and Future Research Direction
By decreasing the thickness of the bottom bar by 15% and the volume of the precast wall by 20%, the new design achieves enhanced environmental friendliness and cost-effectiveness. Assembling the wall system is a rapid process that requires minimal physical exertion. The hollow precast concrete ER wall exhibited superior environmental efficiency to the reinforcement concrete ER wall. In regions with high seismic activity, prefabricated concrete ER walls outperformed reinforcement rigid concrete and gravity-type ER walls. According to a comparative study, policymakers and researchers should be able to comprehend the earthquake-related development impacts in multiple countries by employing various wall models.
To illustrate the correlation between the earth-retaining wall’s movement and seismic input pressure, distinctive design schematics were devised, considering the effects of the various ER walls and the acceleration level of the seismic input motion. Therefore, it is capable of withstanding the development of seismic passive earth pressure forces as it approaches the backfill soil. Nonetheless, this condition is critical for the structural design of ER wall varieties and the stability of embedded ER walls. Additional research is required to comprehend these critical geotechnical structures’ seismic resilience fully.
Acknowledgement: The authors would like to acknowledge this work to the Institute of Mountain Hazards Environment, Chinese Academy of Sciences, Chengdu, China, for providing us with the platform to conduct this valuable research.
Funding Statement: This work was supported by Supported by the Science and Technology Research Program of the Institute of Mountain Hazards and Environment, CAS (IMHE-ZDRW-01), and the National Natural Science Foundation of China, China (Grant Numbers: 42077275 & 42271086), and the Special Project of Basic Research-Key Project, Yunnan (Grant Number: 202301AS070039).
Author Contributions: The authors confirm their contribution to the paper as follows: study conception and design; Muhammad Akbar; data collection: Muhammad Akbar, Huali Pan; draft manuscript preparation: Muhammad Akbar, Huali Pan, Guoqiang Ou; revision of the manuscript: Jiangcheng Huang, Bilal Ahmed; funding; Huali Pan; supervision: Guoqiang Ou. All authors reviewed the results and approved the final version of the manuscript.
Availability of Data and Materials: All data and models are available as per request to the corresponding author.
Conflicts of Interest: The authors declare that they have no conflicts of interest to report regarding the present study.
References
1. Abdelouhab, A., Dias, D., Freitag, N. (2011). Numerical analysis of the behavior of mechanically stabilized earth walls reinforced with different types of strips. Geotextiles and Geomembranes, 29(2), 116–129. [Google Scholar]
2. Allen, T. M., Bathurst, R. J. (2019). Geosynthetic reinforcement stiffness characterization for MSE wall design. Geosynthetics International, 26(6), 592–610. [Google Scholar]
3. AASHTO (2020). AASHTO LRFD bridge design specifications, 9th edition. Washington DC, USA: American Association of State Highway and Transportation Officials. [Google Scholar]
4. AFNOR (Association Franc ̧aise de Normalisation) (2009). Geotechnical design Retaining Structures Reinforced and soil nailing structures. NFP 94-270. Paris: AFNOR. [Google Scholar]
5. Damians, I. P., Bathurst, R. J., Olivella, S., Lloret, A., Josa, A. (2020). 3D modelling of strip reinforced MSE walls. Acta Geotechnica, 16, 711–730. https://doi.org/10.1007/s11440-020-01057-w [Google Scholar] [CrossRef]
6. Geological Survey of Pakistan (2022). GSP. https://gsp.gov.pk/ (accessed on 15/11/2022). [Google Scholar]
7. Earthquake Reconstruction & Rehabilitation Authority (2022). ERRA. http://www.erra.gov.pk/ (accessed on 21/11/2022). [Google Scholar]
8. Bathurst, R. J., Miyata, Y., Allen, T. M. (2020). Deterministic and probabilistic assessment of margins of safety for internal stability of as-built PET strap reinforced soil walls. Geotextiles and Geomembranes, 48(6), 780–792. https://doi.org/10.1016/j.geotexmem.2020.06.001 [Google Scholar] [CrossRef]
9. Bakr, J., Ahmad, S. M. (2018). A finite element performance-based approach to correlate movement of a rigid retaining wall with seismic earth pressure. Soil Dynamics and Earthquake Engineering, 114, 460–464. [Google Scholar]
10. Bourgeois, E., Soyez, L., Le Kouby, A. (2011). Experimental and numerical study of the behavior of a reinforced-earth wall subjected to a local load. Computers and Geotechnics, 38, 515–525. [Google Scholar]
11. Cai, Z., Bathurst, R. J. (1995). Seismic response analysis of geosynthetic reinforced soil segmental retaining walls by finite element method. Computers and Geotechnics, 17(4), 523–546. [Google Scholar]
12. Capilleri, P. P., Ferraiolo, F., Motta, E., Scotto, M., Todaro, M. (2019). Static and dynamic analysis of two mechanically stabilized earth walls. Geosynthetics International, 26(1), 26–41. [Google Scholar]
13. Cristelo, N., Fe’lix, C., Lopes, M. L., Dias, M. (2016). Monitoring and numerical modelling of an instrumented mechanically stabilized earth wall. Geosynthetics International, 23(1), 48–61. [Google Scholar]
14. Damians, I. P., Bathurst, R. J., Josa, A., Lloret, A. (2015). Numerical analysis of an instrumented steel reinforced soil wall. International Journal of Geomechanics, 15(1), 04014037. [Google Scholar]
15. Gu, M., Collin, J. G., Han, J., Zhang, Z., Tanyu, B. F. et al. (2017). Numerical analysis of instrumented mechanically stabilized gabion walls with large vertical reinforcement spacing. Geotextiles and Geomembranes. https://doi.org/10.1016/j.geotexmem.2017.04.002 [Google Scholar] [CrossRef]
16. Cakir, T. (2013). Evaluation of the effect of earthquake frequency content on seismic behavior of cantilever retaining wall including soil-structure interaction. Soil Dynamics and Earthquake Engineering, 45, 96–111. [Google Scholar]
17. Daheur, E. G., Goual, I., Taibi, S., Mitiche-Kettab, R. (2019). Effect of dune sand incorporation on the physical and mechanical behaviour of tuff: (Experimental investigation). Geotechnical and Geological Engineering, 37, 1687–1701. https://doi.org/10.1007/s10706-018-0715-4 [Google Scholar] [CrossRef]
18. Ertugrul, O. L., Trandafir, A. C. (2014). Seismic earth pressures on flexible cantilever retaining walls with deformable inclusions. Journal of Rock Mechanics and Geotechnical Engineering, 6(5), 417–427. [Google Scholar]
19. Keykhosropour, L., Lemnitzer, A. (2019). Experimental studies of seismic soil pressures on vertical flexible, underground structures and analytical comparisons. Soil Dynamics and Earthquake Engineering, 118, 166–178. [Google Scholar]
20. Kuhlemeyer, R. L., Lysmer, J. (1973). Finite element method accuracy for wave propagation problems. Journal of the Soil Mechanics and Foundations Division, 99(5). https://doi.org/10.1061/JSFEAQ.0001885 [Google Scholar] [CrossRef]
21. Ling, H. I., Liu, H., Mohri, Y. (2005). Parametric studies on the behavior of reinforced soil retaining walls under earthquake loading. Journal of Engineering Mechanics, 131(10), 1056–1065. [Google Scholar]
22. Nimbalkar, S., Choudhury, D. (2007). Sliding stability and seismic design of retaining wall by pseudo-dynamic method for passive case. Soil Dynamics and Earthquake Engineering, 27(6), 497–505. https://doi.org/10.1016/j.soildyn.2006.11.006 [Google Scholar] [CrossRef]
23. Osouli, A., Zamiran, S. (2017). The effect of backfill cohesion on seismic response of cantilever retaining walls using fully dynamic analysis. Computers and Geotechnics, 89, 143–152. [Google Scholar]
24. Yazdandoust, M. (2017). Investigation on the seismic performance of steel-strip reinforced-soil retaining walls using shaking table test. Soil Dynamics and Earthquake Engineering, 97, 216–232. [Google Scholar]
25. Hokelekli, E., Yilmaz, B. N. (2019). Effect of cohesive contact of backfill with arch and spandrel walls of a historical masonry arch bridge on seismic response. Effect of Cohesive Contact of Backeriodica Polytechnica Civil Engineering, 63(3), 926–937. [Google Scholar]
26. Munoz, H., Kiyota, T. (2020). Deformation and localization behaviours of reinforced gravelly backfill using shaking table tests. Journal of Rock Mechanics and Geotechnical Engineering, 12(1), 102–111. [Google Scholar]
27. Nematollahi, B., Voo, Y. L., Sanjayan, J. (2016). Design and construction of a precast ultra-high performance concrete cantilever retaining wall. Proceedings of the First International Interactive Symposium on UHPC, Des Moines, Iowa. [Google Scholar]
28. Tiwary, A. K., Bhatia, S., Singh, S., Chohan, S., Kumar, R. et al. (2022). Performance comparison and critical finite element based experimental analysis of various forms of reinforcement retaining structural system. Mathematical Problems in Engineering, 2022, 4434679. https://doi.org/10.1155/2022/4434679 [Google Scholar] [CrossRef]
29. Fathipour, H., Siahmazgi, A. S., Payan, M., Chenari, R. J. (2020). Evaluation of the lateral earth pressure in unsaturated soils with finite element limit analysis using second-order cone programming. Computers and Geotechnics, 125, 103587. [Google Scholar]
30. Fathipour, H., Payan, M., Chenari, R. J. (2021). Limit analysis of lateral earth pressure on geosynthetic-reinforced retaining structures using finite element and second-order cone programming. Computers and Geotechnics, 134, 104119. [Google Scholar]
31. Fathipour, H., Payan, M., Jamshidi Chenari, R., Senetakis, K. (2021). Lower bound analysis of modified pseudo-dynamic lateral earth pressures for retaining wall-backfill system with depth-varying damping using FEM-Second order cone programming. International Journal for Numerical and Analytical Methods in Geomechanics, 45(16), 2371–2387. [Google Scholar]
32. Fathipour, H., Siahmazgi, A. S., Payan, M., Veiskarami, M., Jamshidi Chenari, R. (2021). Limit analysis of modified pseudodynamic lateral earth pressure in anisotropic frictional medium using finite-element and second-order cone programming. International Journal of Geomechanics, 21(2), 04020258. [Google Scholar]
33. Fathipour, H., Safardoost Siahmazgi, A., Payan, M., Jamshidi Chenari, R., Veiskarami, M. (2023). Evaluation of the active and passive pseudo-dynamic earth pressures using finite element limit analysis and second-order cone programming. Geotechnical and Geological Engineering, 41(2), 1–16. [Google Scholar]
34. Aroni Hesari, S., Javankhoshdel, S., Payan, M., Jamshidi Chenari, R. (2022). Pseudo-static internal stability analysis of geosynthetic-reinforced earth slopes using horizontal slices method. Geomechanics and Geoengineering, 17(5), 1417–1442. [Google Scholar]
35. Bahmani Tajani, S., Fathipour, H., Payan, M., Jamshidi Chenari, R., Senetakis, K. (2023). Temperature-dependent lateral earth pressures in partially saturated backfills. European Journal of Environmental and Civil Engineering, 27(10), 3064–3090. [Google Scholar]
36. Fathipour, H., Tajani, S. B., Payan, M., Chenari, R. J., Senetakis, K. (2022). Influence of transient flow during infiltration and isotropic/anisotropic matric suction on the passive/active lateral earth pressures of partially saturated soils. Engineering Geology, 310, 106883. [Google Scholar]
37. Vlcek, J. (2014). Internal stability analyses of geosynthetic reinforced retaining walls. Procedia Engineering, 91, 346–351. [Google Scholar]
38. Tiwari, R., Lam, N. (2021). Modelling of seismic actions in earth retaining walls and comparison with shaker table experiment. Soil Dynamics and Earthquake Engineering, 150, 106939. [Google Scholar]
39. Tiwari, R., Lam, N. (2022). Displacement based seismic assessment of base restrained retaining walls. Acta Geotechnica, 17, 3675–3694. [Google Scholar]
40. Wang, L., Chen, G., Chen, S. (2015). Experimental study on seismic response of geogrid reinforced rigid retaining walls with saturated backfill sand. Geotextiles and Geomembranes, 43(1), 35–45. [Google Scholar]
41. Yu, Y., Bathurst, R. J., Miyata, Y. (2015). Numerical analysis of a mechanically stabilized earth wall reinforced with steel strips. Soils and Foundation, 55(3), 536–547. [Google Scholar]
42. Yu, Y., Bathurst, R. J., Allen, T. M., Nelson, R. (2016). Physical and numerical modelling of a geogrid reinforced incremental concrete panel retaining wall. Canadian Geotechnical Journal, 53(12), 1883–1901. [Google Scholar]
43. Abaqus/Explicit user’s manual, version 6.13 (2013). Rhode Island, USA: Dassault Syste’mes Simulia Corporation, Providence. [Google Scholar]
44. Dano, C., Hicher, P. Y., Tailliez, S. (2004). Engineering properties of grouted sands. Journal of Geotechnical and Geoenvironmental Engineering, 130(3), 328–338. [Google Scholar]
45. Aghamolaei, M., Azizkandi, A. S., Baziar, M. H., Ghavami, S. (2021). Performance-based analysis of cantilever retaining walls subjected to near-fault ground shakings. Computers and Geotechnics, 130, 103924. [Google Scholar]
46. Potts, D. M., Zdravković, L. (1999). Finite element analysis in geotechnical engineering: Theory. London: Thomas Telford Publishing. [Google Scholar]
47. Song, A. (2012). Deformation analysis of sand specimens using 3D digital image correlation for the calibration of an elasto-plastic model (Dissertation). Texas A&M University, USA. [Google Scholar]
48. Lima, M. M., Doh, J. H., Hadi, M. N., Miller, D. (2016). The effects of CFRP orientation on the strengthening of reinforced concrete structures. The Structural Design of Tall and Special Buildings, 25(15), 759–784. [Google Scholar]
49. Akbar, M., Pan, H., Ou, G., Nikitas, G., Ahmad, B. (2023). Seismic response compression of various MSE walls based on 3D modeling. Buildings, 13(11), 2773. https://doi.org/10.3390/buildings13112773 [Google Scholar] [CrossRef]
50. Lubliner, J., Oliver, J., Oller, S., Oñate, E. (1989). A plastic-damage model for concrete. International Journal of Solids and Structures, 25(3), 299–326. [Google Scholar]
51. Lee, J., Fenves, G. L. (1998). Plastic-damage model for cyclic loading of concrete structures. Journal of Engineering Mechanics, 124(8), 892–900. [Google Scholar]
52. Carreira, D. J., Chu, K. H. (1985). Stress-strain relationship for plain concrete in compression. Journal Proceedings, 82(6), 797–804. [Google Scholar]
53. Xu, J. G., Cao, X. Y., Shi, J., Wang, Z. (2023). A comparative study of the novel externally-attached precast SRC braced-frames for seismic retrofitting under near-field spectrum-compatible non-stationary stochastic earthquake. Structures, 50, 200–214. https://doi.org/10.1016/j.istruc.2023.02.026 [Google Scholar] [CrossRef]
54. Nadeem, M., Akbar, M., Pan, H., Ou, G., Amin, A. (2021). Investigation of the settlement prediction in soft soil by Richards Model: Based on a linear least squares-iteration method. Archives of Civil Engineering, LXVII(2). https://doi.org/10.24425/ace.2021.137181 [Google Scholar] [CrossRef]
55. FHWA (2009). Design of mechanically stabilized earth walls and reinforced slopes. In: Berg, R. R., Christopher, B. R., Samtani, N. C. (Eds.Nos. FHWA-NHI-10-024 Vol I and NHI-10-025 Vol II. Washington DC, USA: Federal Highway Administration. [Google Scholar]
56. Yoo, C., Kim, S. B. (2008). Performance of a two-tier geosynthetic reinforced segmental retaining wall under a surcharge load: Fullscale load test and 3D finite element analysis. Geotextiles and Geomembranes, 26(6), 460–472. [Google Scholar]
57. Mengkai, L., Meng, L. (2023). Cost estimation model of prefabricated construction for general contractors based on system dynamics. Engineering, Construction, and Architectural Management. https://doi.org/10.1108/ECAM-03-2023-0304 [Google Scholar] [CrossRef]
58. Peng, J., Zhou, J., Meng, F., Yu, Y. (2021). Analysis on the hidden cost of prefabricated buildings based on FISM-BN. PLoS One, 16(6), e0252138. https://doi.org/10.1371/journal.pone.0252138 [Google Scholar] [PubMed] [CrossRef]
59. Liu, Y., Chen, R. (2022). Analysis of the economic benefits of prefabricated buildings. International Journal of Management and Education in Human Development, 2(1), 208–213. [Google Scholar]
Cite This Article
 Copyright © 2024 The Author(s). Published by Tech Science Press.
This work is licensed under a Creative Commons Attribution 4.0 International License , which permits unrestricted use, distribution, and reproduction in any medium, provided the original work is properly cited.
 Downloads
 Citation Tools