
 Submit a Paper
 Propose a Special lssue
 Open Access
ARTICLE

Modularized and Parametric Modeling Technology for Finite Element Simulations of Underground Engineering under Complicated Geological Conditions
1 State Key Laboratory of Hydraulics and Mountain River Engineering, College of Water Resource and Hydropower, Sichuan University, Chengdu, 610065, China
2 Research Institute of Testing and Inspection, Sinohydro Bureau 7 Co., Ltd., Chengdu, 610213, China
* Corresponding Author: Li Zhuo. Email:
(This article belongs to the Special Issue: Computer-Aided Uncertainty Modeling and Reliability Evaluation for Complex Engineering Structures)
Computer Modeling in Engineering & Sciences 2024, 140(1), 621-645. https://doi.org/10.32604/cmes.2024.046398
Received 29 September 2023; Accepted 22 January 2024; Issue published 16 April 2024
 View Full Text
 Download PDF
Abstract
The surrounding geological conditions and supporting structures of underground engineering are often updated during construction, and these updates require repeated numerical modeling. To improve the numerical modeling efficiency of underground engineering, a modularized and parametric modeling cloud server is developed by using Python codes. The basic framework of the cloud server is as follows: input the modeling parameters into the web platform, implement Rhino software and FLAC3D software to model and run simulations in the cloud server, and return the simulation results to the web platform. The modeling program can automatically generate instructions that can run the modeling process in Rhino based on the input modeling parameters. The main modules of the modeling program include modeling the 3D geological structures, the underground engineering structures, and the supporting structures as well as meshing the geometric models. In particular, various cross-sections of underground caverns are crafted as parametric modules in the modeling program. The modularized and parametric modeling program is used for a finite element simulation of the underground powerhouse of the Shuangjiangkou Hydropower Station. This complicated model is rapidly generated for the simulation, and the simulation results are reasonable. Thus, this modularized and parametric modeling program is applicable for three-dimensional finite element simulations and analyses.Keywords
Numerical simulations for underground engineering projects mainly include three steps: preprocessing, calculation and postprocessing. Numerical simulation software programs, such as FLAC3D, ANSYS and ABAQUS, provide these three functions. However, it is time-consuming to construct a complex underground engineering model using these commercial software programs. The modeling speed directly affects numerical simulation efficiency, especially for underground engineering simulations in which many repetitive structures, such as rock bolts and strata, need to be modeled. Moreover, when a model needs to be modified and adjusted, it often needs to be remodeled. The modeling time occupies most of the time in a whole numerical simulation process. Therefore, improving the efficiency of modeling under the premise of calculation accuracy is a crucial issue.
Three-dimensional underground engineering models in traditional FEM (Finite Element Method) analysis are usually classified into two categories. The first category is the finite element model, which can be directly used in simulation but cannot perfectly reflect the geological conditions during underground engineering. Cheng et al. [1] established a simple three-dimensional model of highway tunnels and analyzed the influence of boiling liquid expansion vapor explosions in tunnels. Hou et al. [2] established a three-dimensional model of a tunnel face and analyzed its stability under unsaturated and unsteady seepage conditions. Liu et al. [3] established a three-dimensional model of a newly built tunnel orthogonally passing under an existing tunnel and proposed a new calculation model of vertical deformation in multilayer strata. Meng et al. [4] established a three-dimensional foundation pit excavation model and studied the influence of existing tunnels. Wang et al. [5] established a three-dimensional model of a tunnel and analyzed the influence of blasting vibrations on adjacent tunnels. Zhao et al. [6] established a three-dimensional model and proposed an improved foundation beam model that could be used to evaluate the longitudinal response of circular tunnels in seismic areas. Liao et al. [7] established a three-dimensional model based on a thermal–hydraulic–mechanical (THM) coupled anisotropic damage model to explore the heat extraction process of hydraulic fracturing in hot dry rocks. Li et al. [8,9] proposed a 3D modeling method based on complex geological conditions such as geological structures.
The second category is the geometric model, which needs to be meshed and then used in simulations. In most numerical simulation software, the geometric model can be imported from third-party software with stronger modeling functions to improve the preprocessing efficiency of the numerical simulation. Xie et al. [10] developed a PM-CRF (parametric modeling-conditional random field) engine to automate the parametric geological modeling process using CRFs. Erharter et al. [11] used MOVE (a modeling software) and other modeling software to establish a real three-dimensional geological model of the Angath Tunnel in Austria. They proposed a storage strategy for the existing data in BIM (Finite Element Method) ground modeling. Pinheirop et al. [12] established a three-dimensional model of a hydraulic underground structure in Portugal using FLAC3D software and proposed a method for measuring the geological parameters of heterogeneous rock. Chen et al. [13] established a three-dimensional geological model of a gold mine and studied the influences of faults and in situ stress on a surface crown pillar. Vennes et al. [14] used Rhino and Kubrix to establish a three-dimensional model of Vale’s Copper Cliff Mine in Canada and studied some related problems of stress blasting. Li et al. [15] proposed an automatic and parametric modeling method based on a BIM-based framework and studied the stability of the Suki Kinari underground powerhouse caverns. Xin et al. [16] established a three-dimensional geometric model of a tunnel and studied the cooling effects of two ventilation arrangements. Li et al. [17] established a three-dimensional geometric model of a tunnel and investigated the cooling and dust suppression effects of an external spray system.
In engineering practice, the modeling process needs to be more efficient, so modeling software such as Rhino has gradually been widely used to construct complex geometric models. Rhino is a three-dimensional modeling software based on NURBS (Non-Uniform Rational B-Splines) modeling technology with strong compatibility and operability. It is widely used in architectural, industrial, animation, and other fields. All instructions in Rhino can be executed from a command, toolbar or menu. It can output geometric models and finite element meshes, which can be further obtained by its plug-in mesh tool called Griddle. Thus, a common method for the numerical modeling of underground engineering is to import a finite element model into simulation software such as FLAC3D, ANSYS and ABAQUS. Zhao et al. [18] established a three-dimensional geological model of salt caverns using the ‘Rhino + Griddle’ method and evaluated the long-term stability of the salt caverns. Tang et al. [19] established a three-dimensional model of the Pingdingshan Coal Mine by the ‘Rhino + Griddle’ method and studied the influence of drilling angle on roof pre-cracking. Yu et al. [20] established a three-dimensional geological model of shallow salt caverns by the ‘Rhino + Griddle’ method and analyzed the safe distance of two adjacent salt caverns. Mreyen et al. [21] used the ‘Rhino + Griddle’ method to establish a three-dimensional slope model of the Balta rock avalanche in the Romanian Carpathian Mountains and simulated the real process of slope failure under earthquakes. Zhao et al. [22] established a three-dimensional geological model of mining areas under complex geological conditions using the ‘Rhino + Griddle’ method and studied surface subsidence during groundwater fluctuation after mining. Song et al. [23] established a finite element model of the Hangzhou subway with Rhino, which verified the feasibility of the InSAR (Interferometric Synthetic Aperture Radar)-GPS (Global Positioning System)-GIS (Geographic Information System) method to monitor land subsidence.
The ‘Rhino + Griddle’ modeling method has become increasingly popular. It solves the finite element mesh problem of arbitrary geometry. However, it is time-consuming to construct a geometry model and finite element model for complicated underground engineering projects. Moreover, the design of underground structures and the geological conditions can be updated repeatedly, and these updates require repeated modeling work. Thus, this study proposes a modularized and parametric modeling technology for the finite element simulation of underground engineering to improve the modeling efficiency of the proposed technology significantly. Since all the modeling instructions in Rhino can be implemented by the Rhinoscriptsyntax script language, it provides an effective path for the secondary development of Rhino and the realization of parametric modeling, which has the advantages of flexibility, high efficiency, and repeatability. Therefore, in this study, the Python programming language is used for secondary development based on Rhino modeling software, and a modularized and parametric modeling program is designed for underground engineering.
2 Modularized and Parametric Modeling Programs for Underground Engineering
Based on the powerful modeling function of Rhino, a modularized and parametric modeling program for underground engineering is developed using the Python programming language. The program’s main module includes modeling 3D geological structures, underground engineering structures, supporting structures, and the meshing of geometric models. As shown in Fig. 1, the modeling program is developed as a cloud server, and its implementation process is divided into two parts: data input from a web platform and cloud execution of the modeling program. Users directly deal with the modeling control interface on the web platform, in which visualization functions have been developed to achieve interactive modeling, and all modeling instructions are automatically executed in the cloud server through a secondary developed program.
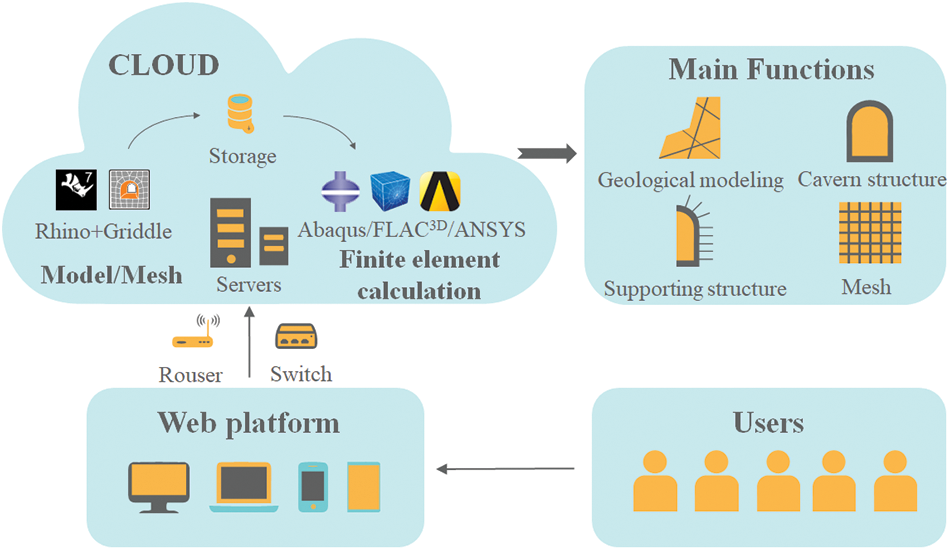
Figure 1: Cloud architecture of the modularized and parametric rapid modeling program
Fig. 2 shows the general process of the modularized and parametric rapid modeling cloud service. The cloud server can automatically generate the geometric model and mesh of the geological structure, engineering structure and supporting structure by inputting a series of parameters. It can also access computing software, such as FLAC3D, through built-in programs to conduct convenient calculations and analysis on the cloud service.
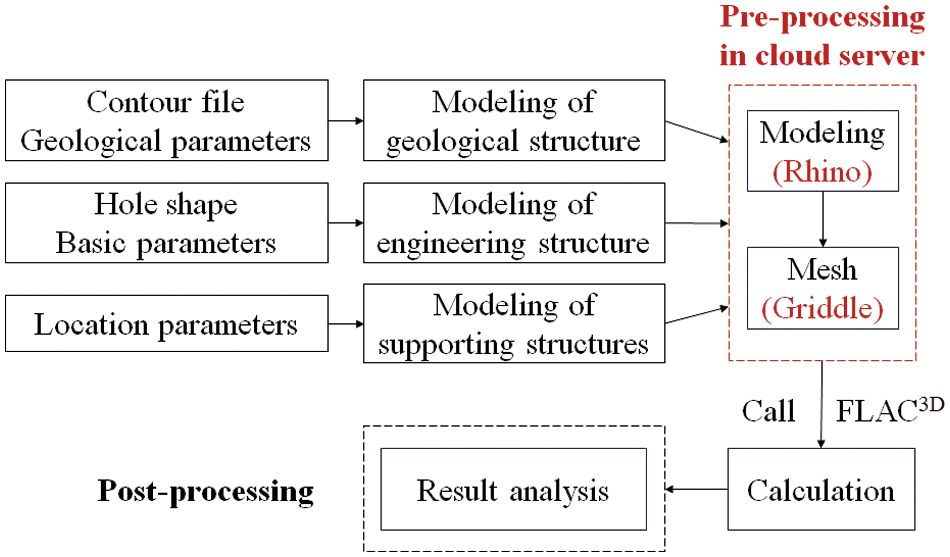
Figure 2: Flow chart of the cloud service
2.1 Modeling of Underground Geological Structure
Three-dimensional underground geological structures are irregular and complex and have always been difficult to numerically model. In the past, modeling methods were very limited, so excessive time would be needed to address the geological conditions when modeling underground engineering. Therefore, the modeling program is programmed to rapidly construct a three-dimensional geological model.
As shown in Fig. 3, the realization of 3D geological modeling can be summarized as follows: first, upload a data file of the geological surface and input some basic parameters, such as the positioning coordinates of a stratum, in the modeling control interface of the web platform; second, generate the modeling instructions according to the input data files and parameters; third, automatically access the modeling software in the cloud server to execute the modeling instructions to generate the model; and finally, automatically return the graphic file of the model to the web platform for preview. The modeling program can model two categories of geological surfaces, i.e., curved surfaces and planar structures. Three-dimensional terrain and stratum surfaces belong to the first category, and faults and structure planes belong to the second category.
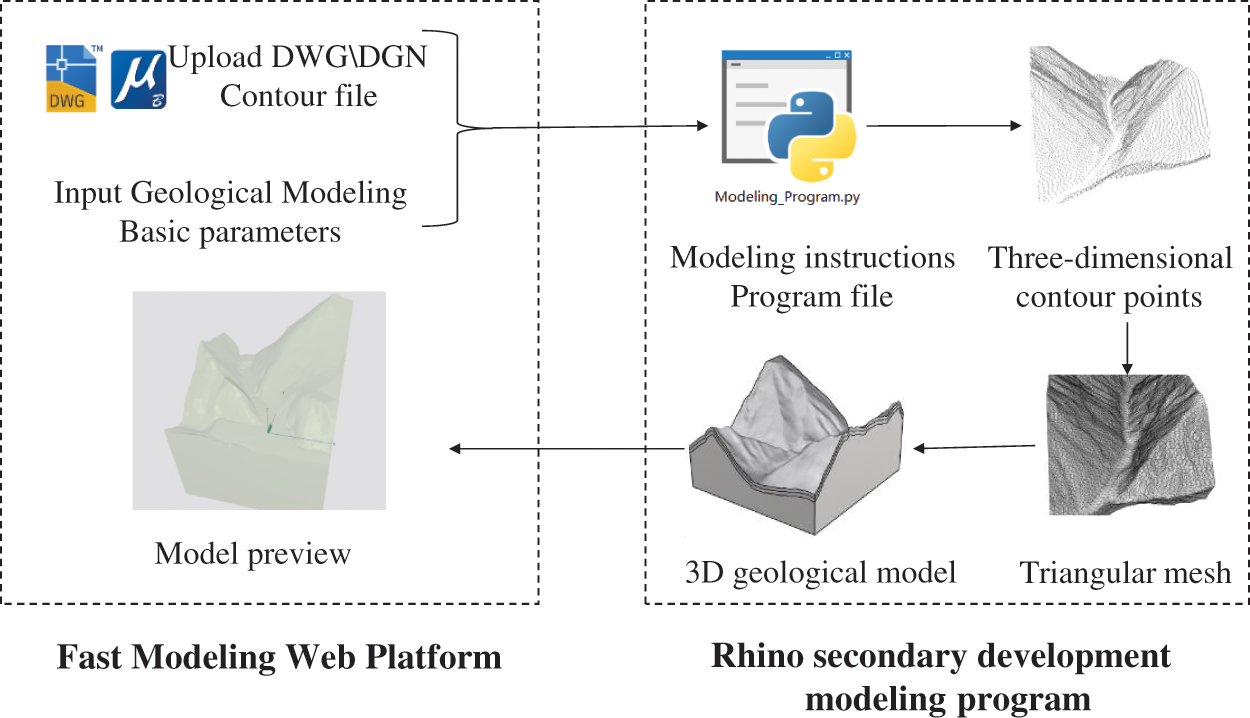
Figure 3: Flow chart of 3D geological modeling
When modeling a three-dimensional curved geological surface, it is necessary to upload its contour file in DWG or DGN format and input the range coordinates of modeling and some optional parameters, as shown in Fig. 4. The contours of the curved surface are transformed into a set of points, and these points are further used to generate a curved surface by implementing the NURBS algorithm in Rhino. The range coordinates are bottom elevation
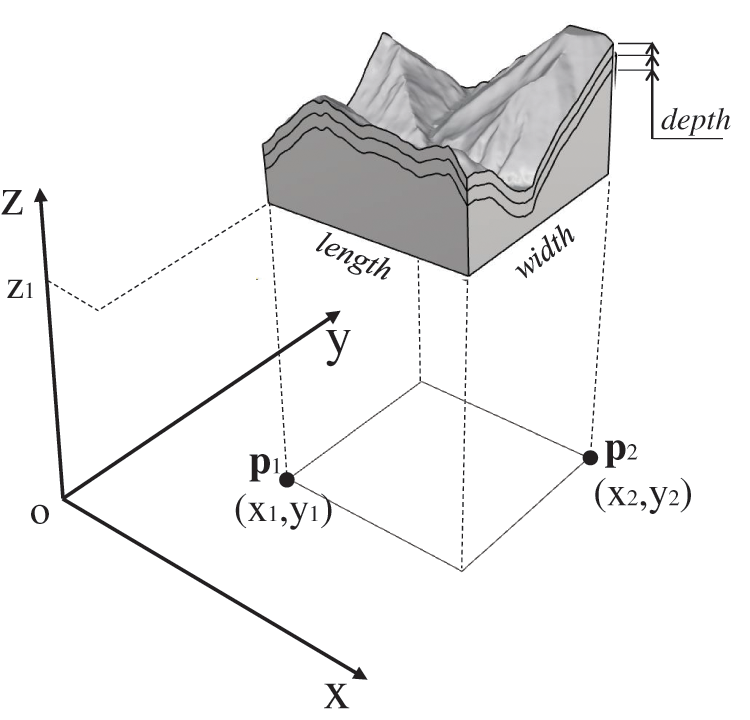
Figure 4: Required parameters to model a 3D curved geological surface
In addition, the modeling of geological structures, such as faults, is very common in underground engineering modeling. Usually, such structures are often simplified as planar structures because we can hardly identify their shape underground. To ensure the reliability of its calculation, the fault is modeled in a range that is more than twice the range of the underground cavern. Some necessary parameters should be input to model a planar geological structure. As shown in Fig. 5, a planar geological structure can be determined in three-dimensional space by inputting its center point
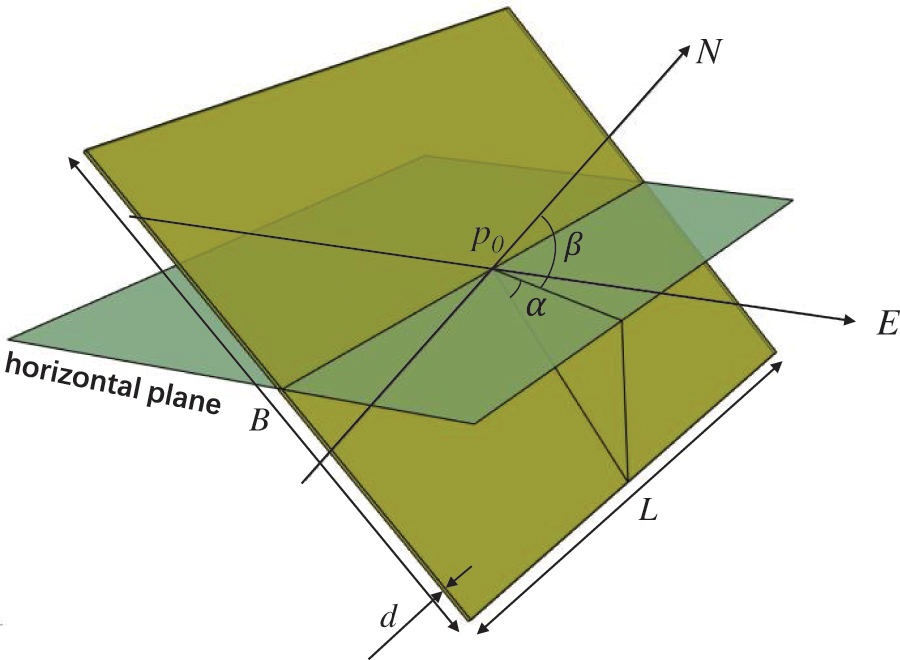
Figure 5: Required parameters to model the 3D planar geological structure
2.2 Modeling of Underground Engineering Structures
Modeling underground engineering structures is a difficult component of underground engineering modeling. The cross-sectional shapes of underground caverns mainly include circular shapes, gate shapes, horseshoe shapes, rectangular shapes, wedge shapes, and powerhouse shapes with rock anchor beams. These geometric shapes can be expressed by parameters such as width, height and radius, which allows parametric modeling of these underground structures. The modeling program generates a cross section by inputting geometric parameters and then generates a three-dimensional geometric model by stretching, lofting, and arraying the cross section. The realization of underground engineering structure modeling is shown in Fig. 6. The user inputs modeling parameters of a modularized cross section on the web platform. Then, the modeling program generates interactive 3D graphics and sends the modeling instructions to the cloud server, which executes the modeling instructions automatically.
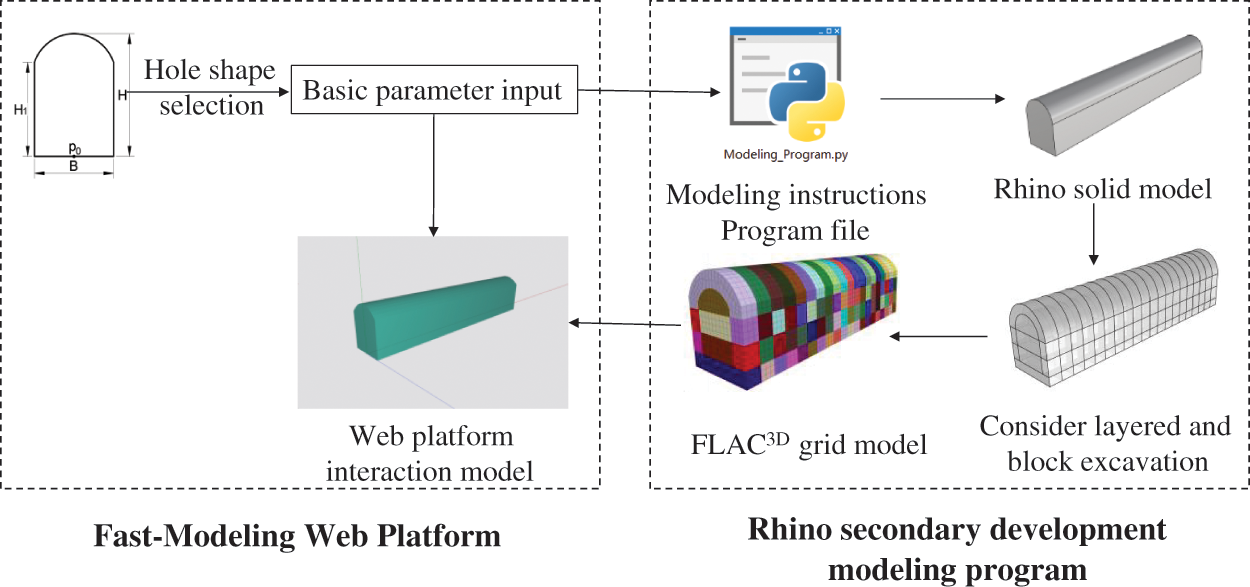
Figure 6: Realization flow chart of underground engineering structure modeling
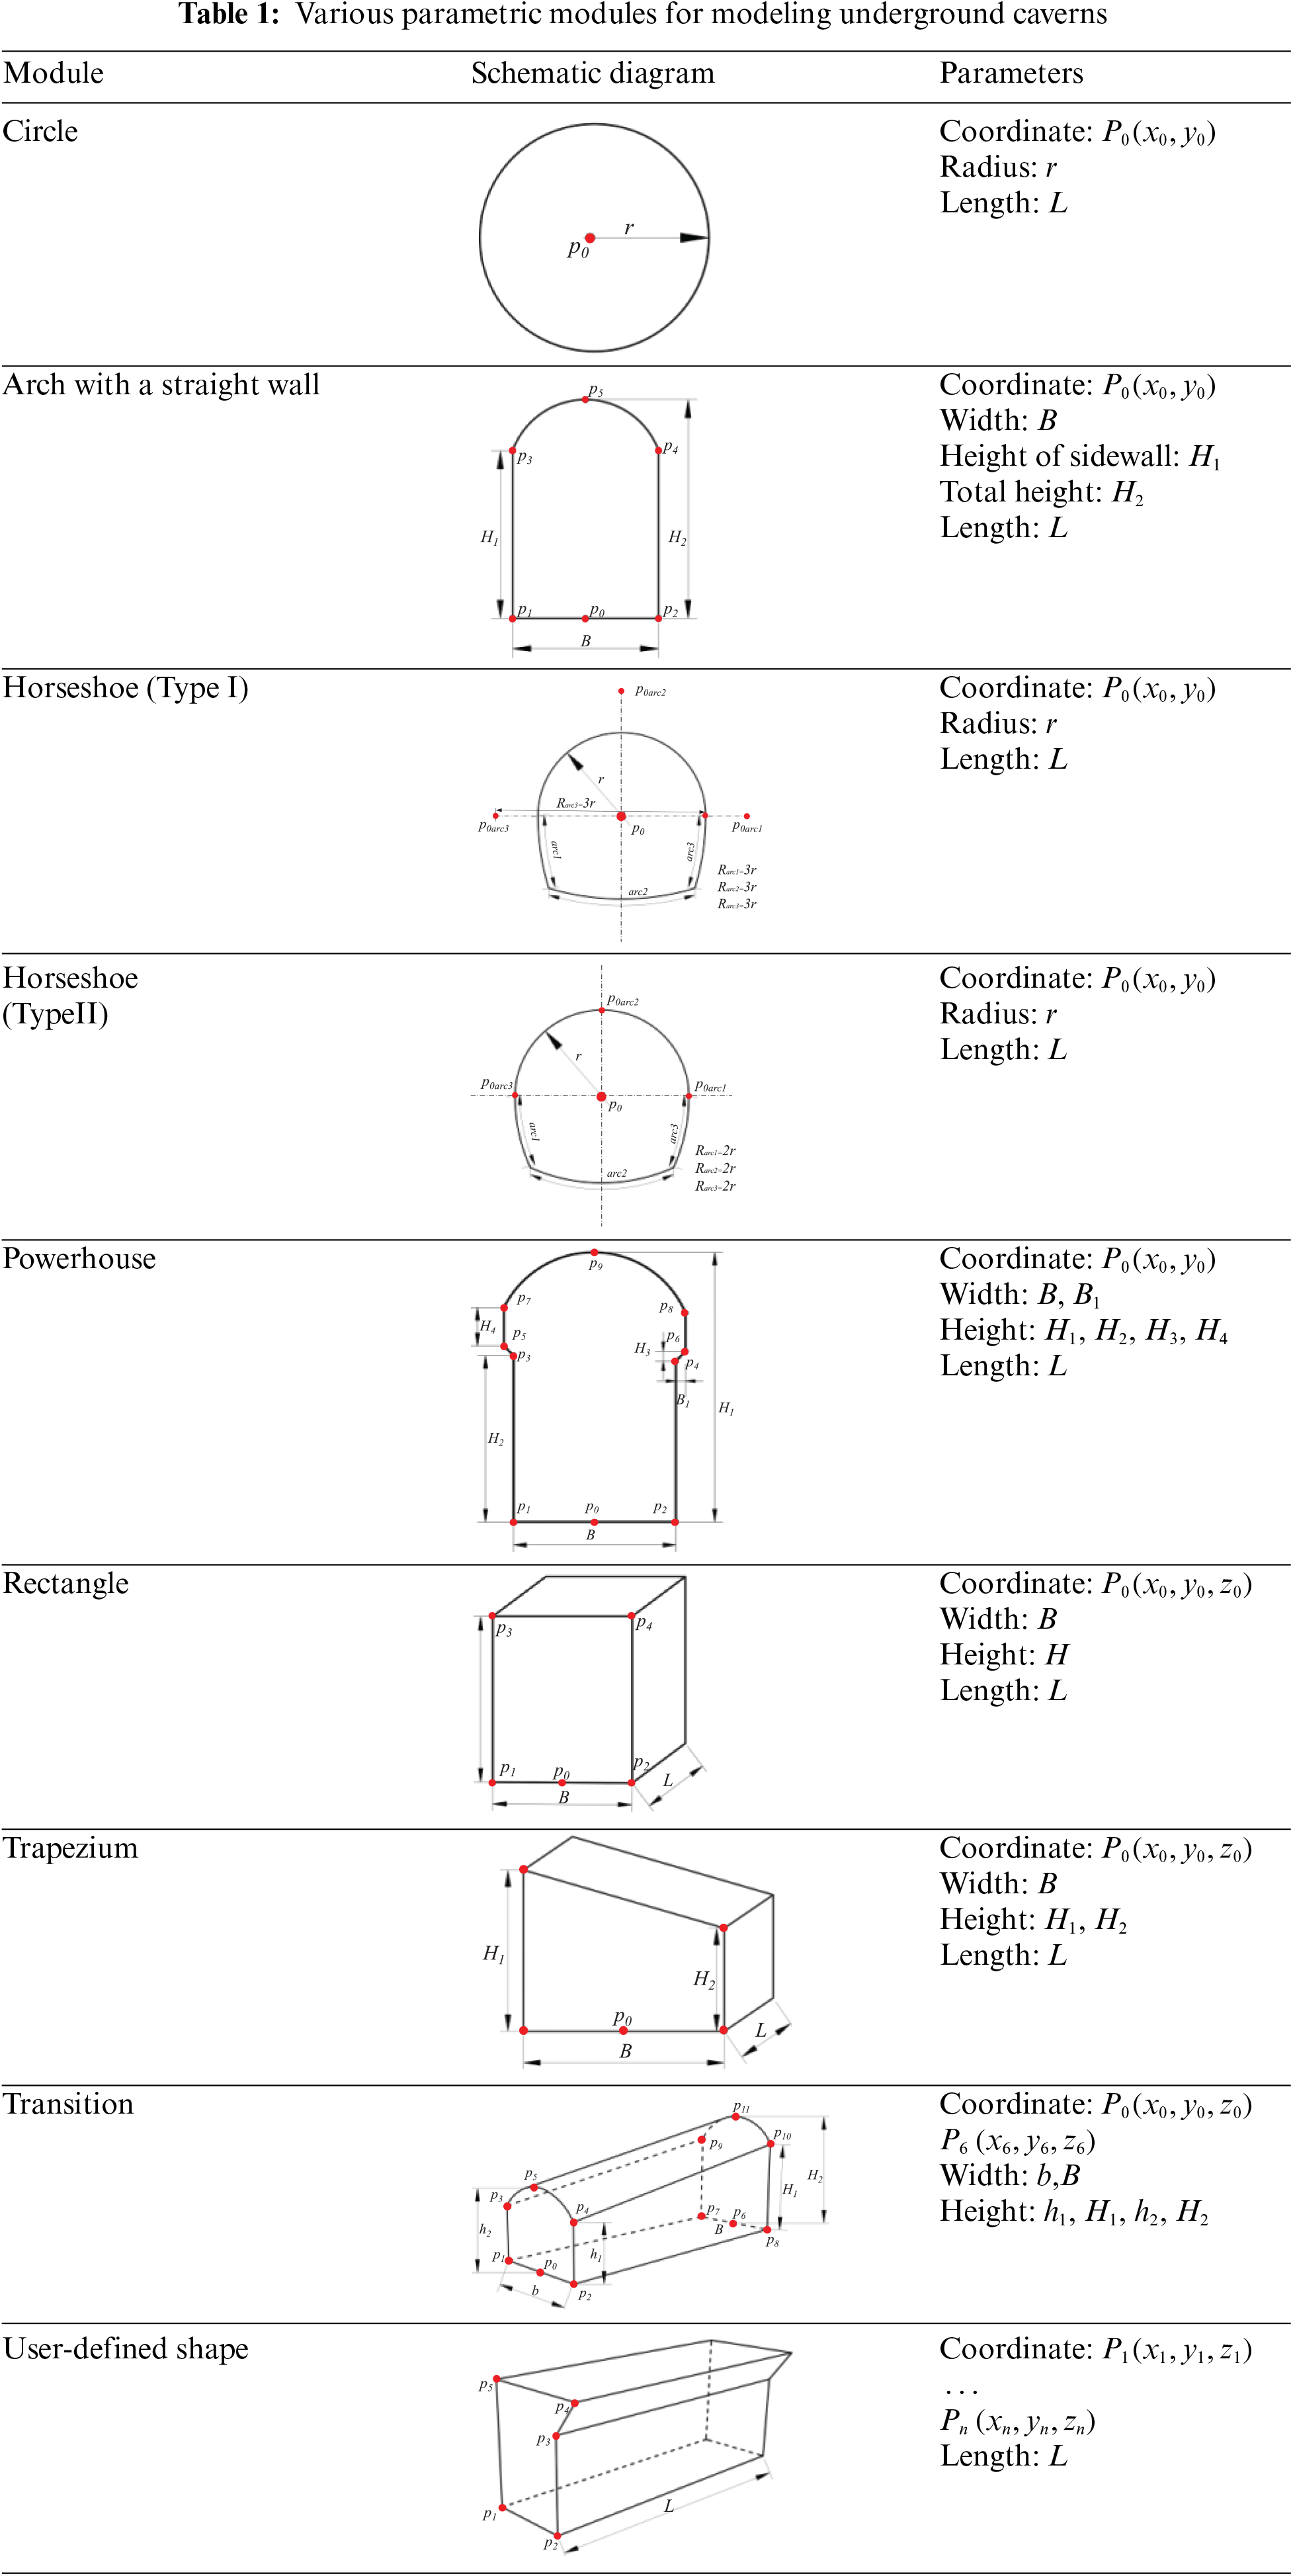
Various cross-sectional shapes of underground caverns are made as parametric modules in the modeling program, as shown in Table 1. Taking the modeling of a gate-shaped tunnel as an example, the modeling procedures are as follows. First, all geometric parameters of the gate-shaped tunnel must be input onto the web platform, including the location coordinates of the cross section
Usually, large underground engineering projects consist of several caverns and tunnels, and a complicated cavern can consist of several modules. Naming each cavern or module before modeling is necessary to facilitate identification. Sometimes, it is also necessary to model the shotcrete and concrete lining, the potential damage zone of the surrounding rock, and the boundaries of step-by-step excavation; these kinds of modeling are programmed as optional. If the shotcrete or concrete lining needs to be modeled as a 3D solid element, the thickness of the shotcrete or concrete lining (
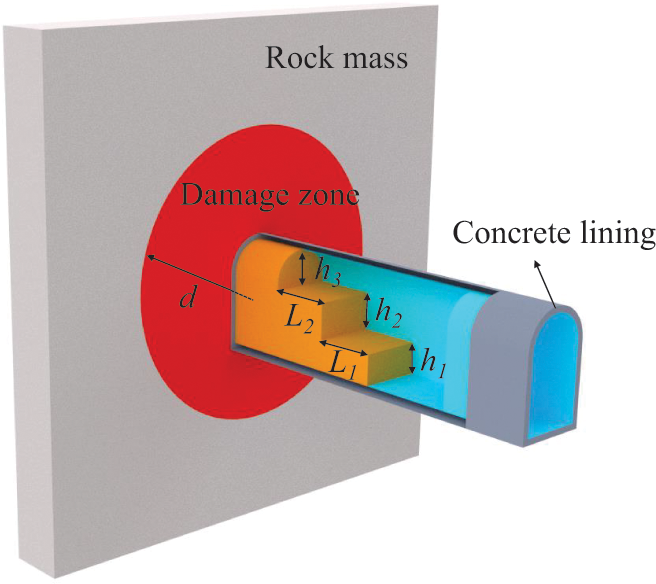
Figure 7: Schematic diagram of optional modeling for underground engineering structures
2.3 Modeling of the Supporting Structure
Linings, steel supports, bolts and anchor cables are the main supporting structures used in underground engineering and the carriers of monitoring sensors such as displacement and stress meters. Structural elements are widely used in the numerical simulation of underground engineering excavation and support, such as plate elements representing linings, beam elements representing steel supports, and link elements representing bolts or anchor cables. Thus, the function of modeling these supporting structures has been developed in the modeling program.
(1) Modeling of the lining structure
The lining structure can be modeled by a 3D solid element or 2D plate element. The modeling method of the 3D solid element is introduced in Section 2.2. If the lining structure needs to be modeled by a 2D plate element, the thickness of the lining (
(2) Modeling of the steel supports, bolts and anchor cables
In numerical simulation software, bolts and anchor cables are usually modeled as link elements, and steel supports are usually modeled as beam elements. Most simulation software, such as FLAC3D and Midas, does not require the solid element and the link or beam element to share the same node. Therefore, it is very convenient to model a link or beam element by two arbitrary points. In addition, FLAC3D supports modeling massive links or beam elements by importing DXF files. A realization path flow chart for modeling the supporting structure of a cavern is shown in Fig. 8. According to basic information (such as position, length, axial spacing, circumferential spacing and angle ranges) from these support structures, which are input onto the web platform, the modeling program automatically generates all the lines of steel supports, bolts and anchor cables in Rhino. Then, these lines are saved as different DXF files according to the construction sequence to facilitate the simulation of the construction process of these supporting structures. Finally, the DXF files are imported into numerical simulation software to generate elements of the supporting structure.
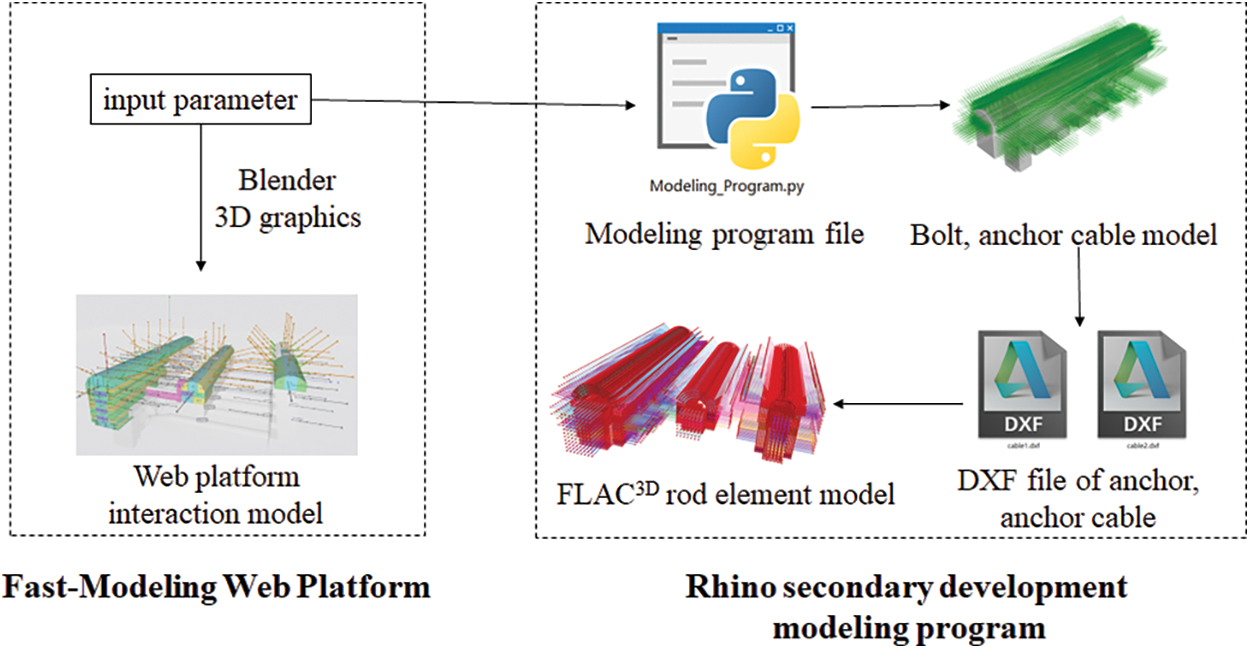
Figure 8: Realization path flow chart of modeling the supporting structure of a cavern
Steel supports, bolts and anchor cables are usually designed equidistantly along the axial direction of a cavern, and bolts and anchor cables are also equidistantly distributed along the circumferential direction. Section 2.2 shows that a cavern’s cross section comprises a straight line or arc, which can be used as the path to model steel supports, bolts and anchor cables. The beam elements representing steel supports can be generated along the straight line or arc on the cavern’s boundary. The link elements representing bolts and anchor cables can be generated by arraying them along the straight line or arc.
The position of the first bolt or anchor cable in its group must be input onto the web platform before the automatic array. In 3D space, a straight line can be expressed in two ways. The first is to determine a straight line with the coordinates of two points, and the second is to determine a straight line with the coordinates of one point, an angle and a length. In engineering, the position of a bolt or anchor cable is usually described by azimuth, dip and length, so the modeling parameters are input in the second way, which is more consistent with the engineering description. As shown in Fig. 9, based on the coordinates
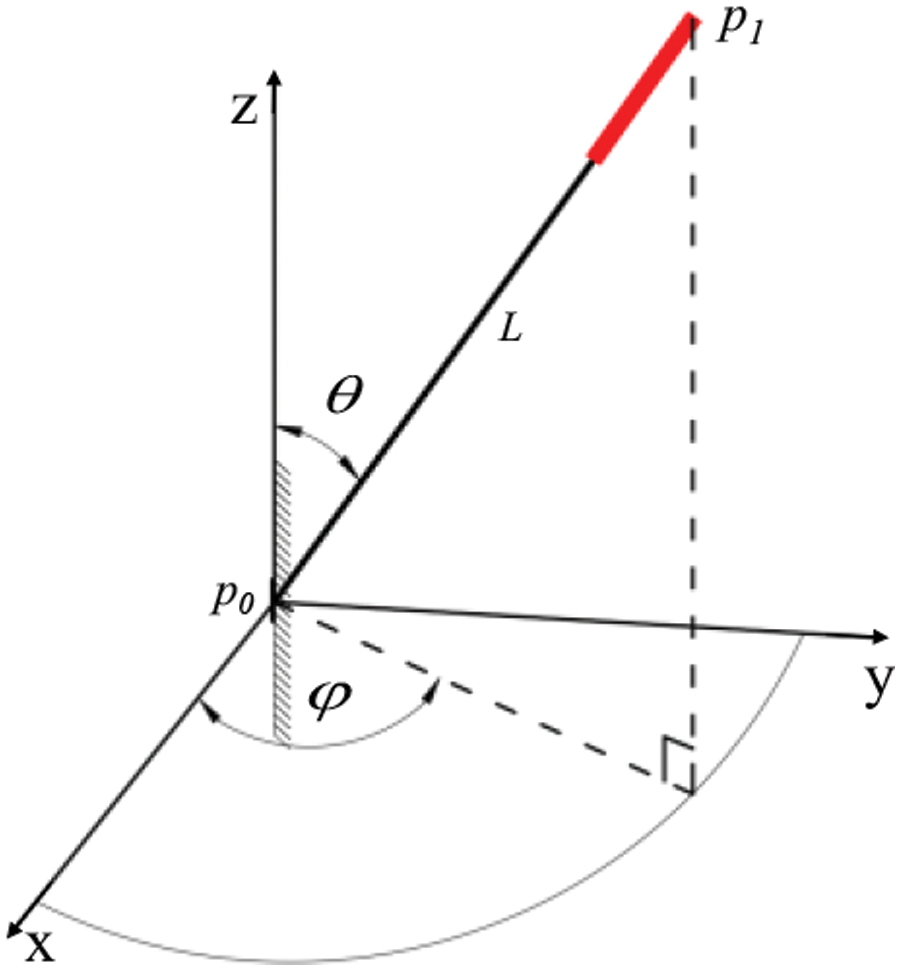
Figure 9: Geometric parameters of the bolt
where
After the first bolt or anchor cable is designated, a group of bolts or anchor cables are first arrayed along the straight line or the arc line according to the circumferential number
Meshing of the geometric model is a necessary part of finite element modeling. In the numerical simulation software, nodes and elements are the carriers for establishing and solving equations. The meshing quality greatly influences the accuracy of the numerical results. Griddle is a plug-in program in Rhino that is used to mesh geometric models. The Griddle mesh method can be divided into two types: structured and unstructured. A structured mesh is usually divided gradually along the geometric structure line according to a certain length or fraction. This kind of mesh is regular and beautiful, and the mesh size is controllable, but it often takes much time, and when the model is complex and the geometric shape is irregular (such as a geological surface), structured mesh division is very difficult. An unstructured mesh is usually divided freely according to a certain mesh size. This meshing method is fast, and the mesh geometry is easy to transition. It is suitable for the mesh generation of complex models. Based on the powerful unstructured function, when using the Griddle plug-in to mesh geometric models, a geometric model’s surfaces will be first meshed into quadrilaterals or triangles. If there is a geological structure and step-by-step excavation, the program will form a plane at the excavation site, subsequently controlling the surface mesh size. Then, the geometric model will be meshed according to the surface mesh by the excellent Griddle algorithm, which can mesh arbitrarily shaped entities. Finally, a grid file with node, element and material grouping information will be generated and imported to simulation software.
In numerical simulations, the finer the grid and the greater the number, the more accurate the numerical simulation, but it will require more computing resources. Element size control is very important when using the Griddle plug-in to mesh geometric models. Therefore, the optimization of element size is considered in the program, and the element size is controlled by the ‘minimum edge principle’. As shown in Fig. 10, when the program meshes an underground cavern, it first establishes a virtual minimum box around the cavern. It then automatically obtains the box’s length L, width B, and height H. The minimum edge is used to control the element size. According to experience, using 1/10 of the length of the minimum edge as the overall element size can ensure the grid’s fineness and minimize the number of elements and nodes.
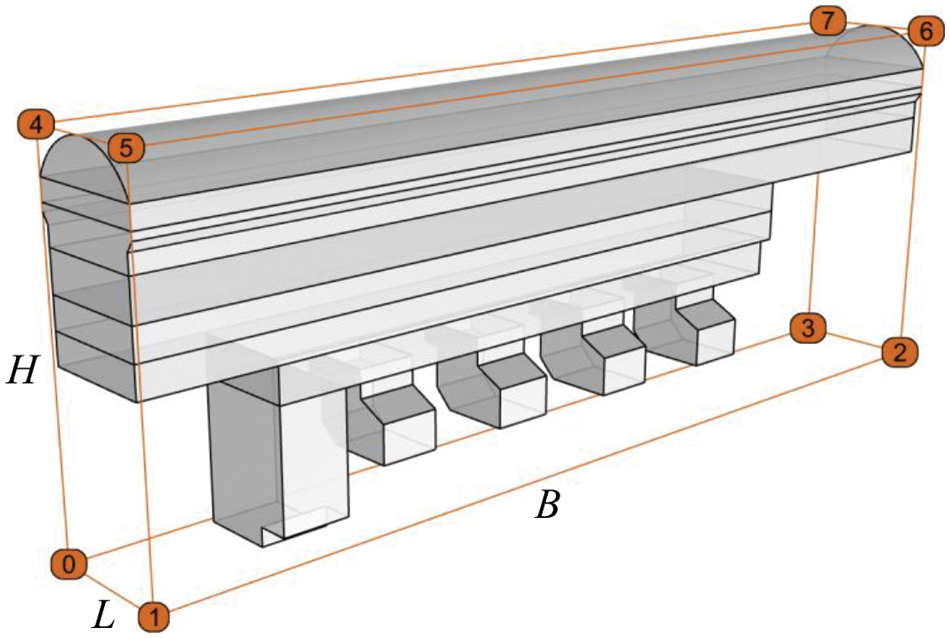
Figure 10: The minimum bounding box of a geometric model
To verify the accuracy of the modeling program and the correctness of the mesh method, a simple case study of a tunnel excavation was established. The model established in the cloud server is compared with the model established in ANSYS. The calculation of the cloud service is carried out by FLAC3D. The meshing comparison is shown in Fig. 11.
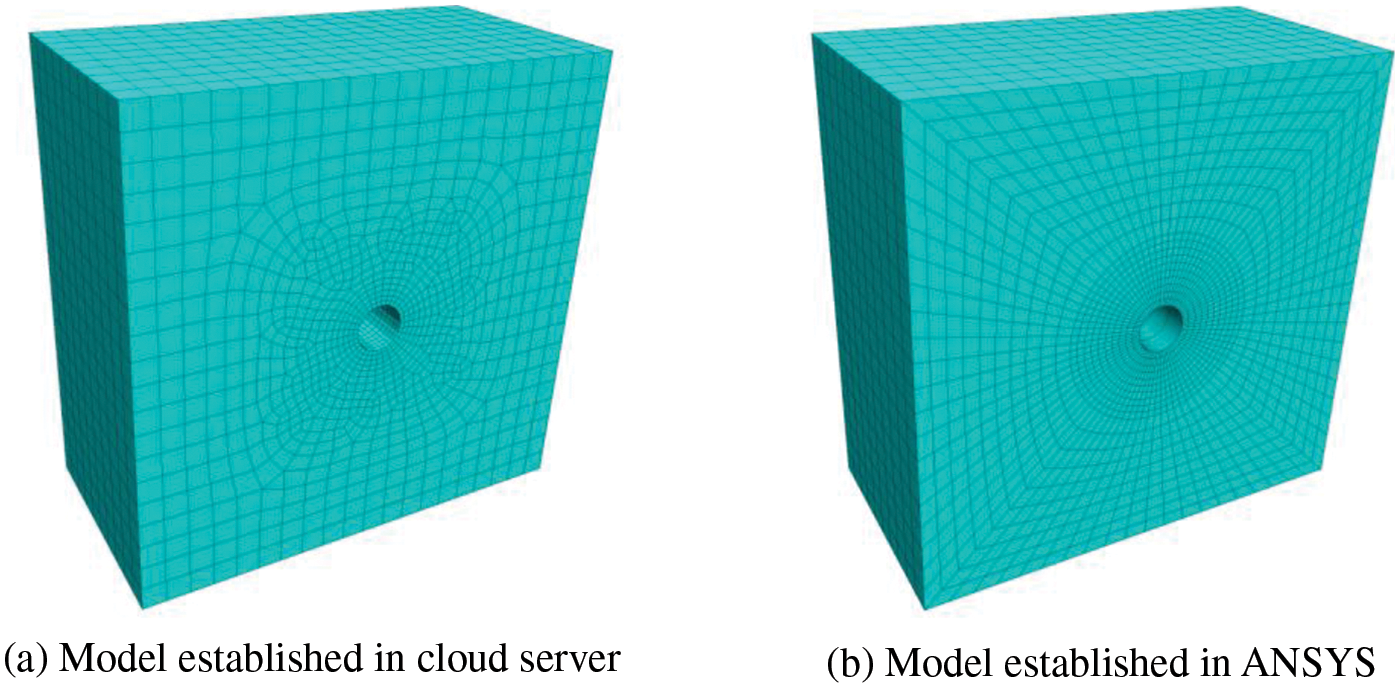
Figure 11: Comparison of meshing
The mechanical parameters are listed in Table 2. The distributions of the simulated displacement and principal stress are shown in Fig. 12. The maximum displacements, the extreme values of maximum principal stresses, and the extreme values of small principal stresses obtained by two methods were compared, and most of the relative differences are between 1%~5%, and the maximum relative difference is about 8.3%. The differences are acceptable in engineering applications, and they are attributed to the finite element mesh. The model constructed by the proposed modeling program has a coarser mesh around the tunnel than the ANSYS model, which is meshed by mapping meshes. Thus, the results obtained by ANSYS present a higher stress concentration around the tunnel.
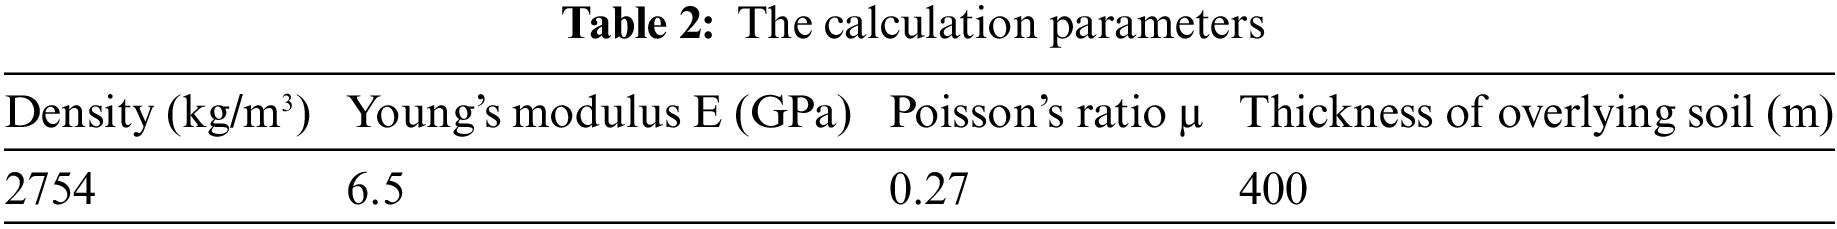
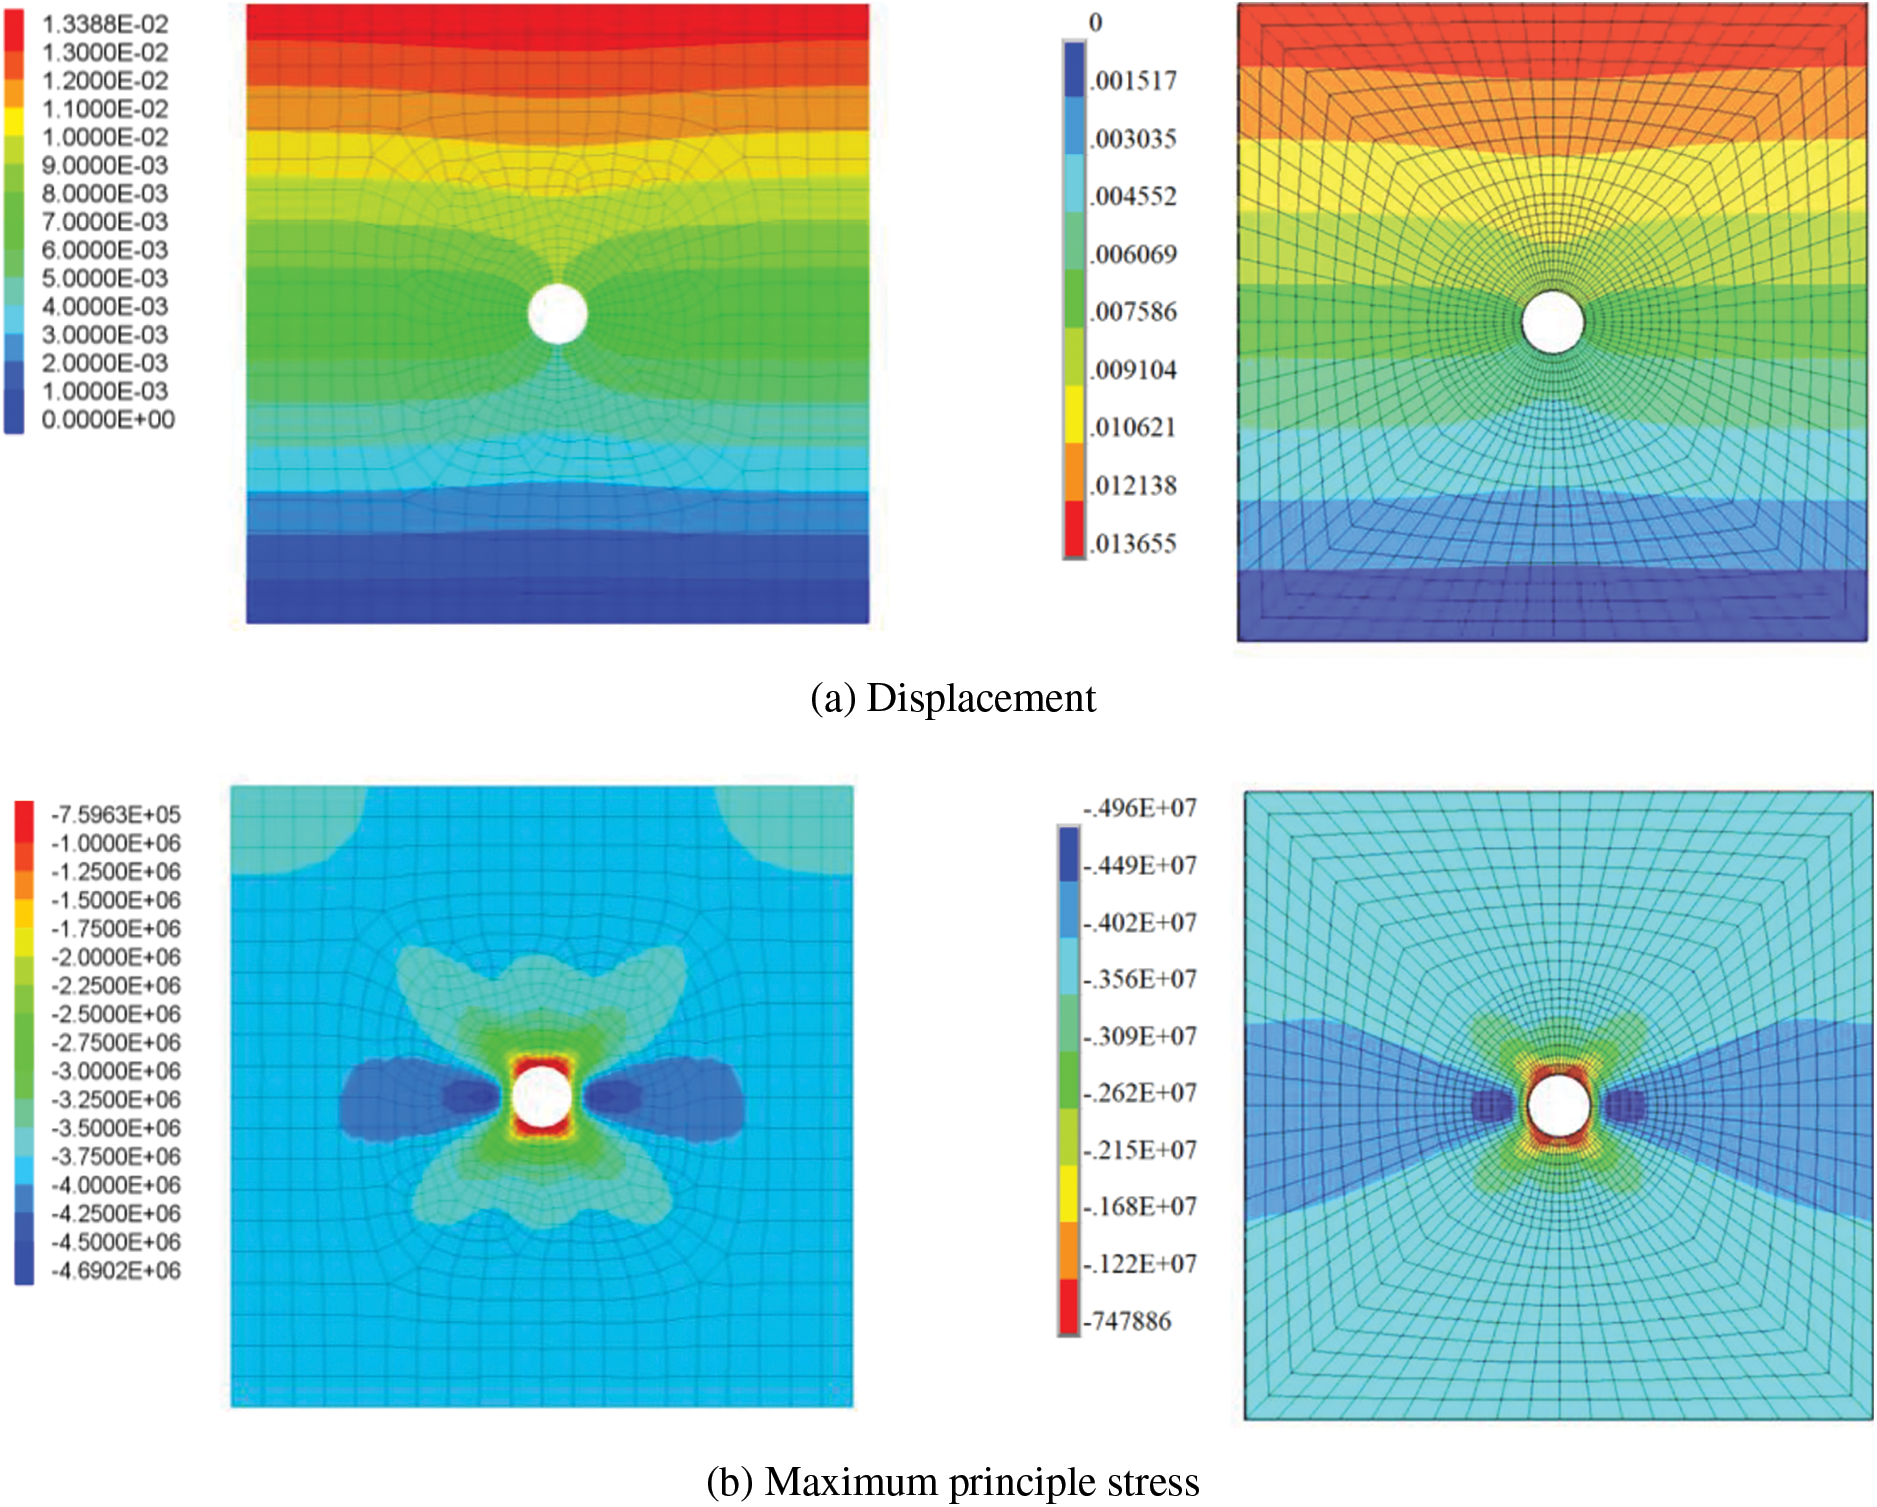
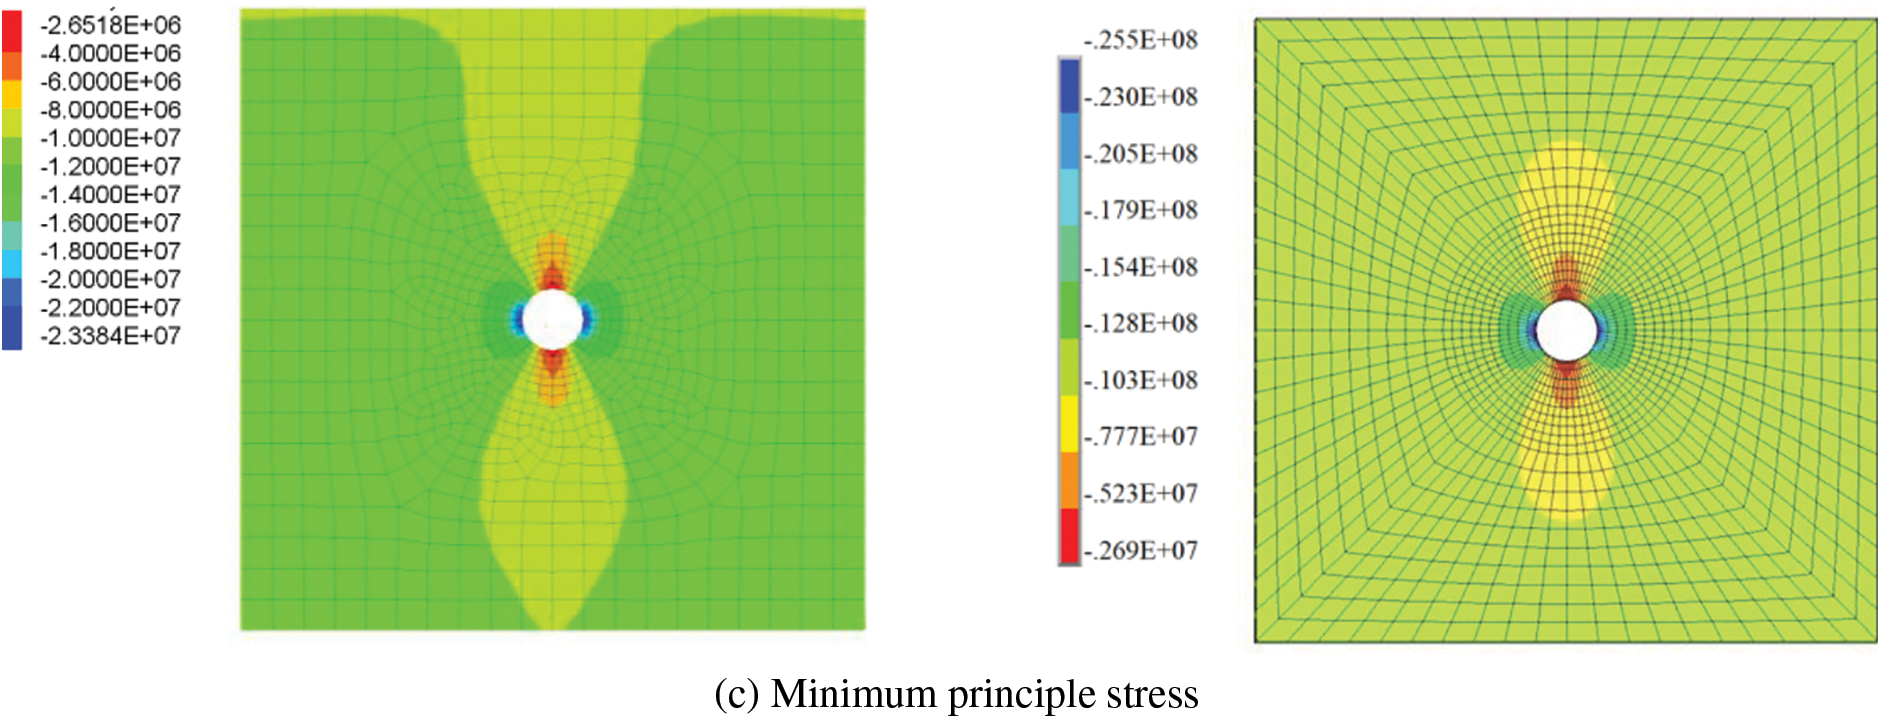
Figure 12: Comparison of displacement and stress simulation by the proposed method and ANSYS. The figures on the left were simulated by the proposed method, and the figures on the right were simulated in ANSYS
However, the cloud server can establish the model automatically with the size of the model and the excavation range of the tunnel, which is very convenient. In contrast, the establishment of a model with regular grids in ANSYS requires tedious operations. After establishing a three-dimensional geometric model with a circular tunnel in ANSYS, it needs to be segmented to ensure that the mesh of the entire model is hexahedron, which consumes a lot of time. Thus, the model established in the cloud server is reliable and can improve modeling efficiency.
The Shuangjiangkou Hydropower Station is located in Jinchuan County, Aba Tibetan and Qiang Autonomous Prefecture, Sichuan Province, China. It is the fifth hydropower station of the 22 planned hydropower stations in the Dadu River Basin. The power station comprises a dam, a flood discharge system, a water diversion system, and a power generation system. The Shuangjiangkou Dam is the highest in the world among the dams already built or under construction. Its underground powerhouse is arranged in the left abutment and upstream of the dam axis. The longitudinal axis of the main powerhouse orients N10°W. Its minimum horizontal burial depth is approximately 400 m, and its vertical burial depth is approximately 320~500 m. In the main powerhouse, the excavation span of the top arch is 28.30 m, the excavation span below the rock anchor beam is 25.30 m, the maximum excavation height is 68.32 m, and the excavation length is 135.06 m. In the installation room, the excavation span is the same as that of the main powerhouse; the maximum excavation height is 29.22 m, and the excavation length is 54.02 m. In the auxiliary powerhouse, the span, the maximum height and the excavation length are 25.30, 42.72 and 30.40 m, respectively. Thus, the total length of the powerhouse is 219.48 m.
According to geological exploration in the SPD9 tunnel, the surrounding rock of the underground powerhouse is mainly porphyritic biotite K-feldspar granite, which is interspersed with granitic pegmatite veins and a small number of fine crystal veins. A lamprophyre vein is noted 395 m away from the entrance of the exploration tunnel, and it has an occurrence of N35~50°W/SW∠72°~75° and a width of 0.8~1 m. The contact interfaces beside the lamprophyre vein are staggered and eroded into a layer of broken and flaky rock with a width of 3~5 cm. Fault F1 is also developed across the underground powerhouse and has an occurrence of N79°W/SW∠48°. The angle between fault F1 and the axis of the SPD9 tunnel is approximately 69°. The crushed band of the faults is composed of clastic rock and has a width of 50~60 cm.
As shown in Fig. 13, the model takes the center of electric generator #1 of the main powerhouse as the origin O in the horizontal plane, the direction perpendicular to the axis of the main powerhouse as the X-axis, the direction along the axis of the main powerhouse as the Y-axis, and the vertical direction as the Z-axis. The Z-axis coordinates of the model correspond to the elevation. The calculation model has a length of 700 m along the X-axis direction and a width of 700 m along the Y-axis direction. The bottom of the model has an elevation of 2000 m, and the top of the model extends to the ground surface.
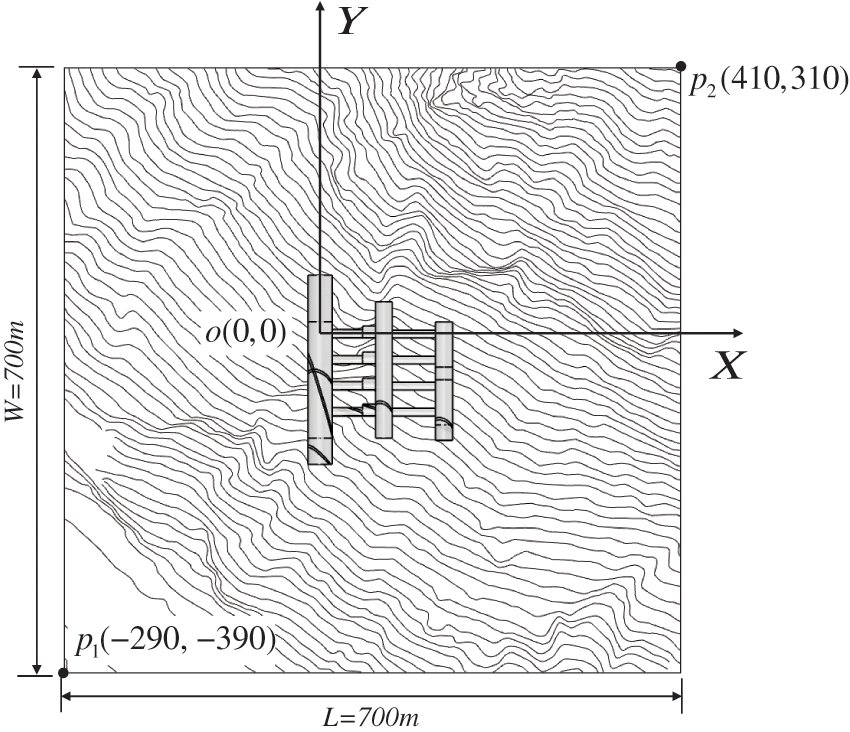
Figure 13: Definition of the axes and modeling range
After determining the range of the model, the horizontal coordinates of the two corners, which are
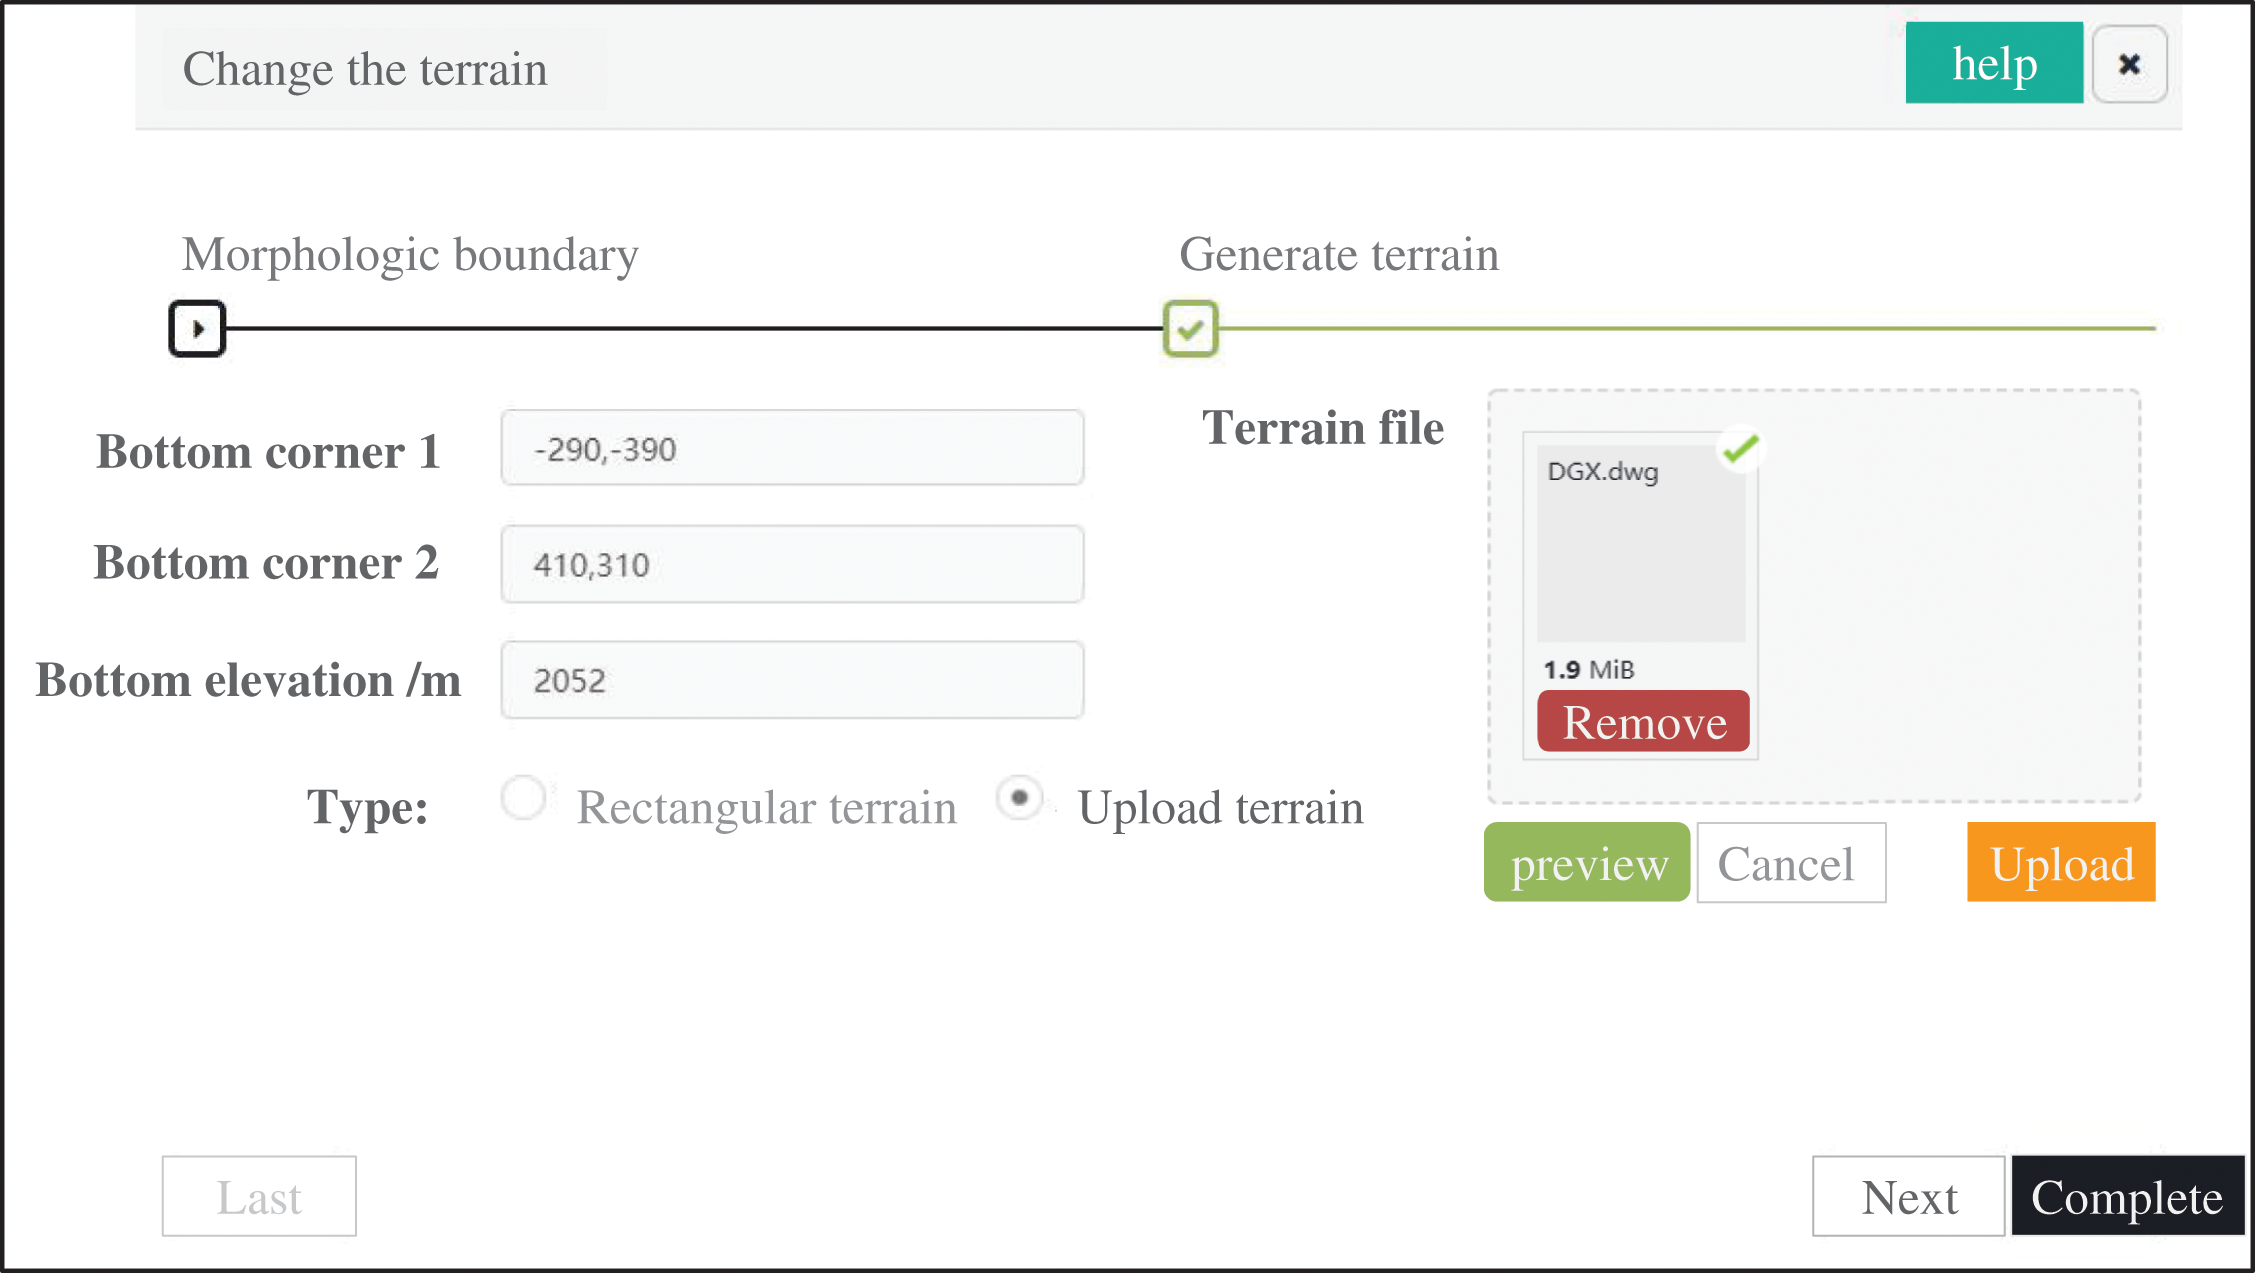
Figure 14: The parameter input on the web platform
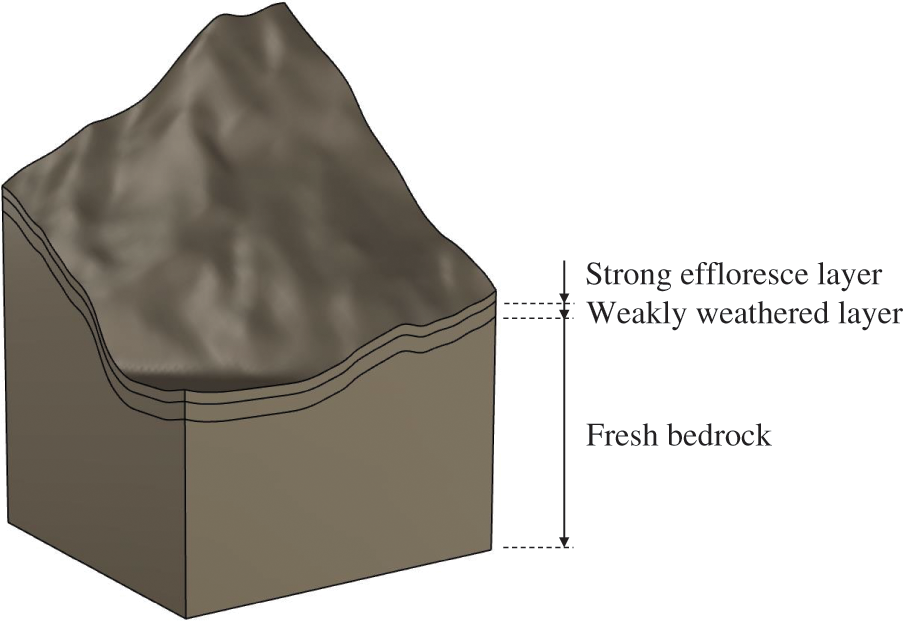
Figure 15: 3D terrain model
The numerical model of the Shuangjiangkou underground powerhouse mainly includes five parts: the main powerhouse (including auxiliary powerhouse and installation room), transformer chamber, omnibus bar cave, tailrace tunnel and downstream surge chamber. The underground powerhouse is divided into eight layers for excavation in the simulation, as shown in Fig. 16. The rocks in different chambers within the same excavation sequence are excavated simultaneously in the simulation. According to the eight excavation layers, each layer in a cavern is modeled as an individual part with the modeling method in Section 2.2. Because the coordinates of the model correspond to the chainage and elevation in the engineering drawing, the modeling parameters can be directly obtained from the engineering drawings. According to the cross-sectional shape of each part, various basic shapes are selected to construct the engineering structure on the web platform. After all parameters of a part are input, the cloud task is performed, the modeling program executes the modeling instructions, and the cloud server automatically runs Rhino to generate the underground powerhouse geometric model and quickly returns the model to the web platform for preview. It takes approximately 25.71 s to generate the geometric model of the underground powerhouse.
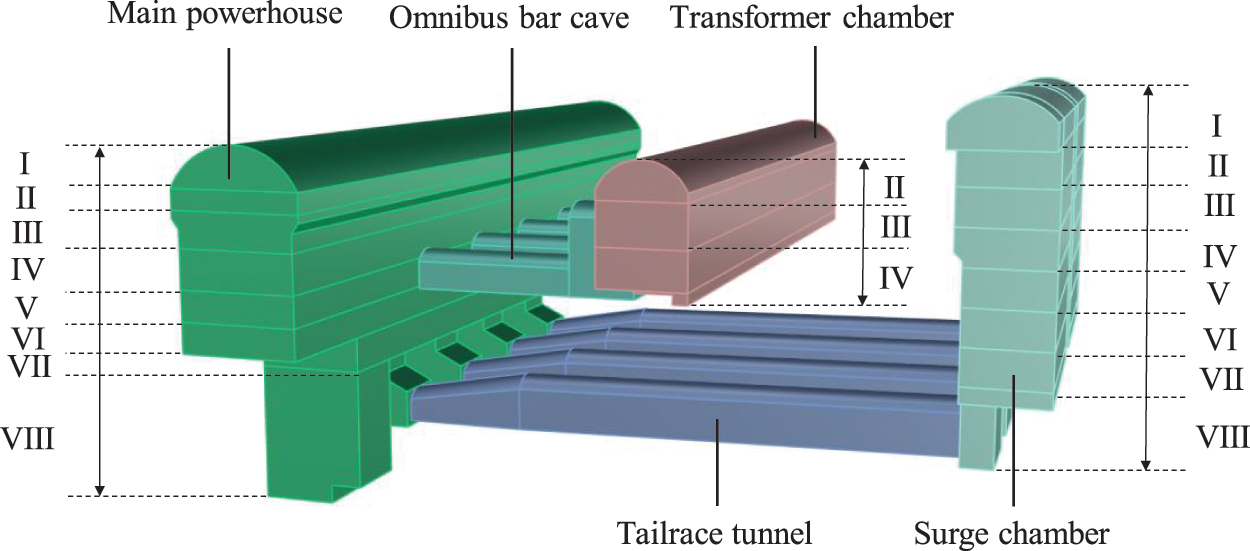
Figure 16: 3D geometrical model of underground powerhouse
According to the geological exploration, the main geological structures across the underground powerhouse are the lamprophyre vein and fault F1. The lamprophyre vein passes through the end wall of the auxiliary powerhouse, and fault F1 passes through the main powerhouse and transformer chamber. Thus, these two geological structures are modeled. After inputting parameters of the geological structures, including center point
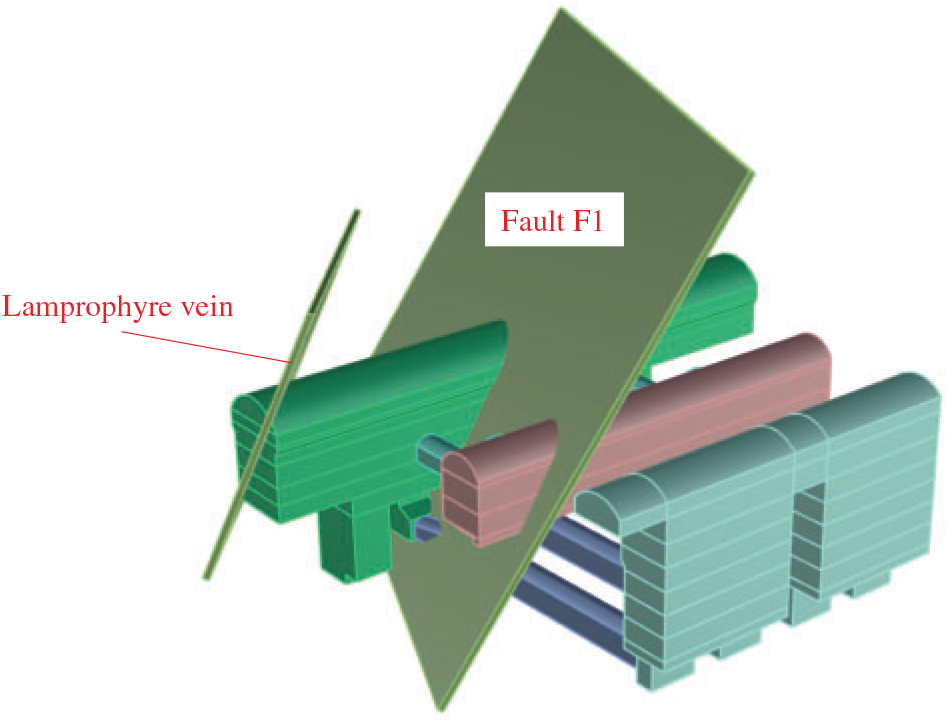
Figure 17: 3D model of the lamprophyre vein and fault F1
The main supporting structures of the Shuangjiangkou underground powerhouse are anchor cables and bolts. Based on the modeling method in Section 2.3, these anchor cables and bolts are generated by inputting parameters of different groups of supporting structures onto the web platform. A total of 25047 bolts and 3607 anchor cables are eventually generated in this model. All anchor cables and bolts are saved as DXF files named by the construction sequence corresponding to the excavation sequence. The model of anchor cables and bolts generated by Rhino is shown in Fig. 18.
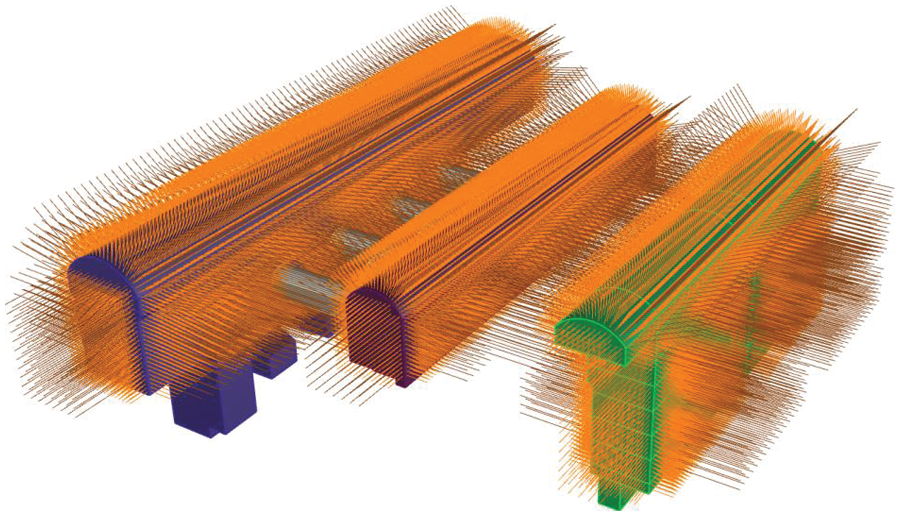
Figure 18: The model of anchor cables and bolts
After all the geometric entities are modeled, the mesh instructions are submitted to the web platform and sent to the cloud server. Then, the cloud mesh process is automatically carried out in Rhino with the Griddle plug-in. After meshing, the grid file applicable to FLAC3D is output and then imported to FLAC3D for simulation. The grid imported into FLAC3D is shown in Fig. 19, which has 477685 nodes and 753151 elements. It takes approximately 7.07 min to generate 753151 elements of the whole calculation model. Benefiting from the excellent mesh algorithm of the Griddle plug-in, almost all the elements are eight-node hexahedral and have a uniform mesh size and good morphology.
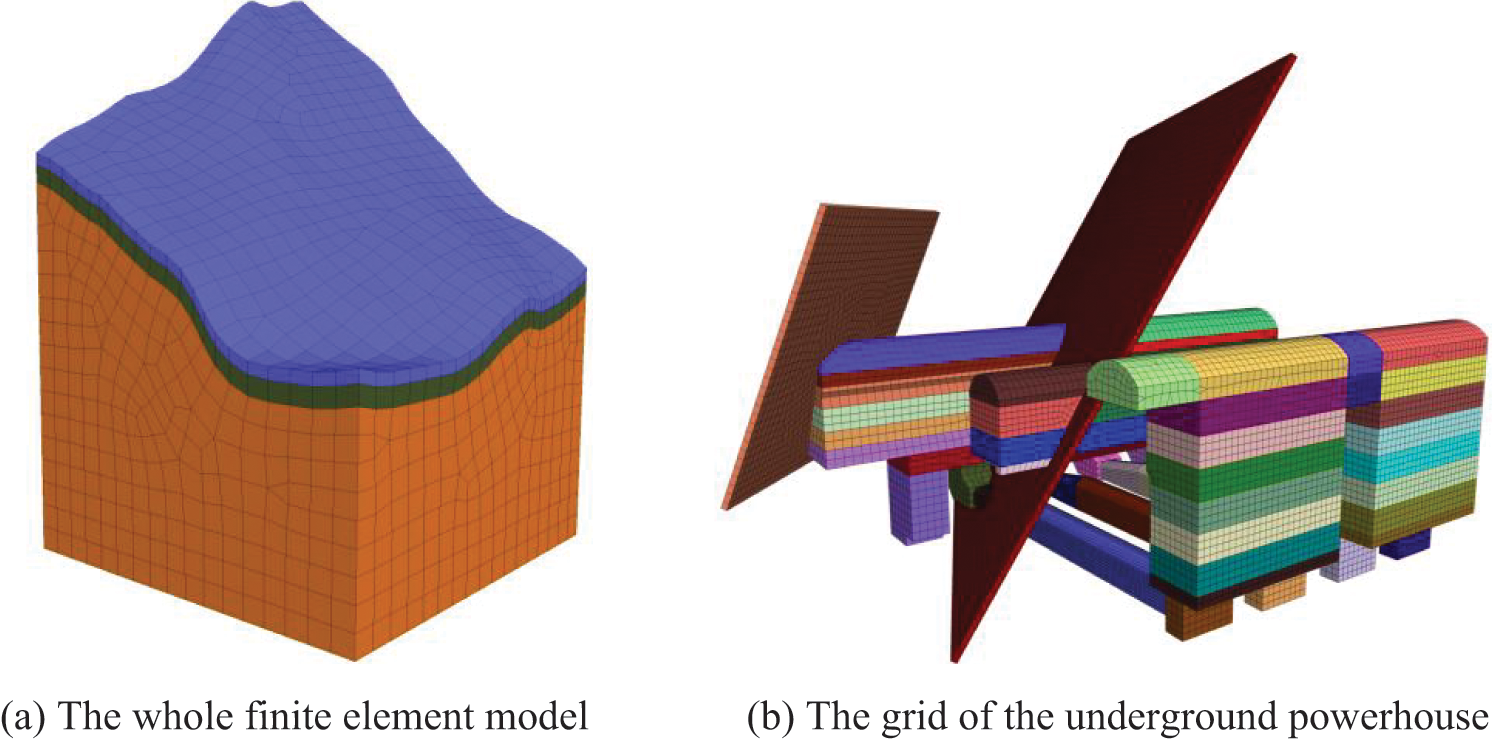
Figure 19: The grid of the model
3.3 Analysis of Finite Element Results
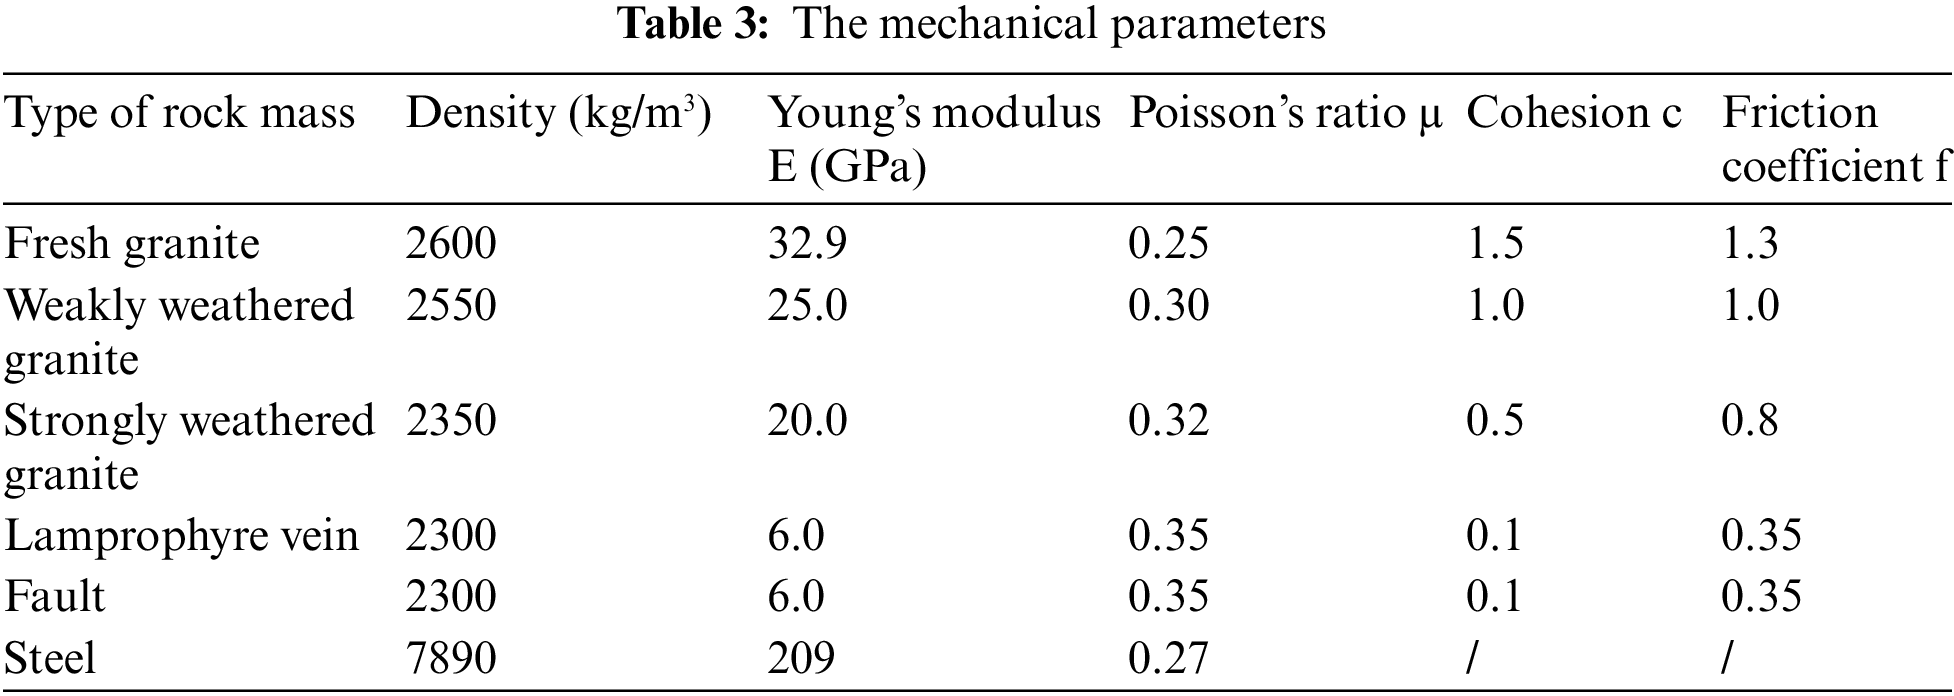
To demonstrate the simulation results of the proposed method of modeling, the generated model is imported into FLAC3D in the server for cloud analysis. Before the simulation, some mechanical parameters, boundary conditions and other necessary parameters are input onto the web platform. The mechanical input parameters were obtained from the geological survey report of the Shuangjiangkou Hydropower Station and are listed in Table 3.
The in-situ stress field of the model is achieved by specifying three coefficients
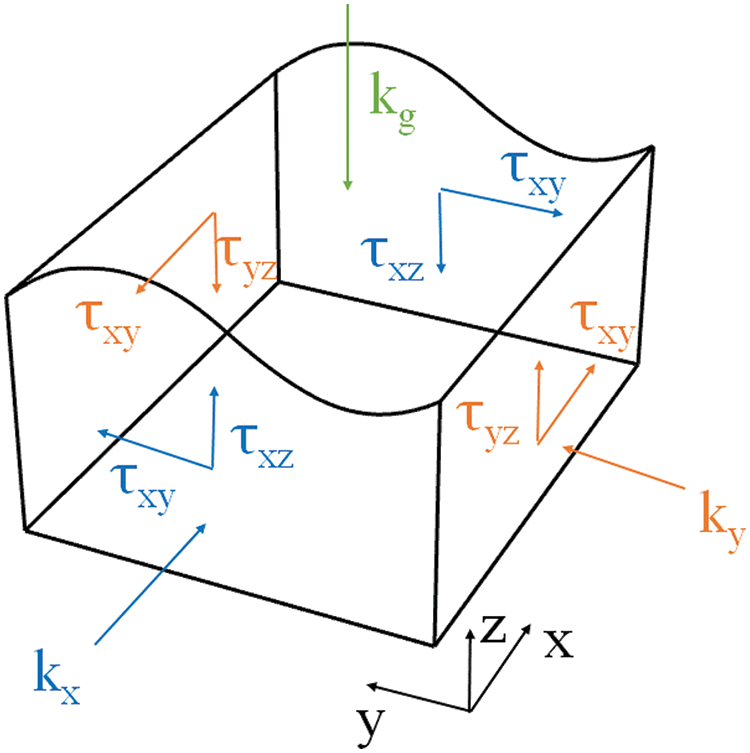
Figure 20: Boundary conditions of the finite element model
After these necessary parameters and solving instructions are sent to the server, the developed program generates a series of solving commands for FLAC3D to simulate the construction process. The program automatically implements FLAC3D to start the solving and then returns the solution as figures and data to the web platform. The excavations are simulated according to the procedure shown in Fig. 15. Fig. 21 shows the displacement contour of the surrounding rock in the transverse section of the #3 electric generator after all the excavations. This shows that the surrounding rocks on the sidewalls of the main powerhouse, the transformer chamber and the surge chamber deform horizontally toward the cavern. After all the excavations, the maximum horizontal deformation is 31.8 mm at the upstream sidewall of the main powerhouse, and the maximum horizontal deformation of the downstream sidewall is 26.5 mm. The surrounding rocks at the vault of the caverns deform downward. Because fault F1 passes through the surrounding rock above the transformer chamber, there is an obvious discontinuity in the contour of the vertical displacement along the fault. The vertical deformation of the surrounding rock above the transformer chamber is relatively large, and the maximum vertical displacement at the vault of the transformer chamber is 14.1 mm after all the excavations. The bottom of each cavern shows upward rebound deformation.
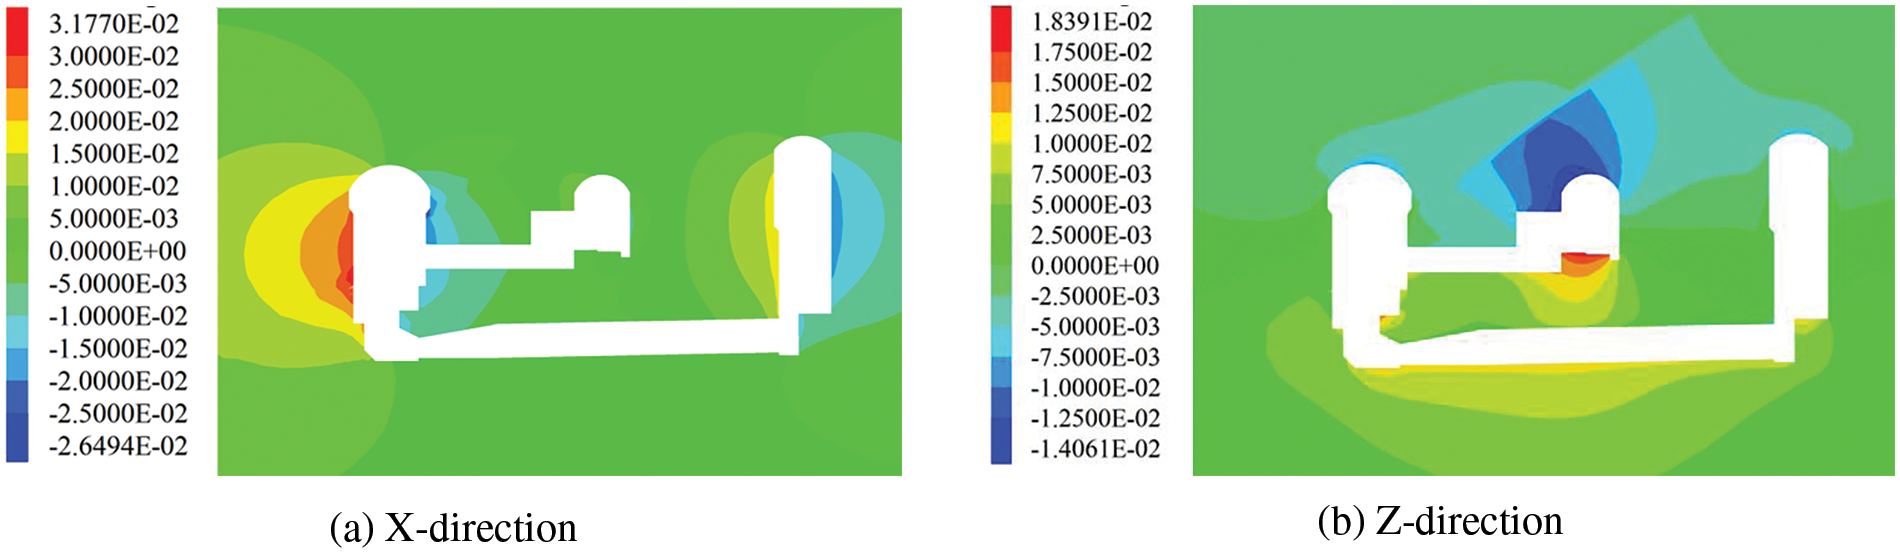
Figure 21: Displacement contour of the surrounding rock in the transverse section of the #3 electric generator after all the excavations (unit: m)
Fig. 22 shows the stress contour of the surrounding rock in the transverse section of the #3 electric generator after all the excavations. This shows that the stress concentrates at the bottom corners of the excavated caverns and on the top of the omnibus bar cave and the tailrace tunnel. Although the excavated volumes of the omnibus bar cave and the tailrace tunnel are smaller than others, the stress concentration on the top of them is more obvious. The minimum principal stress on the top reaches −44.5 MPa after all the excavations. The stress release of the surrounding rock is obvious on the sidewall and the floor of the main powerhouse, and the range of stress release increases with the excavation of the cavern. After all the excavations, the minimum principal stress of the surrounding rock on the upstream and downstream sidewalls of the main powerhouse decreases to approximately −10 MPa. The excavation of the powerhouse has a greater influence on the maximum principal stress than the minimum principal stress. The maximum principal stress of the surrounding rock on the sidewall of the main powerhouse decreases to less than −4 MPa. The tensile stress appears in part of the surrounding rock, but its value is less than 0.3 MPa.
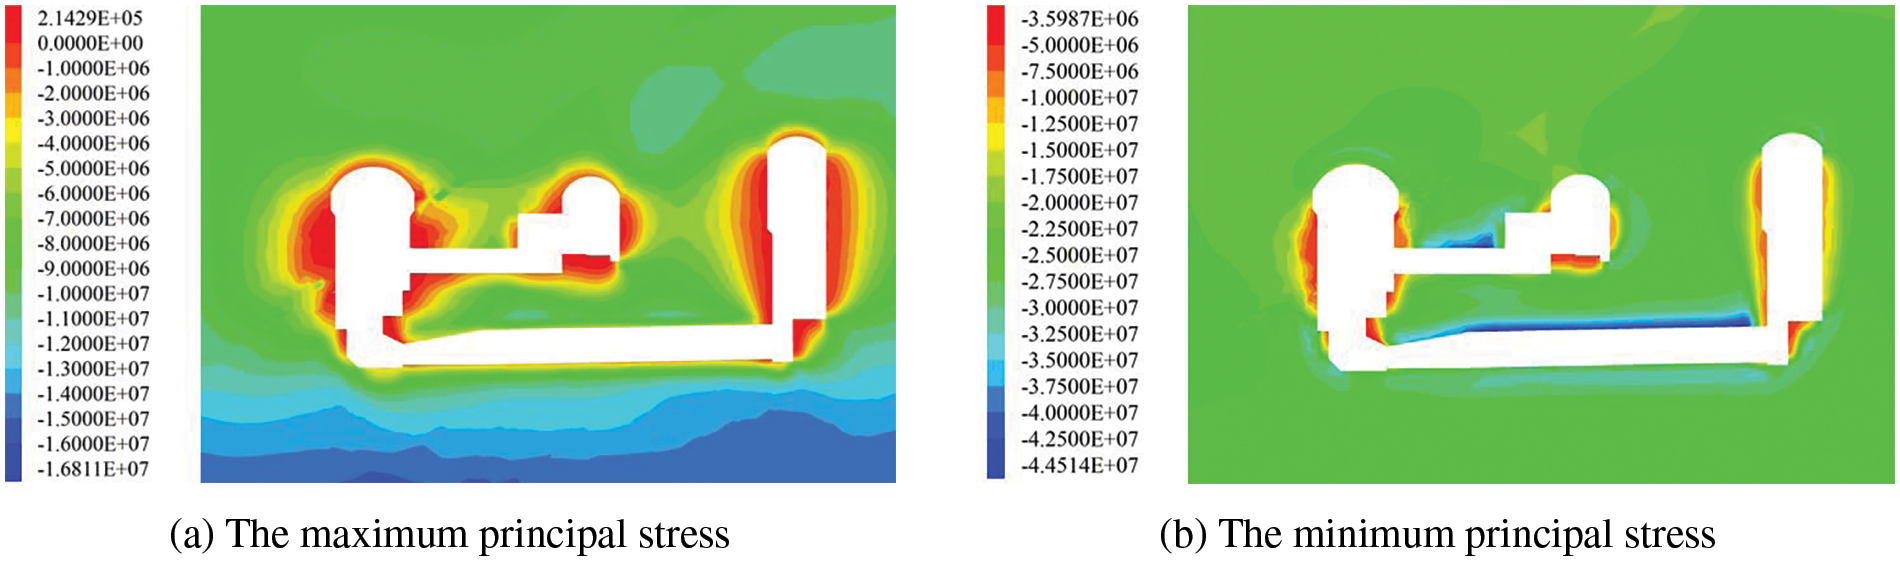
Figure 22: Stress contour of the surrounding rock in the transverse section of the #3 electric generator after all the excavations (unit: Pa, with positive tension). Fig. 23 shows the displacement distributions of the bolts and anchor cables. The displacements of the bolts and anchor cables around the main powerhouse are relatively large. The average displacement of the bolts and anchor cables installed on the sidewall is approximately 20 mm, and the maximum displacement is 36.7 mm on the bolts and anchor cables near fault F1. The displacements of the anchor end of these anchor cables are generally less than 2 mm because the surrounding rocks around the anchor end of these anchor cables are more than 20 m away from the cavern wall and are hardly affected by the excavation of the caverns
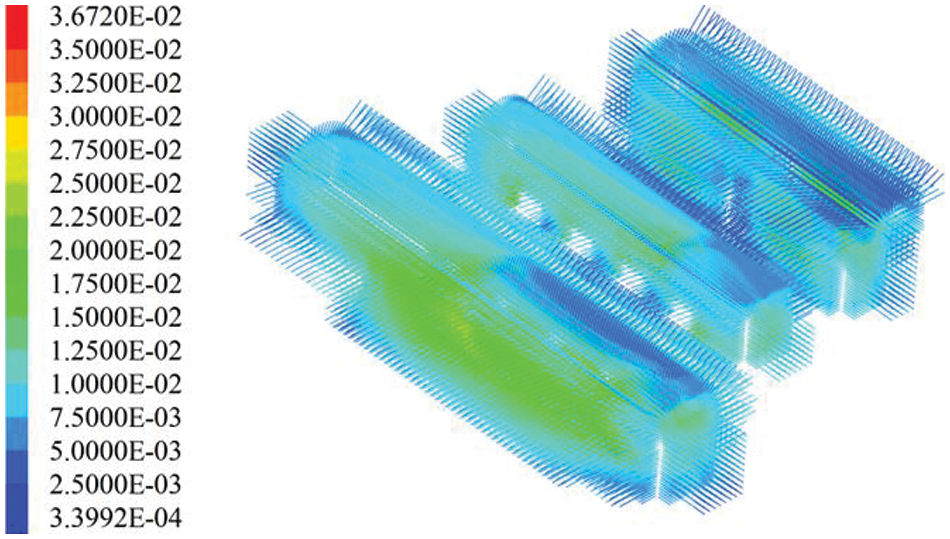
Figure 23: Displacement nephogram of the bolt and anchor cable (unit: m)
Fig. 24 shows the stress distribution of the bolts and anchor cables. After the excavation of the powerhouse, the stresses of the bolts and anchor cables are mainly tensile stress. Most bolts and anchor cables hold a tensile stress greater than 100 MPa. The tensile stresses of the bolts and anchor cables across the lamprophyre vein and fault F1 approach 400 MPa.
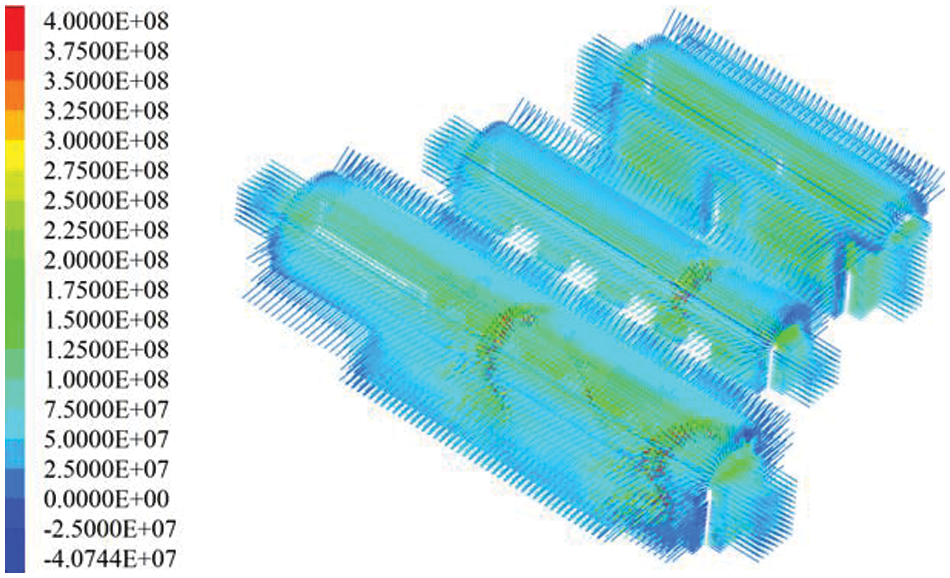
Figure 24: Stress nephogram of the bolt and anchor cable (unit: Pa, with positive tension)
Fig. 25 shows the distribution of the plastic zone around the caverns in the transverse section of the #3 electric generator after all the excavations. It shows both shear and tensile plastic zones around these three caverns. Compared with the scattered tensile plastic zones, the shear plastic zones are dominant and widely distributed on the sidewalls of these caverns. The maximum depth of the plastic zone on the sidewalls of the main powerhouse and the surge chamber is approximately 12 m. The depth of the plastic zone at the vault of the cavern is only approximately 2 m.
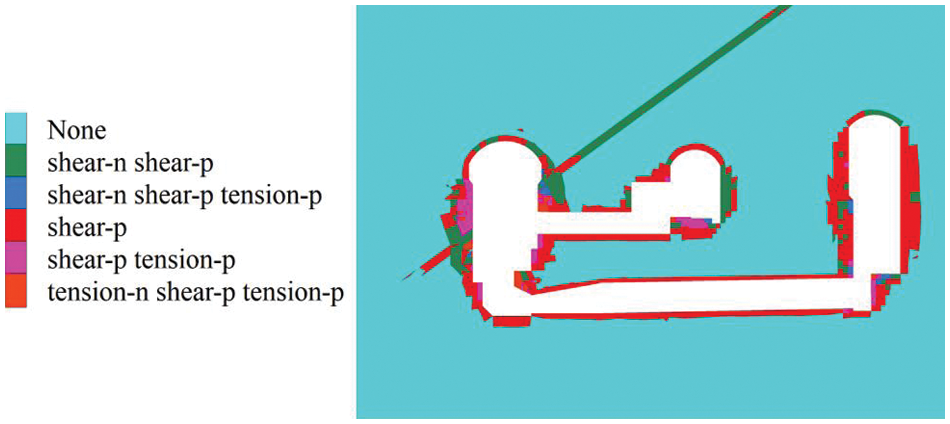
Figure 25: Plastic zone distribution of the surrounding rock in the transverse section of the #3 electric generator after all the excavations
Fig. 26 compares the measured and calculated displacement increments of the characteristic points of the #3 unit section of the main powerhouse after the fourth excavation. It can be seen in the figure that the calculated displacement increment is in good agreement with the monitoring data, and the correlation coefficient between them is 0.958. Thus, the model established by the cloud server in this paper can accurately predict displacement and other underground engineering data, and the calculation results are reliable.
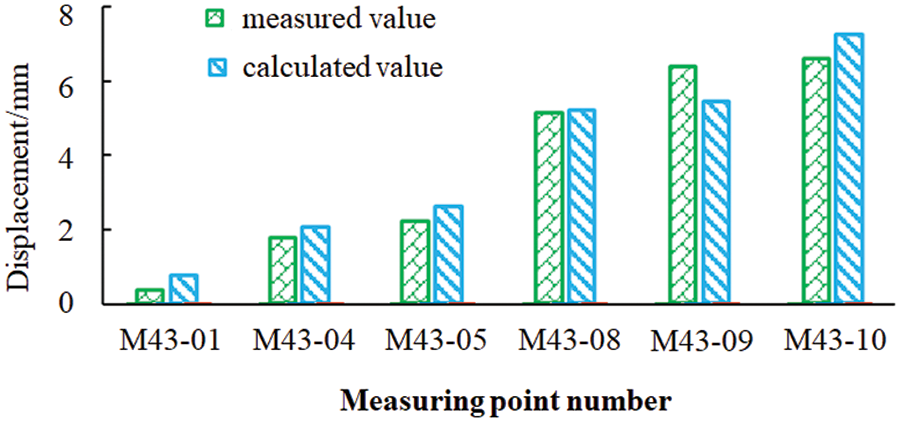
Figure 26: Comparison between the measured and calculated displacement increments of the characteristic points of the #3 electric generator after the fourth excavation (unit: mm)
The above analyses of the finite element results show that the distributions of deformation, stress and plastic zone around the caverns are reasonable, demonstrating that the developed modeling program can generate a workable finite element model in the cloud for engineering analysis.
Based on the powerful modeling function in Rhino modeling software, a modularized and parametric modeling program for underground engineering projects is developed using the Python programming language. The main modules of the modeling program include the modeling of 3D geological structures, underground engineering structures, and supporting structures as well as the meshing of geometric models. The geometries of common geological, engineering and supporting structures are parameterized to realize parametric modeling. In particular, the planar geological structures, various cross-sectional shapes of underground caverns, linings, steel support, bolts and anchor cables are designated as parametric modules in the modeling program, and the Griddle plug-in of Rhino software is used to facilitate the meshing of the geometrical model. In addition, the modeling program and numerical simulation are designed as a cloud server, which facilitates modeling, analyzing and visualizing on a web platform.
The modularized and parametric modeling program is used for the finite element simulation of the underground powerhouse of the Shuangjiangkou Hydropower Station, whose model contains curved geological surfaces, planar geological structures, some complicated and connected caverns and massive bolts and anchor cables. The program can generate this complicated model rapidly for simulation, and the simulation results are reasonable. The engineering application shows that the modularized and parametric modeling program exhibits high efficiency, and the generated model can fully reflect the terrain, geology, engineering and supporting structures with good element shapes. Thus, this modularized and parametric modeling program is applicable for three-dimensional finite element simulations and analyses.
Acknowledgement: The authors thank the editors and the reviewers for their suggestions.
Funding Statement: The Construction S&T Project of the Department of Transportation of Sichuan Province (Grant No. 2023A02); the National Natural Science Foundation of China (No. 52109135).
Author Contributions: The authors confirm contribution to the paper as follows: study conception and design: Li Zhuo, Jiaqi Wu; data collection: Yao Li, Jiaming Wu; analysis and interpretation of results: Jianliang Pei, Hongqiang Xie; draft manuscript preparation: Jiaqi Wu; funding acquisition: Huaizhong Liu. All authors reviewed the results and approved the final version of the manuscript.
Availability of Data and Materials: The data and materials adopted in this research is available from the corresponding author on reasonable requests.
Conflicts of Interest: The authors declare that they have no conflicts of interest to report regarding the present study.
References
1. Cheng, R., Chen, W., Hao, H., Li, J. (2022). Dynamic response of road tunnel subjected to internal Boiling liquid expansion vapour explosion (BLEVE). Tunnelling and Underground Space Technology, 123, 104363. https://doi.org/10.1016/j.tust.2022.104363 [Google Scholar] [CrossRef]
2. Hou, C. T., Yang, X. L. (2022). 3D stability analysis of tunnel face with influence of unsaturated transient flow. Tunnelling and Underground Space Technology, 123, 104414. https://doi.org/10.1016/j.tust.2022.104414 [Google Scholar] [CrossRef]
3. Liu, X., Wang, L., Zhou, X., Wang, J., Zhong, Z. et al. (2022). E-M calculation model and its application of calculating deformation in a new tunnel orthogonally undercrossing an existing tunnel. Tunnelling and Underground Space Technology, 123, 104418. https://doi.org/10.1016/j.tust.2022.104418 [Google Scholar] [CrossRef]
4. Meng, F., Chen, R., Xie, S., Wu, H., Liu, Y. et al. (2022). Excavation-induced arching effect below base level and responses of long-collinear underlying existing tunnel. Tunnelling and Underground Space Technology, 123, 104417. https://doi.org/10.1016/j.tust.2022.104417 [Google Scholar] [CrossRef]
5. Wang, X., Li, J., Zhao, X., Liang, Y. (2022). Propagation characteristics and prediction of blast-induced vibration on closely spaced rock tunnels. Tunnelling and Underground Space Technology, 123, 104416. https://doi.org/10.1016/j.tust.2022.104416 [Google Scholar] [CrossRef]
6. Zhao, M., Jiao, H., Huang, J., Li, H., Du, X. et al. (2022). Analytical solutions for circular tunnels under longitudinally propagating shear waves based on improved foundation beam models considering tangential interaction. Tunnelling and Underground Space Technology, 123, 104444. https://doi.org/10.1016/j.tust.2022.104444 [Google Scholar] [CrossRef]
7. Liao, J., Hou, Z., Haris, M., Tao, Y., Xie, Y. et al. (2020). Numerical evaluation of hot dry rock reservoir through stimulation and heat extraction using a three-dimensional anisotropic coupled THM model. Geothermics, 83, 101729. https://doi.org/10.1016/j.geothermics.2019.101729 [Google Scholar] [CrossRef]
8. Li, M., Han, Y., Wang, G., Yan, F. (2014). 3D multiscale integrated modeling approach of complex rock mass structures. Mathematical Problems in Engineering, 2014, 1–6. https://doi.org/10.1155/2014/867542 [Google Scholar] [CrossRef]
9. Li, M., Han, Y., Miao, Z., Gao, W. (2014). Alternative 3D modeling approaches based on complex multi-source geological data interpretation. Transactions of Tianjin University, 20(1), 7–14. https://doi.org/10.1007/s12209-014-2171-4 [Google Scholar] [CrossRef]
10. Xie, P., Chen, K., Skibniewski Mirosław, J., Wang, J., Hanbin, L. (2023). Parametric geological model update and probabilistic analysis of shield tunnel excavation: A borehole-based conditional random fields approach. Computers and Geotechnics, 157, 105349. https://doi.org/10.1016/J.COMPGEO.2023.105349 [Google Scholar] [CrossRef]
11. Erharter, G. H., Weil, J., Bacher, L., Heil, F., Kompolschek, P. (2023). Building information modelling based ground modelling for tunnel projects–Tunnel Angath/Austria. Tunnelling and Underground Space Technology incorporating Trenchless Technology Research, 135, 105039. https://doi.org/10.1016/J.TUST.2023.105039 [Google Scholar] [CrossRef]
12. Pinheiro, M., Emery, X., Miranda, T., Lamas, L., Margarida, E. (2021). Using geotechnical scenarios for underground structure analysis: A case study in a hydroelectric complex in northern Portugal. Tunnelling and Underground Space Technology, 111, 103855. https://doi.org/10.1016/J.TUST.2021.103855 [Google Scholar] [CrossRef]
13. Chen, T., Mitri Hani, S. (2021). Strategies for surface crown pillar design using numerical modelling–A case study. International Journal of Rock Mechanics and Mining Sciences, 138, 104599. https://doi.org/10.1016/J.IJRMMS.2020.104599 [Google Scholar] [CrossRef]
14. Vennes, I., Mitri, H., Chinnasane, D. R., Yao, M. (2020). Large-scale destress blasting for seismicity control in hard rock mines: A case study. International Journal of Mining Science and Technology, 30(2), 141–149. https://doi.org/10.1016/j.ijmst.2020.01.005 [Google Scholar] [CrossRef]
15. Li, H., Chen, W., Tan, X., Chen, E. (2022). Digital design and stability simulation for large underground powerhouse caverns with parametric model based on BIM-based framework. Tunnelling and Underground Space Technology, 123, 104375. https://doi.org/10.1016/j.tust.2022.104375 [Google Scholar] [CrossRef]
16. Xin, S., Wang, W., Zhang, N., Zhang, C., Yuan, S. et al. (2021). Comparative studies on control of thermal environment in development headings using force/exhaust overlap ventilation systems. Journal of Building Engineering, 38, 102227. https://doi.org/10.1016/J.JOBE.2021.102227 [Google Scholar] [CrossRef]
17. Li, C., Zhang, H., Li, M., Zhang, C., Wang, W. et al. (2021). Numerical study on dust suppression and cooling performance of an external spray system in load-haul-dump vehicles. Case Studies in Thermal Engineering, 27, 101332. https://doi.org/10.1016/J.CSITE.2021.101332 [Google Scholar] [CrossRef]
18. Zhao, K., Liu, Y., Li, Y., Ma, H., Hou, W. et al. (2022). Feasibility analysis of salt cavern gas storage in extremely deep formation: A case study in China. Journal of Energy Storage, 47, 103649. https://doi.org/10.1016/J.EST.2021.103649 [Google Scholar] [CrossRef]
19. Tang, W., Zhai, C., Xu, J., Sun, Y., Cong, Y. et al. (2021). The influence of borehole arrangement of soundless cracking demolition agents (SCDAs) on weakening the hard rock. International Journal of Mining Science and Technology, 31(2), 197–207. https://doi.org/10.1016/J.IJMST.2021.01.005 [Google Scholar] [CrossRef]
20. Yu, H., Liu, Y., Ma, H., Zhao, K., Liu, J. (2022). Pillar safety in shallow salt caverns by using numerical simulations. Journal of Energy Storage, 55, 105881. https://doi.org/10.1016/J.EST.2022.105881 [Google Scholar] [CrossRef]
21. Mreyen, A. S., Donati, D., Elmo, D., Donze, F. V., Havenith, H. B. (2022). Dynamic numerical modelling of co-seismic landslides using the 3D distinct element method: Insights from the Balta rockslide (Romania). Engineering Geology, 307, 106774. https://doi.org/10.1016/J.ENGGEO.2022.106774 [Google Scholar] [CrossRef]
22. Zhao, J., Konietzky, H. (2020). Numerical analysis and prediction of ground surface movement induced by coal mining and subsequent groundwater flooding. International Journal of Coal Geology, 229, 103565. https://doi.org/10.1016/j.coal.2020.103565 [Google Scholar] [CrossRef]
23. Song, Y., Chen, X., Zou, B., Mu, J., Hu, R. et al. (2022). Monitoring study of long-term land subsidence during subway operation in high-density urban areas based on DInSAR-GPS-GIS technology and numerical simulation. Computer Modeling in Engineering & Sciences, 134(2), 1021–1039. https://doi.org/10.32604/CMES.2022.021164 [Google Scholar] [CrossRef]
24. Yan, H., Liu, H., Li, Y., Zhuo, L., Xiao, M. et al. (2023). Inversion analysis of the in situ stress field around underground caverns based on particle swarm optimization optimized back propagation neural network. Applied Sciences, 13(8), 4697. https://doi.org/10.3390/APP13084697 [Google Scholar] [CrossRef]
Cite This Article
 Copyright © 2024 The Author(s). Published by Tech Science Press.
This work is licensed under a Creative Commons Attribution 4.0 International License , which permits unrestricted use, distribution, and reproduction in any medium, provided the original work is properly cited.
 Downloads
 Citation Tools