
 Submit a Paper
 Propose a Special lssue
 Open Access
ARTICLE

Probabilistic-Ellipsoid Hybrid Reliability Multi-Material Topology Optimization Method Based on Stress Constraint
1 College of Mechanical and Electrical Engineering, Qingdao University, Qingdao, 266071, China
2 National Engineering Research Center for Intelligent Electrical Vehicle Power System, Qingdao University, Qingdao, 266071, China
* Corresponding Author: Qinghai Zhao. Email:
(This article belongs to the Special Issue: Structural Design and Optimization)
Computer Modeling in Engineering & Sciences 2024, 140(1), 757-792. https://doi.org/10.32604/cmes.2024.048016
Received 25 November 2023; Accepted 11 January 2024; Issue published 16 April 2024
 View Full Text
 Download PDF
Abstract
This paper proposes a multi-material topology optimization method based on the hybrid reliability of the probability-ellipsoid model with stress constraint for the stochastic uncertainty and epistemic uncertainty of mechanical loads in optimization design. The probabilistic model is combined with the ellipsoidal model to describe the uncertainty of mechanical loads. The topology optimization formula is combined with the ordered solid isotropic material with penalization (ordered-SIMP) multi-material interpolation model. The stresses of all elements are integrated into a global stress measurement that approximates the maximum stress using the normalized p-norm function. Furthermore, the sequential optimization and reliability assessment (SORA) is applied to transform the original uncertainty optimization problem into an equivalent deterministic topology optimization (DTO) problem. Stochastic response surface and sparse grid technique are combined with SORA to get accurate information on the most probable failure point (MPP). In each cycle, the equivalent topology optimization formula is updated according to the MPP information obtained in the previous cycle. The adjoint variable method is used for deriving the sensitivity of the stress constraint and the moving asymptote method (MMA) is used to update design variables. Finally, the validity and feasibility of the method are verified by the numerical example of L-shape beam design, T-shape structure design, steering knuckle, and 3D T-shaped beam.Keywords
In practical engineering disciplines, like machinery, automotive, and aerospace, among others. Uncertainty factors, such as loadings, materials, and dimensional errors, are highly prevalent. These uncertain pieces of information inevitably lead to fluctuations in structural performance and even failures [1,2]. Therefore, reliability-based topology optimization (RBTO) is particularly crucial in structural design.
In structural topology optimization design, stress-constrained topology optimization poses significant challenges. During the solving process, there are singular problems, localized stress characteristics, and highly nonlinear stress constraints that need to be addressed [3–6]. Effective methods are required to solve problems. Xu et al. [7] proposed a design method for maximizing the geometrically nonlinear continuum stiffness with stress constraint. The method effectively reduces singularity issues by utilizing the discrete variable-based Bi-directional Evolutionary Structural Optimization (BESO) method. Lee et al. [8] proposed a method for lightweight design with maximum stress constraint, based on p-norm regularization, was proposed. The method improves the P-norm and addresses its limitations. Wu and Tseng [9] modified differential evolution (DE) and proposed a new stress-based binary decomposition mechanism, which is more efficient in structural topology optimization. Deaton et al. [10] optimized thermoelastic structures with stress constraints. However, the aforementioned studies on stress-constrained are primarily focused on deterministic topology optimization (DTO). Silva et al. [11] compared three topology optimization methods considering stress constraint under uncertain loads and provided the similarities and differences between the different methods. This provides some insights into the direction of stress-constrained optimization.
In general, structural topology optimization is mostly carried out under the condition of deterministic factors, but there are many uncertainties in practical engineering, which mainly include stochastic uncertainty and epistemic uncertainty [12–14]. The former is objective and usually takes a probabilistic approach [15]. The latter is primarily attributed to subjective constraints or insufficient information obtained through non-probabilistic methods. To solve the influence of uncertain factors on structural failure, RBTO is applied to structural optimization design. Kharmanda et al. [16] introduced reliability constraints into the topology optimization model. Wang et al. [17] proposed a framework based on non-probabilistic RBTO. Meng et al. [18] proposed an RBTO method based on fuzzy and probabilistic theories and an efficient single-loop optimization method, which decomposed multi-group optimization problems into deterministic optimization problems. Xia et al. [19] proposed a sequential strategy for RBTO. Wang et al. [20] applied RBTO to the optimization of fail-safe structures using moving morphable bars for the structural fail-safe design. However, the above-mentioned studies mostly focus on single materials. Multi-material structures have wide application potential in automotive, aerospace, and other engineering fields. The application of multiple materials often allows for the full utilization of different material properties, while also enabling better cost control and achieving lightweight designs [21,22].
To better meet the demands of structural applications, the applications of multiple materials are developing day by day. Xu et al. [23] proposed a dynamic response RBTO method based on the BESO approach and validated the effectiveness of his method. Zhao et al. [24] considered the influences of factors such as incomplete measurements, inaccurate information, and limited knowledge, and developed a reliability-constrained multi-material topology optimization method. Doan et al. [25] proposed a method to meet structural stiffness requirements. Chen et al. [26] proposed a topological formulation for thermos-elastic structures with combined effects of mechanical loads and thermal loads under transient conditions. The formulation incorporated stress constraints and provided clear topological structures for multi-material combinations at different temperatures. Cheng et al. [27] proposed a multi-material topology optimization method based on non-probabilistic reliability and verified its effectiveness, but only for the cognitive epistemic uncertainty, the influences of stochastic uncertainty and epistemic uncertainty on structural design are not considered at the same time.
A probability-ellipsoidal hybrid RBTO multi-material topological optimization method with stress constraints is proposed to solve the structural failure problem caused by stochastic uncertainty and epistemic uncertainty of mechanical loads in multi-material structural design. Combine the probabilistic model with the non-probabilistic ellipsoid model. Sequential optimization and reliability assessment (SORA) is combined with the stochastic response surface method and sparse grid technique to obtain accurate probable failure point (MPP) and search for reliable structural design. The rest of the paper is structured as follows: Section 2 establishes the ordered solid isotropic material with penalization (ordered-SIMP) multi-material interpolation model. Section 3 describes the multi-material topology optimization (MMTO) problem. Section 4 establishes the model of MMTO based on stress constraints. Section 5 introduces the probabilistic model and the non-probabilistic ellipsoid model. A probability-ellipsoid hybrid reliability multi-material topology optimization mathematical model with stress constraints is established. Stochastic response surface and sparse grid technology are introduced. Section 6 presents sensitivity analysis and filtration. Section 7 expounds SORA strategy method. In Section 8, the proposed method is compared with DTO through numerical examples. Section 9 presents the conclusion and prospect.
2 Multi-Material Interpolation Model
For the MMTO with stress constraint, it is essential to make a discretization of the design region and implement a normalization approach to address material density and modulus of elasticity. The mathematical model is expressed as follows:
where ρjNe and EjNe are the density of material j and elastic modulus, respectively. ρj and Ej are the actual density and elastic modulus, respectively. ρmax and Emax are the maximum density and elastic modulus.
According to ordered-SIMP [28], the mathematical model is as follows:
where Eei denotes the elastic modulus of multi-material interpolation, PI and PII are the elastic modulus interpolation factor and the stress penalty factor, respectively, ΑEi and ΒEi are the proportionality coefficient and translation coefficient, respectively, can be expressed as follows:
where E j+1Ne is the elastic modulus of j+1 after interpolation, and Ne is expressed as a total number of elements. The three-material interpolation model is shown in Fig. 1. The discrete MMTO problem is transformed into an optimization problem with continuous variable values between [0,1].

Figure 1: Multi-material interpolation model based on ordered-SIMP
3 Description of Multi-Material Topology Optimization Problem
In the structural design, the multi-material structure uses different materials to adapt to the performance requirements of different locations, breaking through the limitations of a single-material structure. It has higher overall and local performance. To give full play to the performance advantages of multi-material structures, MMTO is used to obtain structures with optimal performance that meet the design requirements [29]. The development of additive manufacturing also enables the MMTO. This paper seeks an optimal multi-material structure design under stress constraint and volume minimization. The multi-material structure design is shown in Fig. 2.

Figure 2: Description of the design domain for multi-material elastic structure
For the elastic structure under the structure field, the total equilibrium equation is:
where K(ρ), U(ρ) and Fm are respective global stiffness matrix, node displacement vector and node-independent external mechanical load vector, respectively.
K(ρ) consists of the element stiffness matrix, as follows:
The element stiffness matrix is expressed as follows:
where Be is the element strain displacement matrix, h is the planar element thickness, De is the elastic matrix of the element material, it is expressed as follows:
where D0 is the elastic matrix of solid material, and E0 is the initial modulus of elasticity. A two-dimensional problem is expressed as follows:
where μ is the Poisson’s rate.
4 Deterministic Topology Optimization Formulation
4.1 Mathematical Model of Deterministic Topology Optimization
For the DTO of elastic structures, stress constraint is taken into account [30]. The minimization of volume is taken as the objective function. The mathematical model of DTO is expressed as follows:
where V(ρ) is objective function volume, ve is the volume of the element, σeVM is von Mises stress for each element, and σs is the material yield stress limit.
4.2 Global P-Norm Stress Measure
The phenomenon of singular optimal solution exists in stress constraint, computation surge caused by a considerable amount of localized stress limitations, and the profoundly non-linear nature of stress constraint [31,32]. Therefore, it is necessary to use different power indexes to punish stress. The element stress penalty scheme is expressed as follows:
where σe (ρ) is element stress after interpolation, σe0 is initial element stress, it is expressed as follows:
For two-dimensional problems,
where σex and σey are the stress components in the x and y directions of element e, respectively, and τexy is the shear stress components on the xy planes of element e.
Based on the equivalent stress expression, von Mises stress is expressed as follows:
where σeVM is the element von Mises stress. According to the fourth strength theory, the matrix of coefficient M is expressed as follows:
To reduce the burden of local stress calculation, the aggregation p-norm function is expressed as:
where p is the stress norm parameter, σPN is the integrated global stress, it is equal to max (σeVM/σs).
However, increasing the value of p enhances the nonlinearity of the condensation function, which can result in oscillations during the optimization solution process [33]. To overcome the defect of p, the constraint equation of the correction coefficient is introduced, expressed as:
where the correction factor can be expressed as:
5 Probabilistic-Ellipsoid Hybrid Reliability Topology Optimization with Stress Constraint
5.1 Description of Variables of Probability-Ellipsoid Hybrid Reliability Model
In practical engineering, there are uncertain variables, such as the geometric size of the structure, and the randomness of material properties and loads. Some uncertainties can be characterized by probability, but some need to be treated as bounded uncertainties due to the lack of sufficient sample data [34]. In this case, random variables and uncertain but bounded variables can be combined to solve similarly complex uncertainty problems [35]. Probability theory and ellipsoid model are used to describe the random variation of X = (X1, X2, …, Xn) T and uncertain variables of Y = (Y1, Y2, …, Yn)T.
where fX (Xi) is the probability density function of random variable X, EYo, A expresses n-dimensional ellipsoidal uncertainty field, Y0 is the center of the ellipsoid, A is the characteristic matrix, Y= (Y1,Y2,…,Yn)T is the central point vector of an ellipsoidal set of uncertain variables, Rn is n-dimensional space.
Fig. 3 shows a two-dimensional ellipsoid model. To determine such an ellipse, it is necessary to know the central coordinates of the ellipse, the length of the two half-spindles, and the Angle θ (0 ≤ θ ≤ 𝜋/2) between the Y1 axis and the first axis. By combining a matrix with geometric quantity, numerical characteristics such as mean value, variance, and covariance of ellipsoid variables can represent geometric quantity [36,37]. According to the two-dimensional ellipsoid model diagram, the ellipsoid is projected on the Yi (i = 1, 2) axis as a bounded line segment, its interval can be denoted as YiI = [Yi1, Yi2]. The mean Yia, radius YiR, and variance YiR of the ellipsoidal variables Yi can be defined as:

Figure 3: Two-dimensional ellipsoid model
Through the above elliptic numerical features, the covariance matrix C of an n-dimensional ellipsoid is expressed as follows:
where the covariance is expressed as follows:
The characteristic matrix of elliptic model A is expressed as follows:
When constructing an elliptical model with sample data, there are infinitely many ellipses that satisfy the condition of including all sample data Y(r) (r = 1, 2, …, s). When high-quality samples accurately reflect the boundaries of the parameters, among the countless ellipses that satisfy the condition, we select the one with the smallest volume. Therefore, the construction of the elliptical model can be transformed into an optimization problem, expressed as:
Although the ellipsoidal model is well established, it should be normalized into a spherical model before uncertainty quantification. The uncertainty principle of bounded uncertain parameter Y = (Y1, Y2, ..., Yn)T can be expressed:
The equivalent ellipsoidal model obtained in U-space is expressed as follows:
where AU is the characteristic matrix of the equivalent ellipsoidal modal model in U-space. Performing Cholesky decomposition on the characteristic matrix AU, expressed as:
where Λ is the eigenvalue matrix of AU, Ι is an identity matrix and P is an orthogonal matrix.
Introduce a normalized vector ξ. The equivalent ellipsoid model can be transformed into the unit sphere model Eξ, expressed as:
As shown in Fig. 4, the ellipsoidal model is transformed into the spherical model.

Figure 4: Ellipsoid standardized process
Through transformation, the variable relationship between the standard ξ space and the Y space can be expressed as follows:
Further transformation, Y can be expressed as follows:
where diag (Yw) is an n-dimensional diagonal matrix with its diagonal elements.
5.2 Mathematical Model of Probability-Ellipsoid Reliability Topology Optimization
Considering both probability and non-probability cases in uncertainty, a probabilistic - ellipsoid hybrid reliability topology optimization mathematical model was established, expressed as:
where V (ρ) is objective function volume, ve is the volume of elements, X and Y are vectors of random variables and vectors of ellipsoid variables, respectively, G is the limiting state function, Pr is the symbol of probability, Pf is the symbol for the probability of failure, Pf* is allowable failure probability.
5.3 The Index of Hybrid Reliability
In probability and ellipsoid hybrid reliability analysis, the limit state function G is expressed by the structural carrying capacity as follows:
where R and S are the structural resistance and the load variable [38]. Considering that uncertainty variables may result in von Mises stress exceeding the material’s yield strength limit at certain locations in the structure, leading to the possibility of failure. Therefore, the term R denotes the yield strength of the material σs, and S denotes σeVM. The failure or critical region is denoted as: G (ρ, X, Y) = 0, failure state and safety state are denoted as: G (ρ, X, Y) < 0 and G (ρ, X, Y) > 0. As shown in Fig. 5, u1 and u2 are standard normal random variables, ξ1 and ξ2 are standard variables.
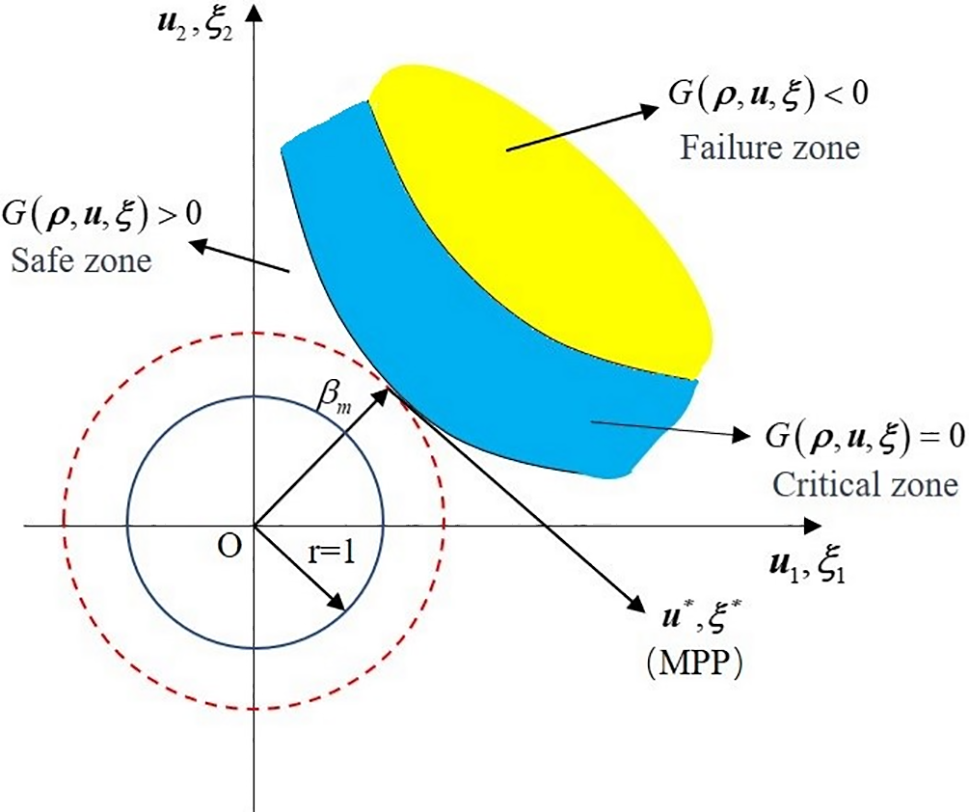
Figure 5: Geometric description of the hybrid reliability metric
The first-order reliability method (FORM) is an approximate analytical method [39,40]. It can be employed to convert the calculation of failure probabilities into the determination of mixed reliability indices βm, which is the minimum distance from the initial position to the G with the most probable point (MPP) being searched. Due to its simplicity and efficiency, FORM has found wide application in reliability analysis research. By utilizing the FORM, it is possible to transform the constraint of failure probabilities into the constraint of mixed reliability indices, expressed as:
where
Random variable X can be converted into a standardized normal random variable u through the normalization method. For uncertain variables Y, for which it is not easy to get distribution information. Therefore, the aforementioned ellipsoidal standardization method can be used to transform them into a standard ξ variable, expressed as:
where μX and σX donate the mean and the standard deviation associated with X.
5.4 Search for the Most Probable Failure Point
In reliability-based topology optimization design, when conducting reliability analysis, it is necessary to use the stochastic response surface method to approximate the construction of the objective function, facilitating the search for the MPP [41]. The sample points required for the stochastic response surface method are selected based on sparse grid techniques, which significantly enhance the accuracy of the constructed model and provide more precise results.
In complex structure analysis, the expression of the objective function is often fuzzy, which brings difficulty to conventional calculation. The stochastic response surface method approximates the function relationship between variables and outputs in uncertain problems through specialized sampling and polynomial expansion. For random output response values Y that follow a standard normal distribution, they can be expressed by using Hermite polynomials as follows:
where a0, al1, al1l2, and al1l2l3 are undetermined coefficients, k denotes the number of random variables, and yn denotes the Hermite polynomial of order n. For example, when k = 3, n = 3, response surface model can be expressed as follows:
The key to the application of the response surface method lies in the determination of undetermined coefficients. By applying the least squares method, the solution for undetermined coefficients is expressed as follows:
where G is the sampling point limit state function vector, and f is the sample point base matrix.
To obtain random response surface sample points. The sparse grid technique is applied to uncertainty analysis, utilizing the Smolyak algorithm-based sparse grid method [42]. Tensor product rules based on sparse grids can be expressed as follows:
where l denotes accuracy, d denotes dimensionality of the variable space, Q (f) denotes sparse grid integration formula,
Sparse grid techniques generate different types of sparse grids depending on the integration rule used. This paper troughed the Cleanshaw-Curtis to select samples. Based on the Gauss-Chebyshev integration rule [43], the experimental sample points selected based on the Clenshaw-Curtis sparse grid are shown in Fig. 6 in this paper.

Figure 6: Sample space for experimental design (d = 3; m = 25)
6 Sensitivity Analysis and Filtration
By introducing Lagrange multipliers, the Lagrange function for stress constraint can be established as follows:
The sensitivity of the design variable ρe is expressed as follows:
According to the chain rule, the sensitivity of the design variable
According to Eq. (16), the P function provides the derivative information of the von Mises stress concerning each component, expressed as:
For a plane structure problem, the derivative of element stress concerning stress components can be calculated as follows:
Combine Eqs. (2), (11) and (12), the derivative of stress components concerning design variables can be obtained as follows:
Consider the load design independence and bring Eqs. (45) into (42), then substitute them into Eq. (41) to obtain:
Expand Eq. (50) and merge terms of the same kind, expressed as:
Eliminate the derivation of displacement to the design variable and establish the adjoint vector equation:
Then the corresponding sensitivity is:
where the sensitivity of the stiffness matrix is expressed as follows:
The sensitivity of the total volume concerning the design variables is expressed as follows:
To avoid excessive intermediate density units, density filtering technology is used to suppress them, which is expressed as:
where xi is the design variable of the unit, Ne is a collection of units in the neighborhood of element e, and Hei is a linear distance function.
To control the minimum size of the topology structure and obtain a clear topology configuration, the Heaviside function is used to map the element density variables [44]. The mapping relationship is expressed as follows:
where Ψ is the mapping parameter, and θ is the mapping threshold parameter. Density mapping variables are calculated by applying density filters and mapping functions to design variables. For sensitivity consistency, the chain rule is expressed as follows:
where s is the objective function or constraint function.
7 Sequential Optimization and Reliability Assessment (SORA)
The probabilistic-ellipsoid hybrid reliability-based topology optimization with SORA includes two sequentially executed parts: DTO and post-analysis of reliability. The main process consists of the following steps:
Step 1: Perform DTO with the mean values of the uncertain variables treated as deterministic parameters.
Step 2: The Performance Measure Approach (PMA) is used for reliability analysis to solve for the MPP that satisfies the required level of reliability [45]. The random variables are modified.
Step 3: According to the DTO model, the optimal structure is determined by solving the optimization problem. In each loop, the information obtained from the MPP in the previous cycle is used to update the topology optimization model until the desired performance metrics are achieved and convergence is reached.
The mathematical model is expressed as follows:
where h (ρ(n)) denotes the deterministic constraint function, n denotes the number of loops, X*(n-1) and Y*(n-1) denote the MPP in the uncertain variable space relative to the limit state in the (n-1) loop. Both are obtained through the transformation of the corresponding standard variable space’s MPP point u*(n-1) and ξ*(n-1), expressed as:
In the (n-1) loop, through inverse reliability analysis to obtain u*(n-1), mathematical model is expressed as follows:
In solving the optimization problem with the aforementioned equality constraint, an additional approach called the advanced mean value (AMV) was used, in addition to conventional mathematical programming algorithms. The iteration format is expressed as follows:
The specific optimization flowchart is shown in Fig. 7.

Figure 7: Hybrid reliability topology optimization workflow diagram
Three examples of structures are presented, namely the L-shaped beam, T-shaped structure, and steering knuckle of the vehicle, considering stress constraint in the probabilistic-ellipsoid hybrid multi-material reliability-based topology optimization were selected to validate the validity of the proposed method. The Young’s modulus E0 = 2.1 × 10⁵, Poisson’s ratio μ = 0.3, p-norm factor p = 8, stress penalty factor PII = 0.8, density penalty factor PI = 3. The density of the initial element is 1 and the initial volume of the structure is V0. V/ V0 is the fraction of the initial volume of the structure to the volume of the optimized structure (V). The ordered-SIMP method is applied to normalize the three selected materials. The normalization scheme for material densities is presented in Table 1.

8.1 2D L-Shaped Beam Structure
As shown in Fig. 8. The design domain has dimensions of 100 mm × 100 mm and a thickness of 1 mm. Its number of quadrilateral elements is 6400. The L-shaped beam structure is clamped at the top end, and mechanical loads are applied to the upper right end of the structure. The loads are uniformly distributed over six adjacent nodes to prevent stress concentration. Mechanical loads at each node: Fxm, Fy1m, and Fy2m. The stress constraint value is 240 MPa.

Figure 8: Geometric configuration of an L-shaped beam
In reliability analysis, the random variable is Fxm. It fits the normal probability distribution and the standard deviation is 5% of the mean. Fy1m and Fy2m are non-probabilistic ellipsoid variables. As shown in Fig. 9, A is the ellipsoidal eigenmatrix and Y0 is the center of the ellipsoid. Mechanical loads: Fxm = 50 N, Fy1m = 350 N, Fy2m = 100 N. The response surface coefficients for the build are shown in Table 2, ξ1, ξ2 and u standardized variable values for the corresponding variables Fy2m, Fy1m, and Fxm. The sensitivity values to random variables are shown in Table 3. The three variables, Fy2m, Fy1m, and Fxm have different degrees of influence on the output.

Figure 9: Ellipsoidal model


As shown in Fig. 10. The stress is concentrated at the corner of the L-shaped beam, so it is necessary to consider stress constraint. Fig. 11 shows the DTO process involves the variation of stress distribution throughout the configuration. As the iteration process continues, the stress distribution changes accordingly, and the stress concentration is relieved. As shown in Fig. 12, material A occupies the majority of the region. Due to the higher stress distribution at the corners of the structure, the concentration of materials is more pronounced, with the presence of material C and a small amount of material B. There is also a small amount of material B distributed in other parts of the beam to accommodate the increase in local stress.

Figure 10: Initial Von Mises stress distribution diagram

Figure 11: Structural evolution for DTO with stress distribution (a–d)
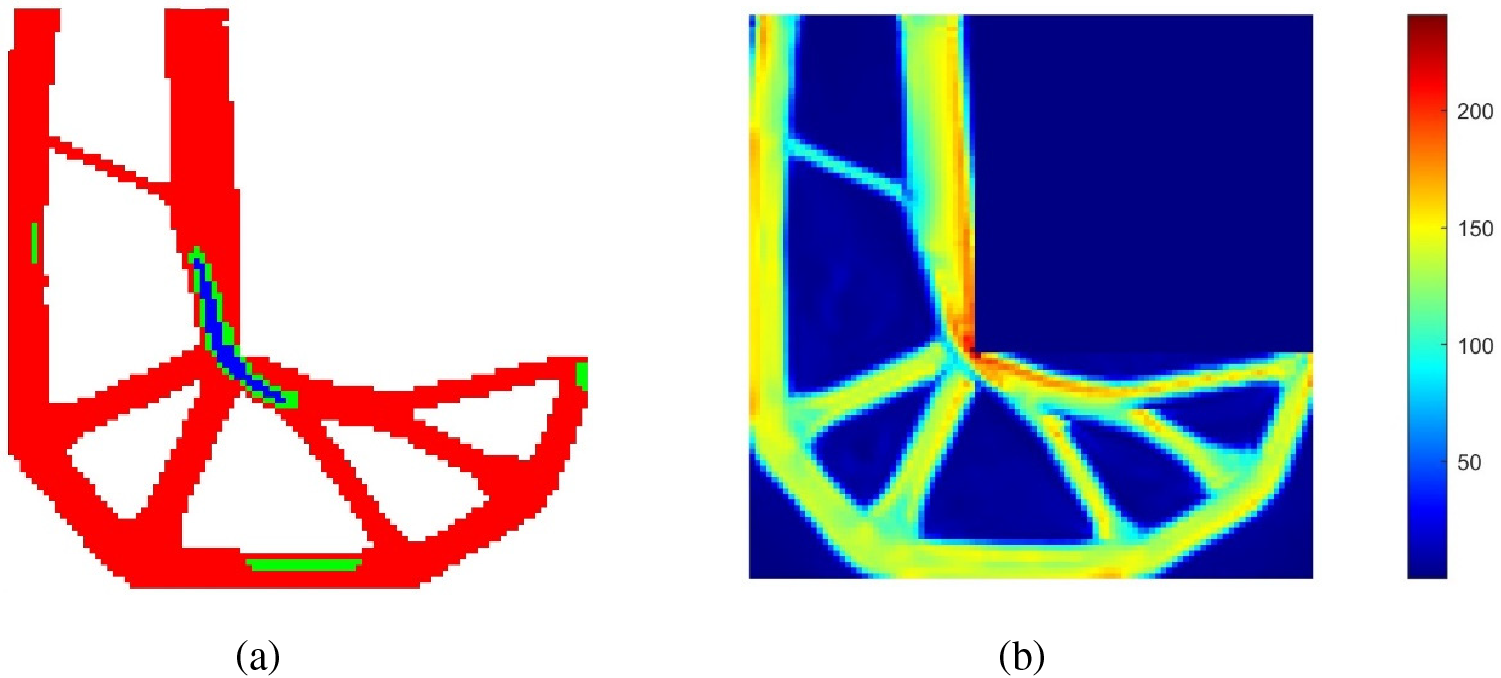
Figure 12: DTO results of structure: (a) Optimized structure, (b) Von Mises stress distribution
Table 4 shows the configuration of the structure changes of the probability-ellipsoid hybrid reliability topology optimization process. The adopted posterior decoupling strategy also plays a corresponding role. During the three external cycles, the first step in each cycle is to continue the optimization based on the results obtained in the previous cycle. Both the structure and material distribution undergo significant changes and finally converge to the optimal configuration. Increasing the distribution of intermediate materials has a more significant effect in obtaining a more reliable configuration. The resulting configuration of RBTO is shown in Fig. 13, the stress concentration is alleviated. Materials A and B constitute a substantial proportion of the overall configuration. Due to the high level of stress distribution at the corners, there is a higher concentration of materials in those areas. Material C is primarily concentrated at the corners to adapt to high levels of stress distribution.


Figure 13: RBTO results of structure (
Comparing Figs. 12 and 13, based on the optimization results of RBTO and DTO,both RBTO and DTO have alleviated stress concentration. However, as shown in Fig. 14, the result of RBTO has a greater distribution of materials B and C, indicating structural changes. The structure becomes more reliable.

Figure 14: The proportion of materials in the optimized structure: (a) DTO and (b) RBTO
As shown in Table 5, RBTO, compared to DTO, resulted in a 10.5% increase in volume ratio in the topology optimization results, and the reliability index has improved. The reliability index of DTO approaches zero, indicating a higher probability of structural failure. Then RBTO shows a higher distribution of materials in the resulting configuration compared to DTO. Although the maximum stress changes are relatively small, there is indeed a reduction and the stress distribution in the structure becomes more uniform. Therefore, the proposed approach can significantly enhance structural reliability.

Fig. 15 shows the iteration curves for DTO and RBTO. Compared with DTO, under stress constraints, RBTO describes uncertainty variables by probability and ellipsoid models, takes into account the uncertainty of mechanical load, and obtains a more reliable structure between the uncertainty domain of structural parameters and the fault domain. Therefore, the maximum von Mises stress of RBTO fluctuates less during iteration, once again highlighting the necessity and effectiveness of reliability analysis for elastic structural optimization problems with stress constraint.

Figure 15: Volume fraction and maximum von Mises stress iteration curves: (a) DTO, (b) RBTO
As shown in Fig. 16, the design domain has dimensions of 120 mm × 80 mm and a thickness of 1 mm. Its number of quadrilateral elements is 6000. The bottom of the T-shaped structure is clamped. Fxm is applied at the top midpoint of the structure, Fy1m and Fy2m are applied in the upper left 1/6 and upper right 1/6 of the structure. Fxm = 180 N, Fy1m = 280 N, Fy2m = 200 N. The stress-constraint value is 245 MPa.

Figure 16: Geometric configuration of T-shaped structure
In reliability analysis, the random variable is Fxm. It fits the normal probability distribution and the standard deviation is 10% of the mean. Fy1m and Fy2m are ellipsoid variables. As shown in Fig. 17, A is the ellipsoidal eigenmatrix and Y0 is the center of the ellipsoid. The response surface coefficients for the build are shown in Table 6, taking

Figure 17: Ellipsoidal model

The initial stress distribution of the structure is shown in Fig. 18. The stress is concentrated at the corners of the T-shaped structure, so it is necessary to consider stress constraint. Fig. 19b shows the stress concentration is significantly alleviated through DTO. As shown in Fig. 19a, material A occupies the majority of the region. In the higher stress distribution, the concentration of materials is more pronounced, with the presence of material C and material B. There is also a small amount of material B distributed in other parts of the beam to accommodate the increase in local stress. As shown in Figs. 20 and 21, materials A and B occupy the majority of the area in the reliability analysis. Due to the high stress level at the bottom and corner of the structure, the concentration of materials is more pronounced, with the presence of material C and material B. In other parts of the structure, there is also a small amount of material B distributed to accommodate the increased local stress.

Figure 18: Initial stress distribution diagram

Figure 19: DTO results of structure: (a) Optimized structure; (b) Von Mises stress distribution

Figure 20: RBTO results of optimized structure: (a)

Figure 21: RBTO results of von Mises stress distribution: (a)
In combination with Fig. 22, it would be more visually intuitive to observe the changes in structure and material distribution under DTO and different reliability indices. In the results of RBTO, there is a higher distribution of materials B and C, and these materials are distributed more extensively in regions with higher stress levels. The structure changes. With the increase in the reliability index, there is an increasing distribution of materials B and C and the structure has significant changes. As shown in Table 7, comparing the results of DTO and RBTO with three different reliability indices. The reliability index of DTO approaches zero, indicating a higher probability of structural failure. The RBTO results with three different reliability indices show an increase in volume ratio compared to the DTO topology optimization results. Moreover, as the reliability index increases, the optimization results exhibit a corresponding increase in volume. In summary, compared to DTO, RBTO shows significant differences in both the structure and material distribution and has an improved reliability of the structure. Under the selected reliability index, as the reliability index increases, the structure becomes more reliable.


Figure 22: The proportion of materials in the optimized structure: (a) DTO, (b–d) RBTO

Fig. 23 shows the iteration curve graphs for DTO and RBTO with three different reliability indices. RBTO shows smaller fluctuations in the maximum von Mises stress during the iteration process. With the increase of the reliability index, the distance between the domain of uncertainty and the fault domain allowed by the structure’s parameter changes becomes larger. Therefore, the obtained structure is more reliable, the iteration converges faster.


Figure 23: Volume fraction and maximum von Mises stress iteration curves: (a) DTO, (b–d) RBTO
8.3 Steering Knuckle Structure
As a crucial component of the automotive suspension system, the steering knuckle plays a vital role in the steering and braking processes of a vehicle. It directly bears the vertical, lateral, and longitudinal forces from the road surface, which are transmitted to the wheels and further conveyed to other components through the steering knuckle. Due to its function, the steering knuckle needs to possess high strength and operate under complex working conditions. As shown in Figs. 24 and 25, taking the steering knuckle of a Formula racing car as the research subject, considering its typical design.

Figure 24: (a) The typical style and assembly relationship of the steering knuckle, (b) Front view of the steering knuckle model

Figure 25: (a) Two-dimensional design domain of the steering knuckle and (b) Initial Von Mises stress distribution diagram
The steering knuckle experiences complex loading conditions, particularly in typical combined steering and braking scenarios. It primarily undergoes vertical, lateral, and longitudinal loads, with fixed constraints applied at the wheel hub bearing mounting holes.
To simplify the calculations, the design of the structure is illustrated in Fig. 25a. The steering knuckle structure has a thickness of 1 mm and consists of 2444 quadrilateral elements. The red-colored positions form a complete circle in which the structure is clamped and mechanical loads are uniformly distributed around the 6 bolt holes. Fx1m= Fx2m= Fx3m= Fx4m= Fy1m= Fy2m= 100 N, Fx5m= Fx6m= Fy3m= Fy4m= 70 N. The stress-constraint value is 235 MPa.
In reliability analysis, the random variable is Fy3m. It fits the normal probability distribution and the standard deviation is 5% of the mean. Fx5m and Fx6m are ellipsoid variables. As shown in Fig. 26, A is the ellipsoidal eigenmatrix and Y0 is the center of the ellipsoid. The response surface coefficients for the build are shown in Table 8, ξ1, ξ2 and u standardized variable values for the corresponding variables Fx5m and Fx6m.

Figure 26: Ellipsoidal model

As shown in Fig. 25b, the structure has a significant stress concentration, so it is necessary to consider stress constraints. Fig. 27b shows the stress concentration is significantly alleviated through DTO. As shown in Figs. 28a and 29, materials A and C occupy the majority of the region. The region with higher stress levels exhibits a more pronounced concentration of material B.

Figure 27: DTO results of steering knuckle structure: (a) Optimized structure, (b) Von Mises stress distribution

Figure 28: RBTO results of steering knuckle (

Figure 29: The proportion of three materials in the optimized structure: (a) DTO and (b) RBTO
Comparing Figs. 27 and 28, the optimization results from RBTO and DTO indicate that the stress concentration is alleviated. But materials B and C are distributed more prominently, and structure has significant changes for RBTO compared to DTO.
As shown in Table 9, compared to DTO, RBTO results in an increase in volume ratio in the optimized topology, and the reliability index has improved. The reliability index of DTO approaches zero, indicating a higher probability of structural failure. The results obtained from RBTO show a higher distribution of material B. Although the maximum stress changes are relatively small, there is indeed a reduction. Therefore, the proposed approach can significantly enhance structural reliability.

Fig. 30 shows the iteration curves for DTO and RBTO. During the iterative process, RBTO effectively reduces the maximum von Mises stress, reaching convergence and showing smaller fluctuations in the maximum. So, reliability analysis is necessary and effective for elastic structural optimization problems with stress constraints.

Figure 30: Volume fraction and maximum von Mises stress iteration curves: (a) DTO, (b) RBTO
As shown in Fig. 31. The design domain has dimensions of 80 mm × 50 mm × 4 mm. The loads are uniformly distributed over five adjacent nodes. Mechanical loads at each node: Fx1m, Fx2m, and Fym. The stress constraint value is 235 MPa.
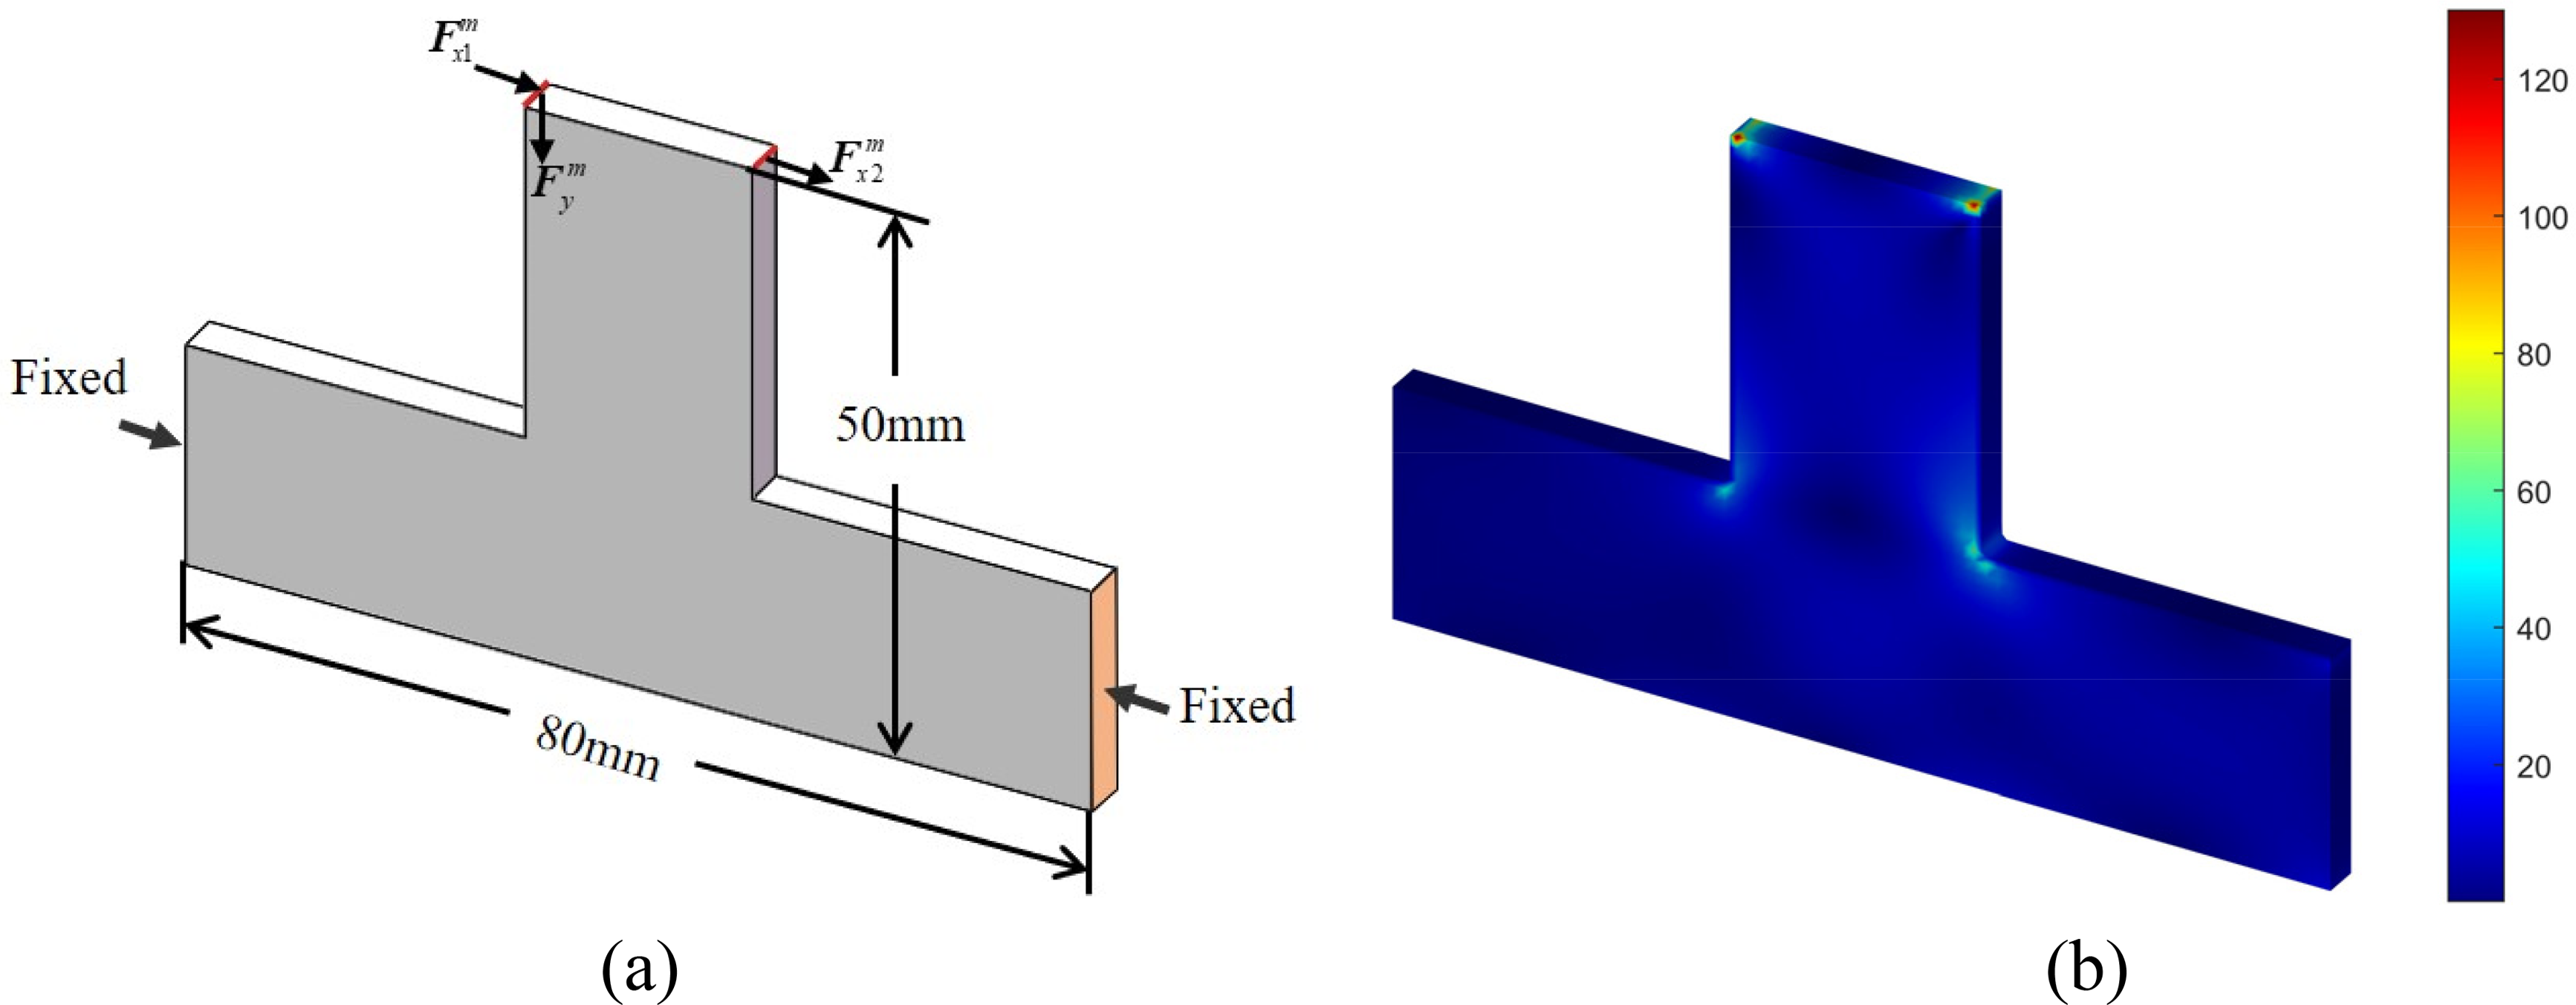
Figure 31: Geometric configuration of T-shaped structure
In reliability analysis, the random variable is Fx2m. It fits the normal probability distribution and the standard deviation is 10% of the mean. Fx1m and Fym are non-probabilistic ellipsoid variables. As shown in Fig. 32, A is the ellipsoidal eigenmatrix and Y0 is the center of the ellipsoid. Mechanical loads: Fx1m = 45 N, Fx2m = 30 N, Fym = 30 N. The response surface coefficients for the build are shown in Table 10, ξ1, ξ2 and u standardized variable values for the corresponding variables Fx2m, Fx1m, and Fym.

Figure 32: Ellipsoidal model

Compared with Figs. 31, 33, 34, and Table 11, the optimization of RBTO and DTO alleviates the stress concentration. Compared with DTO, RBTO has a higher reliability index as the structure volume increases, the distribution of material B and C increases, and the optimized structure is more reliable. As shown in Figs. 35 and 36, the proportion of B and C materials increased after RBTO and the RBTO stress constraint iteration curve can converge faster. The example further verifies the feasibility and effectiveness of the proposed method in 3D structure optimization.

Figure 33: DTO results of steering knuckle structure: (a) Optimized structure, (b) Von Mises stress distribution

Figure 34: RBTO results of steering knuckle structure: (a) Optimized structure, (b) Von Mises stress distribution


Figure 35: The proportion of materials in the optimized structure: (a) DTO and (b) RBTO

Figure 36: Volume fraction and maximum von Mises stress iteration curves: (a) DTO, (b) RBTO
This paper integrates reliability analysis and ordered-SIMP material interpolation model into stress-constrained topology optimization of multi-material structures under mechanical loads. By considering mechanical loads as uncertain variables and combining probability and ellipsoid models, the conclusions of the numerical example are as follows:
(1) Compared with DTO, hybrid RBTO (SORA), considering stochastic uncertainty and epistemic uncertainty, alleviates the stress concentration while increasing the volume of the structure and having more material distribution in the area with higher stress level, reduces the probability of structural failure caused by parameter uncertainty, and the structure has higher reliability.
(2) Based on the iteration curves of the objective function and the maximum von Mises stress, the method shows stable convergence. Among the selected reliability indicators, as the reliability indicator increases, the topological structure of the design exhibits variations. The volume ratio increases, and there is a greater distribution of high-performance materials, resulting in a more reliable structure.
(3) Hybrid RBTO (SORA) combined with stochastic response surface and sparse grid technology can effectively achieve accurate MPP search, which has important practical significance in solving stress constraint problems under external load stochastic uncertainty and epistemic uncertainty.
(4) The aforementioned examples all involve single-field topology optimization of structural domains. Further exploration can be done by incorporating multi-field coupling in the optimization process in future studies to enhance the proposed method.
Acknowledgement: The authors are thankful for Professor Krister Svanberg for the MMA program made freely available for research purposes and the anonymous reviewers for their helpful and constructive comments.
Funding Statement: This work is supported by the National Natural Science Foundation of China (Grant 52175236).
Author Contributions: The authors confirm contribution to the paper as follows: study conception and design: Z. Mao, Q. Zhao, L. Zhang; data collection: Z. Mao; analysis and interpretation of results: Z. Mao, Q. Zhao; draft manuscript preparation: Z. Mao, Q. Zhao. All authors reviewed the results and approved the final version of the manuscript.
Availability of Data and Materials: The data that support the findings of this study are available from the corresponding author upon reasonable request.
Conflicts of Interest: The authors declare that they have no conflicts of interest to report regarding the present study.
References
1. Coelho, L., Lucor, D., Fabbiane, N., Fagiano, C., Julien, C. (2023). Multi-scale approach for reliability-based design optimization with metamodel upscaling. Structural and Multidisciplinary Optimization, 66, 205. [Google Scholar]
2. Habashneh, M., Rad, M. M. (2023). Reliability based topology optimization of thermoelastic structures using bi-directional evolutionary structural optimization method. International Journal of Mechanics and Materials in Design, 19, 605–620. [Google Scholar]
3. Le, C., Norato, J., Bruns, T., Ha, C., Tortorelli, D. (2010). Stress-based topology optimization for continua. Structural and Multidisciplinary Optimization, 41, 605–620. [Google Scholar]
4. Wang, M. Y., Li, L. (2013). Shape equilibrium constraint: A strategy for stress-constrained structural topology optimization. Structural and Multidisciplinary Optimization, 47, 335–352. [Google Scholar]
5. Wang, X., Wang, J., Wang, X., Yu, C. (2022). A pseudo-spectral Fourier collocation method for inhomogeneous elliptical inclusions with partial differential equations. Mathematics, 10(3), 296. [Google Scholar]
6. Nguyen, M. N., Hoang, V. N., Lee, D. (2023). Multiscale topology optimization with stress, buckling and dynamic constraints using adaptive geometric components. Thin-Walled Structures, 183, 110405. [Google Scholar]
7. Xu, B., Han, Y., Zhao, L. (2020). Bi-directional evolutionary topology optimization of geometrically nonlinear continuum structures with stress constraint. Applied Mathematical Modelling, 80, 771–791. [Google Scholar]
8. Lee, K., Ahn, K., Yoo, J. (2016). A novel P-norm correction method for lightweight topology optimization under maximum stress constraint. Computers & Structures, 171, 18–30. [Google Scholar]
9. Wu, C. Y., Tseng, K. Y. (2010). Stress-based binary differential evolution for topology optimization of structures. Proceedings of the Institution of Mechanical Engineers, Part C: Journal of Mechanical Engineering Science, 224(2), 443–457. [Google Scholar]
10. Deaton, J. D., Grandhi, R. V. (2016). Stress-based design of thermal structures via topology optimization. Structural and Multidisciplinary Optimization, 53, 253–270. [Google Scholar]
11. da Silva, G. A., Cardoso, E. L., Beck, A. T. (2020). Comparison of robust, reliability-based and non-probabilistic topology optimization under uncertain loads and stress constraint. Probabilistic Engineering Mechanics, 59, 103039. [Google Scholar]
12. Wang, D., Zhang, D., Meng, Y., Yang, M., Meng, C. et al. (2023). AK-HRn: An efficient adaptive Kriging-based n-hypersphere rings method for structural reliability analysis. Computer Methods in Applied Mechanics and Engineering, 414, 116146. [Google Scholar]
13. Wen, P., Takano, N., Kurita, D. (2016). Probabilistic multiscale analysis of three-phase composite material considering uncertainties in both physical and geometrical parameters at microscale. Acta Mechanica, 227, 2735–2747. [Google Scholar]
14. Tang, J., Li, X., Fu, C., Liu, H., Cao, L. et al. (2023). A possibility-based solution framework for interval uncertainty-based design optimization. Applied Mathematical Modelling, 125, 649–667. [Google Scholar]
15. Wang, L., Liu, Y., Li, M. (2022). Time-dependent reliability-based optimization for structural-topological configuration design under convex-bounded uncertain modeling. Reliability Engineering & System Safety, 221, 108361. [Google Scholar]
16. Kharmanda, G., Olhoff, N., Mohamed, A., Lemaire, M. (2004). Reliability-based topology optimization. Structural and Multidisciplinary Optimization, 26(5), 295–307. [Google Scholar]
17. Wang, L., Xia, H., Zhang, X., Lv, Z. (2019). Non-probabilistic reliability-based topology optimization of continuum structures considering local stiffness and strength failure. Computer Methods in Applied Mechanics and Engineering, 346, 788–809. [Google Scholar]
18. Meng, Z., Pang, Y., Pu, Y., Wang, X. (2020). New hybrid reliability-based topology optimization method combining fuzzy and probabilistic models for handling epistemic and aleatory uncertainties. Computer Methods in Applied Mechanics and Engineering, 363, 112886. [Google Scholar]
19. Xia, H., Qiu, Z. (2022). An efficient sequential strategy for non-probabilistic reliability-based topology optimization (NRBTO) of continuum structures with stress constraints. Applied Mathematical Modelling, 110, 723–747. [Google Scholar]
20. Wang, X., Shi, Y., Hoang, V., Meng, Z., Long, K. et al. (2023). Reliability-based topology optimization of fail-safe structures using moving morphable bars. Computer Modeling in Engineering & Sciences, 136(3), 3173–3195. https://doi.org/10.32604/cmes.2023.025501 [Google Scholar] [PubMed] [CrossRef]
21. Zhang, C., Long, K., Chen, Z., Yang, X., Lu, F. et al. (2024). Multi-material topology optimization for spatial-varying porous structures. Computer Modeling in Engineering & Sciences, 138(1), 369–390. https://doi.org/10.32604/cmes.2023.029876 [Google Scholar] [PubMed] [CrossRef]
22. Nguyen, M. N., Lee, D., Kang, J., Shin, S. (2023). Topology optimization with functionally graded multi-material for elastic buckling criteria. Steel and Composite Structures, 46(1), 33. [Google Scholar]
23. Xu, B., Zhao, L., Li, W., He, J., Xie, Y. M. (2016). Dynamic response reliability based topological optimization of continuum structures involving multi-phase materials. Computers & Structures, 149, 134–144. [Google Scholar]
24. Zhao, Q., Zhang, H., Zhang, T., Hua, Q., Yuan, L. et al. (2019). An efficient strategy for non-probabilistic reliability-based multi-material topology optimization with evidence theory. Acta Mechanica Solida Sinica, 32, 803–821. [Google Scholar]
25. Doan, Q. H., Lee, D., Lee, J., Kang, J. (2020). Multi-material structural topology optimization with decision making of stiffness design criteria. Advanced Engineering Informatics, 45, 101098. [Google Scholar]
26. Chen, J., Zhao, Q., Zhang, L. (2022). Reliability-based topology optimization of thermo-elastic structures with stress constraint. Mathematics, 10(7), 1091. [Google Scholar]
27. Cheng, F., Zhao, Q., Zhang, L. (2023). Non-probabilistic reliability-based multi-material topology optimization with stress constraint. International Journal of Mechanics and Materials in Design. https://doi.org/10.1007/s10999-023-09669-2 [Google Scholar] [CrossRef]
28. Zuo, W., Saitou, K. (2017). Multi-material topology optimization using ordered SIMP interpolation. Structural and Multidisciplinary Optimization, 55, 477–491. [Google Scholar]
29. Ye, H. L., Dai, Z. J., Wang, W. W., Sui, Y. K. (2019). ICM method for topology optimization of multimaterial continuum structure with displacement constraint. Acta Mechanica Sinica, 35, 552–562. [Google Scholar]
30. Lu, F., Long, K., Zhang, C., Zhang, J., Tao, T. (2023). A novel design of the offshore wind turbine tripod structure using topology optimization methodology. Ocean Engineering, 280, 114607. [Google Scholar]
31. Li, Y., Zhou, G., Chang, T., Yang, L., Wu, F. (2022). Topology optimization with aperiodic load fatigue constraints based on bidirectional evolutionary structural optimization. Computer Modeling in Engineering & Sciences, 130(1), 499–511. https://doi.org/10.32604/cmes.2022.017630 [Google Scholar] [PubMed] [CrossRef]
32. Zheng, J., Zhang, G., Jiang, C. (2023). Stress-based topology optimization of thermoelastic structures considering self-support constraints. Computer Methods in Applied Mechanics and Engineering, 408, 115957. [Google Scholar]
33. An, X., Shi, D. Y. (2023). Enhanced modified reliability index approach for efficient and robust reliability-based design optimization. International Journal for Numerical Methods in Engineering, 124, 382–401. [Google Scholar]
34. Qiu, L., Wang, F., Gu, Y., Qin, H. (2023). Modified space-time radial basis function collocation method for long-time simulation of transient heat conduction in 3D anisotropic composite materials. International Journal for Numerical Methods in Engineering, 124(21), 4639–4658. [Google Scholar]
35. Guo, L., Wang, X., Meng, Z., Yu, B. (2022). Reliability-based topology optimization of continuum structure under buckling and compliance constraints. International Journal for Numerical Methods in Engineering, 123, 4032–4053. [Google Scholar]
36. Wang, L., Zhao, X., Wu, Z., Chen, W. (2022). Evidence theory-based reliability optimization for cross-scale topological structures with global stress, local displacement, and micro-manufacturing constraints. Structural and Multidisciplinary Optimization, 65, 23. [Google Scholar]
37. Kang, Z., Luo, Y. (2009). Non-probabilistic reliability-based topology optimization of geometrically nonlinear structures using convex models. Computer Methods in Applied Mechanics and Engineering, 198, 3228–3238. [Google Scholar]
38. Rashki, M. (2018). Hybrid control variates-based simulation method for structural reliability analysis of some problems with low failure probability. Applied Mathematical Modelling, 60, 220–234. [Google Scholar]
39. Jensen, J. (2007). Efficient estimation of extreme non-linear roll motions using the first-order reliability method (FORM). Journal of Marine Science and Technology, 12, 191–202. [Google Scholar]
40. Zheng, J., Yuan, L., Jiang, C., Zhang, Z. (2023). An efficient decoupled reliability-based topology optimization method based on a performance shift strategy. Journal of Mechanical Design, 145(6), 061705. [Google Scholar]
41. Ren, Z. Y., Li, W. Y., Billinton, R., Yan, W. (2015). Probabilistic power flow analysis based on the stochastic response surface method. IEEE Transactions on Power Systems, 31(3), 2307–2315. [Google Scholar]
42. Smolyak, S. A. (1963). Quadrature and interpolation formulas for tensor products of certain classes of functions. Doklady Akademii nauk SSSR, 148, 1042–1045. [Google Scholar]
43. Gerstner, T., Griebel, M. (1998). Numerical integration using sparse grids. Number Algorithms, 18(3–4), 209–232. [Google Scholar]
44. Lazarov, B. S., Wang, F., Sigmund, O. (2016). Length scale and manufacturability in density-based topology optimization. Archive of Applied Mechanics, 86(1–2), 189–218. [Google Scholar]
45. Song, K., Zhang, Y., Zhuang, X., Yu, X., Song, B. (2021). Reliability-based design optimization using adaptive surrogate model and importance sampling-based modified SORA method. Engineering with Computers, 37, 1295–1314. [Google Scholar]
Cite This Article
 Copyright © 2024 The Author(s). Published by Tech Science Press.
This work is licensed under a Creative Commons Attribution 4.0 International License , which permits unrestricted use, distribution, and reproduction in any medium, provided the original work is properly cited.
 Downloads
 Citation Tools