
 Submit a Paper
 Propose a Special lssue
 Open Access
ARTICLE

Application of the CatBoost Model for Stirred Reactor State Monitoring Based on Vibration Signals
1 School of Mechanical Engineering, Tianjin University, Tianjin, 300354, China
2 Quality Department, Shaoxing Key Laboratory of Special Equipment Intelligent Testing and Evaluation, Shaoxing, 312071, China
* Corresponding Authors: Xukai Ren. Email: ; Guobiao Wang. Email:
(This article belongs to the Special Issue: Computer-Aided Uncertainty Modeling and Reliability Evaluation for Complex Engineering Structures)
Computer Modeling in Engineering & Sciences 2024, 140(1), 647-663. https://doi.org/10.32604/cmes.2024.048782
Received 18 December 2023; Accepted 20 February 2024; Issue published 16 April 2024
 View Full Text
 Download PDF
Abstract
Stirred reactors are key equipment in production, and unpredictable failures will result in significant economic losses and safety issues. Therefore, it is necessary to monitor its health state. To achieve this goal, in this study, five states of the stirred reactor were firstly preset: normal, shaft bending, blade eccentricity, bearing wear, and bolt looseness. Vibration signals along x, y and z axes were collected and analyzed in both the time domain and frequency domain. Secondly, 93 statistical features were extracted and evaluated by ReliefF, Maximal Information Coefficient (MIC) and XGBoost. The above evaluation results were then fused by D-S evidence theory to extract the final 16 features that are most relevant to the state of the stirred reactor. Finally, the CatBoost algorithm was introduced to establish the stirred reactor health monitoring model. The validation results showed that the model achieves 100% accuracy in detecting the fault/normal state of the stirred reactor and 98% accuracy in diagnosing the type of fault.Keywords
Stirred reactors are important process equipment and are widely used in many industries. In the production process, the state of the stirred reactor has a great effect on product quality, production efficiency and personal safety. Therefore, it is important to realize the monitoring of the stirred reactor state. As a typical rotating equipment, the changing health condition of the stirred reactor is reflected in the vibration. Therefore, the researchers collect vibration signals and monitor the health state of the key production equipment by using the above features.
In recent years, there has been a new trend to introduce energy harvesting techniques for fault diagnosis and condition monitoring of machinery. Zhang et al. [1] proposed an energy harvester (piezoelectric sheet) that not only scavenged completely wasted energy in rotating machinery but also generated the power that could be used to drive a wireless sensor system to realize the condition monitoring of bearings. Similarly, Safian et al. [2] applied an embedded piezoelectric transducer for fault detection in a cylindrical roller bearing and achieved ideal results compared to the accelerometer. However, more effort is needed to verify the effectiveness of applying this technique in integrated devices with different kinds of faults.
The way that vibration sensors acquire signals is homologous to that of piezoelectric sensors, which is widely used in fault diagnosis. The subsequent diagnosis of the equipment state is based on vibration signal processing. The processing methods can be mainly divided into four categories: time domain [3], frequency domain, time-frequency domain [4], and nonlinear analysis [5]. Time domain analysis analyzes how signal changes across time as an independent variable. The features that can be extracted in the time domain include signal amplitude, energy, root mean square (RMS), wave crest factor, kurtosis, etc. Among them, kurtosis and wave crest factors are less affected by load and speed, better reflecting impact faults [6]. Zarai et al. [7] considered that excessive signal analysis at multiple scales would degrade the efficiency of fault recognition. As a result, he extracted four time-domain features from vibration signals: variance, peak, RMS2, and skewness, which were preprocessed by an elaborately designed filter, allowing him to quickly diagnose bearing faults. Similarly, Yadav et al. [8] investigated the relationship between vibration and bearing faults in the time domain, extracting a total of 6 features such as average amplitude, peak, RMS, etc., proposing an index highly related to bearing condition. However, time-domain analysis is susceptible to noise interference, resulting in erroneous judgment, and it is only a quantification of the amplitude and profile of the signal, which makes it difficult to discern between different system states.
Through a designed bandpass filter, periodic signal information can be provided by the frequency domain, which is also able to extract background noise and fault signals and improve the signal-to-noise ratio [9,10]. Generally, the features that can be extracted from each frequency segment include power spectral density (PSD), standard deviation, peak value, and other statistical features. Ribeiro et al. found that the time domain features of vibration signals were unable to detect faults in electric errors except bearing failures [11]. Frequency domain analysis of the vibration signal was used to overcome this limitation. The results demonstrated that it was possible to detect and classify healthy and other 6 fault states of the motor, indicating that the frequency domain response contains richer state information than the time domain response. However, it is still insufficient for frequency domain analysis to monitor states as the working conditions and the health state of the equipment vary across time [12]. What’s more, some drawbacks can be found in frequency domain analysis. Firstly, a discrete Fourier as it requires may lead to distortion and higher computational complexity. Secondly, the time changes of the signal cannot be observed by frequency domain analysis since it can only provide a frequency domain representation of the signal without time domain information.
Time-frequency analysis is aimed at extracting information from vibration signals functioning as both time and frequency, which raises the efficiency in accomplishing fault diagnosis in non-stationary conditions [13]. Traditional time-frequency analysis includes short-time Fourier transform (STFT) [14], Wigner Ville distribution (WVD) [15] and directional Choi Williams distribution [16], empirical mode decomposition (EMD) technology [17], Hilbert-Huang transform (HHT) [18] and wavelet transform (WT) [19]. However, considering the weak correlation between frequency characteristic and time, integrating time domain analysis and frequency domain analysis makes it possible to enrich the features extracted from the vibration signals to identify the failure or success of the stirred reactor and the kind of fault without the need of complex time-frequency analysis.
In addition to vibration signal processing techniques, model selection has also aroused a significant concern among researchers. Generally speaking, fault diagnosis refers to a kind of classification task. In most studies, supervised classification algorithms have been used to establish models, such as tree models [20], fuzzy logic [21,22], neural networks [23], and particle swarm optimization algorithms [24,25], etc. Attoui et al. designed a wrapped algorithm to extract more effective features and diagnose bearing faults with a high accuracy [26]. The proposed algorithm achieved a fault diagnosis with an accuracy rate of 99.83% through reasonable signal processing and feature processing. Considering that different faults of rotating machinery are reflected in vibrations, You et al. combined vibration severity, dyadic wavelet energy time-spectrum, and coefficient power spectrum of the maximum wavelet energy level (VWC) to extract features [27]. Then, it designed a modified shuffled frog-leaping algorithm-support vector machine (MSFLA-SVM) model and achieved accurate classification of machinery faults. To update the fault database and diagnose the unknown type of incipient faults, Wu et al. [28] improved a Deep Principal Component Analysis (PCA) and Kullback–Leibler Divergence based fault diagnosis scheme to successfully diagnose high-speed railway traction devices.
Although most previous studies have been done in combining machine learning with vibration signals to achieve fault diagnosis of mechanical systems such as bearings and motors, it is still rarely reported to use triaxial vibration signals to diagnose the stirred reactor which is a crucial piece of chemical equipment with kinds of fault. The interaction between the medium and the blades, together with the changing rotational speed of the shaft, makes it difficult to monitor the states of the stirred reactor based on vibration. Therefore, this study aims to achieve the state monitoring of a stirred reactor under complex conditions through the analysis and fusion of multi-source vibration signals. The main contributions are summarized as follows:
(a) Faults of the stirred reactor are diagnosed based on vibration signals and a high-performance model.
(b) z-axial vibration signals contain the most abundant fault information of the stirred reactor.
(c) A combined feature evaluation and reduction method is proposed to realize feature dimension reduction.
The test platform for the stirred reactor is a glass vessel reactor with a capacity of 20 L, as shown in Fig. 1. The glass vessel supported by a stainless steel frame is equipped with a stirring blade and a stirring shaft, which are made of a kind of steel core and plastic-coated material with good rigidity. A bearing sleeve connects the stirring shaft with the vessel lid. The bolts hold the vessel cover to the vessel body in place. The rotation speed of the shaft can be adjusted within the range of 0~600 r/min. Magnetic bases are used to install the x-, y-, and z-axis vibration sensors at the bottom of the stirred reactor. The x-axis and y-axis vibration sensors are installed symmetrically at the radial position of the vessel, while the z-axis vibration sensors are installed axially at the bottom of the vessel.

Figure 1: Testing platform
As shown in Fig. 2, the signal acquisition platform integrates vibration sensors, a power supply, a data acquisition card and a PC. The vibration sensors are KS78C 100 with a maximum sampling rate of 14 kHz and a measuring range of 0–60 g. The acquisition card is ADVANTEC USB4711A with a maximum sampling rate of 150 kHz. An SD14T03, 0–24 V DC power supply is responsible for powering the sensors. Data acquisition parameters are set in a PC which is configured with CPU i7 8565U and RAM 16 G. The subsequent data processing and modeling are performed on Python and MATLAB platforms.

Figure 2: Vibration signal acquiring platform
Given the most occurring faults in production, five agitator conditions are defined: normal condition, bearing wear, shaft bending, blade eccentricity and loosening of bolts. Fig. 3a shows that a rough (Ra0.05 μm) brown corundum ball replaces a zirconia ball in the ceramic bearing to create a worn bearing. A shaft bending fault is made in Fig. 3b. As shown in Fig. 3c, a screw is added to one blade, increasing the weight by 0.8 g compared to the other blade. To simulate a bolt looseness fault, as shown in Fig. 3d, two symmetrically mounted screw nuts are removed and the remaining two are tightened to 2 Nm instead of the normal tightening force of 8–10 Nm. The experimental parameters can be seen in Table 1. The sampling rate of the sensor is set to 250 Hz due to the low stirring shaft speed. Furthermore, four shaft rotating speeds of 300, 400, 500, and 600 r/min are set to fully account for the effect of shaft speed on fault detection. Vibration signals are collected for 15 s at different rotating speeds and stirred reactor states.

Figure 3: Faults setup, (a) bearing wear, (b) shaft bending, (c) blade eccentricity, (d) bolt looseness

Fig. 4 demonstrates the amplitude of the triaxial vibration signals at varying rotation speeds under the normal conditions of the stirred reactor. The amplitude decreases with increasing rotation speed for the same source of vibration signals because a low rotating speed corresponds to the equipment’s natural frequency, causing resonance. As the rotation speed increases, the resonance phenomenon disappears and the amplitude decreases as well. Comparing the triaxial vibration signals, it is evident that the vibration amplitude of the z-axis is greater than that of the x-axis and y-axis, which is attributed to the change of the barycenter in the z-axis when the medium and the shaft rotate. Fig. 5 shows the amplitude of the triaxial vibration signals at different rotation speeds when the bolts are loose. In terms of each axial vibration signal, the fluctuation of the x-axis vibration amplitude becomes significant with the increase of the rotation speed, while the change of the y-axis signal is not obvious, and the amplitude of the z-axis vibration decreases as the rotation speed increases. Moreover, the z-axis signal amplitude increases slightly when the bolt is loose compared to the normal condition. This is because the bolt loosening does not cause axial vibration of the vessel cover. Fig. 6 shows that the amplitude fluctuation of the triaxial signal increases with the increasing rotation speed under the blade eccentricity condition. Fig. 7 presents that the amplitude of the z-axis vibration decreases with the rotation speed increase when the stirred reactor is subject to bearing wear, while the signal of the other two axes remains unchanged. Fig. 8 illustrates the signal amplitude at different rotating speeds when the stirred reactor state is subject to shaft bending. It can be seen that the amplitude of the z-axis vibration increases with the increase of the rotation speed, which differs from the change of the z-axis vibration in other stirred reactor states. In general, in the time domain, the change of the z-axis vibration with changing state and speed shows a more obvious regularity than the vibration of the other two axes.

Figure 4: Vibration amplitude of normal state at the speed of 300, 400, 500, and 600 r/min, (a) x-axis, (b) y-axis, (c) z-axis

Figure 5: Vibration amplitude of bolt looseness at the speed of 300, 400, 500, and 600 r/min, (a) x-axis, (b) y-axis, (c) z-axis
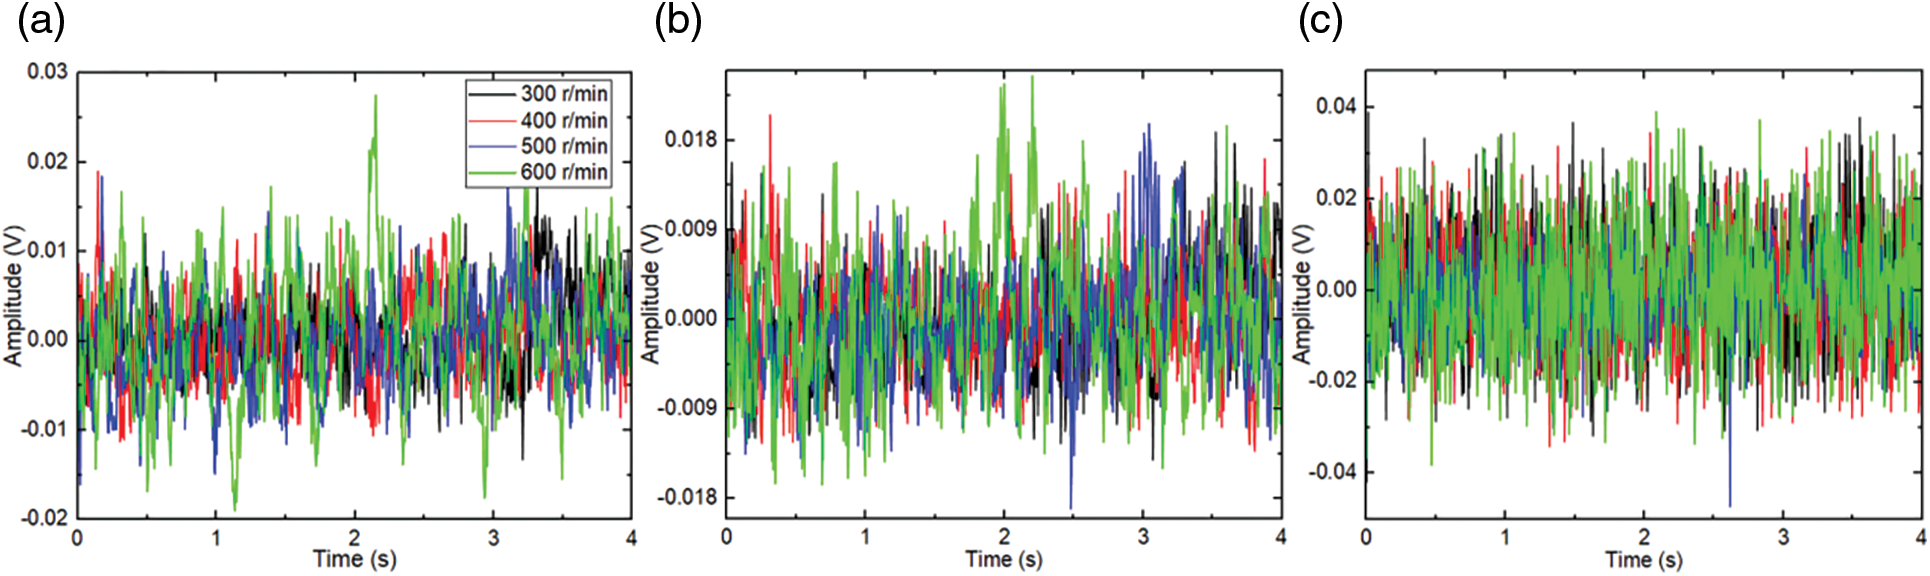
Figure 6: Vibration amplitude of blade eccentricity at the speed of 300, 400, 500, and 600 r/min, (a) x-axis, (b) y-axis, (c) z-axis

Figure 7: Vibration amplitude of bearing wear at the speed of 300, 400, 500, and 600 r/min, (a) x-axis, (b) y-axis, (c) z-axis
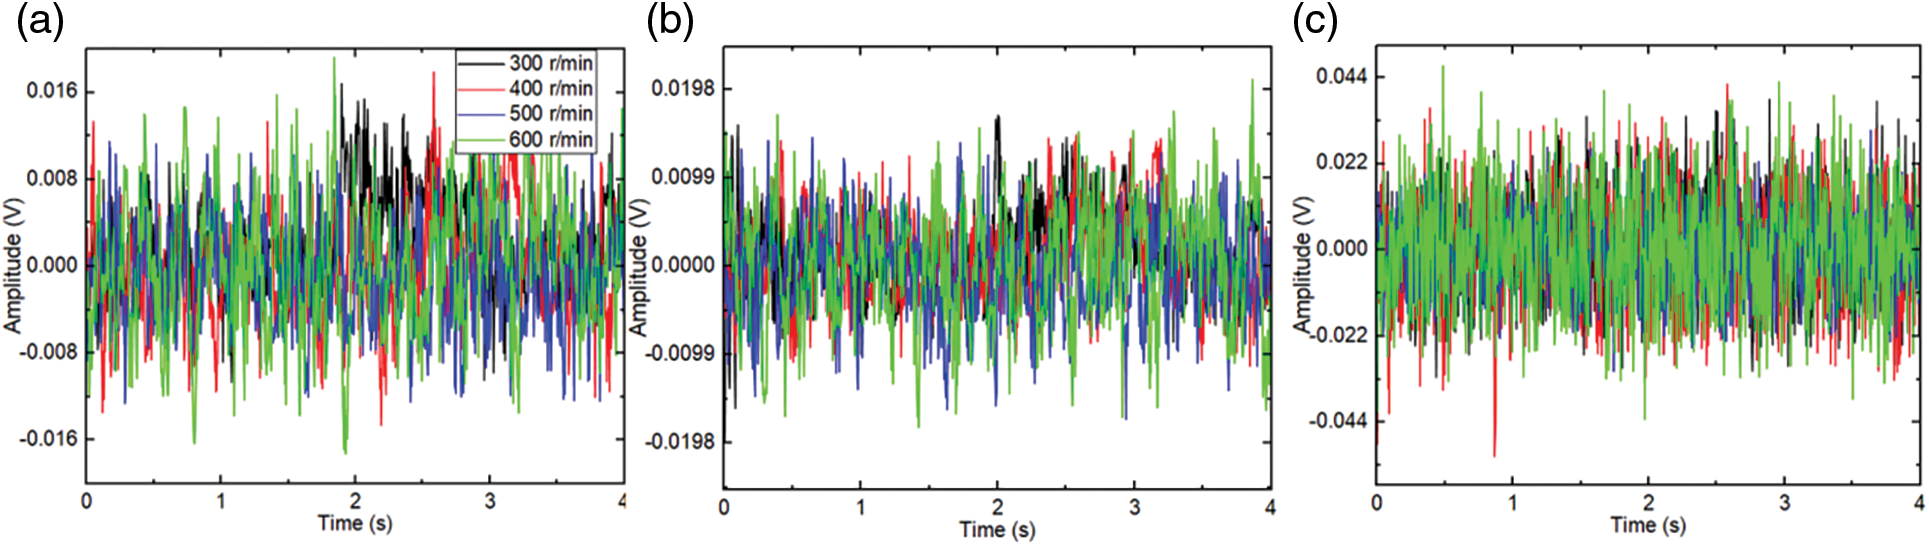
Figure 8: Vibration amplitude of shaft bending at the speed of 300, 400, 500, and 600 r/min, (a) x-axis, (b) y-axis, (c) z-axis
Although the vibration signal in the time domain shows regular changes at different speeds, it is still difficult to detect each fault. Therefore, it is necessary to analyze the vibration signal in the frequency domain. PSD estimation is an effective method for frequency domain analysis in signal processing. Fig. 9 shows the PSDs of the triaxial vibration signal under the state of blade eccentricity at different rotating speeds. From the perspective of every 20 Hz frequency segment, it is apparent that, with the increase of the speed, the PSD of the x-axis signal shows a significant upward trend in the frequency range of 1–20 Hz with an increase in speed, and decreases in the frequency range of 81–100 Hz with the increase in speed. The PSDs of the y-axis and z-axis vibrations do not present any obvious regularity as the rotational speed changes. Fig. 10 shows the PSDs under different stirred reactor states at a rotating speed of 300 r/min. By comparing the PSDs of the triaxial signals, it is noticeable that the PSDs amplitudes of the x and y axes vibrations in the frequency range of 21–120 Hz are capable of detecting the normal state. In addition, the PSDs amplitudes of the z-axis vibration signals in the frequency bands 61–80, 81–100 and 101–120 Hz can clearly distinguish the five states of the stirred reactor.

Figure 9: PSDs of vibration signals under the state of blade eccentricity at different rotating speeds, (a) x-axis, (b) y-axis, (c) z-axis

Figure 10: PSDs of vibration signals under different stirred states at the speed of 300 r/min, (a) x-axis, (b) y-axis, (c) z-axis
4 Feature Processing and Modeling
4.1 Feature Extraction and Reduction
The above signal analysis confirms that the vibration signals in both the time domain and frequency domain are strongly correlated with the stirred reactor state and can be used to diagnose different faults. Therefore, 7 statistical features per second are extracted in the time domain, such as the average amplitude, average energy, and kurtosis of the vibration signal. Similarly, 24 features are extracted in the frequency domain, including the sum, percentage, standard deviation, and root mean square of the PSD of 6 frequency bands (20 Hz per band). The feature definitions are listed in Table 2.

A total of 93 features are extracted from the three axes, with 31 features extracted from each axis vibrating signal. However, a large number of features will inevitably result in redundant data, which will reduce the efficiency and accuracy of state recognition. Therefore, there is a necessity to perform further processing and achieve dimension reduction of 93 features. Although Principal Component Analysis (PCA) can easily achieve the reduction of feature dimension by mapping high-dimensional information to low-dimensional information through linear transformation, there may still be features that are weakly correlated with the health state of the stirred reactor. t-Distributed Stochastic Neighbor Embedding (t-SNE) is a nonlinear dimension reduction method that maps high-dimensional data into 2D or 3D space for easy visualization and analysis but reduces the interpretability of feature selection. Therefore, it is necessary to develop an understandable method to achieve features dimension reduction through evaluating and fusing.
Fig. 11 shows the results of the feature importance evaluation and fusion. Fig. 11a shows the feature weights evaluated by the ReliefF algorithm [29], which is widely used in highly efficient feature processing. When dealing with multi-classification problems, ReliefF randomly selects a set R from the training set at each iteration, finds k nearest neighbors of the same kind set and finds k nearest neighbors of the different kind set, and then updates the weights of each feature. Fig. 11b shows the feature weights obtained by MIC [30]. MIC detects the nonlinear correlation between features and selects features with a greater effect on the targets from the initial feature set. It assigns weights and eliminates features with less information, thus reducing the feature dimension. In addition, effective features can be selected directly through model evaluation. XGBoost [31] is a tree model that can record the weights of each feature while building a decision tree during the model training step. Fig. 11c shows the evaluation results based on XGBoost. Finally, as shown in Fig. 11d, the Dempster-Shafer (D-S) evidence theory [32] is employed to fuse the feature evaluation results. The selection rules are as follows:
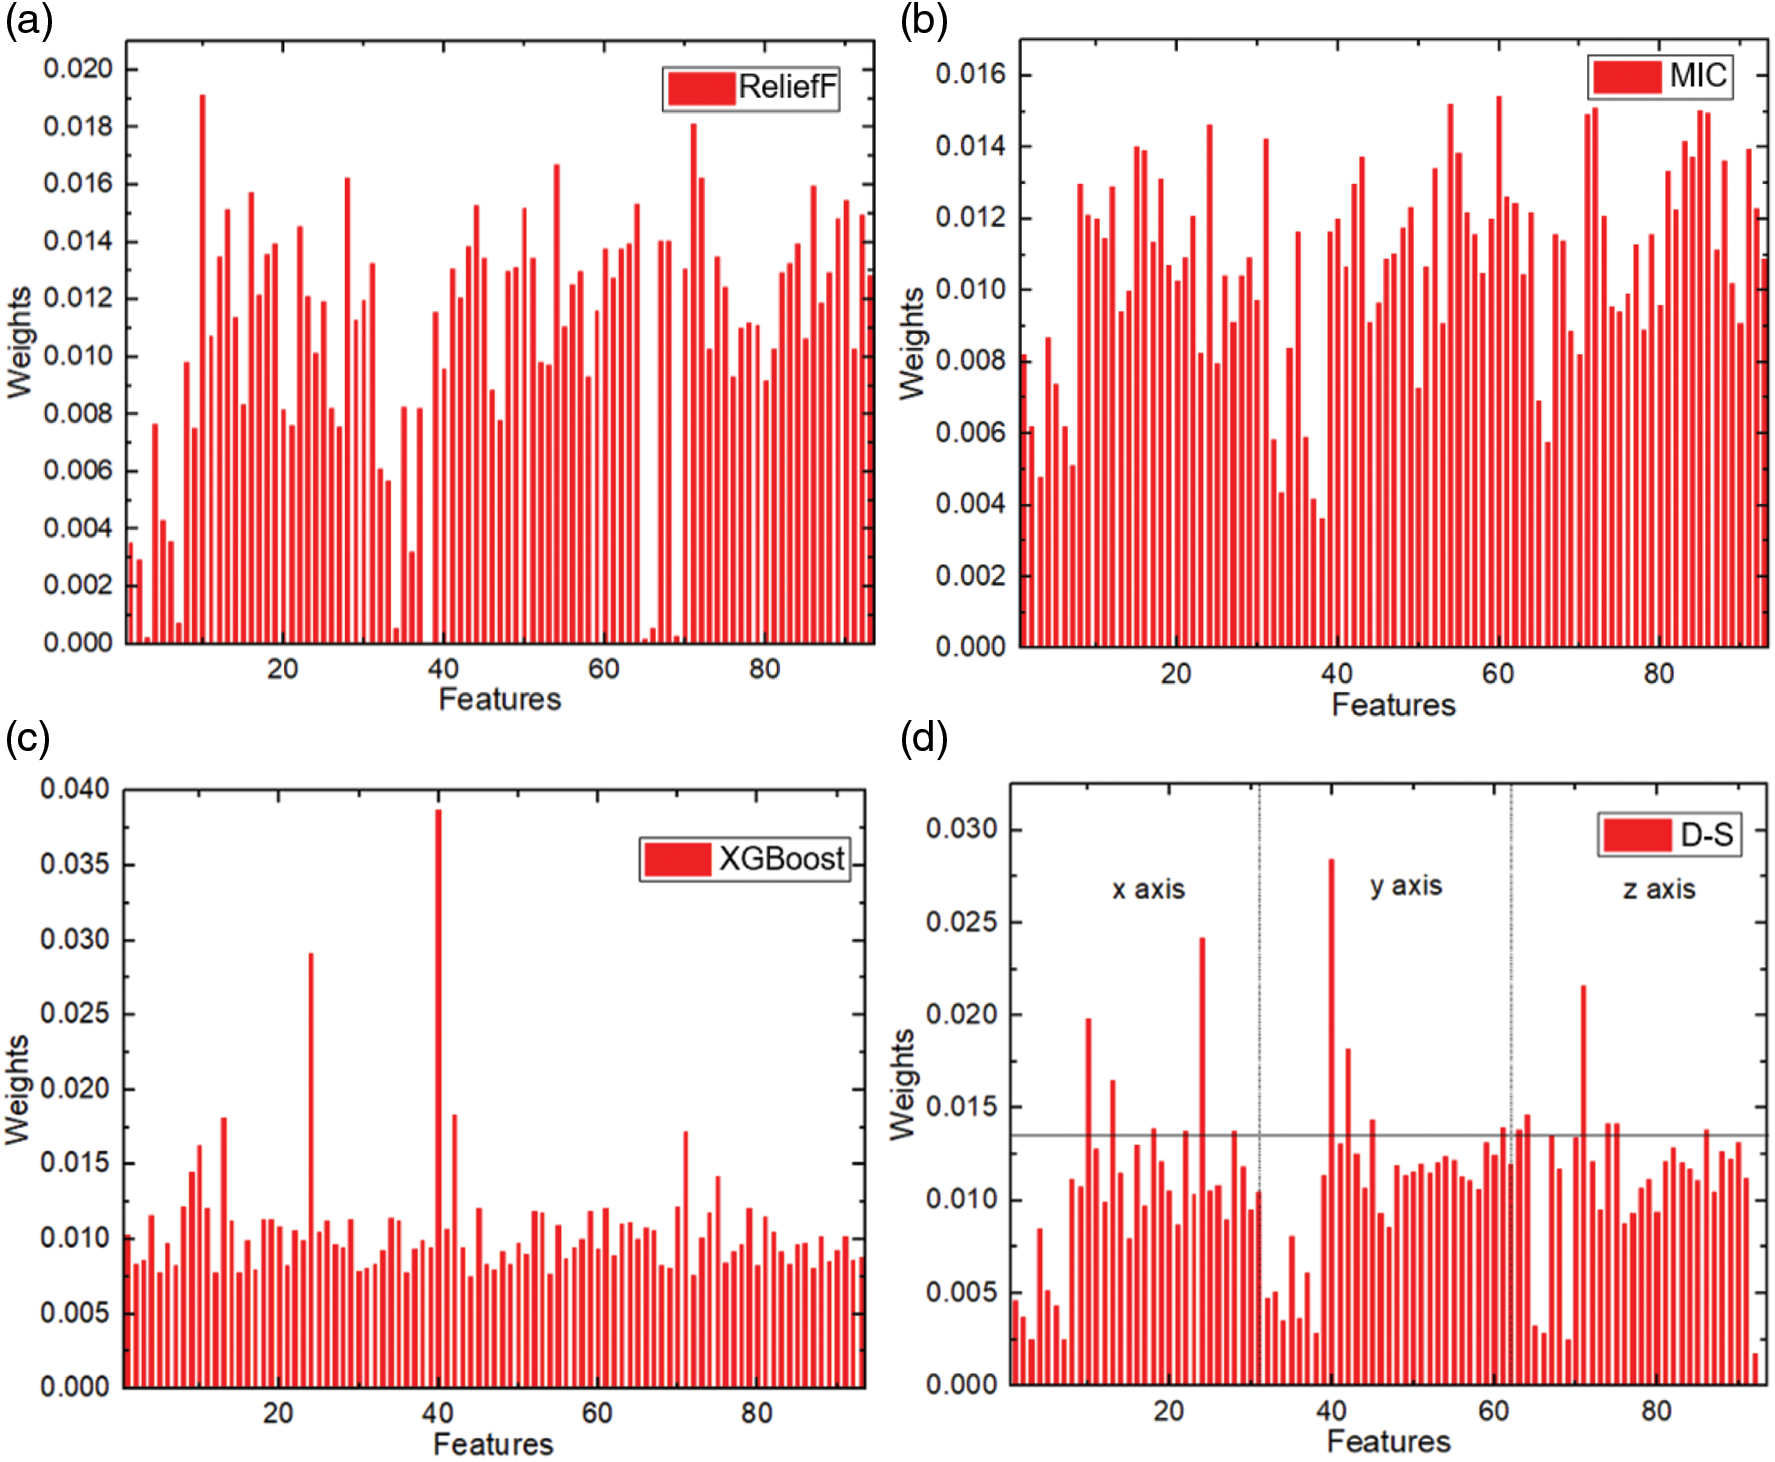
Figure 11: Feature evaluation and fusion
1): The optimal feature set should contain features extracted from x, y, and z axial vibration sources (to avoid missing key information of the stirred reactor state and enhance the compatibility of the model).
2): The optimal feature set should contain both time and frequency domain features (Time domain analysis-based features are strongly correlated with the state of the stirred reactor, while the frequency domain analysis features are strongly correlated with the type of faults).
3): The optimal feature set should contain fewer features (to ensure the model has a good performance in the training model).
According to the above rules, the top 16 features of the triaxial vibration signals are selected as the final feature set and are listed in Table 3. As stated in the signal analysis, 7 features of the z-axis vibration are selected, indicating a stronger correlation between the z-axis vibration and the condition of the stirred reactor compared to the other two axes.

After feature processing, it is essential to perform a visual inspection. Figs. 12a–12d show the relationship between the normalized features of ranking 1~4, 5~8, 9~12, and 13~16 and the state of the stirred reactor. Even under the same stirred reactor state, the selected feature values may vary due to the changing rotation speed of the shaft. Nevertheless, by comparing the changes of each feature both itself and between features, it can be found that each kind of feature or its relationship is distinct under a stirred reactor state, which proves the uniqueness and effectiveness of feature selection.

Figure 12: Selected 16 features and stirred reactor states
4.2 State Monitoring Model Based on CatBoost
CatBoost [33] is a machine learning model based on symmetric decision trees. Compared to XGBoost and LightGBM, CatBoost supports the use of multiple feature categories by preprocessing features and generating new numerical features. This eliminates the need for feature normalization. In addition, CatBoost takes into account the relationship between features, increasing the dimension and use of features at the model level. The gradient lifting method is used to confront the noise points in the training set, so as to avoid the gradient estimation bias and solve the prediction error problem. Pseudo codes of the calculation process are listed in Table 4, where the

CatBoost was selected as the algorithm to establish the stirred reactor state recognition model based on the above characteristics and the ability to perform the classification task efficiently. A total of 300 pieces of triaxial vibration sensor data were collected in the experiment. A total of 250 pieces of data were randomly selected as the training set and the remaining 50 pieces of data were used as the validation set. The validation results are shown in Fig. 13. The recognition accuracy of the model for the fault and the normal state reaches 100%, and the accuracy of diagnosing fault type is 98%.
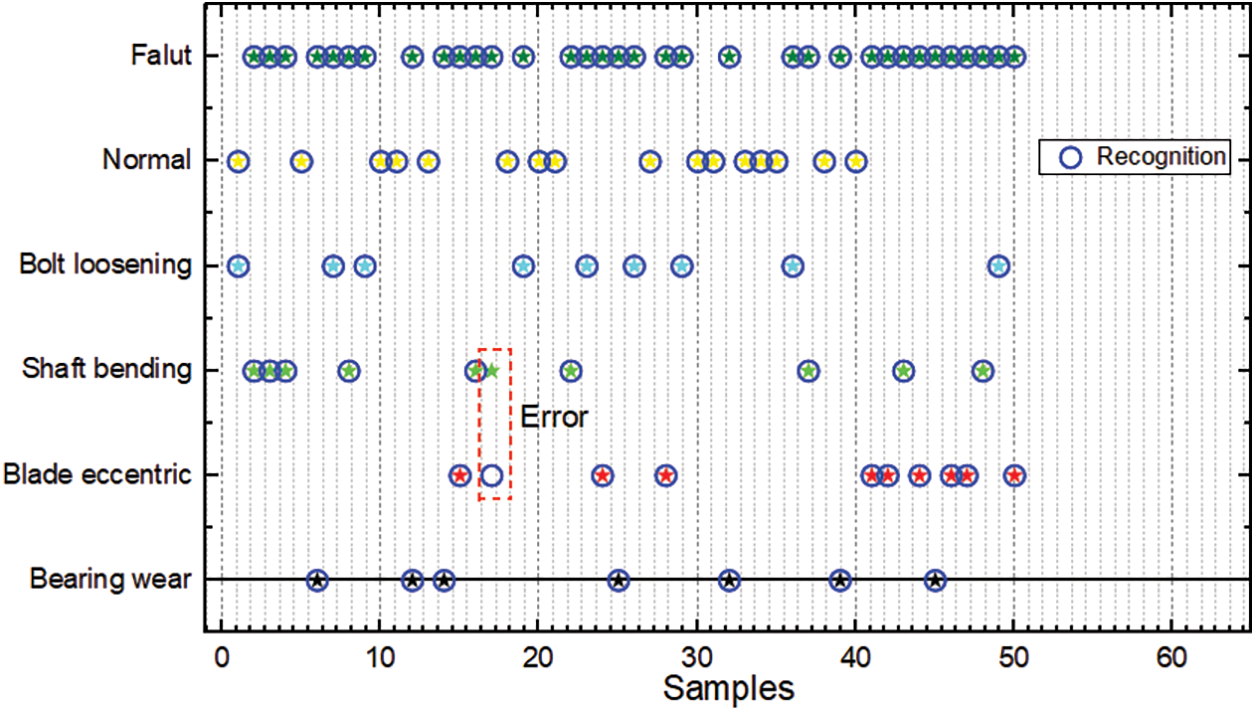
Figure 13: State recognition results of the Catboost-based model
5.1 Performance of Different Feature Sets
Feature engineering is an important step in the establishment of an efficient and accurate model. Therefore, it is necessary to evaluate the performance of the selected feature set at the model level. The evaluation is carried out from four aspects: prediction time, training time, accuracy of fault, and state recognition. The feature set selected by D-S evidence theory is compared with the 93 features set and the top 16 features set ranked by ReliefF, MIC, and XGBoost, respectively. The results of the evaluation are shown in Fig. 14. It can be seen that the 16 feature sets selected by the combined method of feature evaluation and fusion by ReliefF, MIC, XGBoost, and D-S evidence theory have the best model performance and prove the effectiveness of feature engineering.

Figure 14: Performance of different feature sets
5.2 Comparison of Different Models
As mentioned in Section 4.2, CatBoost is selected as the model to monitor the states of the stirred reactor in terms of its low feature requirements and high classification efficiency. However, the performance of the CatBoost needs to be evaluated horizontally. First, LightGBM and XGBoost, which are tree models, are selected to detect the state of the stirred reactor. As shown in Fig. 15, the comparison is made from the following four aspects: prediction time, training time, and accuracy of fault and state detection. Although the training time of the CatBoost model is longer than that of LightGBM and XGBoost, CatBoost shows advantages concerning diagnosis efficiency and accuracy. In addition, another type of model, the Adaptive Network Based Fuzzy Inference System (ANFIS), is trained and compared with the CatBoost model. The comparison results are also shown in Fig. 15. It can be seen that the performance of the CatBoost model is completely superior to that of the ANFIS model.
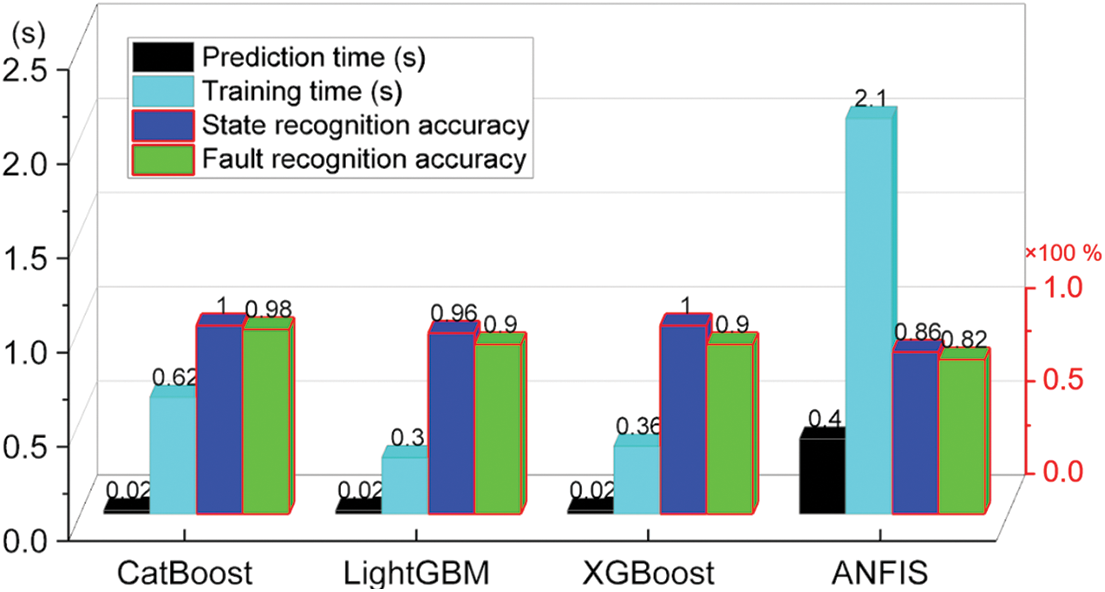
Figure 15: Performance of different models
This study collects the x, y, and z-axis vibration signals of the stirred reactor under normal, shaft bending, blade eccentricity, bearing wear, and bolt looseness states at different speeds and analyzes them in time and frequency domains. The main contributions are summarized as follows: (i) Due to the influence of the equipment’s modal characteristics and the changing speed, triaxial vibration signals are necessary to avoid missing important information. (ii) Effective feature dimension reduction can be achieved by applying ReliefF, MIC and XGBoost to evaluate feature importance, correlation and model performance, respectively, as well as introducing D-S evidence theory to the fusion feature evaluation results. (iii) A CatBoost-based stirred reactor condition monitoring model is established by using the selected set of 16 features, achieving 100% condition detection accuracy and 98% fault diagnosis accuracy.
Acknowledgement: None.
Funding Statement: The study is supported by the China Postdoctoral Science Foundation (Grant Number 2023M742598).
Author Contributions: All authors contributed to the study conception and design. Experiments, data collection and analysis: Xukai Ren, Huanwei Yu, Xianfeng Chen and Yantong Tang; sensors and the stirred reactor preparation: Xiyong Du; draft manuscript polishing: Guobiao Wang; draft manuscript preparation: Xukai Ren. All authors reviewed the results and approved the final version of the manuscript.
Availability of Data and Materials: The datasets generated and analysed during the current study are not publicly available due to privacy protection reasons but are available from the corresponding author on reasonable request.
Conflicts of Interest: The authors declare that they have no conflicts of interest to report regarding the present study.
References
1. Zhang, L., Zhang, F., Qin, Z., Han, Q., Wang, T. et al. (2022). Piezoelectric energy harvester for rolling bearings with capability of self-powered condition monitoring. Energy, 238, 121770. [Google Scholar]
2. Safian, A., Wu, N., Liang, X. (2023). Development of an embedded piezoelectric transducer for bearing fault detection. Mechanical Systems and Signal Processing, 188, 109987. [Google Scholar]
3. Wang, C., Tang, N., Zhang, Q., Gao, L., Yin, H. et al. (2024). Expert experience and data-driven based hybrid fault diagnosis for high-speed wire rod finishing mills. Computer Modeling in Engineering & Sciences, 138(2), 1827–1847. https://doi.org/10.32604/cmes.2023.030970 [Google Scholar] [PubMed] [CrossRef]
4. Fertig, A., Weigold, M., Chen, Y. (2022). Machine learning based quality prediction for milling processes using internal machine tool data. Advances in Industrial and Manufacturing Engineering, 4, 100074. [Google Scholar]
5. Wang, H., Yue, W., Wen, S., Xu, X., Haasis, H. D. et al. (2022). An improved bearing fault detection strategy based on artificial bee colony algorithm. CAAI Transactions on Intelligence Technology, 7(4), 570–581. [Google Scholar]
6. Lei, Y., Zuo, M. J., He, Z., Zi, Y. (2010). A multidimensional hybrid intelligent method for gear fault diagnosis. Expert Systems with Applications, 37(2), 1419–1430. [Google Scholar]
7. Zarei, J., Tajeddini, M. A., Karimi, H. R. (2014). Vibration analysis for bearing fault detection and classification using an intelligent filter. Mechatronics, 24(2), 151–157. [Google Scholar]
8. Yadav, O. P., Pahuja, G. L. (2020). Bearing health assessment using time domain analysis of vibration signal. International Journal of Image, Graphics and Signal Processing, 10(3), 27–40. [Google Scholar]
9. Feng, Z., Zhu, W., Zhang, D. (2019). Time-Frequency demodulation analysis via Vold-Kalman filter for wind turbine planetary gearbox fault diagnosis under nonstationary speeds. Mechanical Systems and Signal Processing, 128, 93–109. [Google Scholar]
10. Zhang, C., Kong, L., Xu, Q., Zhou, K., Pan, H. (2020). Fault diagnosis of key components in the rotating machinery based on Fourier transform multi-filter decomposition and optimized LightGBM. Measurement Science and Technology, 32(1), 015004. [Google Scholar]
11. Junior, R. F. R., dos Santos Areias, I. A., Gomes, G. F. (2021). Fault detection and diagnosis using vibration signal analysis in frequency domain for electric motors considering different real fault types. Sensor Review, 41(3), 311–319. [Google Scholar]
12. Rahman, M. M., Uddin, M. N. (2017). Online unbalanced rotor fault detection of an IM drive based on both time and frequency domain analyses. IEEE Transactions on Industry Applications, 53(4), 4087–4096. [Google Scholar]
13. Chen, Y., Liang, R., Ran, W., Chen, W. (2023). Gearbox fault diagnosis method based on deep learning multi-task framework. International Journal of Structural Integrity, 14(3), 401–415. [Google Scholar]
14. Furman, Ł., Duch, W., Minati, L., Tołpa, K. (2023). Short-time Fourier transform and embedding method for recurrence quantification analysis of EEG time series. The European Physical Journal Special Topics, 232(1), 135–149. [Google Scholar]
15. Faisal, K. N., Sharma, R. R. (2023). Successive variational mode decomposition-based enhanced WignerVille distribution for seismo-volcanic events identification. Journal of Volcanology and Geothermal Research, 440, 107847. [Google Scholar]
16. Martinez-Herrera, A. L., Ledesma-Carrillo, L. M., Ferrucho-Alvarez, E. R., Lopez-Ramirez, M., Rodriguez-Donate, C. et al. (2023). Tunable hyperbolic Cohen-class kernel for cross-term diminishing in time-frequency distributions. Mechanical Systems and Signal Processing, 186, 109850. [Google Scholar]
17. Meng, D., Wang, H., Yang, S., Lv, Z., Hu, Z. et al. (2022). Fault analysis of wind power rolling bearing based on EMD feature extraction. Computer Modeling in Engineering & Sciences, 130(1), 543–558. doi: https://doi.org/10.32604/cmes.2022.018123 [Google Scholar] [PubMed] [CrossRef]
18. Dezhkam, A., Manzuri, M. T. (2023). Forecasting stock market for an efficient portfolio by combining XGBoost and Hilbert-Huang transform. Engineering Applications of Artificial Intelligence, 118, 105626. [Google Scholar]
19. Zhang, Z., Guo, D., Zhou, S., Zhang, J., Lin, Y. (2023). Flight trajectory prediction enabled by time-frequency wavelet transform. Nature Communications, 14(1), 5258. [Google Scholar] [PubMed]
20. Zhang, Y., Lin, R., Zhang, H., Peng, Y. (2023). Vibration prediction and analysis of strip rolling mill based on XGBoost and Bayesian optimization. Complex & Intelligent Systems, 9(1), 133–145. [Google Scholar]
21. Montazeri-Gh, M., Yazdani, S. (2020). Application of interval type-2 fuzzy logic systems to gas turbine fault diagnosis. Applied Soft Computing, 96, 106703. [Google Scholar]
22. Qu, F., Liu, J., Zhu, H., Zhou, B. (2020). Wind turbine fault detection based on expanded linguistic terms and rules using non-singleton fuzzy logic. Applied Energy, 262, 114469. [Google Scholar]
23. Wang, X., Mao, D., Li, X. (2021). Bearing fault diagnosis based on vibro-acoustic data fusion and 1D-CNN network. Measurement, 173, 108518. [Google Scholar]
24. Xue, S., Tan, J., Shi, L., Deng, J. (2020). Rope tension fault diagnosis in hoisting systems based on vibration signals using EEMD, improved permutation entropy, and PSO-SVM. Entropy, 22(2), 209. [Google Scholar] [PubMed]
25. Ding, J., Xiao, D., Li, X. (2020). Gear fault diagnosis based on genetic mutation particle swarm optimization VMD and probabilistic neural network algorithm. IEEE Access, 8, 18456–18474. [Google Scholar]
26. Attoui, I., Oudjani, B., Boutasseta, N., Fergani, N., Bouakkaz, M. S. et al. (2020). Novel predictive features using a wrapper model for rolling bearing fault diagnosis based on vibration signal analysis. The International Journal of Advanced Manufacturing Technology, 106, 3409–3435. [Google Scholar]
27. You, L., Fan, W., Li, Z., Liang, Y., Fang, M. et al. (2019). A fault diagnosis model for rotating machinery using VWC and MSFLA-SVM based on vibration signal analysis. Shock and Vibration, 2019, 1908485. [Google Scholar]
28. Wu, Y., Liu, X., Wang, Y., Li, Q., Guo, Z. et al. (2023). Improved deep PCA and Kullback-Leibler divergence based incipient fault detection and isolation of high-speed railway traction devices. Sustainable Energy Technologies and Assessments, 57, 103208. [Google Scholar]
29. Spolaôr, N., Cherman, E. A., Monard, M. C., Lee, H. D. (2013). ReliefF for multi-label feature selection. 2013 Brazilian Conference on Intelligent Systems, pp. 6–11. IEEE. [Google Scholar]
30. Reshef, D. N., Reshef, Y. A., Finucane, H. K., Grossman, S. R., McVean, G. et al. (2011). Detecting novel associations in large data sets. Science, 334(6062), 1518–1524. [Google Scholar] [PubMed]
31. Chen, T., Guestrin, C. (2016). XGBoost: A scalable tree boosting system. Proceedings of the 22nd ACM SIGKDD International Conference on Knowledge Discovery and Data Mining, pp. 785–794. [Google Scholar]
32. Wu, Y., Ren, Z., Zeng, Z. (2010). Fault diagnosis method based on DS evidence theory. 2010 Prognostics and System Health Management Conference, pp. 1–4. IEEE. [Google Scholar]
33. Prokhorenkova, L., Gusev, G., Vorobev, A., Dorogush, A. V., Gulin, A. (2018). CatBoost: Unbiased boosting with categorical features. Advances in Neural Information Processing Systems 31(NeurIPS 2018), pp. 6638–6648. [Google Scholar]
Cite This Article
 Copyright © 2024 The Author(s). Published by Tech Science Press.
This work is licensed under a Creative Commons Attribution 4.0 International License , which permits unrestricted use, distribution, and reproduction in any medium, provided the original work is properly cited.
 Downloads
 Citation Tools