
 Submit a Paper
 Propose a Special lssue
 Open Access
ARTICLE

Predicting the Construction Quality of Projects by Using Hybrid Soft Computing Techniques
Department of Civil Engineering, Republic of China Military Academy, Kaohsiung, 830, Taiwan
* Corresponding Author: Ching-Lung Fan. Email:
(This article belongs to the Special Issue: Soft Computing Applications of Civil Engineering including AI-based Optimization and Prediction)
Computer Modeling in Engineering & Sciences 2025, 142(2), 1995-2017. https://doi.org/10.32604/cmes.2025.059414
Received 07 October 2024; Accepted 23 December 2024; Issue published 27 January 2025
 View Full Text
 Download PDF
Abstract
The construction phase of a project is a critical factor that significantly impacts its overall success. The construction environment is characterized by uncertainty and dynamism, involving nonlinear relationships among various factors that affect construction quality. This study utilized 987 construction inspection records from 1993 to 2022, obtained from the Taiwanese Public Construction Management Information System (PCMIS), to determine the relationships between construction factors and quality. First, fuzzy logic was applied to calculate the weights of 499 defects, and 25 critical construction factors were selected based on these weight values. Next, a deep neural network was used to identify the relationship between the critical construction factors (input variables) and construction quality (output variable). Finally, the prediction model’s performance was evaluated to confirm the impact of these critical construction factors on project outcomes. This study employed an innovative hybrid soft computing technique, combining fuzzy logic and an artificial neural network, to effectively predict the relationship between critical construction factors and construction quality, achieving a model accuracy of 96.08%. Project managers can utilize the findings of this study to enhance project management practices and establish effective construction management strategies, thereby improving project construction quality.Keywords
The fundamental outcomes of a successful project are completing it within the allowed timeframe, adhering to the estimated budget, and maintaining the quality of the construction project [1]. In particular, quality is a crucial pillar of construction success, as failures in quality pose significant threats to the project [2]. The project is the primary characteristic of the construction industry. However, projects lack clear scope division, standard procedures, and formalized operations, evaluating the overall performance level of construction projects is challenging [3]. The effectiveness of all stages of a project, namely planning, design, construction, and completion, influences the overall project performance. However, numerous factors affect stages effectiveness; thus, making the implementation of a comprehensive evaluation method difficult. Instead, research typically evaluates the factors affecting a single stage. The construction phase is a particularly critical stage of a project. However, most studies only measure project performance after completion; the performance during the construction phase is rarely investigated [4]. Fanaei et al. [5] argued that the performance during the construction phase should be evaluated to enable stakeholders to use the evaluation results to propose corrective measures and predict the performance of the remaining project. Project management affects construction quality, which further affects the interests of clients. Therefore, identifying relevant quality factors and their effects on the construction phase is critical.
There remains considerable disagreement regarding a set of success criteria that can be applied to all types of projects when evaluating project success, making it a complex process for practitioners and scholars [6]. Researchers often use methods such as questionnaire surveys, expert interviews, and literature reviews to identify factors or performance indicators that affect the quality of construction projects. For example, Jha et al. [7] used questionnaire data to develop a model for predicting project quality. Acıkara et al. [8] administered questionnaires to 120 stakeholders in Turkish construction projects to determine their attitudes toward quality management. Nassar et al. [9] conducted expert interviews to determine key performance indicators (KPIs) for the construction phase of projects. Ngacho et al. [10] identified six KPIs through interviews and a literature review to develop a framework for evaluating construction project performance. Leon et al. [11] identified eight performance indicators for construction projects by conducting a literature review and interviews with domain experts. Maya et al. [12] identified 34 factors affecting construction project performance based on the opinions of practitioners.
Studies on construction quality typically rely on conventional survey statistics; however, these techniques are often ineffective for generating large datasets and analyzing the characteristics of dynamic projects. In contrast, soft computing techniques can identify critical factors affecting complex projects, enabling the formulation of suitable project management strategies. The complexity, uncertainty, and randomness inherent in mathematical reasoning often make traditional mathematical or modeling approaches ineffective for many real-world problems. Soft computing, on the other hand, can tackle specific tasks using sample data or experimental observations [13]. Soft computing encompasses a collection of techniques, including fuzzy logic, artificial neural networks (ANNs), genetic algorithms, and learning theory. These methods aim to mimic human cognition and are often more effective than conventional hard computing techniques in addressing issues involving uncertainty or nonlinearity. Each soft computing method has unique strengths and limitations. When a single technique cannot manage a complex or multidimensional real-world problem due to excessive uncertainty, ambiguity, or insufficient data, it is often combined with other methods [14].
Some researchers advocate for integrating different methods to develop hybrid models, aiming to achieve more reliable and accurate estimates by combining the strengths of various approaches. These models often integrate ANNs with metaheuristic techniques or secondary artificial intelligence methods [15]. The combination of ANN and fuzzy logic modeling methods is known as a neuro-fuzzy system, or the Adaptive Neuro-Fuzzy Inference System (ANFIS). This approach facilitates the creation of suitable fuzzy reasoning classifications by leveraging hybrid optimization algorithms, training fuzzy systems, and determining appropriate membership function parameters for fuzzy inference, thereby enabling the modeling of complex input-output relationships [16]. Kiani Mavi et al. [17] developed a decision support system using ANFIS to predict the success of mid- and large-sized construction projects, while Georgy et al. [18] employed a neuro-fuzzy system to forecast project performance. Dissanayake et al. [19] combined fuzzy sets, ANNs, and genetic algorithms to develop a model for project performance monitoring. Fanaei et al. [5] applied neuro-fuzzy techniques to qualitatively measure and predict six critical KPIs of construction projects.
Conventional control methods require numerous variables with explicit numerical values; however, not all variables are quantifiable. Therefore, these approaches are ineffective for modeling large systems. Fuzzy logic, which was proposed by Zadeh [20], is a method of describing uncertainty in complex problems by using fuzzy numbers, operations, and inference. The membership functions are used to calculate crisp (nonfuzzy) weight values for fuzzy concepts. Fuzzy logic is a method of problem simplification similar to that used in human cognition, and this method is an effective alternative to traditional control methods because it can establish logical relationships for uncertain or subjective data. In summary, fuzzy logic can handle imprecise data and accurately solve complex systems and therefore has been applied in practice to solve many difficult control and decision-making problems.
In recent years, fuzzy logic has been adopted to investigate the imprecise and fuzzy phenomena in construction projects. For example, Elwood et al. [21] proposed a method for detecting building damage based on fuzzy pattern recognition. Tripathi et al. [22] used a fuzzy preference relation technique to determine the relative weights of performance factors and the associated performance measurement attributes of construction organizations. Seresht et al. [23] provided a detailed overview of the current applications of fuzzy–hybrid techniques in the construction field, including combinations of fuzzy logic and machine learning methods. The development of machine learning has occurred in two phases: one related to shallow learning and the other related to deep learning. Deep and shallow learning are distinguished by the depth of the “assignment path,” that is, the chain of causality between actions and effects that the path can learn [24]. Early ANNs used techniques such as backpropagation (BP) to learn statistical regularities from large quantities of training data and subsequently make predictions for new events. One early ANN method was a multilayer perceptron, which is a relatively simple model that only contains a single hidden layer. Later, many other shallow machine learning models were proposed, such as support vector machine and logistic regression, whose structures can be considered the same as those of neural networks with a single hidden layer [25] and no hidden layer, respectively. These models have achieved success in theoretical analysis and practical applications.
However, shallow learning is only suitable for small samples, has poor computational performance, and has limited capacity for representing complex functions. Consequently, its generalization performance might be limited for complex classification tasks. By contrast, deep learning methods use a deep, nonlinear network structure to approximate complex functions, which enables the acquisition of a distributed representation of feature inputs and the extraction of essential features from a few samples. Therefore, deep learning involves using large quantities of training data to construct machine learning models with many hidden layers that can learn useful features to achieve high classification or prediction accuracy. Shallow learning methods cannot extract high-level features and might even require further postprocessing to interpret high-dimensional extracted features; the more complex network architectures of deep learning methods do not face these problems [26]. Moreover, in practice, the data description or sample features used in shallow machine learning methods typically must be manually selected by experts; the selection of low-quality features worsens the model’s generalization performance. By contrast, deep learning methods use multiple layers for automatically extracting high-level features from the original input [27].
ANNs use weighted, interconnected computing units (artificial neurons) arranged in multiple layers to mimic the function of the human brain and are increasingly used for prediction tasks involving large data sets [28]. Specifically, ANNs are well-suited for handling incomplete or fuzzy data sets and highly complex or ambiguous problems that conventionally require human intuition [29]. Deep neural networks have been widely applied in civil engineering due to their powerful learning and nonlinear fitting capabilities. For example, these networks have been applied in tasks such as construction cost estimation [30], construction productivity prediction [31–33], construction quality evaluation [34], and project performance prediction [35,36].
The vagueness inherent in human thinking and language introduces subjectivity and uncertainties in practice. During the construction stage, uncertainty may arise from incomplete information or vagueness in state monitoring, construction management, and decision-making processes, leading to uncertainties in measurements and perceptions. Soft computing techniques can help overcome these challenges by bypassing the need for precise mathematical or logical models of the problem. Instead, they process input data directly to obtain results. The combination of fuzzy logic and ANNs can effectively address fuzzy phenomena and numerical data, making them suitable for understanding various stages of construction. By leveraging the complementary functionality of fuzzy systems and the learning capability of ANNs, hybrid methods can achieve performance superior to that of either method alone. Hybrid approaches that combine two or more techniques, such as neuro-fuzzy systems, have been widely used to solve practical problems [37,38].
Tiruneh et al. [39] argued that neuro-fuzzy systems can represent and model complex problems and the input-output relationships of nonlinear systems; practical construction and management problems can be considered to be nonlinear systems. Therefore, some researchers have combined neural networks and fuzzy systems to analyze construction and managerial decision-making. For example, Chae et al. [40] proposed neuro-fuzzy approaches to classify sewer pipe defects. Sinha et al. [41] presented a novel neuro-fuzzy classifier that combined neural network and fuzzy logic concepts; the classifier extracted features from segmented buried pipe images to classify defects. Kumar et al. [42] developed a neuro-fuzzy inference system to classify pipeline defects, assess damage, and evaluate degradation.
As the number of factors increases, model design and analysis become increasingly challenging, with model complexity rising nonlinearly. The conventional expert consultation process may be ineffective in managing the numerous complex factors present in real-world scenarios [43]. In this study, two soft computing methods are combined to identify complex yet meaningful relationships among the factors influencing construction, enabling predictions without relying solely on expert models. This approach represents a state-of-the-art method for investigating construction performance. First, critical construction factors with higher weights are identified through fuzzy logic screening. Then, an ANN is used to predict the relationship between these critical factors and construction quality. Jafarzadeh et al. [44] noted that the likelihood of ANN overfitting significantly increases as the number of predictive variables rises. Thus, fuzzy logic is necessary to select key factors from the potential set to optimize ANN prediction accuracy. By reducing data redundancy and dimensionality, capturing complex relationships, and refining specific variables, prediction accuracy can be enhanced. Soft computing based on fuzzy logic and ANN enables the detection of previously obscured correlations or trends, improving predictive capabilities and generating new practical value. These prediction results can inform construction management strategies, contributing to improved construction quality and overall project performance.
Recently, researchers have applied soft computing techniques to the modeling, prediction, and control of dynamic nonlinear systems, which has resulted in continually increasing computation speed, accuracy, and design complexity [45]. This section describes the principles and operation of fuzzy logic and ANNs in soft computing, the construction inspection data used in this research, and the research framework.
Fuzzy logic employs fuzzy sets to characterize ambiguous ideas, such as high and low, plenty and few, good and bad. It is defined as a set of ordered pairs as shown in Eq. (1). x represents a measure value in the universe of discourse U, and the membership function μ
The membership function is a fundamental concept of fuzzy logic that is used to describe the properties of fuzzy sets. Fuzzy sets often use multiple membership functions defined with similar measures to describe the possible values of a linguistic variable, such as “defect frequency,” to linguistic variables, such as “very high,” “high,” “medium,” “low,” and “very low.” These linguistic variables are subsequently converted into corresponding fuzzy values by using fuzzy numbers and are ultimately output as quantitative values. Thus, the membership functions quantify fuzzy sets by enabling precise mathematical calculations and the analysis of the fuzzy information. The potential power of fuzzy logic lies in its use of linguistic variables instead of quantitative variables to represent imprecise concepts; it has promising performance for decision-making processes that involve human reasoning.
Selecting an appropriate membership function is crucial for successfully applying fuzzy logic to practical problems. However, no general rule or theorem for selecting a reasonable membership function has been developed; a function is typically selected according to the characteristics of the fuzzy variable or expert opinion. Thus, an objective standard for membership functions does not exist. Many types of membership functions, including the commonly used Gaussian function, triangular function, and trapezoidal function, have been proposed. The membership function for a trapezoidal function with a projection on the x-axis as in Fig. 1 (a1, b1, c1, and d1) is presented in Eq. (2).
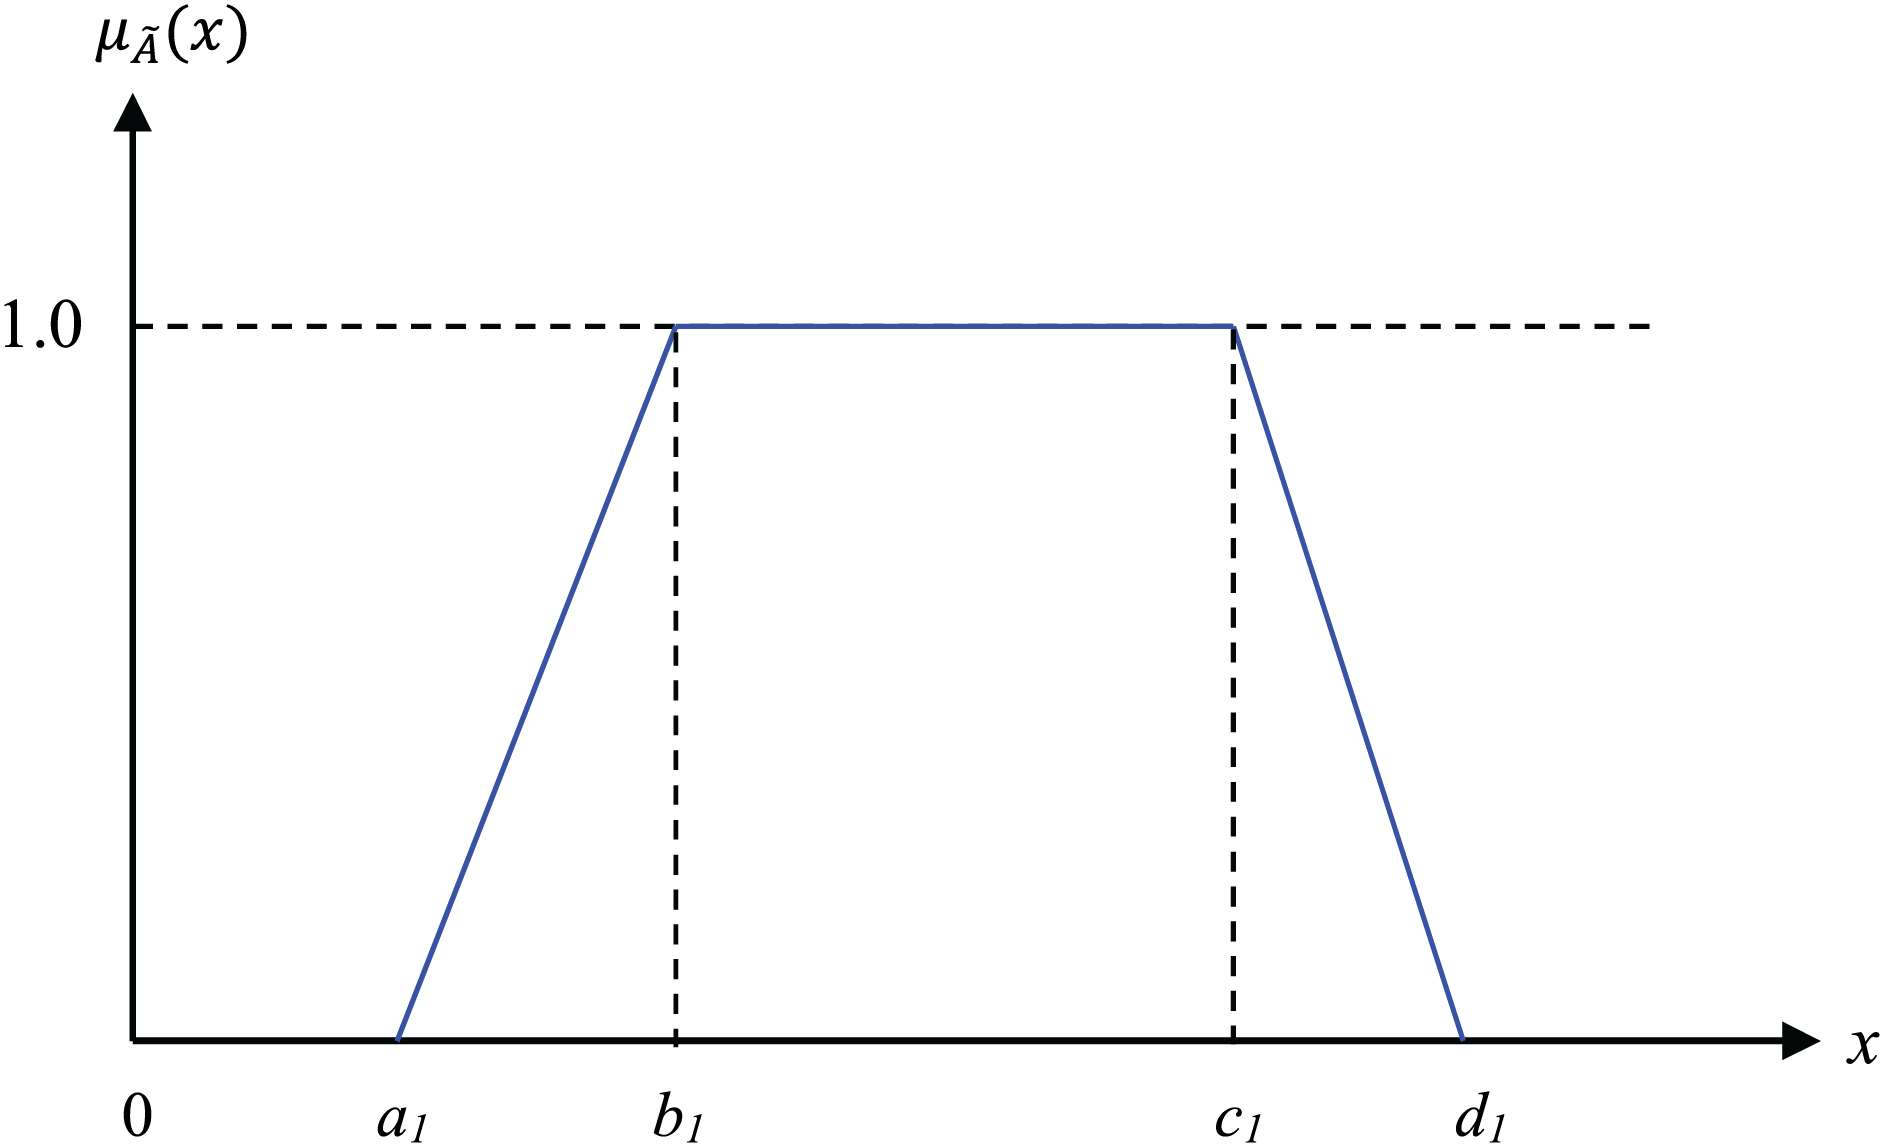
Figure 1: Trapezoidal membership function
2.1.2 Calculation of Fuzzy Logic
Membership functions have indistinct boundaries; therefore, adjacent functions often partially overlap, which is a characteristic of fuzzy systems. Multiple fuzzy values collectively affect the system output. Therefore, fuzzy logic differs from traditional algebraic logic, in which only a single result is possible. One of several suitable or reasonable choices can be selected under the situation or requirements; thus, fuzzy systems are elastic. For example, by using a trapezoidal function (Fig. 2), the fuzzy sets
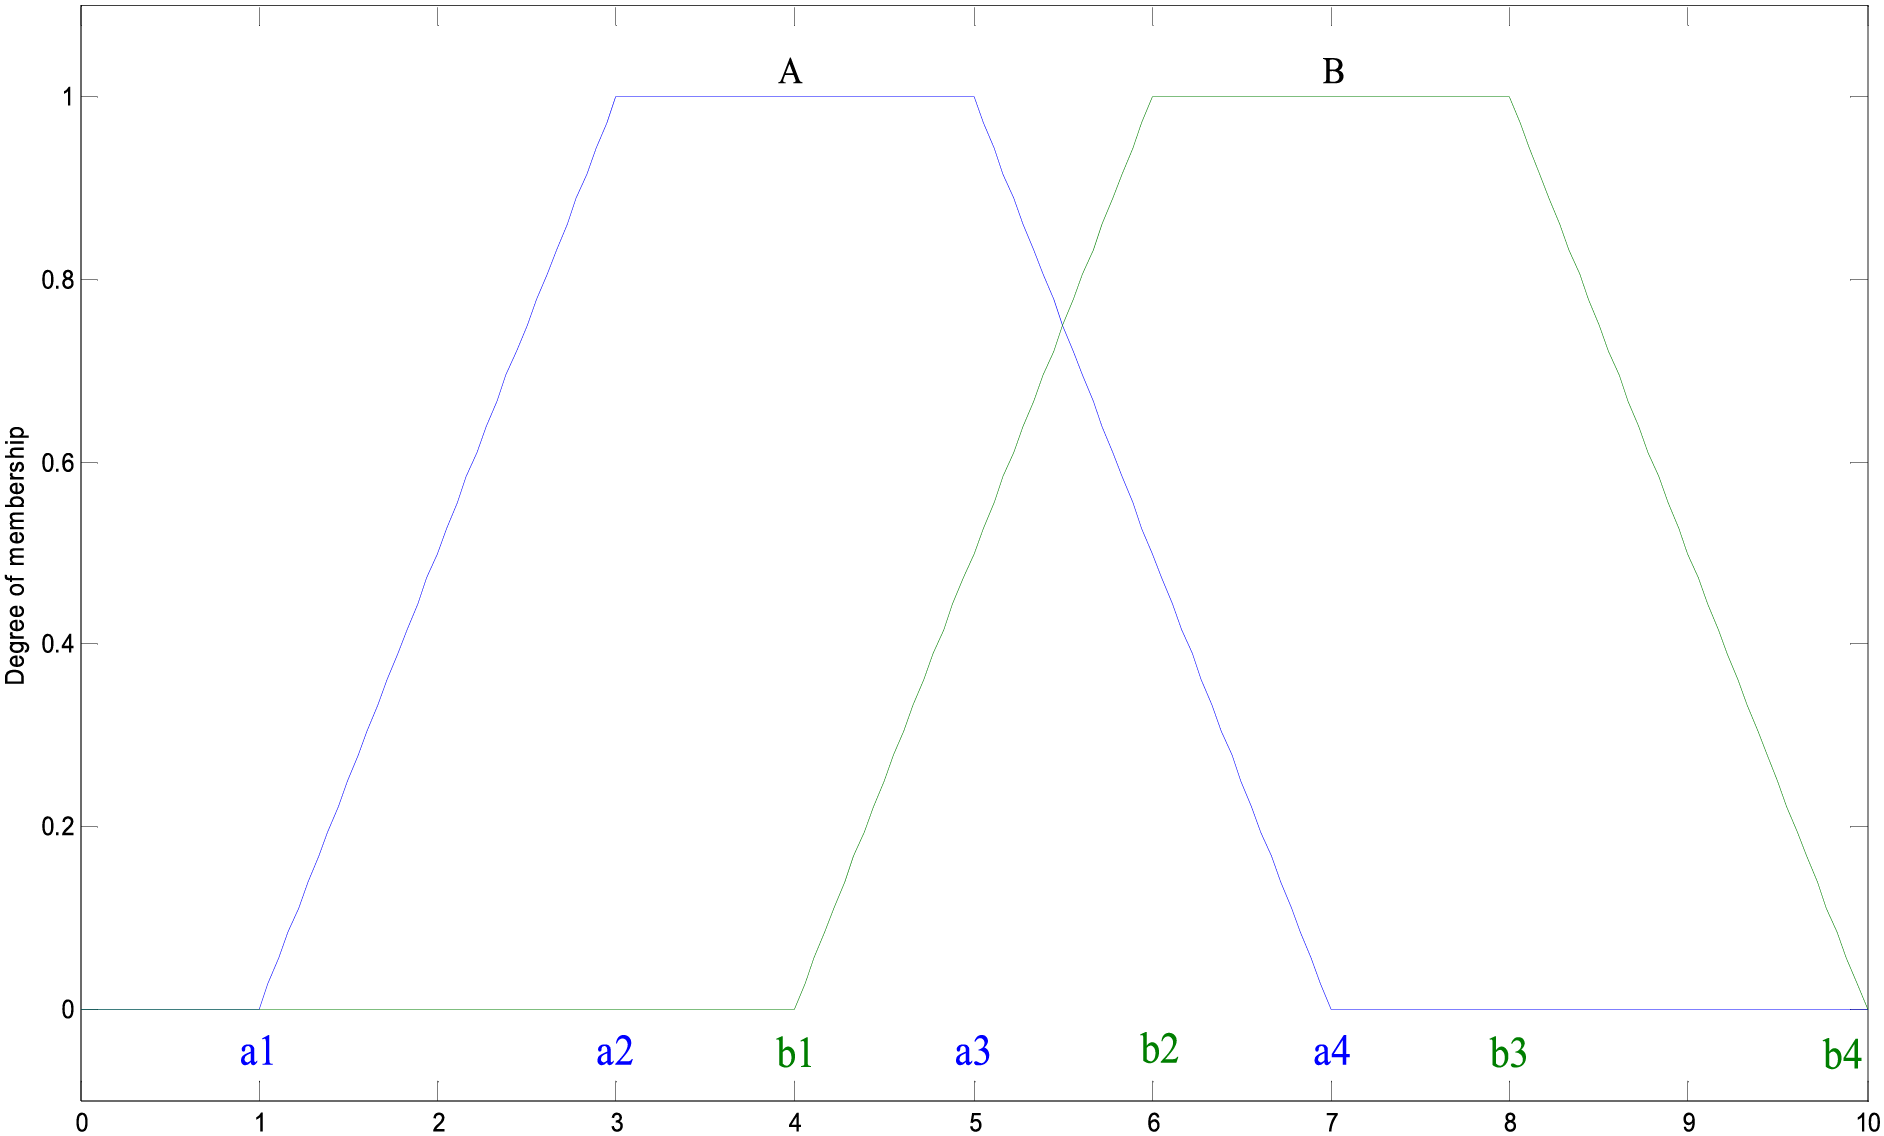
Figure 2: Fuzzy set of a trapezoidal membership function
The core of fuzzy logic operations is the fuzzy rule, which is a statement of the form IF (preconditions)–THEN (consequences). The commonly used operations in fuzzy rules are described as follows. (i) The “AND” operator: the intersection of two fuzzy sets
2.1.3 Steps of Fuzzy Inference
The membership function represents the fuzzy membership degree of an element through fuzzification, which is the process of mapping a definite value to the element’s corresponding membership function. Defuzzification is the opposite process of fuzzification and involves converting the fuzzy results obtained through inference to a definite value. The steps of fuzzy inference are as follows: (i) crisp fuzzification by applying membership functions with several rule conditions to fuzzify crisp input values and determine membership degrees; (ii) calculation of the compliance strength of fuzzy rules by using the membership degree of the rule conditions (these calculations include an intersection or algebraic product for AND or a union or algebraic sum for OR); (iii) evaluation of the membership function of the rule according to the compliance strength weight by using the intersection or algebraic product; (iv) aggregation of the weighted results for each rule by using the union or algebraic sum; and (v) defuzzification of the result obtained with the aggregated membership functions by using the center of the area or the mean of max method to obtain a definite value (i.e., the membership degree).
The purpose of this study is to evaluate the importance of different construction factors and identify the critical construction factors that affect construction quality. To achieve these objectives, definite values of three variables, namely defect frequency, inspection score, and construction progress, were fuzzified using membership functions. Fuzzy inference, defuzzification, and IF-THEN rule conditions (preconditions) were then applied to calculate the definite value of the fuzzy set.
An ANN can be described as a structure of closely interconnected adaptive simple processing elements, which are known as artificial neurons or nodes, that can perform large-scale parallel computations for data processing and knowledge representation [46]. Each neuron generates a series of real-valued activations. Input neurons are activated through external sensors for collecting environmental data; other neurons are activated through weighted connections from previously active neurons [24]. The output of a neuron can be expressed using Eq. (7), where xi is the input value, wi is the weight of the neuron’s connection, bi is the bias value, and yi is the output value. The artificial neurons acquire external information, and various learning methods are applied to train the network structure to achieve the desired output.
The deep neural network structure comprises an input layer, hidden layers, and an output layer. The input layer contains the independent variables, and the output layer produces the solution of the studied problem [47]. Hidden layers are located between the input and output layers and serve as a self-interacting internal structure that solves nonlinear problems. The number of neurons and hidden layers might vary in accordance with the complexity of the data. In general, complex problems require a high number of neurons, and an excessive number of hidden layers can increase computation time and risk local optimization and overfitting.
During training, the input parameters of an ANN are randomly initialized. It then iteratively calculates an output and compares this output with the ground-truth results by using a loss function. The parameters are then continuously updated until the value of the loss function is minimized. Iteration stops when an error threshold is reached. The value of the loss function is the difference between the output and the predicted value and is used as a feedback signal to update the weights and bias of neuron connections according to the error of the loss function (such as cross-entropy). The loss function can be used to measure the learning error (loss) for the training samples, as expressed in Eq. (8), in which Yi’ and Yi are the ground-truth labels and predicted probability distributions, respectively. In backpropagation (BP), the loss function is minimized by backpropagating the error through the network to adjust neuron weights by using an objective function to compute an optimal combination of weights and biases. Because BP allows complex nonlinear relationships to be mapped from inputs to outputs, it can approximate continuous functions and achieve model learning goals. Gradient descent is a technique in which the weight and bias parameters are adjusted in the opposite direction of the error gradient to reduce the total error in each iteration until an error threshold is reached.
An ANN uses nonlinear functions, which are known as activation functions, to approximate any function. Typically, continuous, nonlinear, and differentiable functions are used as activation functions to facilitate the calculation of the loss function gradient for BP. In summary, a two-layer neural network can approximate most functions. In an ANN, not only the output layer but also each hidden layer requires an activation function to produce the input for the next layer. Two activation functions commonly used in ANNs are the Sigmoid function and rectified linear unit (ReLU). The Sigmoid function exhibits the drawback of gradient vanishing in deep neural networks; by contrast, ReLU can solve the gradient vanishing problem but causes neurons to stop learning if they receive negative inputs (silencing neurons).
2.3 Construction Inspection Data and Research Framework
The Taiwanese government established the Public Project Construction Inspection System in 1993 to ensure quality across various construction stages through an effective construction management framework. Inspection committee members conduct on-site assessments of construction projects using a standardized ‘Quality Deficiency Deduction Record Form’ as a guide. Construction progress, inspection scores, defects, and project levels are systematically recorded by the overseeing agency in the Project Construction Management Information System (PCMIS). This data include forms completed by experts and scholars (committee members) during quality inspections of construction sites throughout the construction process. Thus, the data are consistent, objective, and representative of Taiwanese construction standards. These inspection results are used to enhance contractor quality management and ensure that supervisory units adhere to quality management practices, thereby raising standards in public projects. A systematic approach to construction management, along with effective control measures during the construction phase, is essential for meeting quality standards.
The government systematically collects inspection data from committee members in the PCMIS, which is then subjected to statistical analysis to identify improvement opportunities and enhance the performance and management of public projects. This extensive database, containing over 30 years of inspection data across various construction stages, enables accurate analysis of the relationships between construction factors and quality. Additionally, these results can inform the development of effective construction management strategies. The inspection data include both textual and numerical records, documenting the entire construction inspection process. Soft computing techniques can be applied to extract rules and identify patterns within this data, generating valuable insights to support construction management and performance evaluation. Managers can leverage these insights to make more informed decisions. However, the data are often complex and high-dimensional, requiring the identification of key feature variables relevant to specific problems. Preprocessing steps are essential to eliminate errors and simplify models, thereby enabling more effective exploration and analysis through soft computing methods.
Preprocessing is the process of cleaning, selecting, and transforming data to generate a complete and accurate data set. This process is crucial for effective data access, analysis, and application. Data cleaning involves identifying and correcting errors, inconsistencies, and missing values in the data. Flah et al. [48] indicated that some algorithms might focus excessively on missing values and outliers, which results in reduced prediction accuracy. Data selection involves choosing a specific subset of the data that is relevant to the analysis or application. Data transformation involves converting data into a format that is appropriate for the desired analysis or application. The implementation of the aforementioned steps can enable the generation of a complete and accurate data set that can be effectively used for data access, analysis, and application.
Data cleaning, selection, and transformation were applied to the construction data set collected in this study. Construction inspection data often contain errors that must be corrected and identified. Therefore, cleaning involves removing missing, incomplete, abnormal, outlier, invalid, and inconsistent data. In data selection, fuzzy logic is used to calculate the weight of each construction factor and select the most important features in the data (critical construction factors) for subsequent model training and testing. This process facilitates the selection of relevant data and feature variables to produce a superior model that does not exhibit overfitting. In data transformation, text data are converted into a binary or numerical format that can be read by an ANN to obtain a prediction model with optimal learning ability. Akinosho et al. [49] stated that obtaining optimal model performance requires preprocessing and data cleaning as well as subsequent hyperparameter adjustment and model verification.
In this study, construction inspection data from the PCMIS spanning from 1993 to 2022 were collected and analyzed. The preprocessing phase involved obtaining five types of data: 987 construction projects, inspection scores, 499 distinct defect types, 6615 recorded defect occurrences (defect frequency), and construction progress. Due to the high dimensionality and complexity of the defect data, fuzzy logic was applied to convert defect characteristics into fuzzy data, providing a more flexible representation. Through fuzzy inference and using three variables (inspection score, defect frequency, and construction progress), 25 critical factors influencing construction quality were identified. These crucial factors were then used as inputs for an Artificial Neural Network (ANN) model to predict construction quality outcomes. Leveraging official inspection data collected under consistent standards over nearly three decades enabled reliable analysis within a complex, uncertain, and evolving construction environment. By identifying these critical factors, the study aimed to develop a robust model for more effective construction quality prediction. The research process was structured into four main steps, as shown in Fig. 3.
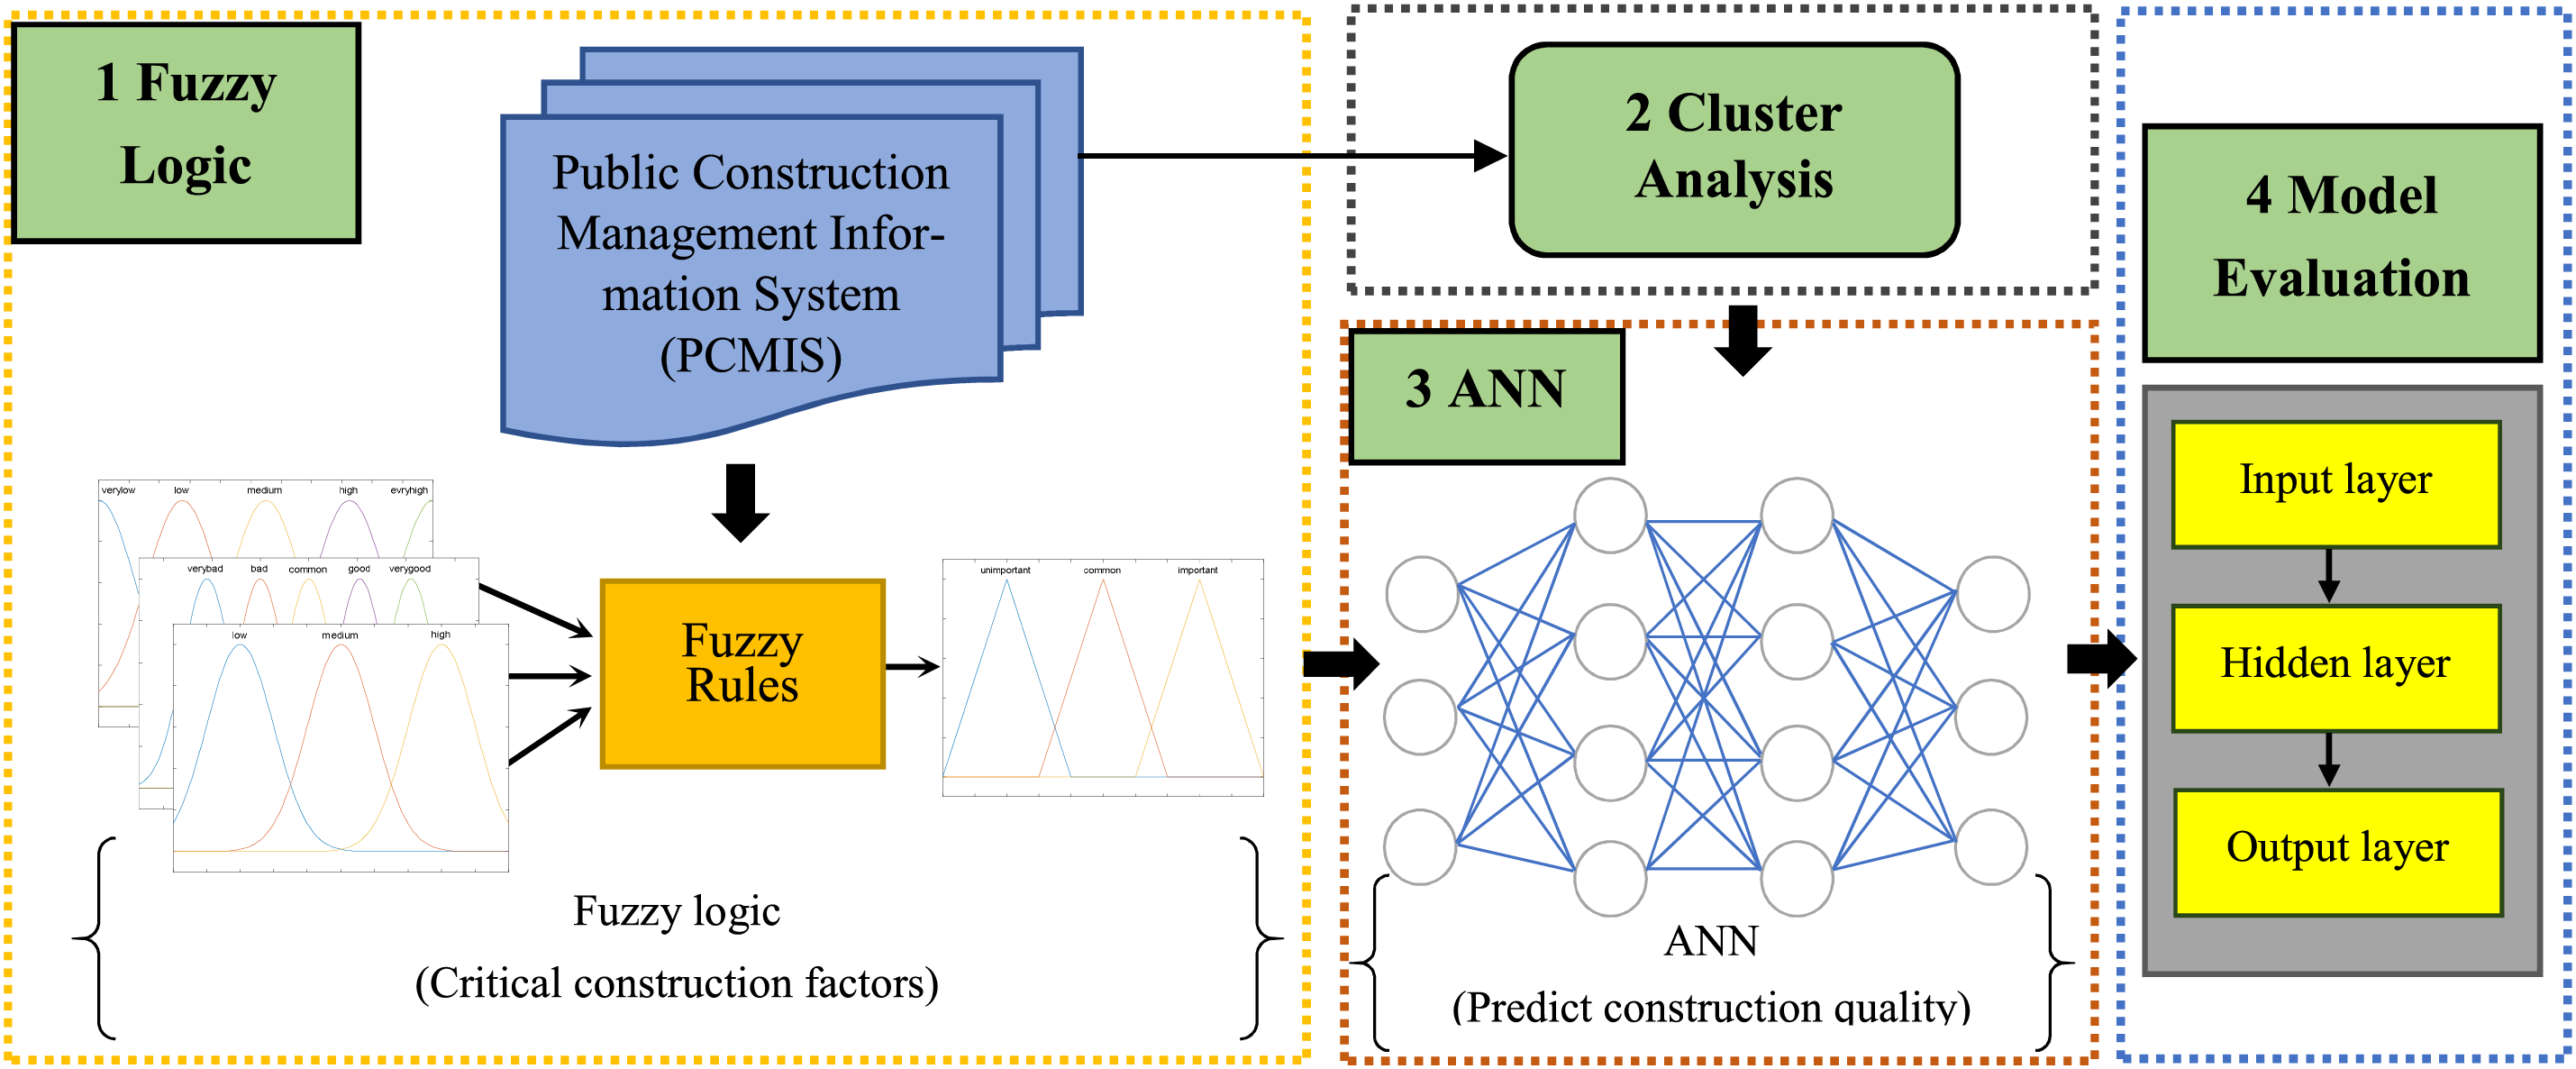
Figure 3: Framework and workflow of this study
(1) Fuzzy Logic: In the fuzzy logic approach, a set of variables is described using membership functions to represent fuzzy concepts. This method allows for handling uncertainty by quantifying the degree to which each variable belongs to a particular set. Through a fuzzy-rule-based inference process, the membership degree of each variable is determined, which helps assess its influence on construction quality. The critical construction factors identified through this process are used as input variables for the predictive model, enabling a more nuanced analysis of construction quality.
(2) Cluster Analysis: Cluster analysis was conducted on the defect frequency data and inspection scores to categorize construction projects into groups with similar characteristics. The projects were divided into two clusters: a high-quality cluster and a low-quality cluster. This clustering process helps differentiate projects based on quality, even when the inspection scores fall within a narrow range. By regrouping the data, each cluster ends up with a comparable number of projects, which effectively serves as a target (label) for predicting construction quality.
(3) ANN: The ANN model developed in this study consisted of an input layer with 26 variables: 25 critical construction factors identified earlier, along with the construction quality label derived from the cluster analysis. The model also included six hidden layers with a total of 1060 neurons, allowing it to capture complex relationships within the data. The output layer consisted of a single output variable that predicted the probability of a construction project belonging to a specific quality cluster. For the activation functions, the input and hidden layers used ReLU, while the Sigmoid function was applied to the output layer to generate a probability score.
(4) Model Evaluation: The dataset was split into a training set (80%) and a testing set (20%) to evaluate the model’s predictive performance. The prediction accuracy and learning error of both the fuzzy logic and ANN models were assessed to validate the relationship between the identified critical construction factors and the overall quality of the construction projects. This evaluation helped confirm the models’ ability to predict construction quality effectively.
This research is based on the idea that soft computing techniques can predict or describe large datasets. First, fuzzy logic was used to infer the weights of 499 construction factors and 25 critical construction factors were ultimately identified and input into an ANN. The ANN was then trained to predict construction quality. Finally, the performance of the prediction model was evaluated to confirm the effects of the critical construction factors on project performance. The hybrid soft computing technique proposed in this paper is a powerful tool that enables the automatic learning of rules and the acquisition of knowledge from actual construction data. Project managers can use this technique to systematically identify factors affecting construction performance. Moreover, the predicted results obtained with this technique can be used by managers to design preventive strategies and corrective measures for effectively improving construction quality.
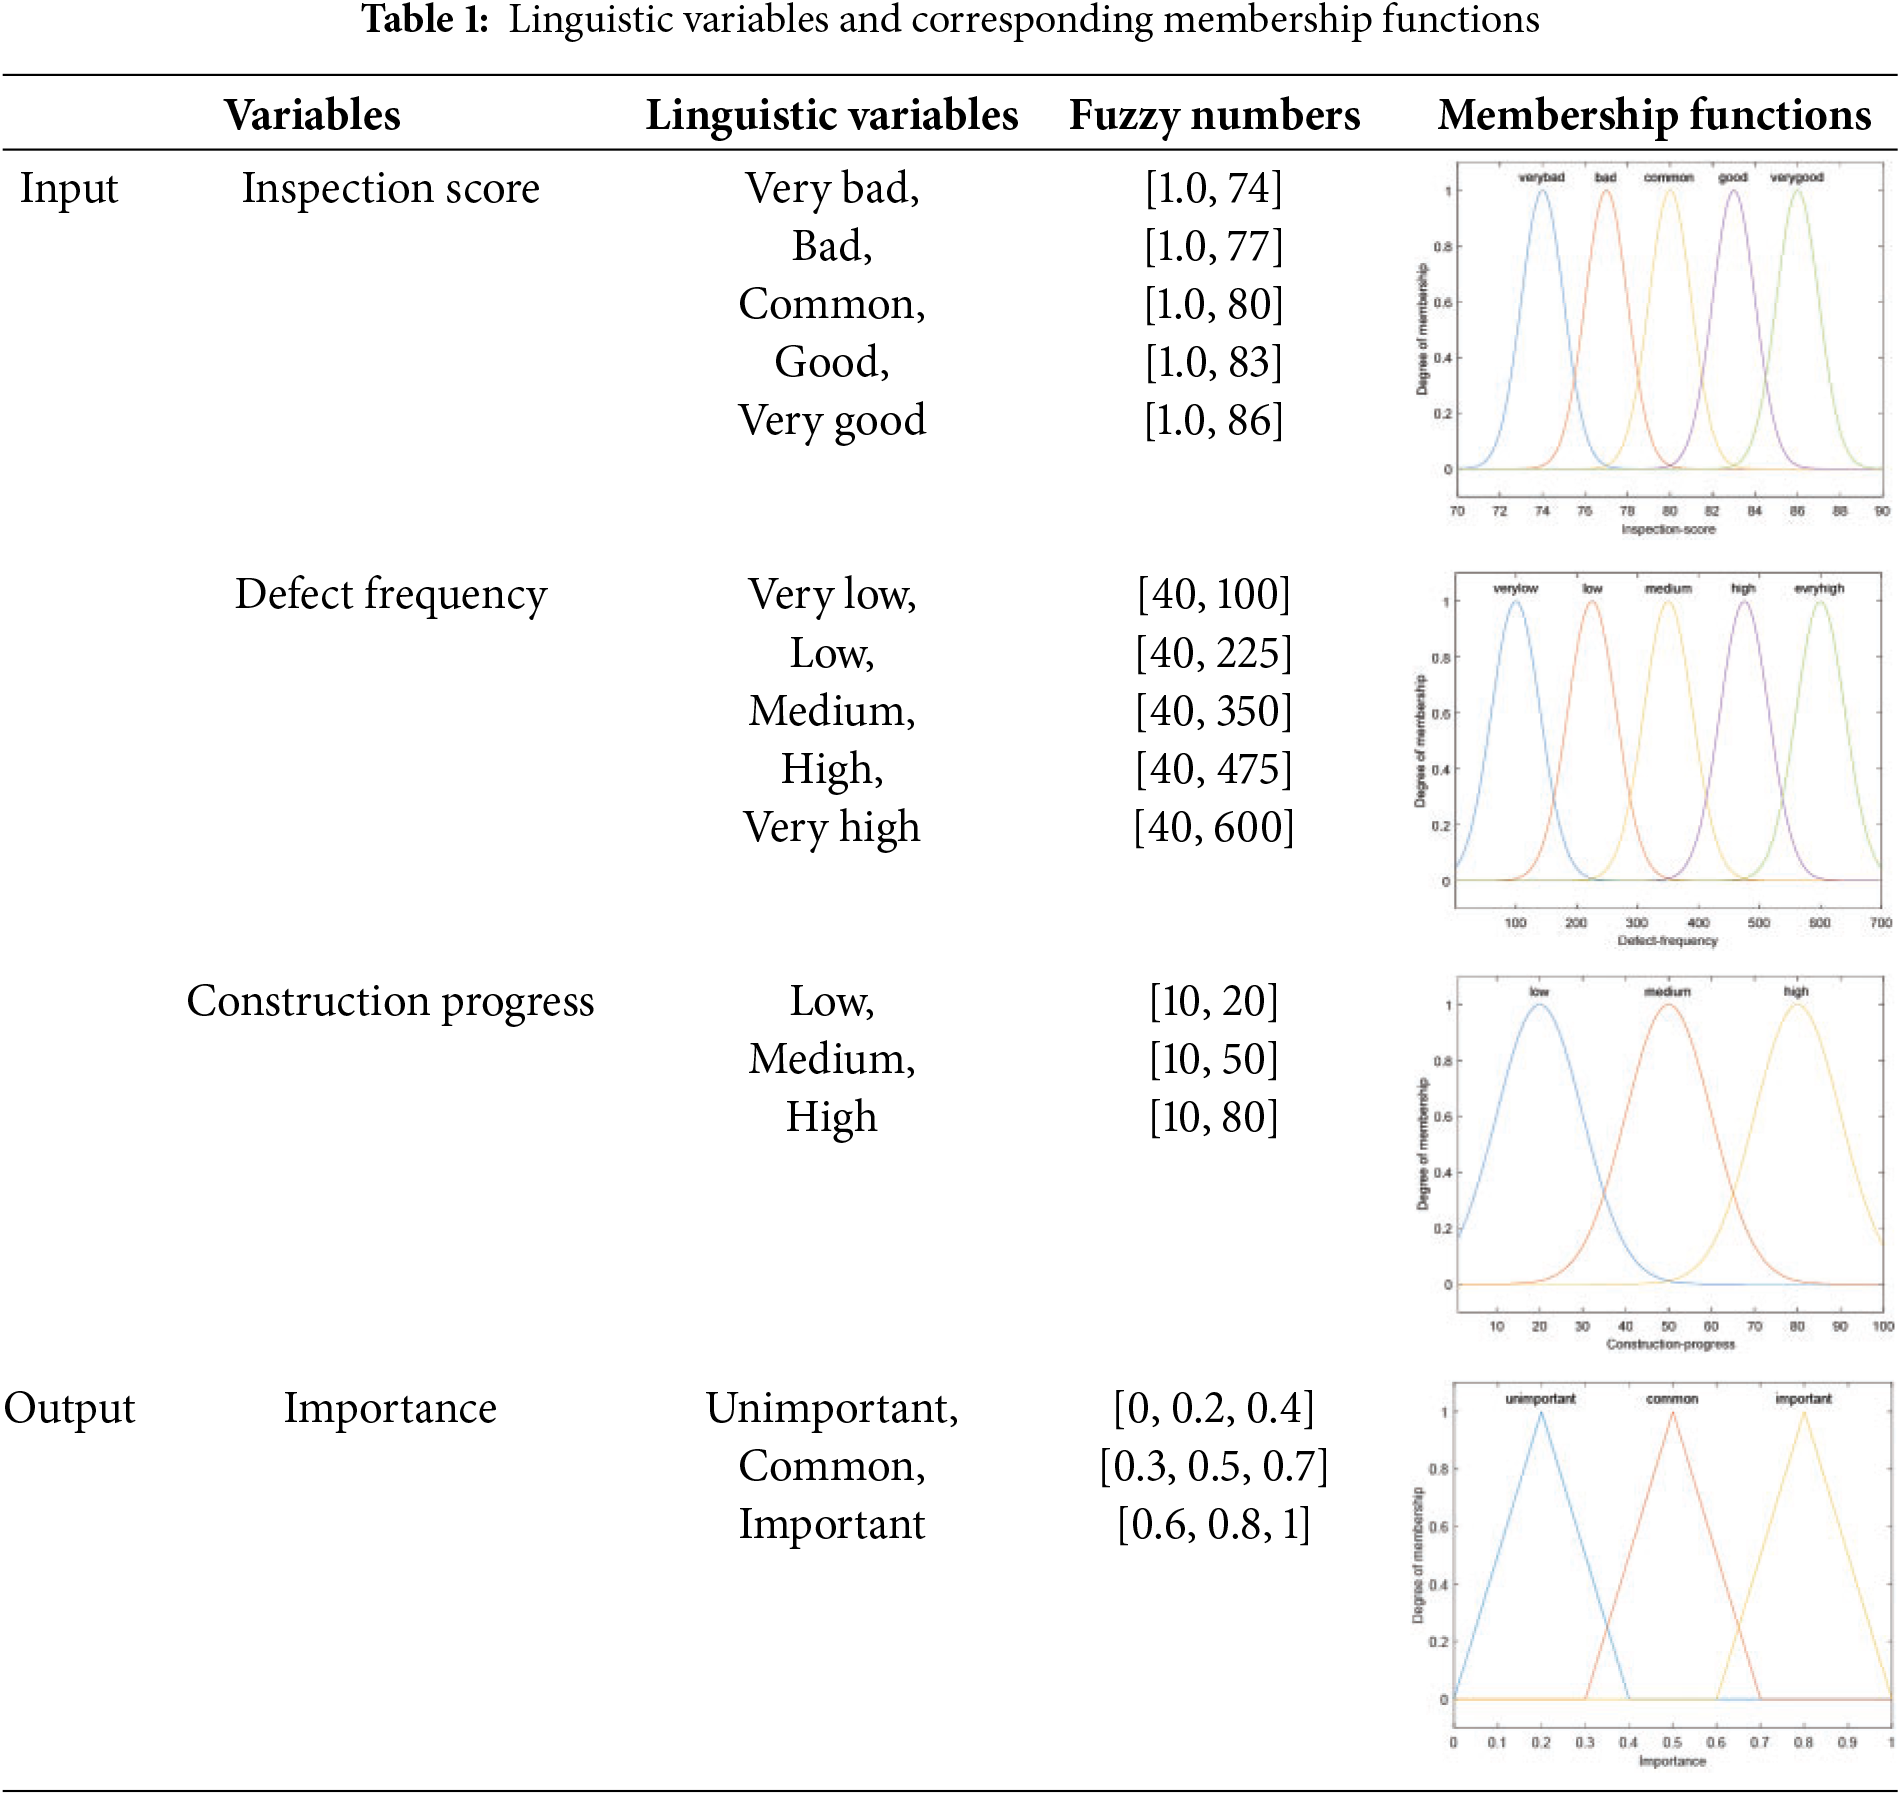
Construction quality defects refer to any functional deficiencies or noncompliance with specifications and regulations in construction products [50]. However, each project occurs in a unique location and environment and is subject to numerous unpredictable risks. In this research, fuzzy logic was used to weigh the construction factors and identify 25 critical construction factors in inspection data from a standardized construction inspection system. By considering the characteristics and value ranges of the PCMIS inspection data, fuzzy numbers were assigned to the linguistic variables. The input variables were defect frequency (times), inspection score (points), and construction progress (%), and the output variable was important (Table 1). In the fuzzy inference process, the three input values were fuzzified, and the membership function produced during the fuzzification process represented the value obtained after fuzzification. The definite input value was added to the previously defined fuzzy set, and the membership function was used to determine the membership degree of each variable.
Fuzzy logic involves using “fuzzy sets” and “membership functions” to assign a membership degree to an element within a set. A fuzzy set is a set of elements in which each element has a membership degree between 0 and 1 instead of a binary status of “member” or “not a member” as in a traditional set. The membership function, which is often represented by a graph, assigns a membership degree to each element within the set based on the input value.
The Gaussian membership function presents a bell-shaped curve that is symmetric and smooth. The peak of the Gaussian distribution marks the center of the membership function, while its standard deviation determines the width or degree of fuzziness. Due to the smooth and normal distribution-like nature of the Gaussian membership function, it is well-suited to represent continuous and naturally transitioning fuzzy characteristics. In contrast, the triangular membership function is simpler and more intuitive, resembling a symmetric triangle shape. It is often used to represent a variable’s membership degree within a specific range, especially when boundary conditions are defined. In this study, inspection scores, defect frequency, and construction progress exhibit continuous and normally distributed characteristics; thus, the Gaussian membership function, with its smooth transition, is employed to represent these fuzzy attributes. For the importance factor, which requires a distinct value to define clear boundaries within a range, the triangular membership function is applied.
In this study, statistical analysis shows that the defect frequency range in PCMIS is between 0 and 700 occurrences, inspection scores range from 70 to 90, and construction progress ranges from 0% to 100%. A Gaussian membership function was used to model the inspection score, and five linguistic variables were established according to this score: very bad [1.0, 74], bad [1.0, 77], common [1.0, 80], good [1.0, 83], and very good [1.0, 86]. The frequency of defects was modeled using a Gaussian membership function, and five linguistic variables were established according to the number of defect occurrences: very low [40, 100], low [40, 225], medium [40, 350], high [40, 475], and very high [40, 600]. Moreover, three linguistic variables were established according to the progress: low [10, 20], medium [10, 50], and high [10, 80]. A triangular membership function was used to establish output values of unimportant [0, 0.2, 0.4], common [0.3, 0.5, 0.7], and important [0.6, 0.8, 1]. The output values can represent the importance of construction factors, allowing for the identification of crucial construction factors.
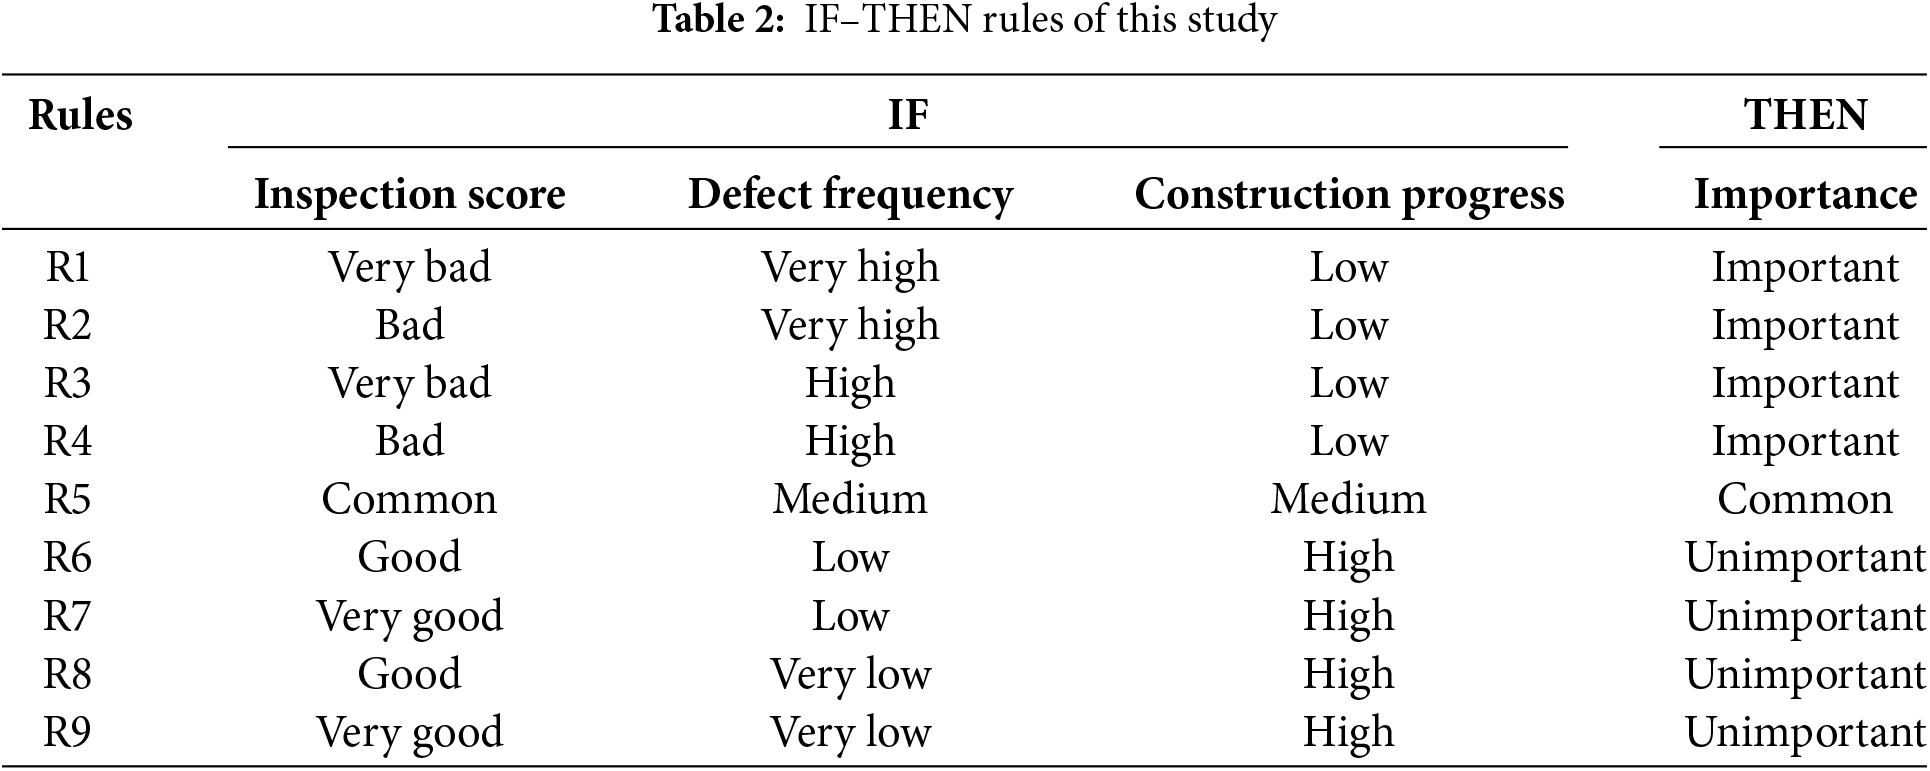
Fuzzy inference involves two parts: evaluating the antecedent (IF) of the rule and applying the result to the consequent (THEN). The antecedent is described using fuzzy sets and can include one or more linguistic variables. Input values are first transformed through fuzzification and then converted into a definite output value through defuzzification. IF–THEN fuzzy rules can be generated by experts by using prior knowledge or leveraging data characteristics. In this study, the characteristics of the construction inspection data and expert opinions were the primary tools used to establish nine IF–THEN rule conditions (Table 2). For example, if a defect in the inspection data has high frequency, the inspection score and construction progress are low, and the defect is considered important. Therefore, the corresponding fuzzy rule R1 can be represented as follows: IF “Inspection score = very bad” AND “Defect frequency = very high” AND “Construction progress = low,” THEN “Importance = important.”
The input variables (inspection score, defect frequency, and construction progress) for determining construction quality were fuzzified using membership functions to assign a membership degree to each variable. These membership degrees were then used in the fuzzy inference process, in which a set of rules was applied to determine the output variable (importance) based on the input variable’s membership degree. This step allows for a nuanced and flexible analysis of construction factors because it accounts for the uncertainty and imprecision inherent in many real-world scenarios.
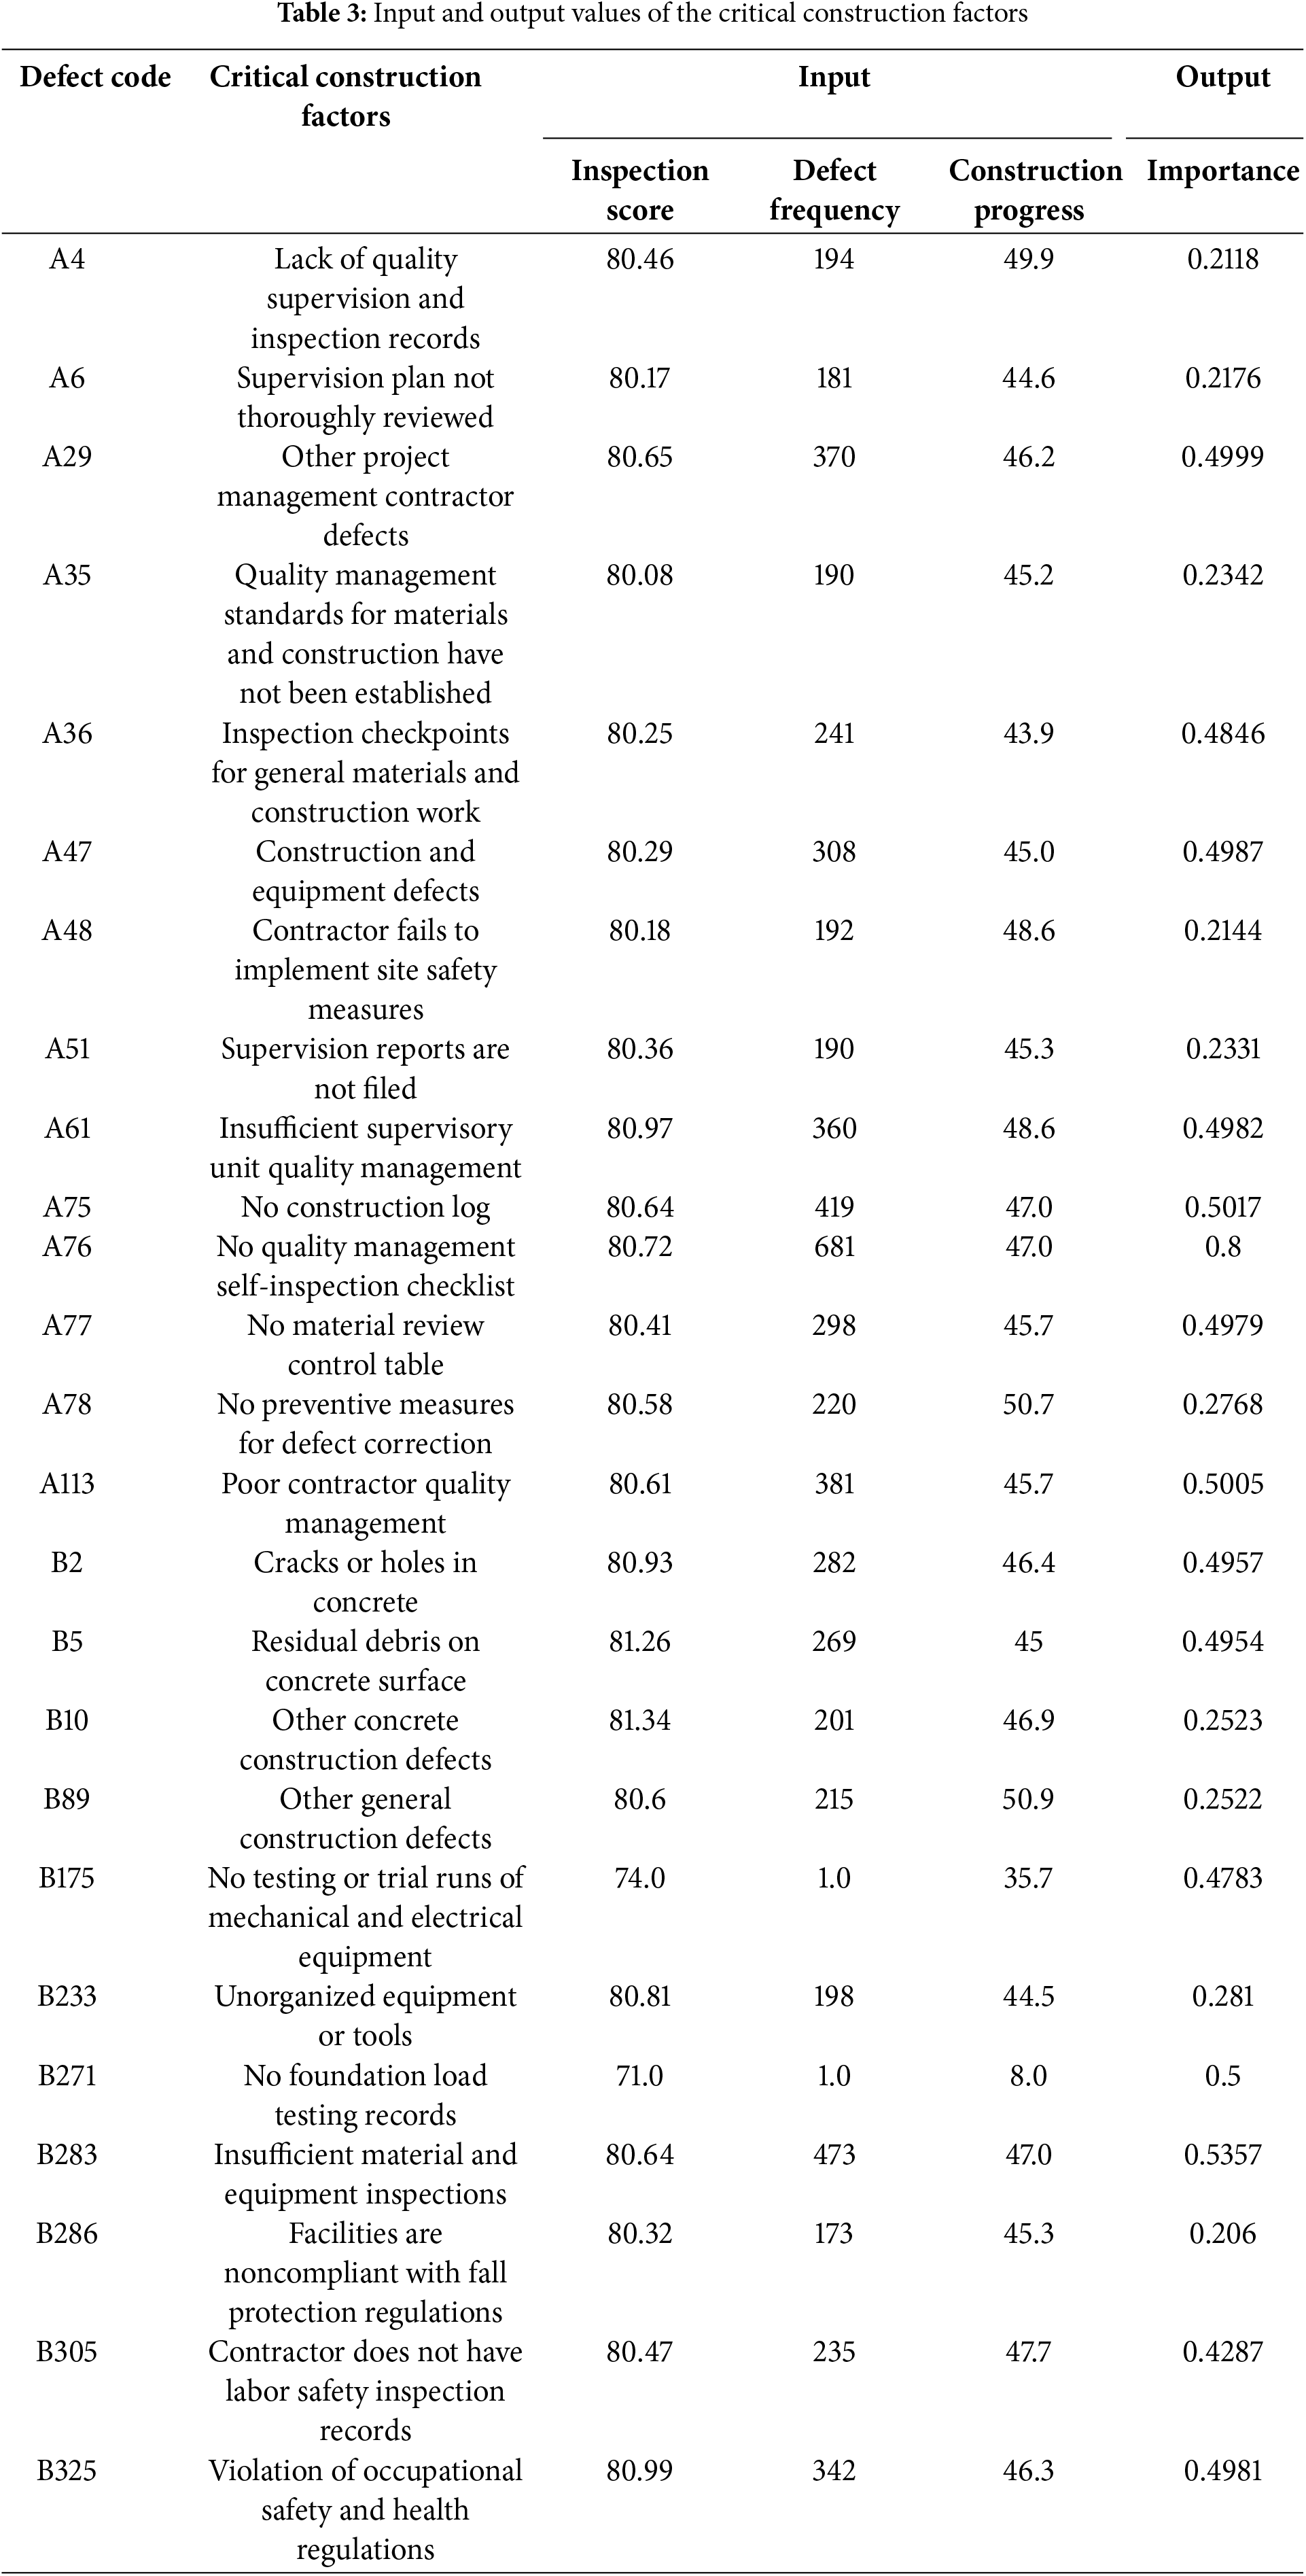
The purpose of fuzzy inference is to determine the importance of construction factors. A construction factor with higher importance has a stronger effect on construction quality. By using fuzzy logic inference and defuzzification, the inspection scores, defect frequency, and construction progress of various projects were analyzed. The results of the fuzzy inference were converted into values and mapped to appropriate values. This process involved identifying the most suitable value for representing the fuzzy set of a given rule to determine the output value for a specific construction factor. In this study, the construction factors are sourced from PCMIS, totaling 499 items. These include 113 defects in the management category (defect codes: A1~A113), 356 defects in the quality category (defect codes: B1~B356), 10 defects in the schedule category (defect codes: C1~C10), and 20 defects in the design category (defect codes: D1~D20). Given the large number of construction factors, to prevent the selection of an excessive number of minimally impactful defects—often chosen based on intuitive judgment during construction quality assessments—which may lead to biases in multi-indicator evaluations, fuzzy logic is employed to infer the more critical construction factors. In this study, most construction factors were determined to have an importance close to 0.2 (with an average value of 0.2) through fuzzy logic reasoning (Fig. 4). Using this approach, 25 crucial construction factors with importance greater than 0.205 were selected, with an average importance of 0.4 (Table 3).
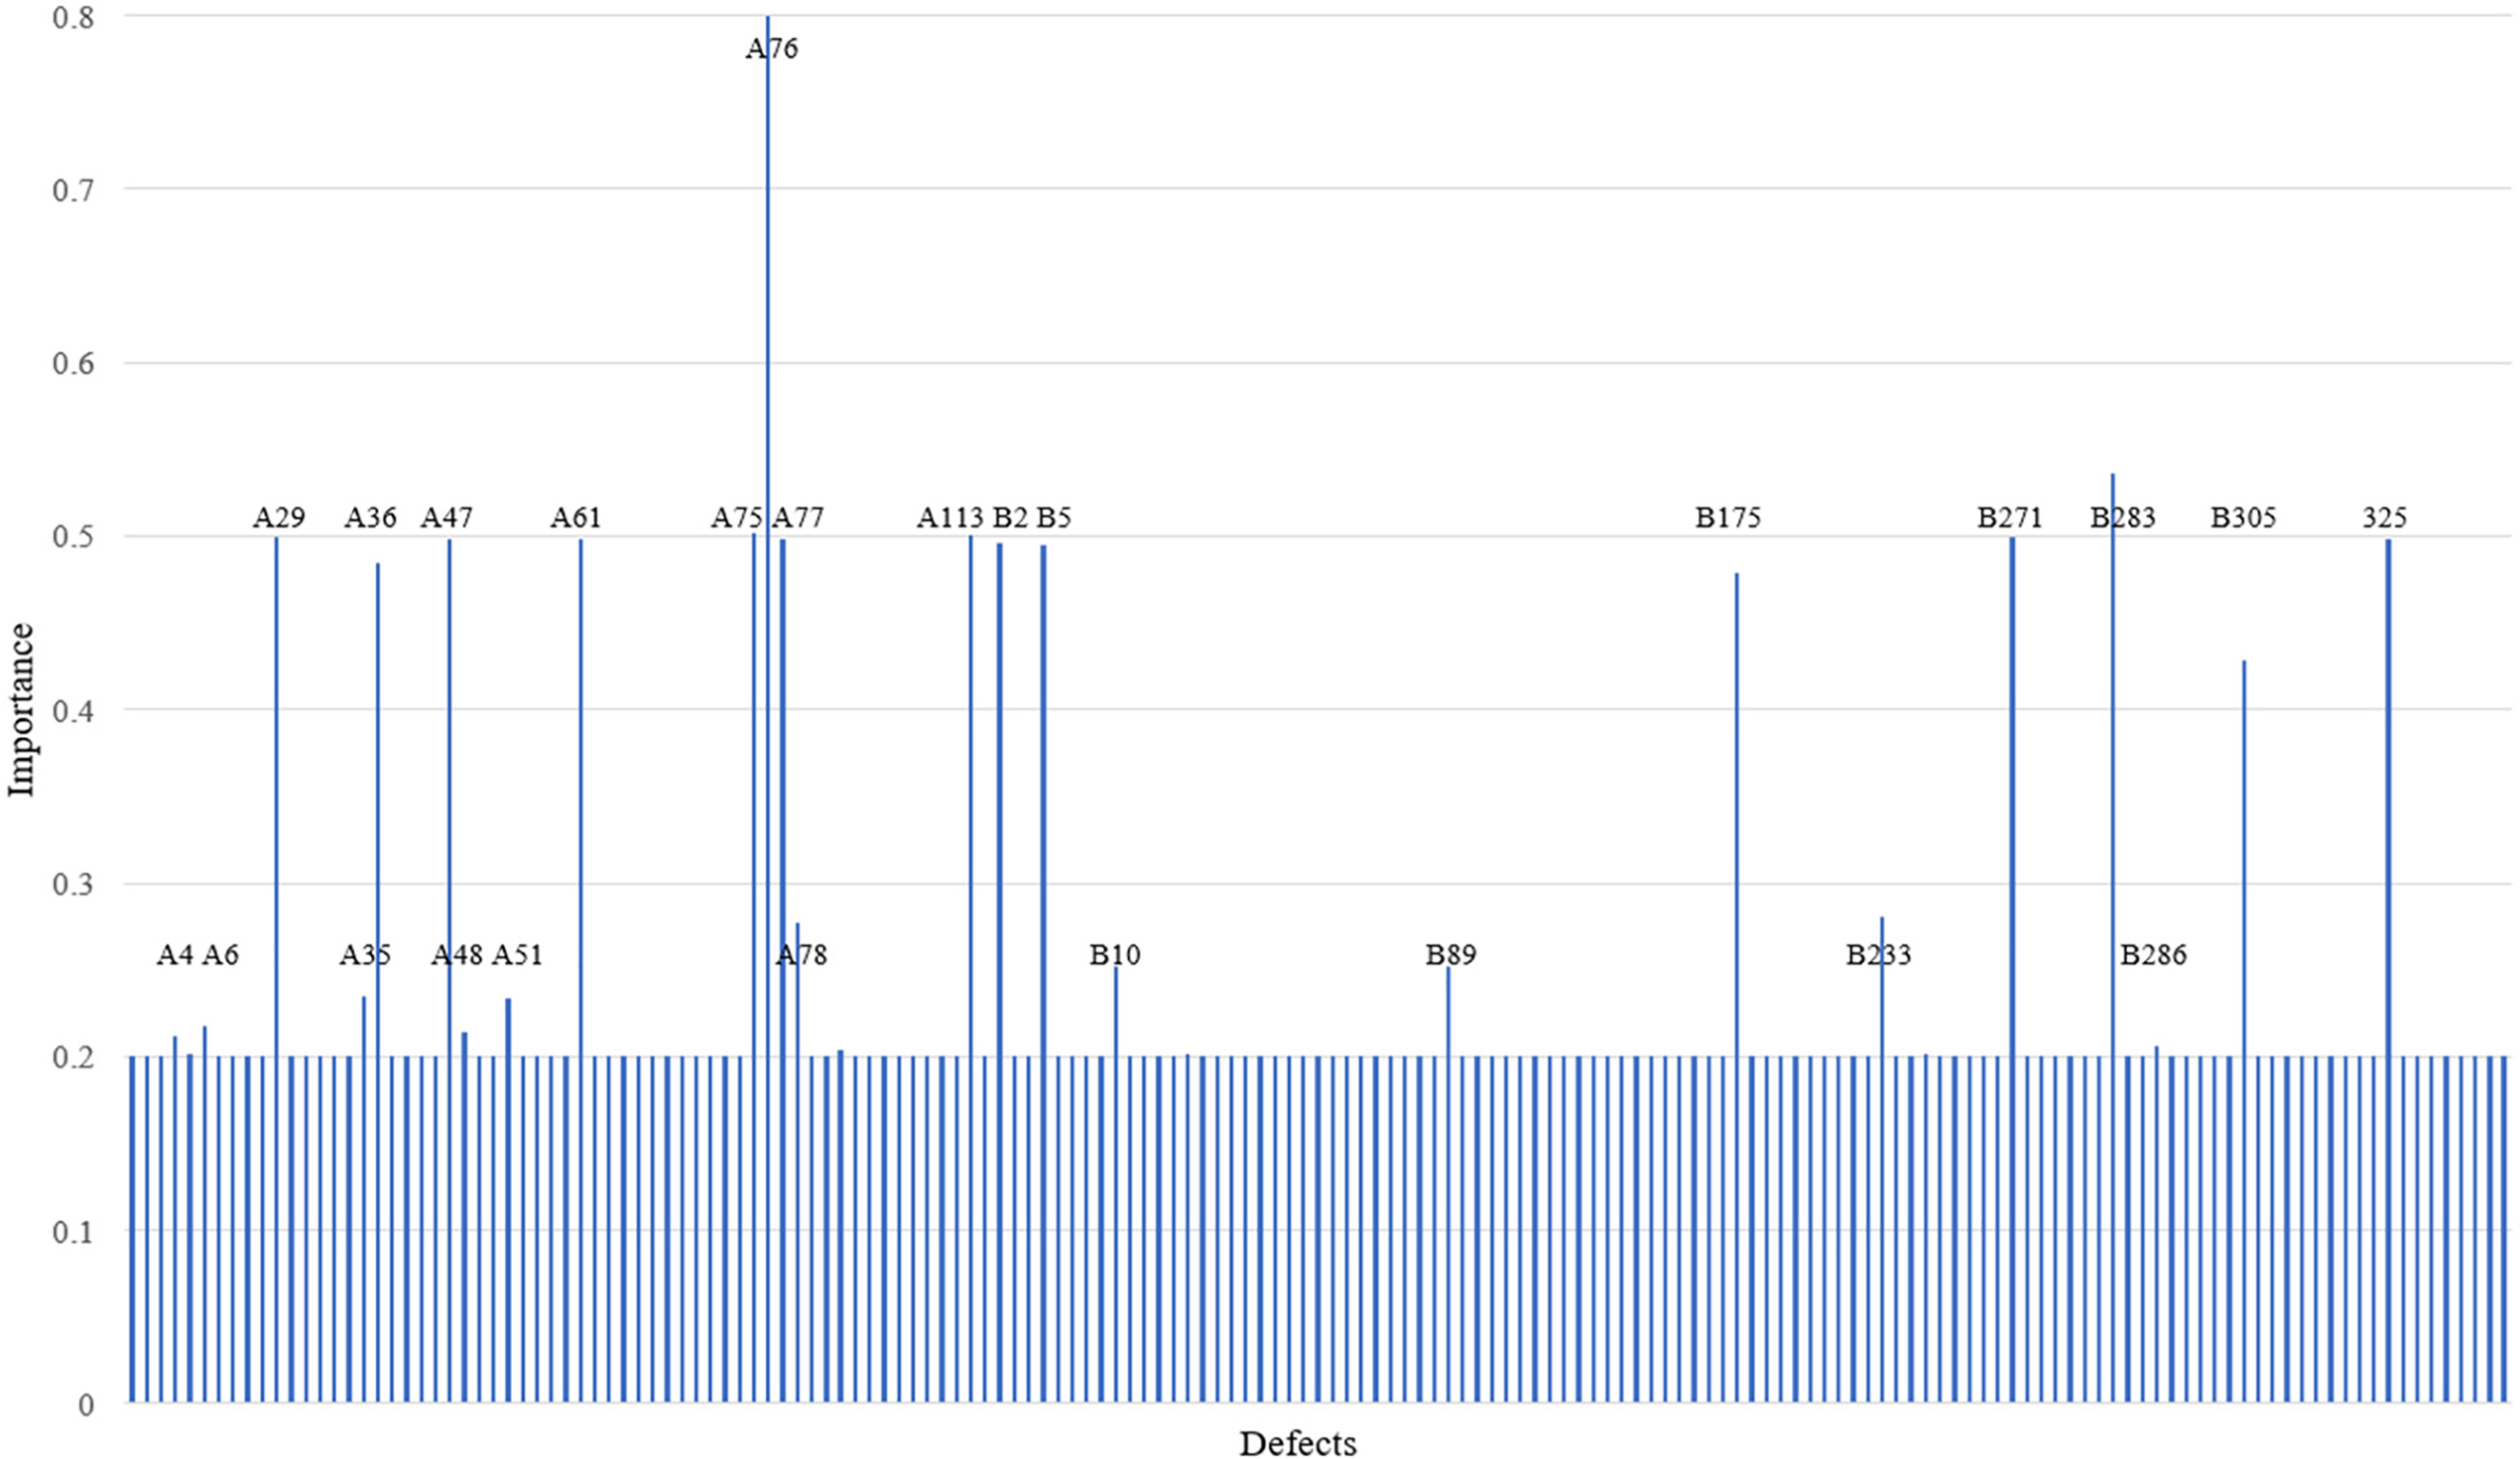
Figure 4: Importance of crucial construction factors
3.2 Analysis of Crucial Construction Factors
The attributes that affect quality during construction stages were divided into five main categories: Man, Material, Machine, Method, and Management attributes. Each of these categories was associated with some of the 25 critical construction factors (Fig. 5). The categories of Man, Material, Machine, Method, and Management attributes had an average importance of 0.43, 0.46, 0.42, 0.34, and 0.32, respectively, for eight, six, three, three, and five critical construction factors, respectively. Thus, the Man, Material, and Machine attributes were more important than were the Method and Management attributes. Among the 25 critical construction factors, “No quality management self-inspection checklist (A76)” had the highest importance, which indicated a strong correlation between quality control self-inspections and construction quality. In addition, concerning the Man attribute category, shortcomings in quality control and project management contractors (A29), supervision units (A61), and construction contractors (A75 and A113) were relatively important factors. With regard to the material attribute category, the importance of the presence of cracks in, holes in, and residual debris on concrete (B2 and B5) indicated that concrete handling is a key factor affecting construction quality.
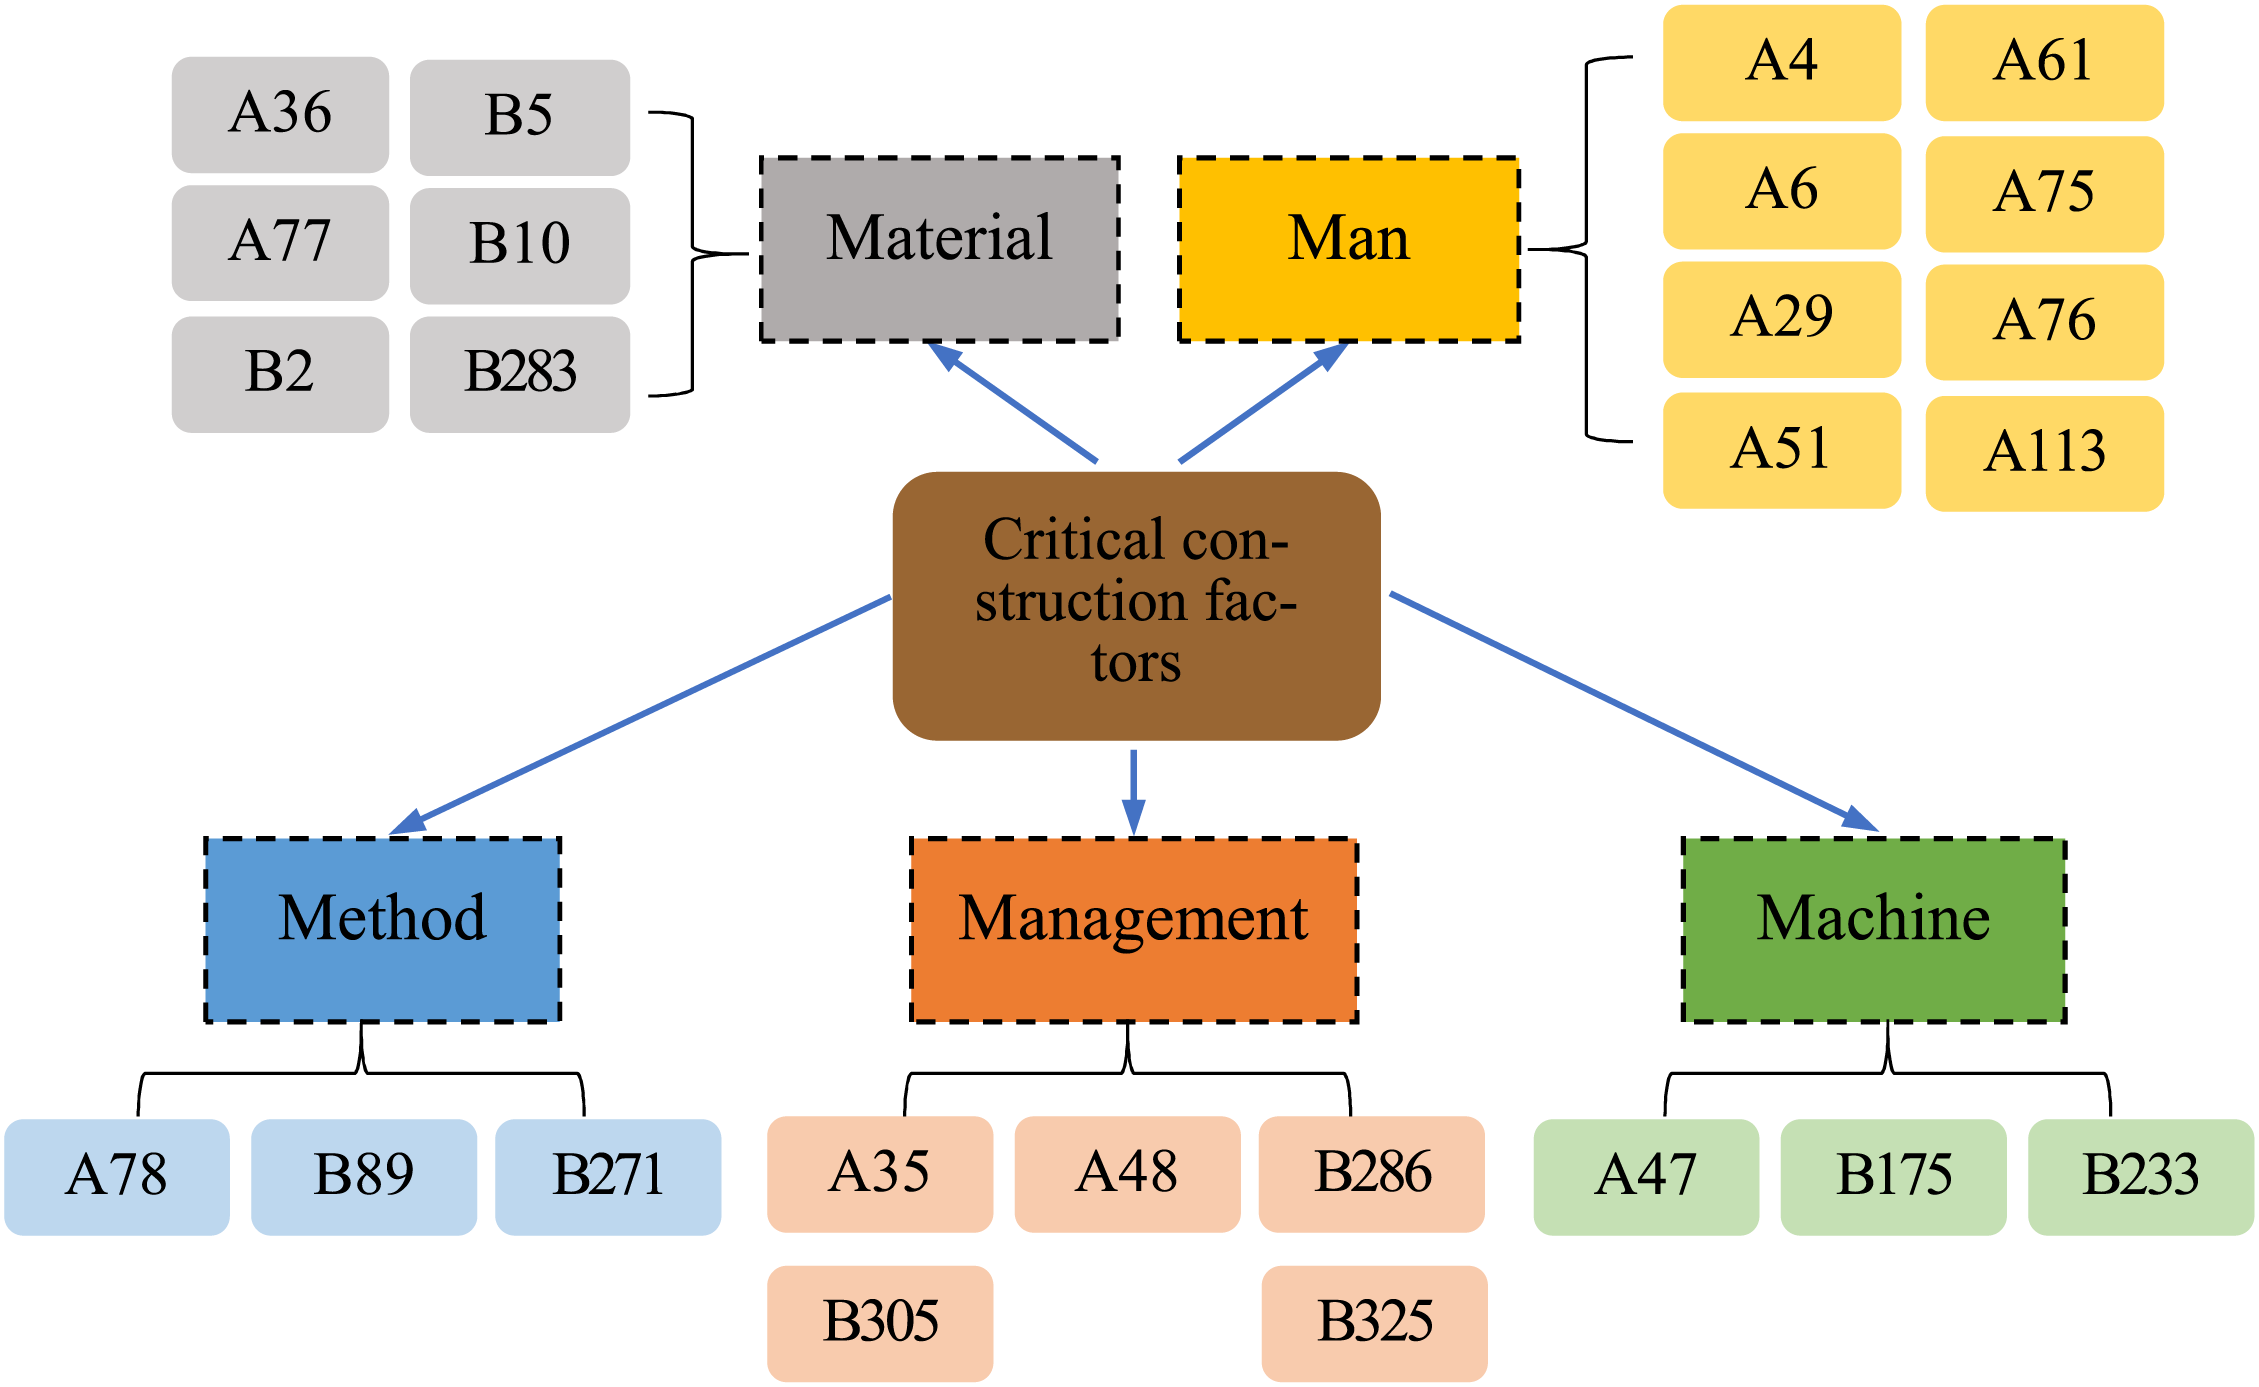
Figure 5: Five attribute categories and twenty-five critical construction factors
3.3 Results of ANN Prediction and Model Evaluation
The number of layers and the number of neurons in each layer in an ANN model affect its computational efficiency. Increases in the number of hidden layers and neurons can enhance an ANN model’s learning ability and predictive accuracy. However, deeper neural networks require more computations, are more prone to overfitting, and are more likely to encounter the vanishing gradient problem. However, by training the network layers and tuning hyperparameters, a neural network that meets practical requirements can be produced. The ANN architecture used in this study comprised one input layer, six hidden layers, and one output layer. The input layer was fed with numerical data converted from textual data for 987 construction projects. The input features were 25 critical construction factors and 1 construction quality label and had data dimensions of 26 × 1 × 987. The six hidden layers comprised a total of 1060 neurons. The number of hidden layers and neurons in the developed ANN model is sufficient for approximating complex continuous functions. A dropout of 0.5 was used because this value can improve predictive accuracy through the temporary ignoring of certain units in the neural network during calculations [48]. In the output layer, the Sigmoid activation function was used to calculate the probability of construction quality and to predict the quality outcome for each input datum.
In this study, a neural network with six hidden layers was constructed, and multiple experiments were conducted to evaluate model performance under different architectures. During testing, it was observed that six hidden layers achieved optimal predictive results while maintaining computational efficiency. The number of neurons per layer decreases from 400 to 10 (400, 300, 200, 100, 50, 10), forming a tapered structure that is typically suitable for models with progressively condensed features. In an ANN, the first hidden layer requires more neurons to capture lower-level features, and as the layers progress, the data features become increasingly condensed, allowing for fewer neurons to capture higher-level features. This gradual reduction in neurons helps reduce computational load and prevent overfitting. Given the large number of neurons in this network, dropout was added to decrease reliance on specific neurons, thus preventing overfitting during training and improving performance on the test set. The layer architecture and parameters of the developed ANN are presented in Table 4.
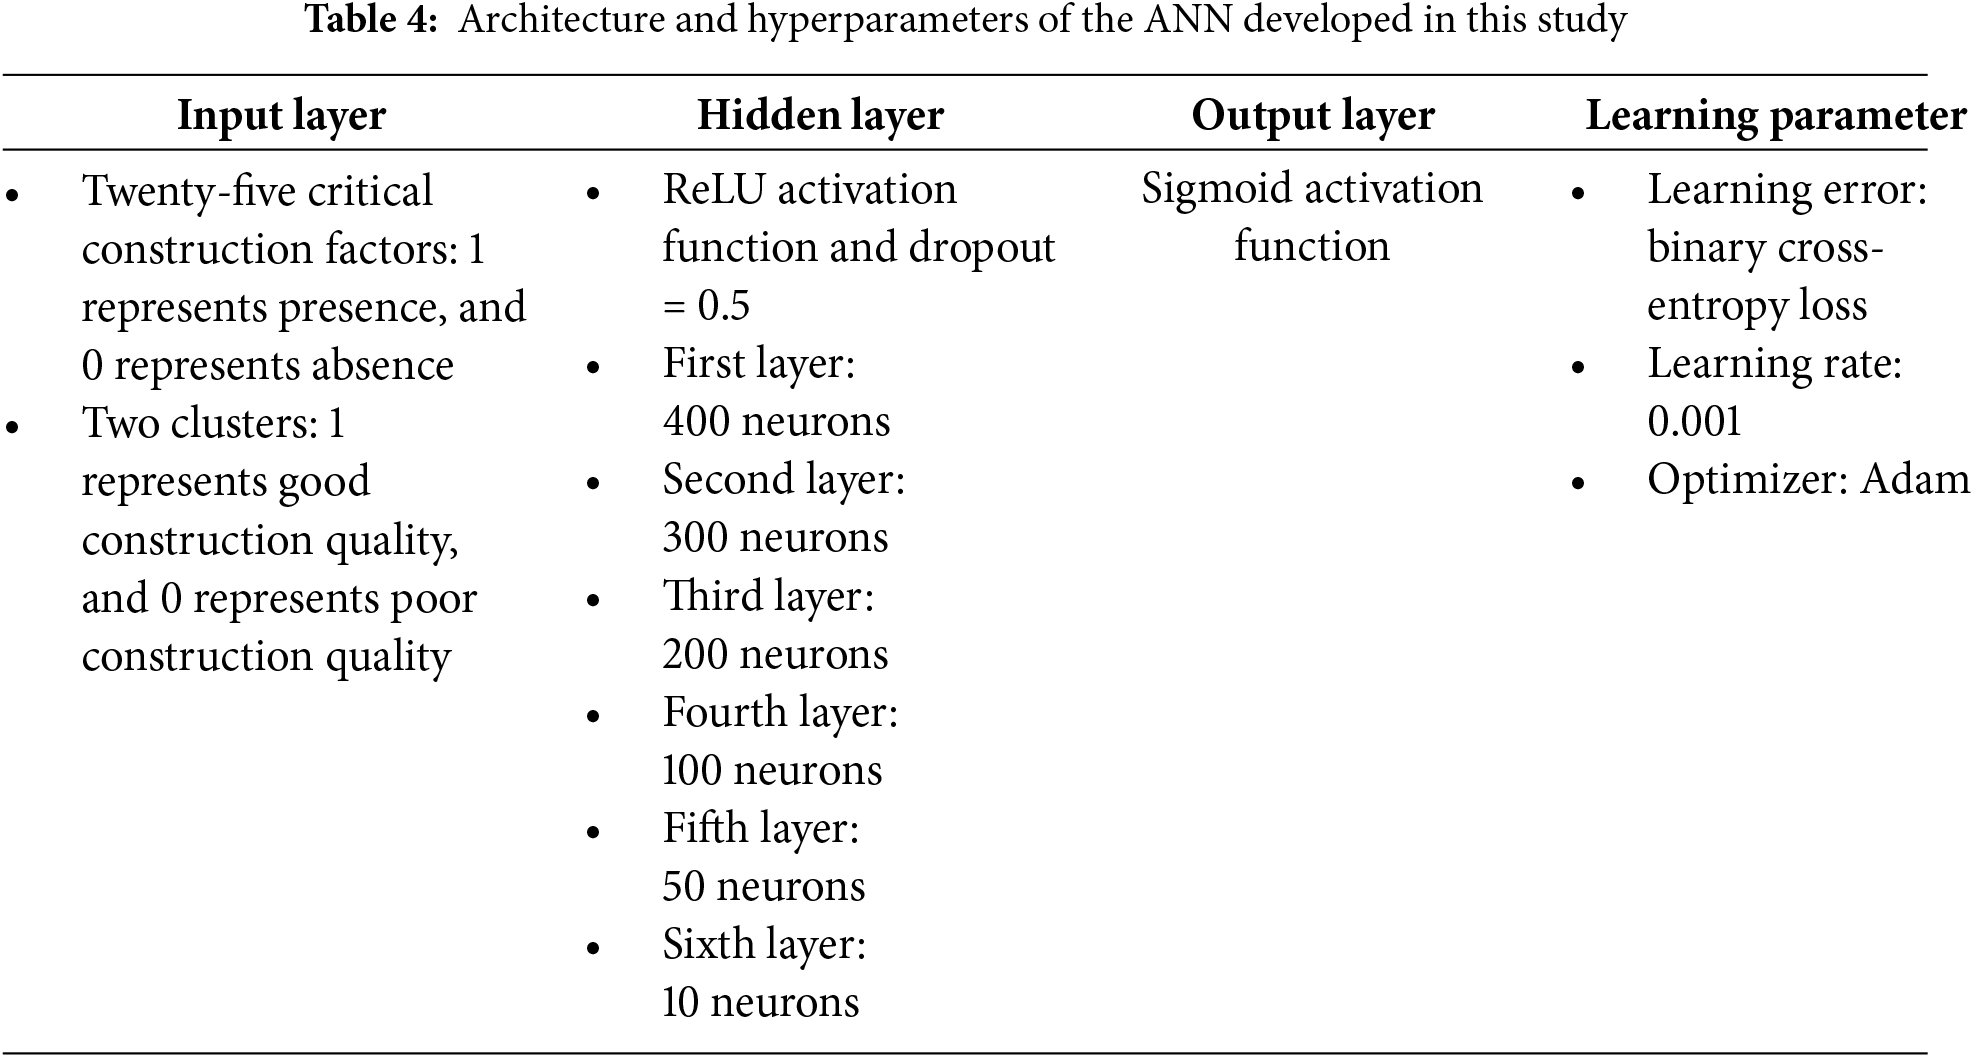
The learning rate determines network step size while optimizing weight navigation to minimize error [40]. Learning rate determines the effectiveness of ANN learning by controlling the extent of parameter updates in each iteration. An excessive or insufficient learning rate negatively affects model performance. A high learning rate can impede convergence, whereas a low learning rate can cause slow convergence. A suitable learning rate results in optimal training speed. The choice of learning rate has a significant impact on training speed and the final model performance (e.g., prediction accuracy and loss). A learning rate that is too high may lead to oscillations or convergence difficulties during training, while a rate that is too low can make the training process excessively slow. Therefore, selecting an appropriate learning rate is crucial for balancing training speed and stability. In many deep learning models, a learning rate of 0.001 is commonly used as an initial value, especially when using optimizers like Adaptive Moment Estimation (Adam), as it often strikes a good balance between training speed and stability across various tasks. The Adam optimizer combines the advantages of Momentum and Root Mean Square Prop (RMSProp), efficiently and stably updating model parameters during the training process. Adam’s base learning rate is usually set to 0.001, and this rate is not fixed; it adapts based on each parameter’s historical gradient information (including first and second moments), setting a different learning rate for each parameter. This allows Adam to adjust the update speed as needed during different training stages, thereby enhancing training effectiveness. In this study, the Adam optimizer was selected with a learning rate of 0.001 and binary cross-entropy was used as the loss function to handle the binary classification task of construction quality prediction.
Data was divided into training and validation sets. The training set was used to calculate gradients and update the weights of the connections, and the validation set was used to evaluate errors. Training stopped when the error for the training set decreased but the error for the validation set increased; at this point, the model weights had minimum errors for the validation set. To achieve high prediction accuracy, the model was repeatedly trained on the training dataset. In this study, the number of samples (batch size) used for each gradient iteration update was 30. The period for which an ANN model is trained on the same sample is called an epoch. In general, more training cycles and iterations produce a model with better performance. The model training process requires numerous epochs to achieve correct classification or prediction. In this study, the total number of epochs was set as 200, and the training and validation set accuracies were 99.32% and 99.21%, respectively (Fig. 6). Ultimately, the test set accuracy was 96.08%.
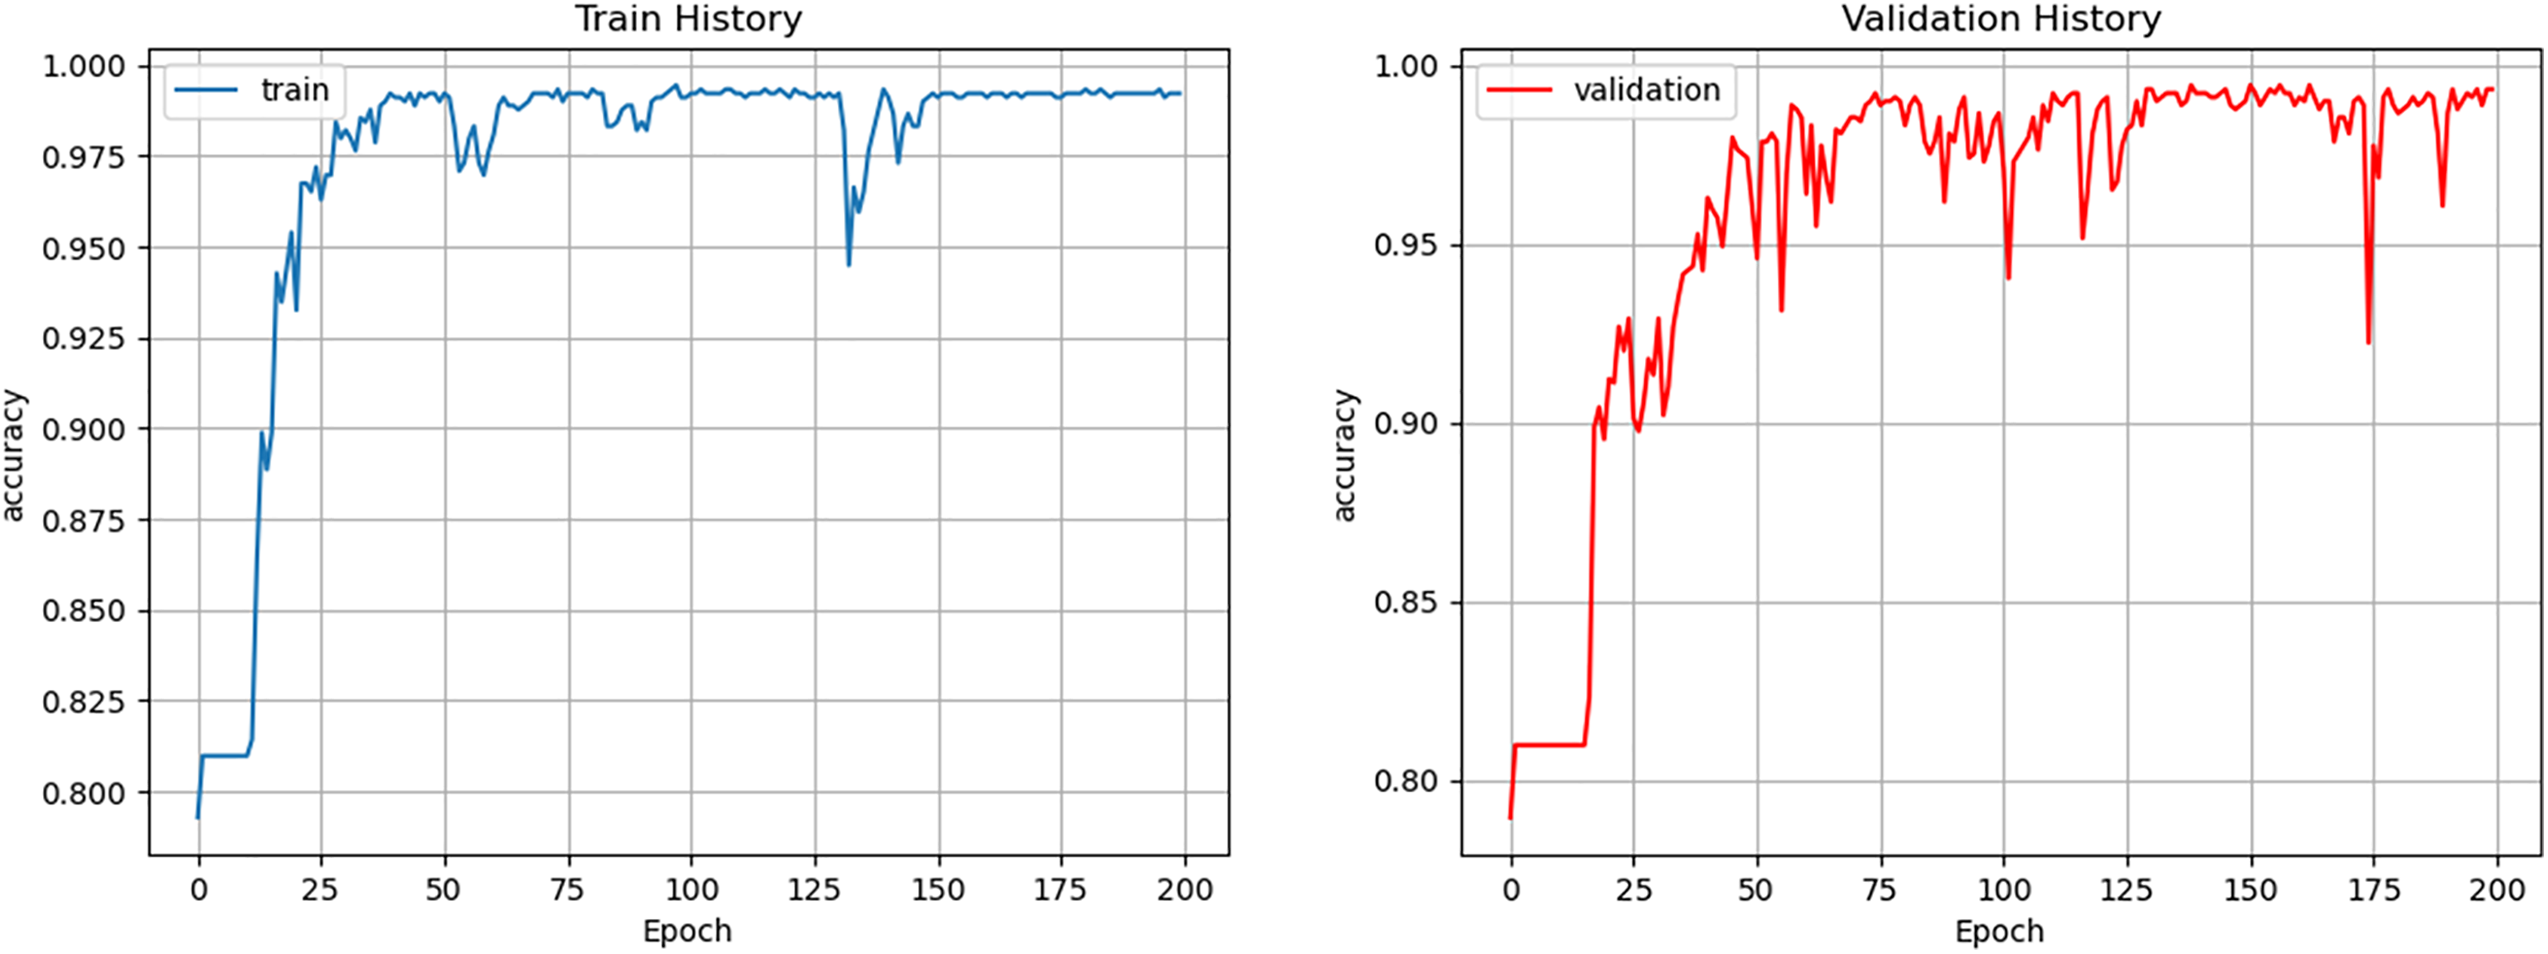
Figure 6: Accuracy of training and validation in the model
The ANN learning method requires the acquisition of a large quantity of labeled data for training, and training requires processing the same data numerous times to adjust the combination of weights and biases gradually for minimizing the error between the true labels and the predicted value until optimal classification is achieved. In this study, binary cross-entropy loss was used to calculate the learning error during training, and 200 training and validation epochs were performed. Initially, the loss decreased rapidly, and the training loss stabilized in epoch 150. The final training loss was 0.014, and the validation set loss was 0.015 (Fig. 7).
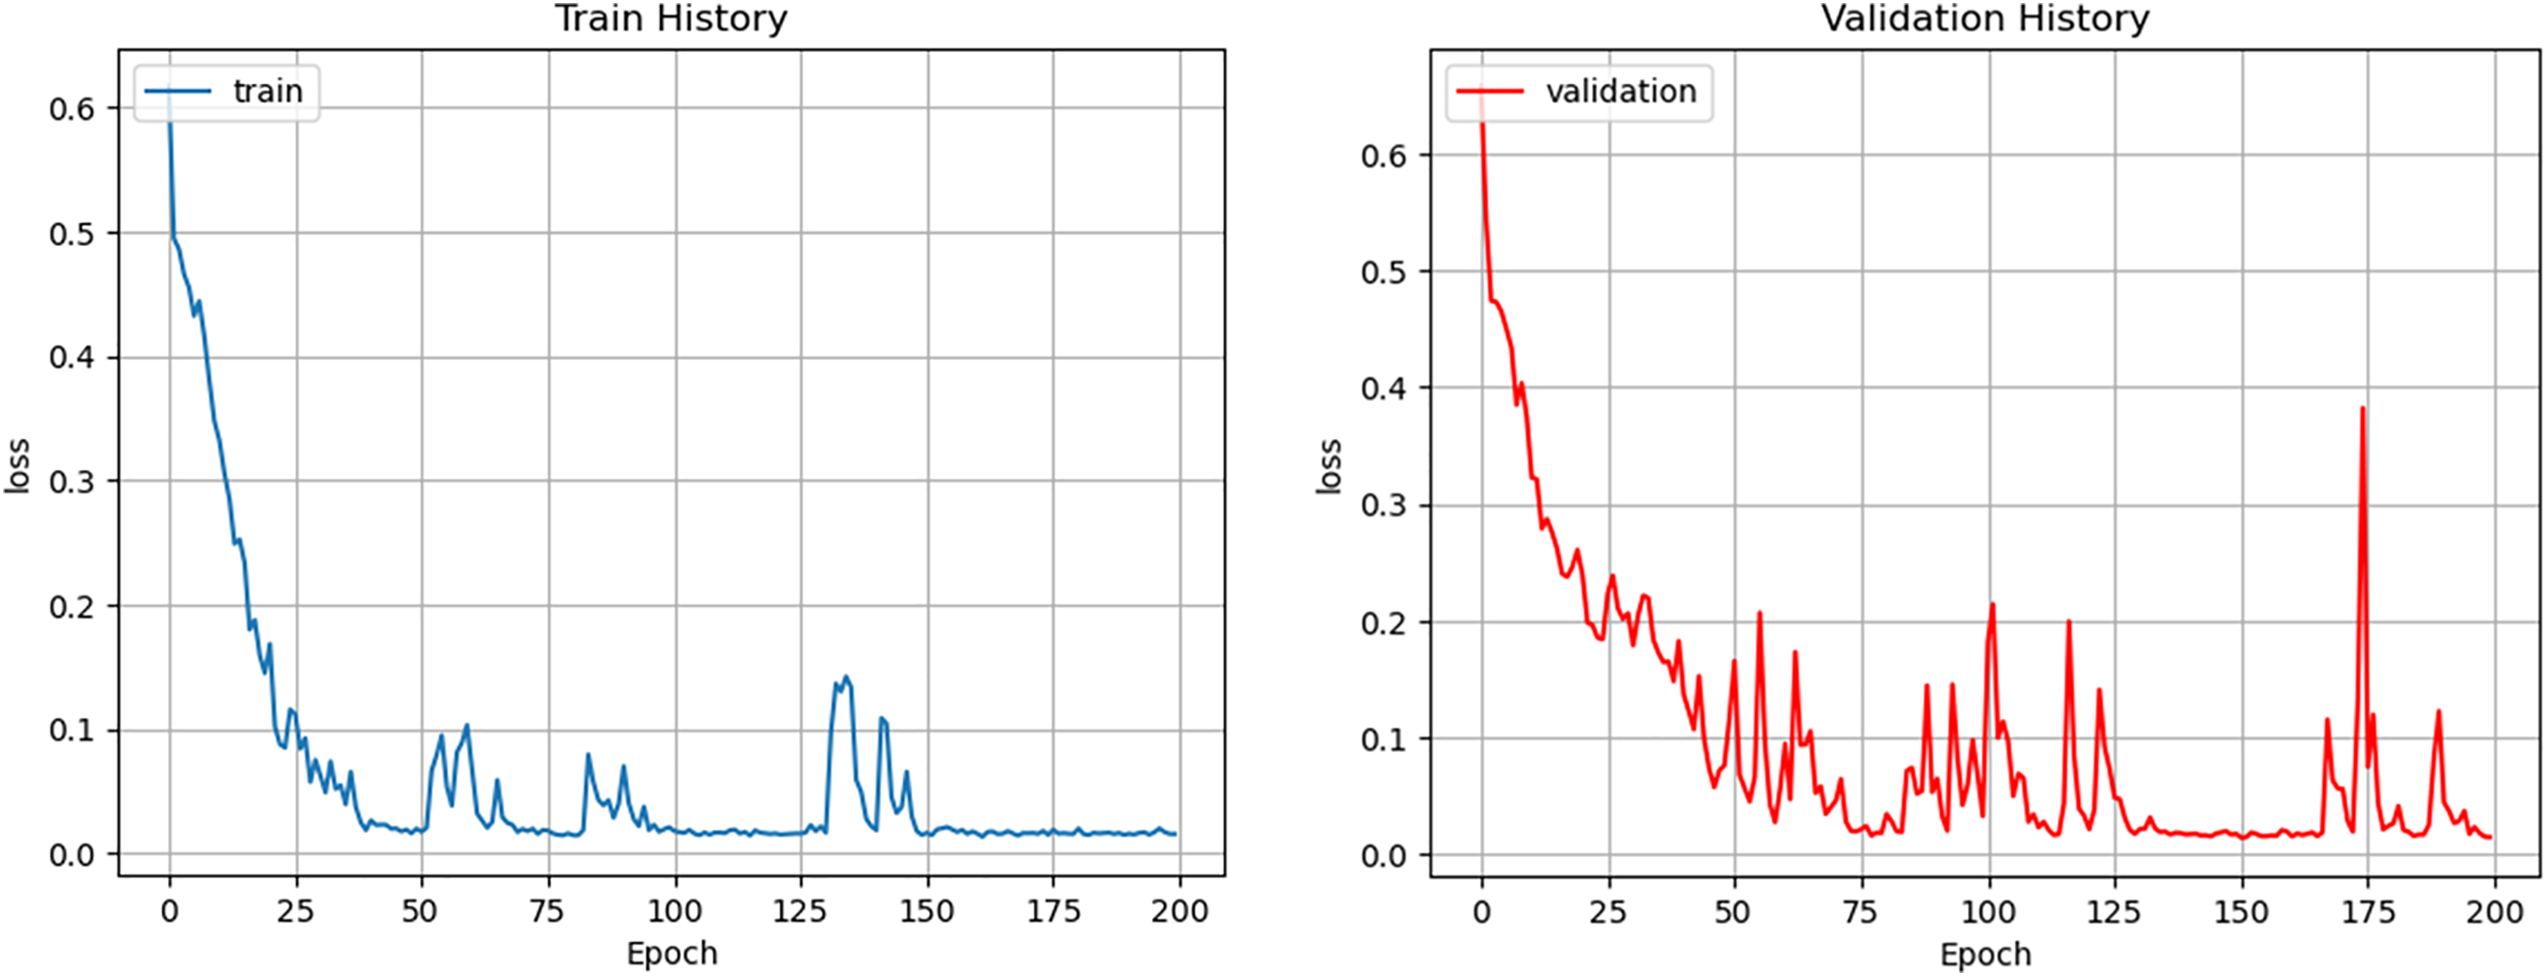
Figure 7: Learning error during training and validation
During the training process of deep learning models, random sampling and random weight initialization can introduce stochastic factors, which may lead to instability in performance on the validation set. The fluctuations in the validation curve observed in this study may suggest that the model is overfitting to the training set, potentially diminishing its generalization ability on the validation set and resulting in unstable performance on validation data. Additionally, high variability in the samples within the validation set can also cause fluctuations in model performance across different batches, thus contributing to variations in the curve. If the validation set is not well-fitted, it can negatively affect the model’s predictive accuracy on new data. In this study, however, the validation curve achieved a relatively high accuracy early on, remaining stable above the 0.95 level for the majority of the training, though occasional decreases occurred, followed by a return to stability (Fig. 6). These temporary drops indicate the model’s difficulty in adapting to certain rare validation samples. The model’s accuracy on both the training and validation sets rose rapidly from 80% to 90% within the initial 20 epochs, showing a fast convergence trend. The maximum fluctuation in the validation set was observed at 0.55 (epoch 174), but overall, the fluctuations were minor, with final accuracy approaching 1.0, aligning with the expected performance. Moreover, the model demonstrated effective early learning, as the validation loss curve quickly converged and reduced the loss value significantly, indicating a strong learning capacity (Fig. 7). Although the validation loss curve exhibited a few fluctuations during the later stages of training, it ultimately stabilized at around 0.04, achieving a satisfactory level of performance.
The dataset in this study is divided into two main parts: the training set and the test set. The training set constitutes 80% of the entire dataset, while the test set accounts for 20%, with a random partitioning method employed. An 80–20 split is commonly used, although different studies may select varying ratios depending on the size of the dataset and specific requirements of the problem. A larger training set (e.g., 90%) provides more data for model training, allowing the model to learn from a greater number of samples, which often results in higher training accuracy. However, this may also lead to overfitting, where the model becomes overly fitted to the training data and performs poorly on the test set due to the limited test data, which may not adequately assess the model’s generalization ability. Conversely, a larger test set (e.g., 30%) can provide a more accurate performance evaluation but may reduce the amount of data available for training, potentially limiting the model’s learning capacity and decreasing predictive performance. This trade-off is especially significant in cases where the dataset is small, as insufficient training data can prevent the model from learning effective features. Thus, in cases with smaller datasets or more complex models, adjusting the data split ratio may be necessary to optimize training and testing outcomes. Changing the split ratio impacts the learning process during training and the model’s final performance on the test set, and selecting the optimal ratio requires experimentation and adjustments based on specific circumstances. The primary function of the test set is to provide an objective performance evaluation of the trained model. The data in the test set does not overlap with that in the training set, allowing us to assess the model’s generalization capability on unseen data. Fig. 8 presents the confusion matrix results for 202 construction projects in the test set of this study. This graphical representation not only aids in intuitively understanding the model’s predictive performance across different classes but also provides specific data regarding true positives (TP), true negatives (TN), false positives (FP), and false negatives (FN). Additionally, the precision, recall, and F1-score of the model are all 96.08%.
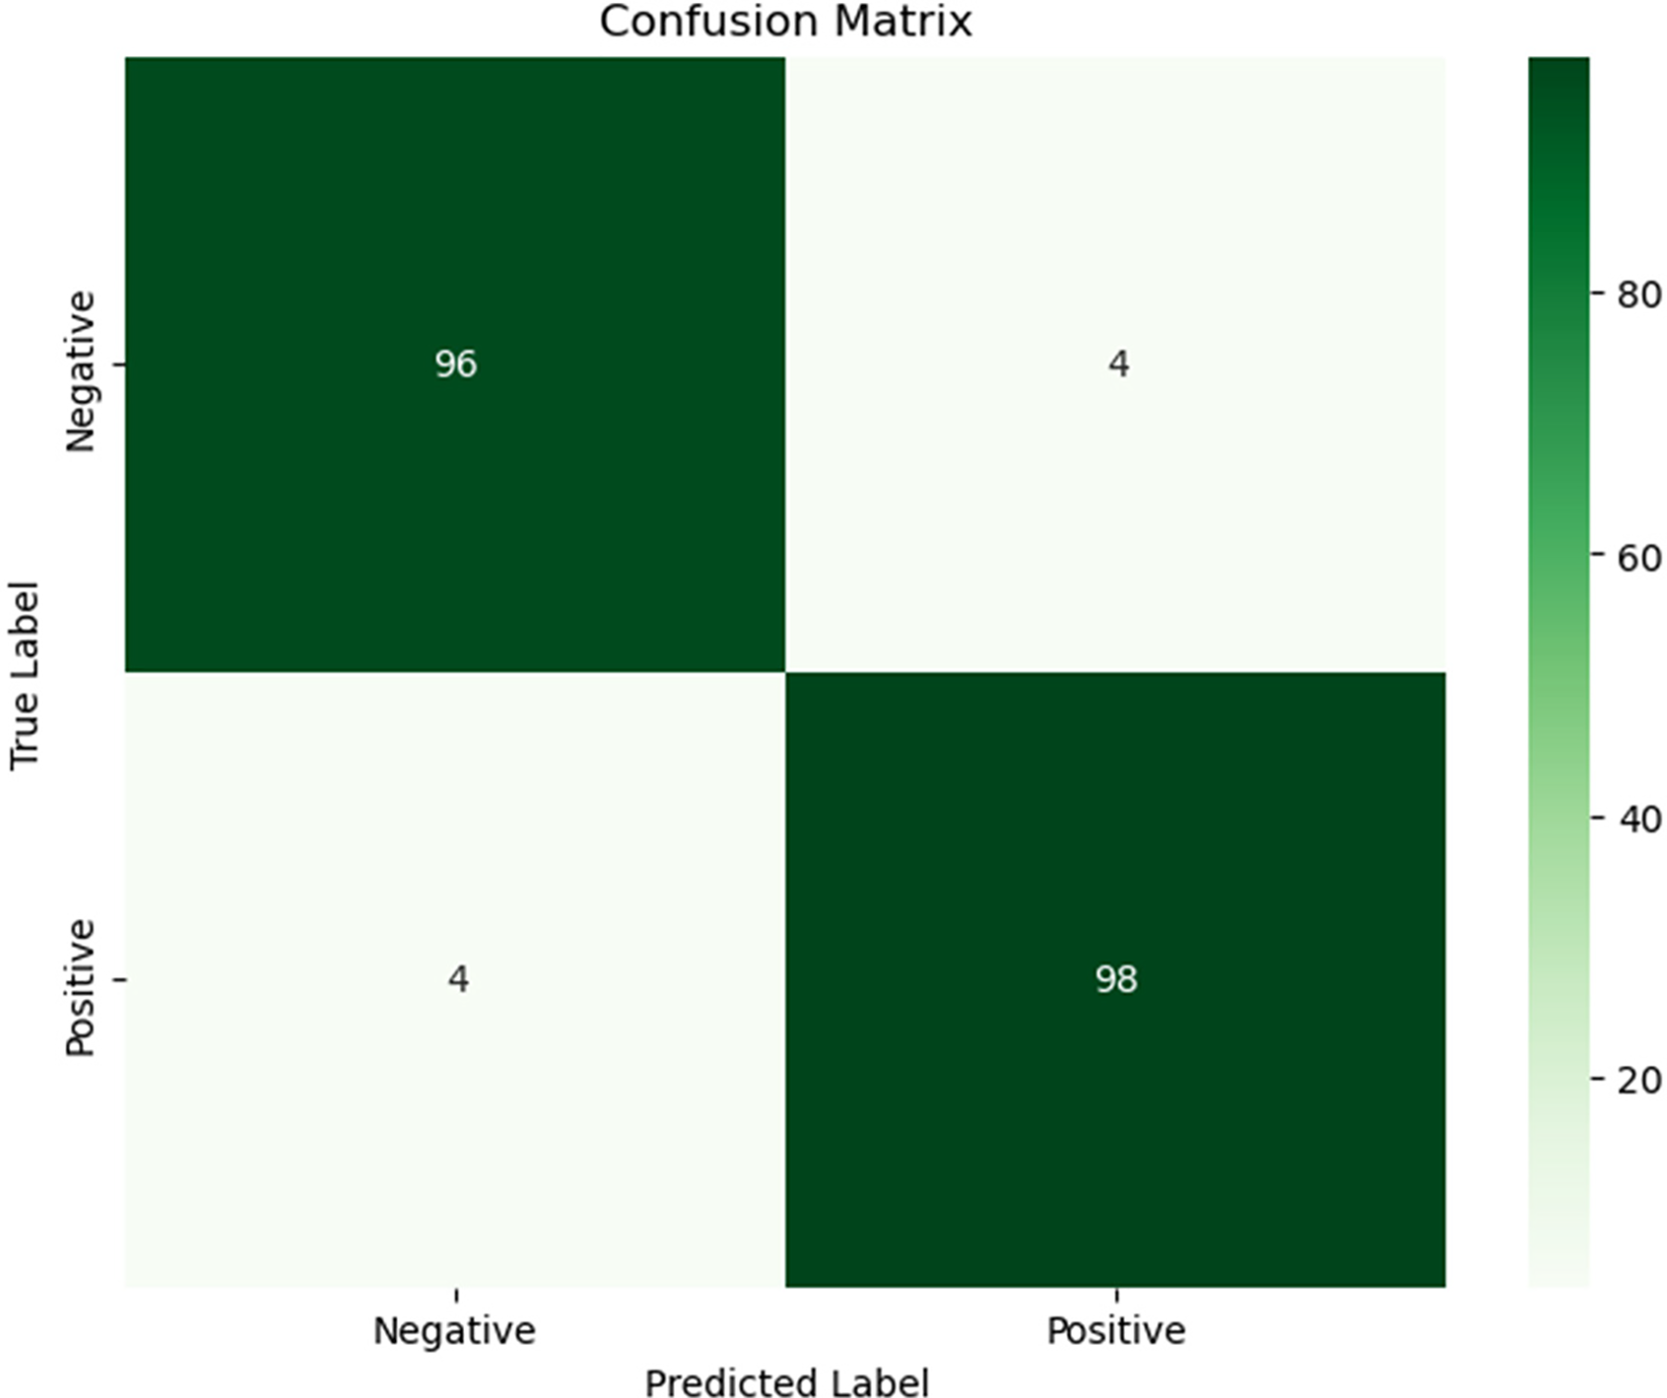
Figure 8: Confusion matrix results of the ANN model on the test set in this study
This study employed fuzzy logic to calculate the weights of construction factors and identify 35 critical ones. A deep ANN was then trained and tested on a comprehensive construction inspection dataset to predict construction quality. The resulting prediction model was further evaluated to determine the relationship between these critical factors and construction quality, achieving an accuracy of 96.08%. These findings indicate that hybrid soft computing is an effective quantitative method capable of automatic learning. By focusing on the identified critical factors, this approach can support the development of sound construction management practices to improve project performance and quality.
However, this research has certain limitations. First, as the study is based on data specific to Taiwan’s PCMIS, the model’s applicability to other regions or types of projects may be limited. Additionally, although the hybrid model achieved high prediction accuracy, the ANN may be susceptible to overfitting with complex datasets, which could affect generalizability. Future research could explore expanding the dataset to include diverse construction contexts and testing alternative hybrid techniques to enhance model robustness.
Acknowledgement: The author is grateful to Yu-Jen Chung from the Department of Marine Science at the ROC Naval Academy for generously providing an NVIDIA Quadro RTX 6000 24 GB GPU, enabling the efficient execution of ANN prediction tasks for construction quality.
Funding Statement: The author received no specific funding for this study.
Availability of Data and Materials: The data that support the findings of this study are available from the corresponding author upon reasonable request.
Ethics Approval: Not applicable.
Conflicts of Interest: The author declares no conflicts of interest to report regarding the present study.
References
1. Daoud AO, El Hefnawy M, Wefki H. Investigation of critical factors affecting cost overruns and delays in Egyptian megaconstruction projects. Alexandria Eng J. 2023;83(10):326–34. doi:10.1016/j.aej.2023.10.052. [Google Scholar] [CrossRef]
2. Mostofi F, Tokdemir OB, Toğan V. Comprehensive root cause analysis of construction defects using semisupervised graph representation learning. J Constr Eng Manag. 2023;149(9):04023079. doi:10.1061/JCEMD4.COENG-13435. [Google Scholar] [CrossRef]
3. Cha HS, Kim CK. Quantitative approach for project performance measurement on building construction in South Korea. KSCE J Civ Eng. 2011;15(8):1319–28. doi:10.1007/s12205-011-1323-5. [Google Scholar] [CrossRef]
4. Haponava T, Al-Jibouri S. Proposed system for measuring project performance using process-based key performance indicators. J Manage Eng. 2012;28(2):140–9. doi:10.1061/(ASCE)ME.1943-5479.0000078. [Google Scholar] [CrossRef]
5. Fanaei SS, Moselhi O, Alkass ST. Performance prediction of construction projects using soft computing methods. Can J Civ Eng. 2019;46(7):609–20. doi:10.1139/cjce-2018-0305. [Google Scholar] [CrossRef]
6. Ghanbaripour AN, Langston C, Tumpa RJ, Skulmoski G. Validating and testing a project delivery success model in construction: a mixed-method approach in Australia. Smart Sustain Built Environ. 2024;13(3):532–59. doi:10.1108/SASBE-09-2022-0200. [Google Scholar] [CrossRef]
7. Jha KN, Chockalingam CT. Prediction of quality performance using artificial neural networks: evidence from Indian construction projects. J Adv Manage Res. 2009;6(1):70–86. doi:10.1108/09727980910972172. [Google Scholar] [CrossRef]
8. Acıkara T, Kazaz A, Ulubeyli S. Evaluations of construction project participants’ attitudes toward quality management in Turkey. Procedia Eng. 2017;196:203–10. doi:10.1016/j.proeng.2017.07.192. [Google Scholar] [CrossRef]
9. Nassar N, AbouRizk S. Practical application for integrated performance measurement of construction projects. J Manage Eng. 2014;30(6):04014027. doi:10.1061/(ASCE)ME.1943-5479.0000287. [Google Scholar] [CrossRef]
10. Ngacho C, Das D. A performance evaluation framework of construction projects: insights from literature. Int J Proj Org Manage. 2015;7(2):151–73. doi:10.1504/IJPOM.2015.069616. [Google Scholar] [CrossRef]
11. Leon H, Osman H, Georgy M, Elsaid M. System dynamics approach for forecasting performance of construction projects. J Manage Eng. 2018;34(1):04017049. doi:10.1061/(ASCE)ME.1943-5479.0000575. [Google Scholar] [CrossRef]
12. Maya R, Hassan B, Hassan A. Develop an artificial neural network (ANN) model to predict construction projects performance in Syria. J King Saud Univ-Eng Sci. 2023;35(6):366–71. doi:10.1016/j.jksues.2021.05.002. [Google Scholar] [CrossRef]
13. Salehi H, Burgueño R. Emerging artificial intelligence methods in structural engineering. Eng Struct. 2018;171:170–89. doi:10.1016/j.engstruct.2018.05.084. [Google Scholar] [CrossRef]
14. Chan APC, Chan DWM, Yeung JFY. Overview of the application of ‘fuzzy techniques’ in construction management research. J Constr Eng Manage. 2009;135(11):1241–52. doi:10.1061/(ASCE)CO.1943-7862.0000099. [Google Scholar] [CrossRef]
15. Mhady AA, Budayan C, Gurgun AP. Estimate-at-completion (EAC) prediction using Archimedes optimization with adaptive fuzzy and neural networks. Autom Constr. 2024;166(2):105653. doi:10.1016/j.autcon.2024.105653. [Google Scholar] [CrossRef]
16. Obianyo JI, Udeala RC, Alaneme GU. Application of neural networks and neuro-fuzzy models in construction scheduling. Sci Rep. 2023;13(1):8199. doi:10.1038/s41598-023-35445-5. [Google Scholar] [PubMed] [CrossRef]
17. Kiani Mavi N, Brown K, Fulford R, Goh M. Forecasting project success in the construction industry using adaptive neuro-fuzzy inference system. Int J Constr Manag. 2024;24(14):1550–68. doi:10.1080/15623599.2023.2266676. [Google Scholar] [CrossRef]
18. Georgy ME, Chang LM, Zhang L. Prediction of engineering performance: a neurofuzzy approach. J Constr Eng Manage. 2005;131(5):548–57. doi:10.1061/(ASCE)0733-9364(2005)131:5(548). [Google Scholar] [CrossRef]
19. Dissanayake M, Fayek AR. Soft computing approach to construction performance prediction and diagnosis. Can J Civil Eng. 2008;35(8):764–76. doi:10.1139/L08-023. [Google Scholar] [CrossRef]
20. Zadeh LA. Fuzzy sets. Inf Control. 1965;8(3):338–535. doi:10.1016/S0019-9958(65)90241-X. [Google Scholar] [CrossRef]
21. Elwood E, Corotis RB. Application of fuzzy pattern recognition of seismic damage to concrete structures. ASCE-ASME J Risk Uncertain Eng Syst Part A: Civ Eng. 2015;1(4):04015011. doi:10.1061/AJRUA6.0000831. [Google Scholar] [CrossRef]
22. Tripathi KK, Hasan A, Jha KN. Evaluating performance of construction organizations using fuzzy preference relation technique. Int J Constr Manage. 2021;21(12):1287–300. doi:10.1080/15623599.2019.1613210. [Google Scholar] [CrossRef]
23. Seresht NG, Lourenzutti R, Salah A, Fayek AR. Overview of fuzzy hybrid techniques in construction engineering and management. In: Fuzzy hybrid computing in construction engineering and management. Leeds, England: Emerald Publishing Limited; 2018. p. 37–107. [Google Scholar]
24. Schmidhuber J. Deep learning in neural networks: an overview. Neural Netw. 2015;61(3):85–117. doi:10.1016/j.neunet.2014.09.003. [Google Scholar] [PubMed] [CrossRef]
25. An Y, Li H, Su T, Wang Y. Determining uncertainties in AI applications in AEC sector and their corresponding mitigation strategies. Autom Constr. 2021;131(3):103883. doi:10.1016/j.autcon.2021.103883. [Google Scholar] [CrossRef]
26. Xu Y, Wei SY, Bao Y, Li H. Automatic seismic damage identification of reinforced concrete columns from images by a region-based deep convolutional neural network. Struct Control Health Monit. 2019 Mar;26(3):e2313. doi:10.1002/stc.2313. [Google Scholar] [CrossRef]
27. Deng L, Yu D. Deep learning: methods and applications. Found Trends Signal Process. 2014;7(3–4):197–387. doi:10.1561/2000000039. [Google Scholar] [CrossRef]
28. Krogh A. What are artificial neural networks? Nat Biotechnol. 2008;26(2):195–7. doi:10.1038/nbt1386. [Google Scholar] [PubMed] [CrossRef]
29. Kalogirou SA. Artificial neural networks in renewable energy systems applications: a review. Renew Sust Energ Rev. 2001;5(4):373–401. doi:10.1016/S1364-0321(01)00006-5. [Google Scholar] [CrossRef]
30. Karaca I, Gransberg DD, Jeong HD. Improving the accuracy of early cost estimates on transportation infrastructure projects. J Manage Eng. 2020;36(5):04020063. doi:10.1061/(ASCE)ME.1943-5479.0000819. [Google Scholar] [CrossRef]
31. Heravi G, Eslamdoost E. Applying artificial neural networks for measuring and predicting construction-labor productivity. J Constr Eng Manage. 2015;141(10):04015032. doi:10.1061/(ASCE)CO.1943-7862.0001006. [Google Scholar] [CrossRef]
32. Nasirzadeh F, Kabir HD, Akbari M, Khosravi A, Nahavandi S, Carmichael DG. ANN-based prediction intervals to forecast labour productivity. Eng Constr Archit Manage. 2020;27(9):2335–51. doi:10.1108/ECAM-08-2019-0406. [Google Scholar] [CrossRef]
33. Song L, AbouRizk SM. Measuring and modeling labor productivity using historical data. J Constr Eng Manage. 2008;134(10):786–94. doi:10.1061/(ASCE)0733-9364(2008)134:10(786). [Google Scholar] [CrossRef]
34. Ma G, Wu M. A big data and FMEA-based construction quality risk evaluation model considering project schedule for Shanghai apartment projects. Int J Qual Reliab Manage. 2019;37(1):18–33. doi:10.1108/IJQRM-11-2018-0318. [Google Scholar] [CrossRef]
35. Alaloul WS, Liew MS, Wan Zawawi NA, Mohammed BS, Adamu M. An Artificial neural networks (ANN) model for evaluating construction project performance based on coordination factors. Cogent Eng. 2018;5(1):1507657. doi:10.1080/23311916.2018.1507657. [Google Scholar] [CrossRef]
36. Ling FYY, Liu M. Using neural network to predict performance of design-build projects in Singapore. Build Environ. 2004;39(10):1263–74. doi:10.1016/j.buildenv.2004.02.008. [Google Scholar] [CrossRef]
37. Seresht NG, Fayek AR. Neuro-fuzzy system dynamics technique for modeling construction systems. Appl Soft Comput. 2020;93:106400. doi:10.1016/j.asoc.2020.106400. [Google Scholar] [CrossRef]
38. Kar S, Das S, Ghosh PK. Applications of neuro fuzzy systems: a brief review and future outline. Appl Soft Comput. 2014;15(2–4):243–59. doi:10.1016/j.asoc.2013.10.014. [Google Scholar] [CrossRef]
39. Tiruneh GG, Fayek AR, Sumati V. Neuro-fuzzy systems in construction engineering and management research. Automat Constr. 2020;119(4):103348. doi:10.1016/j.autcon.2020.103348. [Google Scholar] [CrossRef]
40. Chae MJ, Abraham DM. Neuro-fuzzy approaches for sanitary sewer pipeline condition assessment. J Comput Civil Eng. 2001;15(1):4–14. doi:10.1061/(ASCE)0887-3801(2001)15:1(4). [Google Scholar] [CrossRef]
41. Sinha SK, Fieguth PW. Neuro-fuzzy network for the classification of buried pipe defects. Automat Constr. 2006;15(1):73–83. doi:10.1016/j.autcon.2005.02.005. [Google Scholar] [CrossRef]
42. Kumar S, Taheri F. Neuro-fuzzy approaches for pipeline condition assessment. Nondestruct Test Eva. 2007;22(1):35–60. doi:10.1080/10589750701327858. [Google Scholar] [CrossRef]
43. Maqsoom A, Babar Z, Shaheen I, Abid M, Kakar MR, Mandokhail SJ, et al. Influence of construction risks on cost escalation of highway-related projects: exploring the moderating role of social sustainability requirements. IJST-T Civ Eng. 2021;45(3):2003–15. doi:10.1007/s40996-021-00601-2. [Google Scholar] [CrossRef]
44. Jafarzadeh R, Ingham JM, Wilkinson S, González V, Aghakouchak AA. Application of artificial neural network methodology for predicting seismic retrofit construction costs. J Constr Eng Manage. 2014;140(2):04013044. doi:10.1061/(ASCE)CO.1943-7862.0000725. [Google Scholar] [CrossRef]
45. Shihabudheen KV, Pillai GN. Recent advances in neuro-fuzzy system: a survey. Knowl Based Syst. 2018;152(3):136–62. doi:10.1016/j.knosys.2018.04.014. [Google Scholar] [CrossRef]
46. Basheer IA, Hajmeer M. Artificial neural networks: fundamentals, computing, design, and application. J Microbiol Meth. 2000;43(1):3–31. doi:10.1016/S0167-7012(00)00201-3. [Google Scholar] [PubMed] [CrossRef]
47. Huang Y, Fu J. Review on application of artificial intelligence in civil engineering. Comp Model Eng. Sci. 2019;121(3):845–75. doi:10.32604/cmes.2019.07653. [Google Scholar] [CrossRef]
48. Flah M, Nunez I, Chaabene WBen, Nehdi ML. Machine learning algorithms in civil structural health monitoring: a systematic review. Arch Computat Methods Eng. 2021;28(4):2621–43. doi:10.1007/s11831-020-09471-9. [Google Scholar] [CrossRef]
49. Akinosho TD, Oyedele LO, Bilal M, Ajayi AO, Delgado MD, Akinade OO, et al. Deep learning in the construction industry: a review of present status and future innovations. J Build Eng. 2020;32(6):101827. doi:10.1016/j.jobe.2020.101827. [Google Scholar] [CrossRef]
50. Luo H, Ling L, Chen K, Antwi-Afari MF, Chen L. Digital technology for quality management in construction: a review and future research directions. Dev Built Envir. 2022;12(5):100087. doi:10.1016/j.dibe.2022.100087. [Google Scholar] [CrossRef]
Cite This Article
 Copyright © 2025 The Author(s). Published by Tech Science Press.
This work is licensed under a Creative Commons Attribution 4.0 International License , which permits unrestricted use, distribution, and reproduction in any medium, provided the original work is properly cited.
 Downloads
 Citation Tools