
 Submit a Paper
 Propose a Special lssue
 Open Access
ARTICLE

Improving Fundus Detection Precision in Diabetic Retinopathy Using Derivative-Based Deep Neural Networks
1 Department of Informatics and Computer Systems, College of Computer Science, King Khalid University, Abha, 61421, Saudi Arabia
2 School of Computing, Gachon University, Seongnam, 13120, Republic of Korea
3 Department of Computer Science and Information Systems, College of Applied Sciences, AlMaarefa University, Ad Diriyah, Riyadh, 13713, Saudi Arabia
4 Department of Computer Engineering and Information, College of Engineering in Wadi Alddawasir, Prince Sattam bin Abdulaziz University, Al-Kharj, 16273, Saudi Arabia
5 Department of Computer Engineering, Aligarh Muslim University, Aligarh, 202002, India
* Corresponding Author: Hong Min. Email:
Computer Modeling in Engineering & Sciences 2025, 142(3), 2487-2511. https://doi.org/10.32604/cmes.2025.061103
Received 17 November 2024; Accepted 21 January 2025; Issue published 03 March 2025
 View Full Text
 Download PDF
Abstract
Fundoscopic diagnosis involves assessing the proper functioning of the eye’s nerves, blood vessels, retinal health, and the impact of diabetes on the optic nerves. Fundus disorders are a major global health concern, affecting millions of people worldwide due to their widespread occurrence. Fundus photography generates machine-based eye images that assist in diagnosing and treating ocular diseases such as diabetic retinopathy. As a result, accurate fundus detection is essential for early diagnosis and effective treatment, helping to prevent severe complications and improve patient outcomes. To address this need, this article introduces a Derivative Model for Fundus Detection using Deep Neural Networks (DMFD-DNN) to enhance diagnostic precision. This method selects key features for fundus detection using the least derivative, which identifies features correlating with stored fundus images. Feature filtering relies on the minimum derivative, determined by extracting both similar and varying textures. In this research, the DNN model was integrated with the derivative model. Fundus images were segmented, features were extracted, and the DNN was iteratively trained to identify fundus regions reliably. The goal was to improve the precision of fundoscopic diagnosis by training the DNN incrementally, taking into account the least possible derivative across iterations, and using outputs from previous cycles. The hidden layer of the neural network operates on the most significant derivative, which may reduce precision across iterations. These derivatives are treated as inaccurate, and the model is subsequently trained using selective features and their corresponding extractions. The proposed model outperforms previous techniques in detecting fundus regions, achieving 94.98% accuracy and 91.57% sensitivity, with a minimal error rate of 5.43%. It significantly reduces feature extraction time to 1.462 s and minimizes computational overhead, thereby improving operational efficiency and scalability. Ultimately, the proposed model enhances diagnostic precision and reduces errors, leading to more effective fundus dysfunction diagnosis and treatment.Keywords
Fundus disorders generally occur in diabetic patients due to high blood sugar levels. Diabetic retinopathy (DR) is a disease that affects retinal parts such as blood vessels, optic nerves, and tissues of the eyes. Nearly 285 million people across the globe suffer from fundus problems, making them a major issue in public health. Common eye diseases include DR, hypertensive retinopathy, Age-related Macular Degeneration, and retinal detachment. These issues reduce one’s field of vision and put one’s eye health and well-being in danger. Although Age-related Macular Degeneration primarily impacts the elderly and is anticipated to increase in prevalence as a result of the ageing population, DR is the primary cause of blindness among adults of working age. An alarming systemic problem is hypertensive retinopathy, a result of uncontrolled hypertension. Fundus imaging and diagnosis are being enhanced by the development of advanced diagnostic technologies [1]. Retinal scanning is commonly used to detect and diagnose fundus disorders such as DR. Retinal scanning captures high-resolution images of the retina, including its texture and features, allowing healthcare professionals to analyze and detect any abnormalities in the fundus [2]. Fundus detection requires proper data, improving the diagnosis process’s accuracy. Retinal images are collected from the database that provides feasible data for fundus detection. These databases contain large collections of retinal images annotated with relevant clinical information. These databases increase fundus detection’s accuracy, enhancing the diagnosis process’s efficiency and feasibility range [3,4]. Artificial neural networks (ANNs), such as DNN and convolutional neural networks (CNNs), are commonly used for automated fundus detection [5,6]. These algorithms are trained on large datasets of fundus images and have shown great promise in improving the accuracy and efficiency of fundus detection. These models identify the patterns and features indicative of fundus based on given retinal images and have been shown to reduce the complexity and latency in fundus detection [7].
DR detection is a complicated task to perform in healthcare centres. DR detection typically requires a trained specialist to manually examine retinal images and identify any abnormalities or signs of DR. This process is time-consuming and may be prone to errors or inconsistencies due to variations in human interpretation and expertise. Therefore, automated techniques are used by healthcare centres that potentially reduce the complexity and time required for DR detection, enabling earlier detection and treatment of this serious complication of diabetes [8]. Feature filtering is also used in fundus detection. Feature filtering involves selecting and prioritizing specific features or characteristics in retinal images indicative of particular fundus disorders. Feature filtering techniques are often used in the selection and classification process in fundus detection [9]. Once the most relevant features have been identified, they can be used to train machine learning (ML) algorithms, such as support vector machines, to classify and diagnose fundus disorders accurately. Feature filtering technique reduces the computation process’s time and energy consumption ratio, improving the detection process’s efficiency [10]. In addition, feature filtering helps to reduce the risk of overfitting, which can occur when an ML algorithm is trained on too many features irrelevant to the classification task [11]. The region of interest is identified by feature filtering that reduces the error in further detection. Once the relevant features are selected, automated algorithms such as CNNs are used to classify and diagnose fundus disorders [9,12].
Millions worldwide suffer from fundus problems. Despite medical imaging advances, fundus abnormalities are difficult to detect due to substantial false positive rates and poor fundus region identification. Manual fundus picture interpretation is time-consuming and subjective, causing diagnostic errors and therapy delays. Increasing fundus problems and restricted access to expert care worsen the problem. Innovative ways using DNN and derivative models are required to solve these difficulties. A unique strategy combining deep learning (DL) and derivative models will be developed and tested to better fundus disorder detection and diagnosis, reduce fundus-related illness burden, and improve patient outcomes worldwide.
ANN algorithm-based fundus detection methods diagnose retinal images in healthcare systems. ANN identifies the exact texture, patterns, colour, and shape of the disorder in retinal images from diabetic patients [13]. Computer-assisted tools also use ANN to detect the actual information about fundus disease. ANNs maximize detection accuracy, reducing the error ratio in the diagnosis process [14]. A deep convolutional neural network (DCNN) algorithm is used for detection that predicts the fundus’s patterns, textures, and features. DCNN algorithm improves the energy-efficiency ratio in the computation process [15]. DCNN increases the overall accuracy of fundus detection, reducing the complexity of the detection process [16]. K-nearest neighbour network (KNN) is also used for fundus detection methods. KNN detects the key values and patterns required for the fundus detection process. KNN uses feature extraction to extract key features from the retinal images [17]. With this introduction, the contributions of this article are:
(a) Designing a feature-dependent derivative model with precise feature classification for fundus detection from the medical input.
(b) Performing a layered independent process for textural feature correlation and less accuracy in feature classification and detection.
(c) Performing an experimental and comparative analysis with precise dataset input and variables to prove the proposed methods’ efficiency.
Pan et al. [18] proposed a Multi-Level Remote Relational Modelling Network (MRRM-Net) for the segmentation of fundus blood vessels—a critical task in fundus detection. The model employs a CNN to facilitate feature extraction, focusing on identifying relevant features associated with fundus blood vessels. By implementing CNNs, the segmentation process achieves reduced latency. The MRRM-Net enhances segmentation accuracy, significantly improving the diagnostic process’s performance. Accurate segmentation of retinal blood vessels is vital for diagnosing fundus diseases. Existing CNN-based methods often face challenges due to poor image quality and the intricate topology of blood vessels. The MRRM-Net addresses these limitations by integrating multi-level remote relational modelling with attention modules. This architecture enables establishing and fusing long-range semantic contexts, correcting low-level errors, and transmitting high-level semantic information into the decoder. The model demonstrates superior performance, particularly in segmenting capillaries within complex backgrounds and varying structures. It exhibits better adaptability and stability than other state-of-the-art network architectures, even with a smaller capacity. MRRM-Net provides a robust theoretical foundation for real-time detection technologies for retinopathy, paving the way for advanced diagnostic solutions.
Ju et al. [19] introduced a novel technique for training an ultra-widefield (UWF) fundus diagnosis model, aiming to optimize and regulate the fundus images captured through scans. This technique focuses on identifying critical factors and relevant data within UWF fundus images to ensure that only the most significant features are utilized for diagnosis. High-quality data is emphasized as a prerequisite for effectively training datasets used in fundus diagnosis and detection processes. By enhancing the quality and relevance of UWF images, the proposed method improves the feasibility, effectiveness, and accuracy of the diagnostic process. This approach not only maximizes the utility of UWF imaging but also sets a foundation for achieving superior diagnostic performance in fundus-related applications.
Yang et al. [20] proposed a robust framework for grading the severity of DR using a collaborative technique that combines image-level and patch-level annotations. This approach leverages fundus images to provide optimal information necessary for accurately assessing DR severity. An optimization method is employed to refine and prioritize relevant data, ensuring its suitability for subsequent detection and prediction processes. Experimental results demonstrate that the proposed framework significantly enhances the effectiveness and reliability of the DR annotation process, offering a more accurate and dependable method for severity grading in clinical and diagnostic applications.
Ding et al. [21] developed a DL based method for vessel detection in UWF fundus photography (FP). The proposed approach employs a weakly-supervised vessel detection framework that significantly enhances the performance of the detection process. It integrates multi-modal registration steps to accurately identify the distinct characteristics present in FP images. By leveraging DL, the method effectively trains data related to fundus features, minimizing latency in the computation process. The proposed method demonstrates high accuracy in vessel detection, contributing to improved efficiency in the diagnosis of retinal conditions.
Yang et al. [22] introduced a hybrid deep segmentation method for vessel detection, utilizing a DCNN algorithm to identify microvessels in fundus images. The method employs segmentation within the DCNN framework, segmenting images based on specific functions and characteristics. Multi-segmentation in this approach requires well-structured datasets, which help reduce the energy consumption during the computation process. Compared to existing methods, the proposed approach significantly improves the accuracy of vessel detection, delivering high performance and enhancing the diagnostic process.
Xia et al. [23] designed a multi-scale segmentation-to-classification model (MSSM) for microaneurysm (MA) detection. Both segmentation and classification techniques are used in the proposed model to maximize the accuracy of the MA detection process. A multi-scale residual network named MSRNet is used here for the classification process. The MSRNet reduces the computation’s energy and time consumption level, increasing the feasibility of the detection process. The proposed model maximizes the robustness and efficiency range of the MA detection process.
Ou et al. [24] proposed a bilateral feature enhancement network for multi-level ophthalmic disease classification, utilizing a CNN architecture to address bilateral features from fundus images. The CNN employs a feature extraction method that identifies important patterns and features in the images, which is crucial for accurate classification. This approach significantly reduces the classification latency, enhancing both the performance and feasibility of the disease classification process. By leveraging this network, the classification of ophthalmic diseases becomes more efficient, reliable, and faster, ultimately improving diagnostic outcomes in retinal image analysis.
Han et al. [25] introduced a novel fundus retinal vessel image segmentation method aimed at accurately identifying retinal vessels for further diagnostic processes. The method utilizes an improved version of the U-Net architecture, which is employed to train the datasets for the segmentation task. U-Net effectively identifies the essential convolutional blocks in the dataset, allowing for precise segmentation of the retinal vessels. By decoding the structure of the images, the method produces relevant and feasible data that supports the accurate detection of retinal vessels. This approach enhances the vessel segmentation process, contributing to improved diagnostic accuracy in retinal image analysis.
Sun et al. [26] developed a multi-label classification method named MCGL-Net for fundus images, primarily aimed at improving the performance and efficiency of the diagnostic process. The method employs a high graph convolutional module to classify fundus images based on their key characteristics and functions. Additionally, a light gradient boosting machine network is used to identify and model the relationships among patterns and features present in the images. The experimental results demonstrate that the proposed method achieves high accuracy in the classification process, enhancing its potential for accurate diagnosis in retinal disease detection.
Dos Santos et al. [27] proposed the use of contrast-limited adaptive histogram equalization (CLAHE) for blood vessel detection in fundus images, enhancing the clarity of the vessels in the images. To optimize the results from CLAHE and further improve segmentation, a multilayer artificial neural network (MANN) was employed. The main objective of this approach is to accurately identify blood vessels, even in images of varying quality. Additionally, Wiener filters are applied to filter out noise and irrelevant data, reducing the computational energy required. This method outperforms other existing techniques, significantly improving the accuracy of blood vessel detection and making it more efficient and effective for diagnosing retinal diseases.
Moon et al. [28] developed a novel approach for identifying retinal breaks in ultra-widefield fundus imaging. This method employs a digital green filtering technique to enhance the identification of retinal breaks, which are often challenging to detect due to their complexity and potential to cause significant errors in subsequent detection and classification processes. By using fundus images as inputs, the proposed approach improves the robustness of the overall diagnostic process. The approach significantly increases the accuracy of retinal break identification, thereby enhancing the feasibility and efficiency of the diagnosis process, making it more reliable for clinical applications.
Long et al. [29] introduced a method for detecting MA based on an ML algorithm. The approach utilizes directional local contrast to identify MA at an early stage, which is crucial for timely diagnosis. The ML algorithm is employed to classify MA based on specific patterns and conditions identified within the fundus images. A feature extraction technique is used to extract relevant features from the provided datasets, enhancing the accuracy of the detection process. Experimental results demonstrate that the proposed method achieves high performance in both classification and detection, making it an effective tool for early detection of microaneurysms in retinal images.
Theera-Umpon et al. [30] proposed a method for detecting hard exudates in DR using supervised learning. The method uses fundus retinal images to extract relevant information for DR detection. Hard exudates, characterized by yellowish and white margins in the images, are key indicators in DR diagnosis. The approach demonstrates high accuracy in detecting hard exudates, enhancing the overall effectiveness of DR detection systems.
Özbay et al. [31] introduced a DL method for DR detection, incorporating an artificial bee colony (ABC) algorithm. The ABC algorithm segments fundus images by identifying complex retinal features, enhancing the detection process. It also reduces the energy consumption in computation. The proposed method significantly improves the accuracy of DR classification and detection.
Celik et al. [32] proposed an automated retinal image analysis system for detecting optic nerve hypoplasia. The system uses a U-Net architecture with a pre-trained ResNet encoder to segment the optic disc and fovea structures, providing robust performance in ONH diagnosis. The proposed method was evaluated using retinal images from databases such as Messidor, Diaretdb1, DRIVE, HRF, APTOS, and IDRID. Additionally, 189 retinal scans were used to establish a specialized database called ONH-NET, acquired from Düzce University’s Department of Ophthalmology. In optic disc detection, the method achieved a score of 0.9069, sensitivity of 0.9626, precision of 0.9411, accuracy of 0.9974, and a Dice coefficient of 0.9505. For fovea detection, it achieved a score of 0.8282, sensitivity of 0.8442, precision of 0.8252, accuracy of 0.8992, and a Dice coefficient of 0.7873.
Ramasamy et al. [33] proposed a method for detecting diabetic retinopathy (DR) by fusing textural and ridgelet features from retinal images, along with using a Sequential Minimal Optimization (SMO) classifier. The method extracts and combines textural features, such as co-occurrence, run-length matrices, and Ridgelet Transform coefficients, from ophthalmoscopic images to enhance DR diagnosis. The model uses publicly available retinal image datasets for performance evaluation. On the DIARETDB1 dataset, the method achieved 98.87% sensitivity, 95.24% specificity, and 97.05% accuracy, while on the KAGGLE dataset, it achieved 90.9% sensitivity, 91.0% specificity, and 91.0% accuracy. The results demonstrate the high effectiveness and quality of the proposed method.
Sarmad et al. [34] proposed a 3D CNN framework combined with feature fusion for evaluating retinal abnormalities in diabetic patients, specifically for hemorrhage detection. The method involves extracting features from identified hemorrhages using a modified pre-trained CNN model, followed by selecting the best features using a multi-logistic regression controlled entropy variance approach. The extracted feature vectors are then fused using a convolutional sparse image decomposition method. When tested on 1509 images from several databases (HRF, DRIVE, STARE, MESSIDOR, DIARETDB0, and DIARETDB1), the proposed method achieved an average accuracy of 97.71%. Compared to previous efforts, this hemorrhage detection system outperforms state-of-the-art techniques in both visual quality and quantitative analysis.
Pandey et al. [35] proposed a cascaded network with Atrous convolution and fundus biomarkers for discriminative analysis of Diabetic Retinopathy (DR). The model combines lightweight CNNs with the pre-trained Xception CNN to form a discriminative network. A restricted data merging strategy is also incorporated into the training set to enhance the model’s performance. The study explores various network topologies and cascade networks using different pre-trained CNNs to identify the best configuration. The model is tested on the challenging IDRiD dataset, and performance is evaluated using accuracy, false positive rate (FPR), precision, recall, and F1-score. The results demonstrate the relevance and effectiveness of the proposed system in DR detection, particularly when compared to state-of-the-art studies.
Tohye et al. [36] proposed the use of Contour-Guided and Augmented Vision Transformers (ViT) to enhance glaucoma classification using fundus images. The approach starts by creating a more diverse and robust training dataset using a Conditional Variational Generative Adversarial Network (CVGAN), which incorporates conditional sample creation and reconstruction. A contour-guided method is then applied to focus on the optic disc and cup areas, providing more detailed insights into the condition. The ViT backbone is trained with both the original fundus images and the generated contours, and feature alignment is achieved using a weighted cross-entropy loss. The final step involves multi-class glaucoma classification using the trained ViT model. Testing on several datasets, including EYEPACS, DRISHTI-GS, RIM-ONE, and REFUGE, resulted in an accuracy of 93.0%, precision of 93.08%, F1-score of 92.9%, and recall of 93.08%. The proposed model significantly outperforms existing methods, showing that the integration of augmentation through CVGAN and contour-guided techniques can greatly enhance glaucoma classification.
Nazih et al. [37] presented a CNN with a Vision Transformer (ViT) model for predicting the severity of DR using fundus photography-based retinal images. The model was built using the FGADR dataset and fine-tuned with the AdamW optimizer, which helps identify the global context of images. To address data imbalance in the FGADR dataset, the authors implemented several techniques, including data augmentation, label smoothing, F1-score as the optimization metric, class weights, and focus loss. The effectiveness of these methods was evaluated alongside top CNN algorithms such as ResNet50, InceptionV3, and VGG19. The proposed model effectively extracted important features from retinal images, improving the understanding of DR severity. Performance results showed an F1-score of 0.825, accuracy of 0.825, balanced accuracy of 0.826, area under the curve of 0.964, precision of 0.825, recall of 0.825, and specificity of 0.956, outperforming other CNN and baseline ViT models. Table 1 summarizes the key studies in the literature.
The problem of fundus detection requires variation suppression and textural feature identification as designed in [20,25,26]. The variations in feature availability and extraction result in improper or overlay region detection, as in [22,28]. In other methods discussed in [21,26], the training is intensified due to irregular feature variations; therefore, the learning is re-instigated for better precision. Considering these factors and the chance of error in sensitive medial images, this article introduces DMFD-DNN. The proposed method segregates the learning layers for training and detection using selective measures to prevent high extraction time and error chances.
3 Derivative Model for Fundus Detection Using Deep Neural Networks
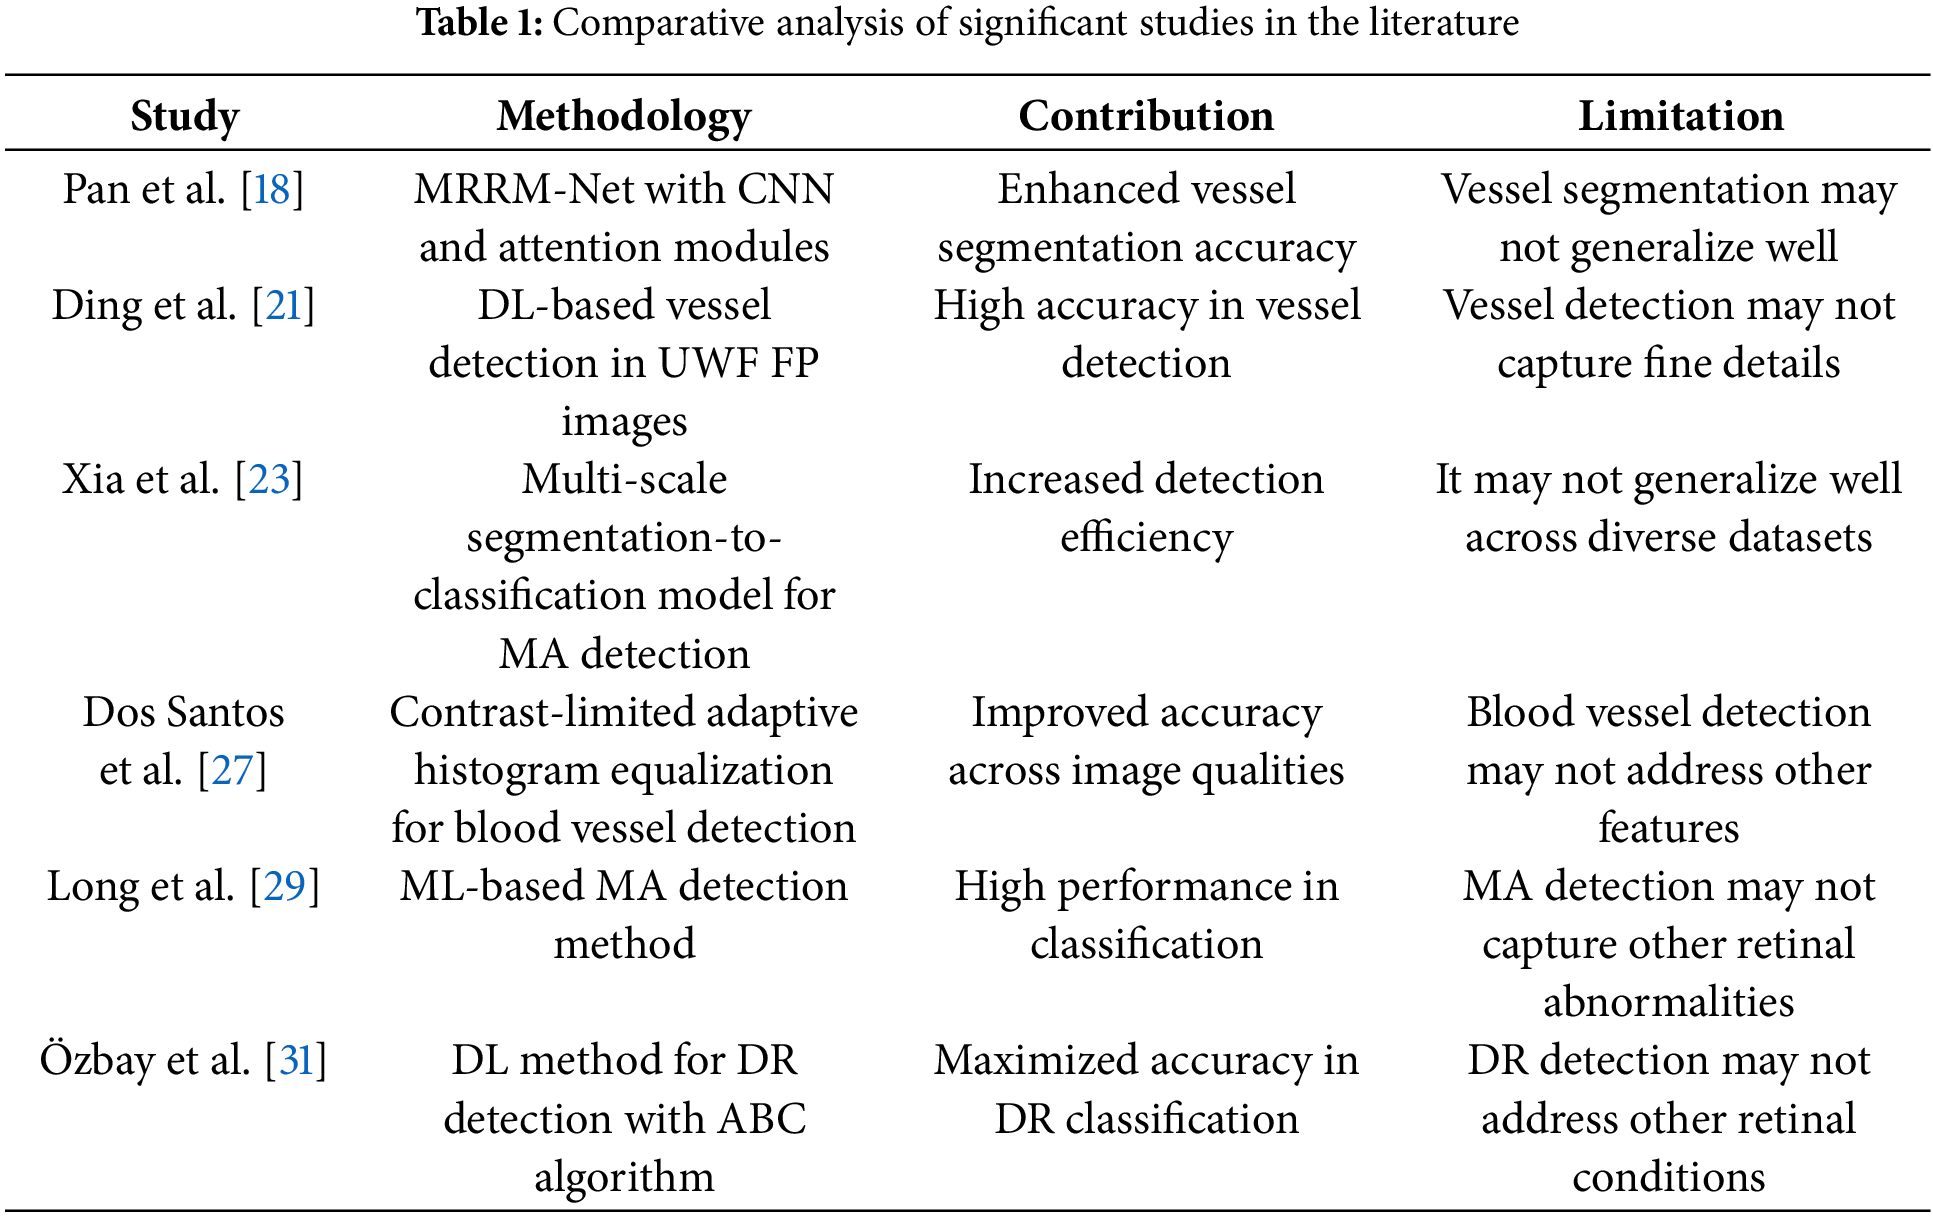
The proposed model for fundus image processing using DNNs is designed to accurately differentiate the fundus region from non-relevant areas during fundoscopic diagnosis, leveraging intelligent imaging processes for optimized feature extraction. FP provides high-resolution retinal images as input, supporting the diagnosis and management of conditions such as DR and glaucoma, which demand precise selection and analysis of critical image features. Key attributes, including retinal image contrast, brightness, and texture, are iteratively processed and analyzed using the DNN. The model sequentially processes medical imaging data, focusing on identifying minimal textural derivatives and reducing feature variations across iterations to improve diagnostic accuracy. By employing advanced filtering and extraction techniques, the proposed model effectively detects small variations and critical features necessary for comprehensive fundoscopic evaluation. To ensure clarity, a diagrammatic representation of the model’s workflow and methodology is provided in Fig. 1, illustrating the step-by-step processes involved in fundus detection and analysis.
Figure 1: Proposed model illustration
The automated fundus detection method analyzes the least derivatives to identify similar features, correlating them with stored fundus images. Relevant features and their extractions are used to train the learning model for continuous fundoscopic diagnosis. This approach ensures accurate identification of textural derivatives and minimal variations, helping detect healthy regions and reduce the spread of fundus-related diseases. Feature extraction is performed to recognize disease-affected areas, with training on similar features from an available medical database. The learning model is trained to minimize false positives and reduce unnecessary medical costs, supporting optimal treatment recommendations.
In fundus image processing image processing, FP is analyzed based on a healthy person’s retinal image observation, the proper eye nerves functioning blood pressure, and diabetic observation. Therefore, the healthy person’s retinal image observations were used for fundus detection from the various image inputs. The least textural derivatives and minimum variations are identified to suppress the chance of inaccurate iteration by causing errors across different features. The error occurrence is identified in a sequence of fundus detection over varying iterations. The proposed derivative model for the fundus detection method focuses on such false positives and errors through similarity analysis using a DNN. Initially, retinal imaging processing assumes
where
As per Eqs. (1) and (2), the variable
Eqs. (3) and (4) compute the similar features observed from the least derivative, and minimum variation over the varying iterations, which are then correlated with
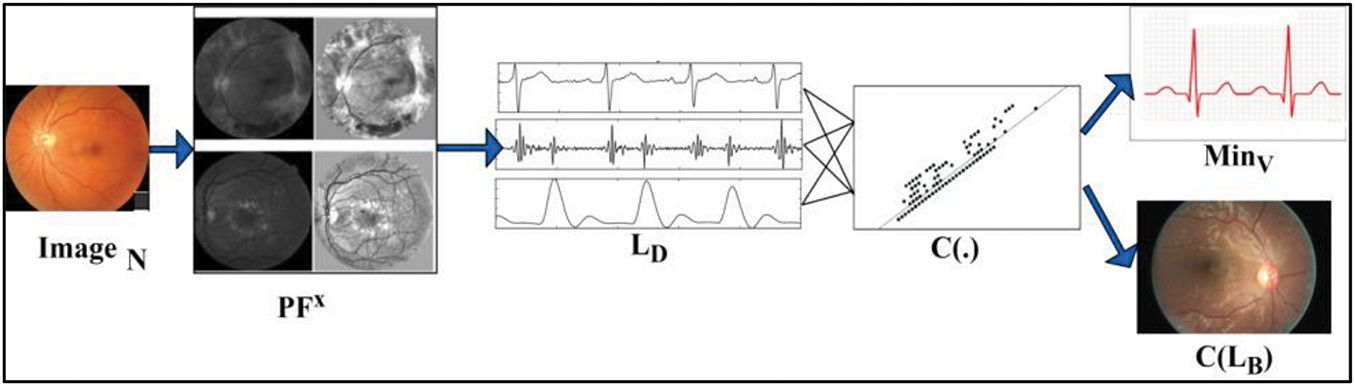
Figure 2: Representation of derivative extraction with variance
For instance, the least derivative and maximum variation are identified from the possible feature extraction processing layer 1 with less accuracy, leading to fundus detection using DL. Similarly, the minimum variation and maximum accuracy identified images perform the selection process in layer 2 to identify good regions. The maximum variations in medical imaging processing rely on the possible feature extraction with
If
The DL process extracts essential features like brightness and contrast from input retinal images through layer 1 and layer 2 processing. Retinal features specific to the patient are observed, enabling the precise selection of features to train similar features identified within the image for fundoscopic diagnosis. Medical imaging processing, guided by previously stored fundus images, achieves high accuracy through DL. These stored images, containing fundus characteristics and their variations, are utilized to detect fundus-related diseases as described in Eq. (1). The probability of feature selection is processed in
In Eq. (6), the variables
In Eq. (7), false positives and error occurrences in fundoscopic diagnosis and detection are analyzed using the least derivatives and variations identified from the features through DL at interval
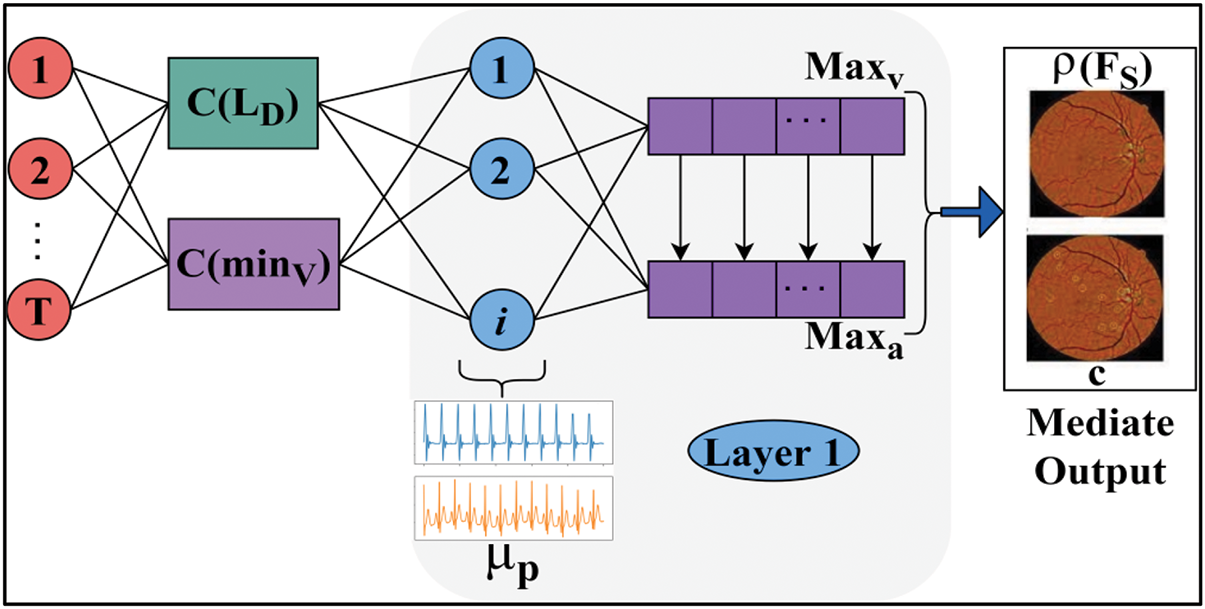
Figure 3: DNN layer process
The mediate output of
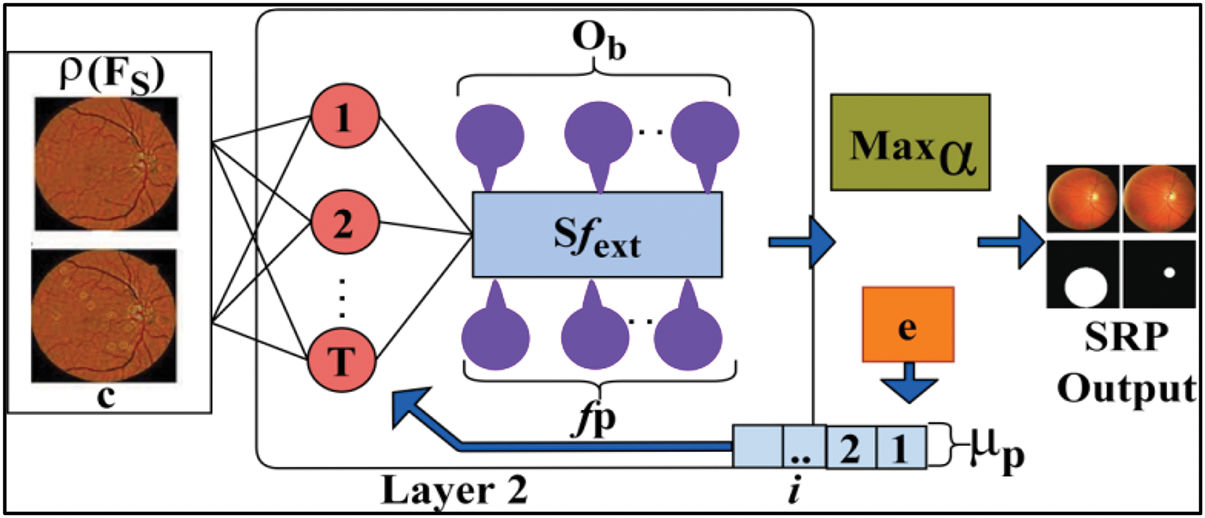
Figure 4: Second layer processing
According to the condition,
In Eq. (8), the learning model is trained using selective feature extractions, identifying fundus-affected patients and their impacts while preventing errors and reducing computational overload. Consequently, only the fundus region features are selected for each successive iteration, ensuring precise feature selection
where
The variable
Eq. (11) estimates the first derivative output for classifying features based on variations and similarity analysis outputs with maximum accuracy and fewer variations and
In Eq. (12), the final image output is computed to prevent overloaded computations and errors, along with reducing processing and computation time. The condition
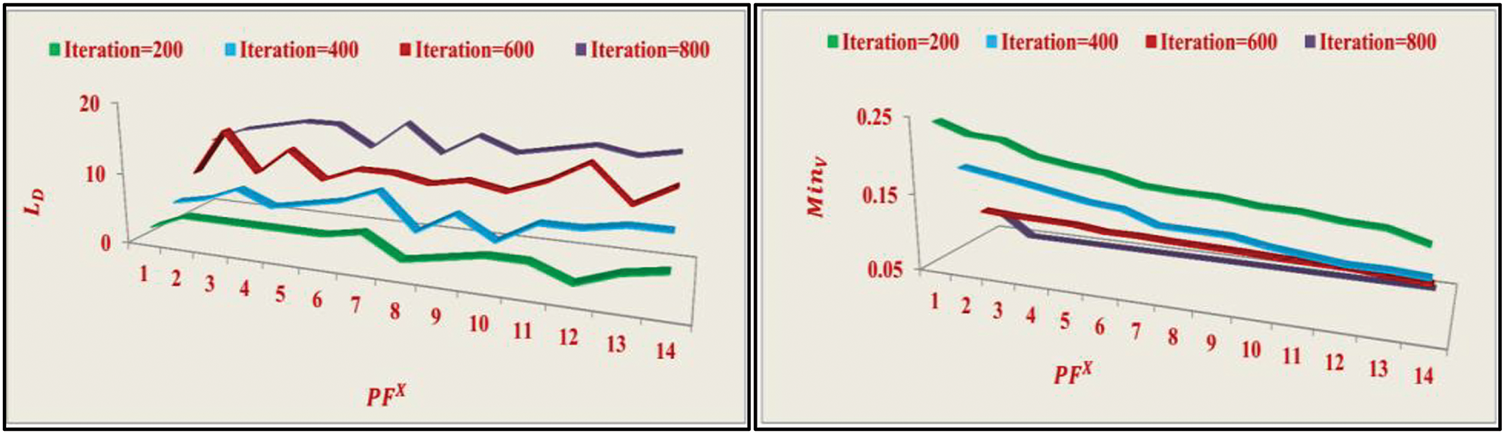
Figure 5: LD and MinV analyses
As the number of iterations increases, the likelihood of suppressing
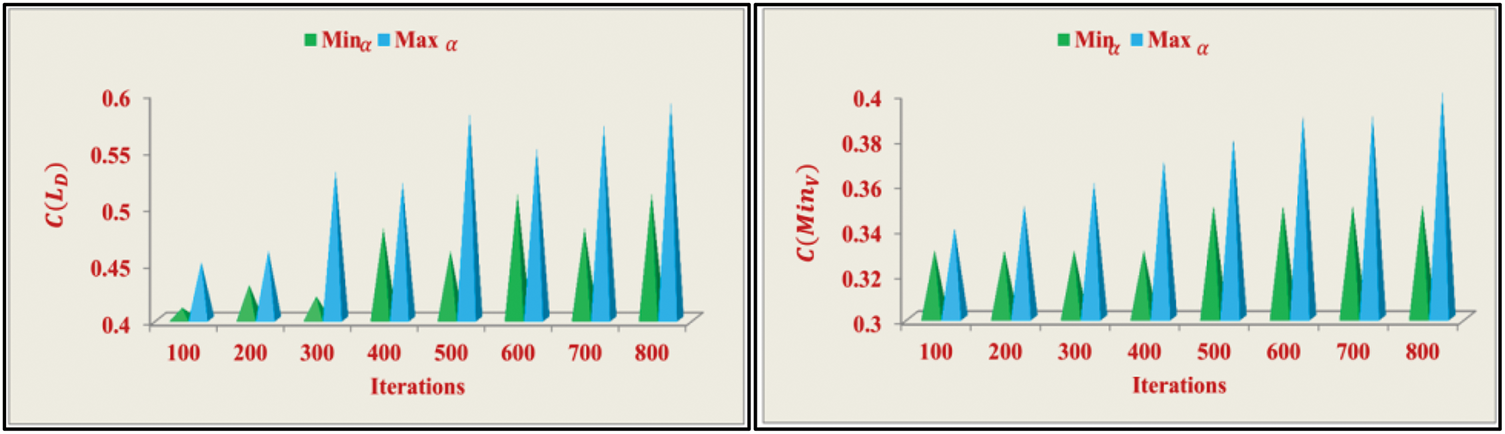
Figure 6: C(LD) and C(MinV) analyses
The correlation analysis is performed across different iterations to achieve both
Figure 7:
The proposed method for fundus detection utilizes a DNN architecture. The process begins with the input layer, where fundus images are fed into the network. Convolutional layers are then responsible for feature extraction from the images. Pooling layers follow, reducing the size of the feature maps and helping mitigate overfitting. The ReLU activation function is employed to introduce non-linearity into the model, enabling it to learn complex patterns. Fully connected layers are used to learn global features from the extracted local ones. In the output layer, multi-class classification is achieved using a softmax activation function, whereas binary classification is performed with a sigmoid activation function. To enhance the model’s performance and robustness, additional architectural components are incorporated. Batch normalization is applied to stabilize and accelerate the training process. Dropout layers are included to reduce overfitting, and L2 regularization helps prevent the model from becoming too complex. An optimizer, such as Adam or stochastic gradient descent, is employed to minimize the loss function and adjust model weights effectively during training.
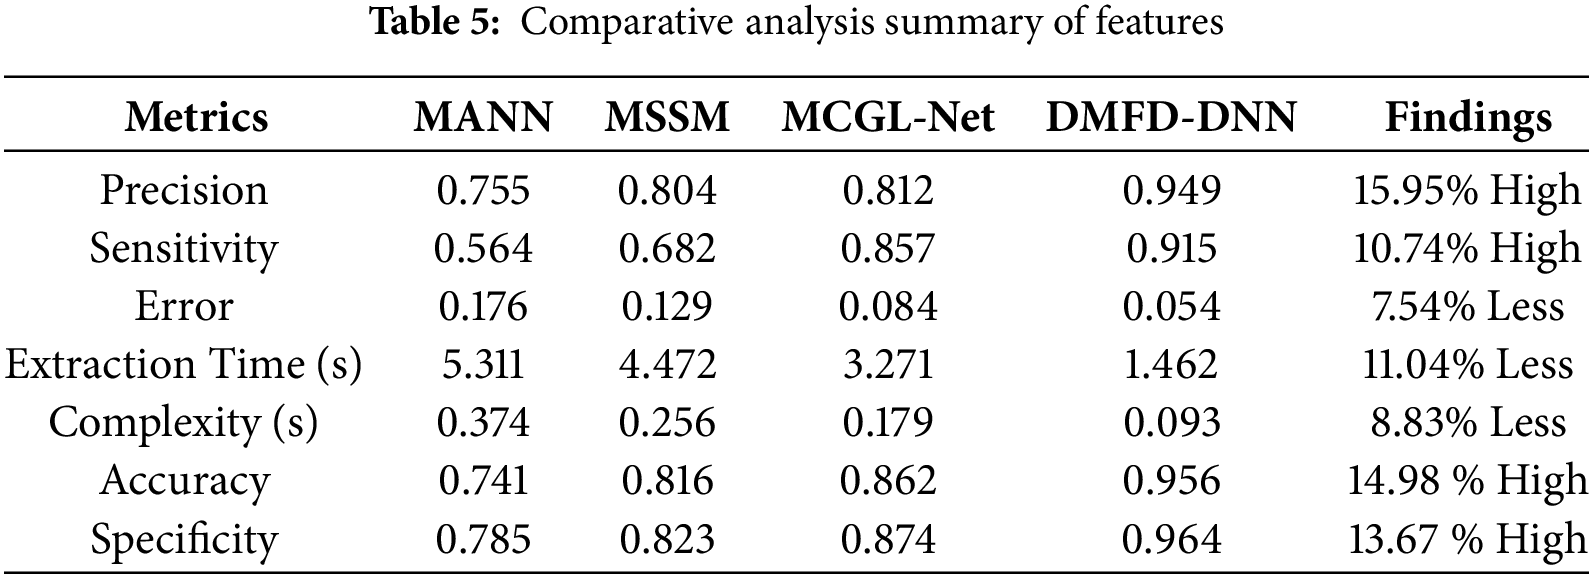
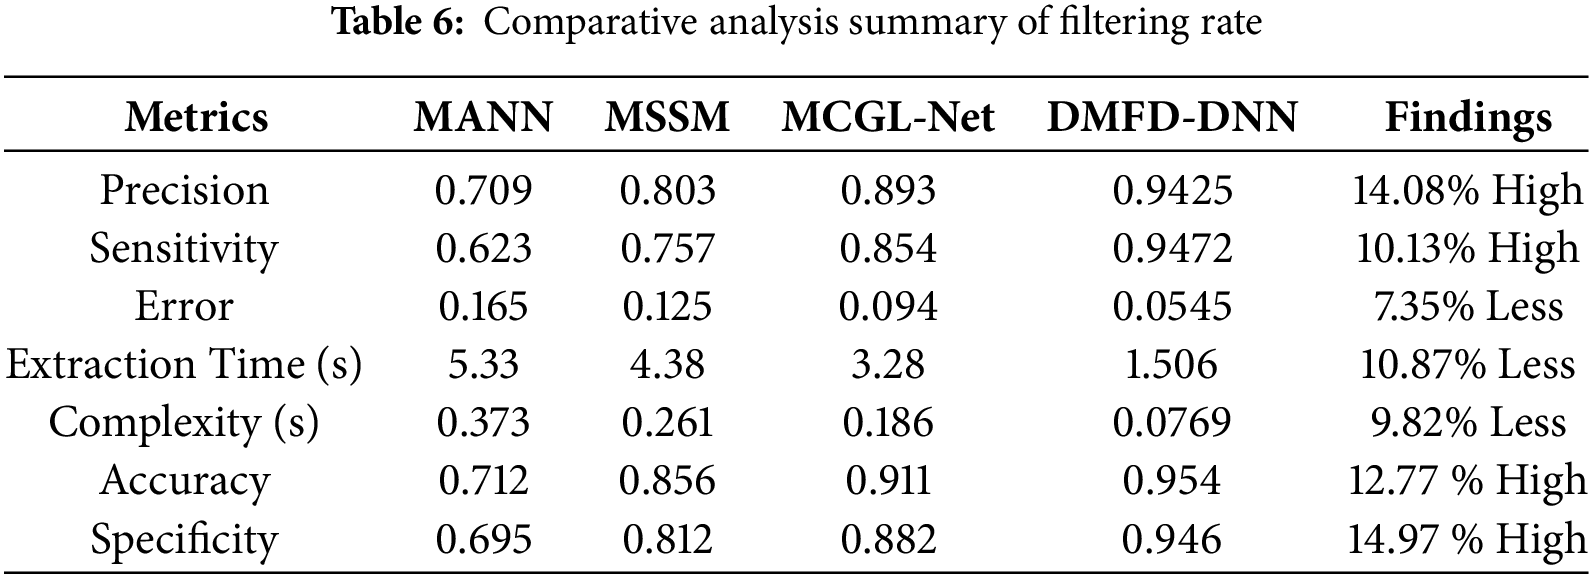
The Results and Discussion section provides a comprehensive comparative analysis to validate the proposed method. The evaluation is based on key performance metrics such as precision, sensitivity, error rate, feature extraction, and computational complexity. The proposed method is analyzed with varying features (up to 14) and a maximum filtering rate of 1. To establish its effectiveness, the method is compared with existing techniques, including MANN [27], MSSM [23], and MCGL-Net [26], as discussed in the related works section. This comparison underscores the robustness and efficiency of the proposed approach in addressing challenges associated with retinal fundus image analysis.
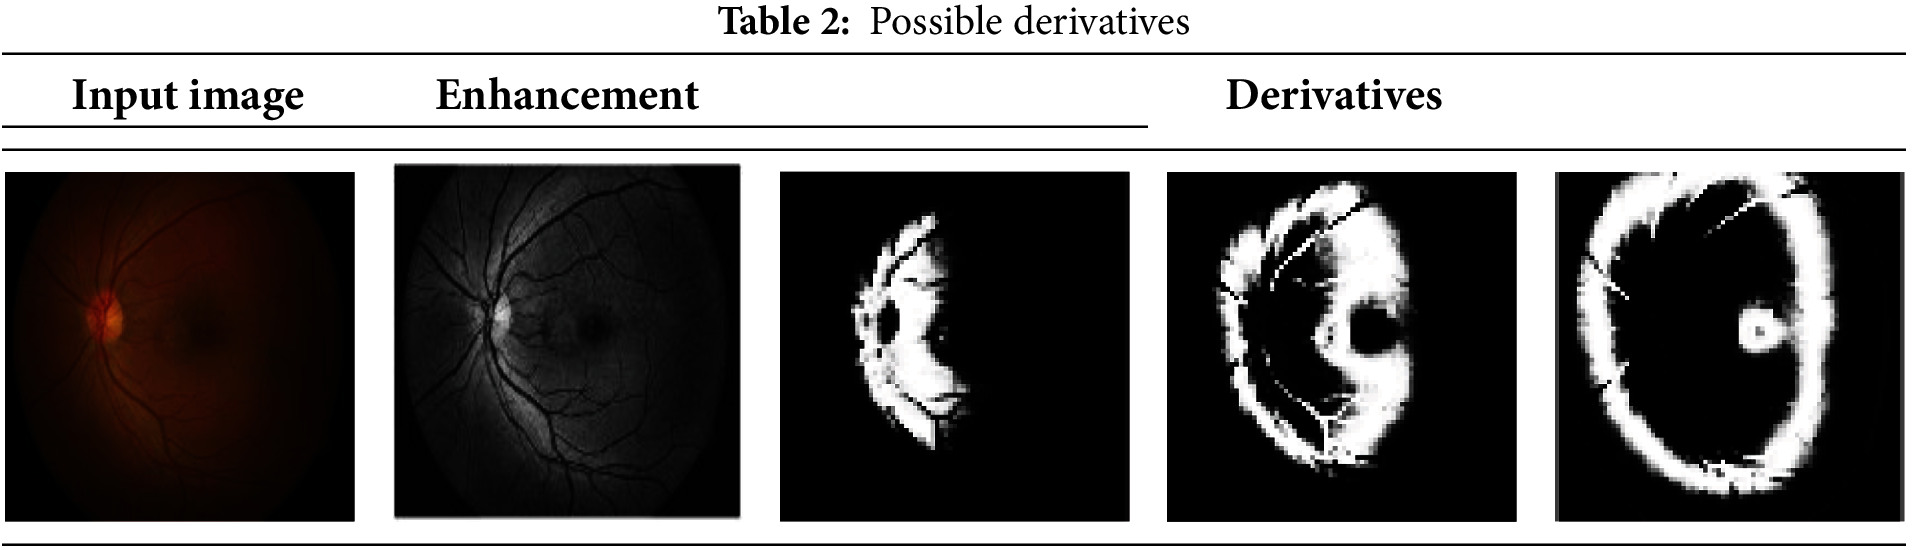
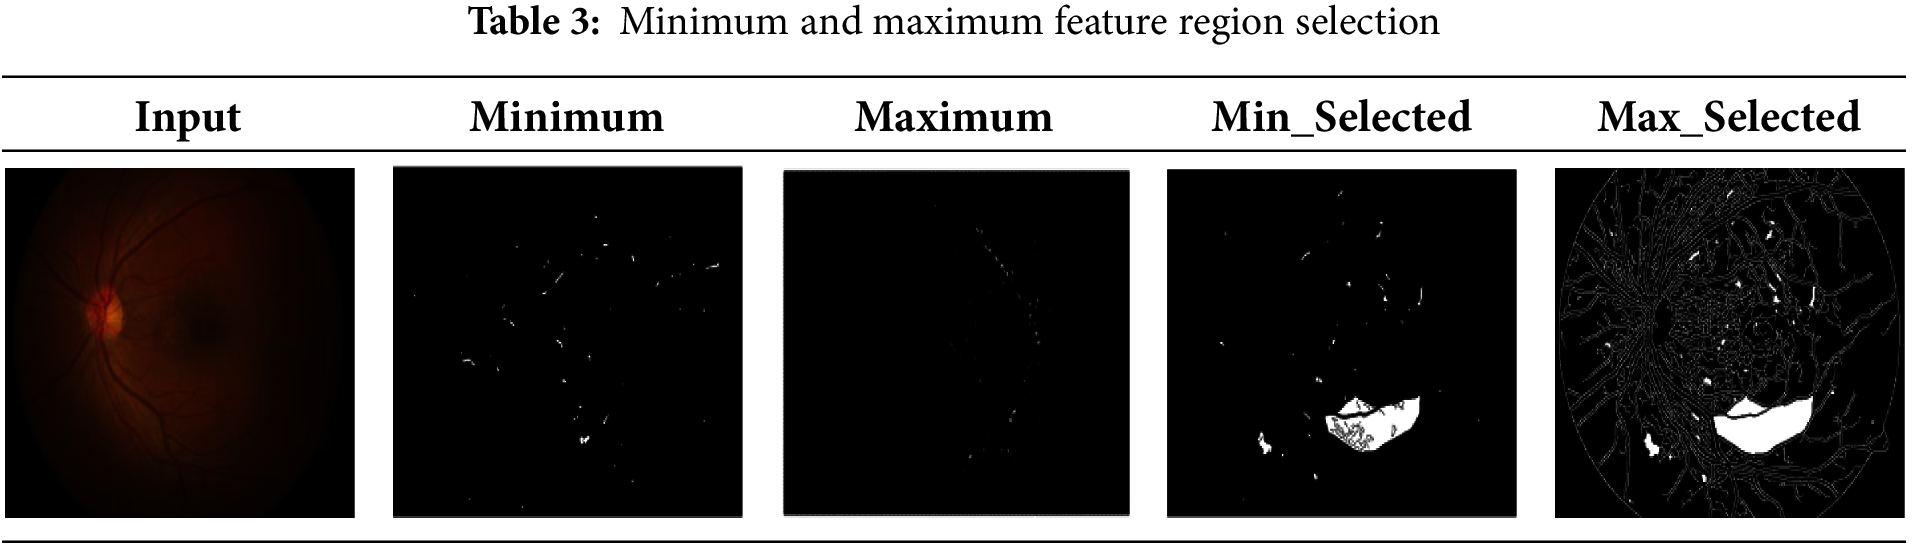
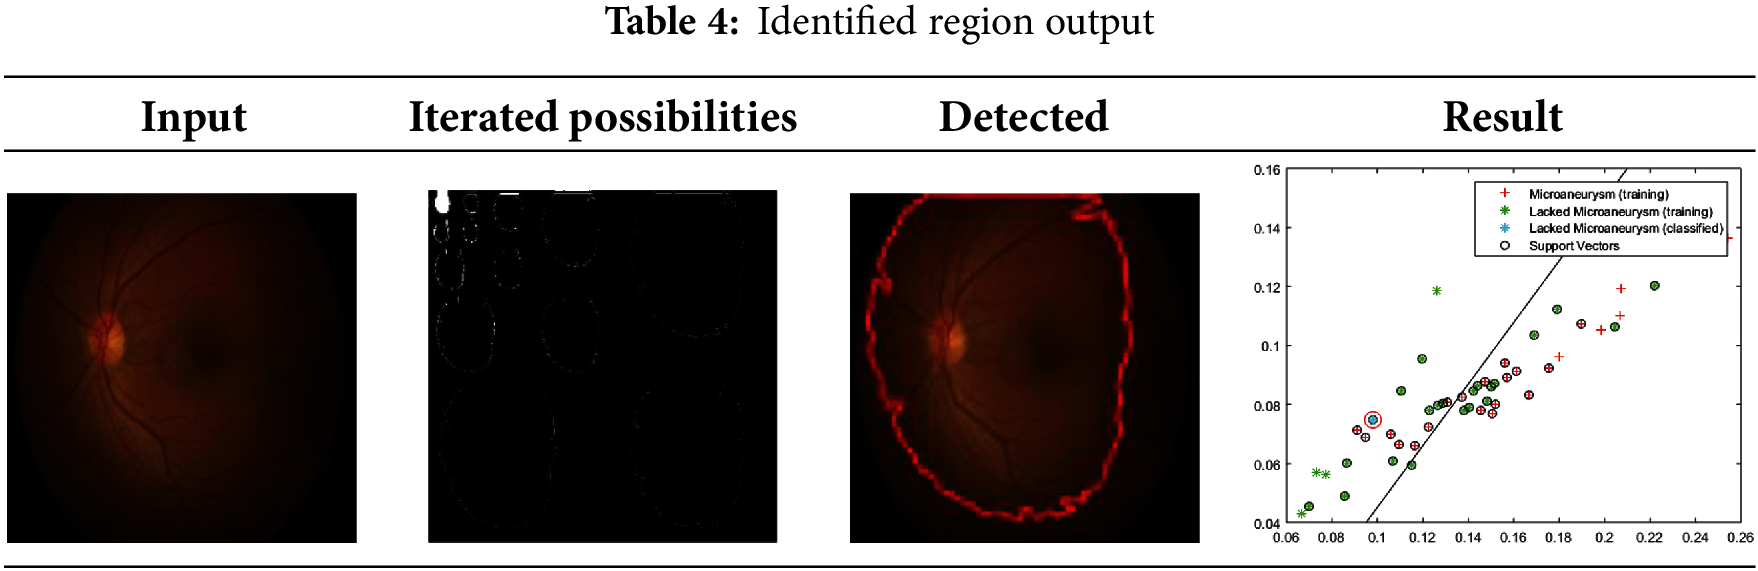
The experimental analysis utilizes retinal fundus images obtained from [38], encompassing data from medical databases and clinical libraries. The dataset includes images of both normal retinas and those with abnormalities such as diabetic, age-related, and hypertensive conditions. This heterogeneous dataset, comprising thousands of samples, reflects the diversity encountered in clinical practice, with contributions from patients of various ages, nationalities, and locations. While the dataset’s diversity enhances its robustness, certain limitations may exist, such as an overrepresentation of fundus abnormalities and the potential subjectivity or inaccuracy of image annotations. For testing, the dataset includes 47 DR images, while 1688+ images are designated for training purposes. Each image is divided into segments for analysis, with the maximum segmentation reaching 16 × 16 regions. Correlations are performed starting with 2 × 2 segments across varying derivatives. Table 2 displays possible derivative extractions for a sample input. Table 3 highlights minimum and maximum variation regions and their selected areas. Table 4 presents identified region outputs along with corresponding training results and accuracy metrics. The performance of the proposed model is evaluated using parameters such as sensitivity, error rate, extraction time, computational complexity, accuracy, and specificity. K-fold cross-validation is employed to assess model performance comprehensively across various dataset subsets. By iteratively training and validating on different fold combinations, this technique ensures consistency, reliability, and accurate computation of metrics like accuracy, precision, sensitivity, and specificity.
The REFUGE (Retinal Fundus Glaucoma Challenge) dataset [39] is also utilized for experimental analysis. Originally developed for glaucoma diagnosis, this publicly accessible dataset has demonstrated its suitability for various other retinal image processing applications. The dataset comprises 1200 fundus images, divided into 360 for training, 120 for validation, and 720 for testing. Annotations include detailed optic disc and cup segmentation, primarily intended for glaucoma assessment. The dataset encompasses both normal and pathological retinal images, offering a robust platform for evaluating retinal analysis models. Beyond its initial purpose for glaucoma detection, the REFUGE dataset serves as a versatile resource for testing model generalization across multiple retinal conditions, such as DR.
In Fig. 8, the medical imaging process for fundus detection using a DNN enhances the precision of fundoscopic diagnosis through continuous monitoring. The deep learning model accounts for inaccurate iterations by training to identify selective features and their corresponding extractions in the fundus region across different time intervals. In layer 1, less accurate and precise fundus detection is observed, where the least derivative and minimum variation are identified. The DNN is then retrained from the previous output, preventing the overload of computations. The maximum variations in the derivative model are addressed using the input retinal image, followed by the feature selection process, expressed with the formula
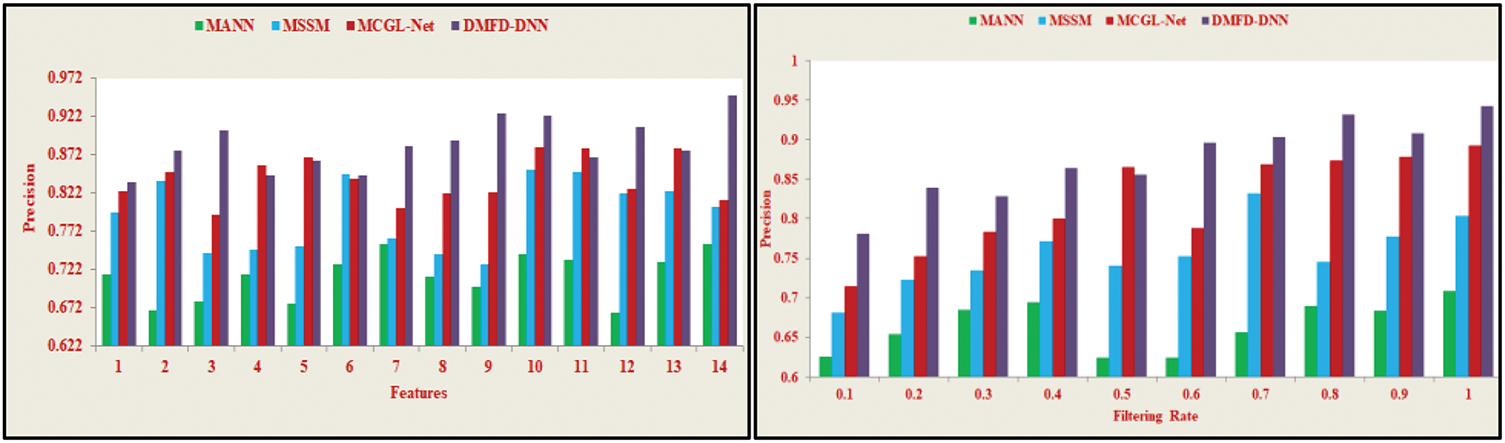
Figure 8: Precision analysis
The proposed DMFD-DNN model for fundus detection in diabetic patients focuses on enhancing image quality through brightness correction and contrast enhancement. This approach aims to achieve high sensitivity, as depicted in Fig. 9. During the feature filtering process, if the minimum derivative is identified over varying iterations in layer 1, the DNN is trained using the previous output. This iterative process ensures that the least derivative model is pursued at different intervals. The extracted features from the input retinal image are analyzed based on brightness observation, enabling the selection of fundus region features for more accurate and efficient fundus detection. The use of these techniques enhances the precision of identifying the fundus region, thereby improving the diagnostic process for diabetic patients.
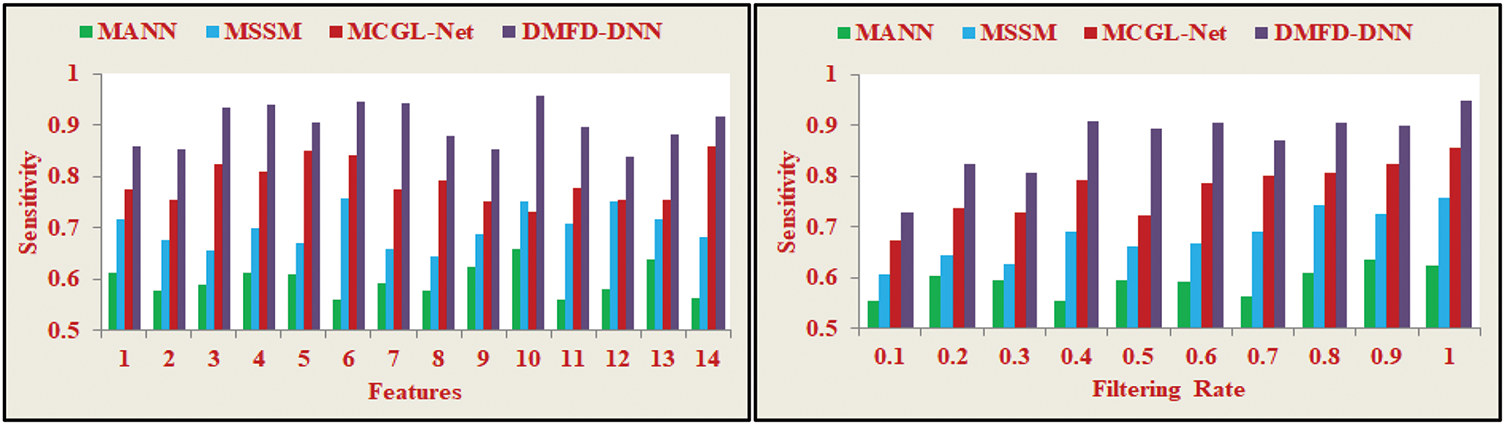
Figure 9: Sensitivity analysis
In Eq. (14), sensitivity measures the proportion of actual positive cases that the model correctly identifies. It is the ratio of correctly predicted positive observations to actual positives. For fundus detection in diabetic patients, the good region and fundus region are identified separately through brightness correction with minimum variations. Maximum accuracy is achieved using the derivative model for fundus detection, which considers similarity features through DL. The least derivative is identified based on potential feature extractions and the training process. The selection process uses the input retinal image and previous output to select specific region features. As a result, the least derivative model is applied to select precise features, improving the fundus detection precision and enhancing the sensitivity of feature selection in inaccurate iterations. This leads to higher sensitivity, ensuring more accurate identification of fundus features for diabetic patients.
The selection of precise features for fundus detection in retinal image observation through a DNN is illustrated in Fig. 10. The process involves identifying similar features and applying the least textural derivative model with minimum variations. This approach helps reduce complexity and minimize errors in fundus detection, enabling more accurate and efficient retinal image analysis.
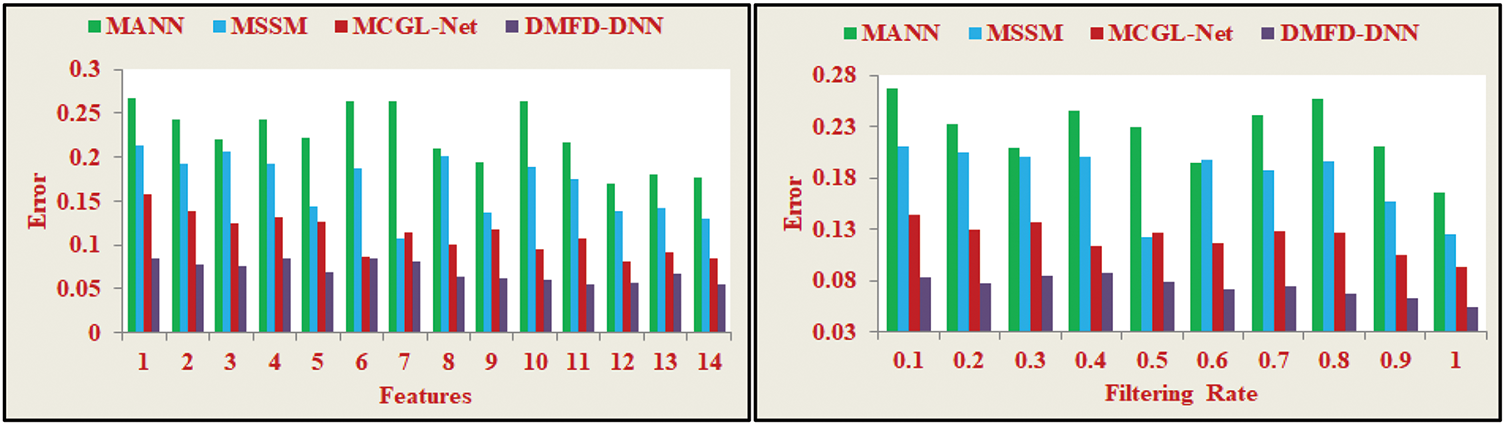
Figure 10: Error analysis
Error in Eq. (15) represents the proportion of misclassifications by the model, calculated as 1 − Accuracy, where accuracy is the ratio of correctly predicted observations to the total observations. The proposed fundus region selection model achieves lower error rates and enables the DNN to compute fundus detection with high precision. Retinal imaging processes adapt to individual variations, ensuring continuous monitoring and analysis for fundoscopic diagnosis with maximum accuracy. The final derivative processing minimizes computational overload by analyzing the input retinal image for feature extraction with minimal variation. Continuous monitoring simplifies identifying the fundus region in the human eye, facilitating easy diagnosis. The hidden layers of the neural network operate during the identification of significant derivatives, which may exhibit lower precision over varying iterations but maintain high sensitivity due to feature variation changes. These computations, detailed in Eqs. (4)–(8), ensure that error remains minimal, enhancing the model’s reliability for precise fundus detection.
The Extraction Time metric in Eq. (16) represents the duration required for feature extraction or data preprocessing within the algorithm. It is often measured in seconds or other appropriate units of time.
In Fig. 11, the process for fundus region selection leverages the least derivative and minimum variations to identify features in layer 2. Using DL, the model determines similarity features by comparing variations in the current image with the previous output, ensuring precise detection. Sequential monitoring of fundus-affected patients enables continuous analysis of feature extraction to detect errors and false positives at any time. The patient’s least textural derivative and maximum variations are examined to detect DR and correlate similar features with stored fundus images, reducing errors in the analysis sequence. This derivative model employs a DNN to process variations from stored images, minimizing errors and feature extraction time. Extracted features allow for selecting good regions and fundus regions without complexity. The DNN trains on the minimum derivatives identified over varying iterations, improving fundus detection precision. Despite an increase in computational cost during iterative training, this one-time expense does not affect the inference phase. The feature extraction time remains constant at 1.462 s during real-world application. For large datasets, where inference is frequently performed, the time saved during feature extraction far outweighs the initial training overhead, enabling efficient and accurate fundoscopic diagnosis for patients.
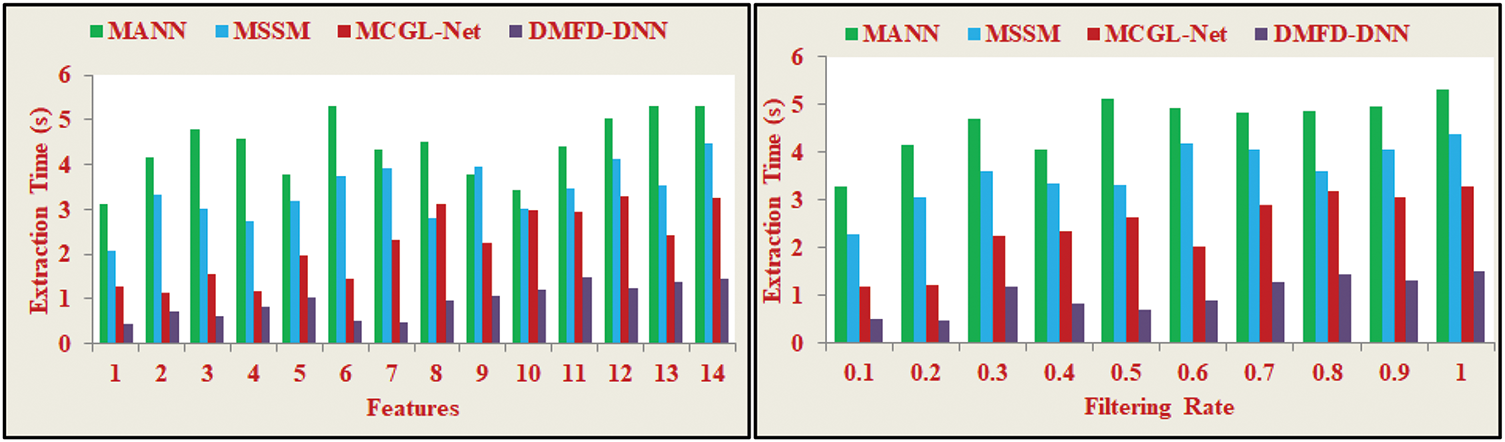
Figure 11: Extraction time analysis
The proposed fundus detection method for diabetic patients emphasizes selecting fundus region features from input retinal images to minimize feature extraction time and reduce complexity during observation and analysis. Minimum variation in the significant derivative is identified to select good regions with maximum accuracy, controlling variations in the initial image-processing phase. In layer 2 of the DL process, maximum variation is reduced across varying iterations and time intervals. This process identifies errors and overloaded computations during fundus region selection. If errors occur during image processing, the learning model retrains using selective features and their corresponding extractions. Stored fundus images are leveraged to facilitate current image processing across different time intervals, reducing complexity. The proposed derivative model analyzes machine-observed eye images for diagnosing and treating fundus diseases while minimizing errors and variations. This approach reduces overall complexity, as illustrated in Fig. 12. A comparative analysis of varying features and filtering rates is presented in Tables 5 and 6, displaying the method’s efficacy in achieving precise fundus detection and error reduction.
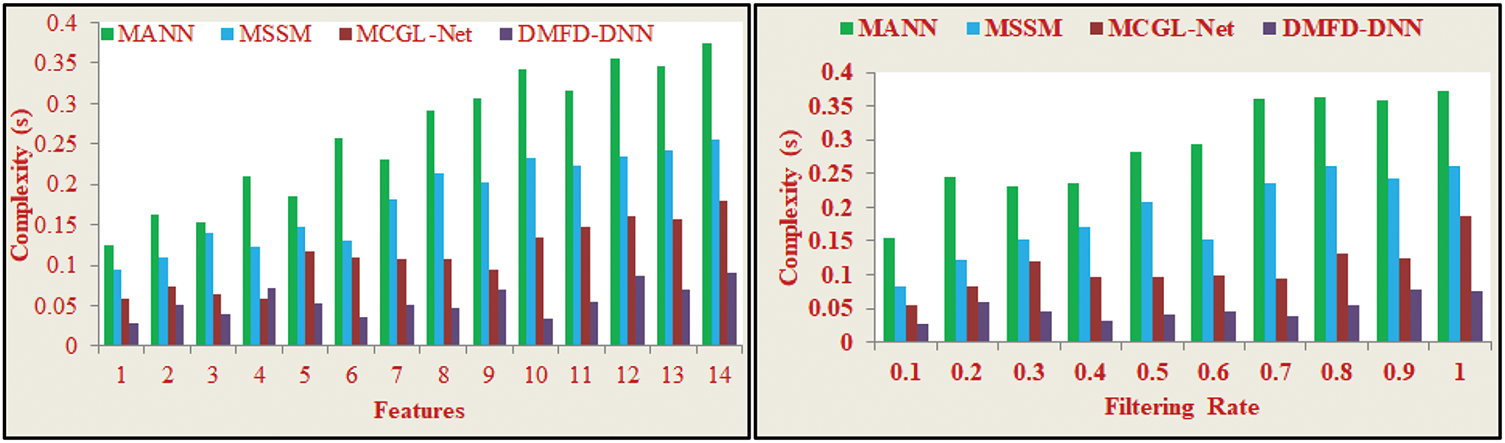
Figure 12: Complexity analysis
The Specificity Ratio, depicted in Fig. 13, is a critical performance metric that evaluates the model’s ability to accurately identify the true negatives, distinguishing normal cases from all actual negatives. In fundus image analysis, achieving a high specificity ratio is vital to minimizing diagnostic errors and avoiding unnecessary medical procedures. The results presented in Fig. 13 demonstrate the model’s robustness, indicating its high specificity even in scenarios with imbalanced datasets or overlapping feature spaces. This capability underscores the model’s suitability for clinical applications, where the precise classification of normal and abnormal retinal images is paramount for ensuring accurate diagnoses and patient care.
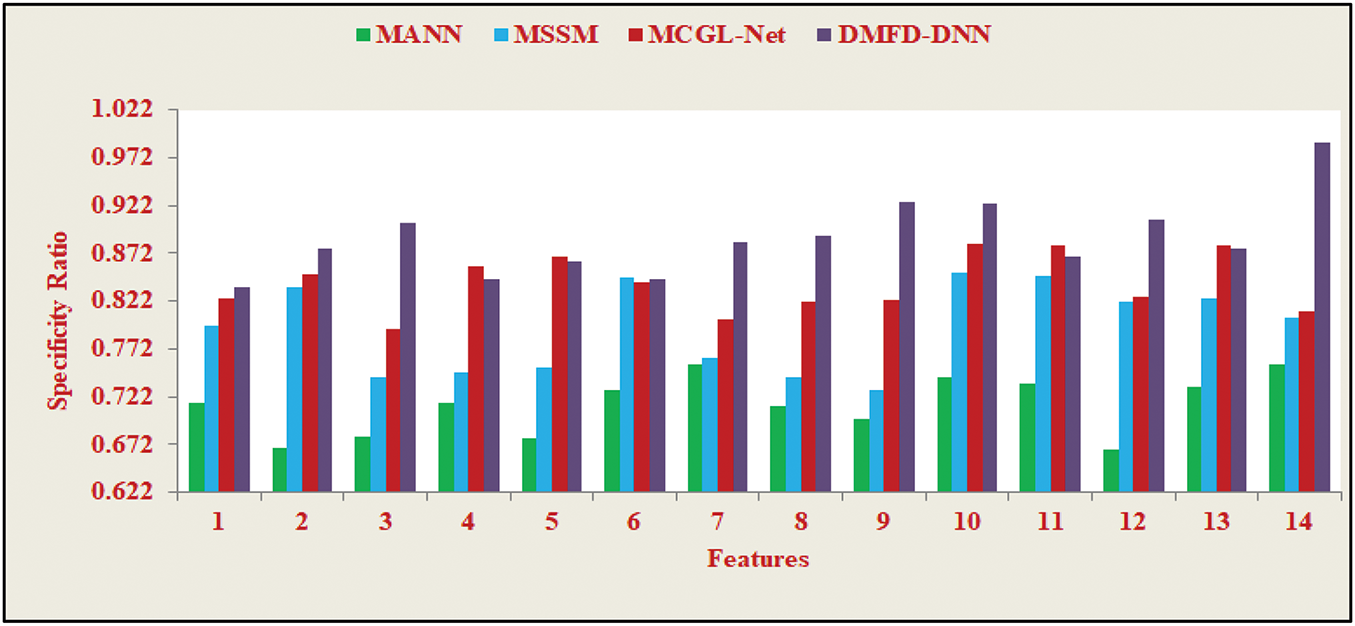
Figure 13: Specificity ratio
Fig. 14 illustrates the F1-score Ratio, which provides a balanced assessment of the model’s performance in fundus detection by integrating both precision and recall into a single metric—the harmonic mean. This metric is particularly beneficial for evaluating models applied to unbalanced datasets, as it accounts for both false positives and false negatives. In the context of fundus detection, the F1-score Ratio highlights the model’s effectiveness in accurately distinguishing true anomalies from false alarms. The consistent performance observed in Fig. 14, with high F1-scores maintained across varied experimental conditions, underscores the robustness and adaptability of the proposed method. This resilience is crucial for addressing the inherent challenges posed by clinical datasets, ensuring reliable and precise diagnostics.
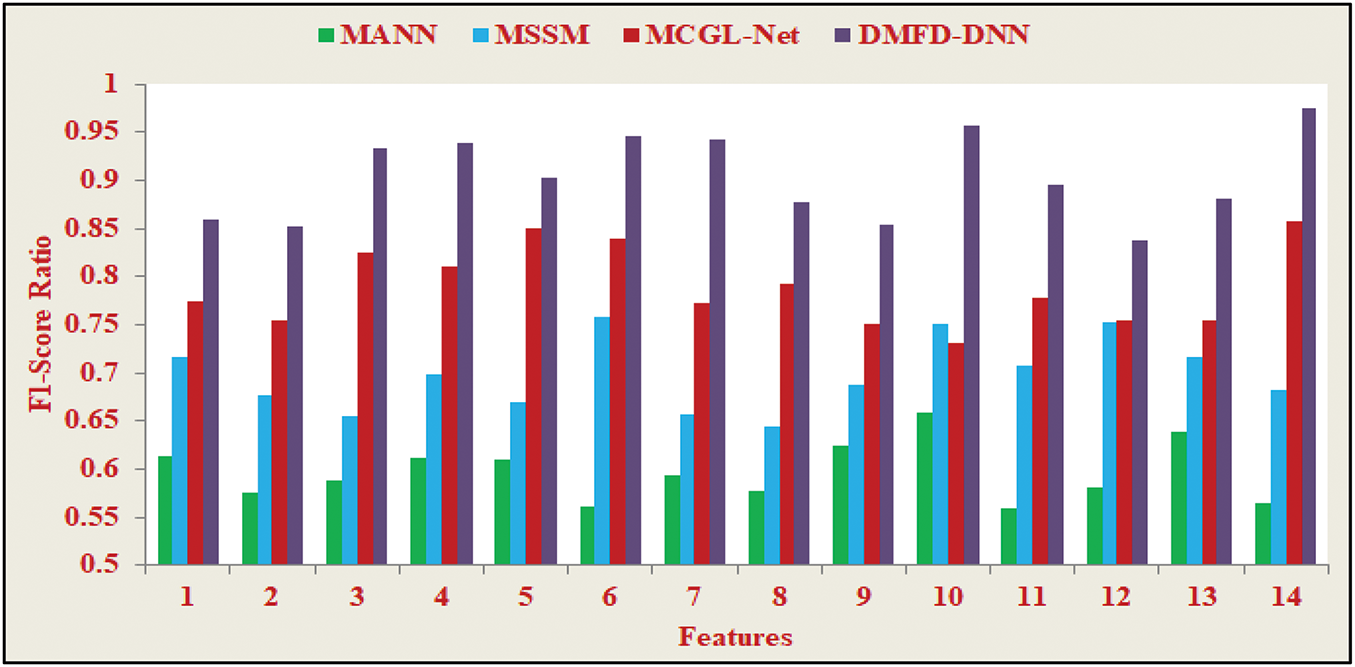
Figure 14: F1-score ratio
Tables 5 and 6 demonstrate a significant improvement in the accuracy rates across various methodologies, highlighting the effectiveness of the proposed strategy compared to existing approaches. The suggested method achieves a precision of 0.956, marking a 14.98% increase over the next most effective technique, which signifies considerable progress in fundus detection. The consistent enhancement in correctly identifying fundus images across the evaluated methods reflects the growing sophistication of fundus detection systems. The proposed method also attains a precision rate of 0.954, outperforming all other methods assessed, with a notable improvement of 12.77% over the closest alternative. This continuous upward trend in accuracy highlights the ongoing advancements and effectiveness of fundus detection technologies.
The study compared various methodologies, including MANN, MSSM, MCGL-Net, and DMFD-DNN, focusing on their characteristics and filtration rates. The findings, as shown in Tables 5 and 6, indicate substantial improvements in specificity with the proposed DMFD-DNN method. The initial set of specificity values showed a 13.67% improvement from MANN to DMFD-DNN, with DMFD-DNN achieving the highest specificity of 0.964. This marks a significant advancement in accuracy compared to earlier methods, demonstrating DMFD-DNN’s effectiveness in identifying negative instances in fundus detection. The subsequent set of specificity values further illustrates notable improvements, with DMFD-DNN reaching the best specificity score of 0.946, reflecting a substantial enhancement in specificity compared to other methods.
DMFD-DNN, a deep learning technique, enhances segmentation accuracy by integrating multi-level distant relational modeling and attention mechanisms. This algorithm effectively detects fundus regions in complex images, reducing error rates and improving patient outcomes. Additionally, it boosts resource efficiency by prioritizing relevant features and eliminating unnecessary calculations, leading to faster processing and lower computational demands. The DMFD-DNN model is highly flexible and robust, consistently delivering strong performance across various datasets despite differences in fundus images. However, its application requires access to extensive and diverse datasets for effective training, which may necessitate significant computational resources. Uniform rating criteria can help ensure fair and equitable comparisons among different methodologies.
This article introduces a derivative model for fundus detection, supported by a DNN, to enhance fundoscopic diagnosis. The proposed model extracts specific features by analyzing different regions and segment derivatives, classifying them based on their minimum and maximum variations to reduce false rates. The process addresses the correlation between textural derivatives and minimum variations to avoid additional complexity. The learning process operates in two layers: the first identifies less accurate features using minimum and maximum correlations, while the second layer focuses on identifying precise features and their regions. Increasing the number of processing instances improves feature selection over time, with textural derivatives helping to prevent errors during training iterations. The model achieves improvements in precision (15.95%), sensitivity (10.74%), error reduction (7.54%), extraction time (11.04%), and complexity (8.83%). However, challenges such as complex computations, noise sensitivity, potential dataset biases, and data privacy concerns persist. Solutions include improving network design, applying model compression techniques, leveraging hardware acceleration, using preprocessing methods to reduce noise, enhancing model generalization through robust training, and ensuring careful data curation to address biases.
Acknowledgement: The authors extend their appreciation to the Deanship of Research and Graduate Studies at King Khalid University for funding this work through small group research under grant number RGP1/296/45. This study is supported via funding from Prince Sattam bin Abdulaziz University Project Number (PSAU/2025/R/1446).
Funding Statement: This research was supported by the Basic Science Research Program through the National Research Foundation of Korea (NRF) funded by the Ministry of Education (No. 2021R1F1A1055408). This work was supported by the Researchers Supporting Project Number (MHIRSP2024005) Almaarefa University, Riyadh, Saudi Arabia.
Author Contributions: Study conception and design: Asma Aledrees, Mohd Anjum, Hong Min; data collection: Yousef Ibrahim Daradkeh; analysis and interpretation of results: Asma Aledrees, Ashit Kumar Dutta, Yousef Ibrahim Daradkeh; draft manuscript preparation: Mohd Anjum, Hong Min, Ashit Kumar Dutta. All authors reviewed the results and approved the final version of the manuscript.
Availability of Data and Materials: The data that support the findings of this study are included within the study.
Ethics Approval: Not applicable.
Conflicts of Interest: The authors declare no conflicts of interest to report regarding the present study.
References
1. Cen LP, Ji J, Lin JW, Ju ST, Lin HJ, Li TP, et al. Automatic detection of 39 fundus diseases and conditions in retinal photographs using deep neural networks. Nat Commun. 2021;12(1):1–13. doi:10.1038/s41467-021-25138-w. [Google Scholar] [PubMed] [CrossRef]
2. Bernabe O, Acevedo E, Acevedo A, Carreno R, Gomez S. Classification of eye diseases in fundus images. IEEE Access. 2021;9:101267–76. doi:10.1109/ACCESS.2021.3094649. [Google Scholar] [CrossRef]
3. AbdelMaksoud E, Barakat S, Elmogy M. A comprehensive diagnosis system for early signs and different diabetic retinopathy grades using fundus retinal images based on pathological changes detection. Comput Biol Med. 2020;126(1):104039. doi:10.1016/j.compbiomed.2020.104039. [Google Scholar] [PubMed] [CrossRef]
4. Zhou C, Zhang X, Chen H. A new robust method for blood vessel segmentation in retinal fundus images based on weighted line detector and hidden markov model. Comput Methods Programs Biomed. 2020;187(9):105231. doi:10.1016/j.cmpb.2019.105231. [Google Scholar] [PubMed] [CrossRef]
5. Wang P, Yuan M, He Y, Sun J. 3D augmented fundus images for identifying glaucoma via transferred convolutional neural networks. Int Ophthalmol. 2021;41(6):2065–72. doi:10.1007/s10792-021-01762-9. [Google Scholar] [PubMed] [CrossRef]
6. Thanki R. A deep neural network and machine learning approach for retinal fundus image classification. Healthc Anal. 2023;3(3):100140. doi:10.1016/j.health.2023.100140. [Google Scholar] [CrossRef]
7. Toptaş B, Toptaş M, Hanbay D. Detection of optic disc localization from retinal fundus image using optimized color space. J Digit Imaging. 2022;35(2):302–19. doi:10.1007/s10278-021-00566-8. [Google Scholar] [PubMed] [CrossRef]
8. Du J, Zou B, Chen C, Xu Z, Liu Q. Automatic microaneurysm detection in fundus image based on local cross-section transformation and multi-feature fusion. Comput Methods Programs Biomed. 2020;196(6):105687. doi:10.1016/j.cmpb.2020.105687. [Google Scholar] [PubMed] [CrossRef]
9. Fang L, Qiao H. Diabetic retinopathy classification using a novel DAG network based on multi-feature of fundus images. Biomed Signal Process Control. 2022;77(43–44):103810. doi:10.1016/j.bspc.2022.103810. [Google Scholar] [CrossRef]
10. Yang D, Zhao H, Han T. Learning feature-rich integrated comprehensive context networks for automated fundus retinal vessel analysis. Neurocomputing. 2022;491(9):132–43. doi:10.1016/j.neucom.2022.03.061. [Google Scholar] [CrossRef]
11. Yellapragada B, Hornauer S, Snyder K, Yu S, Yiu G. Self-supervised feature learning and phenotyping for assessing age-related macular degeneration using retinal fundus images. Ophthalmol Retin. 2022;6(2):116–29. doi:10.1016/j.oret.2021.06.010. [Google Scholar] [PubMed] [CrossRef]
12. Budak Ü, Cömert Z, Çıbuk M, Şengür A. DCCMED-Net: densely connected and concatenated multi encoder-decoder CNNs for retinal vessel extraction from fundus images. Med Hypotheses. 2020;134:109426. doi:10.1016/j.mehy.2019.109426. [Google Scholar] [PubMed] [CrossRef]
13. Medeiros FA, Jammal AA, Mariottoni EB. Detection of progressive glaucomatous optic nerve damage on fundus photographs with deep learning. Ophthalmology. 2021;128(3):383–92. doi:10.1016/j.ophtha.2020.07.045. [Google Scholar] [PubMed] [CrossRef]
14. Liao Y, Xia H, Song S, Li H. Microaneurysm detection in fundus images based on a novel end-to-end convolutional neural network. Biocybern Biomed Eng. 2021;41(2):589–604. doi:10.1016/j.bbe.2021.04.005. [Google Scholar] [CrossRef]
15. Wu J, Ren X, Xiao Z, Zhang F, Geng L, Zhang S. Research on fundus image registration and fusion method based on nonsubsampled contourlet and adaptive pulse coupled neural network. Multimed Tools Appl. 2020;79(47–48):34795–812. doi:10.1007/s11042-019-08194-9. [Google Scholar] [CrossRef]
16. Tang MCS, Teoh SS, Ibrahim H, Embong Z. A Deep learning approach for the detection of neovascularization in fundus images using transfer learning. IEEE Access. 2022;10(6):20247–58. doi:10.1109/ACCESS.2022.3151644. [Google Scholar] [CrossRef]
17. Tang S, Yu F. Construction and verification of retinal vessel segmentation algorithm for color fundus image under BP neural network model. J Supercomput. 2021;77(4):3870–84. doi:10.1007/s11227-020-03422-8. [Google Scholar] [CrossRef]
18. Pan J, Gong J, Yu M, Zhang J, Guo Y, Zhang G. A multi-level remote relational modeling network for accurate segmentation of fundus blood vessels. IEEE Trans Instrum Meas. 2022;71:1–14. doi:10.1109/TIM.2022.3203114. [Google Scholar] [CrossRef]
19. Ju L, Wang X, Zhao X, Bonnington P, Drummond T, Ge Z. Leveraging regular fundus images for training UWF fundus diagnosis models via adversarial learning and pseudo-labeling. IEEE Trans Med Imaging. 2021;40(10):2911–25. doi:10.1109/TMI.2021.3056395. [Google Scholar] [PubMed] [CrossRef]
20. Yang Y, Shang F, Wu B, Yang D, Wang L, Xu Y, et al. Robust collaborative learning of patch-level and image-level annotations for diabetic retinopathy grading from fundus image. IEEE Trans Cybern. 2022;52(11):11407–17. doi:10.1109/TCYB.2021.3062638. [Google Scholar] [PubMed] [CrossRef]
21. Ding L, Kuriyan AE, Ramchandran RS, Wykoff CC, Sharma G. Weakly-supervised vessel detection in ultra-widefield fundus photography via iterative multi-modal registration and learning. IEEE Trans Med Imaging. 2021;40(10):2748–58. doi:10.1109/TMI.2020.3027665. [Google Scholar] [PubMed] [CrossRef]
22. Yang L, Wang H, Zeng Q, Liu Y, Bian G. A hybrid deep segmentation network for fundus vessels via deep-learning framework. Neurocomputing. 2021;448(11):168–78. doi:10.1016/j.neucom.2021.03.085. [Google Scholar] [CrossRef]
23. Xia H, Lan Y, Song S, Li H. A multi-scale segmentation-to-classification network for tiny microaneurysm detection in fundus images. Knowledge-Based Syst. 2021;226(9):107140. doi:10.1016/j.knosys.2021.107140. [Google Scholar] [CrossRef]
24. Ou X, Gao L, Quan X, Zhang H, Yang J, Li W. BFENet: a two-stream interaction CNN method for multi-label ophthalmic diseases classification with bilateral fundus images. Comput Methods Programs Biomed. 2022;219(12):106739. doi:10.1016/j.cmpb.2022.106739. [Google Scholar] [PubMed] [CrossRef]
25. Han J, Wang Y, Gong H. Fundus retinal vessels image segmentation method based on improved U-Net. IRBM. 2022;43(6):628–39. doi:10.1016/j.irbm.2022.03.001. [Google Scholar] [CrossRef]
26. Sun K, He M, Xu Y, Wu Q, He Z, Li W, et al. Multi-label classification of fundus images with graph convolutional network and LightGBM. Comput Biol Med. 2022;149(1):105909. doi:10.1016/j.compbiomed.2022.105909. [Google Scholar] [PubMed] [CrossRef]
27. dos Santos JCM, Carrijo GA, de Fátima dos Santos Cardoso C, Ferreira JC, Sousa PM, Patrocínio AC. Fundus image quality enhancement for blood vessel detection via a neural network using CLAHE and wiener filter. Res Biomed Eng. 2020;36(2):107–19. doi:10.1007/s42600-020-00046-y. [Google Scholar] [CrossRef]
28. Moon JY, Wai KM, Patel NS, Katz R, Dahrouj M, Miller JB. Visualization of retinal breaks on ultra-widefield fundus imaging using a digital green filter. Graefe’s Arch Clin Exp Ophthalmol. 2022;261(4):935–40. doi:10.1007/s00417-022-05855-8. [Google Scholar] [PubMed] [CrossRef]
29. Long S, Chen J, Hu A, Liu H, Chen Z, Zheng D. Microaneurysms detection in color fundus images using machine learning based on directional local contrast. Biomed Eng Online. 2020;19(1):1–23. doi:10.1186/s12938-020-00766-3. [Google Scholar] [PubMed] [CrossRef]
30. Theera-Umpon N, Poonkasem I, Auephanwiriyakul S, Patikulsila D. Hard exudate detection in retinal fundus images using supervised learning. Neural Comput Appl. 2020;32(17):13079–96. doi:10.1007/s00521-019-04402-7. [Google Scholar] [CrossRef]
31. Özbay E. An active deep learning method for diabetic retinopathy detection in segmented fundus images using artificial bee colony algorithm. Artif Intell Rev. 2022;56(4):3291–318. doi:10.1007/s10462-022-10231-3. [Google Scholar] [CrossRef]
32. Celik C, Yücadag İ, Akçam HT. Automated retinal image analysis to detect optic nerve hypoplasia. Inf Technol Control. 2024;53(2):522–41. doi:10.5755/j01.itc.53.2.35152. [Google Scholar] [CrossRef]
33. Ramasamy LK, Padinjappurathu SG, Kadry S, Damaševičius R. Detection of diabetic retinopathy using a fusion of textural and ridgelet features of retinal images and sequential minimal optimization classifier. PeerJ Comput Sci. 2021;7(11):e456. doi:10.7717/peerj-cs.456. [Google Scholar] [PubMed] [CrossRef]
34. Maqsood S, Damaševičius R, Maskeliūnas R. Hemorrhage detection based on 3D CNN deep learning framework and feature fusion for evaluating retinal abnormality in diabetic patients. Sensors. 2021;21(11):3865. doi:10.3390/s21113865. [Google Scholar] [PubMed] [CrossRef]
35. Pandey A, Kumar A. Discriminative analysis of diabetic retinopathy using cascaded network with Atrous convolution and fundus biomarkers. Biomed Signal Process Control. 2024;98:106777. doi:10.1016/j.bspc.2024.106777. [Google Scholar] [CrossRef]
36. Tohye TG, Qin Z, Al-Antari MA, Ukwuoma CC, Lonseko ZM, Gu YH. CA-ViT: contour-guided and augmented vision transformers to enhance glaucoma classification using fundus images. Bioengineering. 2024;11(9):887. doi:10.3390/bioengineering11090887. [Google Scholar] [PubMed] [CrossRef]
37. Nazih W, Aseeri AO, Atallah OY, El-Sappagh S. Vision transformer model for predicting the severity of diabetic retinopathy in fundus photography-based retina images. IEEE Access. 2023;11:117546–61. doi:10.1109/ACCESS.2023.3326528. [Google Scholar] [CrossRef]
38. Memari N, Ramli AR, Saripan MI, Mashohor S, Moghbel M. Retinal blood vessel segmentation by using matched filtering and fuzzy c-means clustering with integrated level set method for diabetic retinopathy assessment. J Med Biol Eng. 2019;39(5):713–31. doi:10.1007/s40846-018-0454-2. [Google Scholar] [CrossRef]
39. Orlando JI, Fu H, Barbosa Breda J, van Keer K, Bathula DR, Diaz-Pinto A, et al. REFUGE challenge: a unified framework for evaluating automated methods for glaucoma assessment from fundus photographs. Med Image Anal. 2020;59(1):101570. doi:10.1016/j.media.2019.101570. [Google Scholar] [PubMed] [CrossRef]
Cite This Article
 Copyright © 2025 The Author(s). Published by Tech Science Press.
This work is licensed under a Creative Commons Attribution 4.0 International License , which permits unrestricted use, distribution, and reproduction in any medium, provided the original work is properly cited.
 Downloads
 Citation Tools