
 Submit a Paper
 Propose a Special lssue
 Open Access
ARTICLE

Pedestrian Collision Safety Performance Prediction Method Based on Deep Learning Models
1 School of Mechanical Engineering, Dalian University of Technology, Dalian, 116024, China
2Guangzhou Automobile Group Co., Ltd., Automotive Engineering Research Institute, Guangzhou, 511434, China
* Corresponding Author: Wenbin Hou. Email:
(This article belongs to the Special Issue: Data-Driven and Physics-Informed Machine Learning for Digital Twin, Surrogate Modeling, and Model Discovery, with An Emphasis on Industrial Applications)
Computer Modeling in Engineering & Sciences 2025, 144(1), 1-27. https://doi.org/10.32604/cmes.2025.065664
Received 19 March 2025; Accepted 30 May 2025; Issue published 31 July 2025
 View Full Text
 Download PDF
Abstract
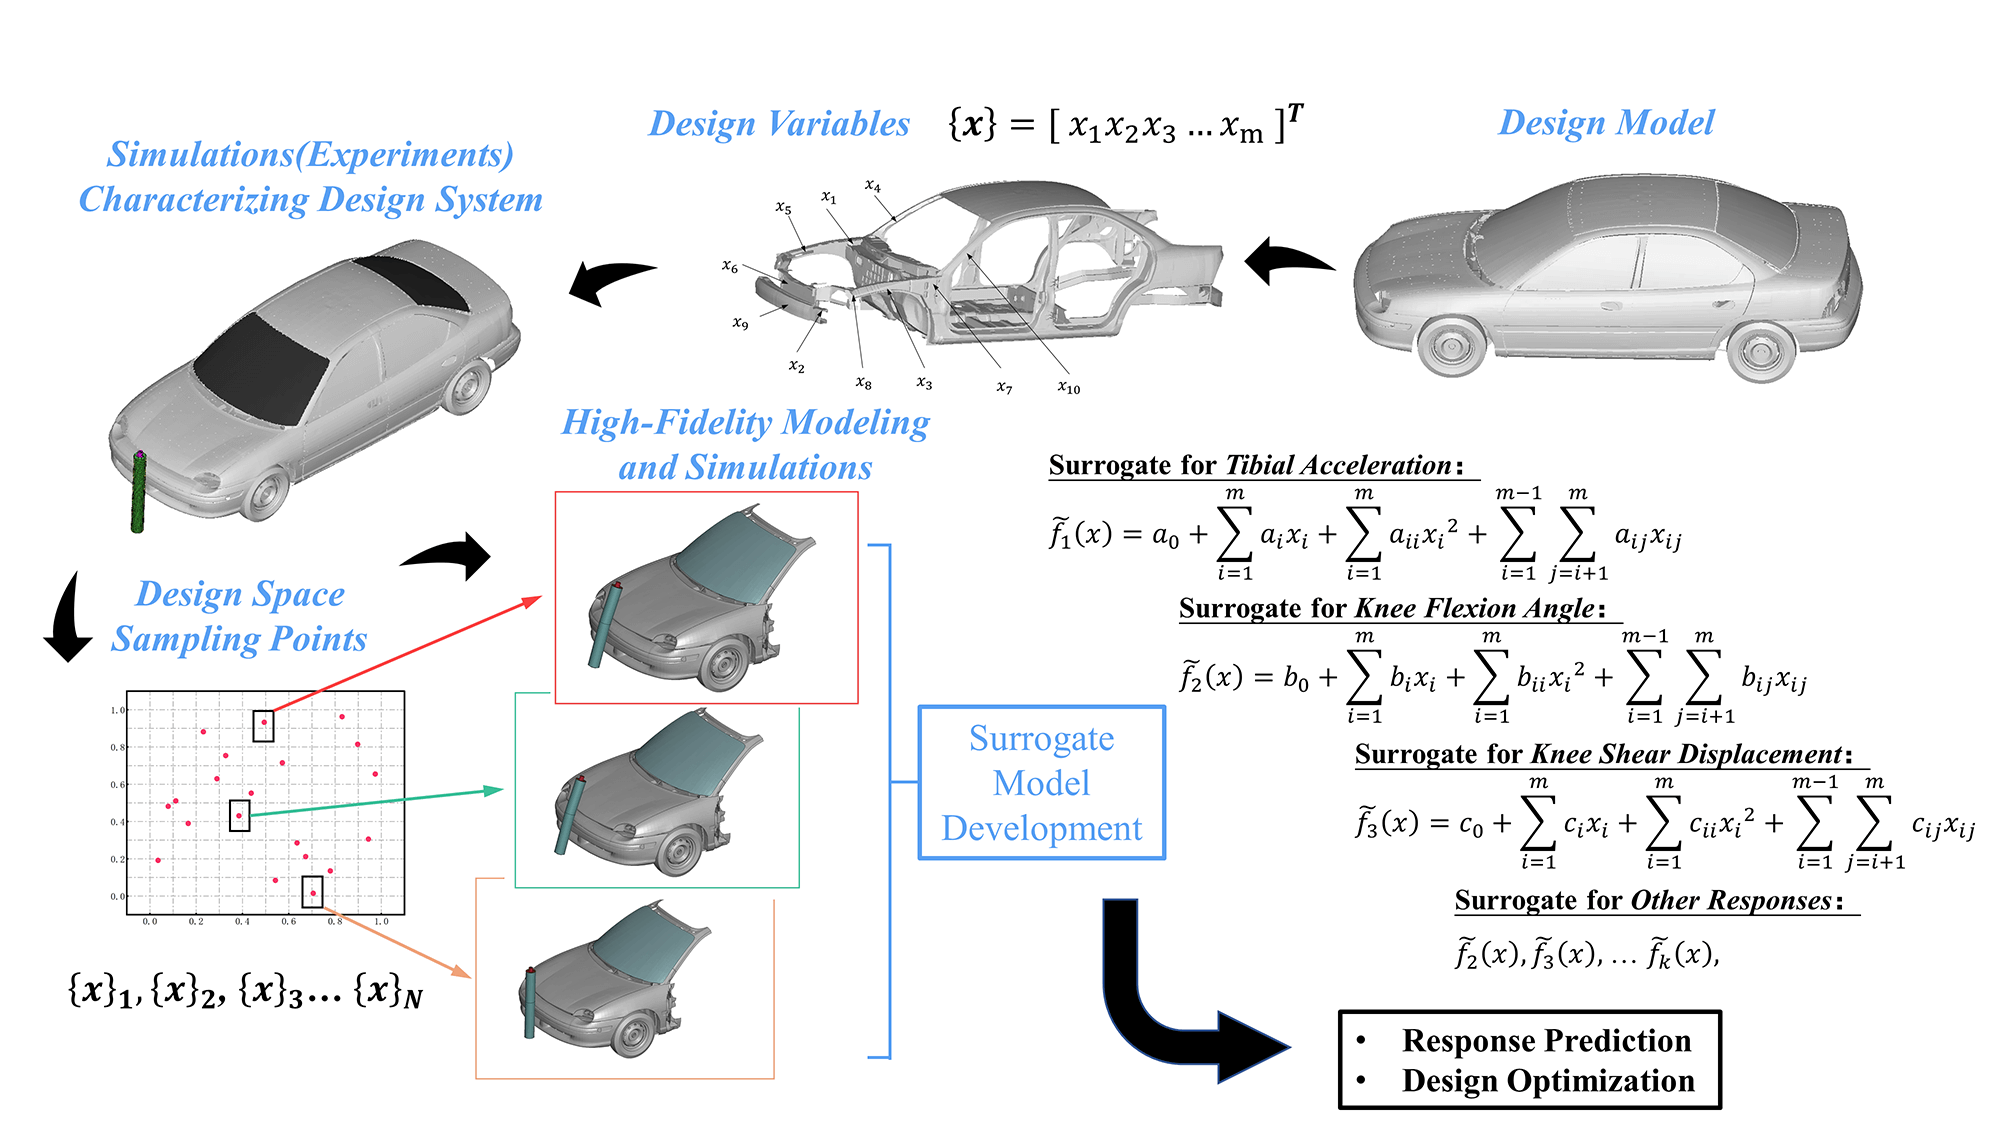
This study presents an interpretable surrogate framework for predicting pedestrian-leg injury severity that integrates high-fidelity finite-element (FE) simulations with a TabNet-based deep-learning model. We generated a parametric dataset of 3000 impact scenarios—covering ten vehicle types and various legform impactors—using automated FE runs configured via Latin hypercube sampling. After preprocessing and one-hot encoding of categorical features, we trained TabNet alongside Support-Vector Regression, Random Forest, and Decision-Tree ensembles. All models underwent hyperparameter tuning via Optuna’s Bayesian optimization coupled with repeated four-fold cross-validation (20 trials per model). TabNet achieved the best balance of explanatory power and predictive accuracy, with an average R2 = 0.94 ± 0.01 and RMSE = 0.14 ± 0.02. On an independent test set, 85%, 88%, and 90% of predictions for tibial acceleration, knee-flexion angle, and shear displacement, respectively, fell within ±20% of true peaks. SHAP-based analyses confirm that collision-point location and bumper geometry dominate injury outcomes. These results demonstrate TabNet’s capacity to deliver rapid, robust, and explainable injury predictions, offering actionable design insights for vehicle front-end optimization and regulatory assessment in early development stages.Graphic Abstract
Keywords
The global surge in motor-vehicle ownership has been accompanied by a corresponding rise in road-traffic accidents. The World Health Organization reports that traffic crashes claim roughly 1.35 million lives each year and injure or disable many millions more [1]. Pedestrians, who lack any intrinsic physical protection, constitute a disproportionate share of these casualties. A typical crash sequence begins with the pedestrian’s lower limbs striking the bumper, followed by secondary contacts of the torso and head with the hood and windshield—often producing severe, sometimes fatal, injuries. In response, many countries have enacted pedestrian-protection regulations [2–4]. Improving leg protection therefore hinges on accurate digital modelling and on front-end structures explicitly tuned for pedestrian friendliness. Conventional development cycles rely heavily on finite-element (FE) simulations, iterating a limited set of geometric variables during the early concept phase. Although such methods can capture complex physics, they are computationally expensive and ill-suited for large-scale, multi-variable optimisation.
Traditional approaches largely rely on Finite Element Method (FEM) simulations to seek structural improvements or evaluate performance. For example, Zhang et al. [5] tuned hood inner-panel parameters to balance indentation resistance and head-impact performance, while Fredriksson et al. [6] mined 1030 real-world cases to map injury severity to impact speed. Follow-up studies added specific countermeasures: Shi et al. [7] analysed how hood airbags and braking profiles lower head-injury scores; Mo et al. [8] and Asgari et al. [9] built validated lower-limb FE models to study fracture and ligament injury; and Fredriksson et al. [10] compared active braking, deployable hoods, and integrated systems in a common FE framework. Konosu et al. [11] highlighted the need for flexible, rather than rigid, legform impactors, and Lu et al. [12] used TRIZ to guide air-bag layout and simulation.
Despite the widespread use of traditional approaches such as topology optimization and finite element method (FEM) analysis in vehicle safety performance design, these methods face inherent limitations. Topology optimization relies heavily on designer expertise and predefined rules, hindering the automated discovery of optimal solutions. FEM, while capable of accurately modeling complex physical phenomena, remains computationally intensive and inefficient for multi-variable optimization. Furthermore, these traditional approaches lack the predictive power of data-driven models, limiting their ability to provide real-time feedback or adapt to rapid design changes. To bypass exhaustive FE sweeps, Das et al. [13] used machine-learning text classifiers for crash reports, Tang et al. [14] built a MATLAB/Simulink virtual vehicle-to-vehicle–pedestrian emergency-braking model, and Zhao et al. [15] applied tree-based algorithms to link highway design to pedestrian crash risk. Integrated solutions are emerging: Choi et al. [16] reported that an active-passive pedestrian-protection suite could cut fatality risk by about 90%. Complementary studies relate front-end geometry to fatal injuries [17], deliver real-time vision warnings [18] and exploit smartphone–vehicle communication for proactive protection [19].
Finite-element (FE) optimisation in high-dimensional design spaces is computationally prohibitive, whereas machine-learning surrogates can deliver rapid, accurate predictions. To leverage the strengths of both approaches, this study integrates high-fidelity FE simulation data with a machine-learning surrogate to identify the front-end design parameters that most strongly influence pedestrian lower-limb injury and to enable accelerated design iteration. We pursue four interrelated objectives:
1. Develop and validate a surrogate predictive framework: Construct a regression model that precisely maps vehicle front-end design variables to three continuous injury metrics—tibial acceleration, knee flexion angle, and shear displacement—and demonstrate that its performance meets or exceeds established regulatory benchmarks.
2. Identify and quantify principal injury drivers: Employ SHAP (Shapley Additive Explanations) to interpret the surrogate, thereby pinpointing and ranking structural features—such as geometric proportions, material stiffness, and energy-absorbing components—according to their quantitative contributions to each injury metric.
3. Translate biomechanical insights into design guidelines: Synthesize the surrogate’s interpretive findings into concrete, performance-driven recommendations for pedestrian-friendly bumper and hood geometries, balancing injury mitigation with manufacturing feasibility and aesthetic considerations.
4. Demonstrate efficiency gains in early-stage design: Compare the computational cost and turnaround time of the surrogate approach against iterative FE analyses, quantifying resource savings and establishing the surrogate’s viability as a real-time decision-support tool during the conceptual design phase.
By achieving these objectives, this work delivers a robust, interpretable, and efficient predictive tool for pedestrian lower-limb injury assessment, supports evidence-based traffic-safety policymaking, and guides the engineering of vehicle front ends that effectively reduce injury severity in real-world crashes.
2 Finite-Element Model Construction for Pedestrian-Collision Safety
The objective of this study is to predict the severity of pedestrian leg injuries resulting from collisions using the TRL leg model. The metrics for evaluating leg injuries include impact acceleration, knee shear displacement, and knee bending angle [20], which are chosen as the target variables for this research. The dataset employed in this study is entirely derived from Finite Element Method (FEM) simulations. FEM is a computational technique that creates a mathematical representation of physical systems to simulate real-world collision events, thereby generating high-precision data. Initially, a finite element (FE) model of the vehicle’s geometric structure is developed. The vehicle’s body is segmented based on the collision zones defined by C-NCAP regulations, as shown in Fig. 1, retaining critical front-end components likely to influence the severity of leg injuries [21], such as the bumper, crash beam, and hood.
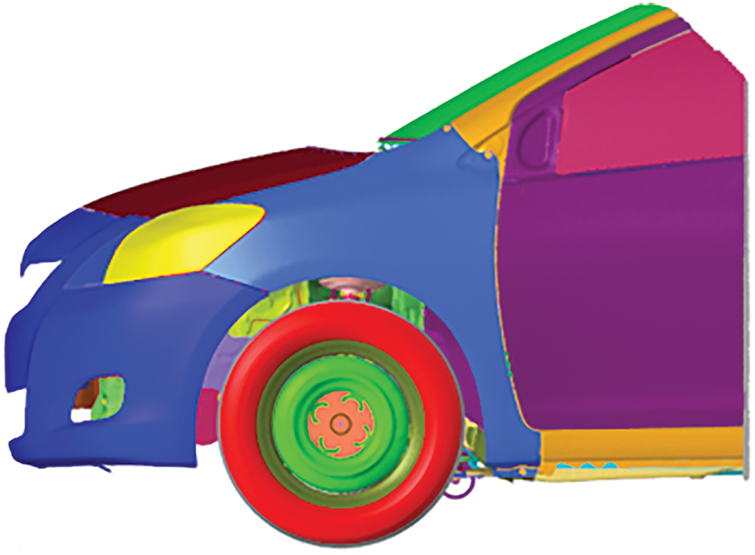
Figure 1: Simplified body
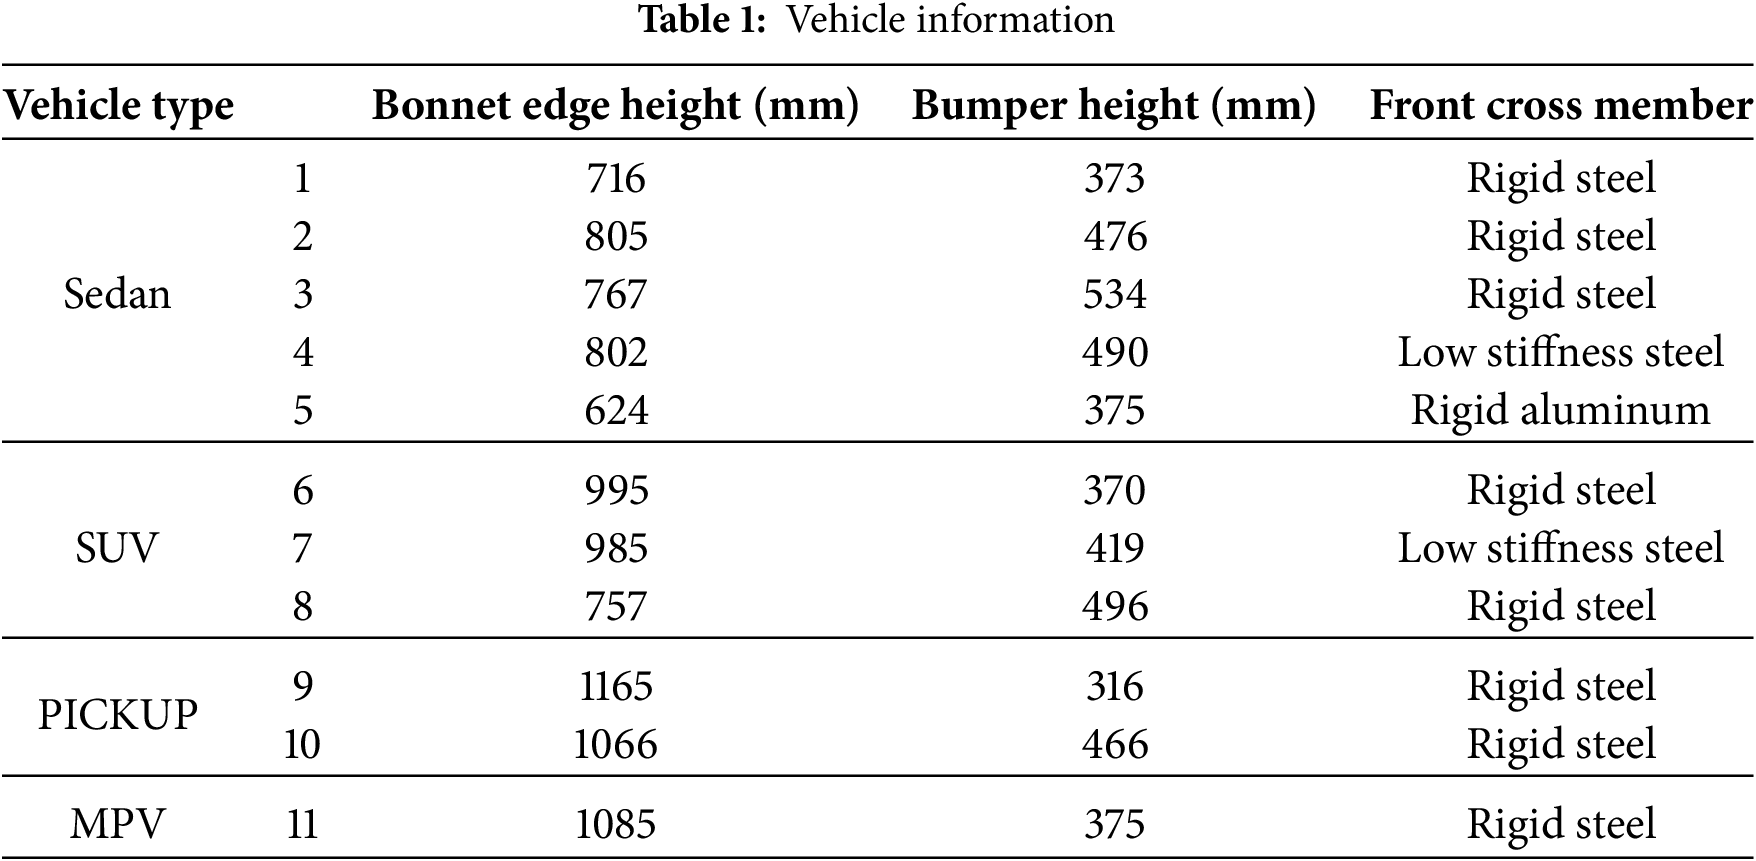
To ensure that the constructed machine learning model generalizes well across a wide range of passenger vehicles, data from ten different vehicle types, including sedans, MPVs, SUVs, and others, were collected. The specific vehicle information is shown in Table 1.
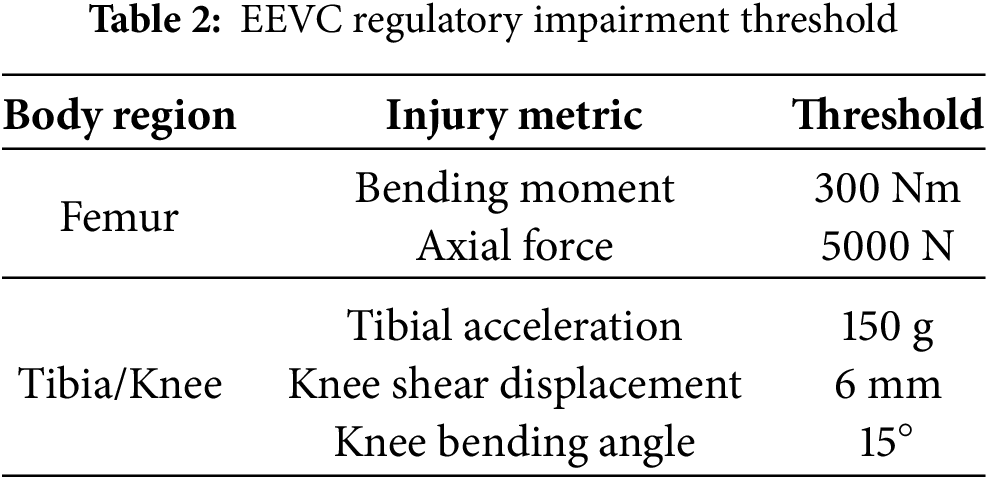
For the assessment of lower-extremity injuries in pedestrian impacts, the European Enhanced Vehicle-safety Committee (EEVC) specifies dedicated evaluation procedures and associated injury thresholds. The relevant regulatory limits are summarised in Table 2.
Following the structural adjustments as per regulatory requirements, the leg model for the collision simulation must be selected. This study employs the TRL leg model [22]. The TRL leg model (Tibia, Rectangular, and Leg model) is a highly detailed finite element model designed specifically for simulating the dynamics of a pedestrian’s leg during a collision. The structure of the TRL leg model is shown in Fig. 2. This model provides a comprehensive depiction of leg anatomy, including bones, muscles, and soft tissues, enabling accurate injury prediction during collisions. The leg structure is broadly divided into several key components: tibia, femur, knee joint, muscle, and skin. By incorporating detailed bone and soft tissue modeling, the TRL leg model delivers high-precision collision simulation data. Injury metrics are recorded using accelerometers and a deformable knee joint.
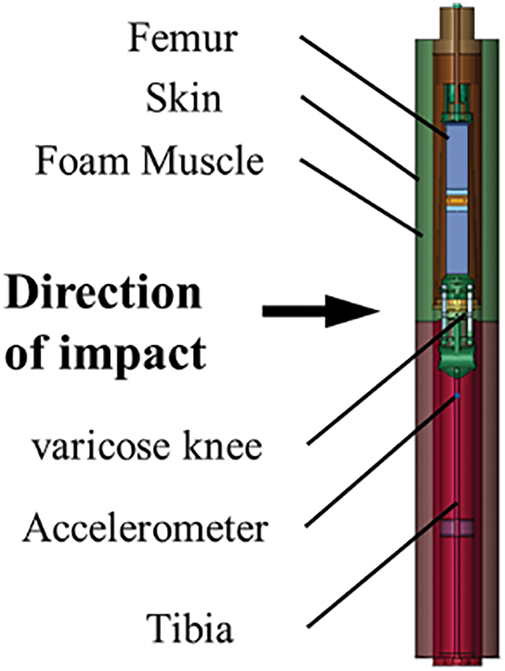
Figure 2: TRL architecture
Under the previously defined test conditions, a representative impact location was selected, and a finite-element simulation was carried out to analyse the collision between a pedestrian’s lower leg and the vehicle’s front bumper. The resulting time-history response of the lower-leg impact model is depicted in Fig. 3.
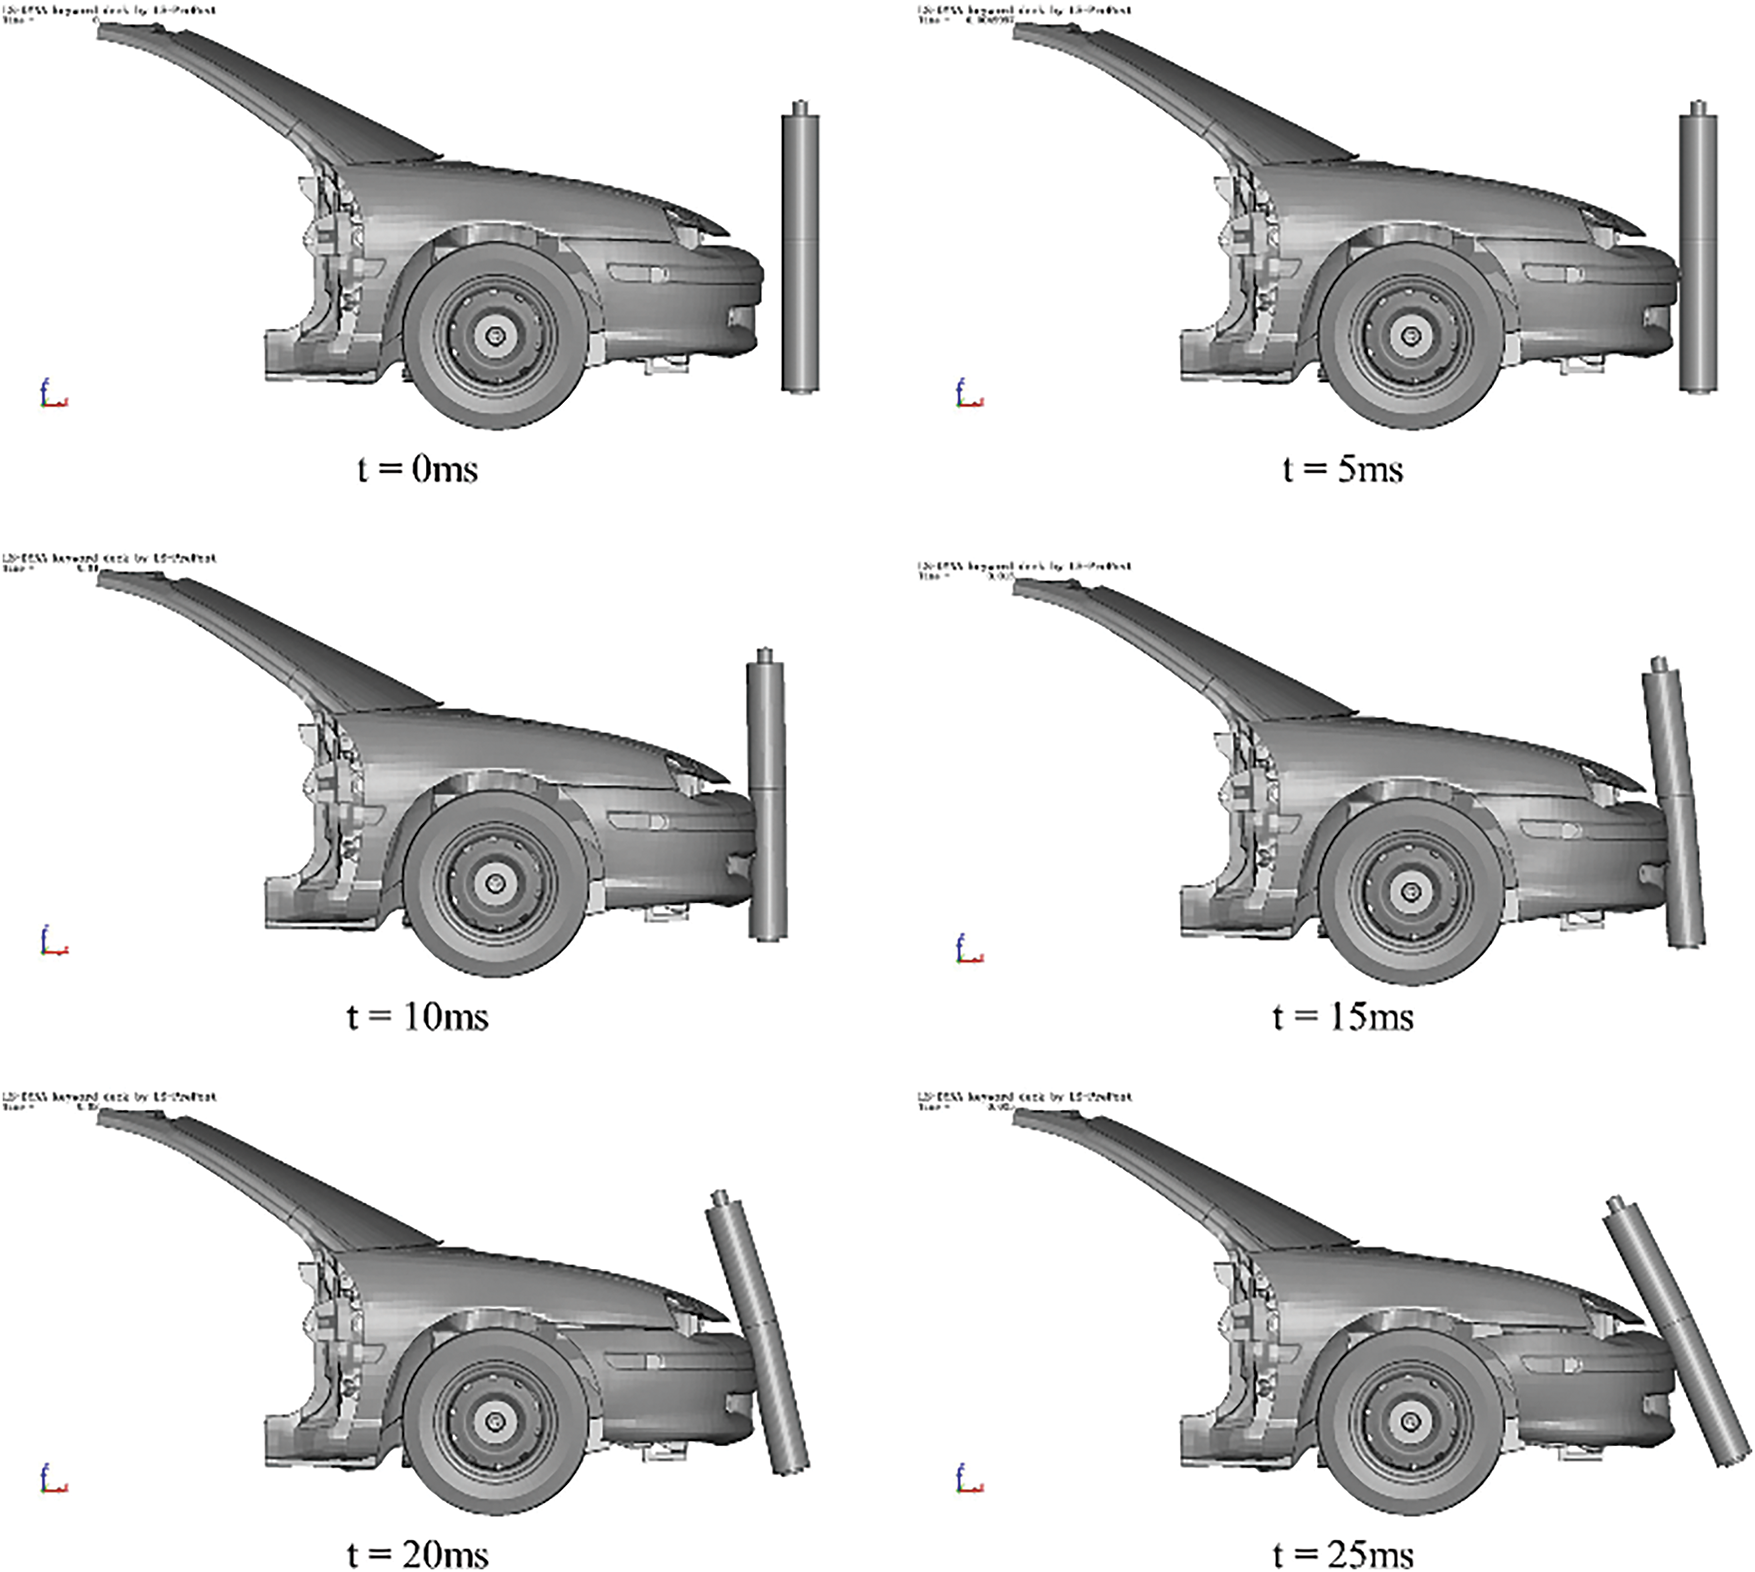
Figure 3: Finite element simulation time course
3 Identification of Design Features
To develop a machine learning model, it is essential to extract design parameters from the FE model. These key design parameters are categorized into six types, as shown in Fig. 4.
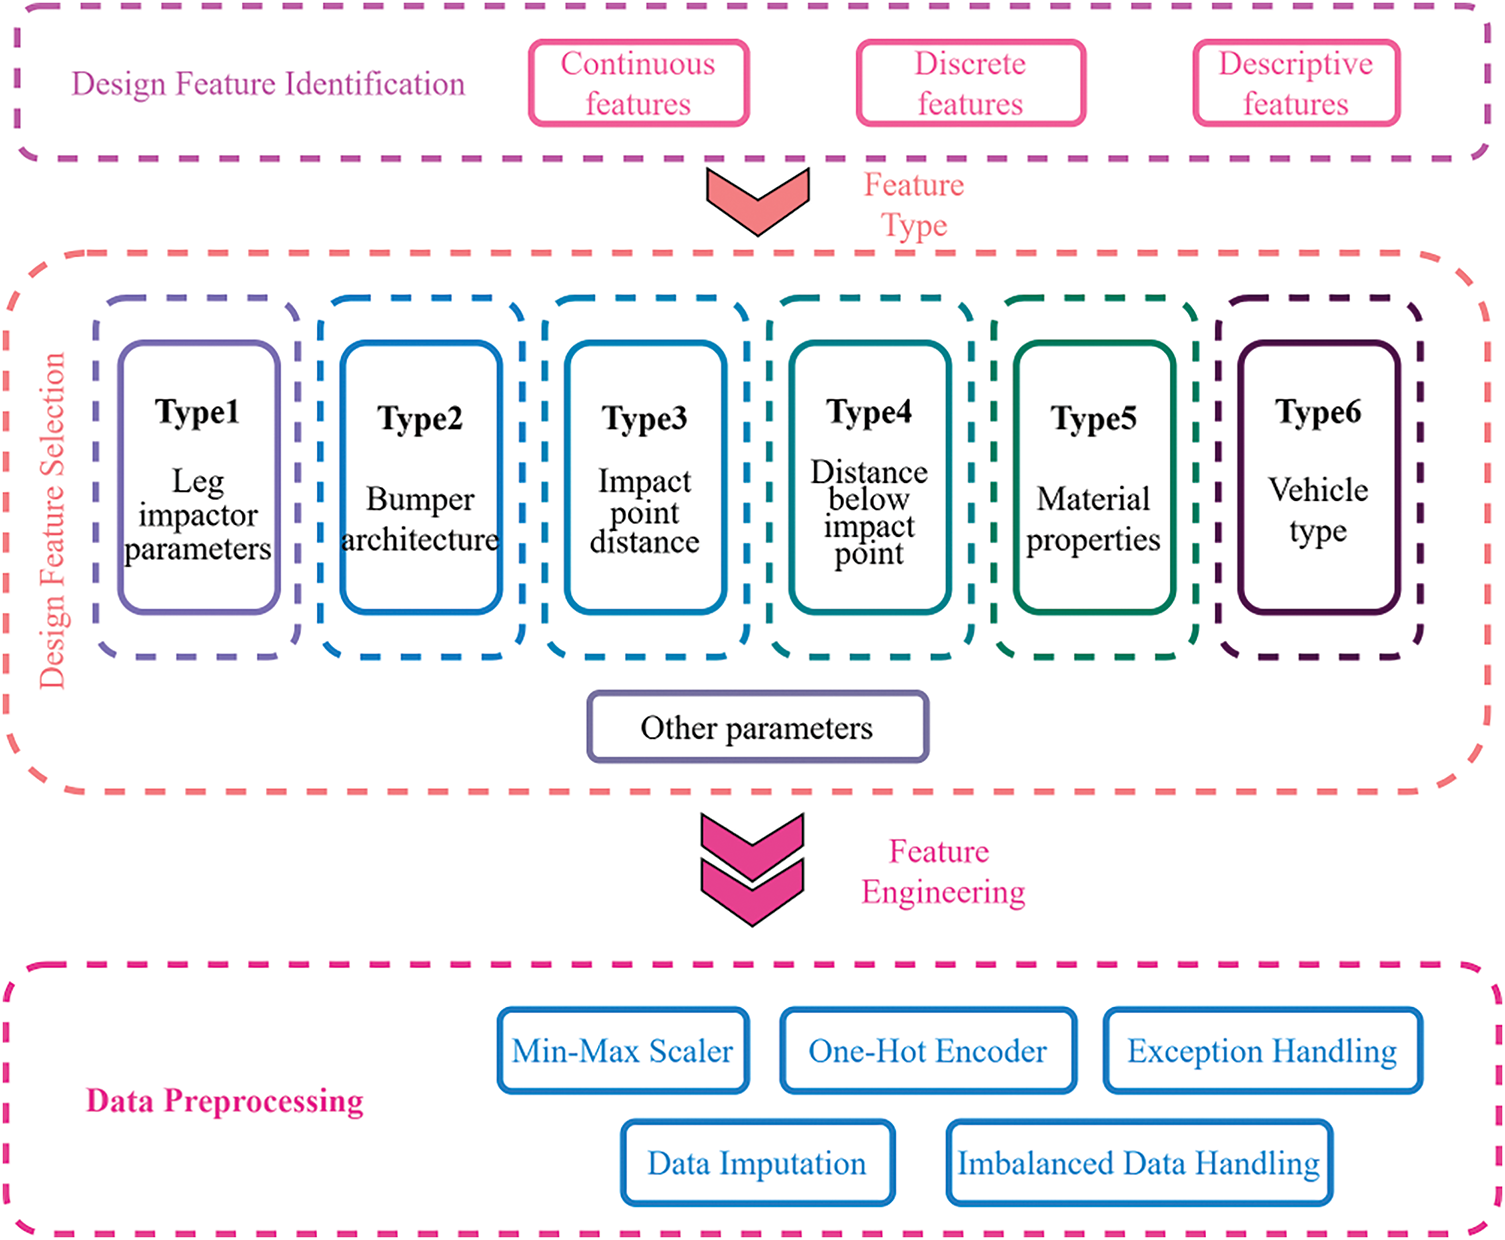
Figure 4: Types of design variable
3.1.1 Type of Leg Impactor Model
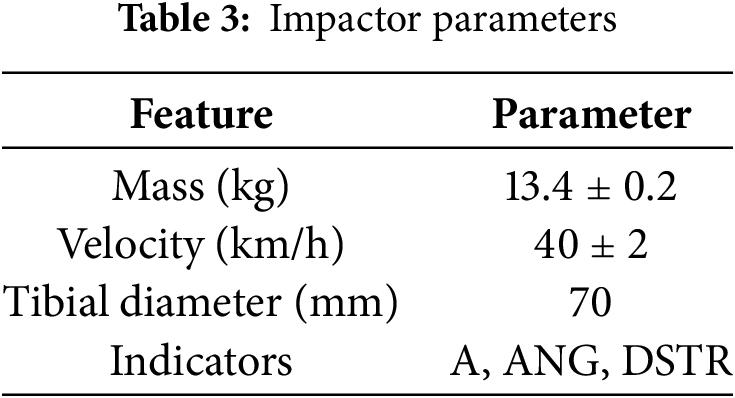
For the finite element analysis, this research uses the TRL (Transport Research Laboratory) leg model. The injury metrics primarily focus on three key indicators related to the knee area: the upper tibial acceleration, knee flexion angle, and knee shear displacement. Knee shear displacement, which refers to the relative displacement between the calf and thigh in the horizontal lateral direction of the knee, is used to assess the risk of cruciate ligament injuries. Knee flexion angle, representing the angular displacement of the knee, is measured to evaluate the potential for lateral collateral ligament injuries. Calf acceleration is recorded to gauge the risk of tibial fractures. Detailed parameters for the TRL leg model are provided in Table 3.
Front crash beams are one of the components that have a significant impact on crash damage performance and were therefore placed in this category and four types of characteristics were identified, as shown in Table 4.
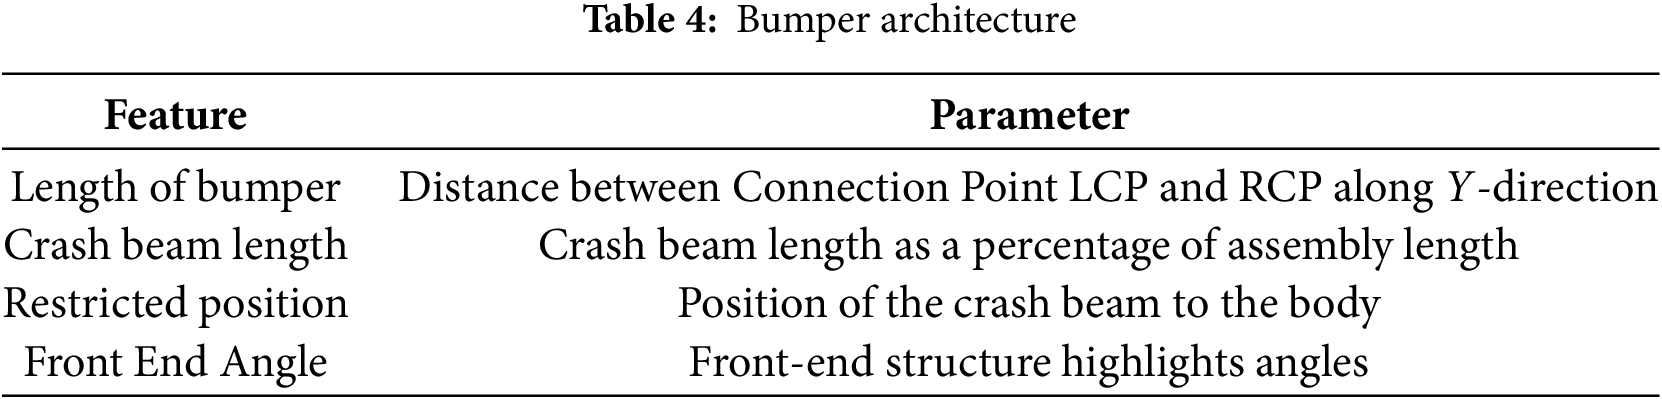
1. Feature 1 Length of bumper
In this case lateral distance between Connection Point LCP and RCP are measured (Refer to Fig. 5).
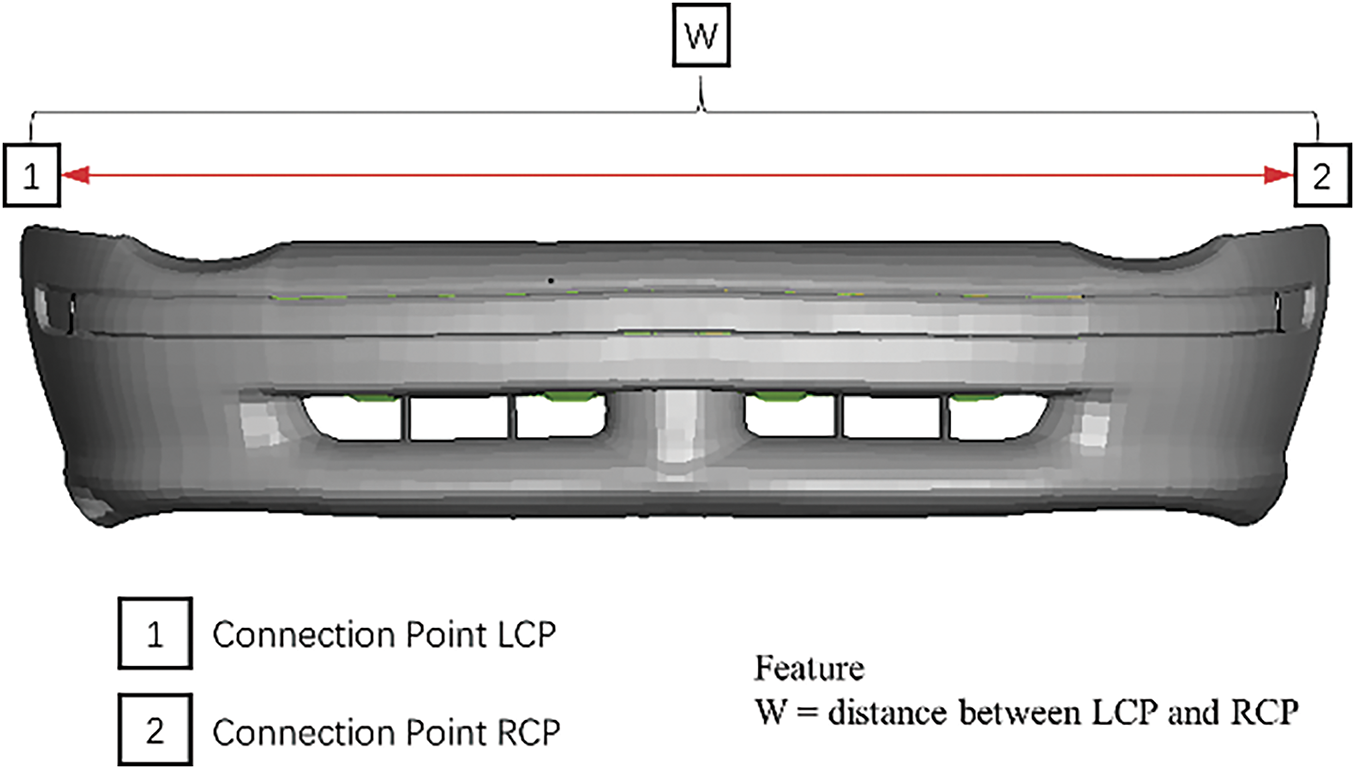
Figure 5: Length of bumper
2. Feature 2 Crash beam length
In Fig. 6, the longitudinal length of the crash beam is likewise chosen as one of the features. This feature is denoted as f1 and is shown in Eq. (1).
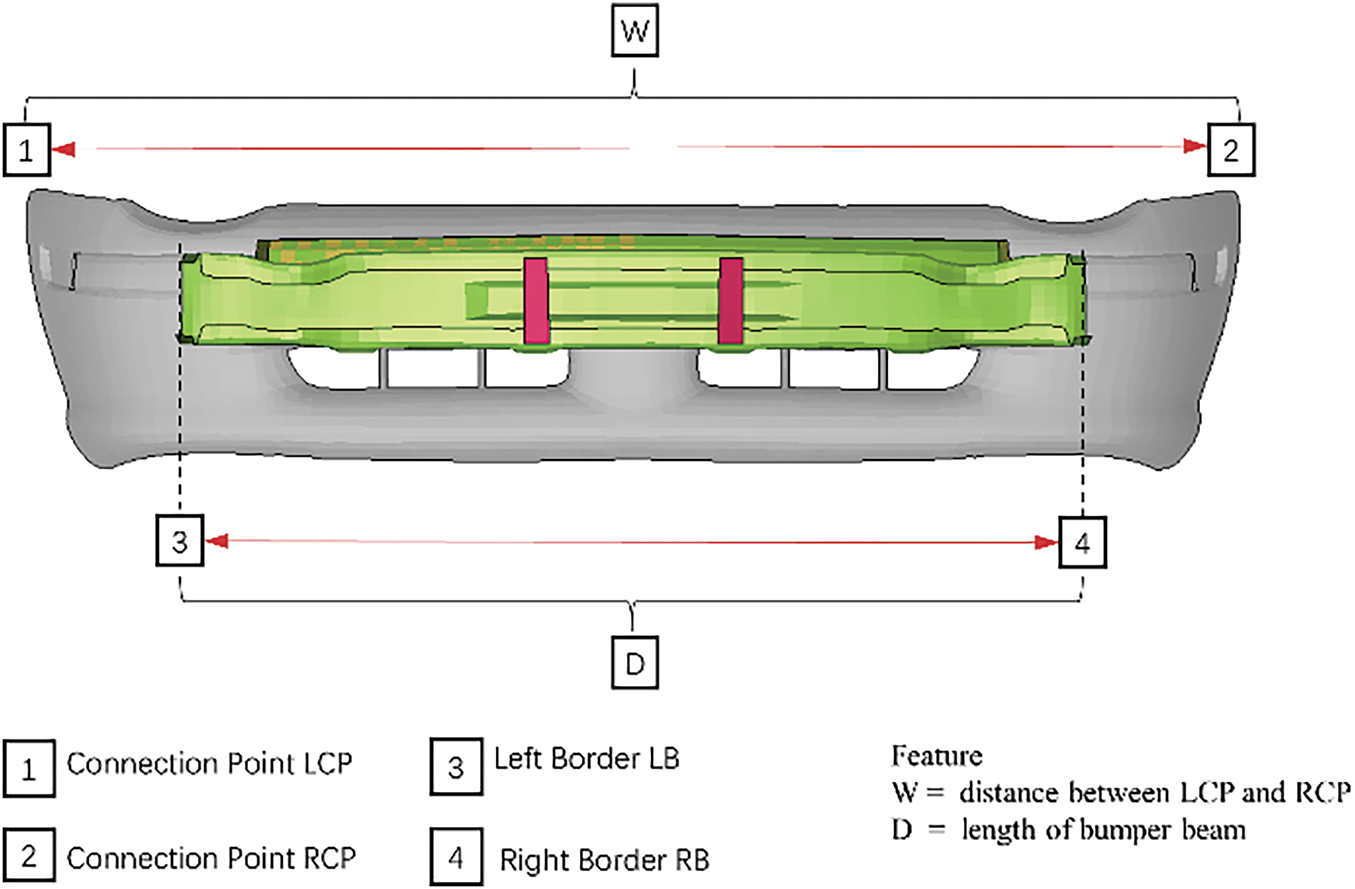
Figure 6: Crash beam length
3. Feature 3 Restricted position
The location of the connection between the crash beam and the body is one of the most important means of absorbing energy in a collision, so the location of the connection is also chosen as a characterization variable, using f2, f3, calculated as in Eqs. (2) and (3), and the specific values are shown in Fig. 7.
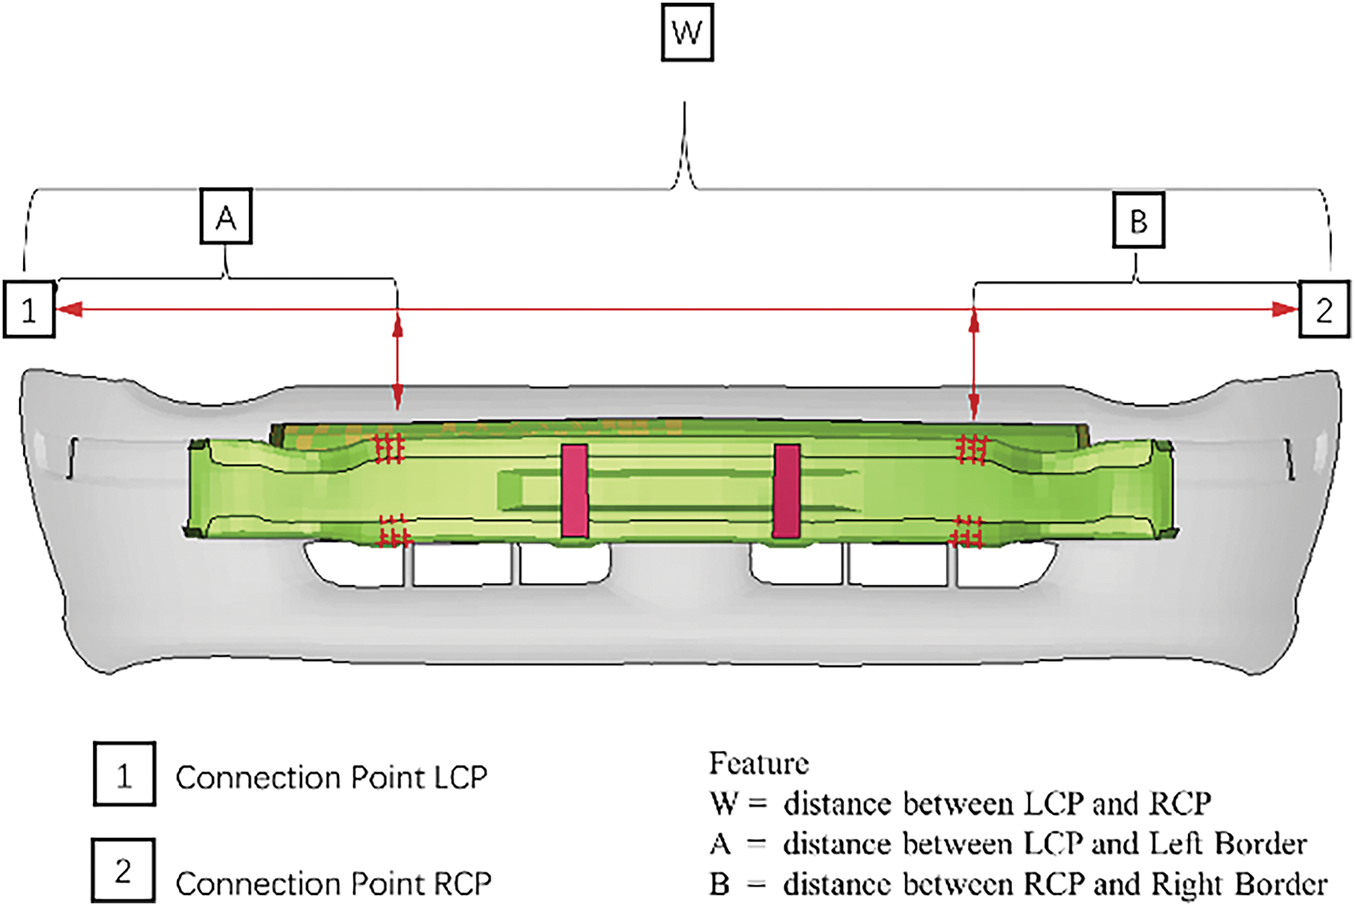
Figure 7: Restricted position
4. Feature 4 Front end angle
The longitudinal angle of the front-end structure of a vehicle can largely affect the level of injury after a pedestrian collision. The longitudinal angle was chosen as one of the characteristic variables and was measured as shown in the Fig. 8.
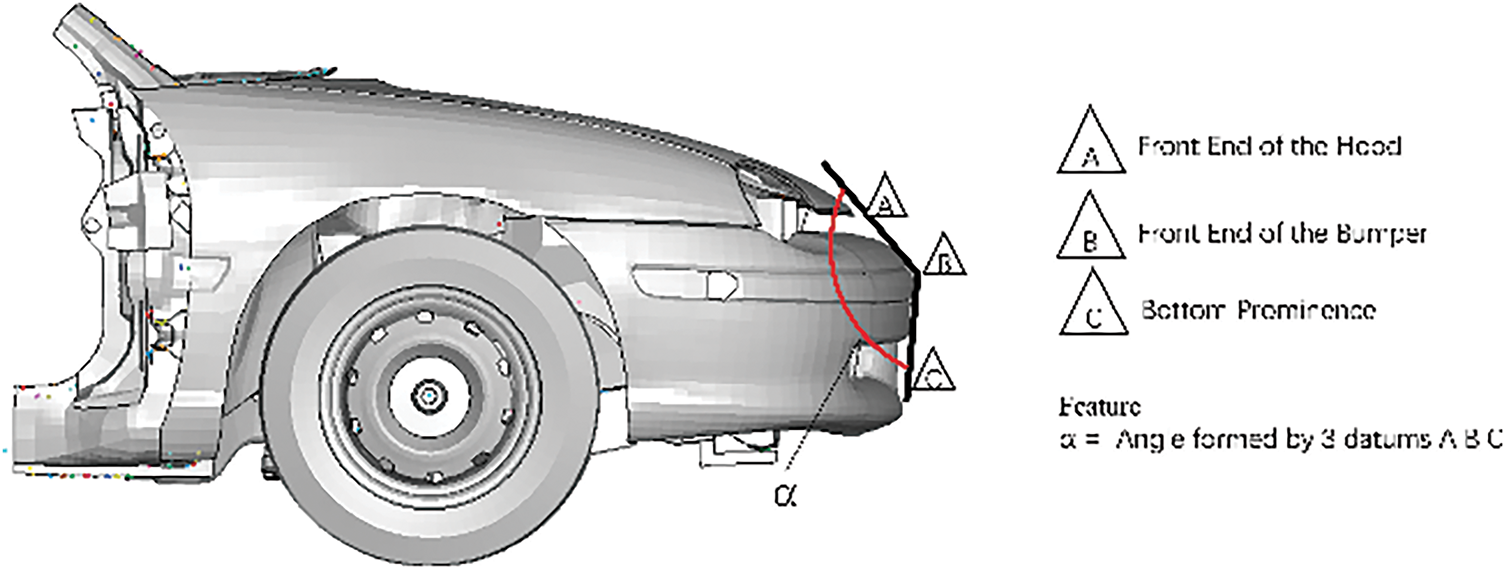
Figure 8: Front end angle
Table 5 presents the measured and normalized impact point distances. For feature 3, the shortest distance from the impact point to the connection point is considered. The normalized distances, relative to the connection point, are used as features, as illustrated in Fig. 9.
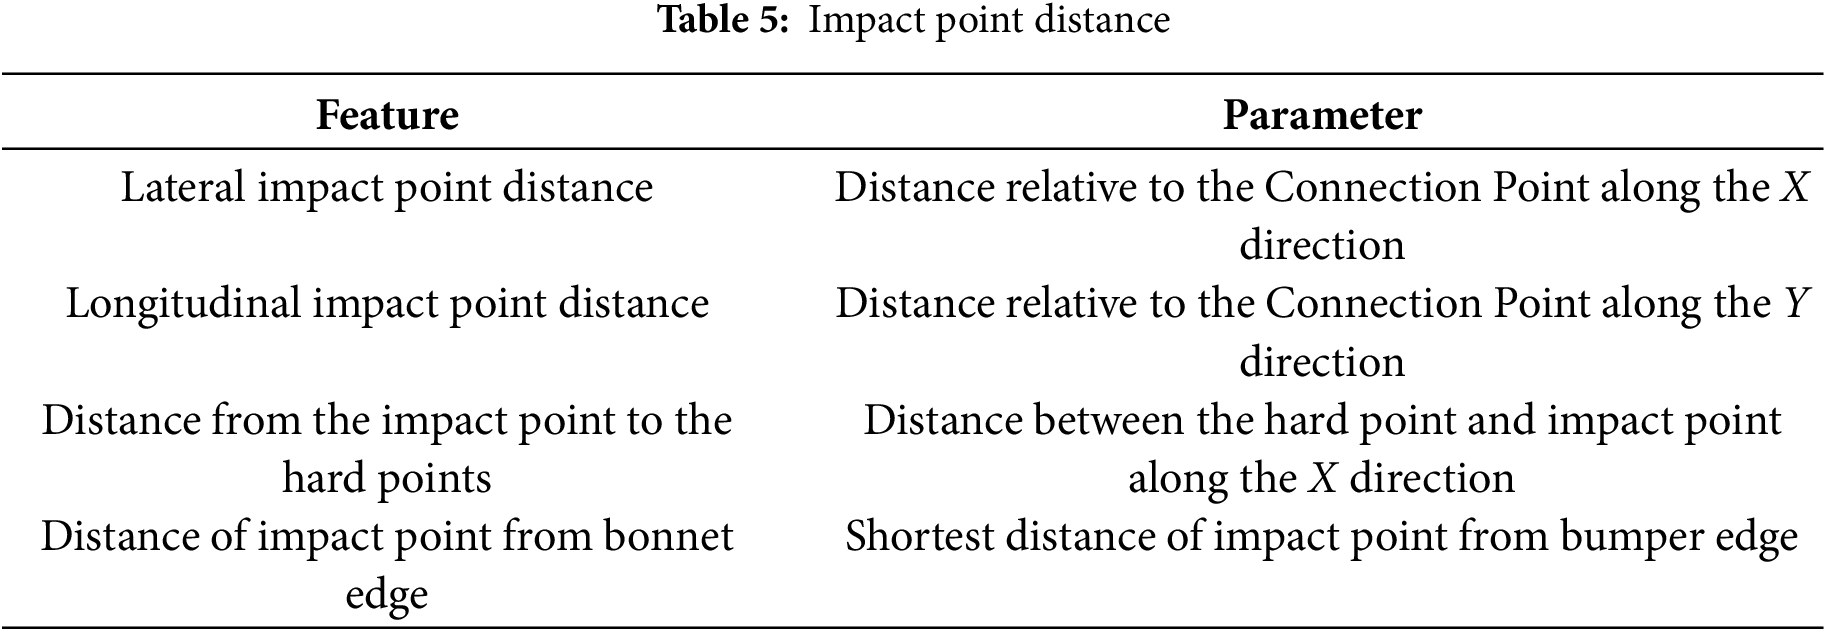
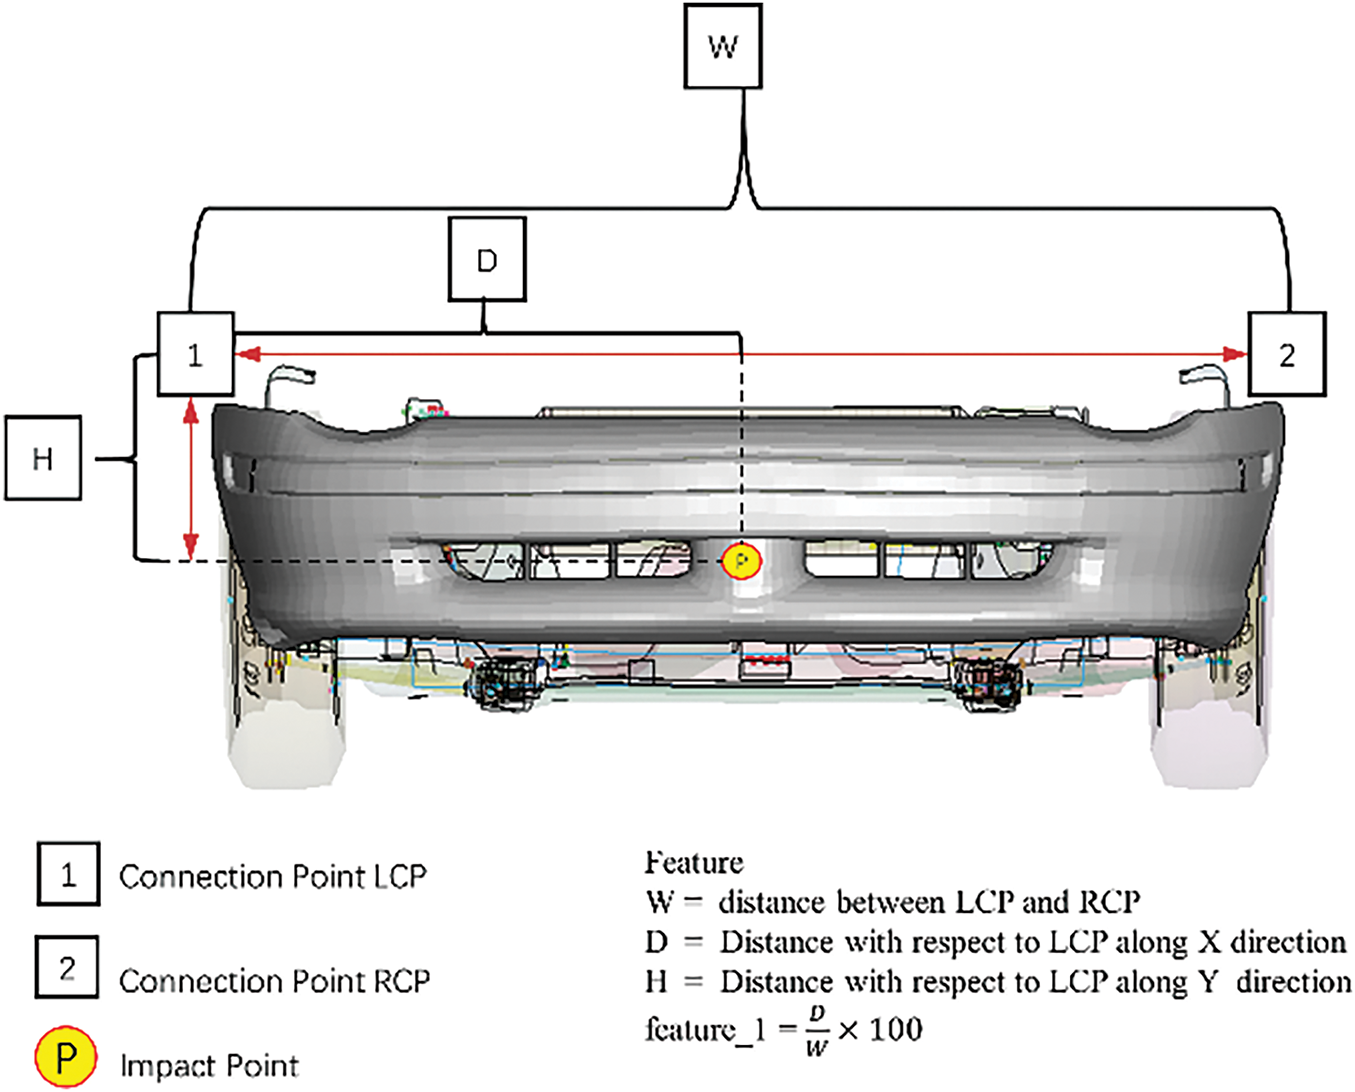
Figure 9: Front-end structural parameters
The selected features include the presence of a hard point below the collision point, which influences the degree of leg injury, as well as the distance from the hard point to the collision plane. Another important feature is clearance, specifically the clearance below the impact point. Two types of clearance features are identified:
1. Clearance between bumper exterior and impact beams
2. Clearance between impact beams and aggregates below bumper assembly
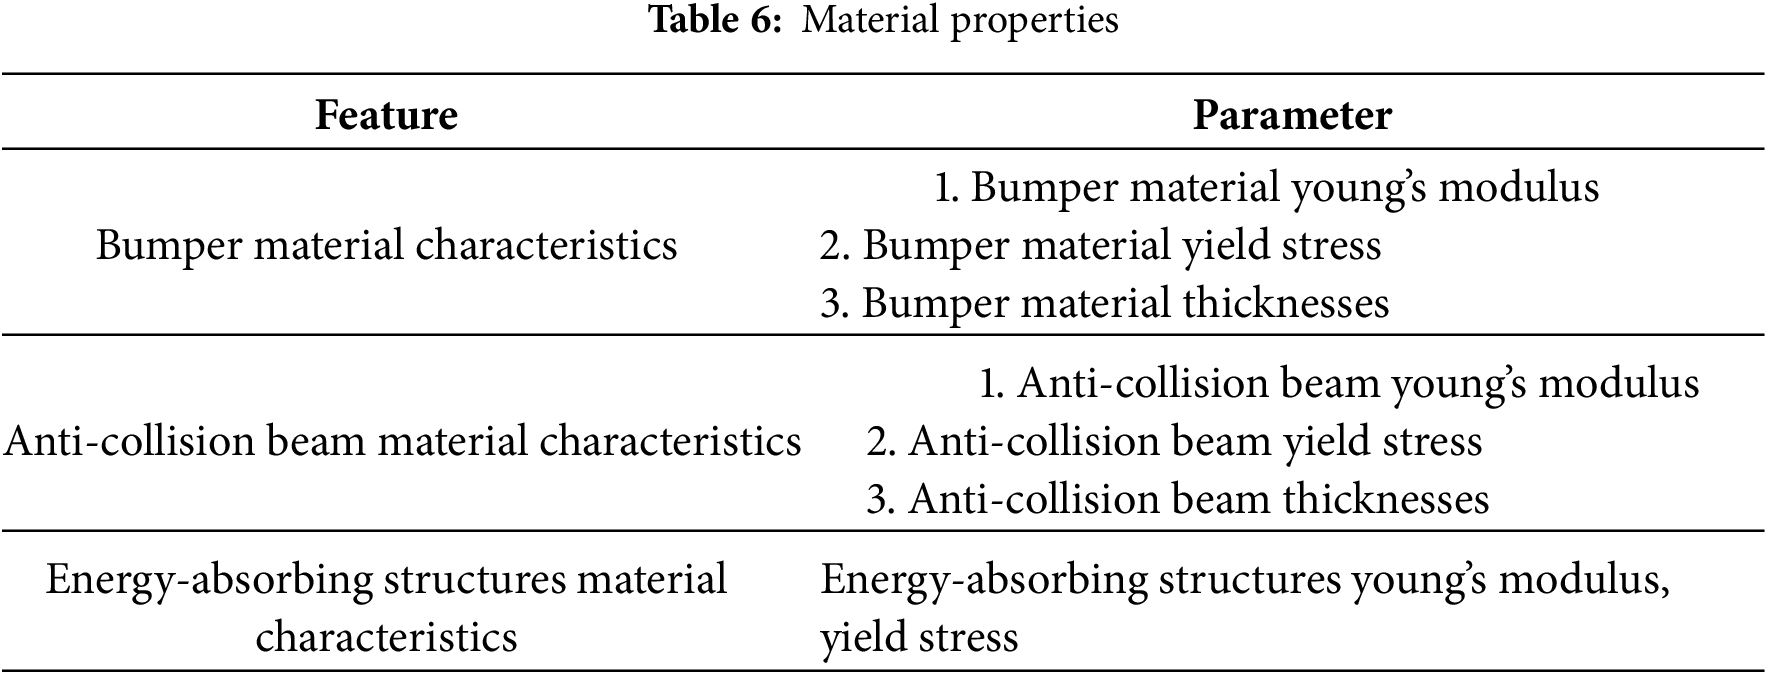
The selected material properties are given in Table 6 and include the modulus of elasticity, yield limit and thickness properties of the skin material and crash barrier material, as well as the material properties of the energy-absorbing structure at the front of the crash barrier.
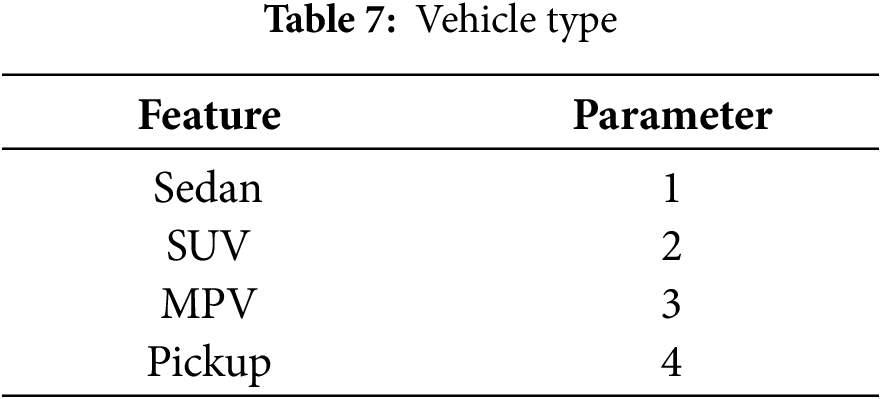
Different car models also have some influence on the crash results, so the statistical model type feature C_T is designed with the values shown in Table 7.
In order to characterize the front-end structure of a vehicle more accurately and comprehensively, more parameters need to be selected as features [23–25]. Some structures such as the radiator, its support, and mounting parts, also have a partial influence on the degree of leg impact damage, and the characteristics RAD_LOC, RAD_MAT are used to describe the radiator position, material, and other properties. The bonnet and fender, although they do not come into direct contact with the leg impactor, are directly connected to the front bumper, so BON_T, BON_MAT, and FEN_MAT is taken as features.
3.2 Data Generation and Pre-Processing
For vulnerable road users, the configuration of a vehicle’s frontal structure is pivotal in reducing both the likelihood and severity of pedestrian injuries. Within leg-injury assessment protocols, tibial acceleration, knee-joint bending angle, and knee shear displacement provide direct and quantitative indications of trauma severity. Accordingly, the present work adopts these three metrics as the output responses for evaluating the pedestrian-protection performance of alternative front-end structural designs.
On the input side, eight design-variable categories—comprising a total of 45 distinct parameters—are defined. Owing to space constraints, Table 8 reports only the 10 most influential variables together with their admissible ranges. Once the output responses
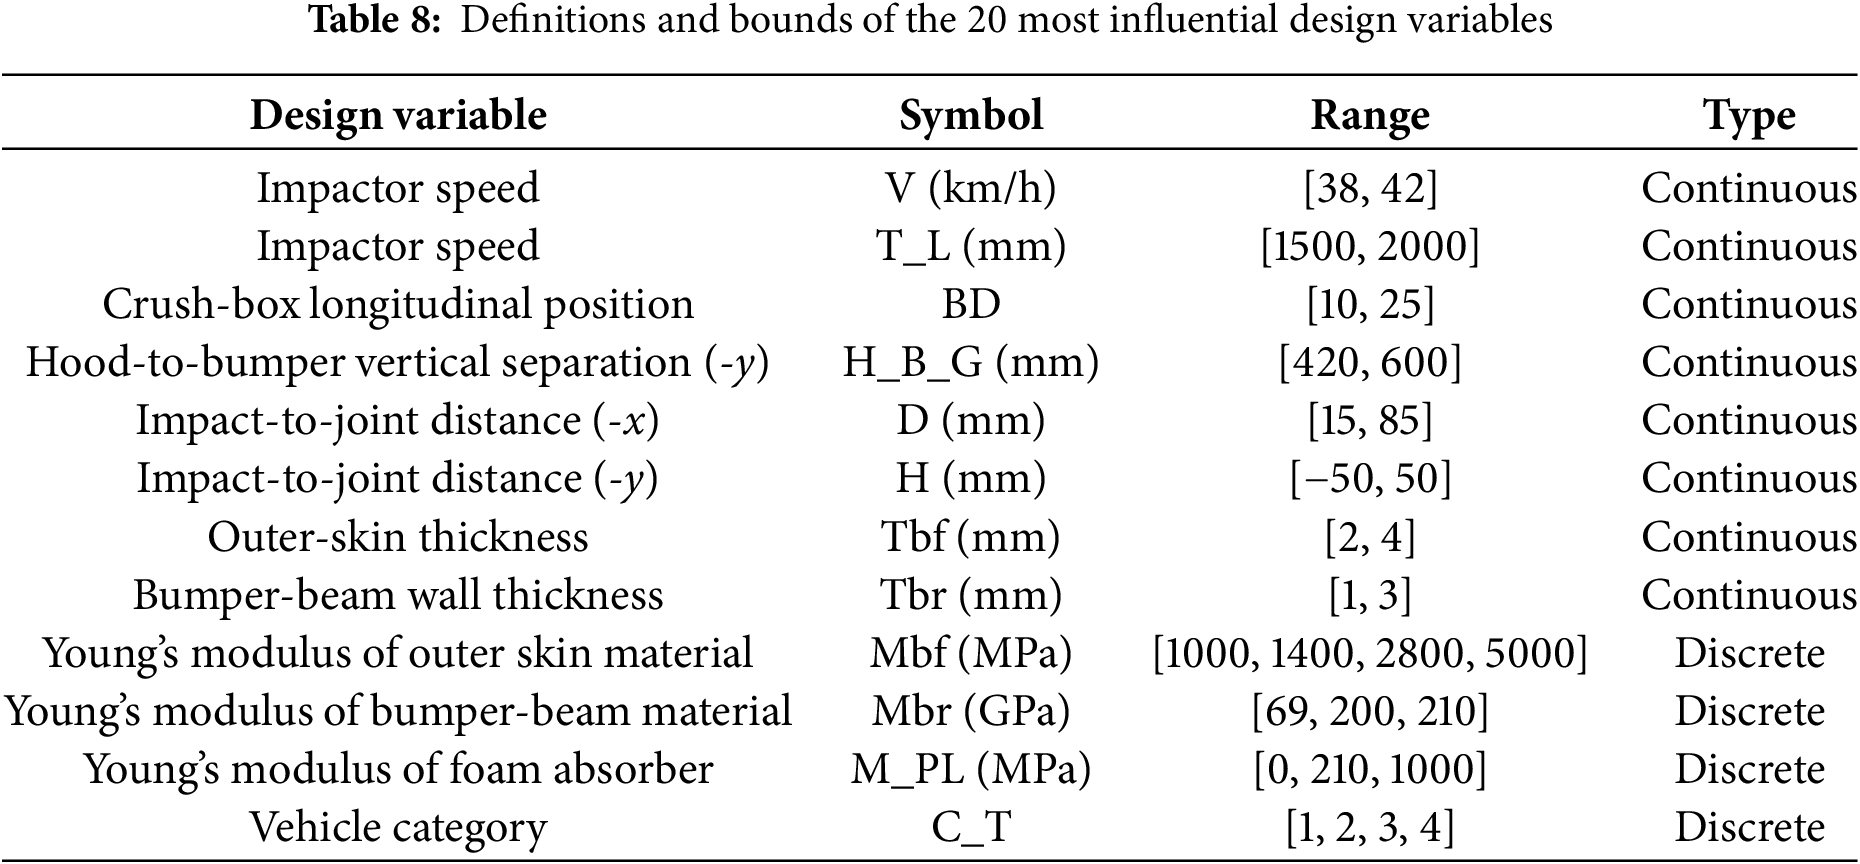
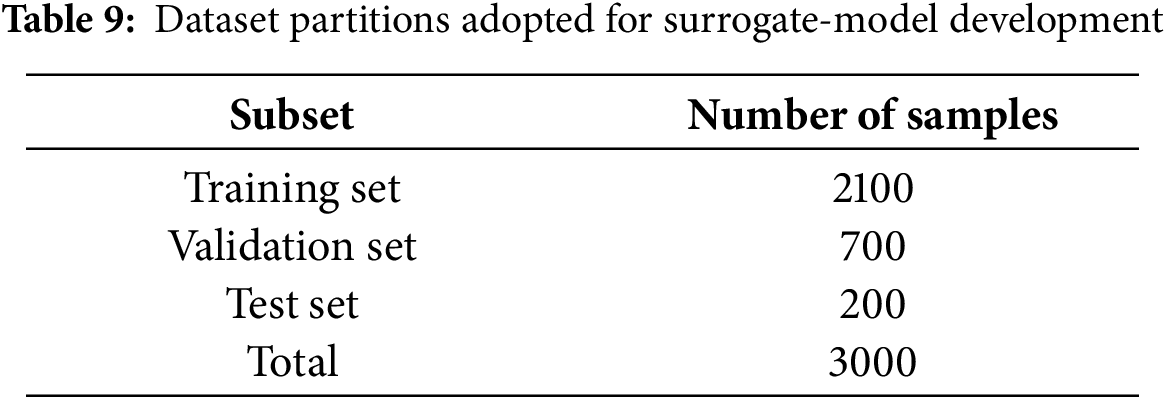
Because data-driven algorithms benefit from large sample sizes whereas each finite-element run is computationally intensive, a multidimensional, space-filling Latin hypercube sampling (LHS) strategy was adopted to explore the design space efficiently. The definitions and upper–lower bounds of the sampled variables are summarised in the same (Table 8). All simulations were executed automatically on an integrated numerical co-simulation platform, which returned the corresponding output responses for every sampled design point. The dataset information is shown in Table 9.
Data preprocessing is a critical step in constructing machine learning models [26], directly impacting the model’s performance, convergence speed, and final predictive accuracy. This process involves extracting useful features from raw data and transforming them into a format suitable for machine learning algorithms [27]. The feature variables selected from this study’s dataset encompass continuous, discrete, and textual types, with considerable differences in their magnitudes. Employing preprocessing techniques enables the model to better adapt to the features and accelerates convergence.
For evident outliers, such as excessive acceleration, knee shear displacement, or knee bending angles that exceed normal ranges, or situations where finite element calculations do not converge or yield negative volumes, these data points are either removed or necessitate a reconstruction of the finite element model and recalculation. Efforts are made to ensure that the dataset remains within a reasonable range. In cases with minimal missing values, the missing data are filled using the column mean.
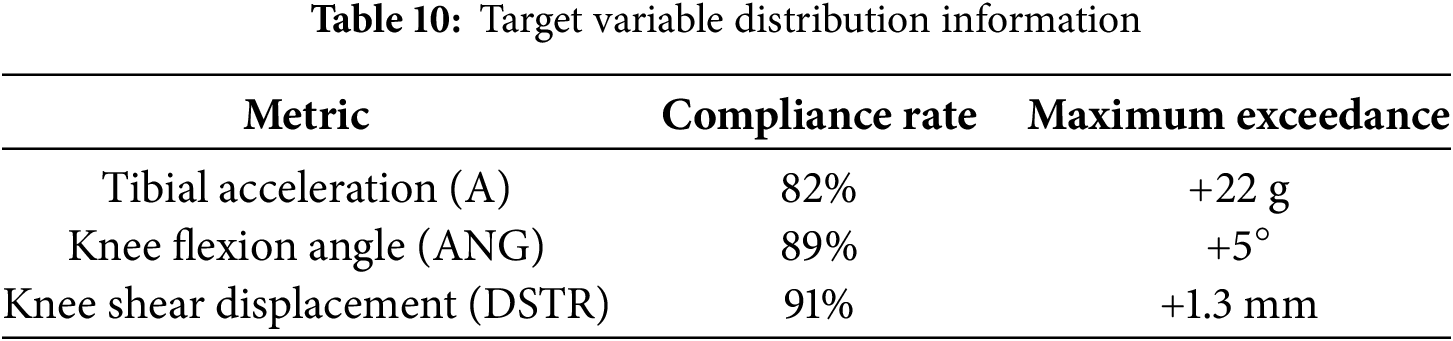
Continuous features, which constitute the most prevalent type of data collected—such as speed, collision location, and material properties—are processed through methods like normalization and standardization. In this study, due to the differing units used for various continuous features leading to substantial discrepancies in data magnitudes, normalization is employed. The continuous features in the dataset are normalized column-wise to yield values distributed within the range of [0, 1]. For discrete features, such as vehicle types and the connection relationships between the impact beam and the bumper, one-hot encoding is utilized. After performing feature selection, the matrix of correlation coefficients for some of the variables is shown in Fig. 10. To validate the reliability of our collected dataset, the predicted peak values were compared against the EEVC regulatory thresholds. The comparison results are presented in the Table 10 below.
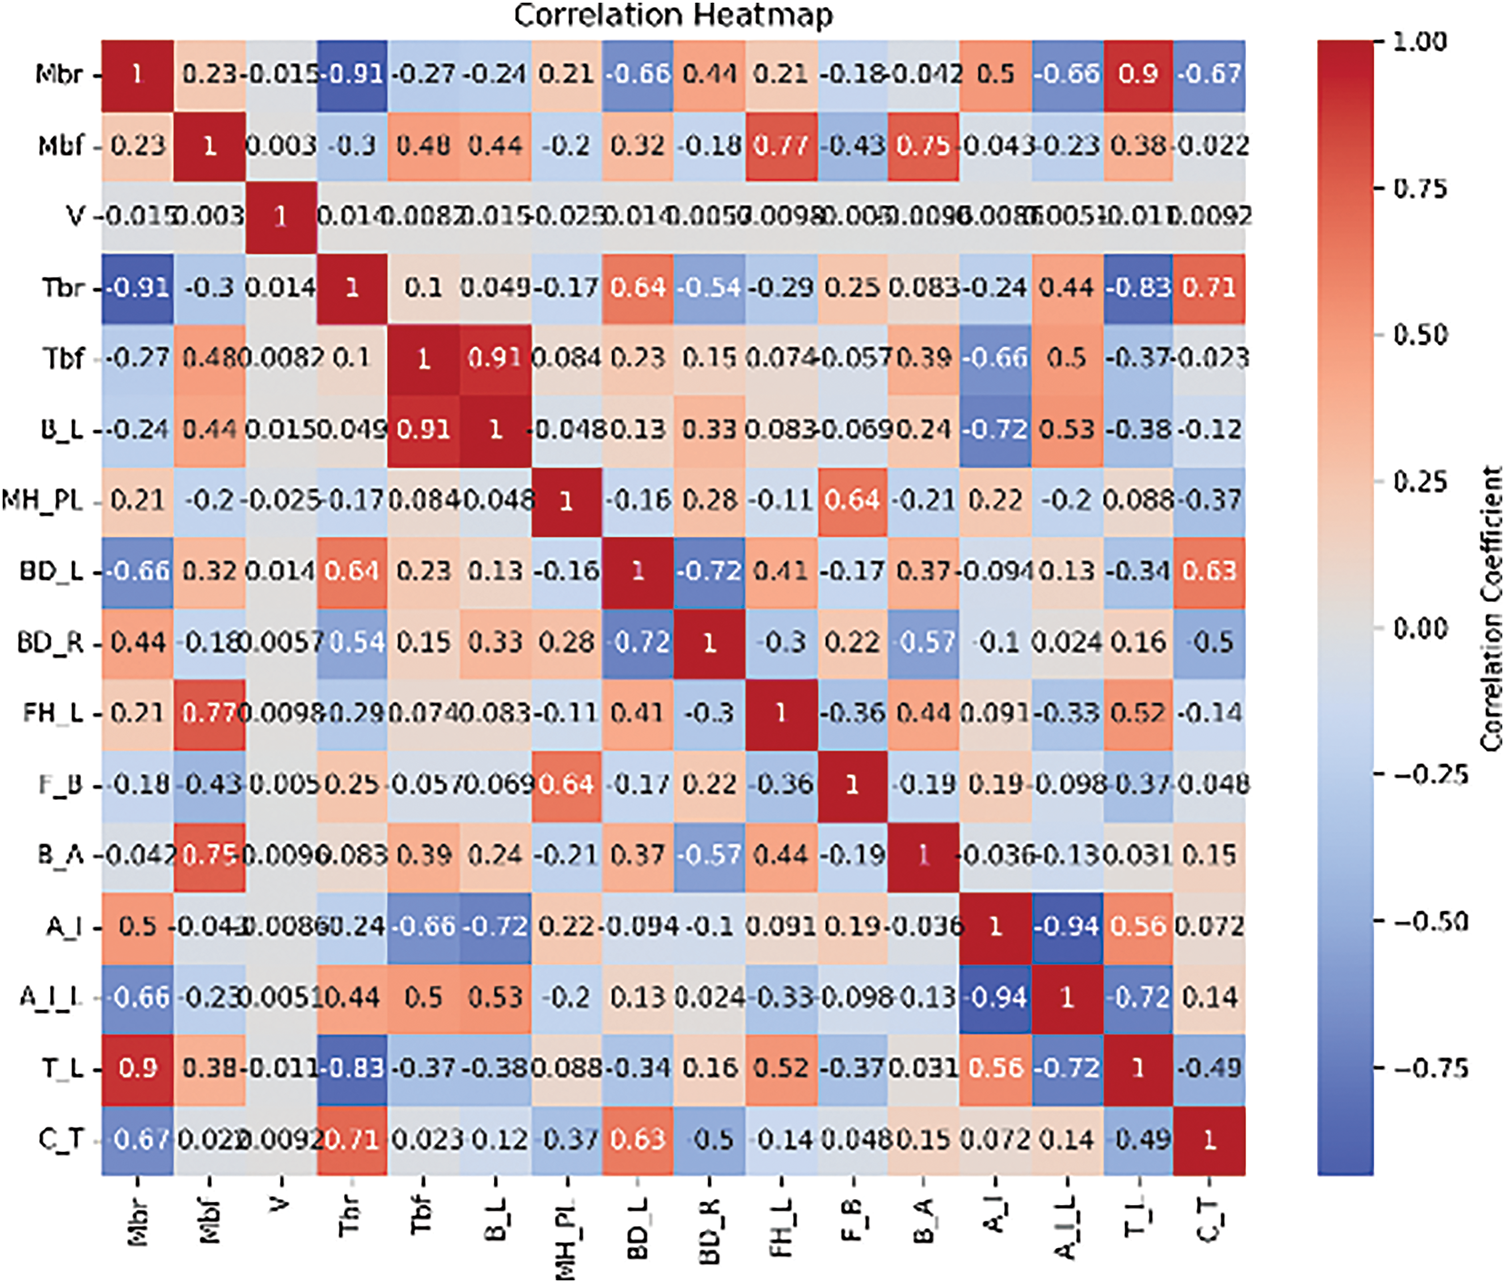
Figure 10: Characteristic correlation matrix
4 Pedestrian Safety Performance Prediction Methodology
4.1 Preliminary Model Selection Using Default HyperParameter Settings
Machine learning—an essential methodology within contemporary data analytics—aims to automate the construction of predictive and descriptive models [28]. As a sub-discipline of artificial intelligence, it is premised on the capacity of computational systems to glean knowledge autonomously from data, uncover latent patterns, and make informed decisions with minimal human supervision. Depending on the availability of labelled outcomes or feedback, machine-learning techniques are typically grouped into supervised, unsupervised, and reinforcement learning.
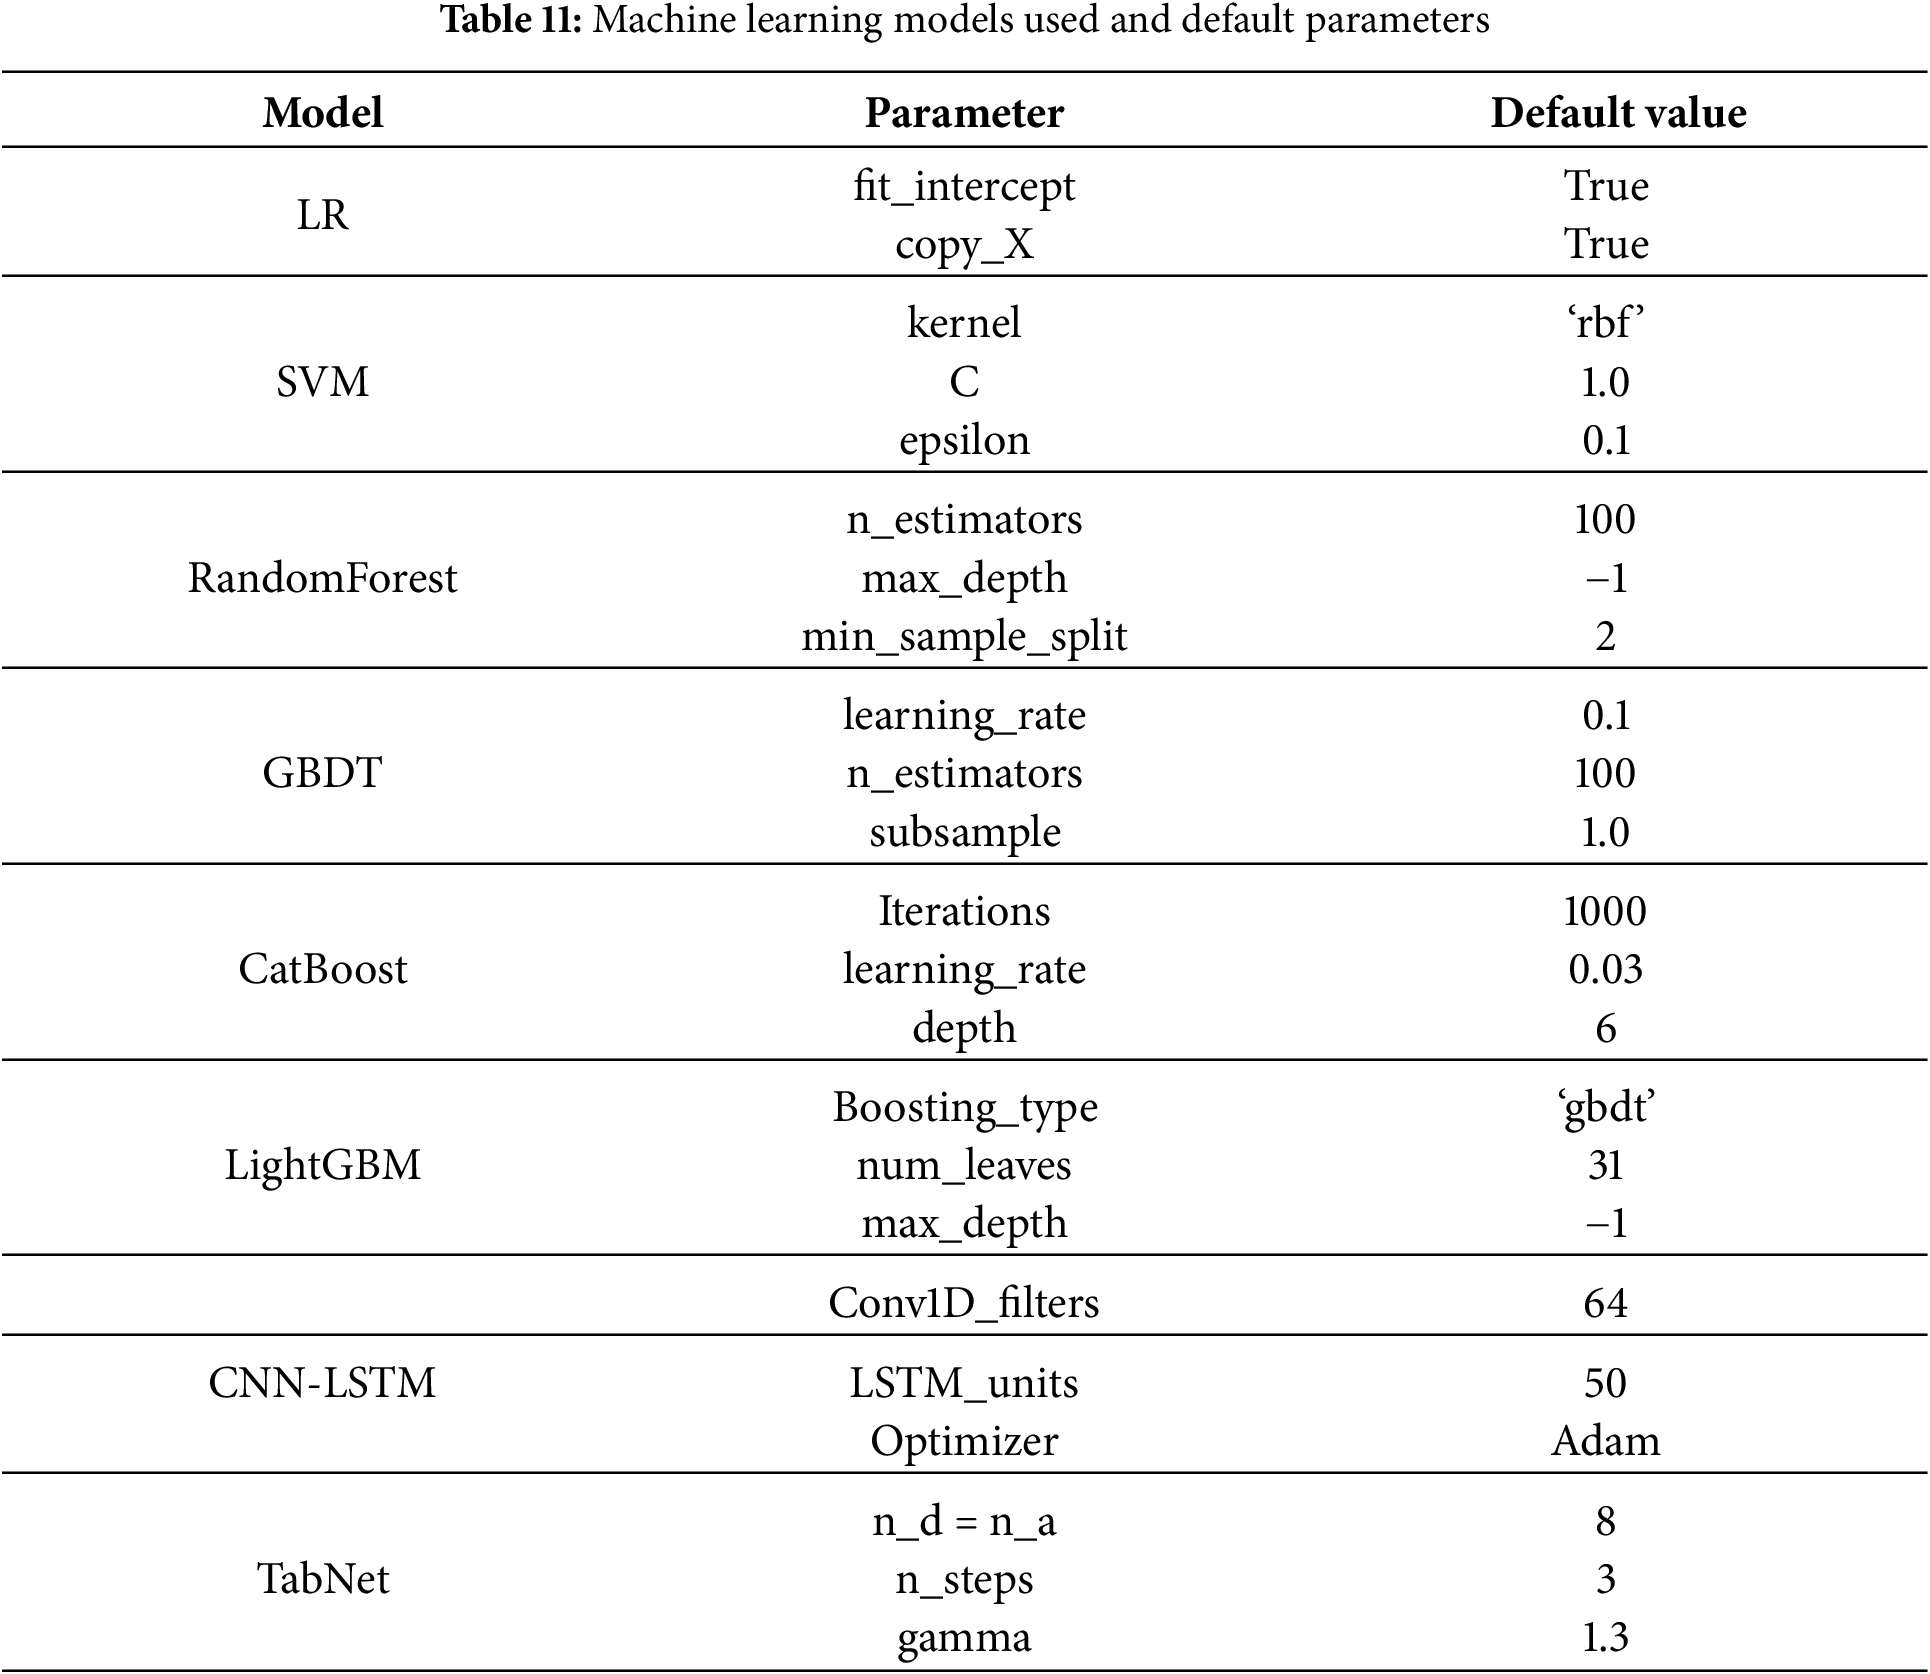
This study constructs surrogate regression models to predict three continuous indicators of pedestrian leg injury severity—tibial acceleration (A), knee flexion angle (ANG), and knee shear displacement (DSTR). Because exhaustive hyperparameter tuning for all candidate algorithms incurs prohibitive computational and time costs, each method is initially trained using the default settings listed in Table 11 to establish a baseline performance profile. Rigorous model selection at this stage is essential to ensure a high-fidelity surrogate. The preliminary evaluation encompasses a broad spectrum of regression approaches: linear models (i.e., Linear Regression), kernel methods (Support Vector Regression), tree-based ensembles (Random Forest, CatBoost, LightGBM, AdaBoost), and deep-learning architectures (CNN–LSTM and TabNet). Baseline models are ranked by their coefficient of determination (
The training corpus is drawn from a finite-element crash-simulation dataset containing roughly 3000 impact scenarios across ten vehicle types. Of these, 200 cases are reserved as an external test set, while the remainder are split into training and validation subsets in a 5:1 ratio. Each record provides 46 explanatory variables describing vehicle and impact conditions, together with the three response variables noted above. As all responses are continuous, the analysis considers only regression algorithms. Candidate models are ranked on the basis of the coefficient of determination,
The overall methodological workflow is depicted in Fig. 11. The average score and average error of the machine learning model on the three target variables (all of which have been normalized) were chosen as the final metrics for evaluating the model’s performance. The machine learning models chosen are common machine learning models for processing tabular data and deep learning combinatorial model. Below provided Fig. 12 provides insights into the performance of different machine learning algorithms (using default parameters). An
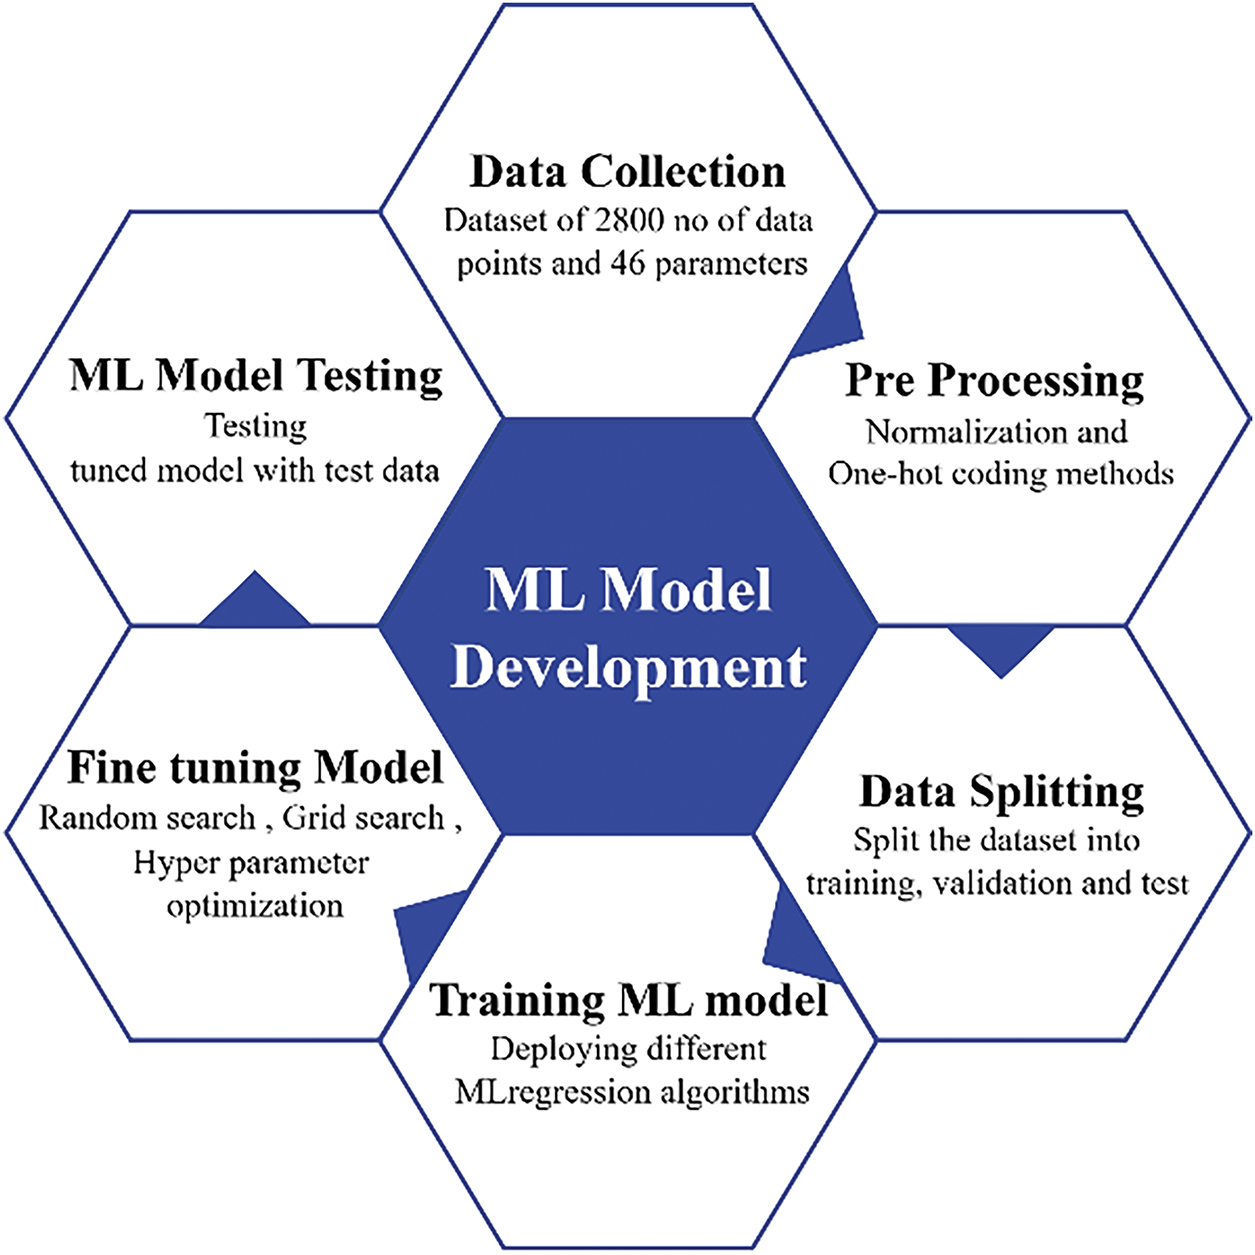
Figure 11: Machine Learning Model Development Process
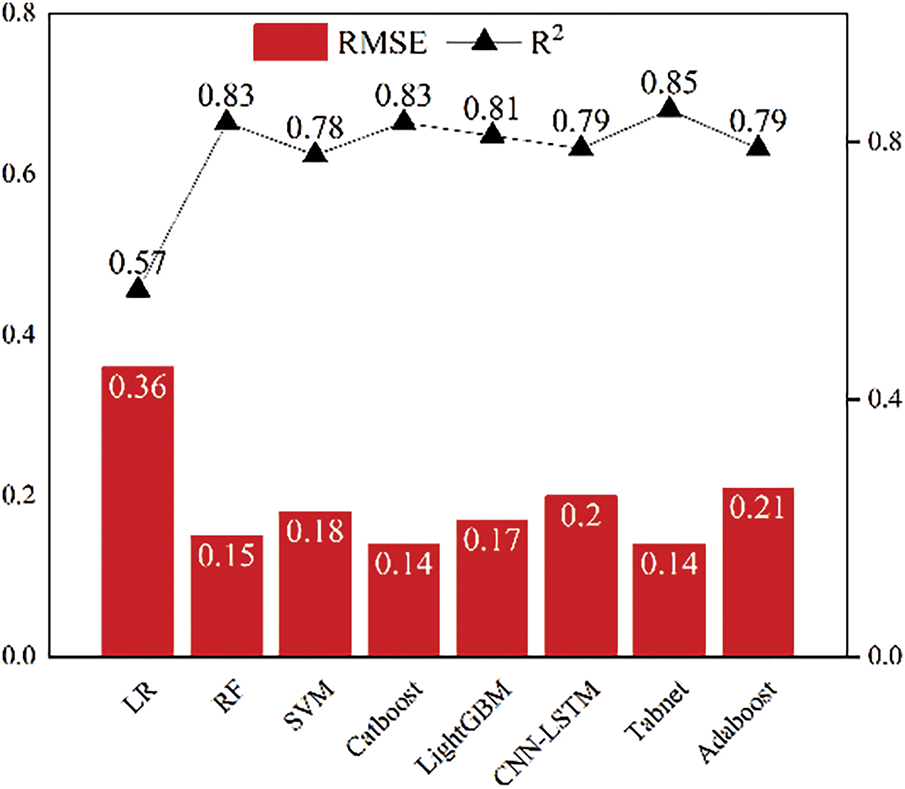
Figure 12: Model comparison (use default parameters)
Inspection of Fig. 12 shows that TabNet attains the highest coefficient of determination (
4.2 Machine Learning Model Deployment
Four high-performing models—TabNet, CatBoost, Random Forest, and LightGBM—were identified in our preliminary screening and advanced to automated hyper-parameter tuning. Given the substantial computational cost of this task, we employed Optuna’s Bayesian-optimization framework, configuring up to 50 parallel trials and a maximum of 200 total evaluations. For each injury metric (tibial acceleration, knee-flexion angle, shear displacement), all four algorithms were fit in turn under identical conditions, and the configuration yielding the highest cross-validated accuracy was selected as that metric’s surrogate. To guard against overfitting from a static train_test split, the Bayesian optimizer was integrated with a K-fold cross-validation scheme (train:test = 3:1). In this arrangement, the dataset is partitioned into
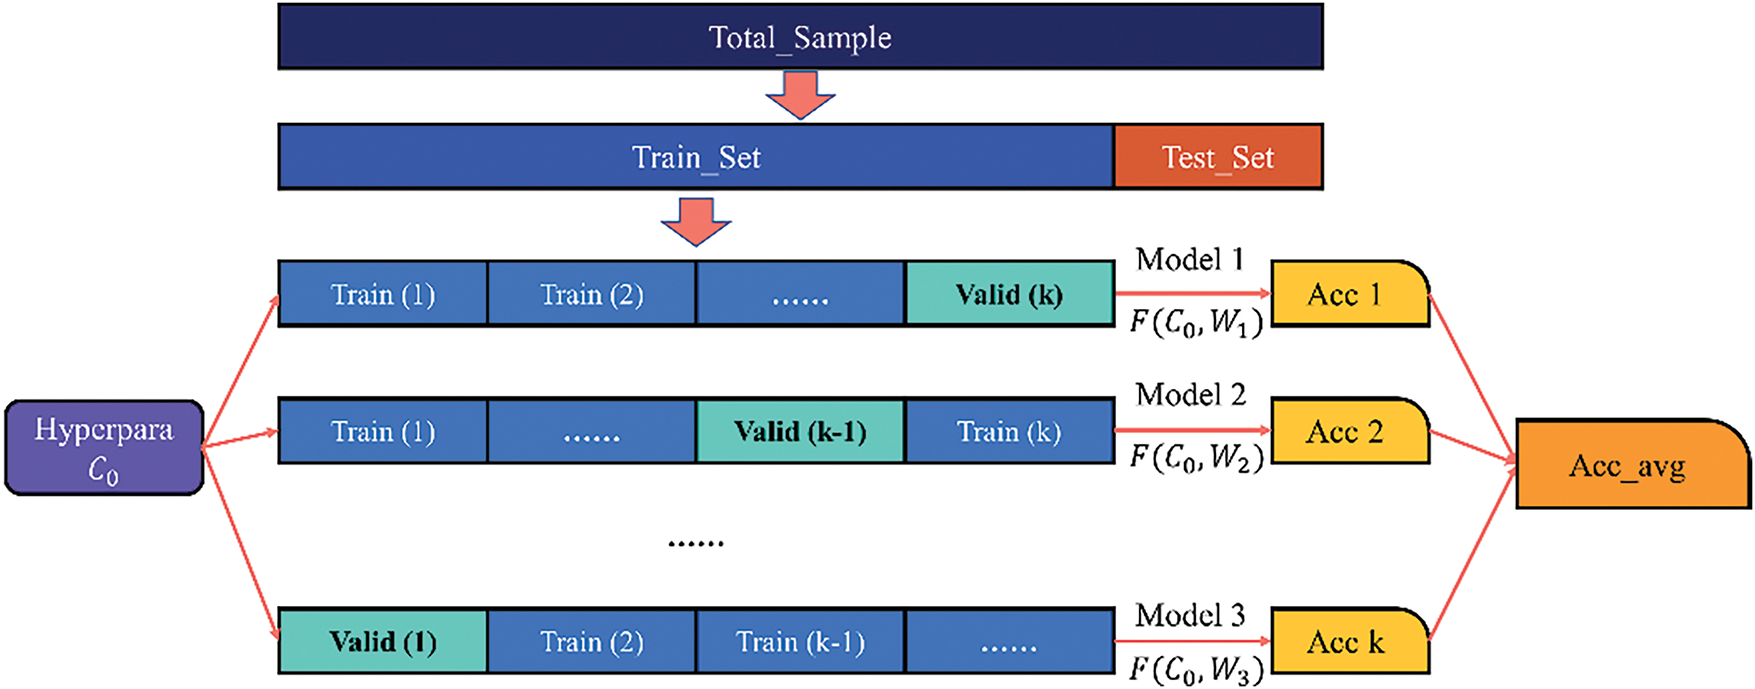
Figure 13: K-fold cross-validation
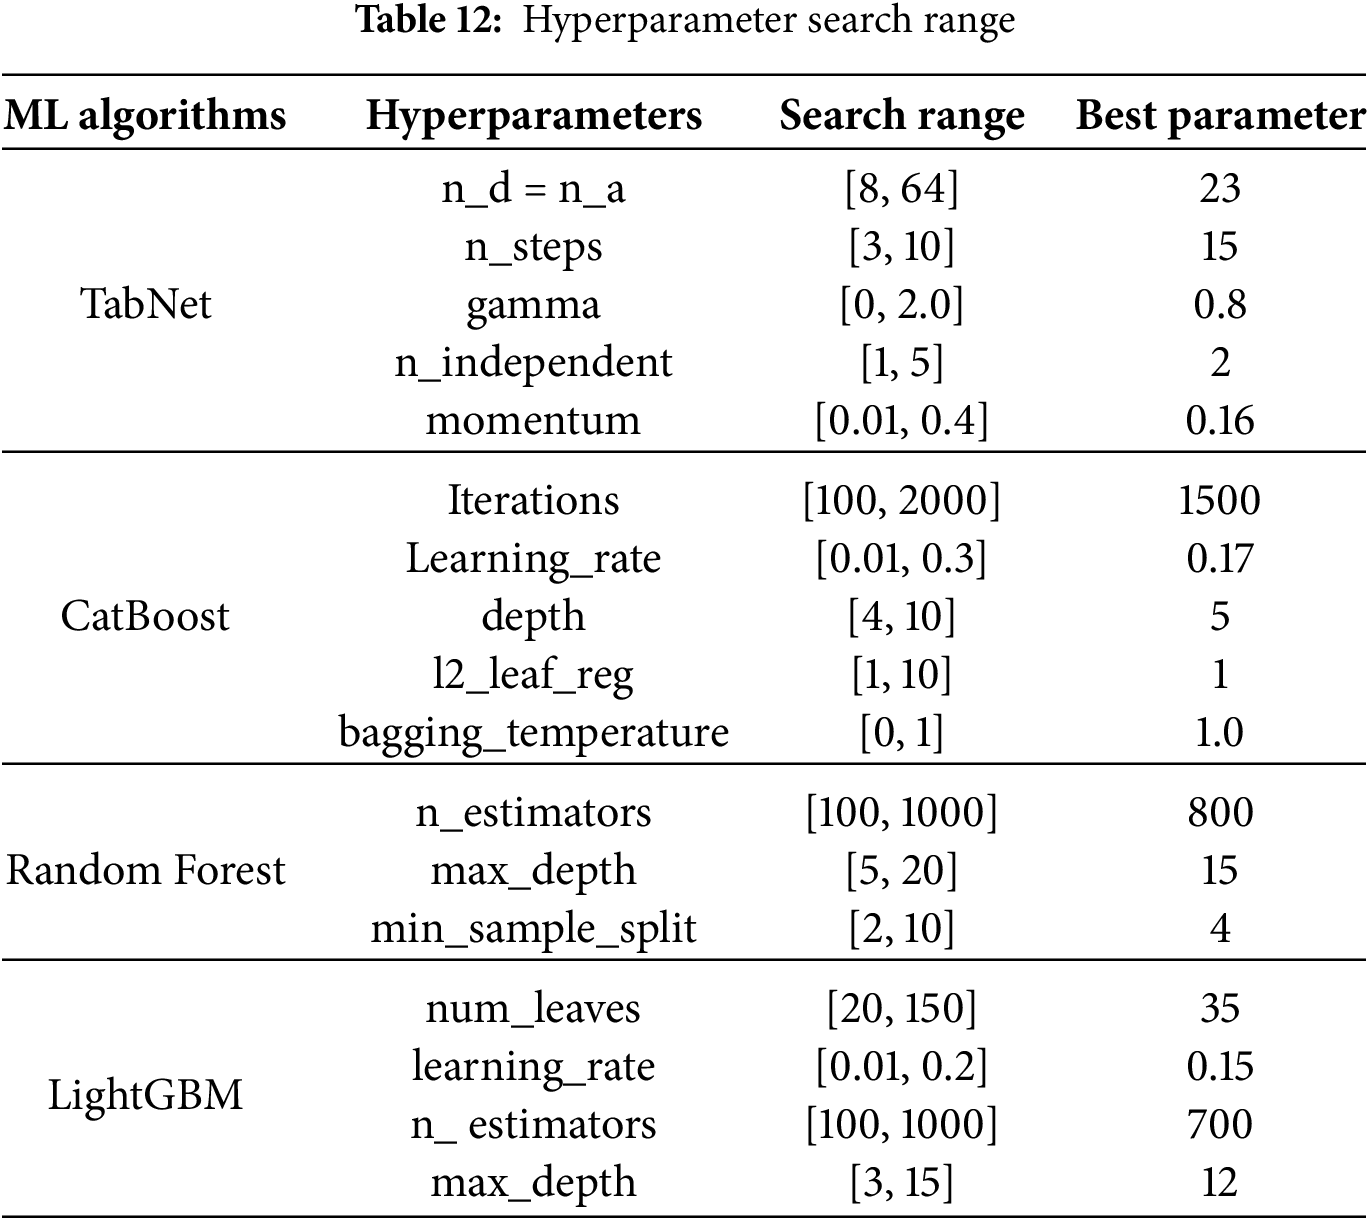
The optimal model parameter settings are shown in the table below. This section describes the hyperparameter optimization process for the TabNet model using Bayesian optimization, while the hyperparameter optimization of other models is not further discussed in this section. The key parameters of each model and the search range are shown in the Table 12.
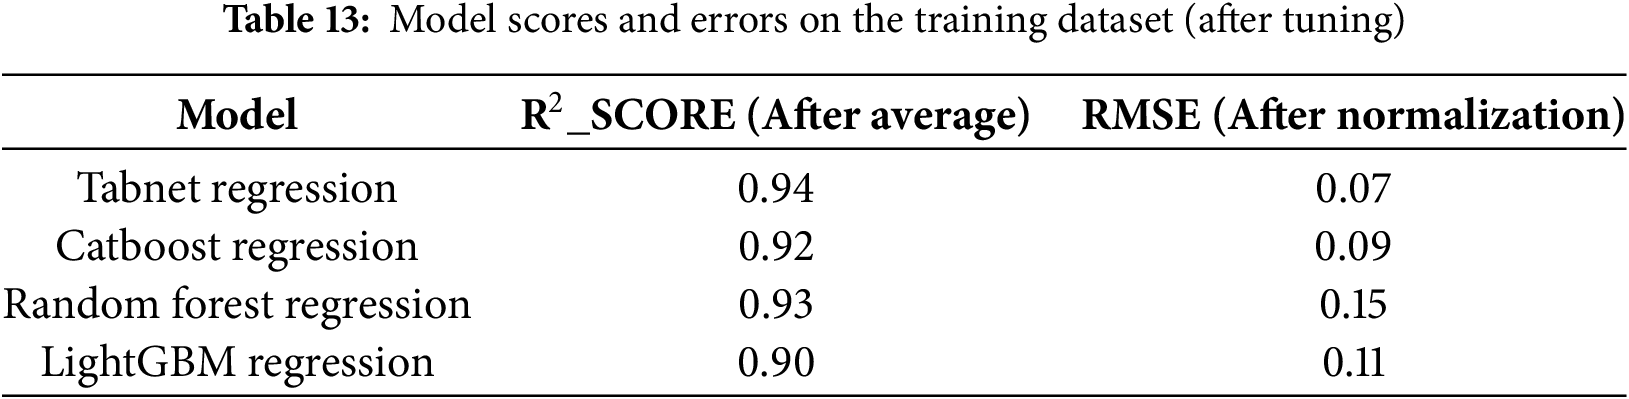
Bayesian optimization significantly accelerates convergence to optimal hyperparameter configurations compared with exhaustive and grid-search methods. As shown in Table 13, all candidate models exhibit substantial gains in both
For this application, the TabNet regressor [29] was selected as the final surrogate model, having delivered the highest R2 and the lowest root-mean-square error (RMSE) among all candidates. Fig. 14 presents its learning curves for the three injury targets—(a) tibial acceleration (pred_A), (b) knee-flexion angle (pred_ANG), and (c) shear displacement (pred_DSTR)—with validation RMSE shown in blue and test RMSE in red. In each case, RMSE decreases sharply within the first 10–15 epochs, indicating rapid capture of the underlying data patterns, and begins to plateau by around epoch 20, signifying convergence. The near-perfect overlap of validation and test RMSE throughout training confirms that the model generalizes well, with no evidence of over- or underfitting. Minor, synchronized fluctuations (e.g., around epoch 25 in pred_ANG) reflect stochastic variations in the optimization process and do not materially affect overall performance. Collectively, these learning curves demonstrate that the TabNet surrogate converges efficiently and exhibits strong generalization across all three injury metrics, achieving low and stable error within relatively few training epochs. Fig. 15 below shows the prediction results of the complex machine learning model on the test set. It is evident that most of the scatter points are concentrated around the line, with the errors falling within the ±10% error margin. This indicates that the model’s predictions are nearly identical to the true values in the test set, further validating the feasibility and effectiveness of using machine learning methods to construct high-precision surrogate models. Therefore, complex models not only provide more accurate fitting for pedestrian safety performance prediction, but also offer more precise references for subsequent vehicle front-end structure optimization.
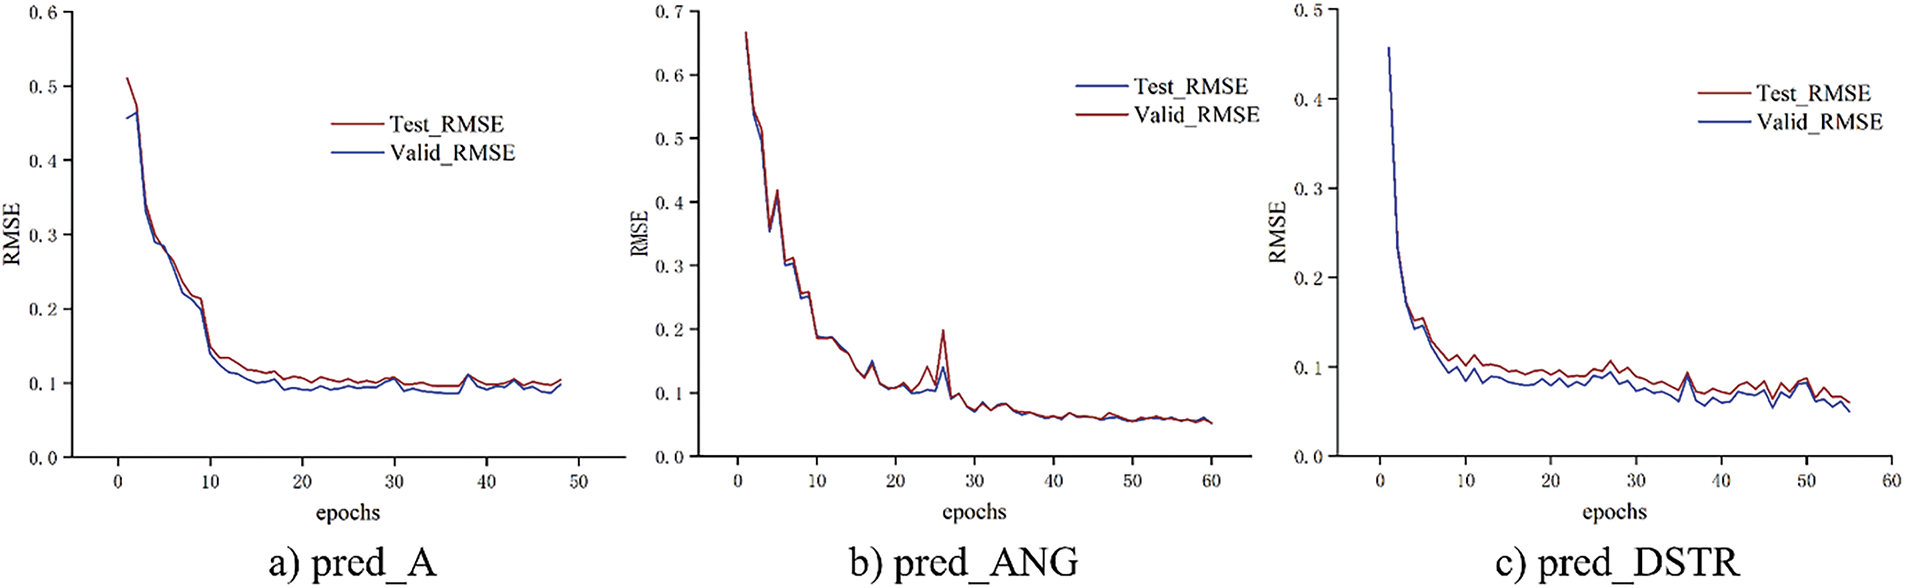
Figure 14: RMSE of the TabNET model
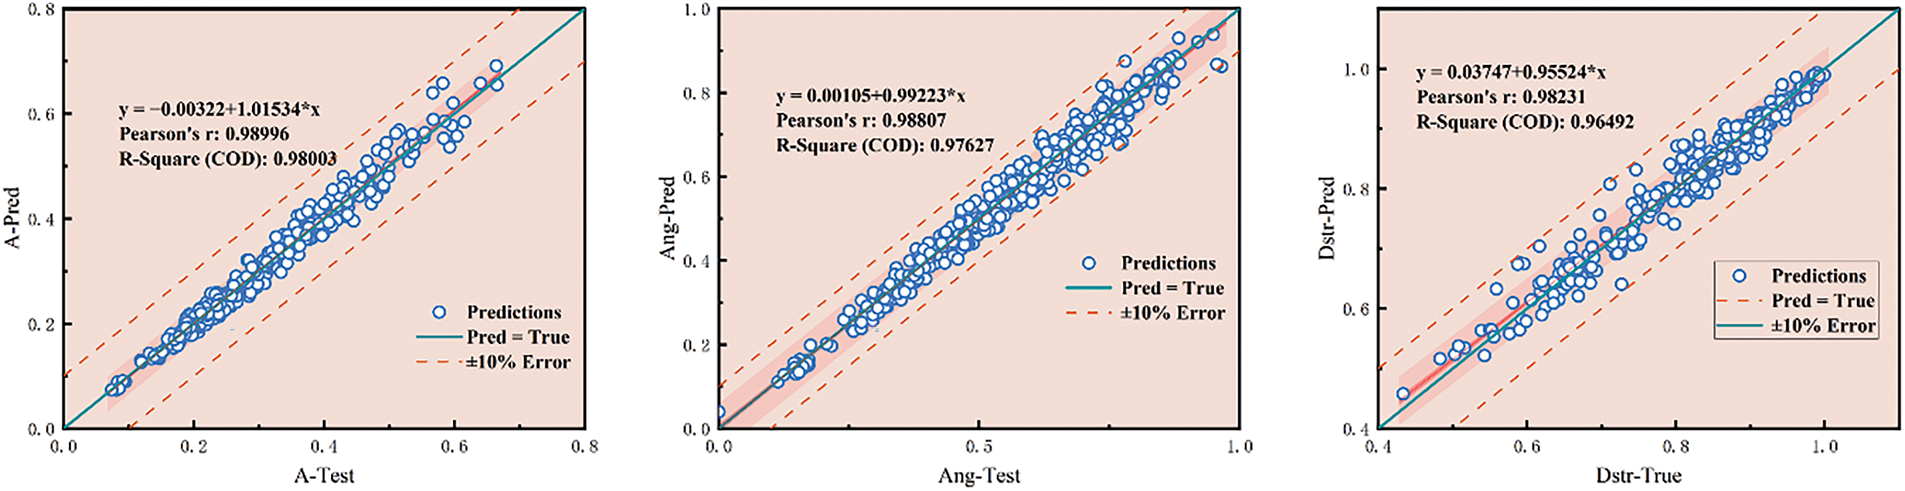
Figure 15: Comparison of true and predicted values
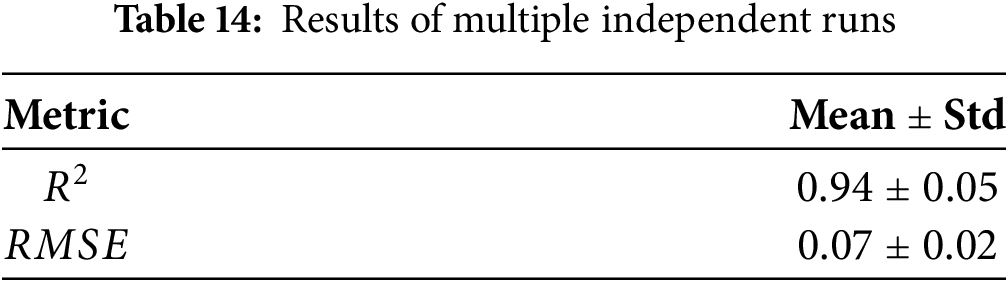
In this work, TabNet was adopted as the principal machine-learning framework. TabNet (Tabular Neural Network) is a specialized deep-learning architecture for tabular data that combines the interpretability of decision-tree models with the representational capacity of neural networks [29]. Its sequential attention mechanism highlights the most relevant features at each decision step, thereby alleviating the curse of dimensionality. Moreover, TabNet natively accommodates both continuous and categorical variables, obviating complex preprocessing pipelines. The model’s use of unbiased, distributed representations and its decision-step structure enable efficient learning of sparse, high-dimensional patterns, which improves generalization while preserving computational efficiency and robustness. The overall architecture of TabNet is illustrated in Fig. 16. To ensure the stability of TabNet’s predictions, we evaluated its performance under the finalized hyperparameter configuration using five repeats of four-fold cross-validation (for a total of 20 independent trials). The aggregated results—mean ± standard deviation for both
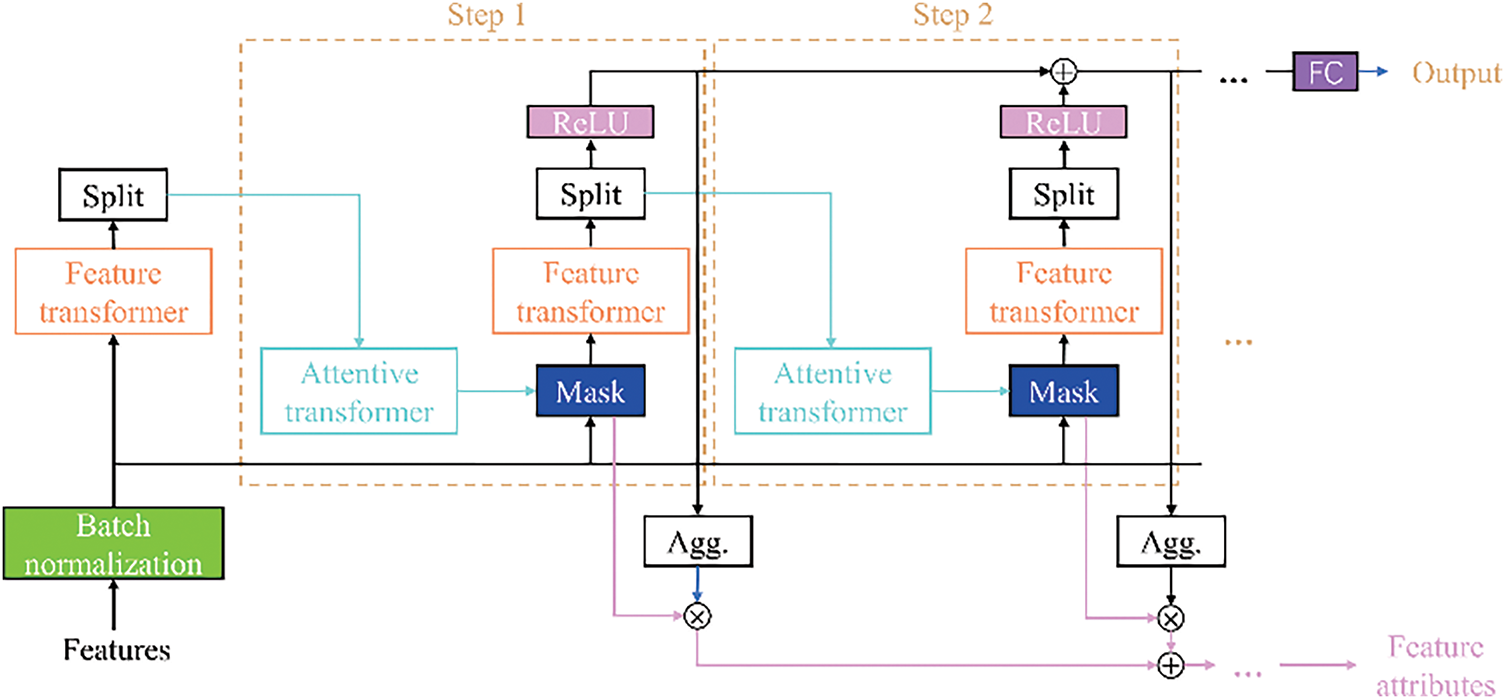
Figure 16: Schematic diagram of tabnet structure
5.1 Model Interpretability Analysis
TabNet utilizes a built-in attention mechanism and dynamic feature masking, which enables it to perform feature importance analysis in a manner like tree-based models. At each decision step, TabNet selectively prioritizes different features, assigning importance based on attention weights. By aggregating these weights across all decision steps, TabNet calculates the final importance score for each feature. Additionally, the multi-step decision structure of TabNet ensures the reevaluation of previously unused features, leading to a more comprehensive and unbiased assessment of feature importance. As illustrated in Fig. 17, the importance of selected feature categories in predicting target variables is clearly shown. Notably, the feature with the highest total share across the three target variables was the bumper architecture, followed by impact point distance and material properties.
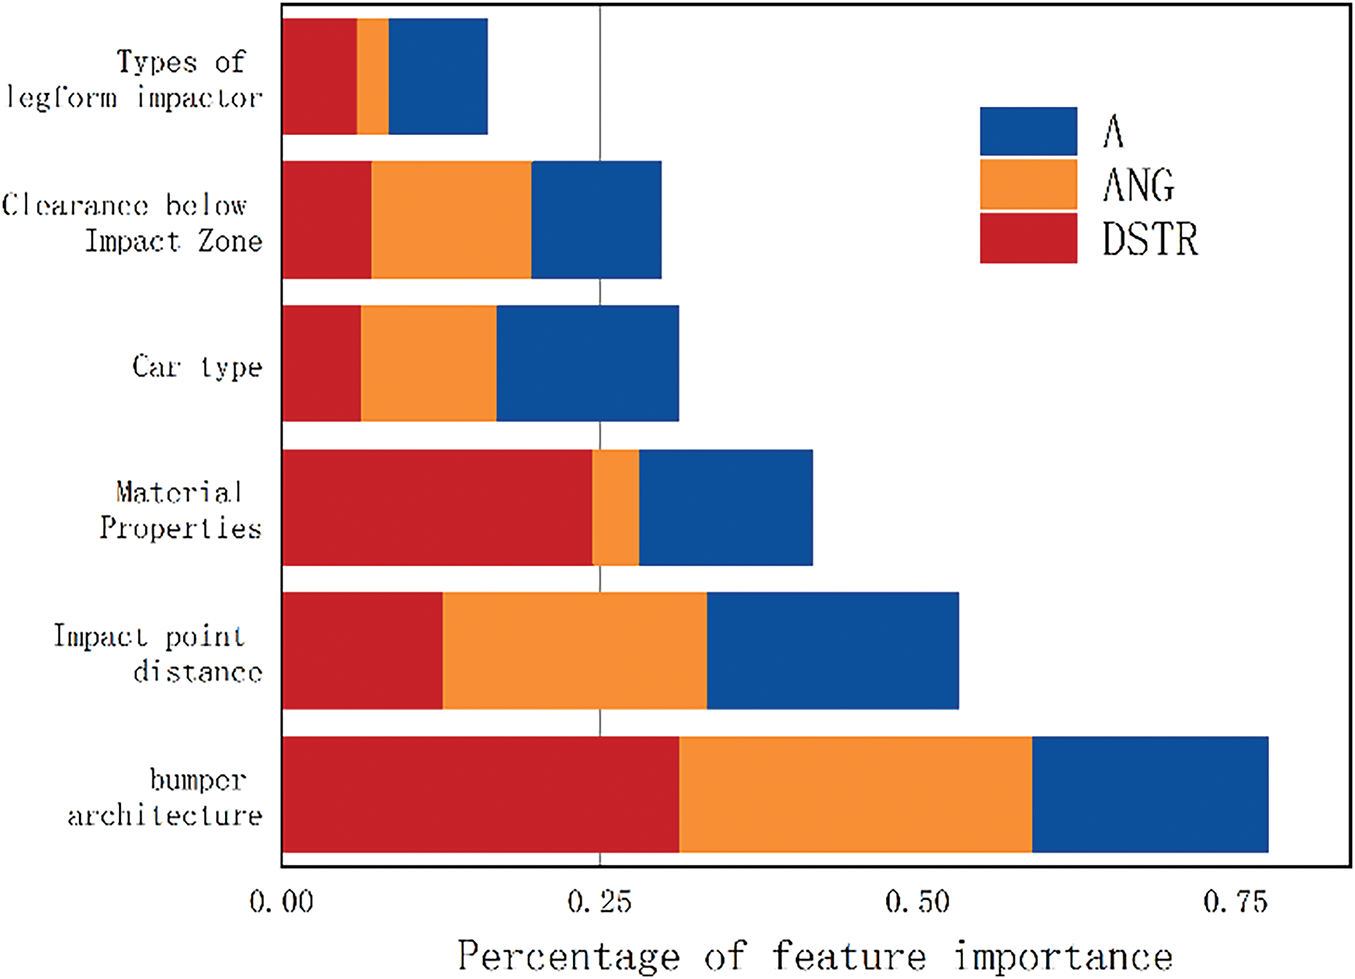
Figure 17: Importance of features
The horizontal stacked-bar chart illustrates the relative importance of six feature groups—bumper architecture, impact-point distance, material properties, vehicle category, under-ride clearance, and legform impactor type—across three injury metrics: tibial acceleration (A), knee flexion angle (ANG), and shear displacement (DSTR). The x-axis quantifies each group’s percentage contribution to the surrogate model’s predictions. As shown, front-end geometric parameters (bumper architecture and impact-point distance) exert an overwhelmingly dominant influence on injury outcomes, particularly for knee flexion and shear displacement. Material properties significantly affect shear displacement but have only a minor effect on knee flexion. Vehicle category and under-ride clearance exhibit moderate influence, indicating that overall vehicle size and chassis height should also inform design decisions. Although legform impactor type remains a standard testing parameter, its importance in this multivariate surrogate model is comparatively low, underscoring the primacy of structural features in real-world crash risk. In summary, pedestrian-protection design should prioritize optimization of bumper-architecture parameters, followed by adjustments to impact-point positioning and material stiffness, with secondary refinements based on vehicle class and ground clearance.
In addition to the feature importance integrated within the model, it is crucial to conduct model interpretability analyses using external methods. Among the various model interpretation techniques, SHAP (Shapley Additive Explanations) [30] has gained considerable attention due to its solid theoretical foundation and broad applicability. SHAP is rooted in Shapley value theory from game theory, and it quantitatively assesses the marginal impact of adding or removing a specific feature on the model’s predicted value. By calculating this marginal effect, SHAP evaluates each feature’s contribution to the model’s prediction. Specifically, the SHAP method approximates the complex black-box model f(x) using a set of simple binary linear functions, leveraging the Shapley value and the additivity principle, as shown in Eq. (6).
where S denotes the subset of features (without feature
In the local interpretation method of SHAP, the influence of each sample on the output response—along with its positive and negative contributions—can be visualized using a force plot. This section presents the effect of each design variable on the output response, exemplified by a randomly selected data sample from the test set of the pedestrian crash safety performance dataset.
In Fig. 18, we analyze three individual samples from the prediction process. Blue arrows on the right side of the output indicate feature contributions that push the predicted value downward, while red arrows on the left indicate contributions that push it upward. The length of each arrow reflects the magnitude of the feature’s effect.
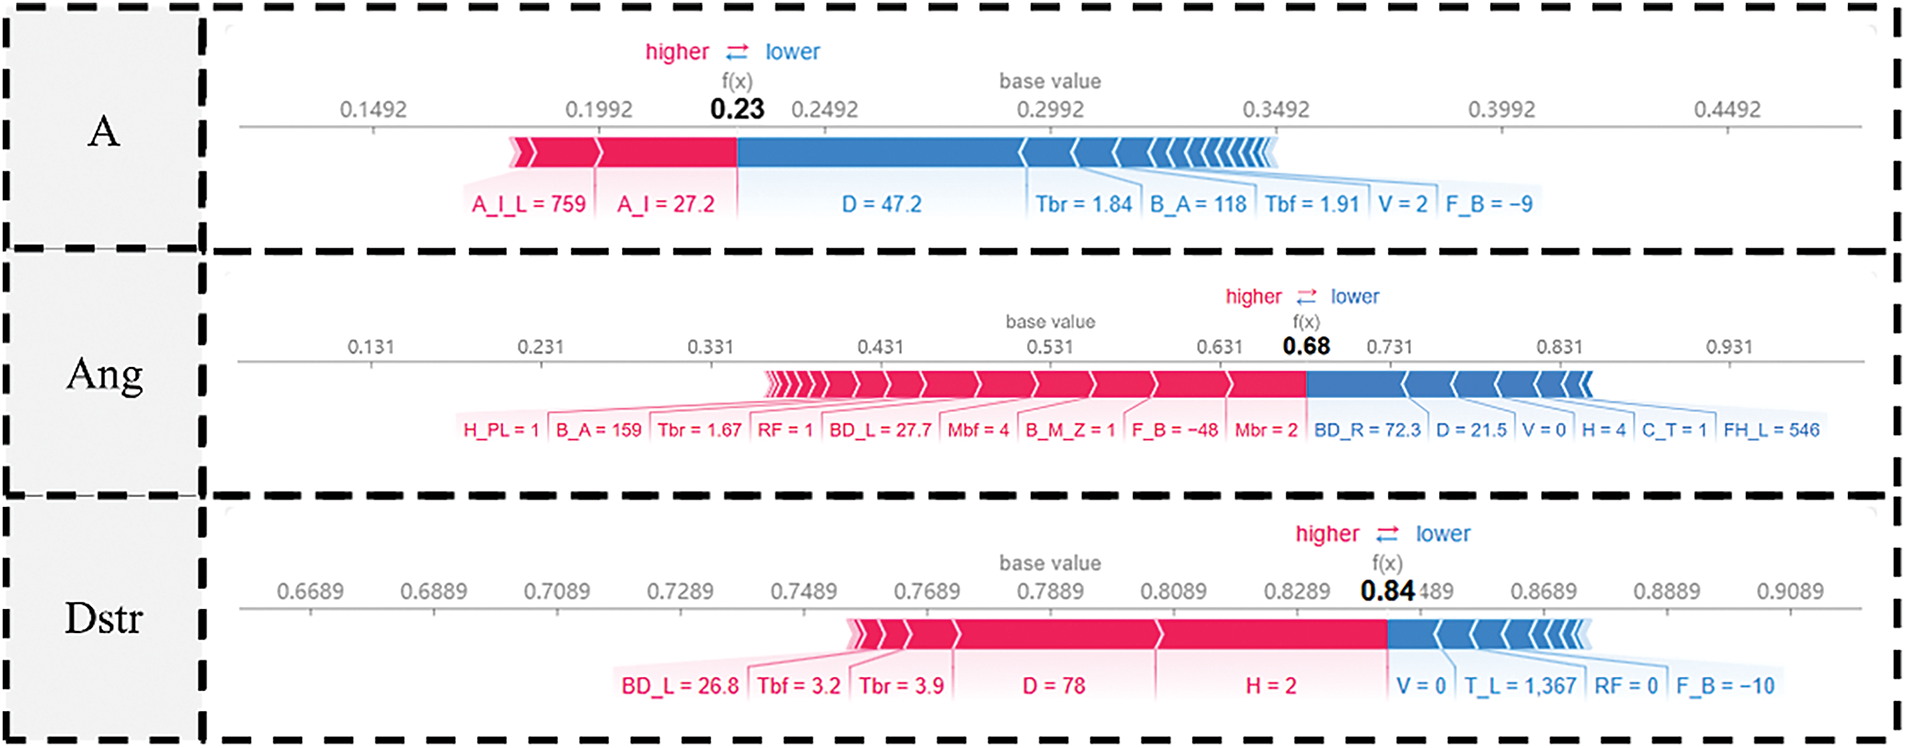
Figure 18: Sample force-plot
Sample 1 (baseline normalized acceleration = 0.23): features D (collision location) and A_I (vent position) have the largest impact. Specifically, an increase in D substantially lowers the predicted tibial acceleration, whereas a higher A_I raises it.
Sample 2 (baseline normalized knee-flexion angle = 0.68): features M_bf (skin Young’s modulus), M_br (bumper-beam modulus), and F_B (bumper fascia presence) all contribute positively to the predicted flexion angle, while BD_R (crush-box position ratio) and D reduce it.
Sample 3 (baseline normalized shear displacement = 0.84): both D (collision location) and H (impact height) strongly increase the predicted shear displacement.
The range and distribution of the top 10 design variables influencing safety performance are shown in the figure below. The y-axis represents the top 10 design variables, sorted by their overall contribution
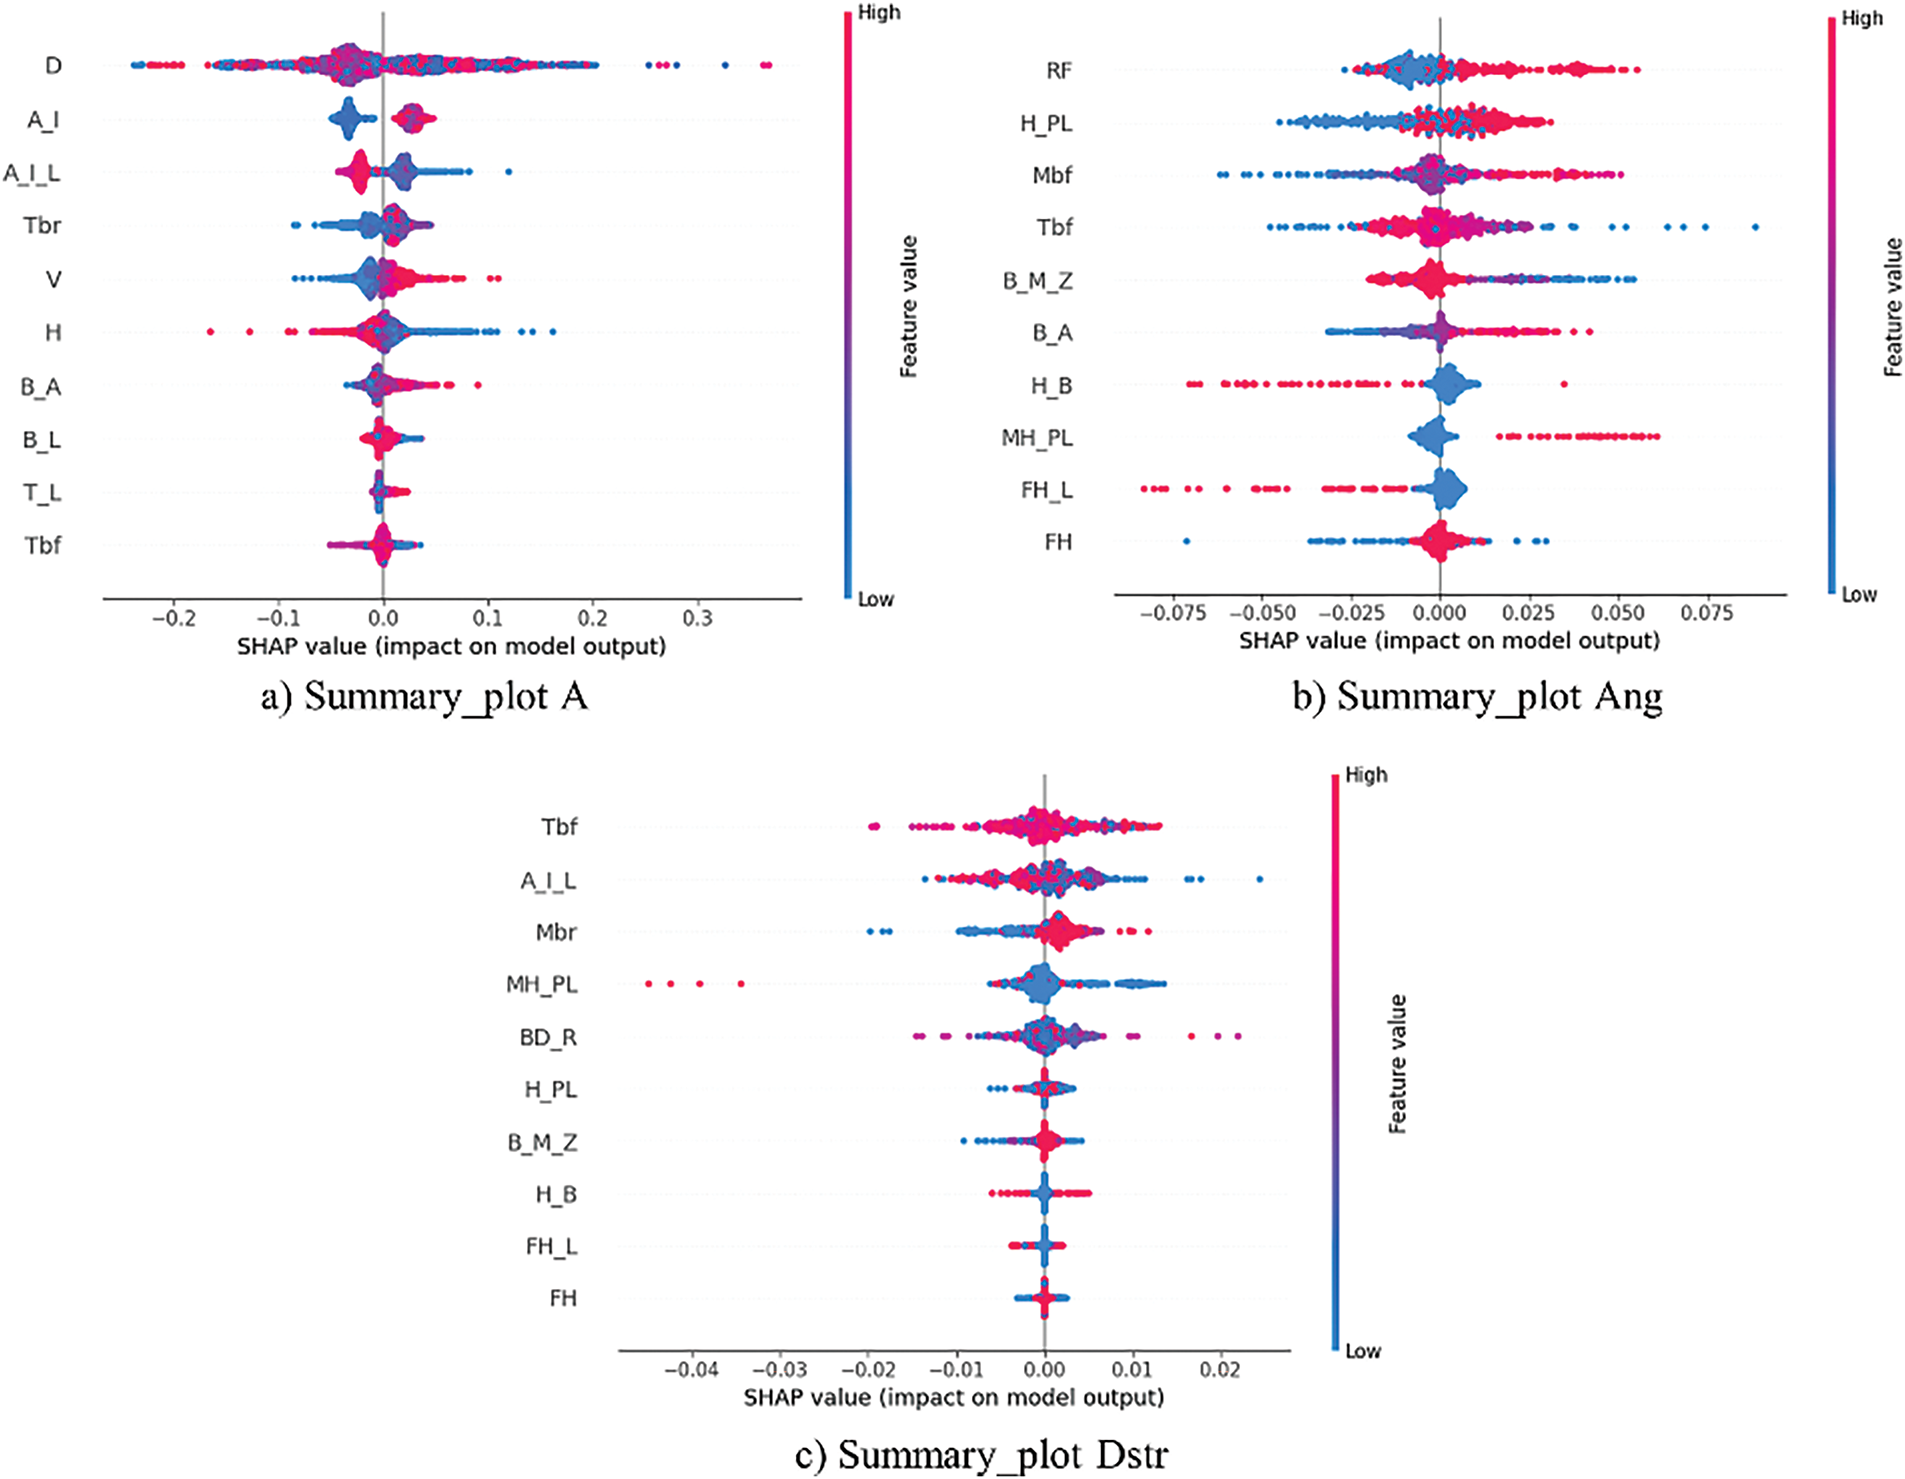
Figure 19: Summary plot
From the summary plot above, the horizontal width represents the range of SHAP values for each feature across all samples, indicating the magnitude of its impact on the model’s predictions. For the acceleration target in particular, feature D (longitudinal collision location) exhibits the widest distribution, making it the most influential factor with the largest positive and negative “push” on the predicted outcome. The next most important features are A_I (vent position), A_I_L (vent length), Tbr (bumper-beam thickness), and V (impact speed). Points are colored from blue (low feature value) to red (high feature value) to reflect each feature’s magnitude. For D, red points (high values) cluster on the right side of the plot, indicating that a larger D increases the predicted injury severity, whereas blue points (low values) tend to produce negative contributions that lower the prediction. Similarly, for A_I, lower vent positions (blue) reduce the predicted severity, while higher positions (red) increase it. Features near the bottom—such as Tbf (outer-skin thickness)—show much narrower distributions, signifying a comparatively minor overall effect. To illustrate the cumulative effect of feature interactions and the combined impact of multiple features on prediction results, this paper employs a decision diagram to display the changes in model predictions based on a set of design variables, as shown in Fig. 20. In the diagram, the prediction trajectory of each sample is represented by a colored curve. Each curve intersects the horizontal axis at the corresponding prediction point, with its color reflecting the observed prediction value at that point. As the curve progresses from bottom to top, the SHAP value of each feature accumulates towards the model’s baseline value, visually demonstrating the contribution of each feature to the overall prediction.
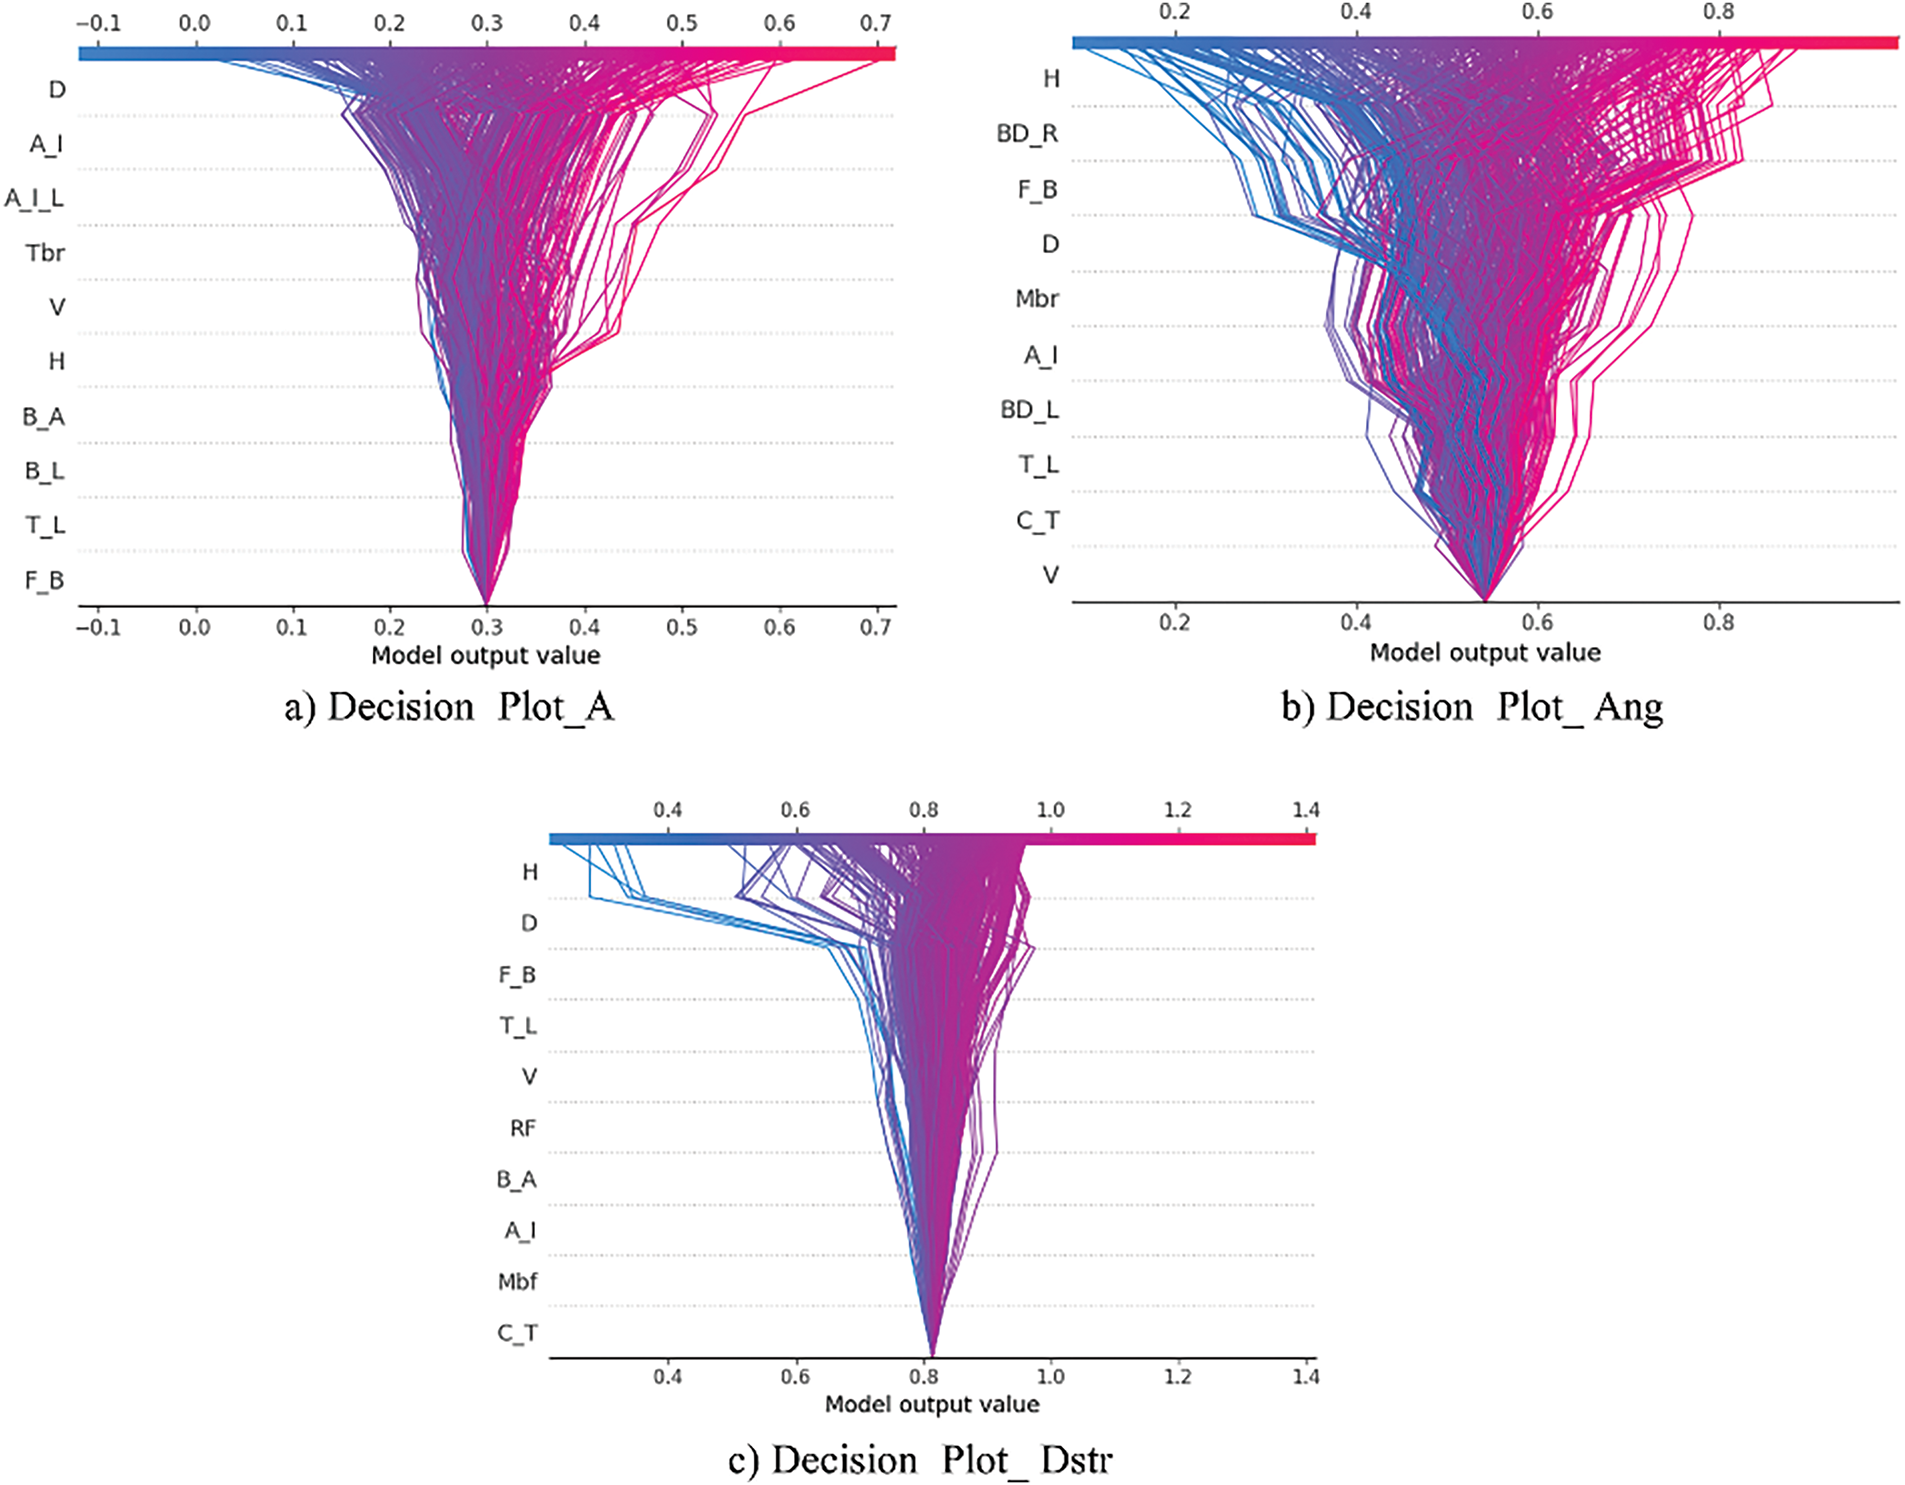
Figure 20: Decision plot
From the decision plot above, each trajectory traces the cumulative effect of features—ordered by their importance—from the model’s baseline output to the final prediction. Line color encodes the predicted severity: blue lines indicate lower injury predictions, and red lines indicate higher ones. For the knee-flexion angle outcome, the earliest features (e.g., H, impact height; BD_R, crush-box position ratio) introduce the largest initial shifts: high impact heights (red lines) rapidly elevate the baseline. Subsequent mid-sequence features (such as F_B, bumper fascia presence; D, collision location) further separate the trajectories, creating a clear divergence between high- and low-severity predictions. Although later, lower-importance features (such as V, impact speed; C_T, vehicle category) continue to adjust the output, the prediction paths have by that point already been largely determined.
5.2 Machine Learning Model Validity Validation
The error is calculated according to Eq. (8). A positive error sign indicates overprediction, i.e., the predicted target value is higher than the actual target value. On the other hand, a negative sign of error indicates under prediction i.e., the predicted target value is lower than the actual target value.
Fig. 21 illustrates the distribution of prediction errors for three lower-limb injury metrics—tibial acceleration (ERROR_A, yellow), knee-flexion angle (ERROR_ANG, light blue), and shear displacement (ERROR_DSTR, dark blue)—expressed as a percentage of the true response. The two horizontal red lines denote
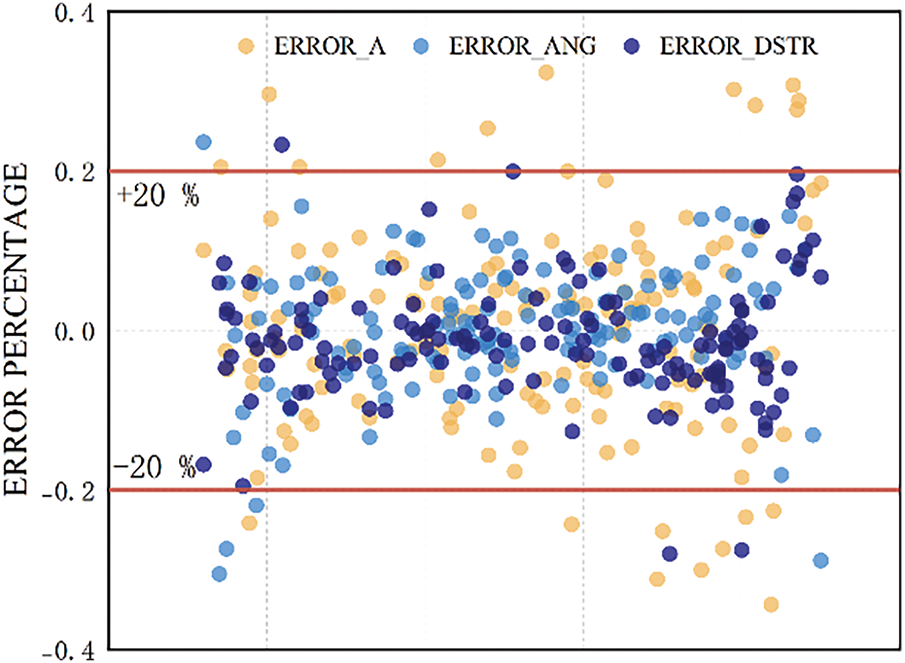
Figure 21: Error distribution chart
Among the metrics, acceleration errors exhibit the greatest variability, with a small number of outliers exceeding
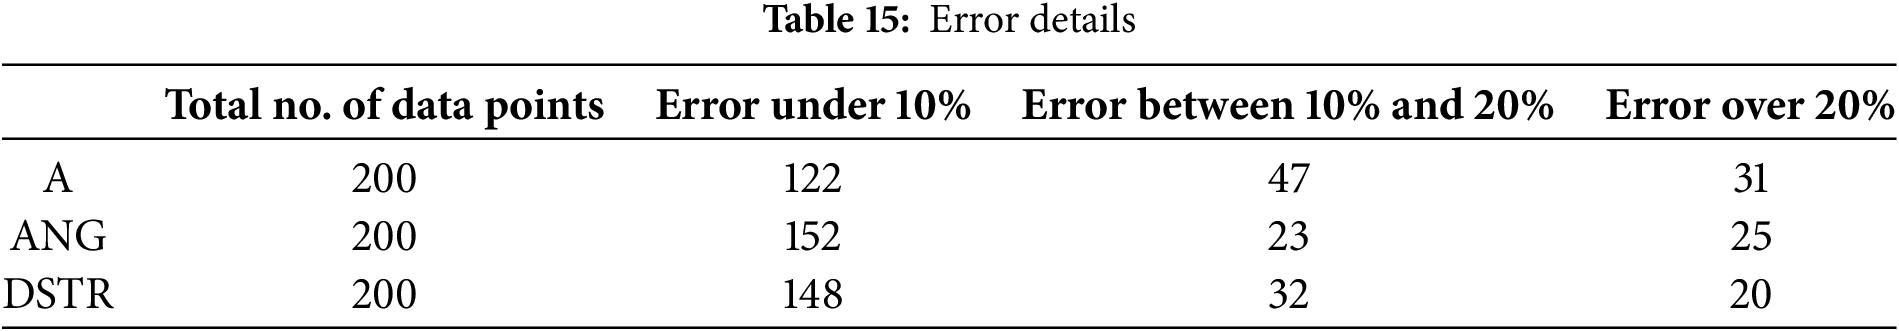
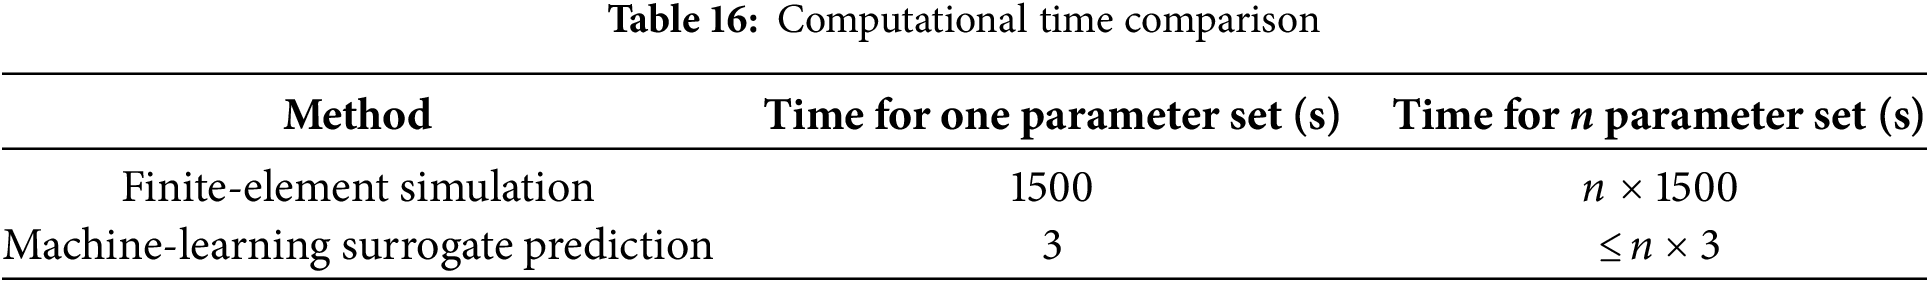
As can be seen in Table 15, most of the absolute values of the errors are below 20 per cent, with 84.5 percent, 87.5 percent and 90 percent of the collision points having absolute error values of less than 20 percent for the three target variables. Taking the simplified vehicle front-end model described in Section 3 as an example, conducting finite-element simulations for 100 pedestrian-leg impact locations on a 12-core, 20-thread CPU requires approximately 84 h for a single set of parameter configurations. By contrast, a machine-learning surrogate can generate predictions for the same scenario in a fraction of that time while maintaining low error levels. Leveraging such a surrogate enables rapid evaluation of numerous front-end design variants, with predictive deviations kept within acceptable engineering tolerances. The prediction time of the finite element method and machine learning surrogate model is shown in Table 16.
This study has demonstrated that a machine-learning surrogate—specifically TabNet—can leverage high-fidelity finite-element simulation data to predict pedestrian lower-limb injury severity with both exceptional accuracy and interpretability, outperforming traditional methods such as SVM, Random Forest, Decision Trees, LightGBM, and CatBoost. TabNet achieved an R2 of approximately 0.94 and an RMSE of 0.14 on both validation and independent test sets, with 84.5%, 87.5%, and 90% of tibial acceleration, knee-flexion angle, and shear-displacement predictions, respectively, falling within a ±20% error margin. SHAP-based analysis revealed that front-end geometric features—most notably collision-point location and bumper architecture—are the primary determinants of injury outcomes, while material stiffness, impact speed, vehicle category, and under-ride clearance also exert meaningful influence. These insights were translated into actionable design recommendations—prioritizing bumper and crush-box geometry adjustments, refining vent placement and material properties, and fine-tuning vehicle classification and ground clearance—to systematically reduce lower-limb injury metrics. Moreover, by replacing iterative finite-element runs with the TabNet surrogate, computation time was reduced by an order of magnitude, confirming its viability as a real-time decision-support tool in early design phases.
Building on this foundation, future work will focus on embedding the TabNet surrogate within a multi-objective optimization framework—such as genetic algorithms—to simultaneously minimize injury risks across multiple body regions (leg, head, chest). Additionally, we plan to explore hybrid deep-learning architectures and enrich the training corpus with extreme-value collision scenarios to enhance model robustness and generalizability. These efforts aim to drive the development of truly pedestrian-friendly front-end vehicle structures through data-driven, performance-based design optimization.
Acknowledgement: Guangzhou Automobile Group Corporation, Dalian University of Technology, and the Automotive Digital and Intelligent Design Research Group are gratefully acknowledged for providing valuable support for the evaluation of this study.
Funding Statement: This work was sponsored by the National Natural Science Foundation of China (No. U21A20165, No. 52072057). The support is gratefully acknowledged. Supported authors include Junling Zhong, Zhixiao Chen, Wenbin Hou.
Author Contributions: The authors confirm contribution to the paper as follows: study conception and design: Wenbin Hou, Junling Zhong; data collection: Junling Zhong, Zhixiao Chen; analysis and interpretation of results: Junling Zhong, Furong Geng; draft manuscript preparation: Junling Zhong. All authors reviewed the results and approved the final version of the manuscript.
Availability of Data and Materials: Please contact 18904491293@mail.dlut.edu.cn to get the codes and data used in the study.
Ethics Approval: Not applicable.
Conflicts of Interest: The authors declare no conflicts of interest to report regarding the present study.
References
1. World Health Organization. Global status report on road safety 2023: summary. Geneva, Switzerland: WHO; 2023. [Google Scholar]
2. Pereira NQ, Callaghan B. A comparison new car assessment program NCAP requirements and procedures around the world. Warrendale, PA, USA: SAE International; 2013. Report No.: 2013-36-0499. doi:10.4271/2013-36-0499. [Google Scholar] [CrossRef]
3. Viano DC. Frontal NCAP performance and field injury over 40 years. Traffic Inj Prev. 2024;25(3):297–312. doi:10.1080/15389588.2024.2315890. [Google Scholar] [PubMed] [CrossRef]
4. Zhiliang Z, Peng L, Wang X, Zhibo Z, Tianhua W, Dandan C. Research on active safety testing based on China new car assessment program (C-NCAP). Traffic Inj Prev. 2024;15:2. doi:10.1117/12.3025949. [Google Scholar] [CrossRef]
5. Zhang H, Shi Y, Lu L, Gou L, Wang L, Zhang J. Research of Hood on maintaining performance balance between dent resistance and pedestrian head protection. Int J Automot Technol. 2024;25(4):931–43. doi:10.1007/s12239-024-00081-z. [Google Scholar] [CrossRef]
6. Fredriksson R, Rosén E, Kullgren A. Priorities of pedestrian protection—a real-life study of severe injuries and car sources. Accid Anal Prev. 2010;42(6):1672–81. doi:10.1016/j.aap.2010.04.006. [Google Scholar] [PubMed] [CrossRef]
7. Shi L, Zhang H, Wu L, Liu Y, Cheng K, Han Y, et al. A hierarchical prediction method for pedestrian head injury in intelligent vehicle with combined active and passive safety system. Biomimetics. 2024;9(3):124. doi:10.3390/biomimetics9030124. [Google Scholar] [PubMed] [CrossRef]
8. Mo F, Luo D, Tan Z, Shang B, Lv X, Zhou D. A human active lower limb model for Chinese pedestrian safety evaluation. J Bionic Eng. 2021;18(4):872–86. doi:10.1007/s42235-021-0067-2. [Google Scholar] [CrossRef]
9. Asgari M, Keyvanian SS. Crash Injury analysis of knee joint considering pedestrian safety. J Biomed Phys Eng. 2019;9(5):569. doi:10.31661/jbpe.v0i0.424. [Google Scholar] [PubMed] [CrossRef]
10. Fredriksson R, Shin J, Untaroiu CD. Potential of pedestrian protection systems—a parameter study using finite element models of pedestrian dummy and generic passenger vehicles. Traffic Inj Prev. 2011;12(4):398–411. doi:10.1080/15389588.2011.566655. [Google Scholar] [PubMed] [CrossRef]
11. Konosu A, Ishikawa H, Tanahashi M. Reconsideration of injury criteria for pedestrian subsystem legform test—Problems of rigid legform impactor. Warrendale, PA, USA: SAE International. 2001. Report No.: 2001-06-0206. [cited 2025 Apr 20]. Available from: http://papers.sae.org/2001-06-0206/. [Google Scholar]
12. Lu Y, Shen J, Wang C, Lu H, Xin J. Studying on the design and simulation of collision protection system between vehicle and pedestrian. Int J Distrib Sens Netw. 2020;16(1):155014771990010. doi:10.1177/1550147719900109. [Google Scholar] [CrossRef]
13. Das S, Le M, Dai B. Application of machine learning tools in classifying pedestrian crash types: a case study. Transp Saf Environ. 2020;2(2):106–19. doi:10.1093/tse/tdaa010. [Google Scholar] [CrossRef]
14. Tang B, Chien S, Huang Z, Chen Y. Pedestrian protection using the integration of V2V and the pedestrian automatic emergency braking system. In: Proceedings of the 2022 IEEE 25th International Conference on Intelligent Transportation Systems (ITSC); 2016 Dec 1–4; Rio de Janeiro, Brazil. p. 2213–8. doi:10.1109/itsc.2016.7795913. [Google Scholar] [CrossRef]
15. Zhao B, Zuniga-Garcia N, Xing L, Kockelman KM. Predicting pedestrian crash occurrence and injury severity in Texas using tree-based machine learning models. Transp Plan Technol. 2023;47(8):1205–26. doi:10.1080/03081060.2023.2216202. [Google Scholar] [CrossRef]
16. Choi S, Jang J, Oh C, Park G. Safety benefits of integrated pedestrian protection systems. Int J Automot Technol. 2016;17(3):473–82. doi:10.1007/s12239-016-0049-2. [Google Scholar] [CrossRef]
17. Hu W, Monfort SS, Cicchino JB. The association between passenger-vehicle front-end profiles and pedestrian injury severity in motor vehicle crashes. J Saf Res. 2024;90(1):115–27. doi:10.1016/j.jsr.2024.06.007. [Google Scholar] [PubMed] [CrossRef]
18. Zhao G, Takafumi M, Shoji K, Kenji M. Video based estimation of pedestrian walking direction for pedestrian protection system. J Electron. 2012;29(1–2):72–81. doi:10.1007/s11767-012-0814-y. [Google Scholar] [CrossRef]
19. Rabieh K, Samir R, Azer MA. Empowering Pedestrian safety: unveiling a lightweight scheme for improved vehicle-pedestrian safety. Information. 2024;15(3):160. doi:10.3390/info15030160. [Google Scholar] [CrossRef]
20. Shojaeifard MH, Khalkhali A, Rafsanjani SEN, Ghadirinejad K. Numerical investigation on automotive bumper structure improvements for pedestrian protection. Int J Crashworthiness. 2017;22(6):635–53. doi:10.1080/13588265.2017.1287521. [Google Scholar] [CrossRef]
21. Zanetti EM, Franceschini G, Audenino AL. Lower leg injury in relation to vehicle front end. Traffic Inj Prev. 2013;15(4):395–401. doi:10.1080/15389588.2013.824567. [Google Scholar] [PubMed] [CrossRef]
22. Lee YH, Joo YJ, Park JS, Kim YS, Yim HJ. Robust design optimization of frontal structures for minimizing injury risks of flex pedestrian legform impactor. Int J Automot Technol. 2014;15(5):757–64. doi:10.1007/s12239-014-0079-6. [Google Scholar] [CrossRef]
23. Wang D, Li S, Xie C. Crashworthiness optimisation and lightweight for front-end safety parts of automobile body using a hybrid optimisation method. Int J Crashworthiness. 2021;27(4):1193–204. doi:10.1080/13588265.2021.1926809. [Google Scholar] [CrossRef]
24. Lv X, Xiao Z, Fang J, Li Q, Lei F, Sun G. On safety design of vehicle for protection of vulnerable road users: a review. Thin-Walled Struct. 2022;182(2):109990. doi:10.1016/j.tws.2022.109990. [Google Scholar] [CrossRef]
25. Zhang M, Wang J, Yao J, Dong C, Zhang L. Optimization of the vehicle front structure for pedestrian protection with the aPLI legform model. In: Lecture notes in electrical engineering. Singapore: Springer; 2022. p. 1447–61. doi:10.1007/978-981-16-2090-4_94. [Google Scholar] [CrossRef]
26. Eid AM, Soudan B, Nassif AB, Injadat M. Comparative study of ML models for IIoT intrusion detection: impact of data preprocessing and balancing. Neural Comput Appl. 2024;36(13):6955–72. doi:10.1007/s00521-024-09439-x. [Google Scholar] [CrossRef]
27. Alam S, Yao N. The impact of preprocessing steps on the accuracy of machine learning algorithms in sentiment analysis. Comput Math Organ Theory. 2018;25(3):319–35. doi:10.1007/s10588-018-9266-8. [Google Scholar] [CrossRef]
28. Rawal A, Rawat DB, Sadler B. Recent advances in adversarial machine learning: status, challenges and perspectives. Artif Intell Mach Learn Multi-Domain Oper Appl III. 2021;11746:701–12. doi:10.1117/12.2583970. [Google Scholar] [CrossRef]
29. Kanász R, Drotár P, Gnip P, Zoričák M. Clash of titans on imbalanced data: Tabnet vs. XGBoost. In: Proceedings of the 2nd IEEE Conference on Artificial Intelligence (CAI); 2024 Jun 25–27; Singapore. p. 320–25. doi:10.1109/cai59869.2024.00068. [Google Scholar] [CrossRef]
30. Wang H, Liang Q, Hancock JT, Khoshgoftaar TM. Feature selection strategies: a comparative analysis of SHAP-value and importance-based methods. J Big Data. 2024;11(1):44. doi:10.1186/s40537-024-00905-w. [Google Scholar] [CrossRef]
Cite This Article
 Copyright © 2025 The Author(s). Published by Tech Science Press.
This work is licensed under a Creative Commons Attribution 4.0 International License , which permits unrestricted use, distribution, and reproduction in any medium, provided the original work is properly cited.
 Downloads
 Citation Tools