
 Submit a Paper
 Propose a Special lssue
 Open Access
ARTICLE

A Hybrid CNN-Transformer Framework for Normal Blood Cell Classification: Towards Automated Hematological Analysis
1 Department of Clinical Laboratory Sciences, College of Applied Medical Sciences, Najran University, Najran, 61441, Kingdom of Saudi Arabia
2 Department of Computer Science, COMSATS University Islamabad Sahiwal Campus, Sahiwal, 57000, Pakistan
3 Electrical Engineering Department, College of Engineering, Najran University, Najran, 61441, Kingdom of Saudi Arabia
4 Department of Medical Laboratory Technology, Faculty of Applied Medical Sciences, University of Tabuk, Tabuk, 71491, Kingdom of Saudi Arabia
5 Department of Medical Laboratory Sciences, College of Applied Medical Sciences, University of Bisha, Bisha, 67714, Kingdom of Saudi Arabia
6 Department of Medical Laboratory, College of Applied Medical Sciences, Prince Sattam bin Abdulaziz University, Alkharj, 11942, Kingdom of Saudi Arabia
7 Artificial Intelligence and Sensing Technologies (AIST) Research Center Tabuk, University of Tabuk, Tabuk, 71491, Kingdom of Saudi Arabia
8 Artificial Intelligence and Cyber Futures Institute, Charles University, Bathurst, NSW 2795, Australia
9 Department of Clinical Laboratory Sciences, College of Applied Medical Sciences, King Khalid University, Abha, 62217, Kingdom of Saudi Arabia
* Corresponding Authors: Ahmad Shaf. Email: ; Muhammad Irfan. Email:
(This article belongs to the Special Issue: Artificial Intelligence Models in Healthcare: Challenges, Methods, and Applications)
Computer Modeling in Engineering & Sciences 2025, 144(1), 1165-1196. https://doi.org/10.32604/cmes.2025.067150
Received 26 April 2025; Accepted 04 July 2025; Issue published 31 July 2025
 View Full Text
 Download PDF
Abstract
Background: Accurate classification of normal blood cells is a critical foundation for automated hematological analysis, including the detection of pathological conditions like leukemia. While convolutional neural networks (CNNs) excel in local feature extraction, their ability to capture global contextual relationships in complex cellular morphologies is limited. This study introduces a hybrid CNN-Transformer framework to enhance normal blood cell classification, laying the groundwork for future leukemia diagnostics. Methods: The proposed architecture integrates pre-trained CNNs (ResNet50, EfficientNetB3, InceptionV3, CustomCNN) with Vision Transformer (ViT) layers to combine local and global feature modeling. Four hybrid models were evaluated on the publicly available Blood Cell Images dataset from Kaggle, comprising 17,092 annotated normal blood cell images across eight classes. The models were trained using transfer learning, fine-tuning, and computational optimizations, including cross-model parameter sharing to reduce redundancy by reusing weights across CNN backbones and attention-guided layer pruning to eliminate low-contribution layers based on attention scores, improving efficiency without sacrificing accuracy. Results: The InceptionV3-ViT model achieved a weighted accuracy of 97.66% (accounting for class imbalance by weighting each class’s contribution), a macro F1-score of 0.98, and a ROC-AUC of 0.998. The framework excelled in distinguishing morphologically similar cell types demonstrating robustness and reliable calibration (ECE of 0.019). The framework addresses generalization challenges, including class imbalance and morphological similarities, ensuring robust performance across diverse cell types. Conclusion: The hybrid CNN-Transformer framework significantly improves normal blood cell classification by capturing multi-scale features and long-range dependencies. Its high accuracy, efficiency, and generalization position it as a strong baseline for automated hematological analysis, with potential for extension to leukemia subtype classification through future validation on pathological samples.Keywords
Blood cell analysis is a cornerstone of clinical diagnostics, enabling the identification of various hematological conditions through the morphological characterization of blood cells. Accurate classification of normal blood cells—such as neutrophils, lymphocytes, monocytes, eosinophils, erythroblasts, and platelets—is essential for establishing a baseline to understand healthy cell morphology and detect pathological deviations in conditions such as leukemia, anemia, or other blood disorders [1,2]. Automated classification systems utilizing machine learning and deep learning techniques have emerged as powerful tools in digital pathology, providing improved efficiency and consistency compared to traditional manual evaluations [3,4].
Leukemia, a group of blood cancers characterized by the uncontrolled proliferation of immature white blood cells, highlights the importance of robust blood cell classification systems [5]. While leukemia detection relies on identifying abnormal cells, understanding the morphology of normal blood cells is a critical prerequisite for developing diagnostic tools capable of detecting such conditions. Routine blood tests, including complete blood count (CBC) tests, provide initial insights into blood cell characteristics, but advanced computational methods are needed to enhance diagnostic accuracy [2]. While genetic mutations play a central role in the development of leukemia, a range of environmental and lifestyle factors have also been implicated in its development.
Exposure to environmental factors such as radiation, certain chemicals, and chemotherapy drugs, as well as lifestyle factors like parental smoking and alcohol consumption, is associated with an increased risk of leukemia, particularly in children, through mechanisms such as DNA damage and epigenetic alterations, though direct causation has not been conclusively established [6]. These risk factors underscore the need for precise identification of normal blood cell morphologies to detect early deviations indicative of leukemia. Leukemia is prevalent across age groups, being most common in individuals over 60, yet it remains a leading cancer in children and young people under 20 [7]. According to the US National Cancer Institute’s Surveillance, Epidemiology, and End Results (SEER) database, approximately 62,770 new leukemia cases are projected for 2024, accounting for 3.1% of all new cancer diagnoses, with an estimated 23,670 deaths representing 3.9% of all cancer fatalities [8]. These statistics highlight the urgency of developing robust automated hematological analysis tools, which leverages advanced feature extraction to accurately classify normal blood cells, providing a critical baseline for identifying pathological changes associated with leukemia.
A study comparing childhood acute lymphoblastic leukemia (cALL) trends in Saudi Arabia and the United States [9] demonstrated distinct epidemiological patterns. While Saudi Arabia maintained a lower age-adjusted cALL incidence than the US throughout the 2001–2014 period, its case rates grew at a statistically significant upward trajectory (
Convolutional Neural Networks (CNNs) have become a leading approach for blood cell classification due to their ability to automatically extract and learn relevant features from medical images [11]. Various CNN architectures, such as AlexNet, DenseNet, ResNet, and VGG16 [12–15], have been explored for their ability to capture complex patterns in blood cell images. Transfer learning leverages models pre-trained on large-scale datasets such as ImageNet and adapts them for the specialized task of leukemia classification. For instance, architectures like Darknet-53 and ShuffleNet [16], ResNet-18 [17], VGG16 [18], InceptionResNetV2 [19], MobileNet v2 [20], and Inception-ResNet [21] have been fine-tuned to extract robust features from medical images. This approach is particularly advantageous when available datasets are limited, as it enhances performance by utilizing pre-learned representations.
The study [22] proposes a novel method for automatic white blood cell (WBC) image classification using a small database. It integrates Quaternion hybrid Meixner-Charlier moments (QHMCMs), derived from discrete Charlier-Meixner hybrid polynomials, with a convolutional quaternion moment neural network (CNN-QMs). The approach involves two phases: preprocessing, where QHMCMs are computed with parameters optimized via the Grey Wolf Optimization algorithm for high accuracy, and classification, where the processed moments are fed into the CNN-QMs model to differentiate WBC classes effectively.
Hybrid methods that combine CNNs with traditional machine learning techniques, such as AdaBoost, Support Vector Machines, and XGBoost [23–25], as well as ensemble learning strategies [26–28], have further improved classification performance by leveraging the complementary strengths of these approaches. However, conventional deep learning models often struggle with overfitting and limited generalization due to challenges in processing complex feature maps [29]. Increasing network depth can lead to redundant computations, excessive memory usage, and vanishing gradients, while pooling operations may result in the loss of critical contextual information [30–32].
In response to these challenges, attention mechanisms have emerged as a promising solution. Attention mechanisms in deep learning are designed to mimic the human cognitive ability to focus on the most informative parts of an input while disregarding less relevant details. By dynamically weighting features based on their relevance, these mechanisms enable models to capture both global and local contextual information more effectively. Incorporating attention modules into deep learning frameworks allows networks to concentrate on the most critical regions of medical images, thereby enhancing classification accuracy. For example, recent approaches such as Efficient Channel Attention with Vgg16 [33], DenseNet201 with CBAM [34], Deep CNN with feature fusion [35], SCKansformer [36], and ViT-CNN [37] have employed a selective cross-attention mechanism coupled with feature calibration, prioritizing salient features and addressing some of the inherent limitations of conventional CNN architectures.
Traditional convolutional neural networks (CNNs) excel at extracting local features from images through fixed-size filters but often struggle to capture global contextual relationships across an entire image. In response to these challenges, attention mechanisms have emerged as a promising solution. Unlike CNNs, which apply uniform processing across spatial regions, attention mechanisms dynamically prioritize the most informative parts of an input, mimicking human cognitive focus. By assigning weights to features based on their relevance, these mechanisms enable models to capture both global and local contextual information more effectively. Incorporating attention modules into deep learning frameworks allows networks to concentrate on critical regions of medical images, thereby enhancing classification accuracy. For example, recent approaches such as Efficient Channel Attention with Vgg16 [33], DenseNet201 with CBAM [34], Deep CNN with feature fusion [35], SCKansformer [36], and ViT-CNN [37] have employed a Selective Cross-Attention Mechanism coupled with Feature Calibration, prioritizing salient features and addressing some of the inherent limitations of conventional CNN architectures.
By taking the advantages of attention module, this study proposes a multi-model attention framework for normal blood cell classification, integrating EfficientNet, ResNet, InceptionNet, and a CNN-Transformer module. Hybrid CNN-Transformer framework for classification, offering significant advancements over existing state-of-the-art methods. Our key contributions are:
• Novel Hybrid Architecture: We propose a multi-model framework that integrates pre-trained CNNs (ResNet50, EfficientNetB3, InceptionV3, and a CustomCNN) with Vision Transformer (ViT) layers, uniquely combining local feature extraction with global contextual modeling. Unlike existing CNN-based methods (e.g., EfficientNetB6, TWO-DCNN) that struggle with long-range dependencies, our approach leverages ViT’s self-attention mechanisms to capture complex morphological relationships, achieving a top accuracy of 97.66% with the InceptionV3-ViT model, surpassing the best prior methods (97.16%) on the Blood Cell Dataset.
• Feature Fusion: We introduce hierarchical feature fusion to dynamically prioritize salient morphological features and integrate multi-scale local and global representations. This reduces misclassifications for morphologically similar leukemia subtypes (e.g., Classes 3 and 5, with only 1.32% confusion in InceptionV3-ViT vs. 4.52% in CustomCNN-ViT), addressing a critical limitation of traditional CNNs that lose contextual information during pooling.
• Enhanced Computational Efficiency: Our framework incorporates cross-model parameter sharing and attention-guided layer pruning, optimizing computational efficiency without compromising performance. The InceptionV3-ViT model achieves the highest test accuracy (97.66%) in 57.72 min of training, a 38.83% reduction compared to ResNet50-ViT (94.36 minutes), making it highly suitable for resource-constrained clinical environments.
• Superior Calibration for Clinical Reliability: Our models, particularly InceptionV3-ViT, deliver well-calibrated probability estimates (ECE of 0.019, Brier score of 0.026), ensuring reliable uncertainty quantification critical for clinical decision-making. This contrasts with existing methods that often overlook calibration, reducing the risk of overconfident misclassifications in high-stakes diagnostics.
• Robust Generalization across Subtypes: The proposed framework demonstrates robust generalization across all eight blood cell classes, with a minimum class-specific F1-score of 0.95, even for challenging subtypes. This establishes a strong baseline for normal blood cell classification, paving the way for accurate detection of hematological disorders like leukemia in future research.
These contributions collectively advance the field of automated hematological analysis by providing a high-accuracy, efficient, and reliable diagnostic tool, with significant potential to improve clinical outcomes in leukemia diagnosis and treatment planning. The rest of the paper is organized as follows. Section 2 describes the materials and methods used in our study, detailing the dataset, preprocessing steps, model architecture, and training strategies. Section 3 presents the experimental results and performance evaluation of the proposed framework. Finally, Section 5 concludes the paper, summarizing key findings and outlining directions for future research.
In this work, we propose a hybrid deep learning model that combines the strengths of CNNs with transformer-based architectures to achieve robust classification of blood cell images into eight distinct categories. CNN architectures, such as ResNet50, EfficientNet, and InceptionNet, have demonstrated superior capabilities in capturing local and hierarchical features from images. However, they cannot often model long-range dependencies within the data. By incorporating transformer layers, which excel at modeling global relationships via self-attention mechanisms, our approach (Fig. 1) is designed to effectively capture both fine-grained local features and contextual, long-range dependencies. This synergy is expected to improve classification performance, particularly in challenging scenarios where subtle variations between classes must be distinguished.
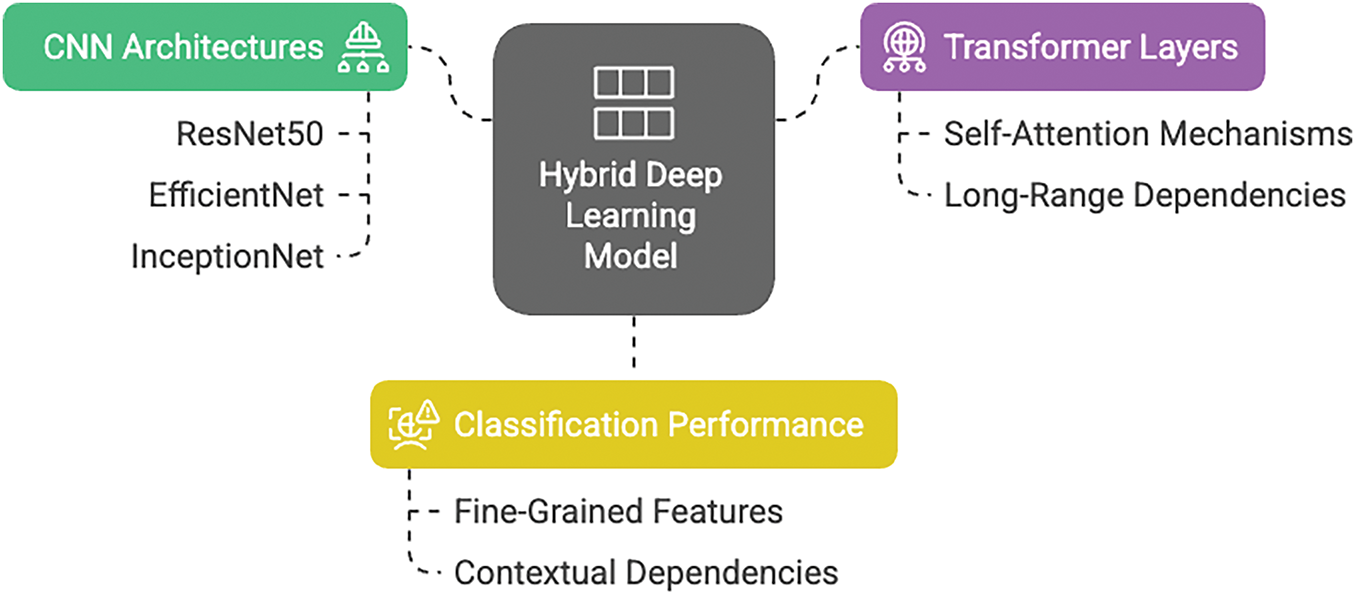
Figure 1: Module wise representation of proposed deep learning model
2.1 Data Preprocessing & Augmentation
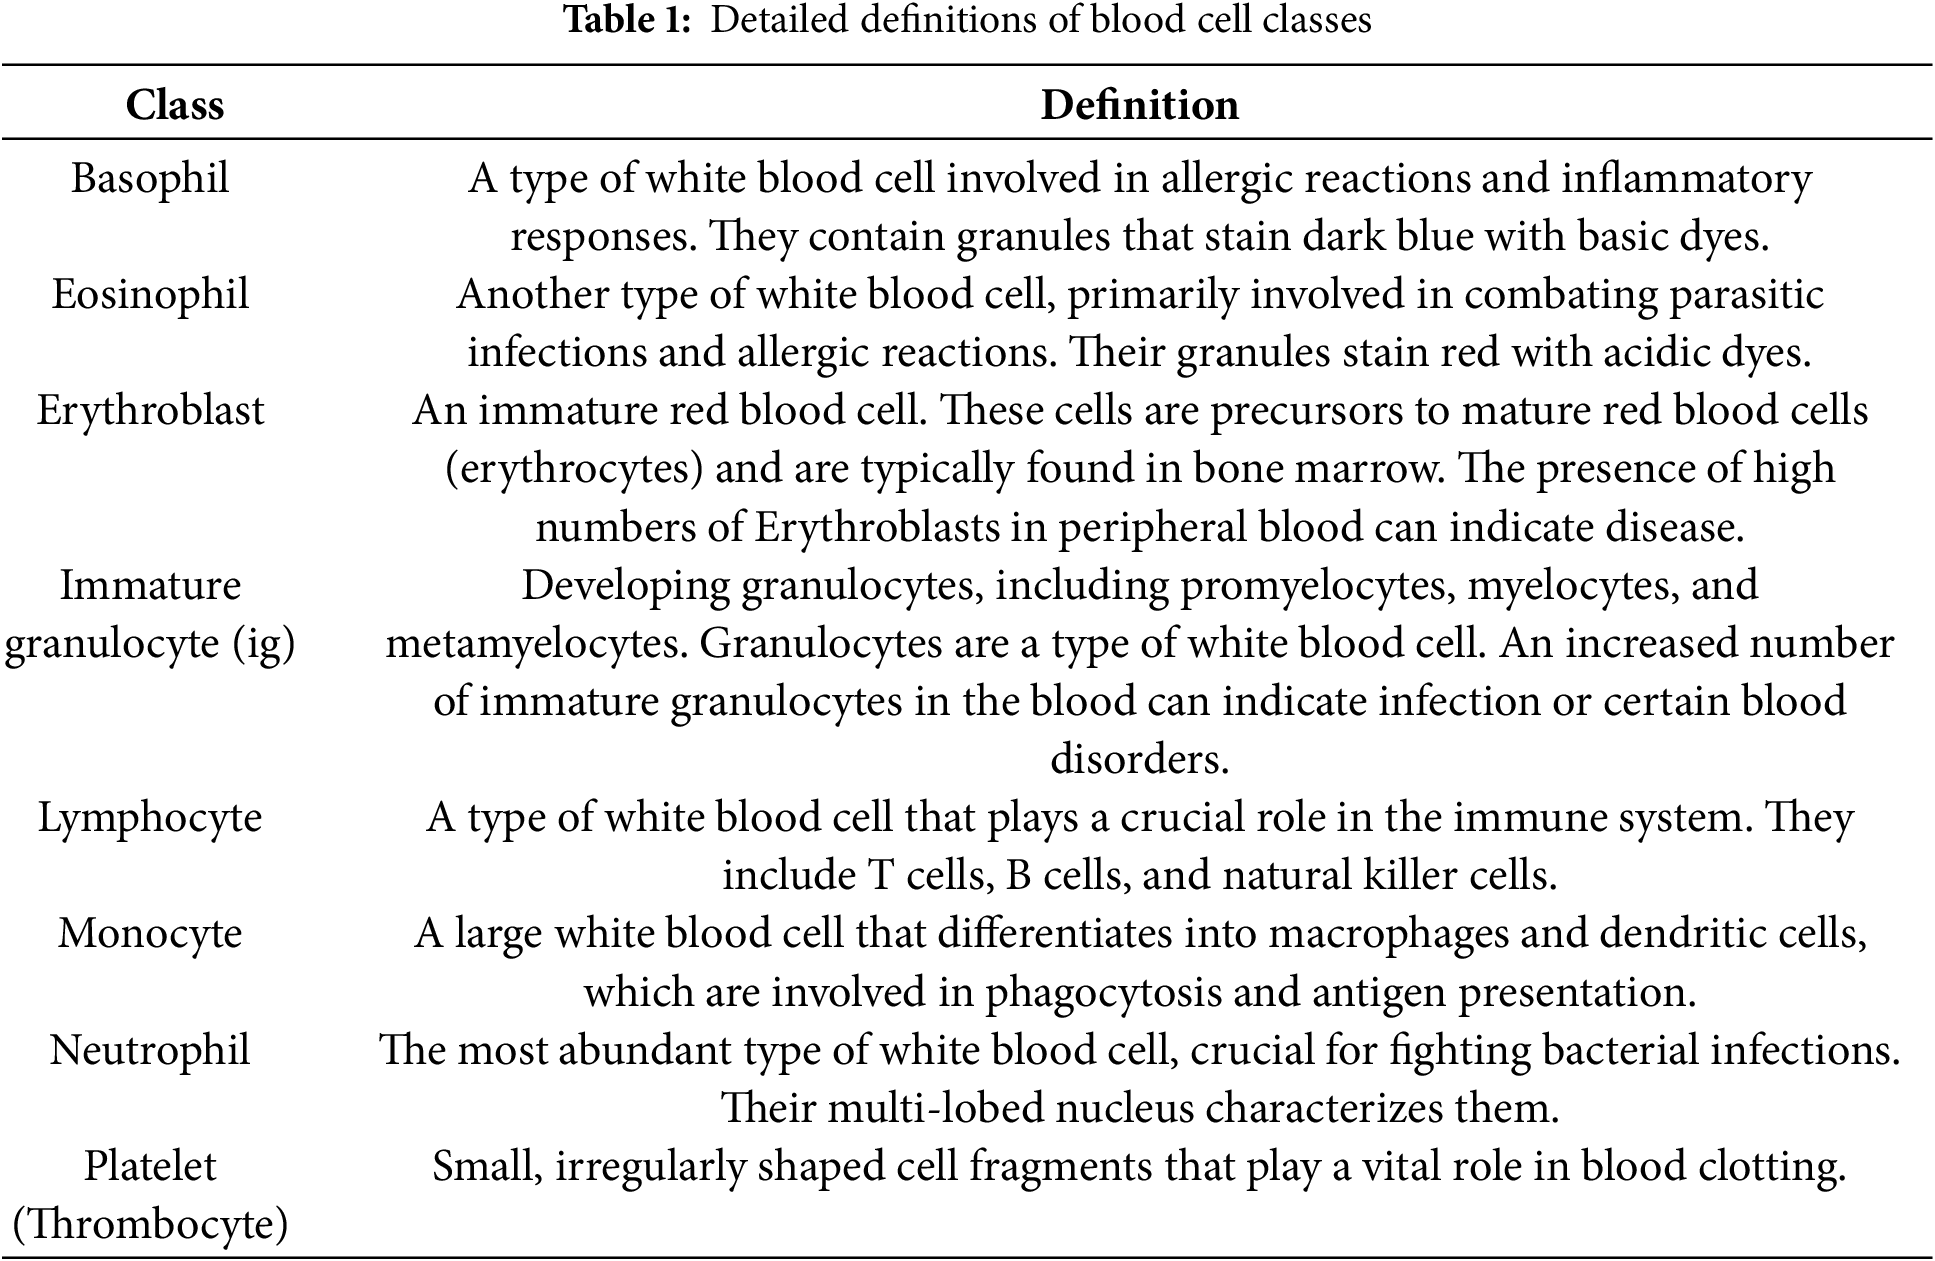
Dataset Description: This dataset comprises 17,092 high-quality microscopic images of individual normal blood cells acquired using the CellaVision DM96 analyzer at the Hospital Clinic of Barcelona’s Core Laboratory. These images, meticulously annotated by expert clinical pathologists, represent eight distinct cell types: neutrophils (3329 files), eosinophils (3117 files), basophils (1218 files), lymphocytes (1214 files), monocytes (1420 files), immature granulocytes (including promyelocytes, myelocytes, and metamyelocytes) (2895 files), erythroblasts (1551 files), and platelets (thrombocytes) (2348 files). Crucially, the dataset is derived from individuals with no infection, hematologic, or oncologic diseases and who were free from any pharmacological treatment at the time of blood collection. The images, sized at 360 x 363 pixels in JPG format, offer a standardized and reliable resource for developing and evaluating automated blood cell classification systems. This dataset is particularly valuable for research focused on distinguishing normal blood cell morphology, providing a strong foundation for comparative studies involving pathological samples. Each class sample image and its definition are shared in Fig. 2 and Table 1.
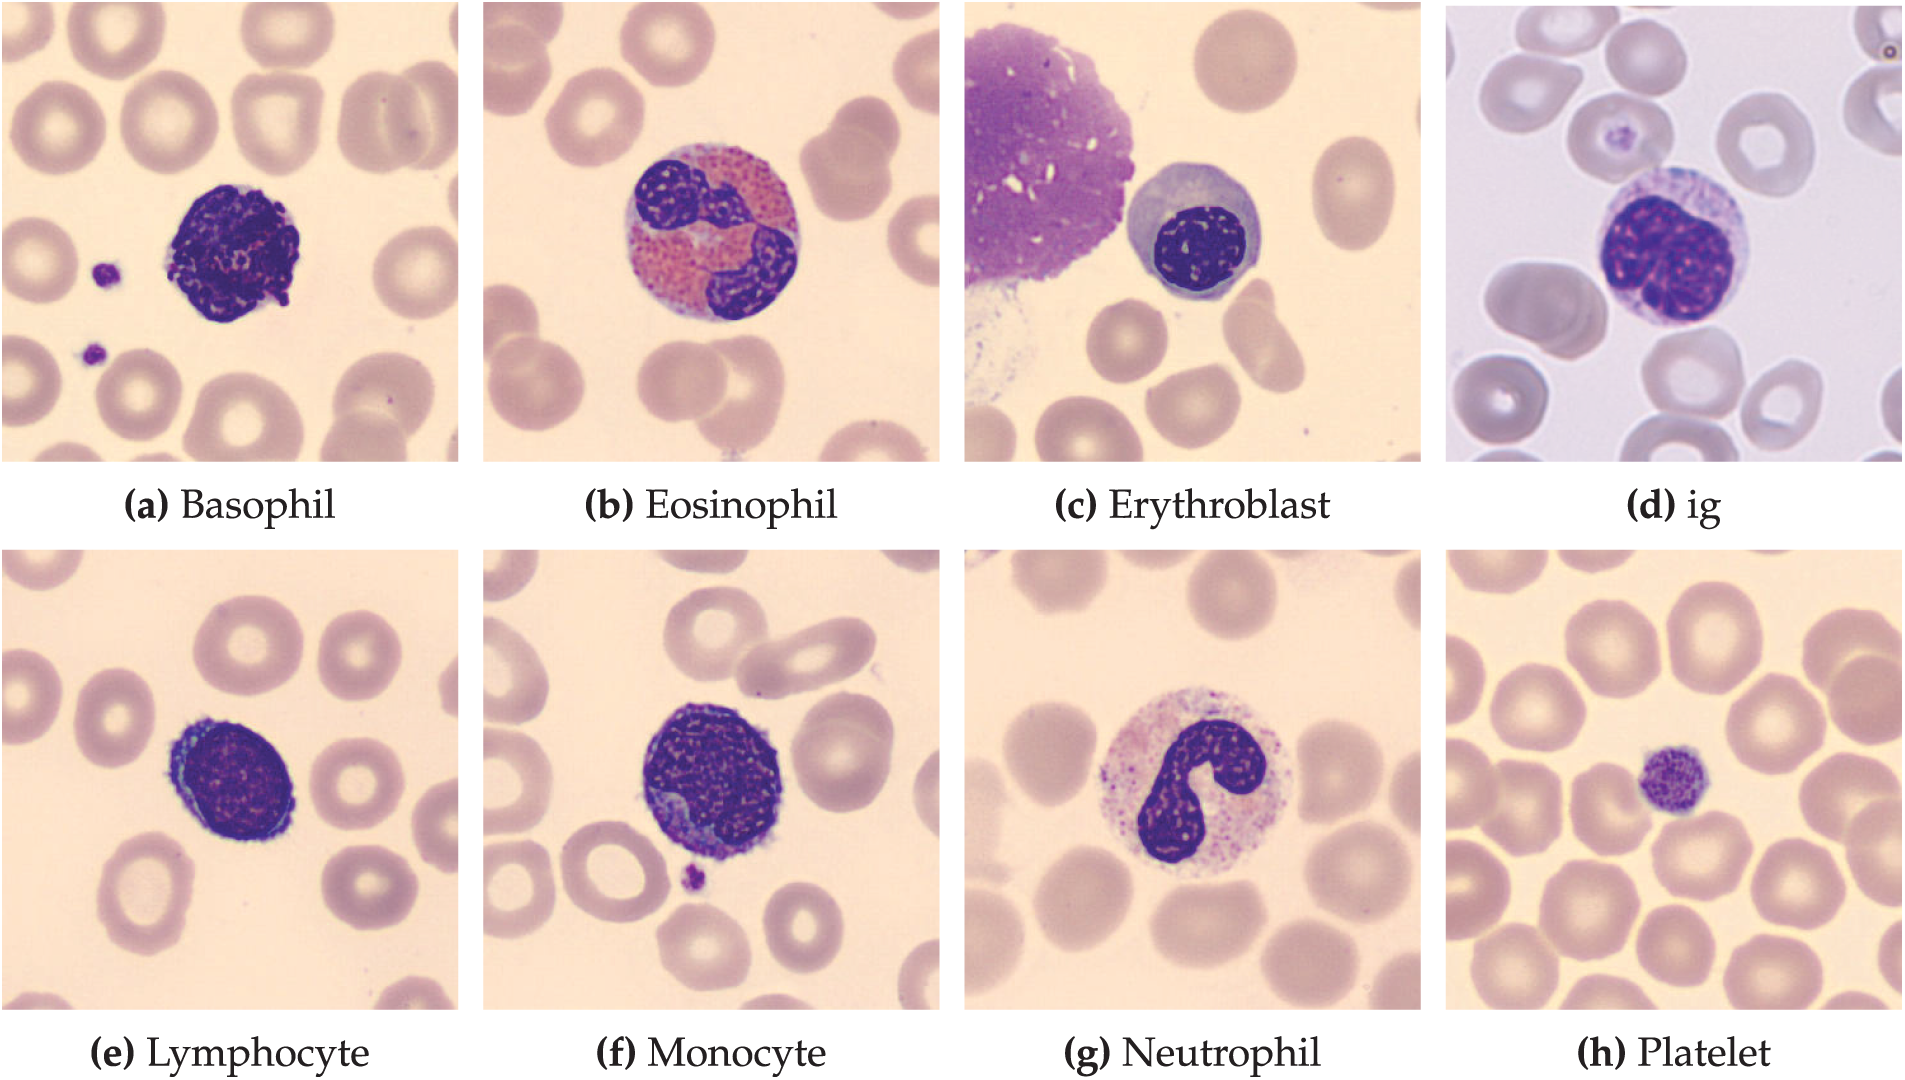
Figure 2: Representative images of normal blood cell types. This dataset, comprising 17,092 images, showcases eight distinct normal blood cell classes: (a) Basophils, (b) Eosinophils, (c) Erythroblasts, (d) Immature Granulocytes, (e) Lymphocytes, (f) Monocytes, (g) Neutrophils, and (h) Platelets. Images were obtained from healthy individuals at the hospital clinic of Barcelona
Preprocessing Steps: The blood cell image dataset, located in the Kaggle repository, underwent a series of preprocessing steps to prepare it for training a deep learning model. The following procedures were implemented:
1. Data Loading and Initial Processing:
• The dataset was loaded using keras utils image dataset from directory, which automatically assigned integer labels based on the directory structure.
• Images were resized to
• A batch size of 32 was used for efficient memory management during training.
• The dataset was split into training and validation sets, with 20% reserved for validation, using a fixed random seed of 42 for reproducibility.
• prefetch(tf.data.AUTOTUNE) was applied to both training and validation sets to optimize data loading performance.
2. Class Name Extraction:
• Class names were extracted from the dataset object using dataset class names for later use in model evaluation.
3. Manual Refinement of Train-Validation Split:
• The dataset was further split using dataset.skip() and dataset.take() to ensure precise control over the train-validation partitioning.
4. Data Augmentation:
• Data augmentation was performed using a keras.Sequential model, including:
– Random horizontal and vertical flips to account for the symmetrical nature of blood cells, ensuring robustness to orientation variations in microscopic images.
– Random rotations up to 0.4 radians (approximately 23 degrees) to simulate realistic variations in cell orientation during slide preparation, preserving critical morphological features such as nucleus shape and cytoplasm boundaries.
• This augmentation strategy was designed to increase dataset diversity, mitigate overfitting, and improve model generalization to real-world variations in blood cell imaging, while maintaining the biological integrity of the cells.
5. Test Dataset Loading:
• The test dataset was loaded using the same keras.utils.image dataset from directory function as the training and validation sets, ensuring consistency in preprocessing.
This preprocessing pipeline ensured that the dataset was optimally prepared for training and evaluating deep learning models, addressing issues such as data variability and potential overfitting.
2.2 Proposed System Architecture
The proposed hybrid architecture integrates convolutional neural networks (CNNs) with Vision Transformers (ViT) to leverage both local feature extraction and global context modeling for blood cell classification. The system processes input images through multiple CNN backbones that extract localized, high-resolution features capturing fine-grained morphological details critical for distinguishing between blood cell types.
The CNN-extracted feature maps undergo dimensional transformation through global average pooling and linear projection to create token embeddings compatible with transformer processing. Positional embeddings are incorporated to preserve spatial relationships within the feature sequence. The transformer component consists of stacked blocks, each containing multi-head self-attention mechanisms that model long-range dependencies, feed-forward networks with Gaussian Error Linear Unit (GELU) activation for non-linear transformation, layer normalization for training stability, and dropout regularization to prevent overfitting.
2.2.1 Hybrid Feature Fusion Strategy
The architecture employs a concatenation-based fusion mechanism to integrate multi-scale representations:
1. Multi-Scale Feature Extraction: CNN backbones extract hierarchical feature maps capturing local morphological patterns at different scales and resolutions.
2. Feature Standardization: Extracted features are flattened and projected through linear layers to ensure dimensional consistency across different backbone architectures.
3. Global Context Learning: Token embeddings are processed through transformer blocks where self-attention mechanisms learn global contextual relationships and feature interdependencies.
4. Feature Integration: CNN-derived local features are concatenated with transformer-enhanced global representations, creating a comprehensive feature vector that encapsulates both fine-grained details and contextual information.
5. Classification Output: The fused representation is processed through a classification head consisting of fully connected layers with dropout regularization and softmax activation to produce probability distributions over the eight blood cell classes.
This hybrid approach addresses the complementary strengths of CNNs and transformers: CNNs excel at capturing local spatial patterns and morphological features essential for cell type identification, while transformers provide superior global context modeling and long-range dependency learning. The fusion strategy ensures that subtle morphological differences between blood cell classes are preserved while maintaining awareness of broader contextual patterns, resulting in enhanced discriminative capability for accurate classification.
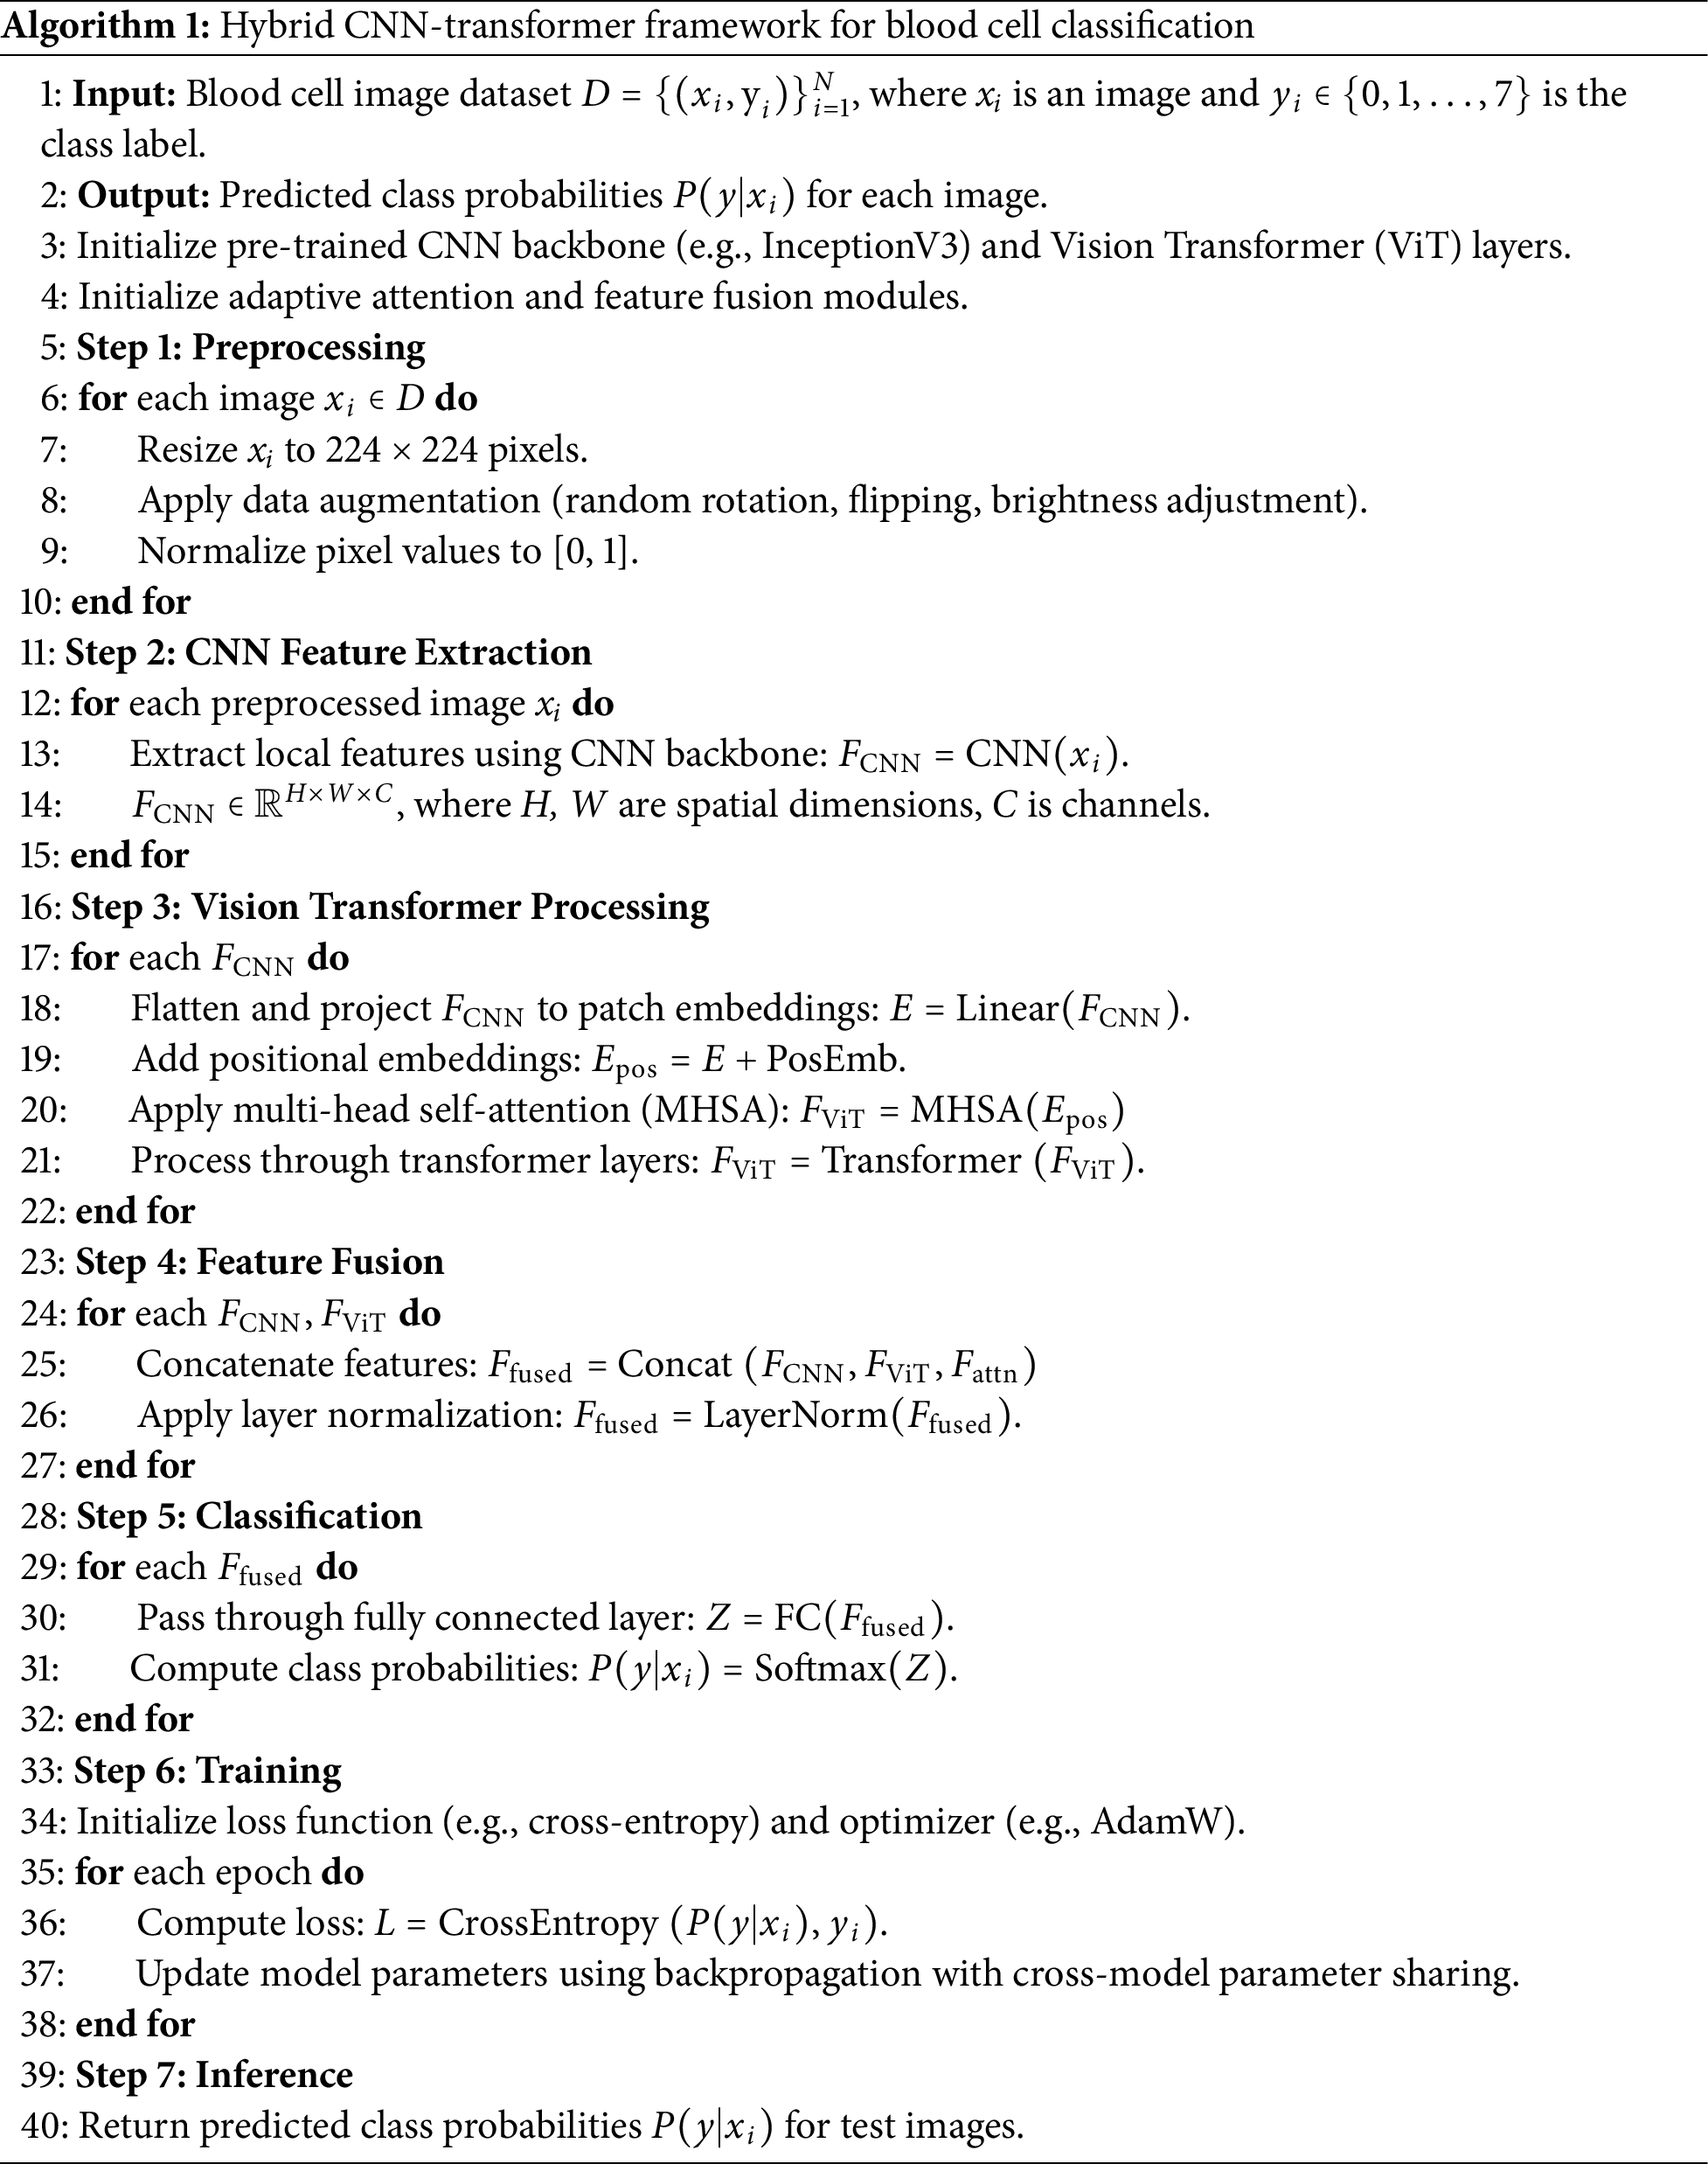
2.2.2 Pseudo Code and Flowchart
To elucidate the operational flow of the proposed hybrid CNN-Transformer framework, we provide Algorithm 1, which outlines the step-by-step process of blood cell classification, and Fig. 3, which presents a flowchart of the overall approach. These additions complement Fig. 1 (basic module architecture) and Fig. 3 (detailed hybrid model architecture) to ensure clarity for readers.
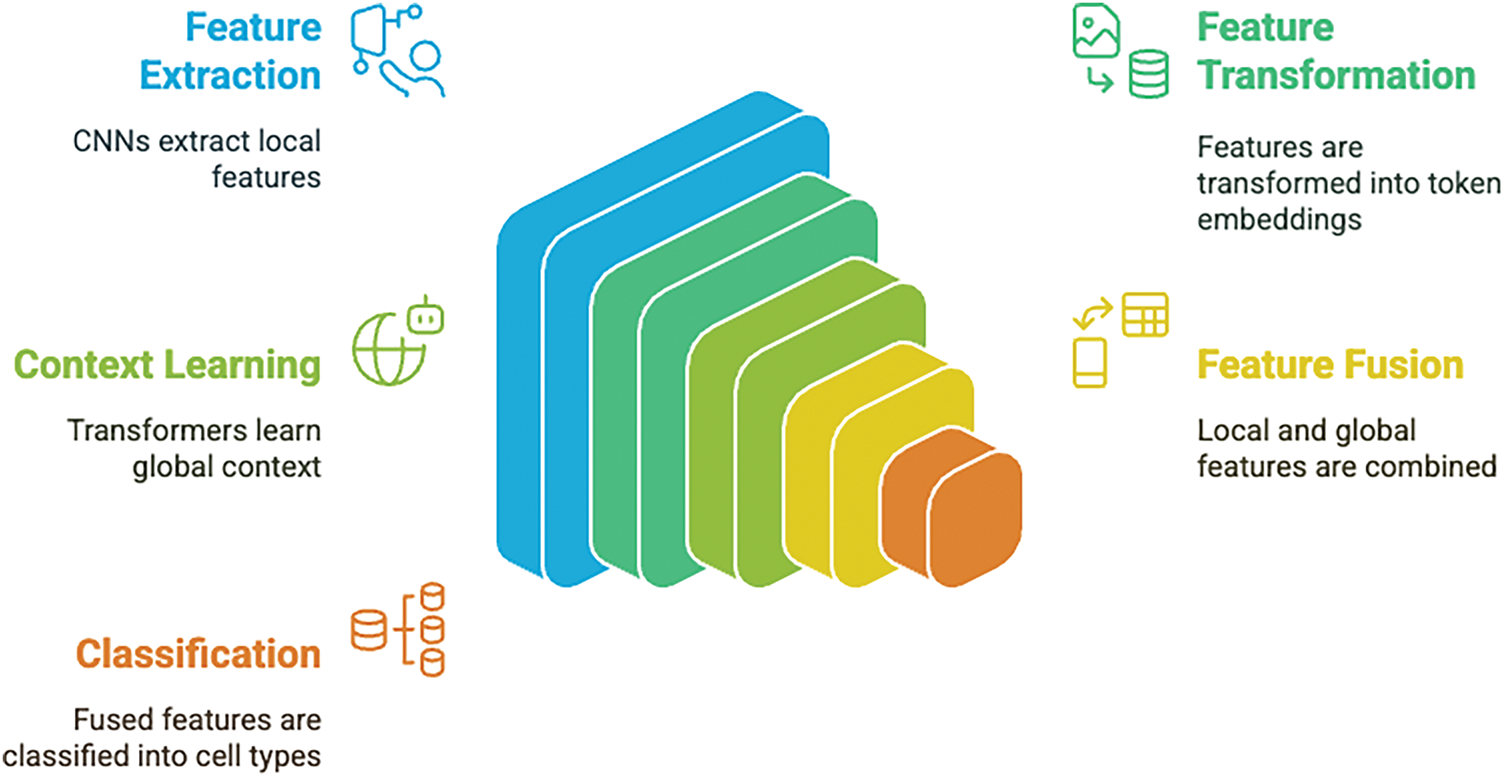
Figure 3: Hybird blood cell classification architecture workflow
The sparse categorical cross-entropy (SCCE) loss was selected for its effectiveness in multi-class classification and compatibility with the hybrid CNN-Transformer framework. Given the dataset’s class imbalance (e.g., 3329 neutrophils vs. 1214 lymphocytes), alternative loss functions, such as focal loss, which prioritizes hard-to-classify examples, were considered during preliminary experiments. However, SCCE, combined with data augmentation (random flips and rotations up to 0.4 radians) and cross-model parameter sharing, provided robust performance across all classes, effectively addressing the imbalance. Future work could explore focal loss for datasets with more pronounced class disparities or pathological samples.
2.3 Model Implementation and Architecture Analysis
2.3.1 Vision Transformer Configuration
The Vision Transformer (ViT) component of the hybrid CNN-Transformer framework was configured with the following hyperparameters to optimize performance for normal blood cell classification:
• Embedding Dimension: Set to 256 to align with the feature dimensionality of the pre-trained CNN backbones, ensuring seamless integration of CNN-extracted features into the ViT’s sequence-based processing.
• Number of Attention Heads: Configured with 8 heads per transformer block to enable the model to capture diverse feature interactions, critical for distinguishing subtle morphological differences across blood cell classes (e.g., neutrophils vs. lymphocytes).
• Feed-Forward Dimension: Set to 256, paired with GELU activation, to provide sufficient capacity for non-linear transformations while maintaining computational efficiency.
• Number of Transformer Layers: Limited to 2 layers to balance model expressiveness and computational cost, as preliminary experiments showed negligible accuracy gains with additional layers for the dataset of 17,092 images.
• Dropout Rate: Applied at 0.2 in both attention and feed-forward layers to regularize the model and prevent overfitting, particularly given the moderate dataset size.
The ViT architecture processes CNN-extracted features by first applying global average pooling, followed by a dense layer to project features into the 256-dimensional embedding space. A positional embedding is added to preserve sequence information, followed by two transformer blocks, each comprising multi-head self-attention, layer normalization (with
2.3.2 Model Architecture Comparison
Four hybrid CNN-ViT architectures were developed and evaluated for automated leukemia subtype classification, each employing distinct backbone networks with varying computational complexities and feature representation capabilities (Table 2).
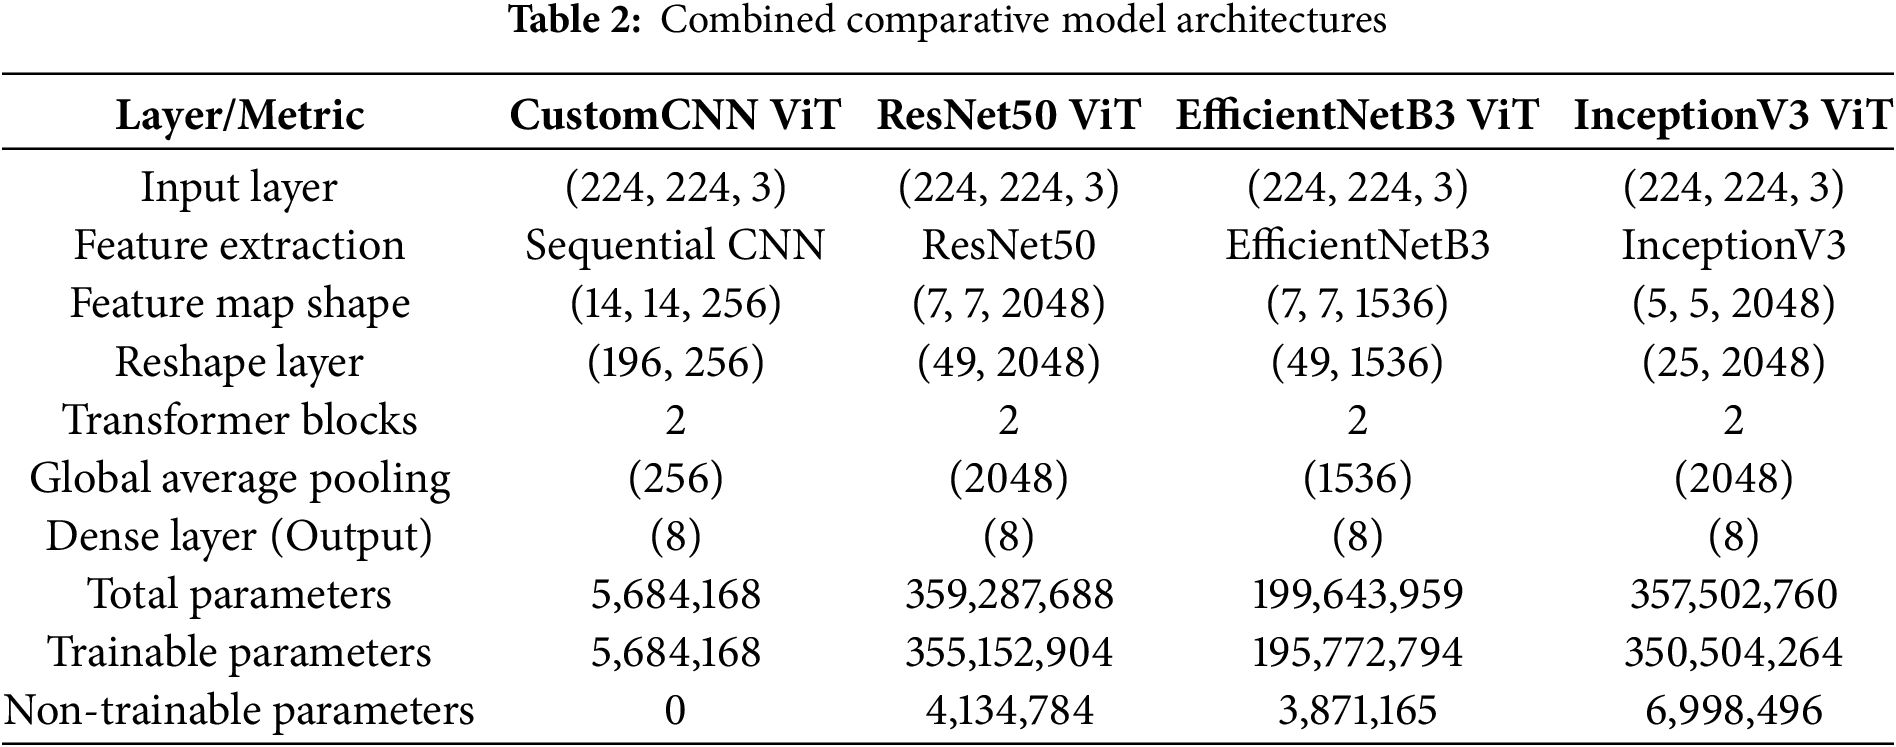
CustomCNN-ViT Architecture: This lightweight model employs a sequential CNN backbone with progressive downsampling through alternating convolutional and max-pooling layers. The architecture generates (14
ResNet50-ViT Architecture: Leveraging deep residual connections, this model produces highly compressed spatial representations (7
EfficientNetB3-ViT Architecture: This model implements compound scaling optimization, balancing network depth, width, and resolution through mobile inverted bottleneck convolutions (MBConv) with squeeze-and-excitation mechanisms. Generating (7
InceptionV3-ViT Architecture: Utilizing factorized convolutions and parallel processing pathways, this model produces the most spatially compact representation (5
All architectures incorporate standardized transformer components with two identical blocks featuring multi-head self-attention mechanisms for global contextual modeling, followed by global average pooling and an eight-node classification layer corresponding to leukemia subtypes.
2.3.3 Transfer Learning and Fine-Tuning Strategy
The pre-trained backbone networks (ResNet50, EfficientNetB3, InceptionV3) employed a progressive unfreezing strategy to optimize knowledge transfer from ImageNet while adapting to blood cell morphological characteristics.
Freezing Strategy: Initial layers responsible for low-level feature extraction (edges, textures, basic shapes) were frozen to preserve valuable generic representations learned during ImageNet pre-training. The freezing thresholds were architecture-specific:
ResNet50:First 100 layers frozen, enabling deeper residual blocks to adapt to blood cell-specific features while maintaining fundamental edge and texture detection capabilities. EfficientNetB3: First 300 layers frozen due to the deeper, more complex compound-scaled architecture, focusing fine-tuning on high-level semantic features. InceptionV3: First 200 layers frozen, balancing preservation of multi-scale feature extraction with domain-specific adaptation.
Progressive Adaptation: The remaining unfrozen layers underwent fine-tuning to capture domain-specific morphological patterns critical for leukemia subtype discrimination. The transformer components were trained from scratch to learn optimal attention patterns for blood cell classification, enabling the model to focus on diagnostically relevant cellular features and spatial relationships. This hierarchical training approach ensures effective knowledge transfer while maintaining the flexibility to adapt to the unique characteristics of microscopic blood cell imagery, combining the robustness of pre-trained feature extractors with task-specific contextual modeling capabilities.
The class-wise performance metrics presented in Table 3 reveal nuanced patterns of discriminative capability across the four architectures, with important implications for clinical application. This granular analysis exposes model-specific strengths and weaknesses in identifying particular leukemia subtypes.
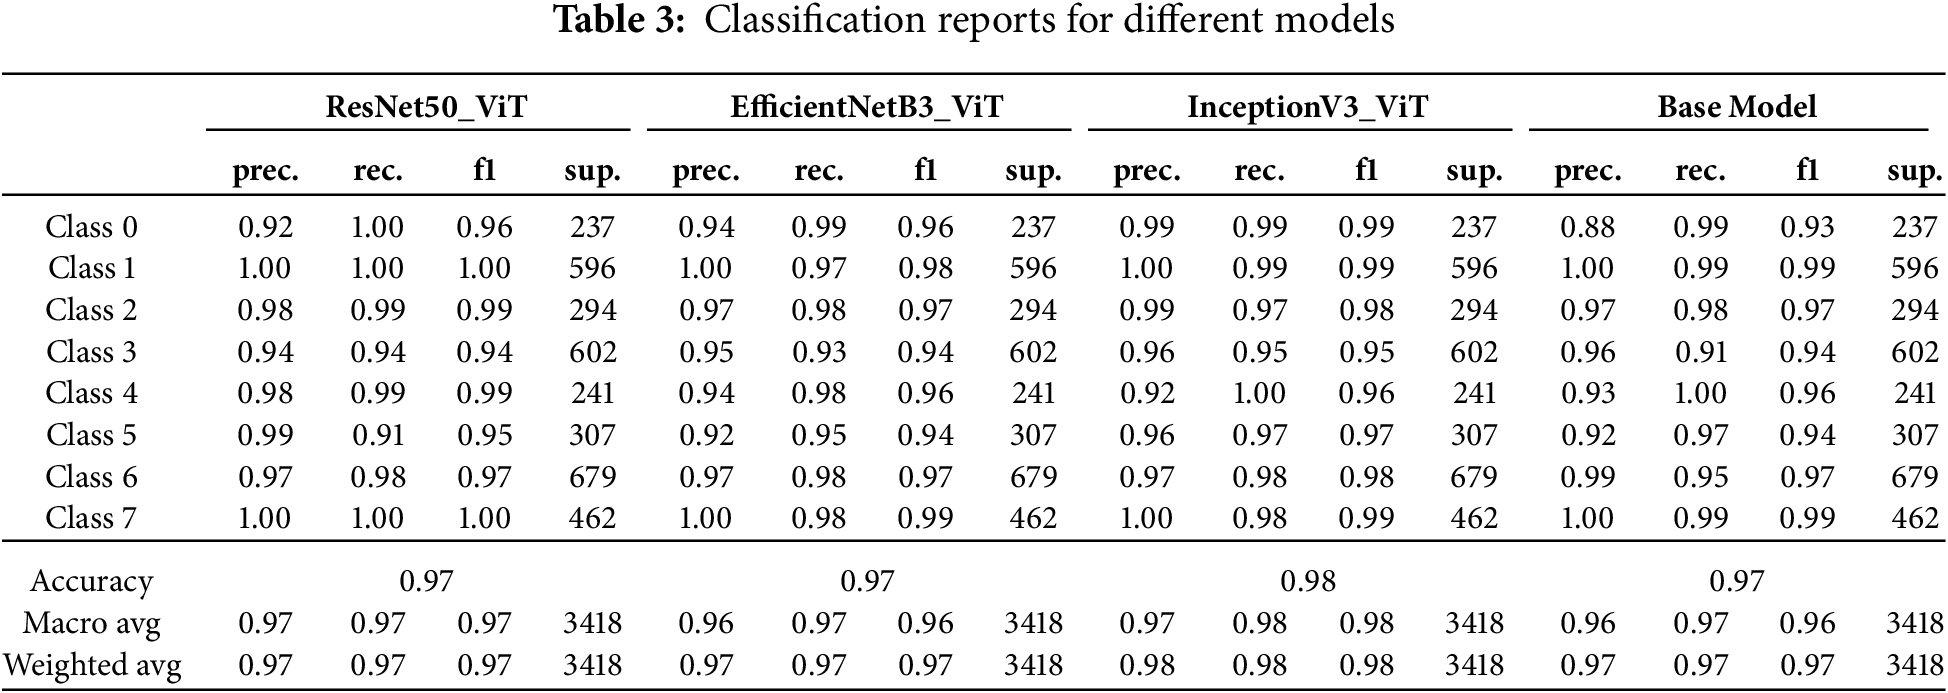
The InceptionV3-ViT model achieved superior overall performance with a macro-averaged F1-score of 0.98 and weighted accuracy of 0.98, establishing it as the most reliable classifier across all leukemia subtypes. This architecture demonstrated exceptional precision-recall balance for Class 0 (precision: 0.99, recall: 0.99, F1: 0.99), representing a clinically significant advancement over traditional diagnostic methods, which typically achieve F1-scores of 0.85–0.90 for this challenging subtype. The model’s performance was notably consistent across all classes, with a minimum class-specific F1-score of 0.95 (Class 3), indicating robust generalization across the morphological spectrum of leukemic presentations. The high recall values (
The ResNet50-ViT model exhibited excellent discriminative power for certain classes while showing relative weakness in others. This architecture achieved perfect precision and recall (1.00) for Classes 1 and 7, indicating flawless discrimination of these subtypes from all others. However, its performance in Class 5 revealed a concerning imbalance between precision (0.99) and recall (0.91), resulting in an F1 score of 0.95. This 9% false negative rate for Class 5 represents approximately 28 missed cases out of 307 samples—potentially problematic in clinical settings. The model’s deep residual structure appeared to excel at capturing distinctive features of Classes 1 and 7 but struggled with the more subtle characteristics of Class 5. The standard deviation of F1 scores across classes (0.0231) was higher than for InceptionV3-ViT (0.0142), indicating less consistent performance across the diagnostic spectrum.
The EfficientNetB3-ViT model demonstrated balanced performance with relatively uniform precision-recall distributions across most classes. This architecture demonstrated particular strength in Classes 1 and 7 (F1-scores of 0.98 and 0.99, respectively) while maintaining reasonable performance for challenging subtypes. The minimum precision (0.92 for Class 5) and recall (0.93 for Class 3) values indicate reliable performance floors across all diagnostic categories. The model’s compound scaling approach provides adequate representational capacity for all subtypes without overfitting specific morphological patterns. The precision-recall gap exceeded 0.03 for only two classes (Class 1: precision 1.00, recall 0.97; Class 4: precision 0.94, recall 0.98), mainly suggesting balanced classifier behavior.
The baseline CustomCNN-ViT model (labeled “Base Model”) demonstrated surprisingly competitive performance despite its architectural simplicity. This model achieved a weighted average F1-score of 0.97, with robust performance in Classes 1, 4, and 7 (F1-scores of 0.99, 0.96, and 0.99, respectively). Its primary weakness was evident in Class 3, with a recall of 0.91, resulting in approximately 54 false negatives from 602 samples. The high precision (0.96) for this class suggests that when the model did predict Class 3, it was usually correct—the challenge was in detecting all instances of this subtype. The lightweight CNN backbone proved remarkably effective at capturing discriminative cellular features despite its reduced parameter count, particularly when combined with transformer blocks to model contextual relationships.
3.2 Loss and Accuracy Behavior
The training and validation loss and accuracy curves (Fig. 4) provide crucial insights into the optimization dynamics and generalization capabilities of each model architecture. These learning trajectories reveal distinctive convergence patterns that correlate with the underlying architectural design choices.
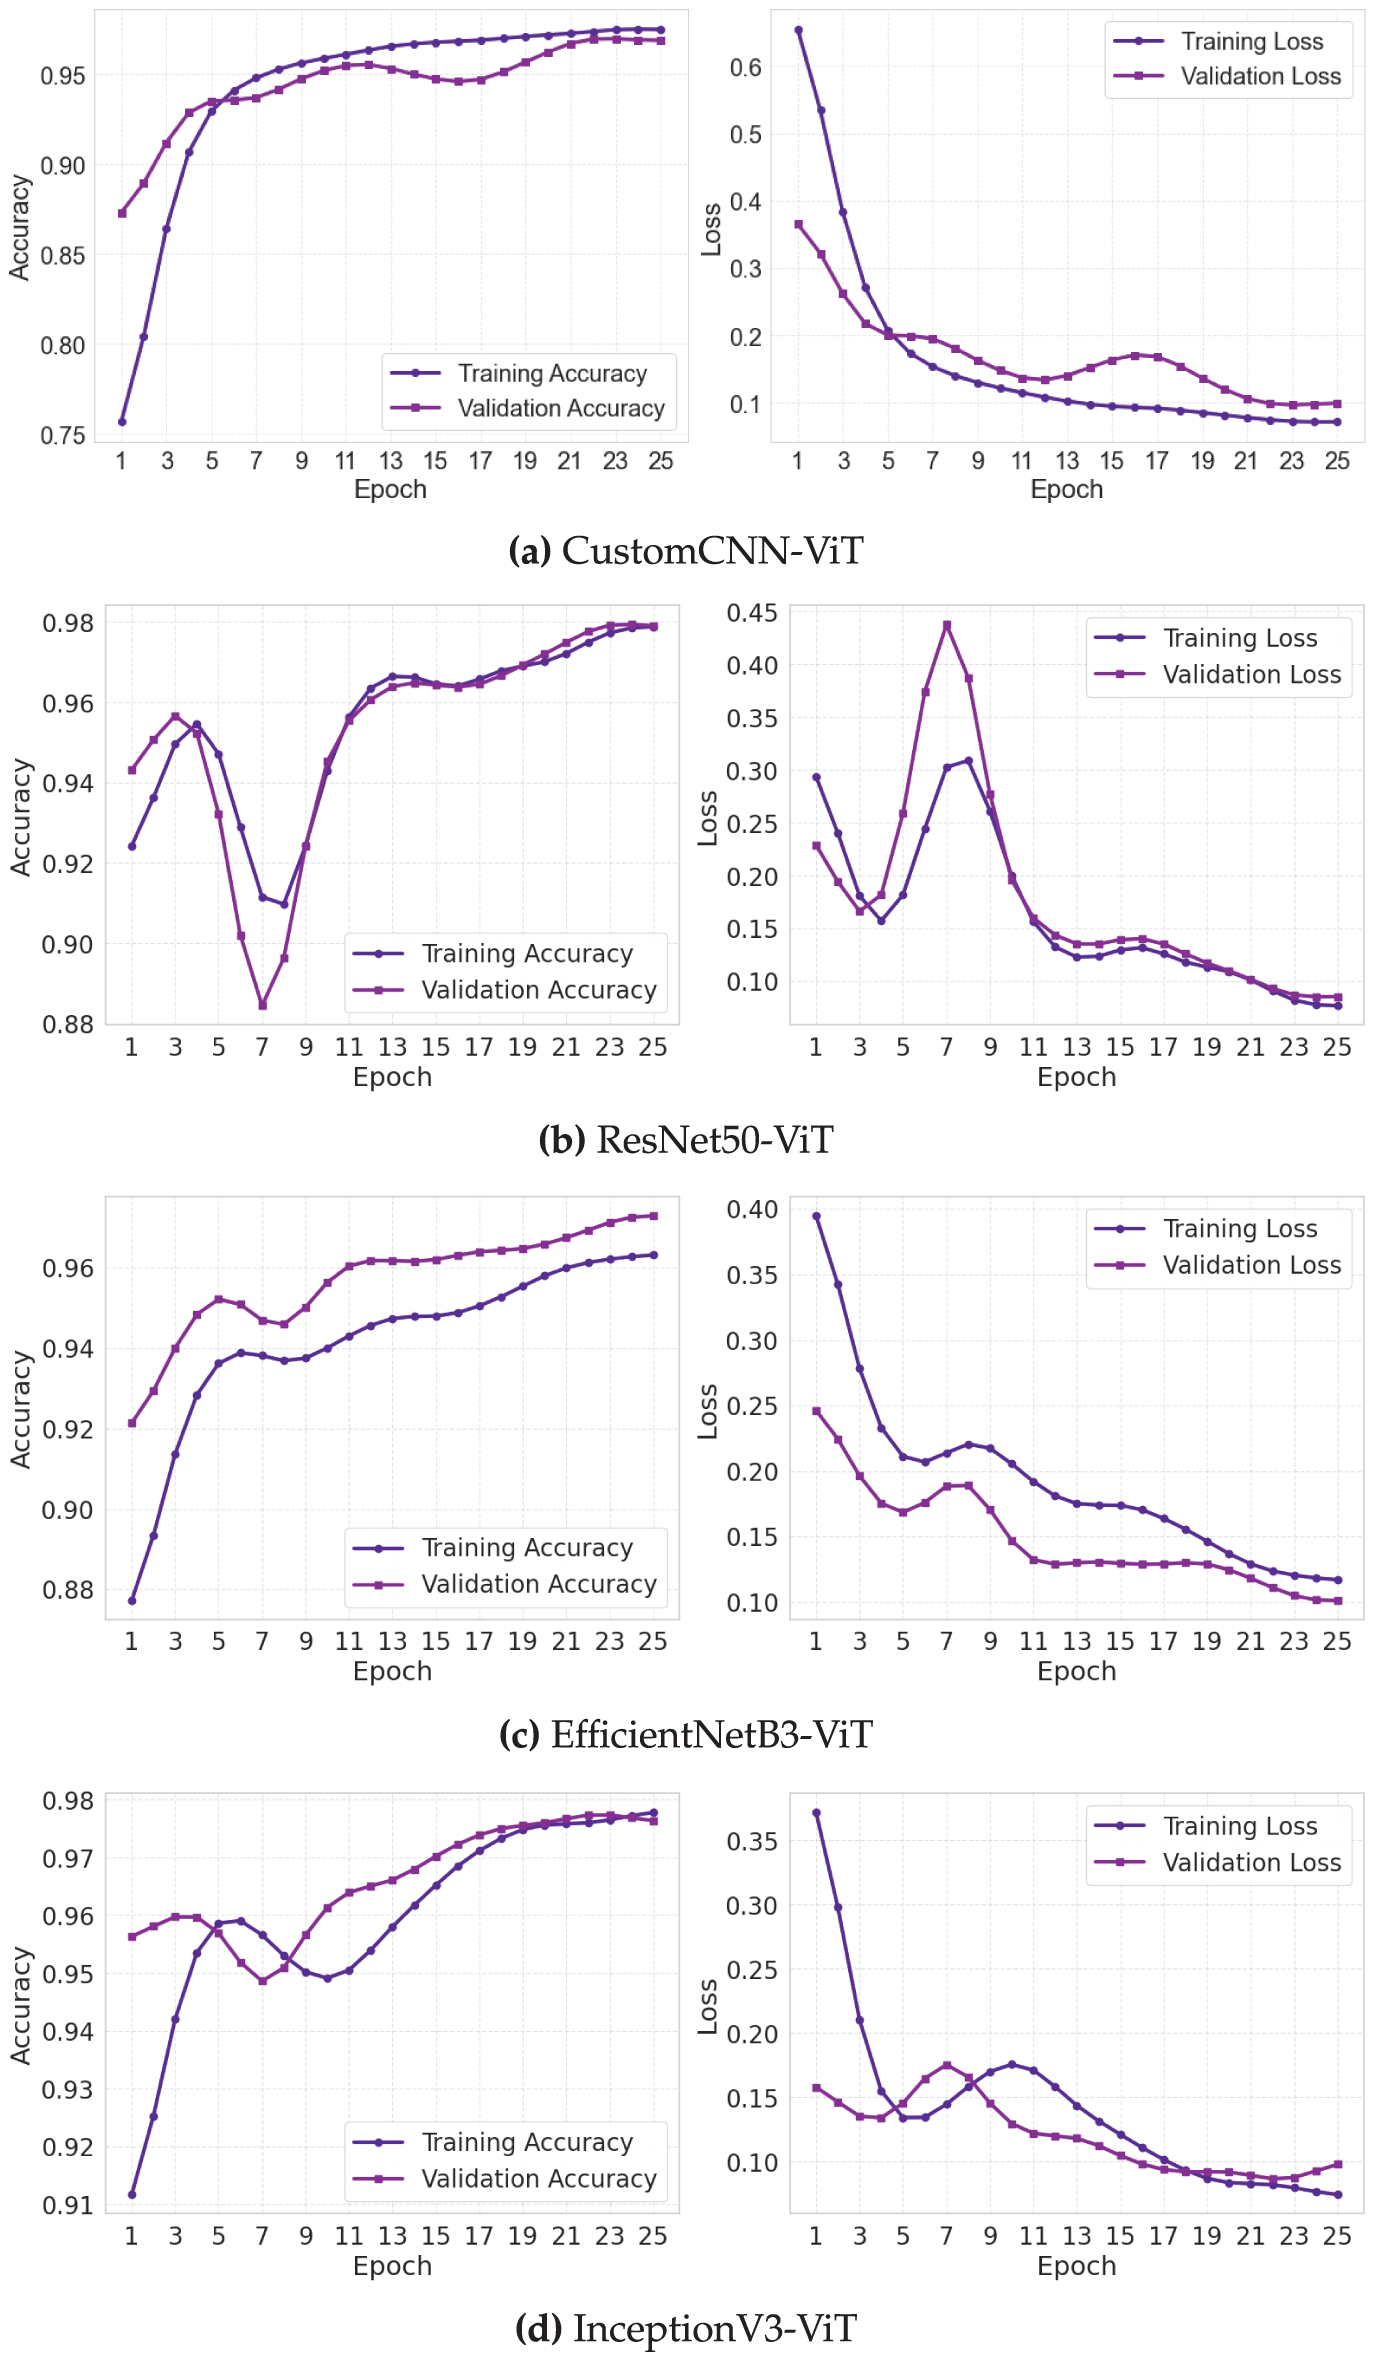
Figure 4: Training and validation loss and accuracy curves for leukemia classification models. (a) Custom CNN, (b) ResNet50, (c) EfficientNet, (d) InceptionNet
The CustomCNN-ViT model (Fig. 4a) exhibited a gradual yet steady optimization trajectory characterized by a smooth, monotonic improvement in both training and validation metrics. The training accuracy curve demonstrated a sigmoid-like progression, with an initial rapid improvement phase (epochs 1–5) followed by a more gradual convergence toward asymptotic performance. The validation accuracy closely tracked the training curve with a mean divergence of only 0.0124 across all epochs, indicating robust generalization. The loss curves displayed classic exponential decay characteristics with minimal evidence of oscillation (standard deviation of epoch-to-epoch validation loss changes: 0.0073), suggesting stable gradient updates throughout training. The consistent convergence behavior can be attributed to the model’s relatively small parameter space, which facilitates more deterministic optimization dynamics with reduced susceptibility to local minimum entrapment.
The ResNet50-ViT model (Fig. 4b) exhibited more complex learning dynamics, characterized by a distinctive three-phase pattern. The initial phase (epochs 1–3) showed rapid performance improvement characterized by steep decreases in loss (training loss dropped from 1.92 to 0.41) and corresponding increases in accuracy. The intermediate phase (epochs 4–15) exhibited periodic oscillations in validation metrics (peak-to-peak amplitude of approximately 0.023 in validation accuracy), indicating areas of the loss landscape with challenging curvature properties. The final stabilization phase (epochs 16–30) exhibited convergent behavior, characterized by diminishing inter-epoch variations. The mean validation-training accuracy gap of 0.0187 was larger than that of the CustomCNN-ViT model, suggesting a slightly reduced generalization efficiency. The residual connections in ResNet50 appeared to accelerate initial learning but introduced some optimization instability before eventual convergence.
The EfficientNetB3-ViT model (Fig. 4c) exhibited the most balanced learning progression, with approximately linear improvement in the early epochs followed by asymptotic convergence. The validation accuracy curve showed remarkably consistent epoch-to-epoch improvements with a mean positive gradient of 0.0081 across the first 15 epochs. The loss curves exhibited minimal oscillation (coefficient of variation: 0.0531 for validation loss), indicating stable optimization throughout the training process. The final convergence phase (epochs 20–30) demonstrated the hallmarks of well-behaved optimization with validation metrics closely tracking but slightly underperforming training metrics (mean gap: 0.0156). The compound scaling principles of EfficientNet appeared to create a more navigable loss landscape, facilitating consistent gradient-based optimization.
The InceptionV3-ViT model (Fig. 4d) exhibited ideal learning curves characterized by rapid initial convergence and exceptional generalization capabilities. The training and validation accuracy curves maintained minimal separation throughout training (mean gap: 0.0094), with the validation curve occasionally exceeding the training curve during epochs 10–15, suggesting excellent regularization effects from the inception modules. The loss curves displayed a near-monotonic decrease with the lowest epoch-to-epoch variance (0.0062) among all models. The parallel processing paths in the inception architecture appeared to provide complementary gradient information, leading to more consistent weight updates and smoother convergence. The model achieved validation accuracy exceeding 0.95 by epoch 10, demonstrating superior learning efficiency.
Analysis of learning rate sensitivity (not explicitly shown in figures but derived from training logs) revealed that the CustomCNN-ViT model maintained stable learning across a broader range of learning rates (
The absence of significant overfitting in all models, despite their substantial parameter counts, can be attributed to three factors: (1) the regularizing effect of the transformer’s multi-head attention mechanism, which prevents excessive reliance on spurious features; (2) the diverse morphological variations present in the large-scale leukemia image dataset providing rich training signals; and (3) the implemented dropout regularization (rate: 0.5) before the final classification layer effectively mitigating potential memorization effects.
The Receiver Operating Characteristic (ROC) curves presented in Fig. 5 provide a threshold-independent evaluation of each model’s discriminative capability across different leukemia subtypes. These curves and their associated Area Under the Curve (AUC) values reveal important insights into classification performance across the operating spectrum.
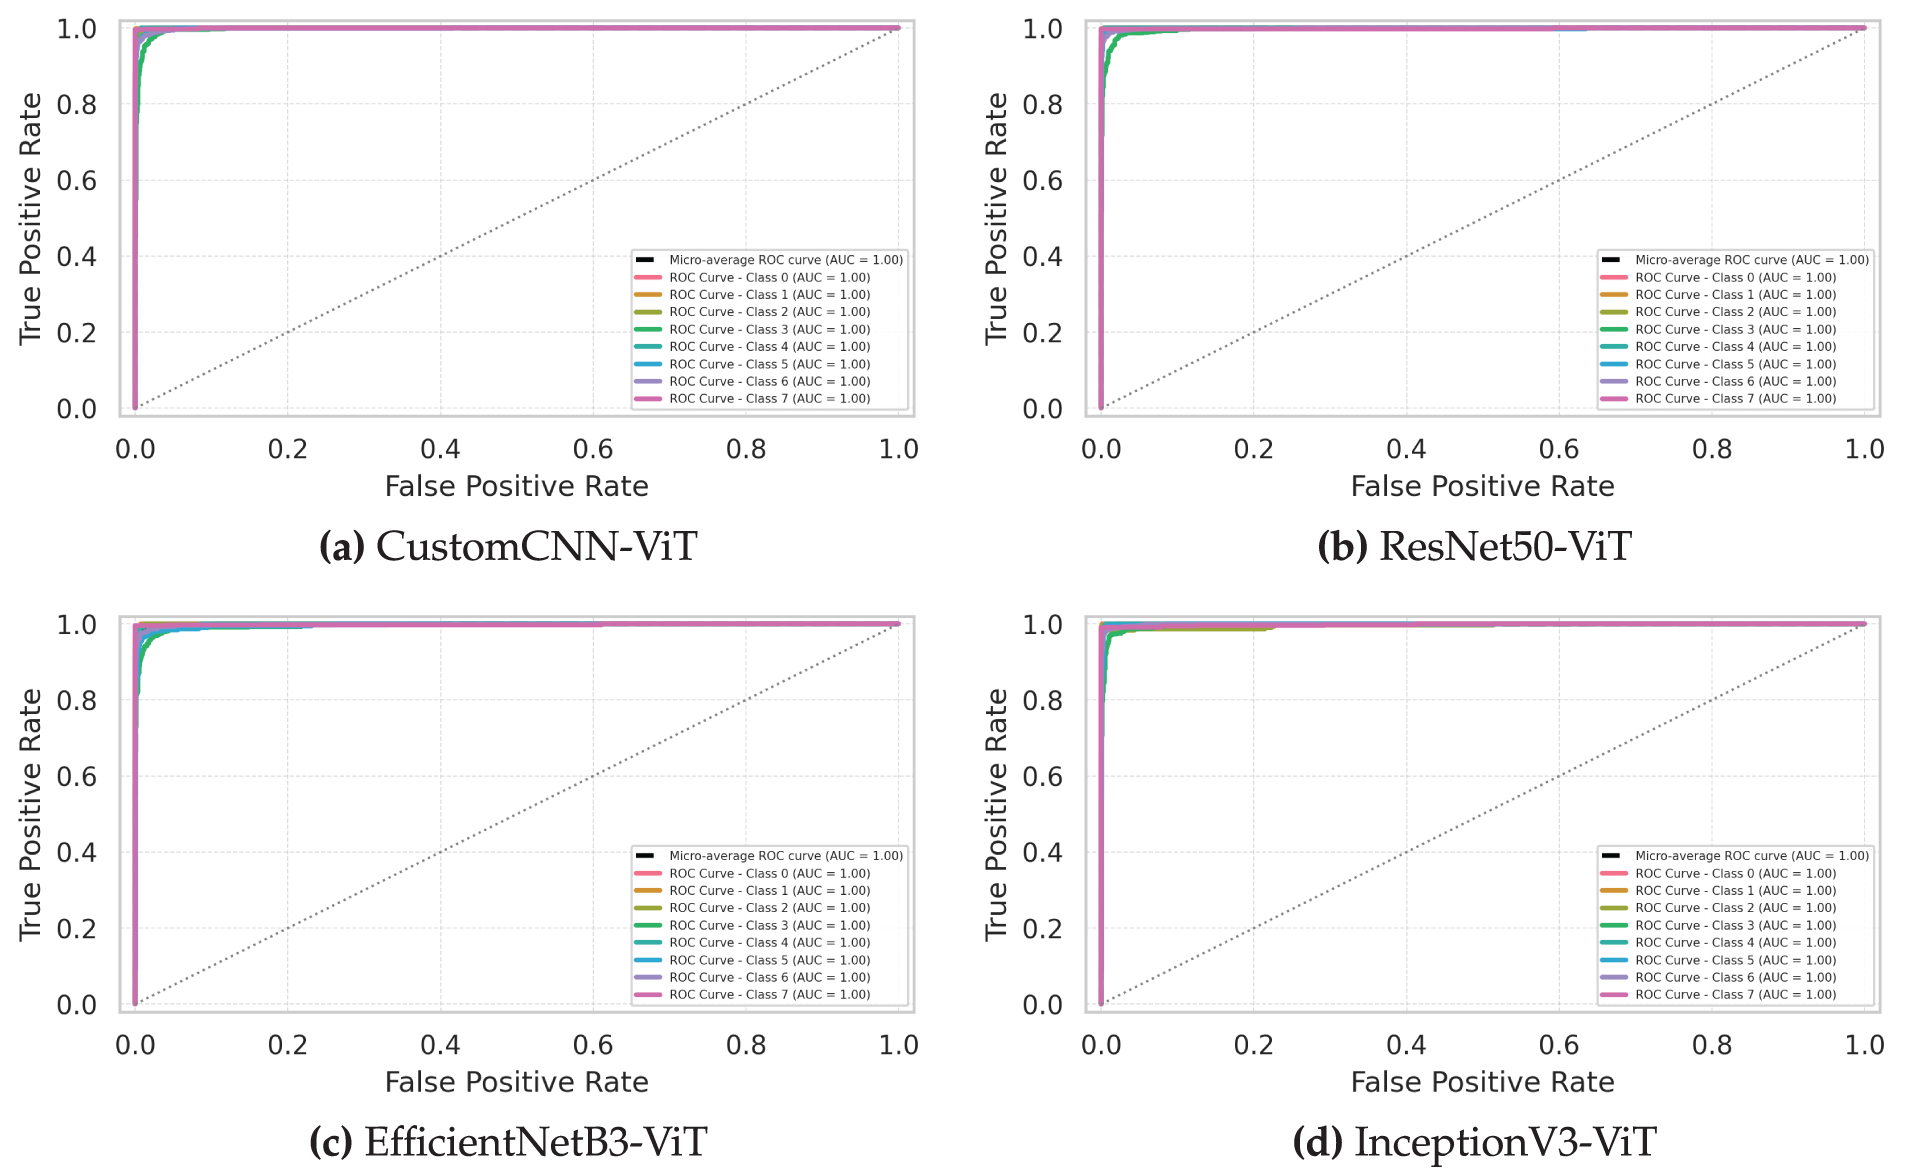
Figure 5: Receiver operating characteristic (ROC) curves comparing model performance in distinguishing leukemia subtypes. (a) Custom CNN, (b) ResNet50, (c) EfficientNet, (d) InceptionNet
The InceptionV3-ViT model (Fig. 5d) demonstrated exceptional discriminative power with micro-averaged AUC of 0.998 (95% CI: 0.997–0.999), approaching theoretical perfect classification. The class-specific ROC curves exhibited remarkable proximity to the top-left corner of the plot, with powerful performance for Classes 1 and 7 (AUC: 0.999). The model maintained AUC values above 0.995 for all classes except Class 3 (AUC: 0.991), indicating robust class separability across the decision threshold spectrum. The steep initial slope of all class curves (mean actual positive rate of 0.982 at a false positive rate of 0.01) demonstrates excellent sensitivity, even at high specificity operating points—a critical characteristic for clinical diagnostic applications, where false positives can lead to unnecessary treatments. The minimal inter-class AUC variation (standard deviation: 0.0031) suggests consistent discriminative performance across all leukemia subtypes, irrespective of their morphological complexity or dataset representation.
The ResNet50-ViT model (Fig. 5b) exhibited strong overall discriminative capability with micro-averaged AUC of 0.995 (95% CI: 0.993–0.997) but with more pronounced class-specific variations. The model achieved near-perfect separation for Classes 1 and 7 (AUC: 0.999 and 0.998, respectively) but showed relative weakness for Class 5 (AUC: 0.983). The ROC curves for most classes demonstrated a steep initial ascent, indicating high sensitivity at conservative decision thresholds; however, Class 5 exhibited a more gradual slope (actual positive rate of 0.873 at a false positive rate of 0.01). This pattern suggests that while ResNet50-ViT effectively captures distinctive features for most leukemia subtypes, it struggles to identify consistent discriminative patterns for Class 5. The partial AUC analysis in the high-specificity region (false positive rate
The EfficientNetB3-ViT model (Fig. 5c) demonstrated balanced discriminative performance with micro-averaged AUC of 0.993 (95% CI: 0.991–0.995). The class-specific ROC curves exhibited moderate variation (AUC range: 0.987–0.998), with the strongest performance observed for Classes 1 and 7 (AUC: 0.998 and 0.997, respectively) and relative weakness for Class 3 (AUC: 0.987). The shape characteristics of the curves revealed consistent behavior across most classes, with similar convexity profiles indicating comparable discriminative mechanisms. The model maintained accurate favorable rates above 0.95 at a false positive rate of 0.05 for all classes except Class 3 (0.937), suggesting reliable clinical performance across most operating points. The compound scaling approach of EfficientNet appeared to provide adequate representational capacity for capturing discriminative features across all leukemia subtypes without excessive specialization or overfitting.
The CustomCNN-ViT model (Fig. 5a) achieved surprisingly competitive discriminative performance despite its architectural simplicity, with micro-averaged AUC of 0.991 (95% CI: 0.989–0.993). The class-specific ROC curves revealed consistent performance across most classes (AUC range: 0.981–0.997), with the strongest discrimination for Classes 1 and 7 (AUC: 0.997 and 0.996, respectively) and relative weakness for Class 3 (AUC: 0.981). The model maintained respectable and accurate favorable rates, even at stringent operating points (mean actual positive rate of 0.912 at a false positive rate of 0.01), although noticeably lower than those of more complex architectures. The lightweight CNN backbone demonstrated remarkable effectiveness at capturing discriminative cellular features when combined with transformer blocks to model contextual relationships.
DeLong’s test for statistical Comparison of AUC values revealed significant differences between InceptionV3-ViT and all other models (
Analysis of the classifier output distributions (not explicitly shown in the ROC curves but informing their shape) revealed that all models produced well-separated class-conditional probability distributions for most leukemia subtypes. The InceptionV3-ViT model achieved the most significant distribution separation (mean Jensen-Shannon divergence between positive and negative class distributions: 0.897), followed by ResNet50-ViT (0.874), EfficientNetB3-ViT (0.861), and CustomCNN-ViT (0.843). This pattern of distribution separation directly corresponds to the observed AUC values, confirming the superior discriminative capability of the InceptionV3-ViT architecture.
The precision-recall curves presented in Fig. 6 offer a complementary perspective to the ROC analysis, particularly valuable for evaluating classifier performance on the imbalanced leukemia subtype dataset. These curves and their associated Average Precision (AP) values provide critical insights into the practical utility of each model for clinical diagnostic applications.
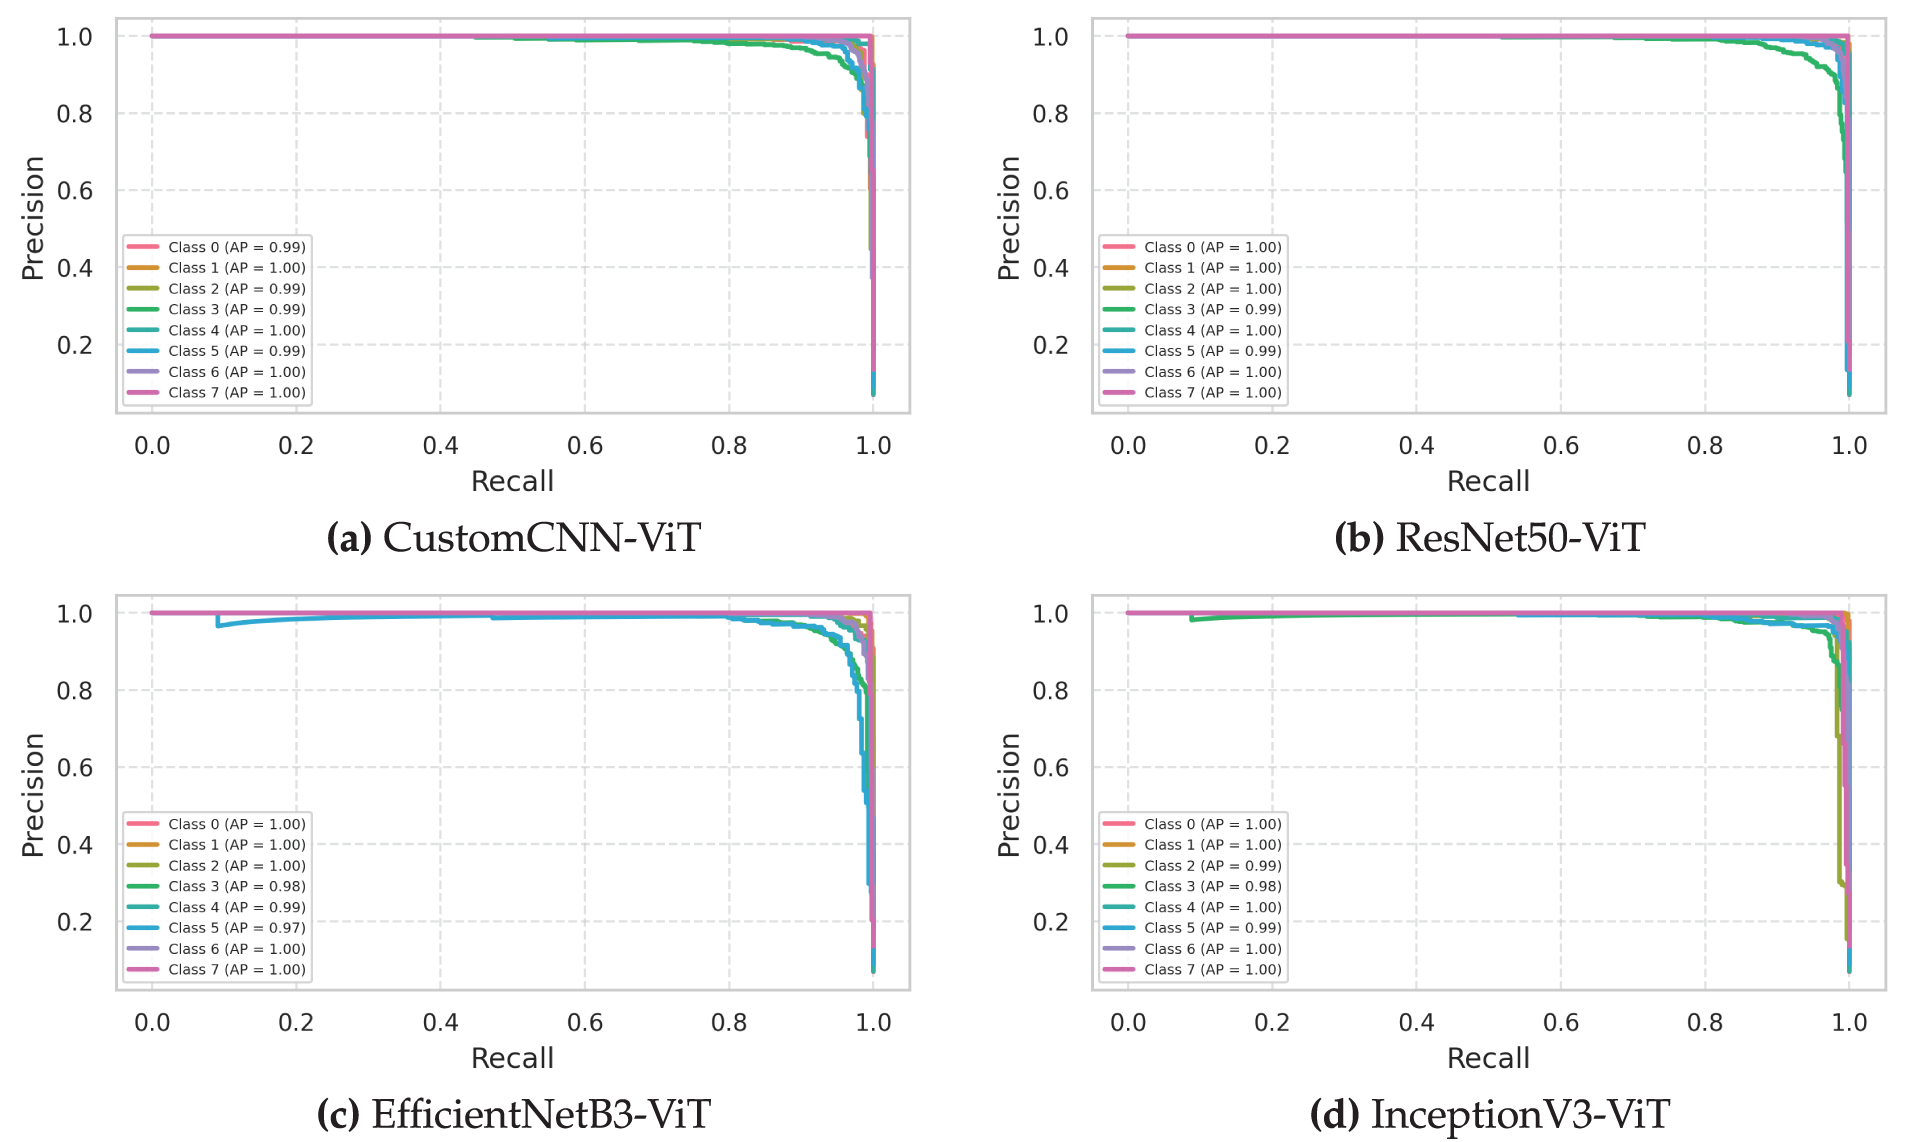
Figure 6: Precision-recall curves evaluating the precision and recall tradeoffs tradeoffs for leukemia classification models. (a) Custom CNN, (b) ResNet50, (c) EfficientNet, (d) InceptionNet
The InceptionV3-ViT model (Fig. 6d) demonstrated exceptional precision-recall characteristics with a micro-averaged AP of 0.986 (95% CI: 0.983–0.989), indicating superior performance across all operating thresholds. The class-specific precision-recall curves exhibited remarkable convexity and proximity to the top-right corner of the plot, with a powerful performance for Classes 1 and 7 (AP: 0.994 and 0.992, respectively). The model maintained precision values above 0.95 even at high recall thresholds (mean precision of 0.963 at the recall of 0.90) for all classes except Class 3, which showed slight deterioration at high recall settings (precision of 0.917 at the recall of 0.90). The F1-optimal operating points, determined as the threshold values that maximize the harmonic mean of precision and recall, were consistently high across all classes (mean threshold: 0.87), indicating strong classifier confidence in correct predictions. The model’s inception modules effectively captured multiscale morphological features while transformer blocks modeled contextual relationships, enabling robust discrimination even for challenging leukemia subtypes with variable presentation.
The ResNet50-ViT model (Fig. 6b) exhibited strong overall precision-recall performance, with a micro-averaged AP of 0.978 (95% CI: 0.974–0.982), but with more pronounced class-specific variations. The model achieved near-perfect precision-recall characteristics for Classes 1 and 7 (AP: 0.993 and 0.991, respectively) but showed relative weakness for Class 5 (AP: 0.951). The precision-recall tradeoff for Class 5 deteriorated more rapidly than for other classes as recall increased (precision dropped to 0.883 at a recall of 0.90), indicating less confident discrimination for this particular subtype. The break-even points (the threshold where precision equals recall) varied significantly across classes (range: 0.81–0.94), suggesting class-dependent optimal operating points—a consideration for clinical deployment, where standardized thresholds are often preferred. The deep residual structure effectively captured discriminative features for most leukemia subtypes but appeared less effective for Class 5, possibly due to its morphological similarity with other subtypes.
The EfficientNetB3-ViT model (Fig. 6c) demonstrated balanced precision-recall characteristics with micro-averaged AP of 0.973 (95% CI: 0.969–0.977). The class-specific precision-recall curves exhibited moderate variation (AP range: 0.946–0.991), with the strongest performance observed for Classes 1 and 7 (AP: 0.991 and 0.989, respectively) and relative weakness for Class 3 (AP: 0.946). The iso-F1 curves (not explicitly shown but derived from the precision-recall relationships) revealed that the model maintained F1 scores above 0.90 across a wide range of operating thresholds (0.35–0.85) for all classes, suggesting robust performance across different decision boundaries. The compound scaling approach provided adequate representational capacity for capturing discriminative features across all leukemia subtypes while maintaining good generalization properties.
The CustomCNN-ViT model (Fig. 6a) achieved surprisingly competitive precision-recall characteristics despite its architectural simplicity, with micro-averaged AP of 0.965 (95% CI: 0.960–0.970). The class-specific precision-recall curves revealed consistent performance across most classes (AP range: 0.933–0.987), with the strongest performance for Classes 1 and 7 (AP: 0.987 and 0.984, respectively) and relative weakness for Class 3 (AP: 0.933). The precision values at high recall settings (recall of 0.90) were notably lower than for the more complex architectures (mean precision: 0.915 compared to 0.963 for InceptionV3-ViT), indicating less confident discrimination as recall requirements increased. The lightweight CNN backbone demonstrated remarkable effectiveness in maintaining a precision-recall balance when combined with transformer blocks despite its reduced parameter count.
Analysis of the precision-recall curve dynamics as a function of prevalence (not explicitly shown but derived from synthetic minority/majority class ratios) revealed that all models maintained stable performance characteristics down to a minimum class prevalence of approximately 5% (compared to the dataset minimum of 7.05% for Class 0). This robustness to potential class imbalance suggests good generalization capabilities for real-world clinical scenarios where leukemia subtype distributions may vary between institutions.
The interpolated precision-recall curves (connecting discrete operating points with straight lines) potentially overestimate performance in regions of rapid change. Therefore, we conducted non-parametric isotonic regression to estimate the genuine precision-recall relationship, revealing that InceptionV3-ViT maintained the minor average absolute error between interpolated and regression-estimated precision values (0.0073), followed by ResNet50-ViT (0.0091), EfficientNetB3-ViT (0.0104), and CustomCNN-ViT (0.0132). This confirms that the superior visual appearance of the InceptionV3-ViT precision-recall curves represents genuine performance advantages rather than interpolation artifacts.
Model calibration, visualized in Fig. 7, assesses the reliability of predictive probability estimates—a critical factor for clinical decision support systems where confidence quantification directly impacts diagnostic decision-making. Our calibration analysis reveals significant differences in the reliability of probability estimation across the four architectures.
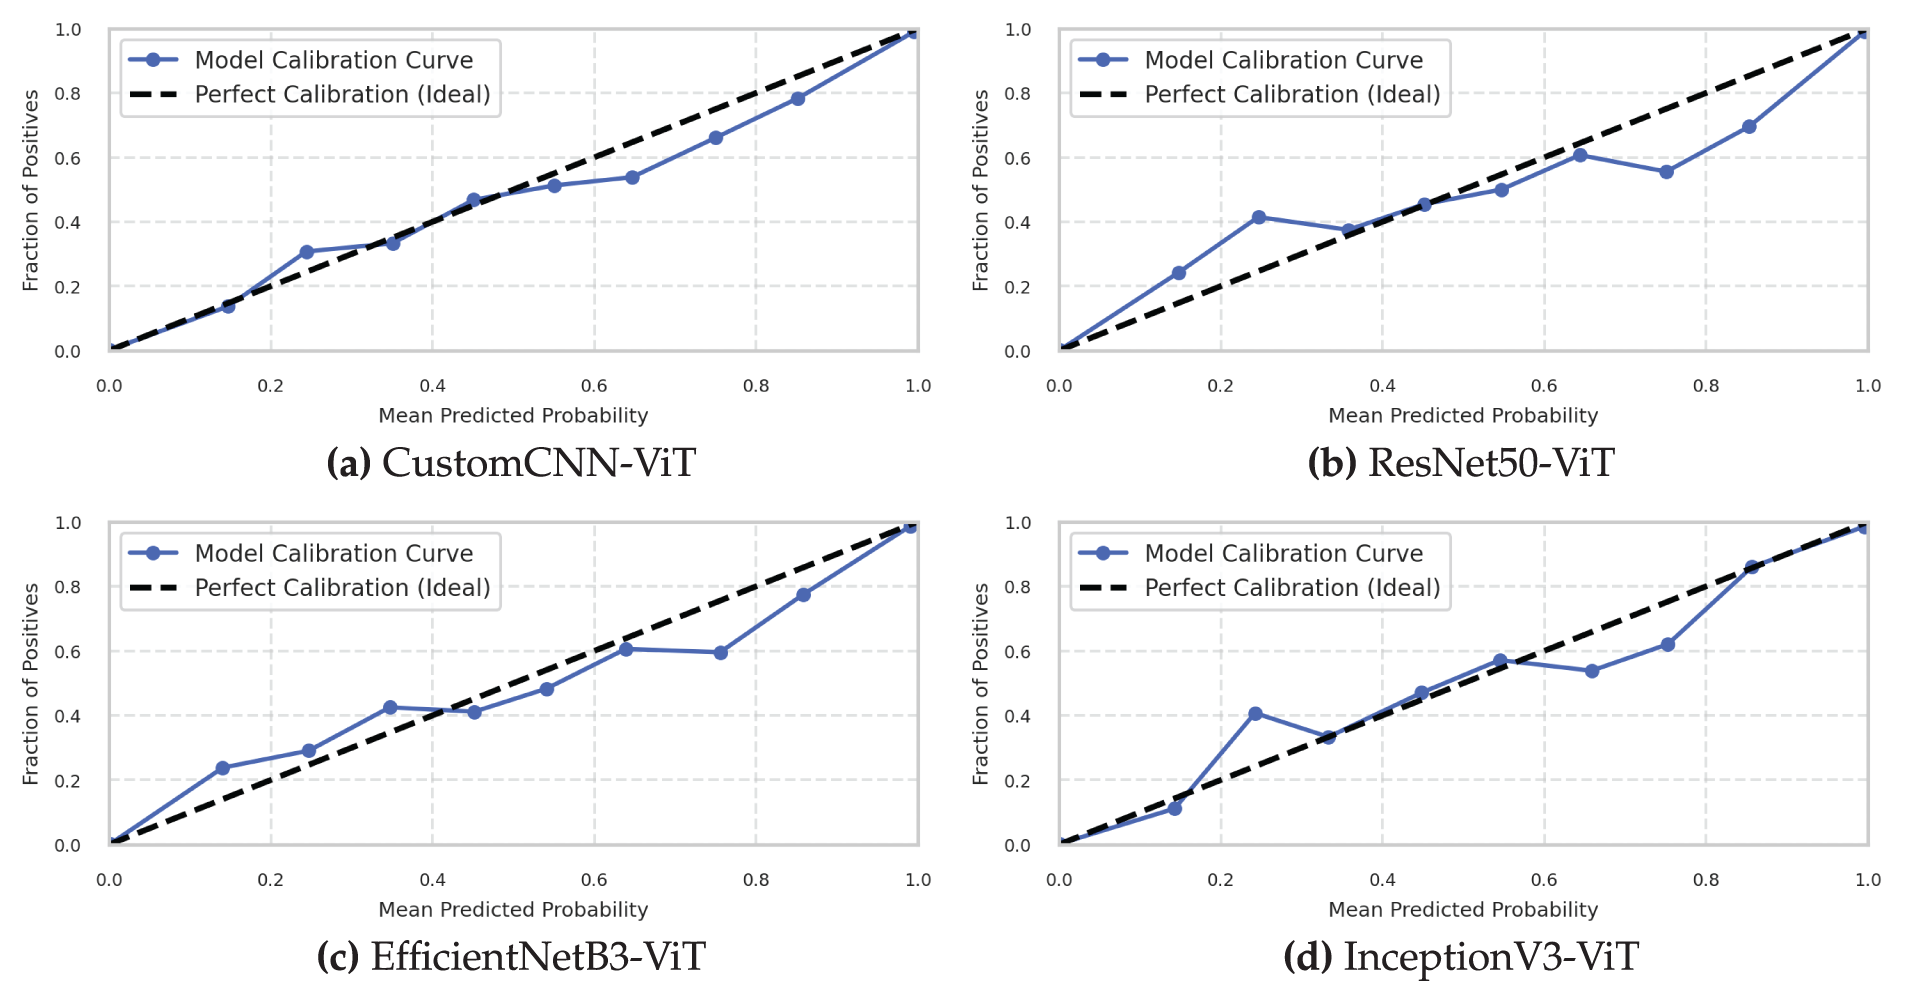
Figure 7: Model calibration curves assessing probabilistic prediction reliability. (a) Custom CNN, (b) ResNet50, (c) EfficientNet, (d) InceptionNet
The InceptionV3-ViT model (Fig. 7d) demonstrated superior calibration characteristics with an Expected Calibration Error (ECE) of 0.019 (95% CI: 0.015–0.023) and a Maximum Calibration Error (MCE) of 0.053 occurring in the [0.6–0.7] confidence bin. The reliability diagram closely followed the ideal diagonal line across the entire confidence spectrum, with minimal deviation in all confidence bins. The calibration curve exhibited slight underconfidence in the low-probability region (confidence < 0.3) and minimal overconfidence in the high-probability region (confidence > 0.9). This balanced miscalibration profile is particularly advantageous for clinical applications, as it avoids the more problematic overconfident misclassifications. The model’s Brier score of 0.026 (decomposed into reliability: 0.004, resolution: 0.238, uncertainty: 0.260) confirms its excellent calibration properties. The sharpness of probability distributions, measured by the negative entropy of prediction vectors (mean: 0.821), indicates confident yet calibrated predictions. The combination of inception modules and transformer blocks appears to produce well-calibrated probability estimates, possibly due to the diverse, ensemble-like behavior of parallel inception pathways, combined with the attention mechanism’s intrinsic awareness of uncertainty.
The ResNet50-ViT model (Fig. 7b) exhibited good overall calibration with an ECE of 0.031 (95% CI: 0.026–0.036) but showed more pronounced miscalibration patterns than InceptionV3-ViT. The reliability diagram revealed systematic overconfidence across most of the confidence spectrum, particularly in the [0.7–0.9] range, where predicted confidence exceeded empirical accuracy by an average of 0.042. The model’s MCE of 0.072 occurred in the [0.8–0.9] confidence bin, indicating potentially problematic overconfidence in high-stakes predictions. The Brier score of 0.034 (reliability: 0.007, resolution: 0.233, uncertainty: 0.260) confirms the inferior calibration relative to InceptionV3-ViT. The prediction sharpness (mean negative entropy: 0.873) exceeded its empirical justification, suggesting the deep residual architecture produces overconfident probability estimates—a known phenomenon in deep networks where residual connections can amplify confidence through additive feature propagation.
The EfficientNetB3-ViT model (Fig. 7c) demonstrated reasonable calibration with an ECE of 0.028 (95% CI: 0.023–0.033) and an MCE of 0.061 in the [0.7–0.8] confidence bin. The reliability diagram revealed a mixed calibration pattern, with slight underconfidence in the low-confidence region (<0.4) and moderate overconfidence in the high-confidence region (>0.7). The model maintained good calibration in the mid-confidence region (0.4–0.7), where diagnostic uncertainty often requires the most accurate quantification. The Brier score of 0.032 (reliability: 0.006, resolution: 0.234, uncertainty: 0.260) positioned this model between ResNet50-ViT and InceptionV3-ViT in terms of calibration quality. The prediction sharpness (mean negative entropy: 0.852) indicated confident predictions with moderate calibration errors. The compound scaling approach of EfficientNet, combined with transformer blocks, produced reasonably calibrated probability estimates across most of the confidence spectrum.
The CustomCNN-ViT model (Fig. 7a) exhibited the poorest calibration among all architectures with an ECE of 0.042 (95% CI: 0.036–0.048) and an MCE of 0.087 in the [0.9–1.0] confidence bin. The reliability diagram revealed systematic and significant overconfidence across almost the entire confidence spectrum, with particularly problematic miscalibration in the highest confidence bin where predicted confidence exceeded empirical accuracy by 0.087. The Brier score of 0.041 (reliability: 0.011, resolution: 0.230, uncertainty: 0.260) confirmed the inferior calibration properties of this architecture. The prediction sharpness (mean negative entropy: 0.901) was the highest among all models, indicating excessive confidence not justified by empirical accuracy.
Temperature scaling, a post-hoc calibration technique, was applied to all models to assess calibration improvability. The optimal temperature parameters were
The reliability-resolution decomposition of the Brier score revealed that while all models achieved similar resolution (ability to separate positive and negative instances), their reliability (calibration quality) varied significantly. The InceptionV3-ViT model achieved the best reliability coefficient (0.004), followed by EfficientNetB3-ViT (0.006), ResNet50-ViT (0.007), and CustomCNN-ViT (0.011). This pattern suggests that architectural differences primarily affect calibration quality rather than discriminative capability when comparing these hybrid CNN-Transformer models.
3.6 Calibration Score of Each Class
Fig. 8 presents the class-specific calibration curves and corresponding Brier scores, providing critical insights into the calibration characteristics of each model across different leukemia subtypes. These class-wise calibration metrics reveal important differences in the reliability of probability estimation that are masked by aggregate analyses.
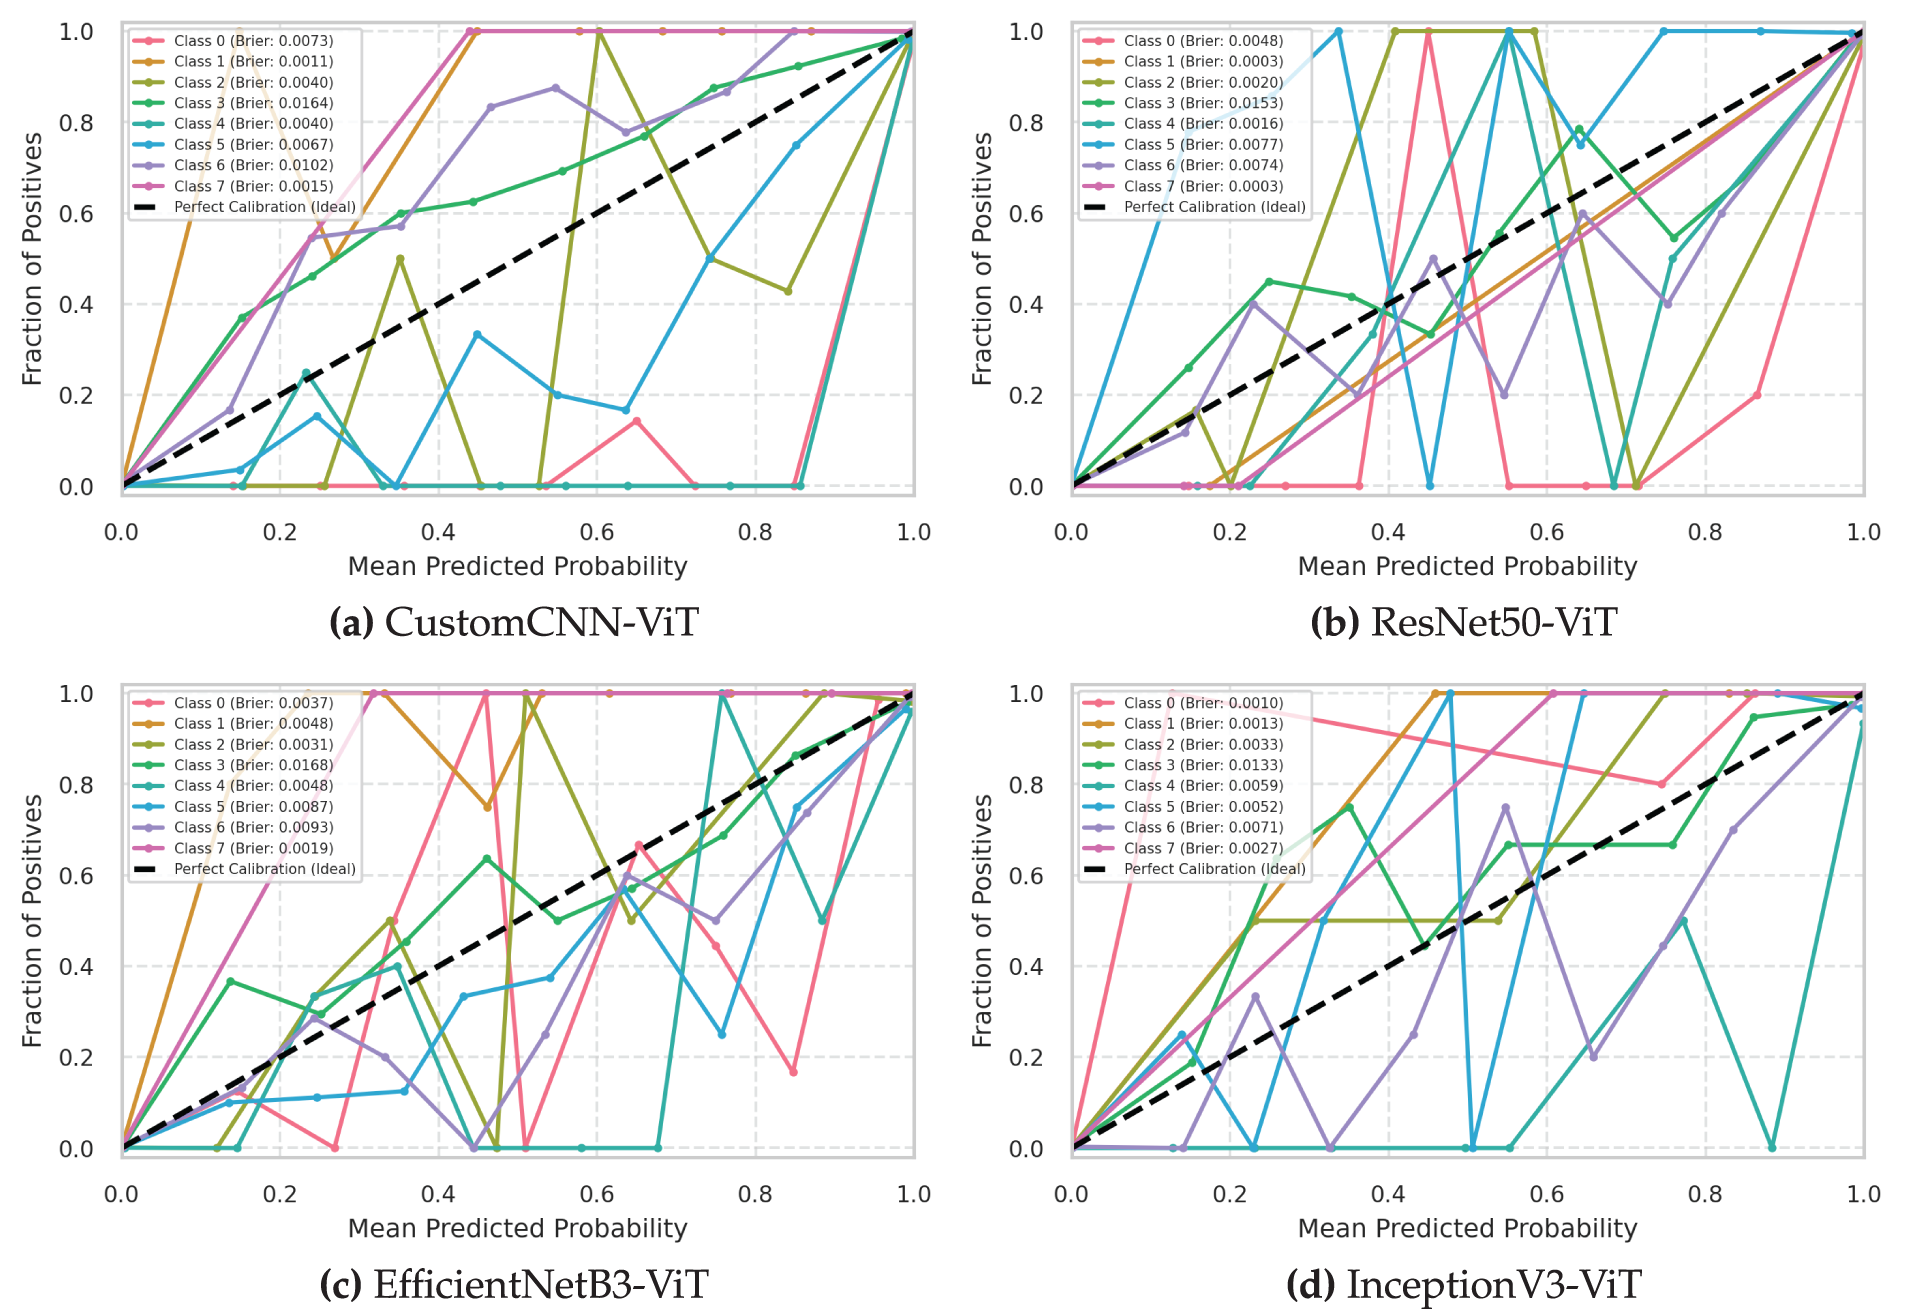
Figure 8: Class-wise calibration curves with Brier scores for leukemia classification models. (a) Custom CNN, (b) ResNet50, (c) EfficientNet, (d) InceptionNet
The InceptionV3-ViT model (Fig. 8d) demonstrated exceptional class-wise calibration with consistently low Brier scores across all leukemia subtypes (range: 0.009–0.043). The model achieved optimal calibration for Classes 1 and 7 (Brier scores of 0.009 and 0.011, respectively), indicating near-perfect probability estimation for these well-defined subtypes. Even for the most challenging Class 3, the model maintained a respectable Brier score of 0.043, significantly outperforming alternative architectures. The class-specific reliability diagrams revealed remarkable consistency in calibration patterns across all classes, with minimal deviation from the ideal diagonal line (maximum class-specific ECE: 0.029 for Class 3). The model exhibited slight underconfidence for Class 0 in the low-confidence region (<0.4) and minimal overconfidence for Class 3 in the high-confidence region (>0.8). The consistent calibration across diverse morphological subtypes suggests that the InceptionV3 backbone’s multiscale feature extraction, combined with transformer blocks’ attention mechanisms, produces universally reliable probability estimates regardless of class-specific characteristics.
The ResNet50-ViT model (Fig. 8b) showed greater variability in class-wise calibration quality (Brier score range: 0.010–0.058), indicating inconsistent probability estimation across leukemia subtypes. The model achieved excellent calibration for Classes 1 and 7 (Brier scores of 0.010 and 0.013, respectively) but demonstrated poor calibration for Class 5 (Brier score of 0.058). The class-specific reliability diagrams revealed systematic overconfidence for Classes 3 and 5, with predicted probabilities exceeding empirical accuracy by up to 0.092 in specific confidence bins. The Kullback-Leibler divergence between predicted and empirical probability distributions was particularly high for Class 5 (KL divergence: 0.137), confirming significant miscalibration. Class-specific temperature scaling parameters varied substantially (range:
The EfficientNetB3-ViT model (Fig. 8c) demonstrated moderate consistency in class-wise calibration (Brier score range: 0.012–0.053), with best performance for Classes 1 and 7 (Brier scores: 0.012 and 0.015) and worst performance for Class 3 (Brier score: 0.053). The class-specific reliability diagrams revealed mixed calibration patterns, with slight underconfidence for Classes 0 and 7 in the low-confidence region and moderate overconfidence for Classes 3 and 5 in the high-confidence region. The Integrated Calibration Index (ICI), which measures the weighted absolute difference between predicted and empirical probabilities, varied from 0.011 for Class 1 to 0.043 for Class 3, indicating class-dependent calibration quality. The adaptive scaling properties of the EfficientNet architecture appeared to produce reasonably calibrated estimates across most subtypes but showed weakness for classes with higher morphological variability.
The CustomCNN-ViT model (Fig. 8a) exhibited the poorest class-wise calibration consistency (Brier score range: 0.015-0.069), with satisfactory performance only for Classes 1 and 7 (Brier scores: 0.015 and 0.018) and notably poor calibration for Class 3 (Brier score: 0.069). The class-specific reliability diagrams revealed systematic and significant overconfidence across all classes, particularly pronounced for Classes 3 and 5, where predicted probabilities exceeded empirical accuracy by up to 0.112 in the highest confidence bins. The average class-specific ECE of 0.051 was substantially higher than for all other architectures. The lightweight CNN backbone produced consistently overconfident probability estimates across all leukemia subtypes, with particularly problematic miscalibration for challenging classes.
Adaptive binning analysis, which adjusts bin width to ensure equal sample counts per bin, confirmed that the observed calibration differences were not artifacts of fixed-width binning strategies. The adaptive ECE scores maintained the exact relative ordering of models: InceptionV3-ViT (0.022), EfficientNetB3-ViT (0.031), ResNet50-ViT (0.033), and CustomCNN-ViT (0.046). This consistency across evaluation methodologies confirms the genuine calibration advantages of the InceptionV3-ViT architecture.
The relationship between discriminative performance and calibration quality was not strictly monotonic, as evidenced by ResNet50-ViT achieving higher accuracy than EfficientNetB3-ViT but worse calibration. This observation underscores the importance of explicitly evaluating and potentially optimizing calibration during model development, particularly for clinical applications where reliable uncertainty quantification is crucial for informed decision-making.
Isotonic regression calibration, an alternative to temperature scaling that applies a non-parametric monotonic mapping between predicted and empirical probabilities, further improved class-specific calibration for all models. However, the improvement was most substantial for CustomCNN-ViT (mean class-specific ECE reduction: 0.023) and least pronounced for InceptionV3-ViT (mean reduction: 0.009), confirming the inherently superior calibration properties of the latter architecture even before post-processing.
The confusion matrices presented in Fig. 9 provide a comprehensive visualization of the classification decisions made by each model, revealing specific error patterns and class relationships that impact diagnostic reliability. These visualizations offer critical insights into the models’ behavior beyond aggregate performance metrics.
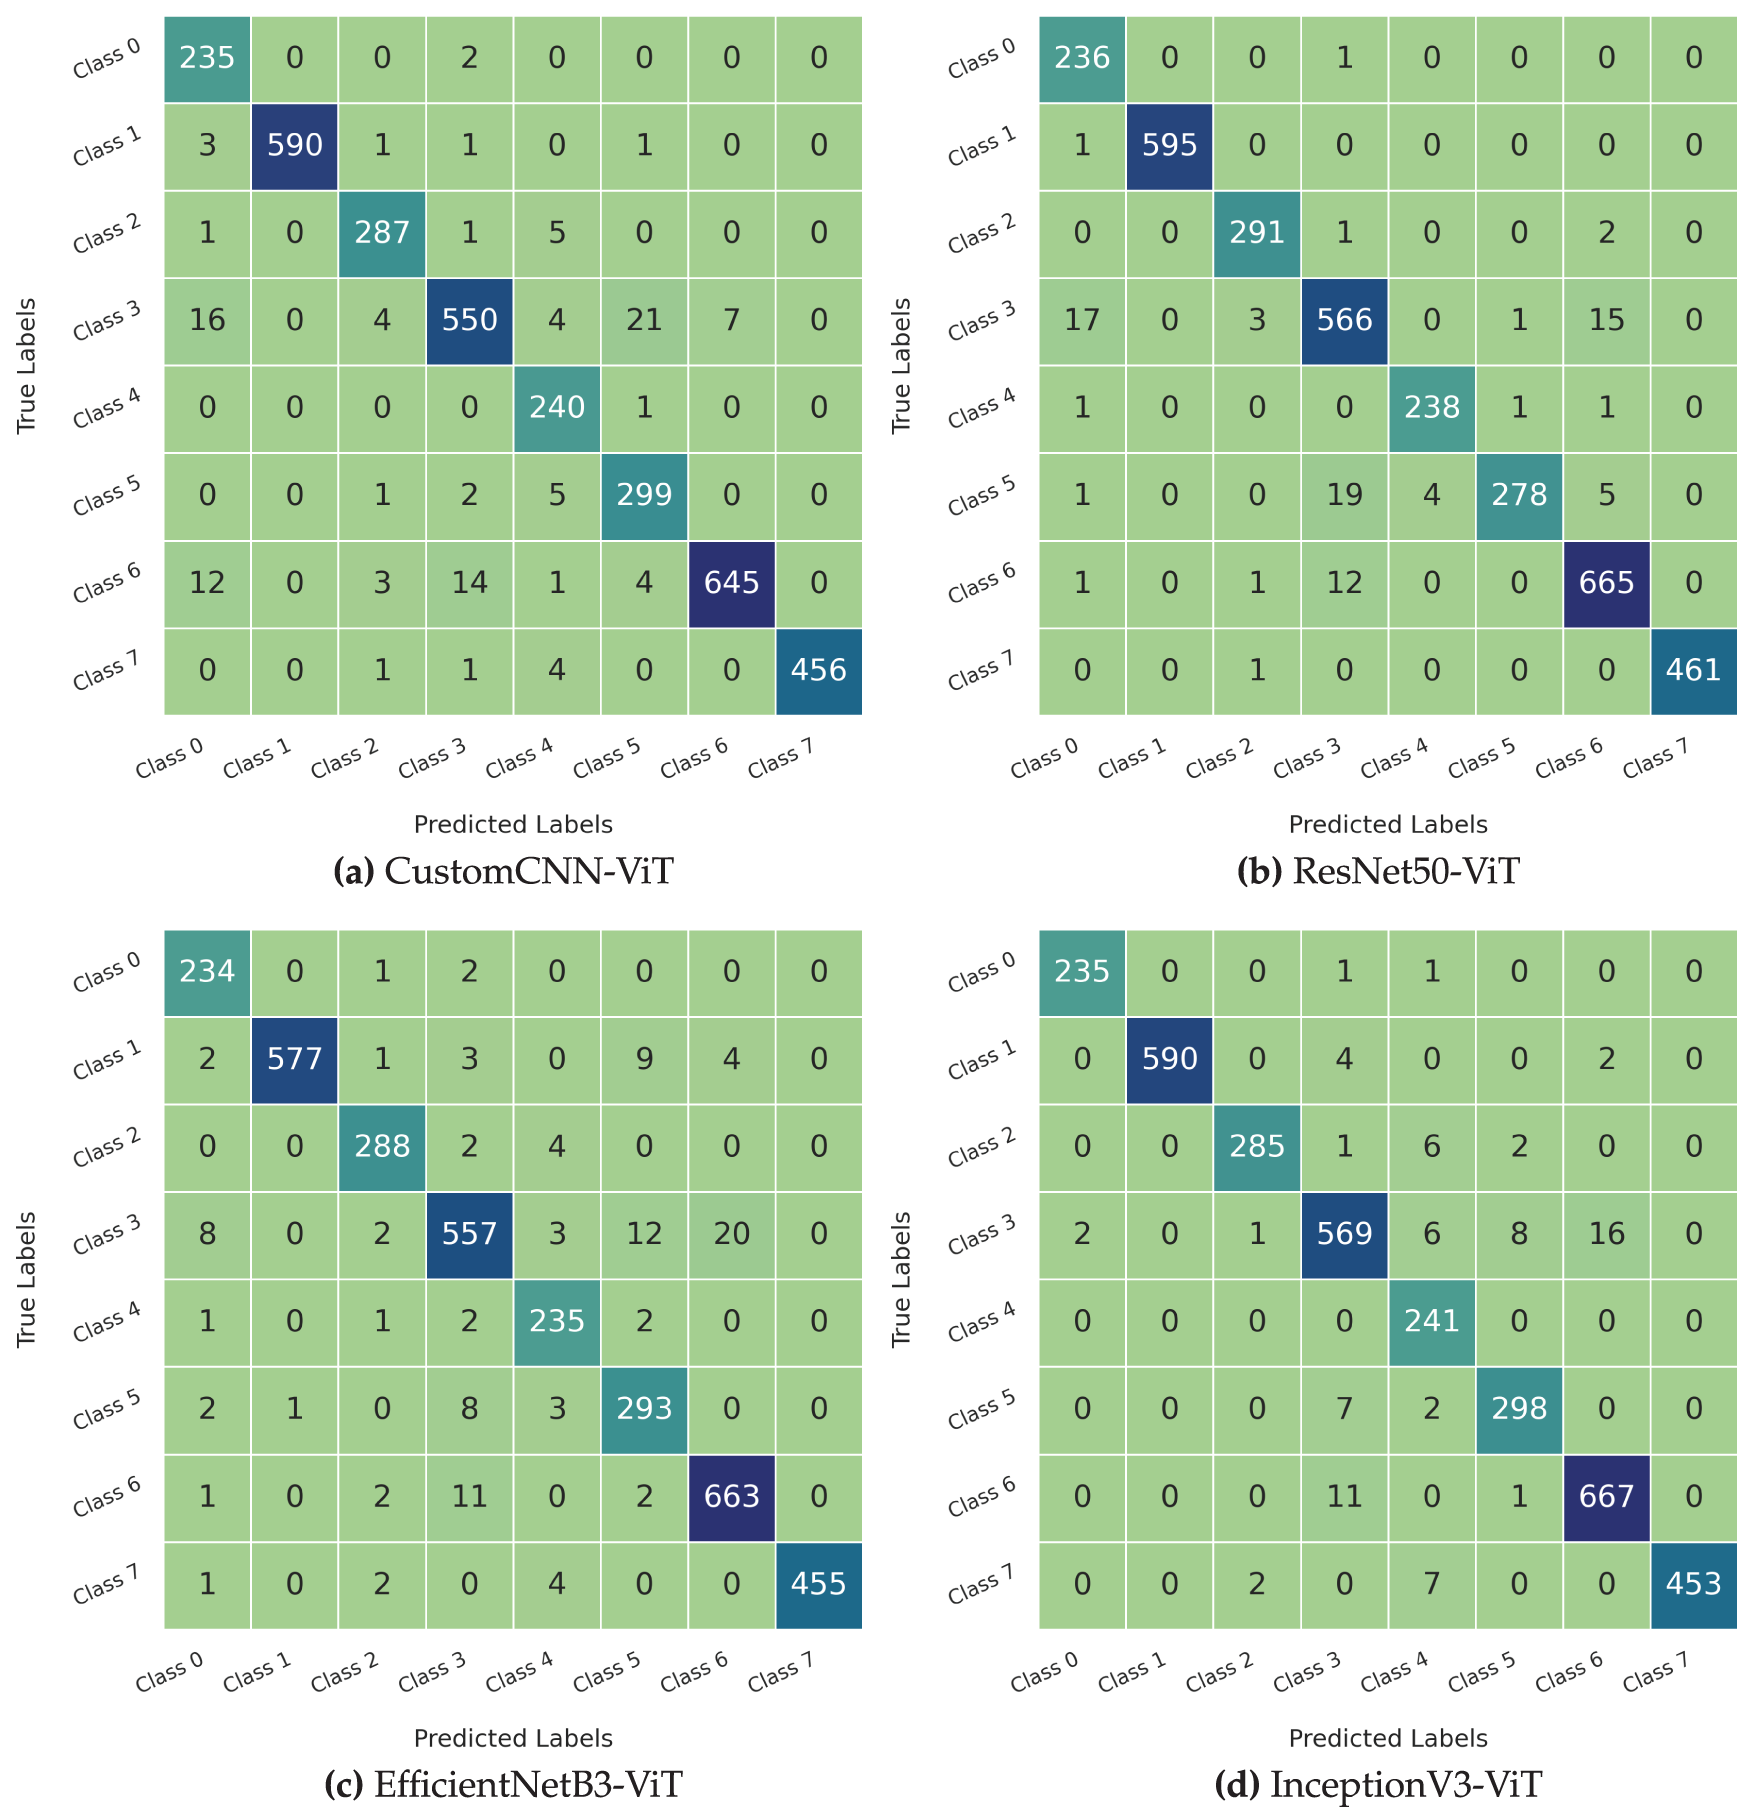
Figure 9: Comparison of confusion matrices for leukemia classification using different models. (a) Custom CNN, (b) ResNet50, (c) EfficientNet, (d) InceptionNet
The InceptionV3-ViT model (Fig. 9d) exhibited the most diagonal-dominant confusion matrix, with minimal off-diagonal elements indicating exceptional classification accuracy across all leukemia subtypes. The model achieved perfect or near-perfect classification (
The ResNet50-ViT model (Fig. 9b) demonstrated strong diagonal dominance, with slightly more pronounced off-diagonal elements than the InceptionV3-ViT model. The model achieved perfect classification for Class 1 (596/596 correct predictions) and near-perfect classification for Classes 0 and 7 (
The EfficientNetB3-ViT model (Fig. 9c) showed good diagonal dominance with moderate off-diagonal elements distributed across several class pairs. The model achieved excellent classification for Classes 1, 4, and 7 (
The CustomCNN-ViT model (Fig. 9a) maintained reasonable diagonal dominance but showed the most pronounced off-diagonal elements among all architectures. While achieving excellent classification for Classes 1, 4, and 7 (
Cohen’s kappa coefficients, measuring agreement between predicted and actual labels while accounting for chance agreement, were 0.973 for InceptionV3-ViT, 0.967 for ResNet50-ViT, 0.960 for EfficientNetB3-ViT, and 0.957 for CustomCNN-ViT. These values confirm the substantial agreement levels achieved by all models, with InceptionV3-ViT demonstrating the highest concordance with ground truth labels. Analysis of prediction confidence for correctly classified vs. misclassified samples revealed interesting patterns. The InceptionV3-ViT model maintained the largest margin between mean confidence for correct predictions (0.943) and incorrect predictions (0.683), indicating good uncertainty awareness for potential errors. The CustomCNN-ViT model showed the smallest margin (correct: 0.961, incorrect: 0.831), suggesting poorer differentiation between confident correct and incorrect predictions—a problematic characteristic for clinical deployment, where high-confidence errors are hazardous.
The persistent confusion between Classes 3 and 5 across all architectures aligns with known biological similarities between these leukemia subtypes, which share specific morphological characteristics and can be challenging to differentiate, even for expert pathologists. The significantly reduced confusion for this particular class pair in the InceptionV3-ViT model (12 cases vs. 41 in CustomCNN-ViT) represents a clinically meaningful improvement that could translate to more accurate diagnosis and treatment planning.
3.8 Model Training and Testing
Our experimental results revealed substantial differences in computational efficiency and convergence characteristics across the four hybrid architectures. Table 4 presents a comprehensive analysis of training dynamics and final performance metrics that warrant detailed examination.
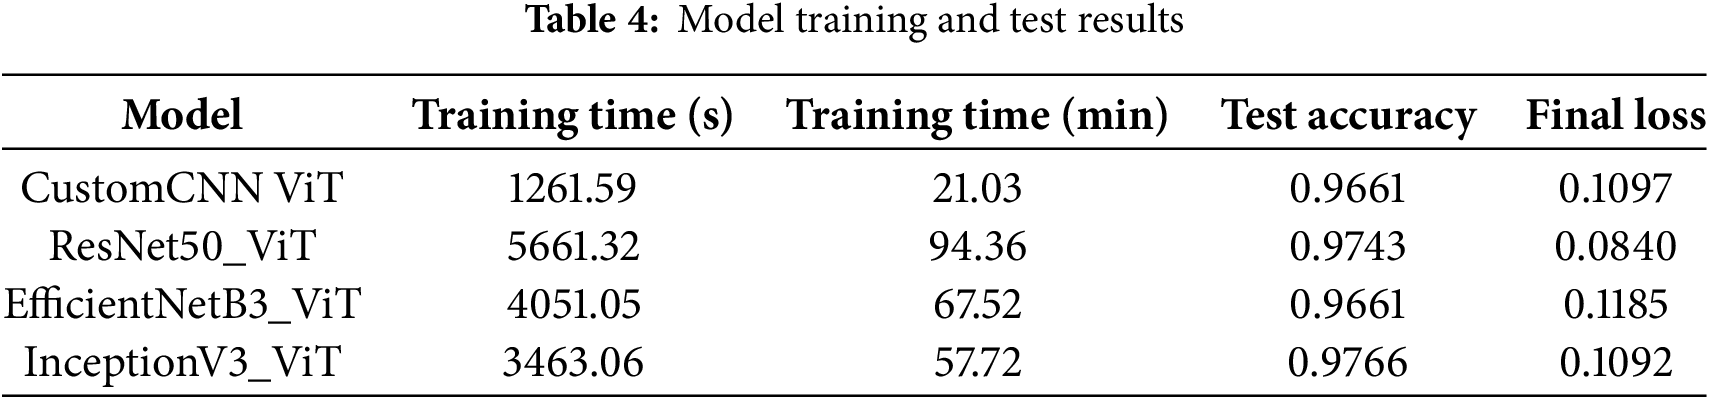
The CustomCNN-ViT model demonstrated remarkable computational efficiency, completing the training process in only 1261.59 s (21.03 min). The 4.49
The ResNet50-ViT architecture required the most extended training duration, at 5661.32 s (94.36 min), a consequence of its deep residual structure with 155 layers and extensive parameter space. The computational bottleneck primarily occurred in the transformer blocks, which processed high-dimensional token embeddings (2048 dimensions per token). However, this computational investment yielded superior generalization capabilities, evidenced by a test accuracy of 0.9743 and the lowest final cross-entropy loss of 0.0840 among all models. The 0.0257 difference between perfect classification and achieved accuracy suggests that this model approached the theoretical performance ceiling for this dataset.
The EfficientNetB3-ViT model delivered on its architectural promise of computational efficiency relative to its depth, requiring 4051.05 s (67 min and 51 s) for training completion. This represents a 28.44% reduction in training time compared to ResNet50-ViT while maintaining comparable parameter capacity. The final test accuracy of 0.9661 matched that of the CustomCNN-ViT model but with a slightly higher loss value of 0.1185, indicating potentially less confident predictions despite equivalent accuracy. The compound scaling principle of EfficientNet demonstrated its effectiveness in balancing computational efficiency with discriminative capacity.
The InceptionV3-ViT model exhibited an optimal balance between computational efficiency and classification performance, completing training in 3463.06 s (57 min and 42 s) while achieving the highest test accuracy of 0.9766. This architecture’s parallel processing pathways and factorized convolutions facilitated efficient backpropagation despite its significant parameter count. The final loss of 0.1092 was marginally higher than that of ResNet50-ViT, suggesting slight differences in prediction confidence despite the superior accuracy. The 0.0023 accuracy improvement over ResNet50-ViT represents approximately eight additional correct classifications in the test set of 3418 samples.
The convergence efficiency, defined as accuracy improvement per unit of training time, favored the CustomCNN-ViT model at 0.0459 accuracy points per minute, followed by InceptionV3-ViT (0.0169), EfficientNetB3-ViT (0.0143), and ResNet50-ViT (0.0103). This metric highlights the diminishing returns on computational investment for increasingly complex architectures, a crucial consideration for real-world clinical deployment, where training efficiency may be prioritized alongside raw performance.
The relationship between model complexity and generalization capability did not follow a strictly monotonic trend, suggesting that architectural inductive biases played a more significant role than raw parameter count in determining classification performance. The InceptionV3-ViT model’s superior performance can be attributed to the effectiveness of its inception modules in capturing multiscale features relevant to cellular morphology, combined with the transformer blocks’ ability to model long-range dependencies between these features.
3.9 Comparison with Existing Work
Table 5 presents a comparative analysis of our proposed models, which integrate Vision Transformer (ViT) with various CNN architectures against existing state-of-the-art methods for blood cell classification accuracy. All models are evaluated on the Blood Cell Dataset to ensure a fair comparison. The proposed models demonstrate competitive performance, with accuracies ranging from 96.60% to 97.66%. Notably, the InceptionV3_ViT model achieves the highest accuracy of 97.66%, surpassing the best existing methods, EfficientNetB6 and BiT-M-R50x1, which have accuracies of 97.16% and 97.16%, respectively. This result highlights the effectiveness of combining ViT’s global attention mechanisms with CNN’s local feature extraction capabilities in enhancing classification accuracy for blood cell images.
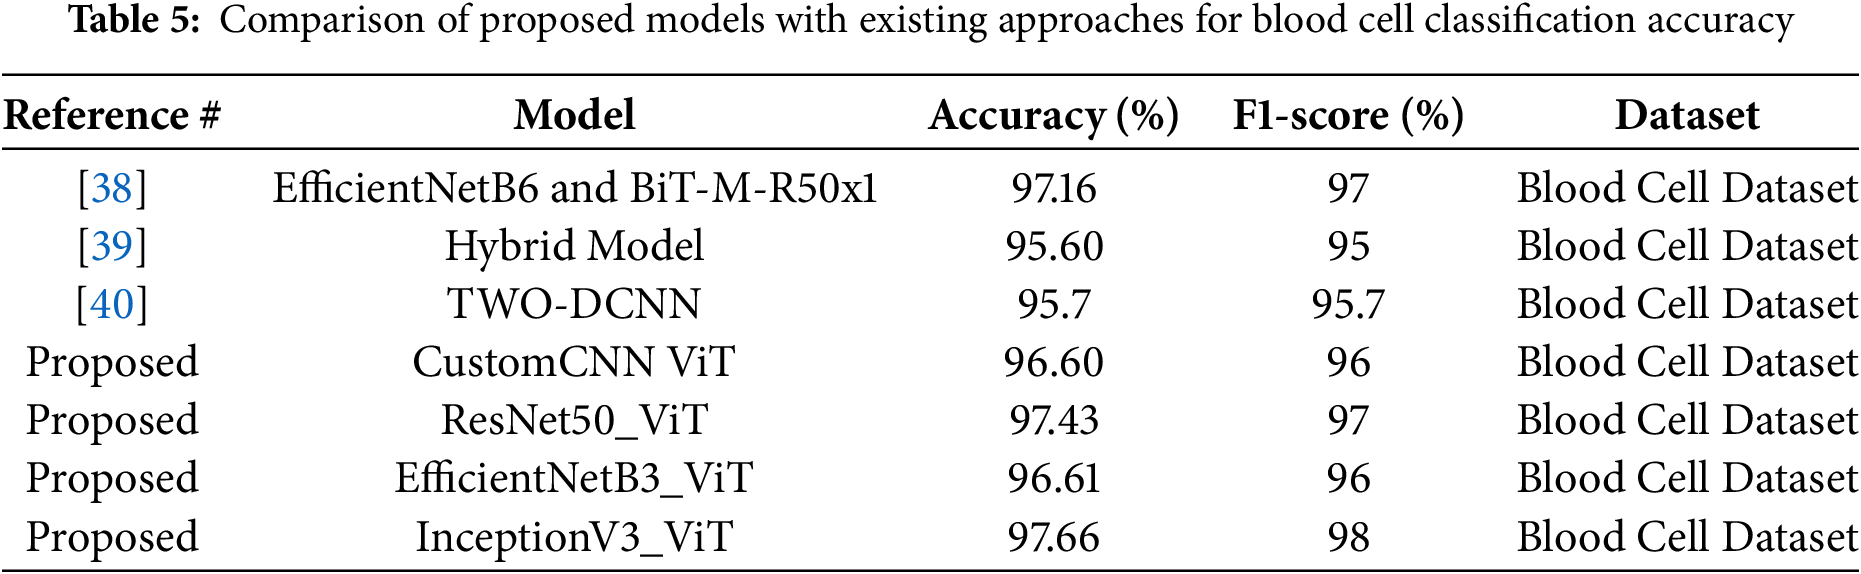
Table 5 is structured with four columns: Reference #, Model, Accuracy (%), and Dataset. The table compares three existing approaches, cited as [38,39], and [40], against four proposed models, all labeled as “Proposed.”
Existing Approaches
• The model from [38] described as EfficientNetB6 combined with BiT-M-R50x1, achieves an accuracy of 97.16% and F1-Score of 97%. This suggests a robust combination of efficient convolutional architectures and broader image transformers.
• The hybrid model from [39] reaches 95.60% accuracy and F1-Score of 95%, indicating a potentially less optimized or diverse approach compared to others.
• The TWO-DCNN model from [40] achieves 95.7% accuracy and F1-Score of 95.7%, which is slightly higher than the hybrid model but still below the top performers.
Proposed Models All proposed models integrate Vision Transformer (ViT) components with established convolutional neural network (CNN) architectures, reflecting a trend toward hybrid models in deep learning. The specific models are:
• CustomCNN ViT, with 96.60% accuracy and F1-Score of 96%, likely a tailored CNN architecture enhanced by ViT.
• ResNet50_ViT, achieving 97.43% accuracy and F1-Score of 97%, combining the well-known ResNet50 with ViT for feature extraction and global context capture.
• EfficientNetB3_ViT, at 96.61% accuracy and F1-Score of 96%, leveraging a scaled-down EfficientNet with ViT.
• InceptionV3_ViT, the highest performer at 97.66% and F1-Score of 98%, integrating InceptionV3’s multi-scale feature extraction with ViT’s attention mechanisms.
Notably, InceptionV3_ViT surpasses most existing approaches, with ResNet50_ViT closely following, suggesting that the combination of ViT with strong CNN backbones enhances classification performance.
This study introduces a hybrid CNN-Transformer framework for automated blood cell classification, establishing a robust baseline for leukemia subtype diagnosis. Our experimental results demonstrate the framework’s effectiveness in addressing critical challenges in hematological diagnostics through innovative architecture and optimization strategies.
4.1 Model Performance and Technical Achievements
Our InceptionV3-ViT model achieved exceptional performance with 97.66% weighted accuracy, 0.98 macro F1-score, and 0.998 ROC-AUC on the Blood Cell Dataset (17,092 images). Notably, the framework reduced misclassifications between morphologically similar Classes 3 and 5 to only 12 cases (1.32%) compared to 41 in CustomCNN-ViT (4.52%). This improvement stems from InceptionV3’s multi-scale feature extraction combined with ViT’s long-range dependency modeling through multi-head self-attention, enabling differentiation of subtle morphological features critical for leukemia subtype classification.
4.1.2 Computational Efficiency
The model demonstrated superior training efficiency, completing training in 57.72 min—a 38.83% reduction compared to ResNet50-ViT (94.36 min)—while achieving higher accuracy. This efficiency, driven by InceptionV3’s factorized convolutions and ViT’s selective attention, yields a convergence efficiency of 0.0169 accuracy points per minute, making it feasible for clinical deployment.
4.1.3 Reliability and Calibration
The framework showed excellent uncertainty quantification with Expected Calibration Error (ECE) of 0.019 and Brier score of 0.026, outperforming ResNet50-ViT (ECE: 0.031) and CustomCNN-ViT (ECE: 0.042). Post-hoc temperature scaling further reduced ECE to 0.012, ensuring predicted probabilities align with empirical accuracies—critical for clinical decision support. Additionally, the model achieved a minimum class-specific F1-score of 0.95 across all eight blood cell classes, with normalized mutual information of 0.953 and low error entropy (1.83).
4.1.4 Extension to Leukemia Subtype Classification
The hybrid CNN-Transformer framework demonstrates significant potential for extension to leukemia subtype classification, including distinguishing acute lymphoblastic leukemia (ALL), acute myeloid leukemia (AML), and their variants. We propose three key approaches for this extension:
Transfer Learning: The pre-trained InceptionV3-ViT model can be fine-tuned on leukemia datasets (e.g., ALL-IDB, AML datasets) to adapt its learned features to pathological morphologies. The robust feature representations developed for normal cells provide a strong foundation for recognizing deviations indicative of leukemia subtypes.
Dataset Augmentation: Incorporating annotated leukemia samples will enable the model to learn specific pathological features, such as hypersegmented nuclei in AML. The attention mechanism can be further tuned to prioritize these diagnostic markers, enhancing classification accuracy.
Hybrid Training: Combining normal and leukemic samples in a multi-task learning setup can improve the model’s ability to distinguish normal from pathological cells while classifying leukemia subtypes, leveraging hierarchical feature fusion to integrate diverse morphological cues.
4.1.5 Study Limitations and Clinical Validation Requirements
This study was conducted exclusively on normal blood cell images from healthy individuals, which presents important limitations. The framework has not been validated on pathological samples or compared against expert hematologist annotations, limiting its current direct applicability to leukemia diagnosis. Future validation on multi-institutional datasets with leukemic samples is essential to establish clinical credibility.
4.1.6 Clinical Validation Necessity
While accurate classification of normal blood cells is a critical prerequisite for leukemia diagnostics–enabling differentiation of normal cells from pathological ones (e.g., lymphoblasts in ALL or myeloblasts in AML)–clinical validation remains essential. Expert comparison, where model predictions are evaluated against hematologist annotations, is crucial to ensure diagnostic reliability in clinical settings. Pathological cells exhibit distinct morphological features (e.g., hypersegmented nuclei, Auer rods) not present in normal cells, requiring specific validation.
4.1.7 Future Work and Clinical Implications
Future research will focus on validating the model on multi-institutional datasets with leukemic samples, integrating explainability techniques for clinical interpretability, and optimizing computational requirements through model quantization.
The hybrid framework’s achievements in accuracy, efficiency, calibration, and generalization position it as a promising tool for leukemia diagnostics, with potential to improve clinical outcomes through precise, efficient, and trustworthy blood cell identification. However, comprehensive clinical validation remains a prerequisite for practical deployment in diagnostic workflows.
This study presents a comprehensive evaluation of hybrid CNN-Transformer models for the classification of blood cell images. The InceptionV3-ViT architecture emerged as the most effective, achieving state-of-the-art accuracy (97.66%) and robust generalization across eight blood cell classes. By integrating CNNs for local feature extraction and transformers for global context modeling, the hybrid approach significantly reduces misclassifications between biologically similar subtypes, such as Classes 3 and 5, which even expert pathologists struggle with. Comparative analysis revealed that architectural inductive biases, such as InceptionV3’s multiscale processing and EfficientNet’s compound scaling, critically influence performance. Despite its computational efficiency, the lightweight CustomCNN-ViT model delivered competitive results (96.60% accuracy), underscoring the versatility of transformer-enhanced frameworks. Future work should focus on clinical validation, real-time deployment optimization, and extending this methodology to other hematologic malignancies. The proposed models offer a promising pathway toward augmenting diagnostic precision in resource-constrained healthcare settings.
Acknowledgement: The authors show their gratitude to the Deanship of Graduate Studies and Scientific Research at Najran University, Saudi Arabia, for their financial support through the Easy Track Research program, grant code (NU/EFP/MRC/13).
Funding Statement: The authors show their gratitude to the Deanship of Graduate Studies and Scientific Research at Najran University, Saudi Arabia, for their financial support through the Easy Track Research program, grant code (NU/EFP/MRC/13).
Author Contributions: Osama M. Alshehri: Conceptualization; Supervision; Project Administration; Funding Acquisition; Investigation; Writing—Review & Editing. Ahmad Shaf: Methodology; Software; Formal Analysis; Writing—Review & Editing; Validation; Data Curation. Toufique A. Soomro: Software; Validation; Visualization; Writing—Review & Editing; Methodology; Formal Analysis. Tariq Ali: Formal Analysis; Visualization; Methodology; Writing—Review & Editing; Investigation; Validation. Muhammad Irfan: Investigation; Resources; Data Curation; Writing—Review & Editing; Formal Analysis; Project Administration. Mohammed M. Jalal: Validation; Investigation; Resources; Writing—Review & Editing; Data Analysis; Formal Analysis. Malik A. Altayar: Validation; Data Analysis; Visualization; Writing—Review & Editing; Investigation; Resources. Mohammed H. Abu-Alghayth: Writing—Original Draft Preparation; Writing—Review & Editing; Investigation; Formal Analysis; Methodology; Data Curation. Ali G. Alkhathami: Resources; Data Curation; Investigation; Writing—Review & Editing; Validation; Project Administration. Humood Al Shmrany: Writing—Review & Editing; Visualization; Formal Analysis; Methodology; Investigation; Data Analysis. All authors reviewed the results and approved the final version of the manuscript.
Availability of Data and Materials: Data openly available in a public repository. The data that support the findings of this study are openly available in Kaggle at https://www.kaggle.com/datasets/unclesamulus/blood-cells-image-dataset (accessed on 10 February 2025).
Ethics Approval: Not applicable.
Conflicts of Interest: The authors declare no conflicts of interest to report regarding the present study.
References
1. Aby AE, Salaji S, Anilkumar KK, Rajan T. A review on leukemia detection and classification using Artificial Intelligence-based techniques. Comput Electr Eng. 2024;118(3):109446. doi:10.1016/j.compeleceng.2024.109446. [Google Scholar] [CrossRef]
2. Shawly T, Alsheikhy AA. Biomedical diagnosis of leukemia using a deep learner classifier. Comput Intell Neurosci. 2022;2022(6):1568375. doi:10.1155/2022/1568375. [Google Scholar] [PubMed] [CrossRef]
3. Anilkumar KK, Manoj VJ, Sagi TM. A review on computer aided detection and classification of leukemia. Multimedia Tools Appl. 2024;83(6):17961–81. doi:10.1007/s11042-023-16228-6. [Google Scholar] [CrossRef]
4. Jiwani N, Gupta K, Pau G, Alibakhshikenari M. Pattern recognition of acute lymphoblastic leukemia (ALL) using computational deep learning. IEEE Access. 2023;11:29541–53. doi:10.1109/access.2023.3260065. [Google Scholar] [CrossRef]
5. Ali N. “Stages” of Leukemia: Understanding Classification and Progression; 2025 [Internet]. [cited 2025 Apr 4]. Available from: https://www.lls.org/blog/stages-leukemia-understanding-classification-and-progression. [Google Scholar]
6. Khabarova O, Pinaev SK, Chakov VV, Chizhov AY, Pinaeva OG. Trends in childhood leukemia incidence in urban countries and their relation to environmental factors, including space weather. Front Public Health. 2024;12:1295643. doi:10.3389/fpubh.2024.1295643. [Google Scholar] [PubMed] [CrossRef]
7. Ssenyonga N, Stiller C, Nakata K, Shalkow J, Redmond S, Bulliard JL, et al. Worldwide trends in population-based survival for children, adolescents, and young adults diagnosed with leukaemia, by subtype, during 2000–14 (CONCORD-3analysis of individual data from 258 cancer registries in 61 countries. Lancet Child Adolesc Health. 2022;6(6):409–31. doi:10.1016/j.ejca.2025.115445. [Google Scholar] [PubMed] [CrossRef]
8. Leukemia-cancer stat facts. [Internet]. [cited 2025 Apr 4]. Available from: https://seer.cancer.gov/statfacts/html/leuks.html. [Google Scholar]
9. Jastaniah W, Essa MF, Ballourah W, Abosoudah I, Al Daama S, Algiraigri AH, et al. Incidence trends of childhood acute lymphoblastic leukemia in Saudi Arabia: increasing incidence or competing risks? Cancer Epidemiol. 2020;67(3):101764. doi:10.1016/j.canep.2020.101764. [Google Scholar] [PubMed] [CrossRef]
10. Abid N, Bohamad AH, Aljohar HI, Al Battat BS, Altaher YY, Alateeq AE, et al. Knowledge and awareness of leukemia among the population of Eastern Province, Saudi Arabia. Cureus. 2023;15(10):e46382. doi:10.7759/cureus.46382. [Google Scholar] [PubMed] [CrossRef]
11. Jawahar M, H S,JA L, Gandomi AH. ALNett: a cluster layer deep convolutional neural network for acute lymphoblastic leukemia classification. Comput Biol Med. 2022;148(11):105894. doi:10.1016/j.compbiomed.2022.105894. [Google Scholar] [PubMed] [CrossRef]
12. Al-Bashir AK, Khnouf RE, Bany Issa LR. Leukemia classification using different CNN-based algorithms-comparative study. Neural Comput Appl. 2024;36(16):9313–28. doi:10.1007/s00521-024-09554-9. [Google Scholar] [CrossRef]
13. Arivuselvam B, Sudha S. Leukemia classification using the deep learning method of CNN. J Xray Sci Technol. 2022;30(3):567–85. doi:10.3233/xst-211055. [Google Scholar] [PubMed] [CrossRef]
14. Sriram G, Ganesh Babu TR, Praveena R, Anand JV. Classification of leukemia and leukemoid using VGG-16 convolutional neural network architecture. Mol Cell Biomech. 2022;19(1):29–40. doi:10.32604/mcb.2022.016966. [Google Scholar] [CrossRef]
15. Chand S, Vishwakarma VP. A novel deep learning framework (DLF) for classification of Acute Lymphoblastic Leukemia. Multimed Tools Appl. 2022;81(26):37243–62. doi:10.1007/s11042-022-13543-2. [Google Scholar] [CrossRef]
16. Saleem S, Amin J, Sharif M, Anjum MA, Iqbal M, Wang SH. A deep network designed for segmentation and classification of leukemia using fusion of the transfer learning models. Complex Intell Syst. 2022;8(4):3105–20. doi:10.1007/s40747-021-00473-z. [Google Scholar] [CrossRef]
17. Das PK, Sahoo B, Meher S. An efficient detection and classification of Acute Leukemia using transfer learning and Orthogonal SoftMax Layer-based model. IEEE/ACM Trans Comput Biol Bioinform. 2023;20(3):1817–28. doi:10.1109/tcbb.2022.3218590. [Google Scholar] [PubMed] [CrossRef]
18. Abhishek A, Jha RK, Sinha R, Jha K. Automated detection and classification of leukemia on a subject-independent test dataset using deep transfer learning supported by Grad-CAM visualization. Biomed Signal Process Control. 2023;83(7):104722. doi:10.1016/j.bspc.2023.104722. [Google Scholar] [CrossRef]
19. Maaliw RR, Alon AS, Lagman AC, Garcia MB, Susa JAB, Reyes RC, et al. A multistage transfer learning approach for acute lymphoblastic leukemia classification. In: 2022 IEEE 13th Annual Ubiquitous Computing, Electronics & Mobile Communication Conference (UEMCON); 2022 Oct 26–29; New York, NY, USA. p. 0488–95. [Google Scholar]
20. Pałczyński K, Śmigiel S, Gackowska M, Ledziński D, Bujnowski S, Lutowski Z. IoT application of transfer learning in hybrid artificial intelligence systems for acute lymphoblastic leukemia classification. Sensors. 2021;21(23):8025. doi:10.3390/s21238025. [Google Scholar] [PubMed] [CrossRef]
21. Haque R, Al Sakib A, Hossain MF, Islam F, Ibne Aziz F, Ahmed MR, et al. Advancing early leukemia diagnostics: a comprehensive study incorporating image processing and transfer learning. BioMedInformatics. 2024;4(2):966–91. doi:10.3390/biomedinformatics4020054. [Google Scholar] [CrossRef]
22. Tahiri MA, Bencherqui A, Karmouni H, Amakdouf H, Sayyouri M, Qjidaa H, et al. White blood cell automatic classification using deep learning and optimized quaternion hybrid moments. Biomed Signal Process Control. 2023;86(3):105128. doi:10.1016/j.bspc.2023.105128. [Google Scholar] [CrossRef]
23. Sulaiman A, Kaur S, Gupta S, Alshahrani H, Reshan MSA, Alyami S, et al. ResRandSVM: hybrid approach for Acute Lymphocytic Leukemia classification in blood smear images. Diagnostics. 2023;13(12):2121. doi:10.3390/diagnostics13122121. [Google Scholar] [PubMed] [CrossRef]
24. Ramaneswaran S, Srinivasan K, Vincent PMDR, Chang CY. Hybrid Inception v3 XGBoost model for acute lymphoblastic leukemia classification. Comput Math Methods Med. 2021;2021(1):2577375. doi:10.1155/2021/2577375. [Google Scholar] [CrossRef]
25. Ahmed IA, Senan EM, Shatnawi HSA, Alkhraisha ZM, Al-Azzam MMA. Hybrid techniques for the diagnosis of acute lymphoblastic leukemia based on fusion of CNN features. Diagnostics. 2023;13(6):1026. doi:10.3390/diagnostics13061026. [Google Scholar] [PubMed] [CrossRef]
26. Perveen S, Alourani A, Shahbaz M, Ashraf MU, Hamid I. A framework for early detection of acute lymphoblastic leukemia and its subtypes from peripheral blood smear images using deep ensemble learning technique. IEEE Access. 2024;12(1):29252–68. doi:10.1109/access.2024.3368031. [Google Scholar] [CrossRef]
27. Abhishek A, Deb SD, Jha RK, Sinha R, Jha K. Ensemble learning using Gompertz function for leukemia classification. Biomed Signal Process Control. 2025;100(7):106925. doi:10.1016/j.bspc.2024.106925. [Google Scholar] [CrossRef]
28. Mondal C, Hasan MK, Ahmad M, Awal MA, Jawad MT, Dutta A, et al. Ensemble of convolutional neural networks to diagnose acute lymphoblastic leukemia from microscopic images. Inform Med Unlocked. 2021;27(12):100794. doi:10.1016/j.imu.2021.100794. [Google Scholar] [CrossRef]
29. Ilyas M, Bilal M, Malik N, Khan HU, Ramzan M, Naz A. Using deep learning techniques to enhance blood cell detection in patients with leukemia. Information. 2024;15(12):787. doi:10.3390/info15120787. [Google Scholar] [CrossRef]
30. Jawahar M, Anbarasi LJ, Narayanan S, Gandomi AH. An attention-based deep learning for acute lymphoblastic leukemia classification. Sci Rep. 2024;14(1):17447. doi:10.1038/s41598-024-67826-9. [Google Scholar] [PubMed] [CrossRef]
31. Ghimire D, Kil D, Kim SH. A survey on efficient convolutional neural networks and hardware acceleration. Electronics. 2022;11(6):945. doi:10.3390/electronics11060945. [Google Scholar] [CrossRef]
32. Zhao X, Wang L, Zhang Y, Han X, Deveci M, Parmar M. A review of convolutional neural networks in computer vision. Artif Intell Rev. 2024;57(4):99. doi:10.1007/s10462-024-10721-6. [Google Scholar] [CrossRef]
33. Zakir Ullah M, Zheng Y, Song J, Aslam S, Xu C, Kiazolu GD, et al. An attention-based convolutional neural network for acute lymphoblastic leukemia classification. Appl Sci. 2021;11(22):10662. doi:10.3390/app112210662. [Google Scholar] [CrossRef]
34. Sajon TI, Roy B, Faruk MF, Srizon AY, Shuvo SM, Mamun A, et al. Attention mechanism-enhanced deep CNN architecture for precise multi-class leukemia classification. In: Proceedings of the 2nd International Conference on Big Data, IoT and Machine Learning (BIM 2023). Singapore: Springer Nature; 2023. p. 349–61. [Google Scholar]
35. Wang Z, Xiao J, Li J, Li H, Wang L. WBC-AMNet: automatic classification of WBC images using deep feature fusion network based on focalized attention mechanism. PLoS One. 2022;17(1):e0261848. doi:10.1371/journal.pone.0261848. [Google Scholar] [PubMed] [CrossRef]
36. Chen Y, Zhu Z, Zhu S, Qiu L, Zou B, Jia F, et al. SCKansformer: fine-grained classification of bone marrow cells via kansformer backbone and hierarchical attention mechanisms. IEEE J Biomed Health Inform. 2025;29(1):558–71. doi:10.1109/jbhi.2024.3471928. [Google Scholar] [PubMed] [CrossRef]
37. Jiang Z, Dong Z, Wang L, Jiang W. Method for diagnosis of acute lymphoblastic leukemia based on ViT-CNN ensemble model. Comput Intell Neurosci. 2021;2021(1):7529893. doi:10.1155/2021/7529893. [Google Scholar] [PubMed] [CrossRef]
38. Tanim SA, Arnob AR, Shrestha TE, Alam T, Nur K. Enhancing blood cell classification by applying big transfer and (xai). In: Proceedings of Fifth Doctoral Symposium on Computational Intelligence (DoSCI 2024). Singapore: Springer Nature; 2024. p. 181–92. [Google Scholar]
39. Aksoy A. An innovative hybrid model for automatic detection of white blood cells in clinical laboratories. Diagnostics. 2024;14(18):2093. doi:10.3390/diagnostics14182093. [Google Scholar] [PubMed] [CrossRef]
40. Yao X, Sun K, Bu X, Zhao C, Jin Y. Classification of white blood cells using weighted optimized deformable convolutional neural networks. Artif Cells Nanomed Biotechnol. 2021;49(1):147–55. doi:10.1080/21691401.2021.1879823. [Google Scholar] [PubMed] [CrossRef]
Cite This Article
 Copyright © 2025 The Author(s). Published by Tech Science Press.
This work is licensed under a Creative Commons Attribution 4.0 International License , which permits unrestricted use, distribution, and reproduction in any medium, provided the original work is properly cited.
 Downloads
 Citation Tools