
 Submit a Paper
 Propose a Special lssue
 Open Access
ARTICLE

Mechanical Performance of Additive Manufactured TPMS Lattice Structures Based on Topology Optimization
1 College of Mechanical and Electrical Engineering, Qingdao University, Qingdao, 266071, China
2 National Engineering Research Center for Intelligent Electrical Vehicle Power System, Qingdao University, Qingdao, 266071, China
* Corresponding Author: Qinghai Zhao. Email:
(This article belongs to the Special Issue: Topology Optimization: Theory, Methods, and Engineering Applications)
Computer Modeling in Engineering & Sciences 2025, 144(1), 763-789. https://doi.org/10.32604/cmes.2025.067363
Received 01 May 2025; Accepted 18 June 2025; Issue published 31 July 2025
 View Full Text
 Download PDF
Abstract
Lattice structures have attracted extensive attention in the field of engineering materials due to their characteristics of lightweight and high strength. This paper combines topology optimization with additive manufacturing to investigate how pore shape in Triply Periodic Minimal Surface (TPMS) structures affects mechanical properties and energy absorption performance. The periodic lattice structures (Triangle lattice, rectangle lattice and Rectangle lattice) and aperiodic mixed structures are designed, including a variety of lattice structures such as circle-circle and triangle-triangle (CCTT), triangle-triangle and rectangle-rectangle (TTRR), circle-circle and rectangle-rectangle (CCRR), triangle-circle-circle-triangle (TCCT), rectangle-triangle-triangle-rectangle (RTTR) and rectangle-circle-circle-rectangle (RCCR). The anisotropy of the unit cells is compared by using the homogenization method. The deformation modes, mechanical properties, and energy absorption efficiency of lattice structures are evaluated systematically by finite element analysis and compression experiments. The results demonstrate that the circle lattice exhibits significantly superior performance in Young’s modulus, compressive strength, toughness, and energy absorption characteristics compared to the triangle lattice and the rectangle lattice. Among aperiodic structures, TCCT shows better comprehensive mechanical properties, while TTRR exhibits relatively inferior performance. The periodic structures possess overall superior mechanical performance. This study demonstrates that the mechanical properties and energy absorption characteristics can be optimized by controlling the pore shape of TPMS lattice structures. This provides an important insight into lightweight structure design in the engineering field.Keywords
Porous lattice structures have attracted significant interest in biomedical, new energy, aerospace, and other fields due to their outstanding mechanical properties and lightweight advantages [1–3]. These structures demonstrate remarkable capabilities in achieving high specific strength, high energy absorption, and high mechanical properties. In the same lattice structure, the change of pore shape can significantly change the macroscopic mechanical response. Therefore, investigating the relationship between pore shape and mechanical performance becomes critical.
In recent years, extensive studies have been conducted on the mechanical properties of lattice structures, with a primary focus on material selection and structural design [4,5]. Liu et al. [6] systematically summarized the influence of factors such as materials on the mechanical properties of lattice structures and explored the development prospects of additive manufacturing applied to lattice structures. Ashok et al. [7] developed a new 3D open lattice structure and contrasted it with the natally-inspired structure of grapefruit peel. The influence of geometry and material nonlinearity on the structure is also shown. The results show that the proposed novel 3D open lattice structure has better energy absorption performance under the same loading conditions. Ge et al. [8] designed gradient hollow-strut octet lattice structures and conducted in-depth investigations into their mechanical properties and deformation stability. Yin et al. [9] classified three-dimensional lattice structures into four categories (truss structures, plate structures, shell structures, and layered structures), and systematically analyzed their energy absorption characteristics. Dara et al. [10] designed and prepared several types of nature-inspired novel open flower lattice (NINOFL) structures. The performance of the NINOFL structure is compared with the standard Honeycomb (HC) structure and the merged tessellated open-type lattice structure (MTLs) with similar relative density. The results show that the proposed NINOFL structure exhibits excellent performance in terms of energy absorption and loading capacity. To further enhance the performance of lattice structures, researchers have expanded their investigations to mechanical responses under different loading conditions. Wang et al. [11] proposed an optimization method incorporating both geometric nonlinearities and load nonlinearities and described the finite element formula of geometric nonlinearity under pressure load. Gaganelis et al. [12] developed a novel optimization approach for tension/compression anisotropy. This method effectively maximizes the stiffness of lattice structures while maintaining prescribed volume constraints. Zhu et al. [13] developed a multi-fastener shear optimization method. This approach systematically evaluates shear load effects on porous structural performance. These studies demonstrate distinct deformation characteristics in lattice structures. The observed failure modes directly correlate with structural geometry and material composition.
The mechanical properties of lattice structures are also related to manufacturing parameters, environmental conditions, and microstructural composition [14–16]. Mang et al. [17] found that geometric defects caused by manufacturing processes are unavoidable, and these defects are directly related to manufacturing parameters. Großmann et al. [18] proposed a reliable aluminum-based truss lattice structure framework and investigated the effects of selective laser melting (SLM) parameters on lattice porosity and compressive performance. Gu et al. [19] studied the influence of environmental temperature and 3D printing on the compressive properties of lattice structures, with experimental verification. Jia et al. [20] found that the macro geometry and relative density distribution of the infilled microstructure significantly influence the performance of lattice-infilled structures. They proposed an optimization design method for self-supporting additive microstructures. Topologically optimized lattice structures typically possess complex geometric features, making the identification of high-precision manufacturing technologies essential for achieving their theoretical performance. TPMS lattice structures have demonstrated significant potential in engineering fields due to their distinctive continuous surface topology and exceptional mechanical properties [21,22]. Zhang et al. [23] designed a hybrid TPMS lattice with circular transitions and further verified it by axial impact experiments. Yang et al. [24] designed and fabricated a Gyroid-type TPMS gradient lattice structure. The modified mathematical equations are also developed to predict the mechanical response of the gradient lattice structure. Lin et al. [25] proposed a multi-scale TPMS structure optimization design method based on geometric continuity fusion and strain energy driven. The experimental results show that the mechanical properties of the lattice structure designed by the proposed method are significantly improved. Although the above methods have their advantages, there are still significant deficiencies in the collaborative optimization of structural mechanical properties and lightweight design. Consequently, the balance between mechanical performance and lightweight requirements needs to be addressed. Topology optimization (TO) is regarded as an effective solution due to its advantages in integrated design.
TO has emerged as a transformative methodology in lattice structure design, demonstrating unparalleled capabilities in achieving simultaneous lightweight and high-performance objectives [26–28]. TO enables significant enhancements in lattice structures by systematically optimizing material distribution, thereby improving mechanical performance, functional characteristics, and manufacturability. Li et al. [29] combined TO, size optimization, and biomimetic lattice structure. It is applied to the support structure optimization of the Fengyun-3 satellite payload. The results show that the proposed method significantly improves the stiffness of the structure while achieving the lightweight goal. Bai et al. [30] combined additive manufacturing with TO and proposed a two-step density filtering-based TO method for sandwich structures. Additive manufacturing technology was used to prepare the optimized structure and its performance was verified by experiments. Cheng et al. [31] proposed a novel material interpolation method for lattice structures and developed a TO framework to achieve minimum weight under stress constraints. The combination between TO and additive manufacturing has opened new possibilities for lattice structure fabrication. Additive manufacturing (AM) is an advanced digital fabrication technology. This technique relies on three-dimensional models to precisely form solid structures through layer-by-layer material deposition [32]. Compared with conventional manufacturing technology, AM demonstrates significant advantages, including high material utilization, exceptional design freedom, and rapid prototyping capability for complex geometries. Selective laser melting (SLM) represents a typical metal AM technology. This method utilizes a high-energy laser beam to selectively melt metal powder layers and enables the fabrication of high-precision components with densities exceeding 99%. SLM is particularly suitable for complex applications in aerospace, chemical engineering, and biomedical fields [33–35].
This study integrates TO with AM. TO is performed on TPMS structures, resulting in the design and evolution of nine lattice architectures. The unit cells are systematically arranged and thickened using nTopology. Finite element analysis is conducted in Abaqus to extract force-displacement curves from simulation results, enabling evaluation of the structural mechanical behavior characteristics. By employing 3D printing technology in AM, physical models are fabricated and subjected to compression testing using a universal testing machine. Comparative analysis between simulation and experimental results elucidated the influence of pore shape on the mechanical performance of lattice structures. In this study, Section 2 first conducts TO research based on TPMS, subsequently designing nine distinct lattice structures. A systematic calculation of Young’s modulus and shear modulus is performed for each structure. Section 3 details the methodology of simulations and compression experiments. Section 4 presents a comparative analysis of how different pore shapes and volume fractions influence the deformation mechanism, mechanical performances, and energy absorption characteristics of the lattice structures.
2 Description and Implementation of Design and Manufacturing Methods
2.1 Principle, Process, and Results of Topology Optimization
TO is a computational design method. This method employs mathematical algorithms to identify the optimal material distribution within a predefined design space. The objective is to maximize structural performance under given constraints, such as reducing weight, increasing strength, and improving stiffness [36]. This study performs TO of TPMS structures using Abaqus. TPMS represents a complex surface architecture. This structure exhibits periodic extension in three-dimensional space. It maintains zero mean curvature. TPMS demonstrates excellent mechanical properties and multifunctional characteristics. The material used is 6061 aluminum alloy, an Al-Mg-Si alloy characterized by lightweight, corrosion resistance, and good processability. The material density is 2.70 g/cm3, the Young’s modulus is 69 GPa, and the Poisson’s ratio is 0.3. Due to its multi-purpose characteristics, 6061 aluminum alloy is widely used in aerospace, automotive industry, and other fields. The structural dimensions of the unit TPMS cells are 10 mm × 10 mm × 10 mm. To ensure symmetrical geometric characteristics of the lattice structure, identical loads are applied along the x, y, and z-axes to achieve the periodic structure better overall. When setting the conditions for TO, the analysis step is set to static and universal. The initial value of the increment step is set to 0.005, the minimum increment step size is 1 × 10⁻⁵, and the maximum is 1. The maximum number of incremental steps is 100. The TO objective is stress minimization, with volume fraction as the constraint. Based on the classical density method, the mathematical model of TO is as follows:
where ρ represents the design variable. σmax(ρ) represents the maximum stress of the structure. σivM represents the von Mises stress at the centroid of element i. K(ρ) represents the global stiffness matrix. U represents the displacement vector. H stands for mechanical load vector. Vf( ρ) and Va represent the volume fraction and target volume fraction, respectively.
Since the max function is not differentiable. In this paper, the P-norm aggregation strategy is used to approximate the global maximum stress. This does not affect generality.
where ps is the stress condensation parameter, and its value has a great influence on the approximation quality and smoothness of the aggregate function. The von Mises stress is expressed as follows:
where σi is the stress vector at the center of the element. To effectively deal with the stress singularity problem, a power exponent penalty different from the stiffness is applied to the stress:
where q is the stress penalty factor, and the common value 0.5 is taken here. Y0 is the solid material elastic matrix. Bi is the strain displacement at the center of element i. In the plane stress regime, the constant matrix D is expressed as:
The sensitivity of the objective function Eq. (2) concerning the physical density of the element can be calculated by the chain rule:
According to Eq. (4), it can be obtained:
where χei is the Kronecker function. The matrix Li aggregates the nodal displacement vectors of element i from the global displacement vector. Assuming the load is design-independent, the derivative of the equilibrium equation KU = H concerning the physical density can obtain:
Substituting Eqs. (7) and (8) into Eq. (6) can obtain:
where the adjoint vector
Shell TO yields material distribution in structures, manifested as thickness variations or pore designs. Solid TO produces material distributions within three-dimensional solids, represented by complex geometries and internal cavities. This paper investigates the effects of pore shapes on the mechanical properties and energy absorption characteristics of TPMS lattice structures. For the aforementioned reasons, this study conducts TO using shell TPMS structures. The complete optimization process is shown in Fig. 1.
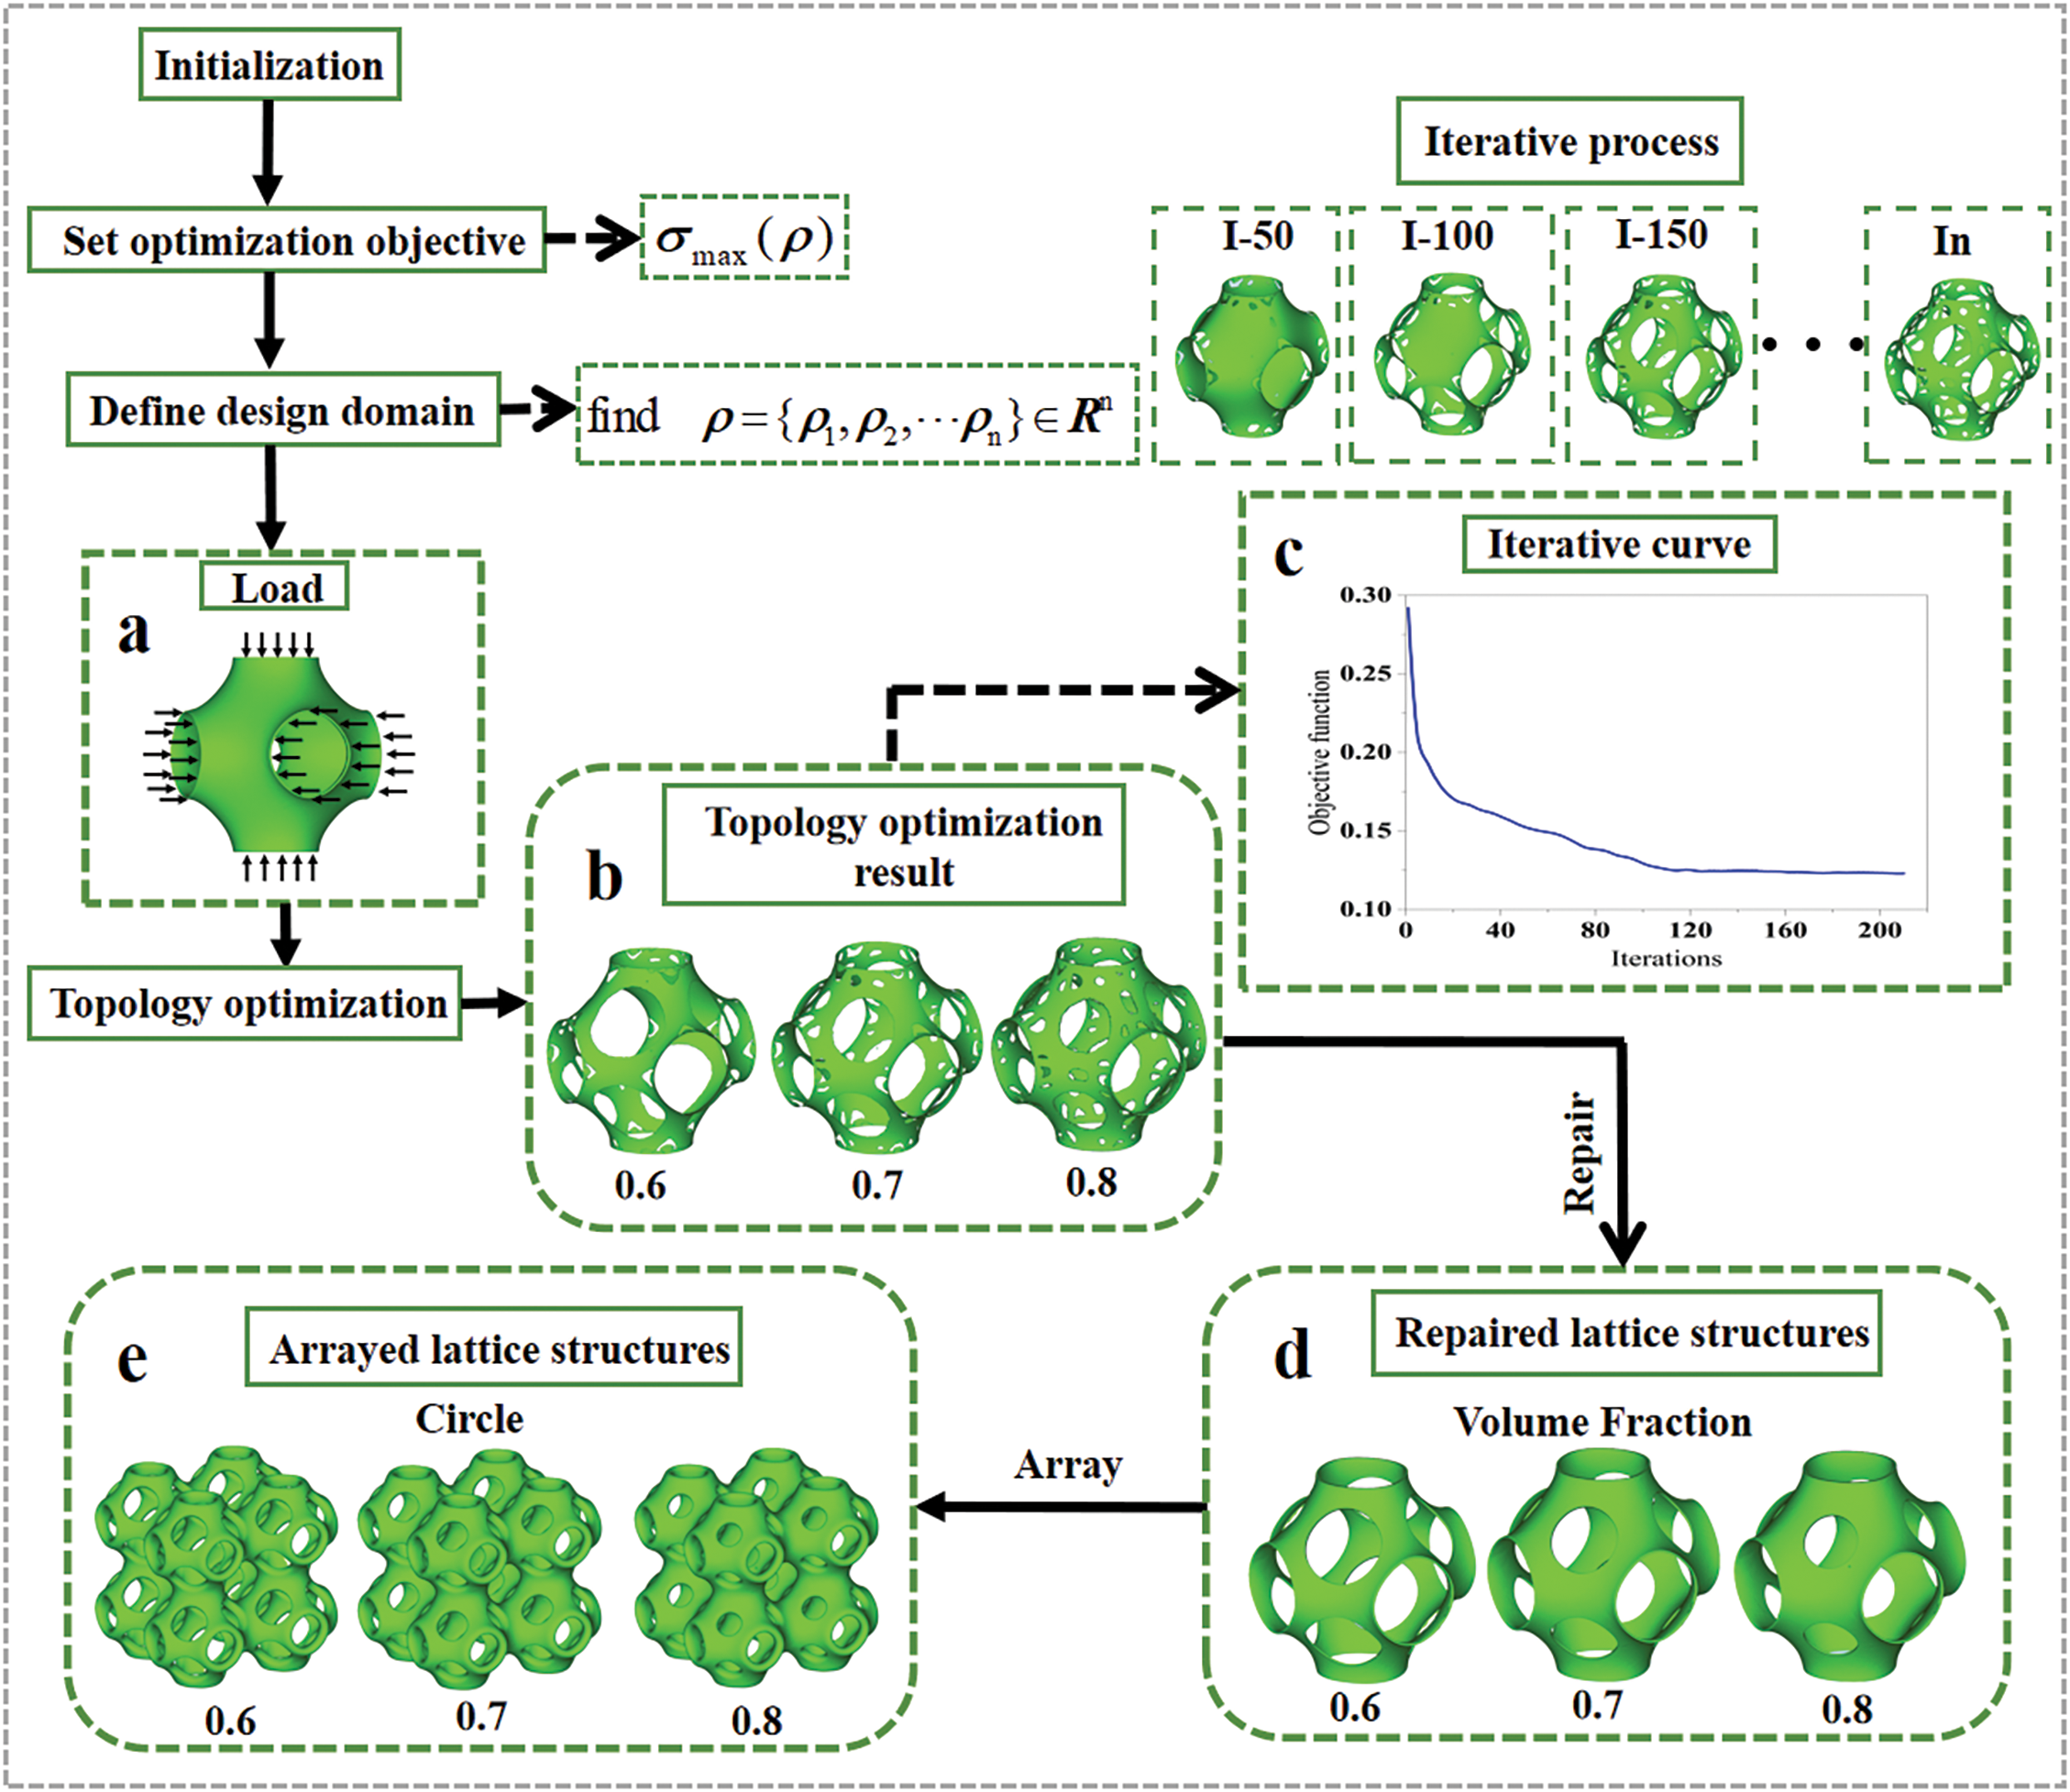
Figure 1: Topology optimization process: (a) Loading mode; (b) Topology optimization result; (c) Iterative curve; (d) Repaired lattice structures; (e) Arrayed lattice structures
As shown in Fig. 1, symmetrical circular pores appear on the surface of the lattice structure after TO. Additionally, this study systematically examines volume fraction effects on structural performance. Three volume fraction constraints are established. The lattice structures have volume fractions of 0.6, 0.7, and 0.8, respectively. To achieve engineering applicability, the optimized unit cells undergo array patterning. The cells align along axes in a 2 × 2 × 2 configuration. The resulting specimen dimensions measure 20 mm × 20 mm × 20 mm. In arrayed structures, the connection positions of unit cells serve as the actual load application points in TO. This design approach guarantees structural integrity and mechanical stability.
2.2 The Extension of the Topology Optimization Results
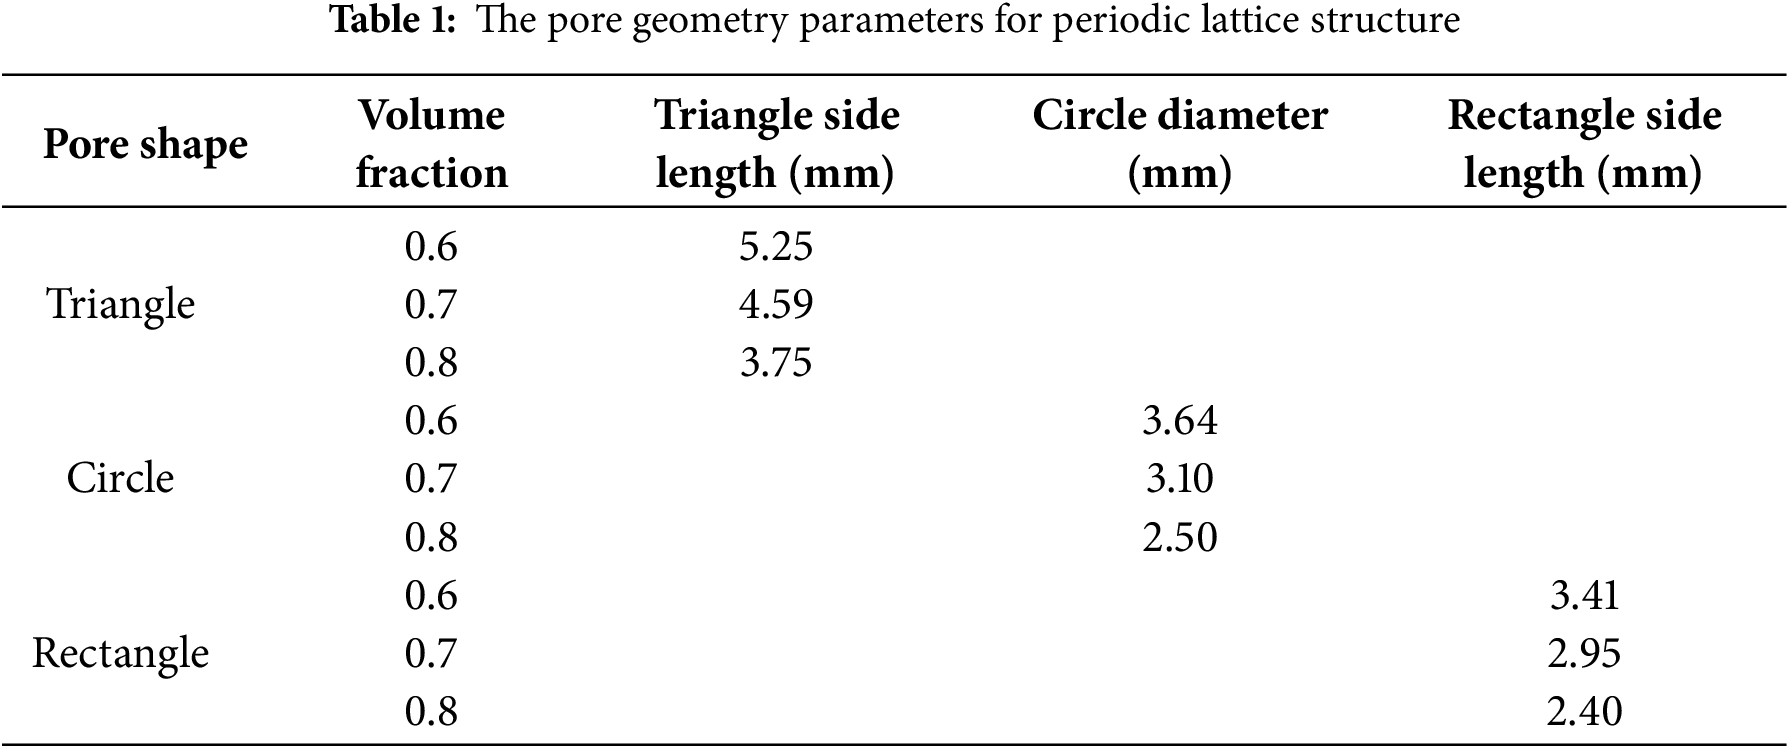
To further investigate pore shape effects on structural mechanical performance, the topologically optimized circular pores are replaced with triangular and rectangular pores, as shown in Fig. 2. In the process of pore shape reconstruction of TPMS structure, the pore shape is replaced based on the equivalent area principle in this paper. On the premise of keeping the position of the circular pores obtained by TO unchanged, the circular pores are replaced by triangular and rectangular pores with the same projected area. The volume fraction of the lattice structure can be adjusted by adjusting the geometrical parameters of the pore shape, such as the ratio of the side length of the triangle to the side length of the rectangle. The circular, triangular, and rectangular pore structures are all periodic structures. The introduction of triangular and rectangular pores induces significant alterations in the microstructural morphology and geometric distribution of TPMS structures.
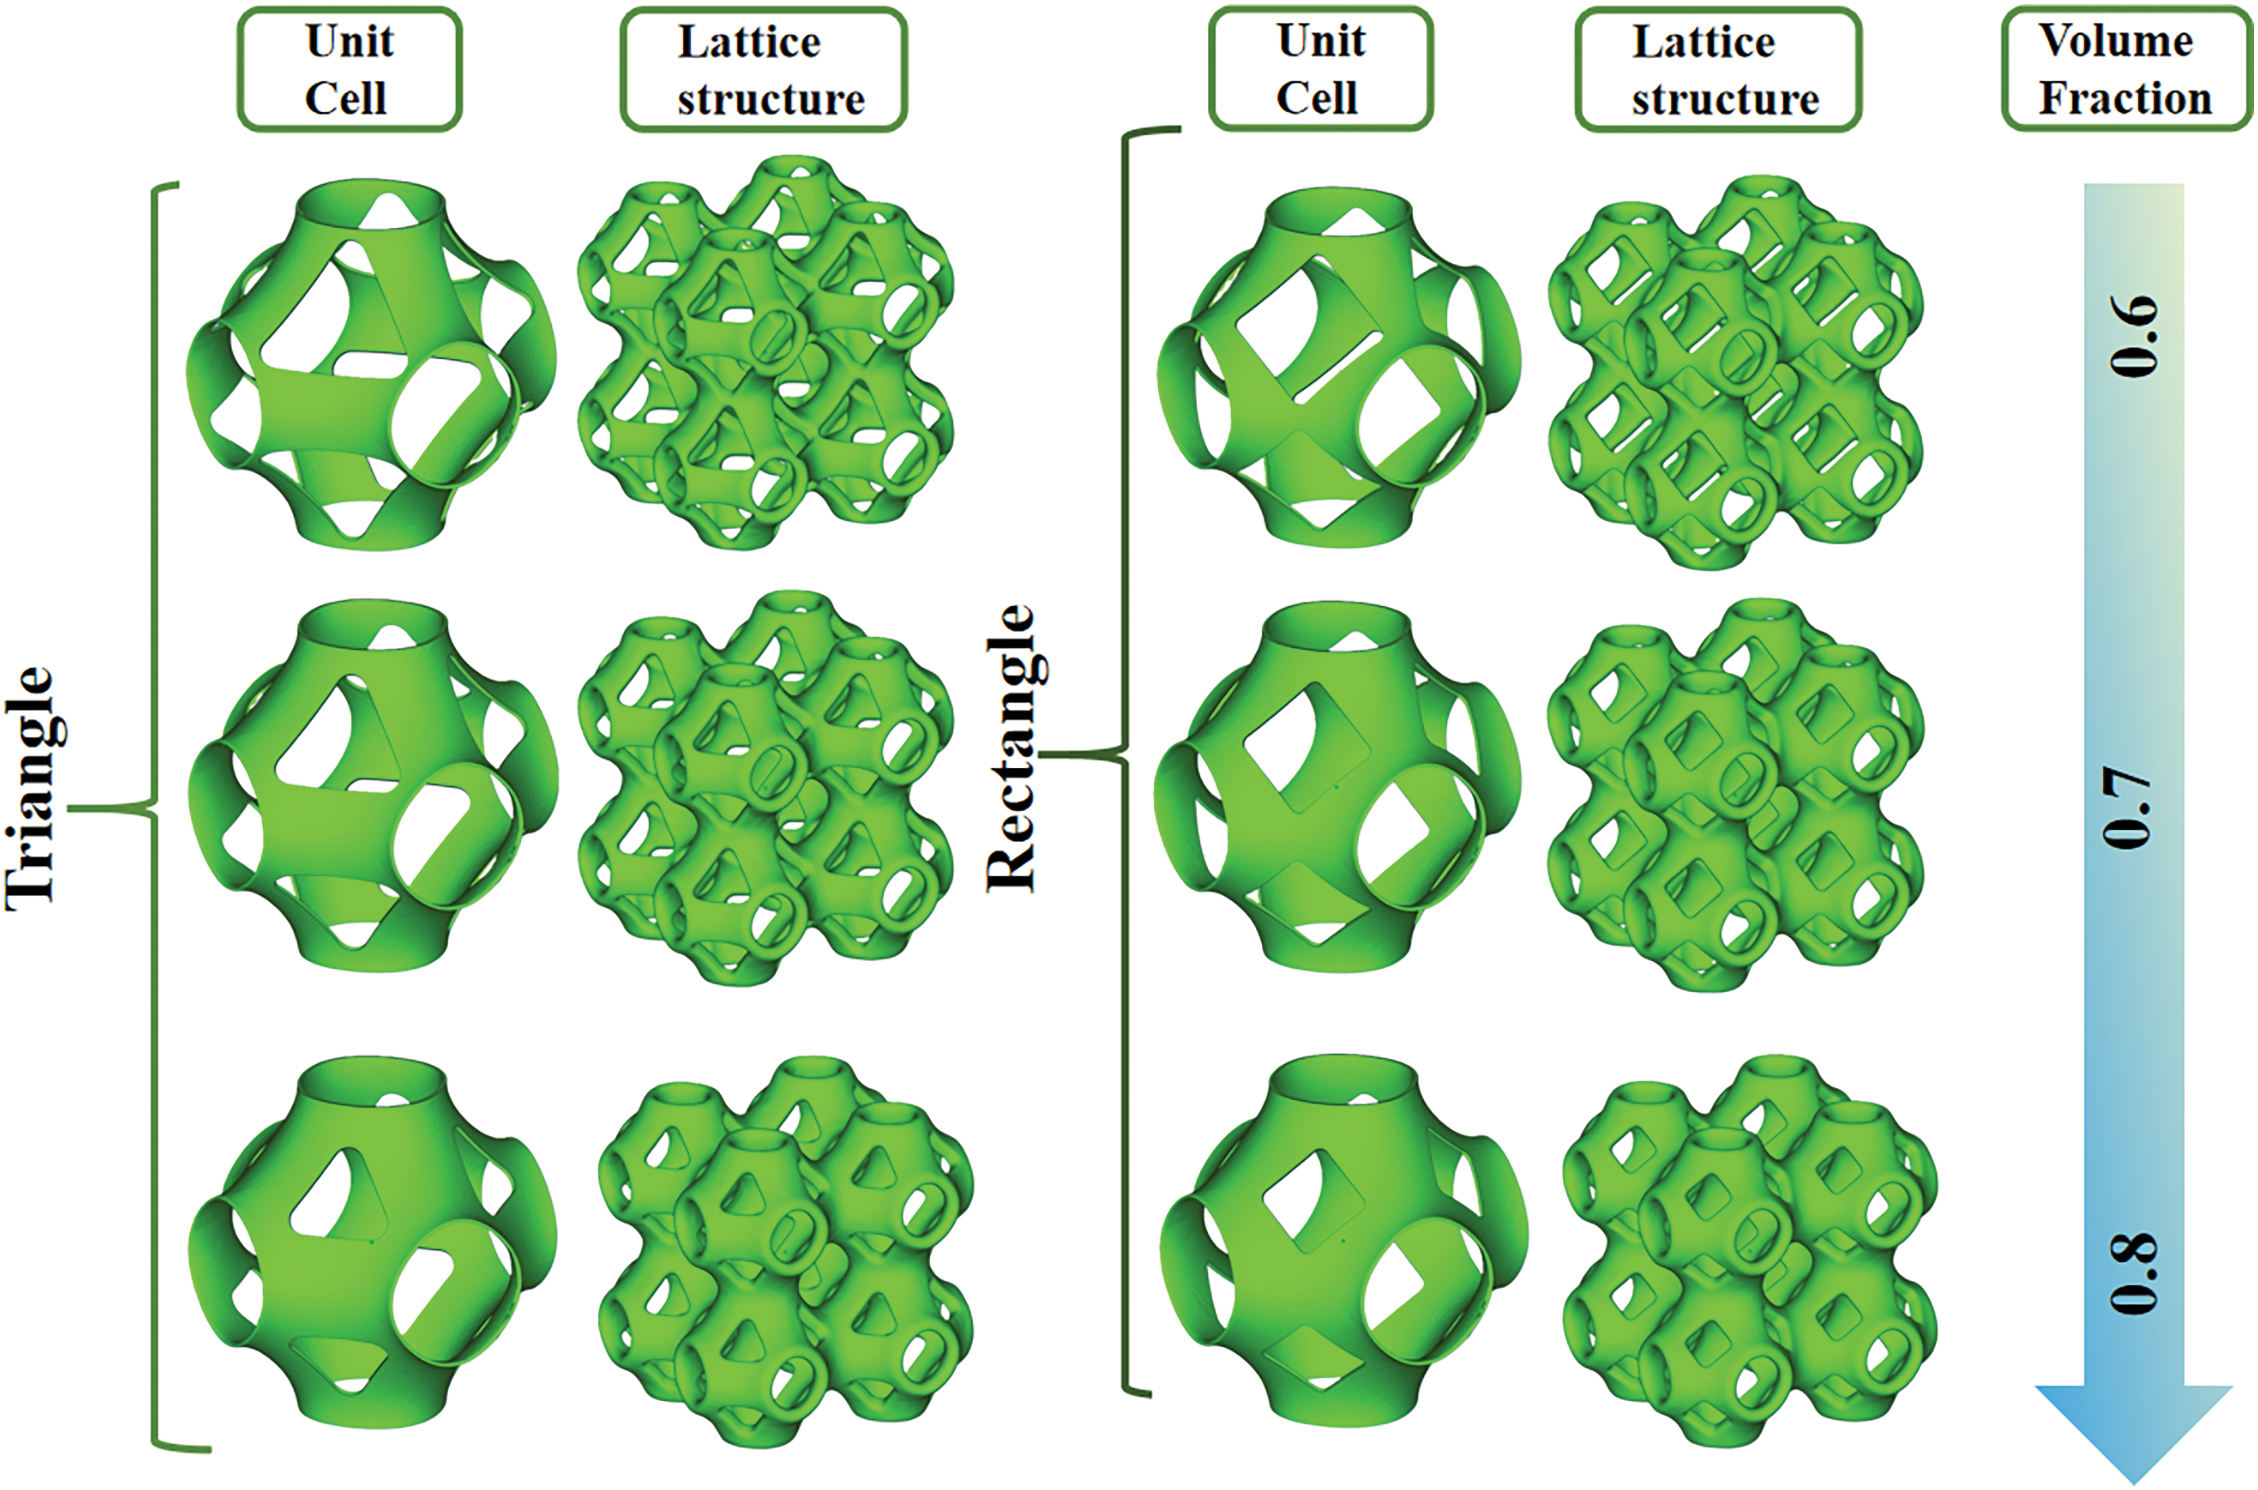
Figure 2: TPMS lattice structure with different pore shapes
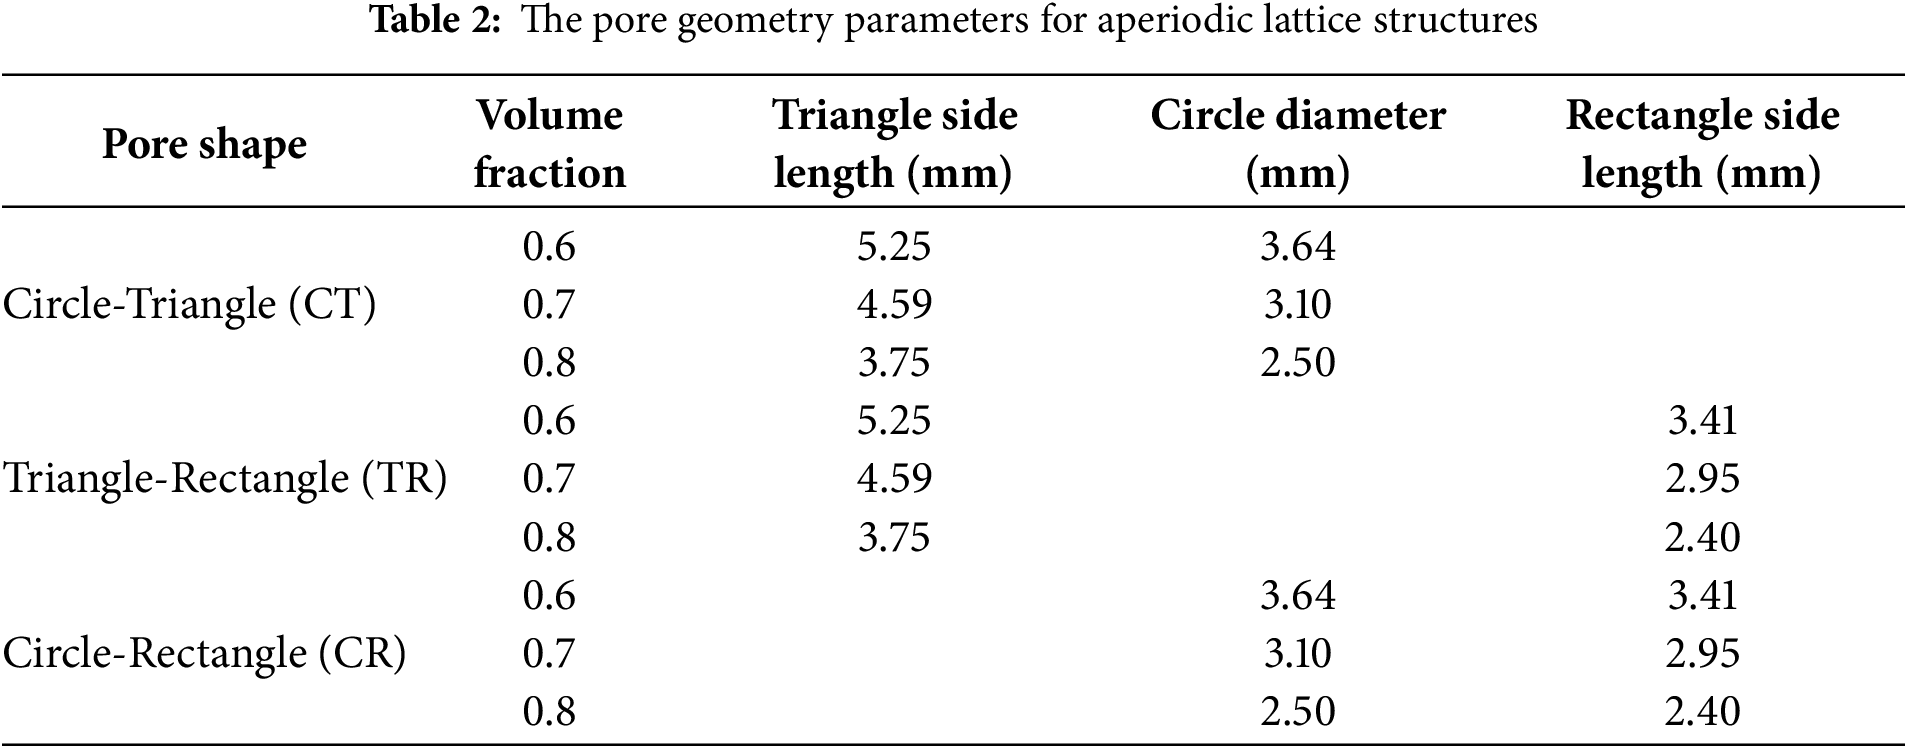
This study further expands the design space of porous structures. By combining unit cells with three fundamental pore shapes, along with thickness optimization and mirroring operations, composite porous structures with TPMS characteristics are successfully constructed. Specifically, six combined aperiodic structures are designed: circle-circle and triangle-triangle (CCTT), triangle-triangle and rectangle-rectangle (TTRR), circle-circle and rectangle-rectangle (CCRR), triangle-circle-circle-triangle (TCCT), rectangle-triangle-triangle-rectangle (RTTR) and rectangle-circle-circle-rectangle (RCCR). The resulting porous structure is shown in Figs. 3 and 4. Fig. 3 demonstrates a direct assembly method achieved by straightforward arrangement and thickening of periodic structural cells (CCTT, TTRR, and CCRR). Fig. 4 adopts the hybrid unit strategy. The two basic hole shapes are first integrated into a hybrid unit, and then the final lattice structure is constructed by thickening and mirror symmetry operations (TCCT, RTTR, and RCCR). In the lattice structure of the same pore shape, by controlling the size of the pore, (such as the side length of triangular and rectangular pores), it is possible to ensure that the volume of the removed material is basically the same, and thus the volume fraction of the lattice structure is basically the same. In lattice structures with different pore shapes, the area of the pores can be controlled to ensure that the structure volume is basically consistent. Thus ensuring the same volume fraction of the lattice structures. For the TPMS structure with the best performance, through the above method, a single variable can be controlled to ensure the accuracy and scientific nature of the experimental results. This multi-morphology composite design strategy not only expands the geometric configurations of porous structures but also provides new technical means for regulating their mechanical properties.
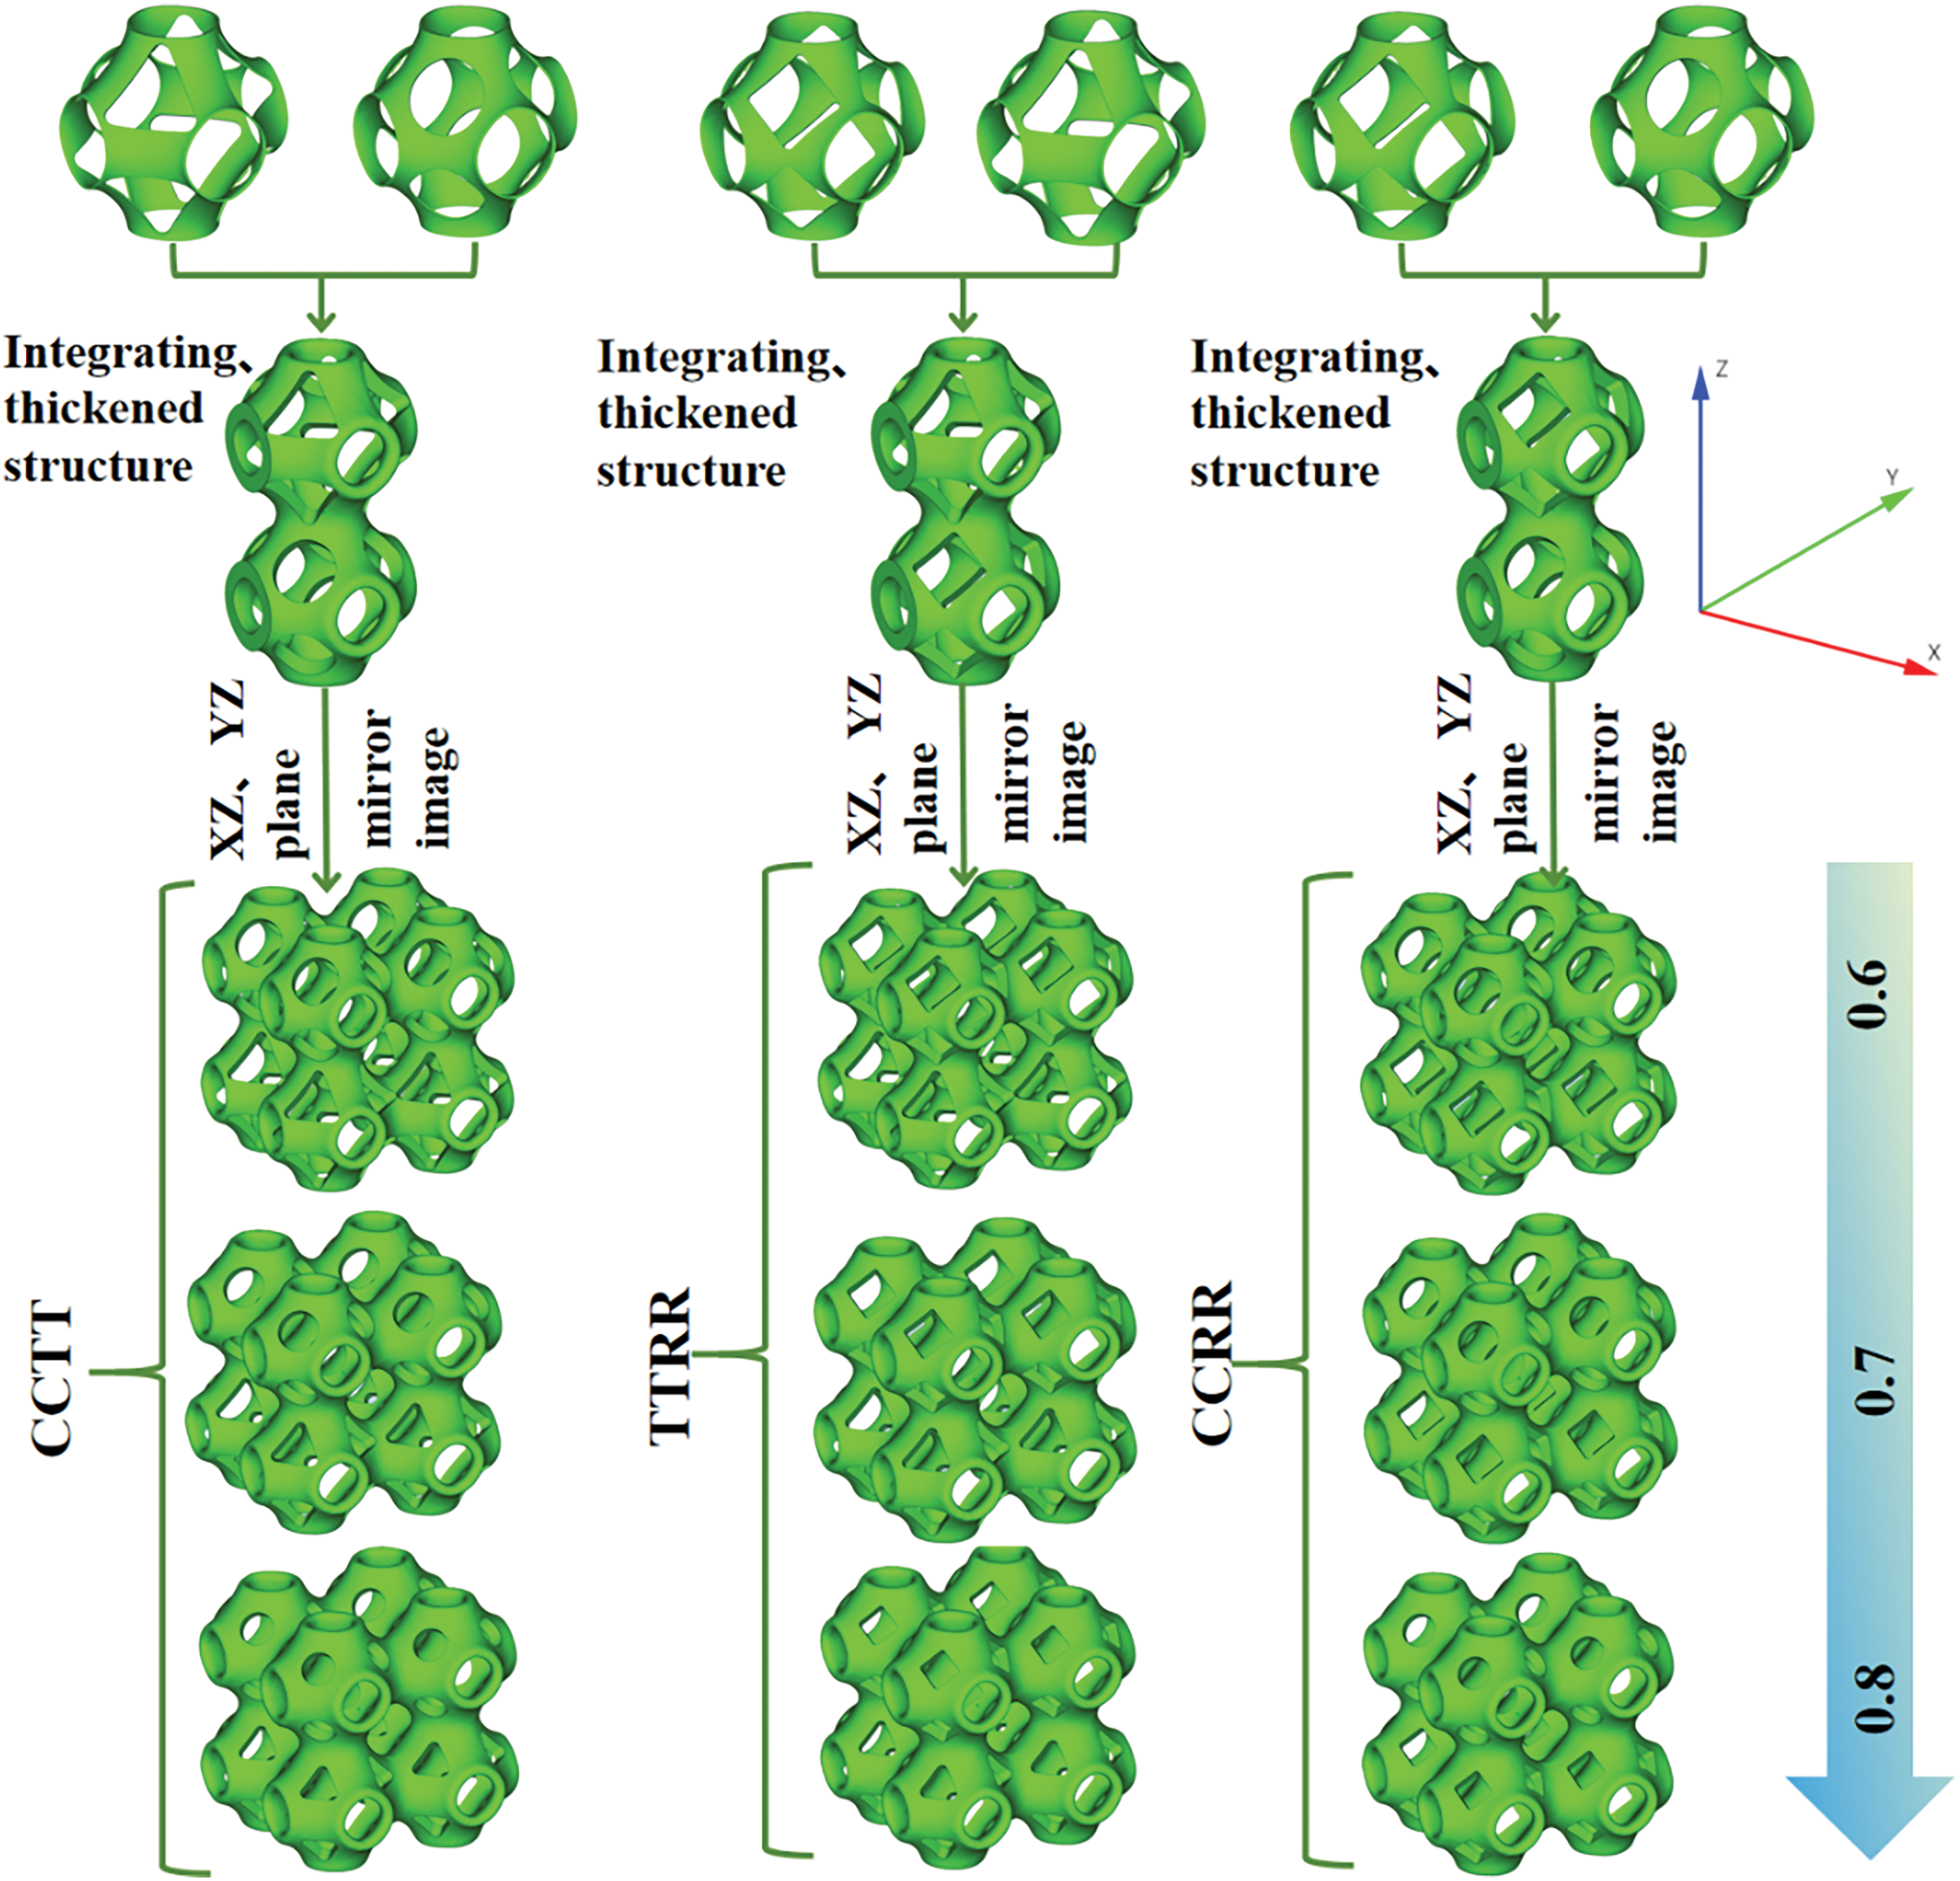
Figure 3: Aperiodic lattice structures for direct assembly
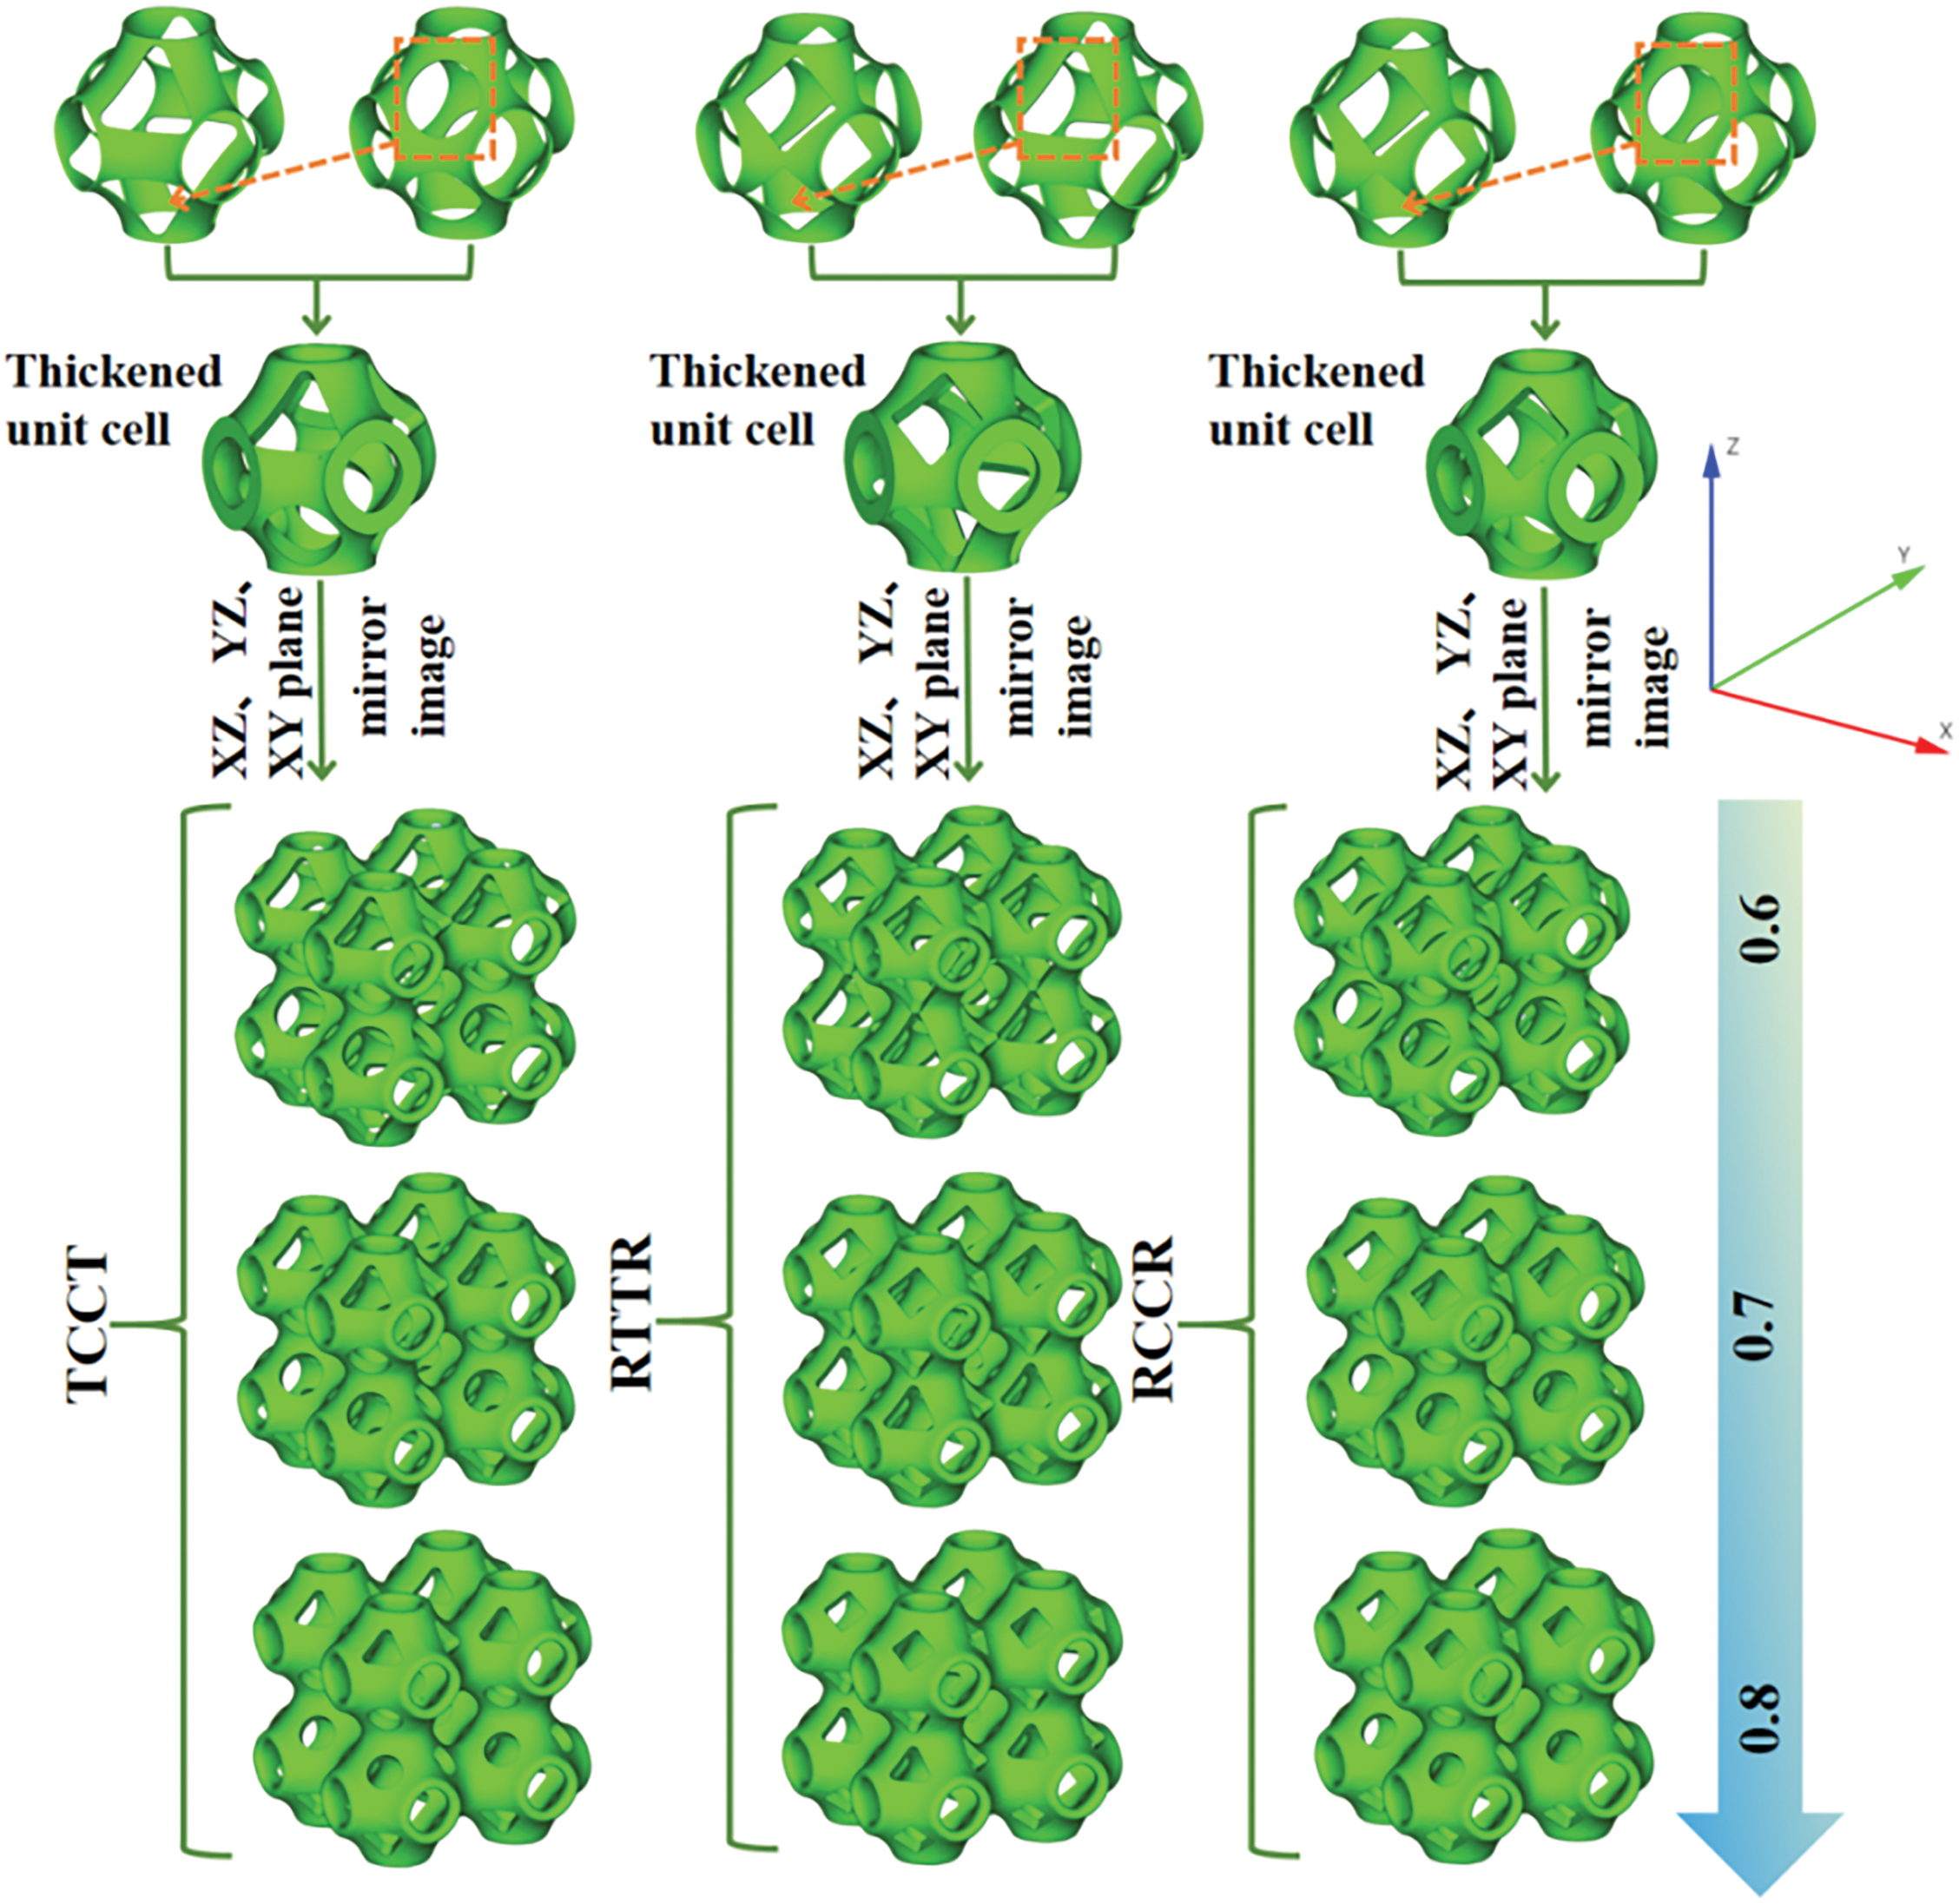
Figure 4: Aperiodic lattice structures of a hybrid unit cell
The pore geometry parameters for periodic and aperiodic lattice structures are shown in Tables 1 and 2.
2.3 Homogenization Analysis of Elastic Modulus of Lattice Structures
The elastic modulus is a key parameter for evaluating mechanical properties. It directly shows a material’s resistance to external forces during elastic deformation. This parameter describes the linear relationship between stress and strain. It also serves as an important measure of material stiffness [37]. This study employs the homogenization method to calculate elastic modulus. The method effectively determines the equivalent elastic modulus of composite materials. It is particularly suitable for analyzing porous structures. This method utilizes the material’s microstructural features. It simplifies complex mechanical problems into macroscopic homogenization issues. The approach provides an accurate evaluation of structural mechanical properties.
In the space Cartesian coordinate system, the stress-strain relationship of lattice structures can be expressed as:
where σx, σy, and σz denote the normal stresses in the x, y, and z directions, respectively. εx, εy, and εz denote the corresponding positive strains. For the shear component, τxy, τyz, and τzx express the shear stress in the xy, yz, and zx planes, respectively. γxy, γyz, and γzx express the corresponding shear strain.
In the analysis of the elastic properties of lattice structures, the equivalent elastic matrix C is a 6 × 6 matrix containing 36 independent unknown parameters. The elasticity matrix C satisfies the symmetry condition (Cij = Cji). Symmetry reduces independent parameters to 21. The lattice structure is an orthotropic material. Thus, the equivalent elasticity matrix C can be expressed as:
The lattice structures are symmetrical. It exhibits identical geometric features in the x, y, and z directions. Thus, Young’s modulus is equal in these directions. The shear modulus is also identical on the xy, yz, and zx planes. This symmetry results in some elements of the elastic matrix C being equal, namely C11 = C22 = C33, C21 = C31 = C32, and C44 = C55 = C66. Therefore, the elastic matrix C eventually contains only three independent parameters: C11, C21, and C44. Through numerical analysis, the anisotropy of the structure can be further revealed and characterized as:
where θ is the anisotropy index. It effectively characterizes the orientation dependence of lattice structures. When θ approaches 1, the lattice structure exhibits strong isotropic behavior. Its physical properties become consistent across different directions. As θ deviates from 1, lattice anisotropy becomes more pronounced. Significant performance variations emerge across different directions.
This study investigates the effects of volume fraction and pore shape on the anisotropy of lattice structures. The anisotropy indexes of lattice unit cells are calculated for various volume fractions and pore shapes. Tables 3 and 4 present the anisotropy indexes of lattice unit cells.
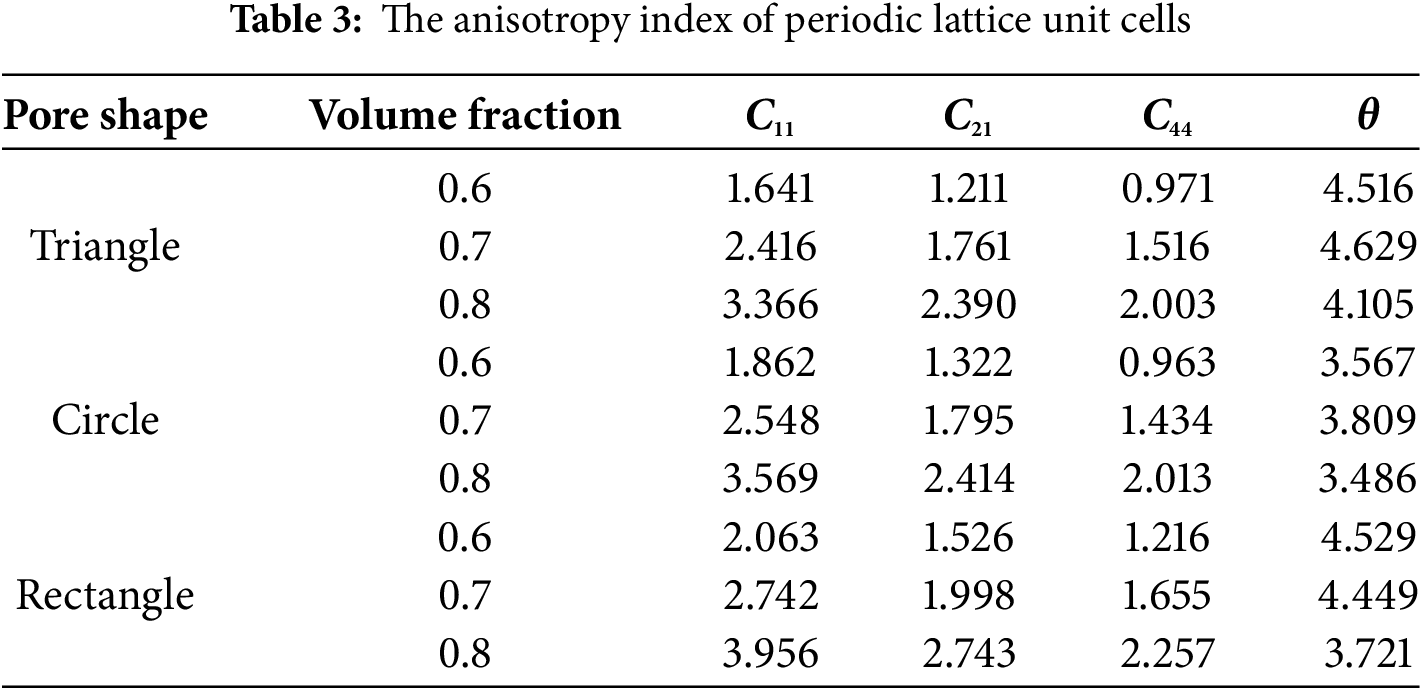
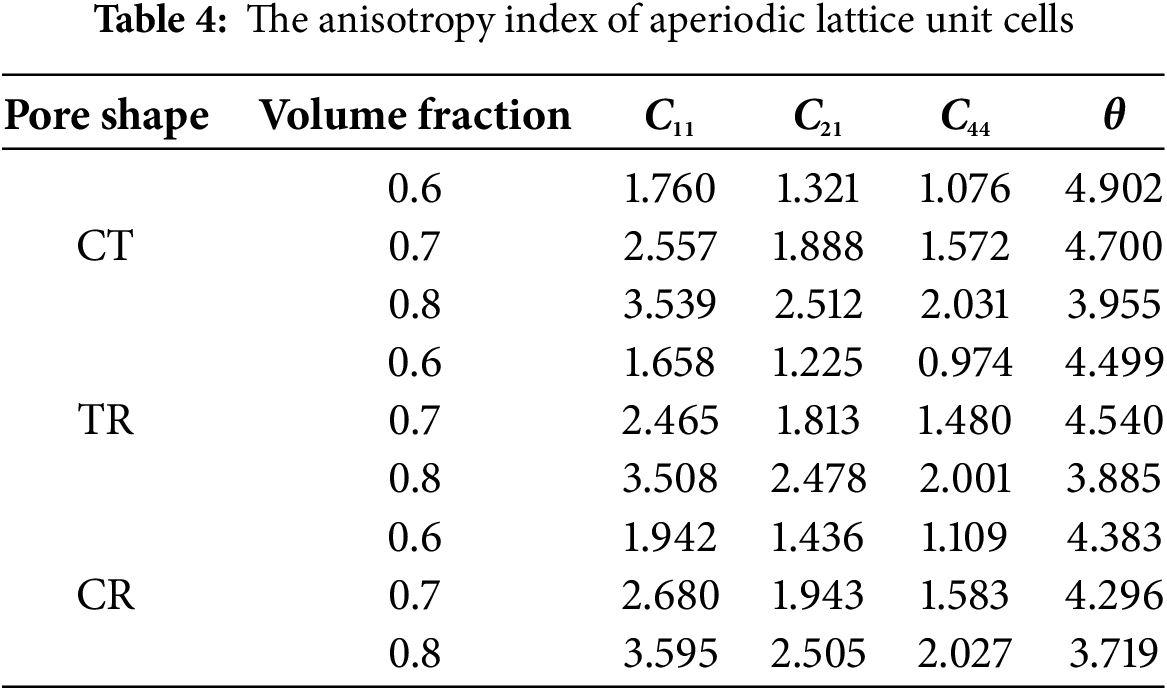
Table 3 results show that in periodic structures, the Triangle demonstrates the best anisotropy, while the Circle exhibits optimal isotropy. This behavior may be related to their geometric characteristics. The circle shape provides periodic stress distribution in all directions, leading to isotropic properties. The triangle shape shows orientation-dependent mechanical responses, resulting in anisotropic behavior. Table 4’s data indicate that in aperiodic structures, CT shows the best anisotropy, while CR performs worst. Comparative analysis reveals that periodic structures generally have better isotropy than aperiodic structures. Additionally, structural isotropy gradually improves with increasing volume fraction. This enhancement can be attributed to improved structural uniformity at higher volume fractions.
The elastic modulus can be expressed by Young’s modulus and shear modulus. Young’s modulus is a physical quantity that describes a material’s ability to undergo elastic deformation under compressive loading. It represents the material’s stiffness in resisting linear deformation. Shear modulus reflects the ability of a material to resist shear deformation. Both of them provide theoretical foundations for analyzing the mechanical properties of engineering structures. Fig. 5 presents the equivalent elastic modulus of unit cells with varying volume fractions and pore shapes. Fig. 6 displays the Young’s modulus and shear modulus of the unit cells.
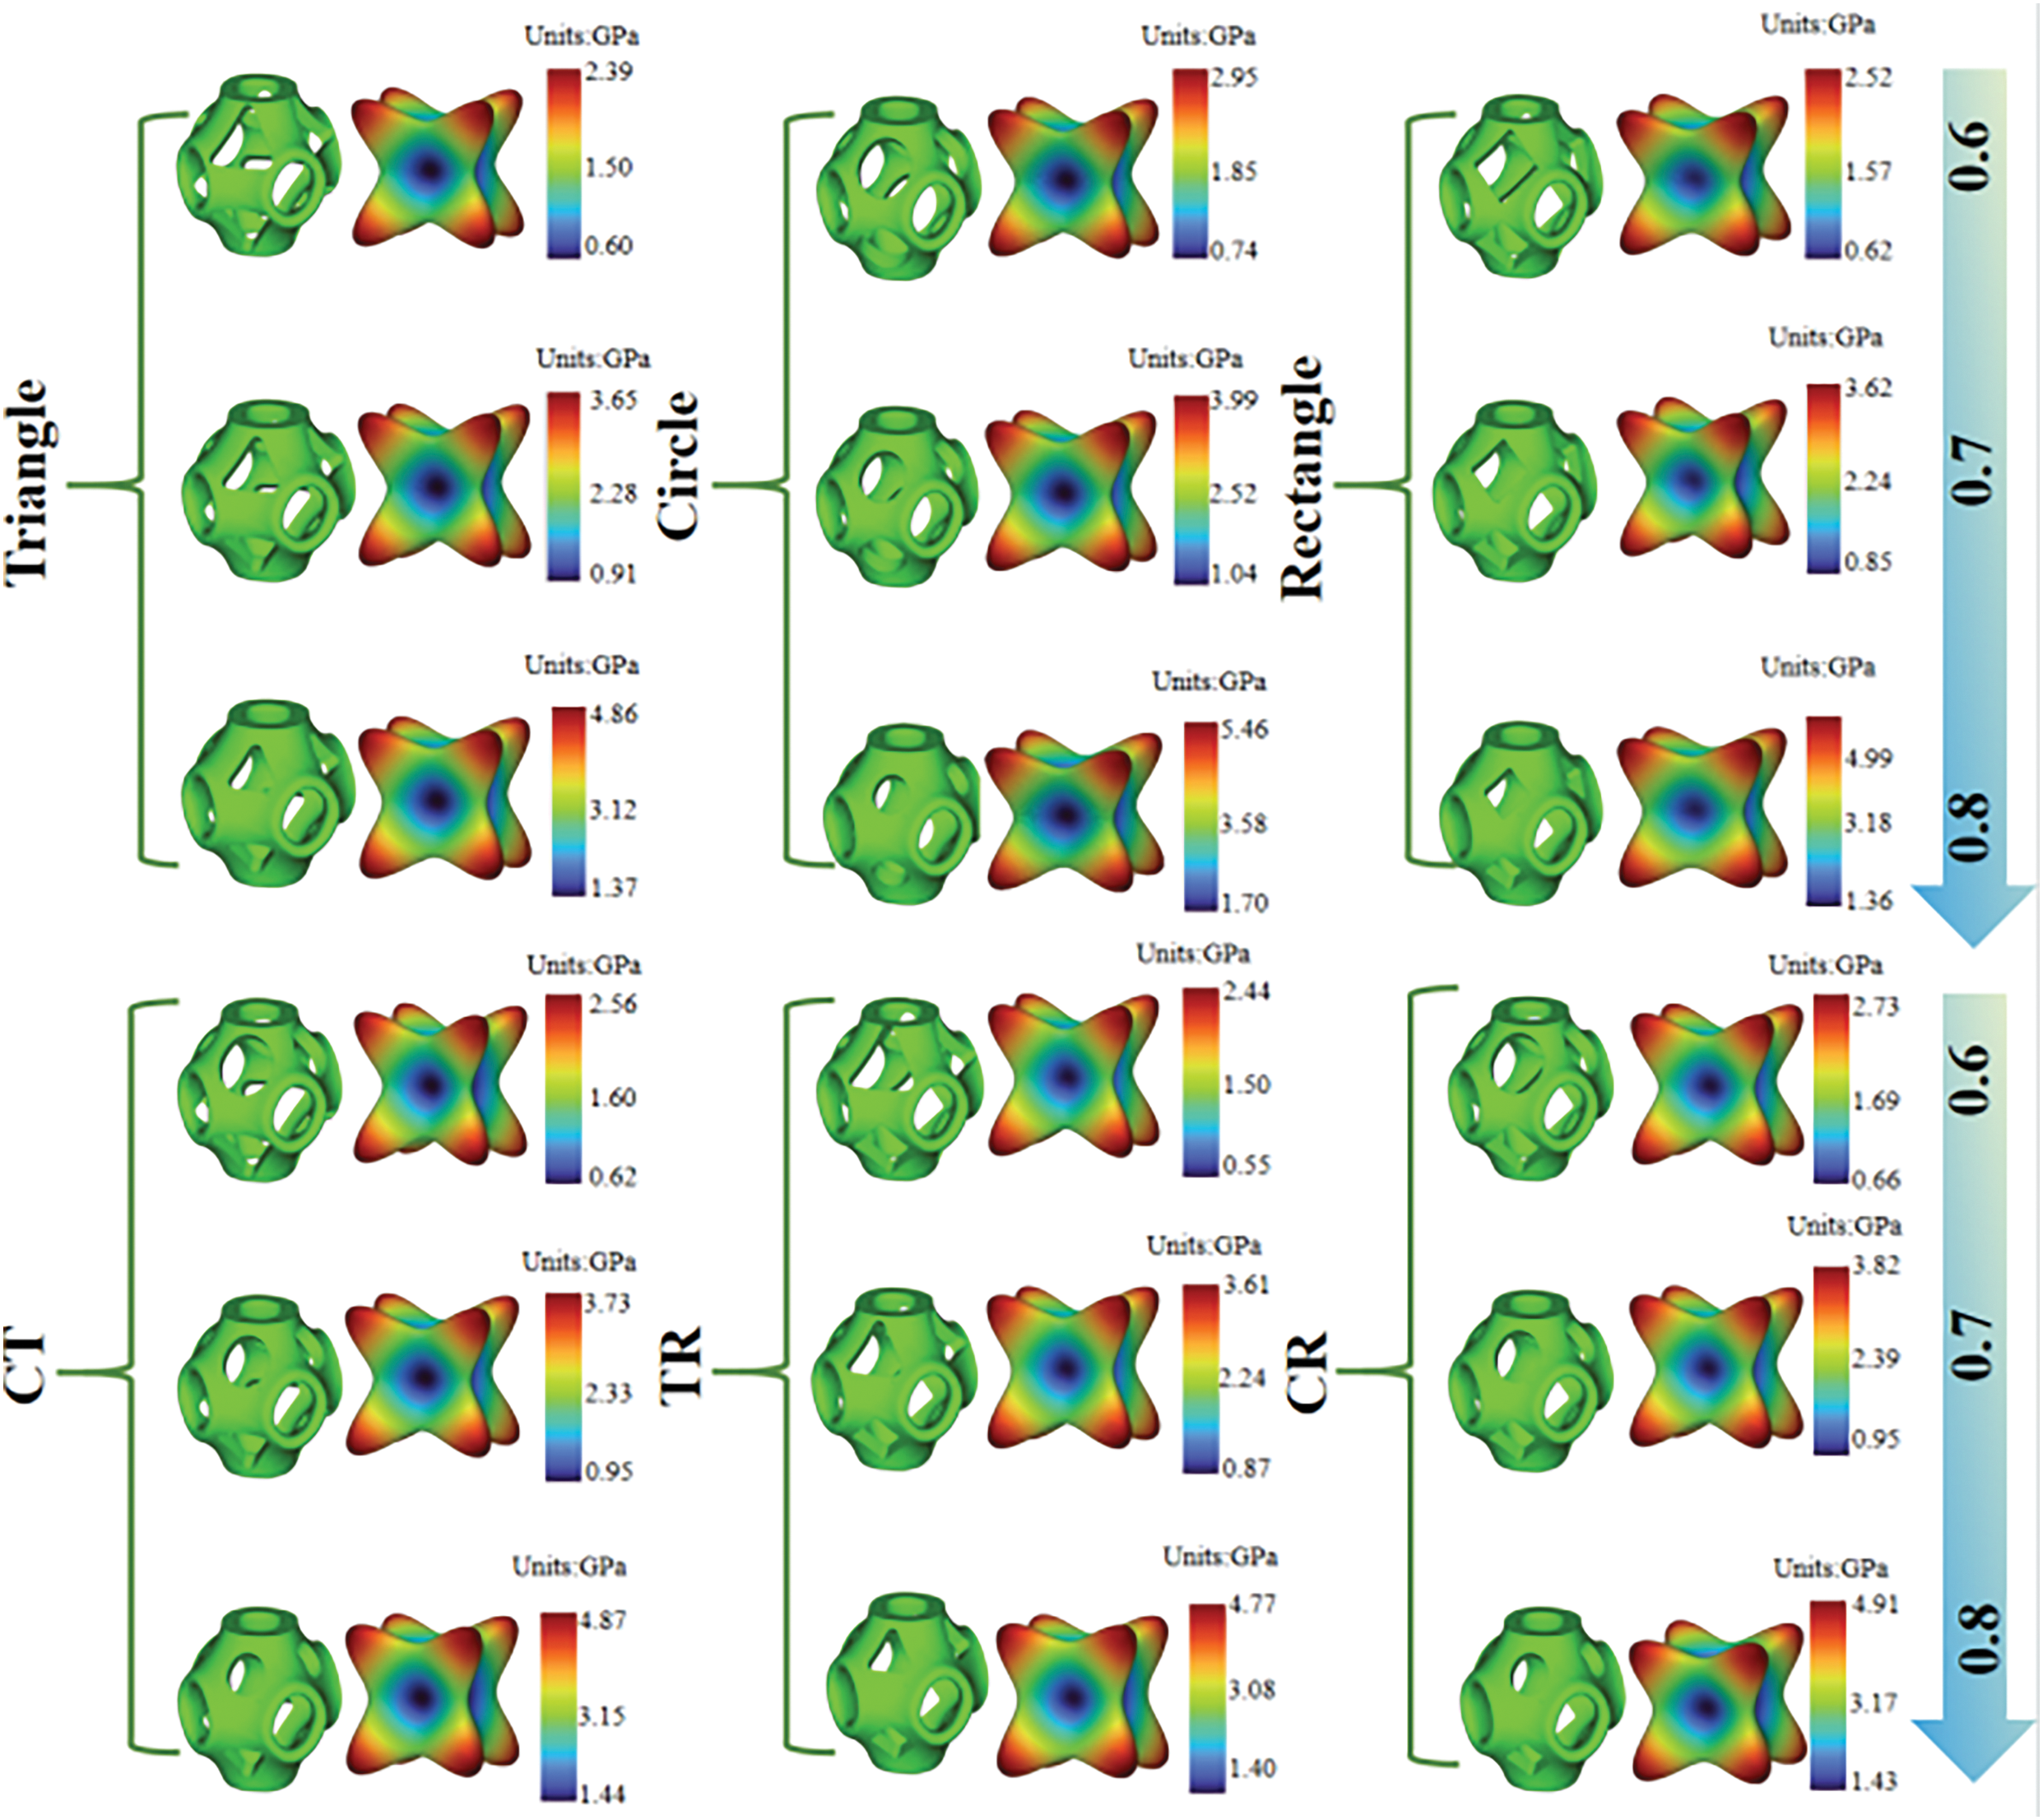
Figure 5: The equivalent elastic modulus diagram of unit cells
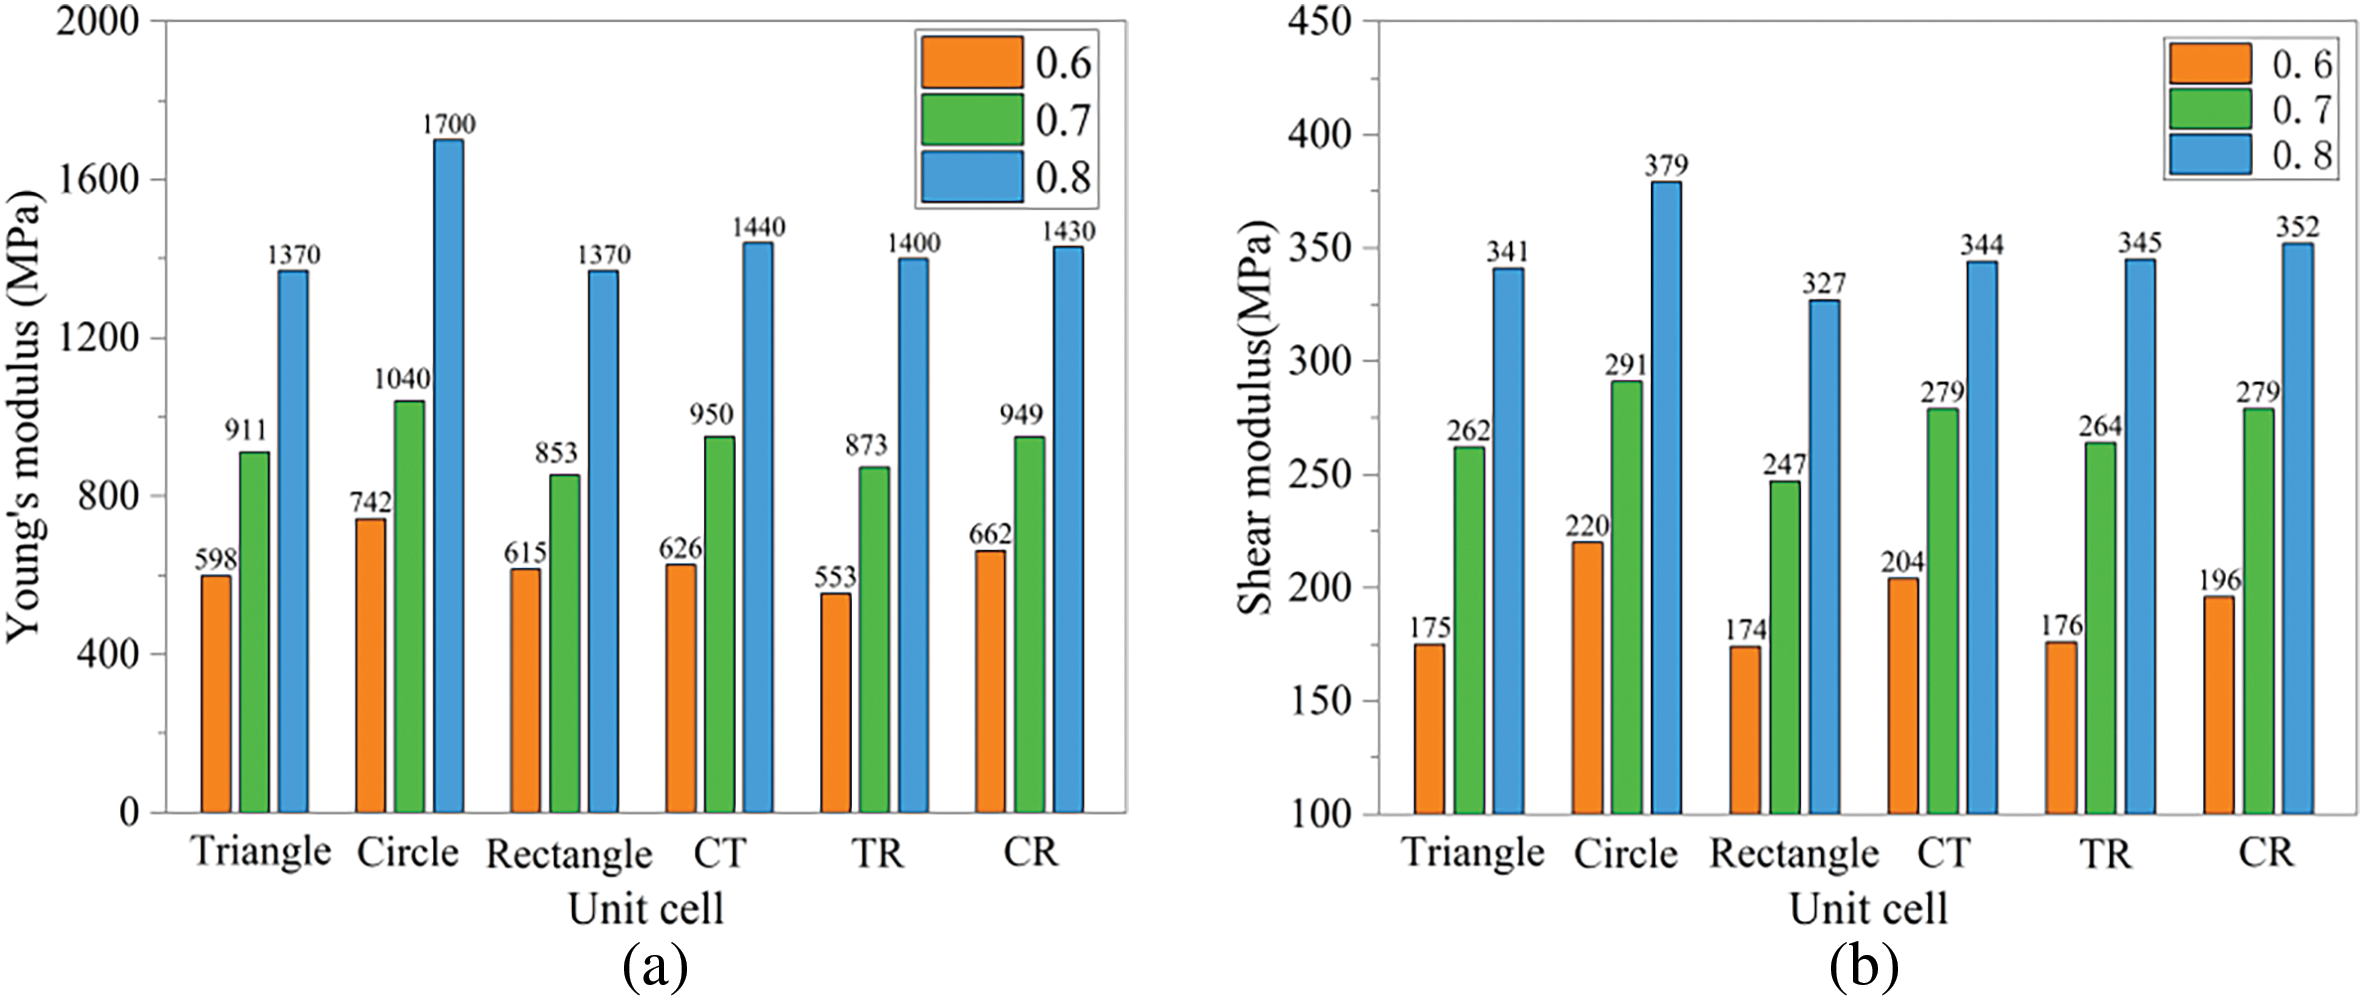
Figure 6: Young’s modulus and shear modulus of unit cells: (a) Young’s modulus; (b) Shear modulus
Young’s modulus and shear modulus are extracted from the inverse of matrix C as follows:
where E denotes Young’s modulus, G represents the shear modulus, and v characterizes the Poisson’s ratio. The calculation formula of the Young’s modulus is calculated as:
The practical shear modulus G is expressed as:
As shown in Fig. 5, the equivalent elastic modulus of the unit cell reaches its maximum value along the diagonal direction and shows the minimum value along the axial direction. This characteristic distribution pattern persists with increasing volume fractions. Fig. 6 demonstrates that both Young’s modulus and shear modulus of the unit cells increase with higher volume fractions. At identical volume fractions, circular pores exhibit the highest values for both Young’s modulus and shear modulus, followed by triangular pores which slightly outperform rectangular pores. Both CR and CT show lower values than circular pores but higher than triangular pores. TR consistently displays the minimum values, in agreement with the observed overall trend.
2.4 Additive Manufacturing and 3D Printing
The 3D printing material is adopted by 6061 aluminum alloy. The 3D printing technology is applied for AM. Samples with complex geometries are successfully prepared. The process demonstrates good forming capability. During the manufacturing process, the aluminum alloy feedstock is initially processed into metallic powder with controlled particle size distribution. A precision powder spreading system deposits the metallic powder uniformly onto the substrate surface, forming a powder layer with well-controlled thickness. A high-energy laser beam selectively irradiates the powder layer following pre-programmed 3D scanning paths, achieving layer-wise metal consolidation through melting and solidification. The entire fabrication process is continuously conducted under inert gas shielding, effectively suppressing oxidation reactions during the metal molten phase. The results show that the aluminum alloy lattice structures fabricated by this forming technology not only have excellent dimensional accuracy, but also maintain good mechanical properties.
3 Compression Simulation and Experiments
Abaqus is used to simulate the mechanical response of lattice structures under compressive loads. The array and the thickened lattice structures are introduced as the three-dimensional model, and the plate structure is added to simulate the actual compression test conditions. Key mechanical parameters such as density, Young’s modulus, Poisson’s ratio, and yield strength of isotropic lattice materials are set, respectively. During model assembly, the lattice structure is placed between upper and lower rigid plates, and the interaction between the plates and the specimen is accurately simulated by defining contact pairs. The upper rigid plate is displaced along the z-axis at a constant rate of 10 mm/min. The lower rigid plate is fully constrained. An optimized mesh scheme is applied to the plate components to guarantee computational accuracy. During computation, Abaqus solves nonlinear equilibrium equations iteratively. Geometric nonlinearity is considered, including large deformation effects. If geometric nonlinearity is ignored, the simulation will fail to predict progressive failure modes (such as the stress phase of the platform). Material nonlinearity is also accounted for, such as plastic deformation and hardening effects. If the material nonlinearity is ignored, the energy absorption characteristics of the lattice structure cannot be accurately evaluated. The interaction between geometry and material nonlinearity can more accurately predict the deformation mode and energy absorption performance of lattice structures under quasi-static compression experiments. These combined factors enable accurate simulation of progressive deformation during compression. The force-displacement curves obtained from the simulation are analyzed. The mechanical response characteristics of the lattice structure under compressive loading are revealed. These results provide a reliable theoretical basis for evaluating its mechanical performance. The finite element analysis diagram of the lattice structure is shown in Fig. 7.
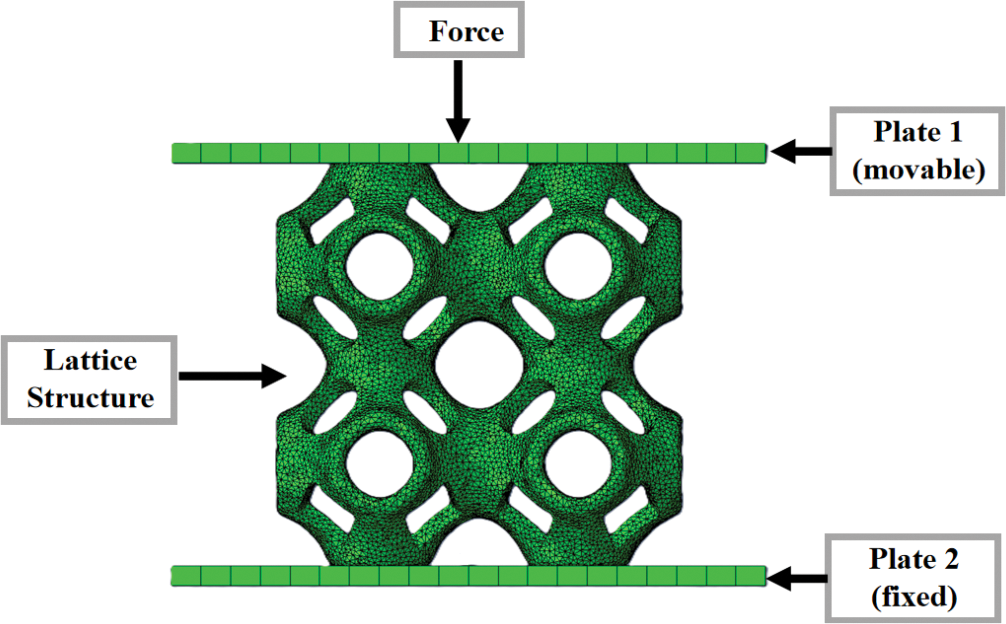
Figure 7: Finite element analysis diagram of lattice structures
Quasi-static compression experiments are conducted to validate the simulation results. As one of the fundamental methods for mechanical property characterization, this technique primarily evaluates materials’ deformation resistance and damage tolerance under external loading [38]. The lattice structures fabricated by AM are subjected to compressive mechanical testing using a universal testing machine under ambient temperature conditions. Before testing, the lattice structure is precisely centered and mounted on the testing machine platform to ensure periodic load distribution across the bearing surface. The loading rate is set to 10 mm/min. This rate meets quasi-static requirements while synchronizing with the simulated compression process. During the experimenting process, the machine applied compressive load to the lattice structure at a constant rate. Force-displacement data are acquired synchronously in real time. The experiment proceeds until either significant structure deformation occurs, or the predefined termination criteria are met. To ensure the reliability and consistency of the experimental data, standardized test parameters are set for all lattice structure samples. Sample size (20 mm × 20 mm × 20 mm), loading rate (10 mm/min), and restraint mode (fixed bottom, uniaxial compression). The same universal testing machine is used throughout the experiment and carried out under constant environmental conditions. To ensure the reliability of the experimental data, the experiment is repeated three times for each lattice structure, and the final data are taken as the average of the three tests. This process conforms to the American Society of Testing Materials (ASTM) standard for quasi-static compression testing of porous materials. The compression experiment diagram of the lattice structure is shown in Fig. 8.
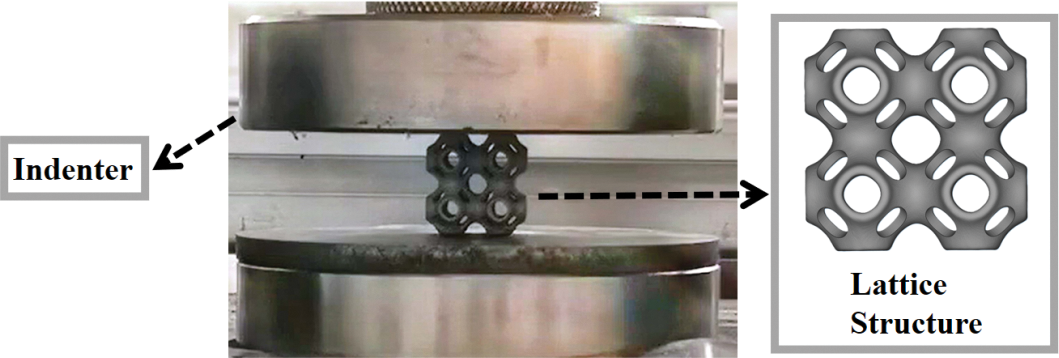
Figure 8: Compression experiment diagram
4 Analysis of the Compression Deformation Pattern, Mechanical Properties, and Energy Absorption Properties of Lattice Structures
Since the analysis methods of lattice structures with the same pore shape in the simulation process are consistent, only the lattice structures with a volume fraction of 0.7 are listed in this paper, and their simulated deformation processes are fully representative. Fig. 9 demonstrates the progressive deformation evolution of these lattice structures under simulated compressive loading. As shown in Fig. 9, the lattice structures with different pore shapes all exhibit progressive collapse characteristics during compression. The deformation pattern initiates from the upper layers and subsequently propagates downward through the structural hierarchy. When the structure reached the critical failure state, its bottom region maintained a periodic stress distribution without observable shear deformation. The stiffness of the structure can be effectively increased by this progressive deformation mechanism. When subjected to heavy impact loads, the stress is rationally distributed, resulting in a significant improvement in impact resistance.
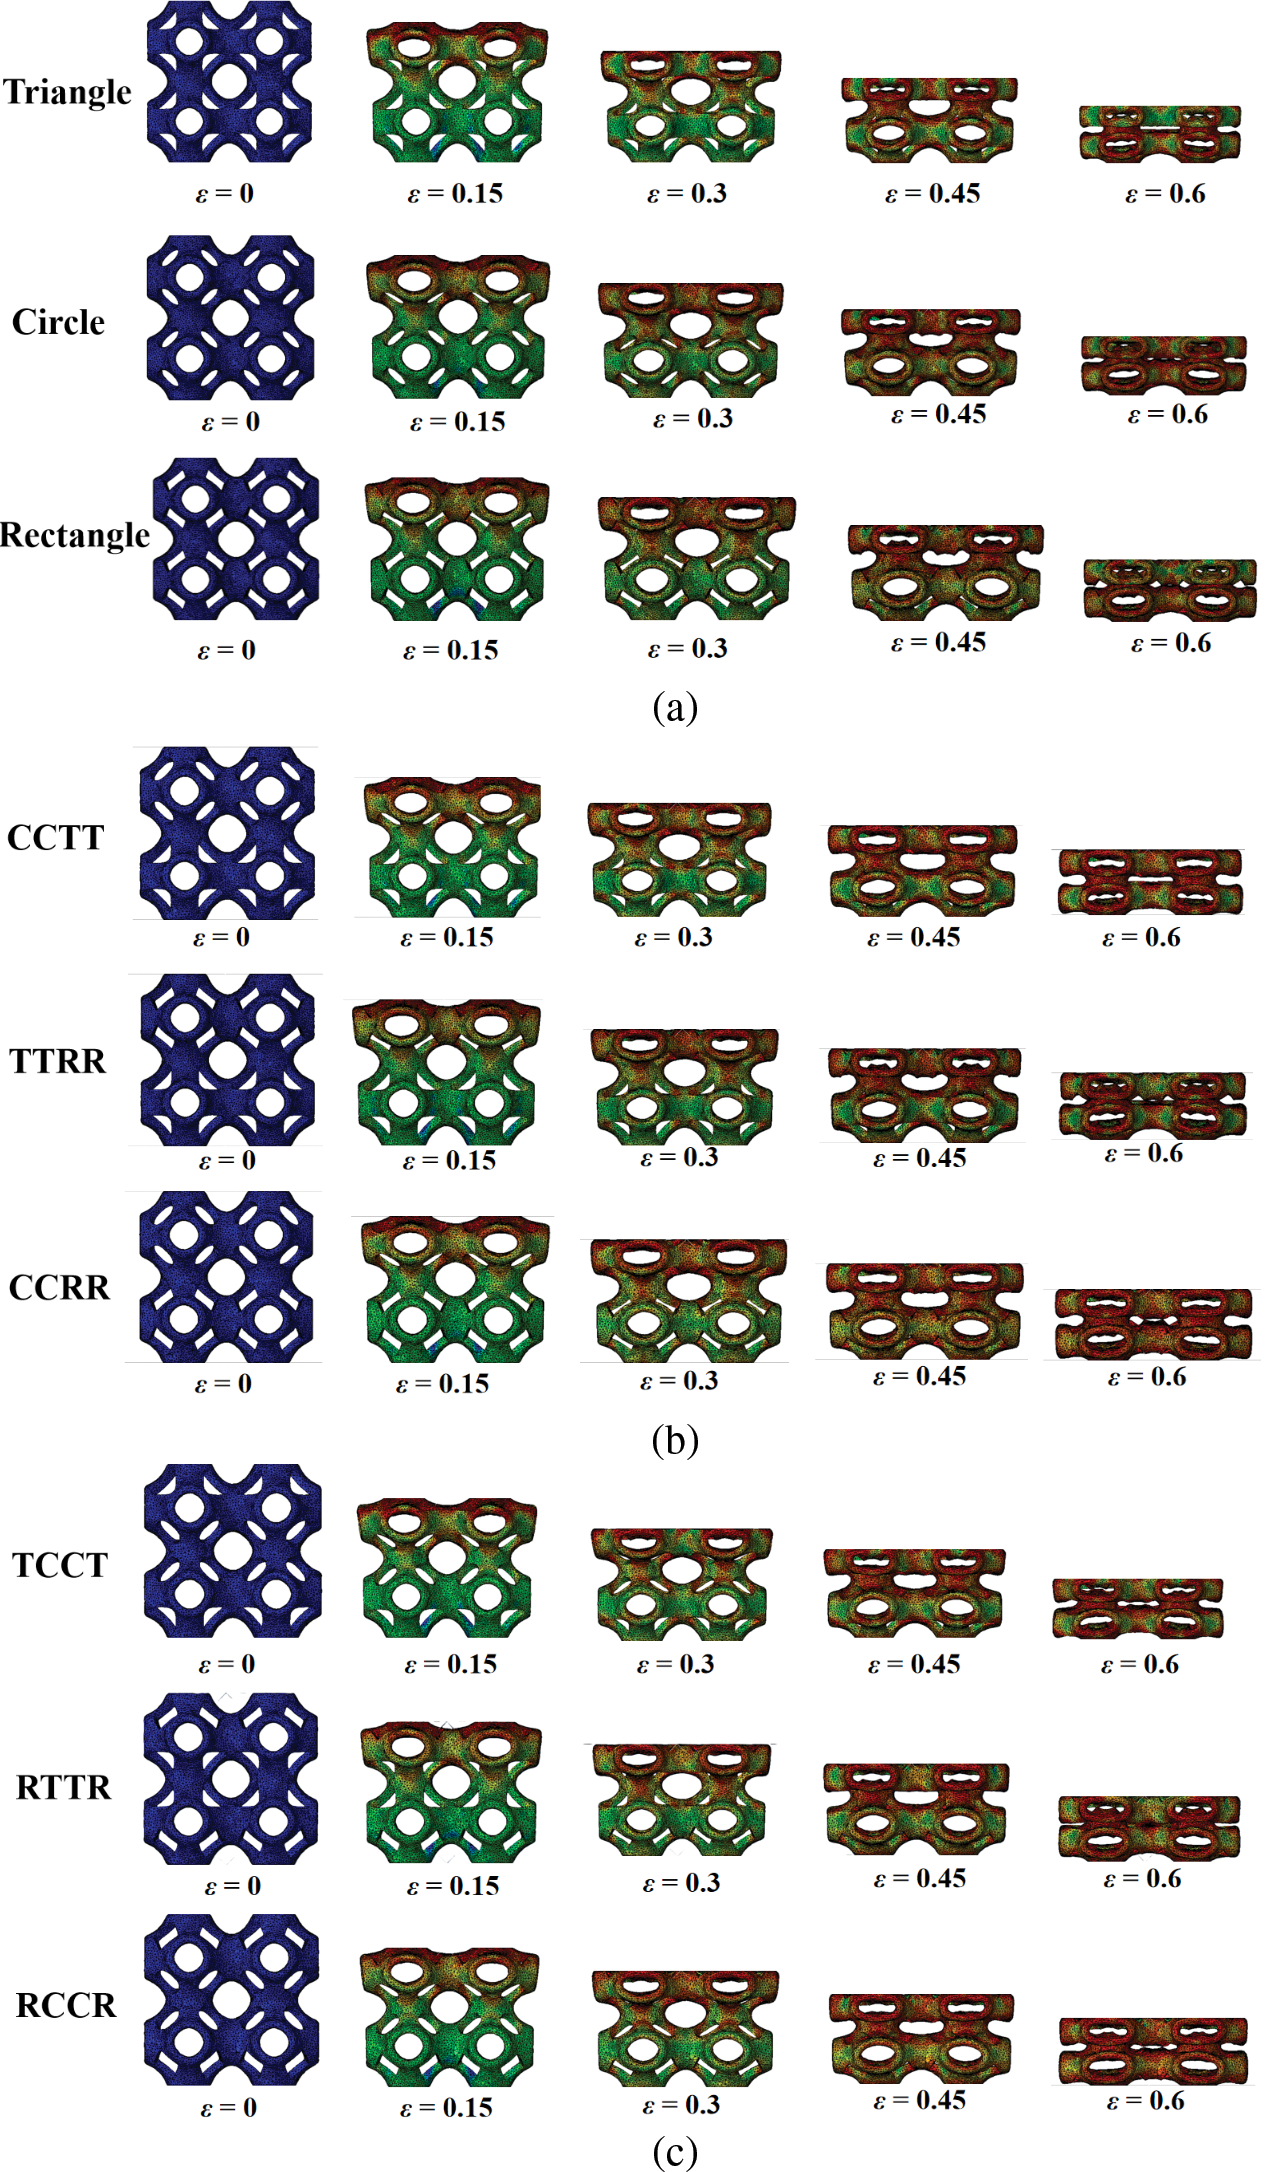
Figure 9: Simulation of compression deformation of different lattice structures: (a) Triangle, Circle, and Rectangle; (b) CCTT, TTRR, and CCRR; (c) TCCT, RTTR, and RCCR
Fig. 10 presents a comparative analysis of the compressive deformation between simulations and experiments for the Circle, Rectangle, and TCCT lattice structures at 0.7 volume fraction. The experimental results demonstrate that the measured deformation shows high consistency with simulation results, effectively validating the reliability of the simulation analysis. Since Local defects and printing deviations may be introduced during metal AM. As a result, discrepancies are observed in local deformation behaviors between experiments and simulations. TCCT shows some degree of shear deformation when the strain value is large, but the overall deformation trend is consistent with the simulation.
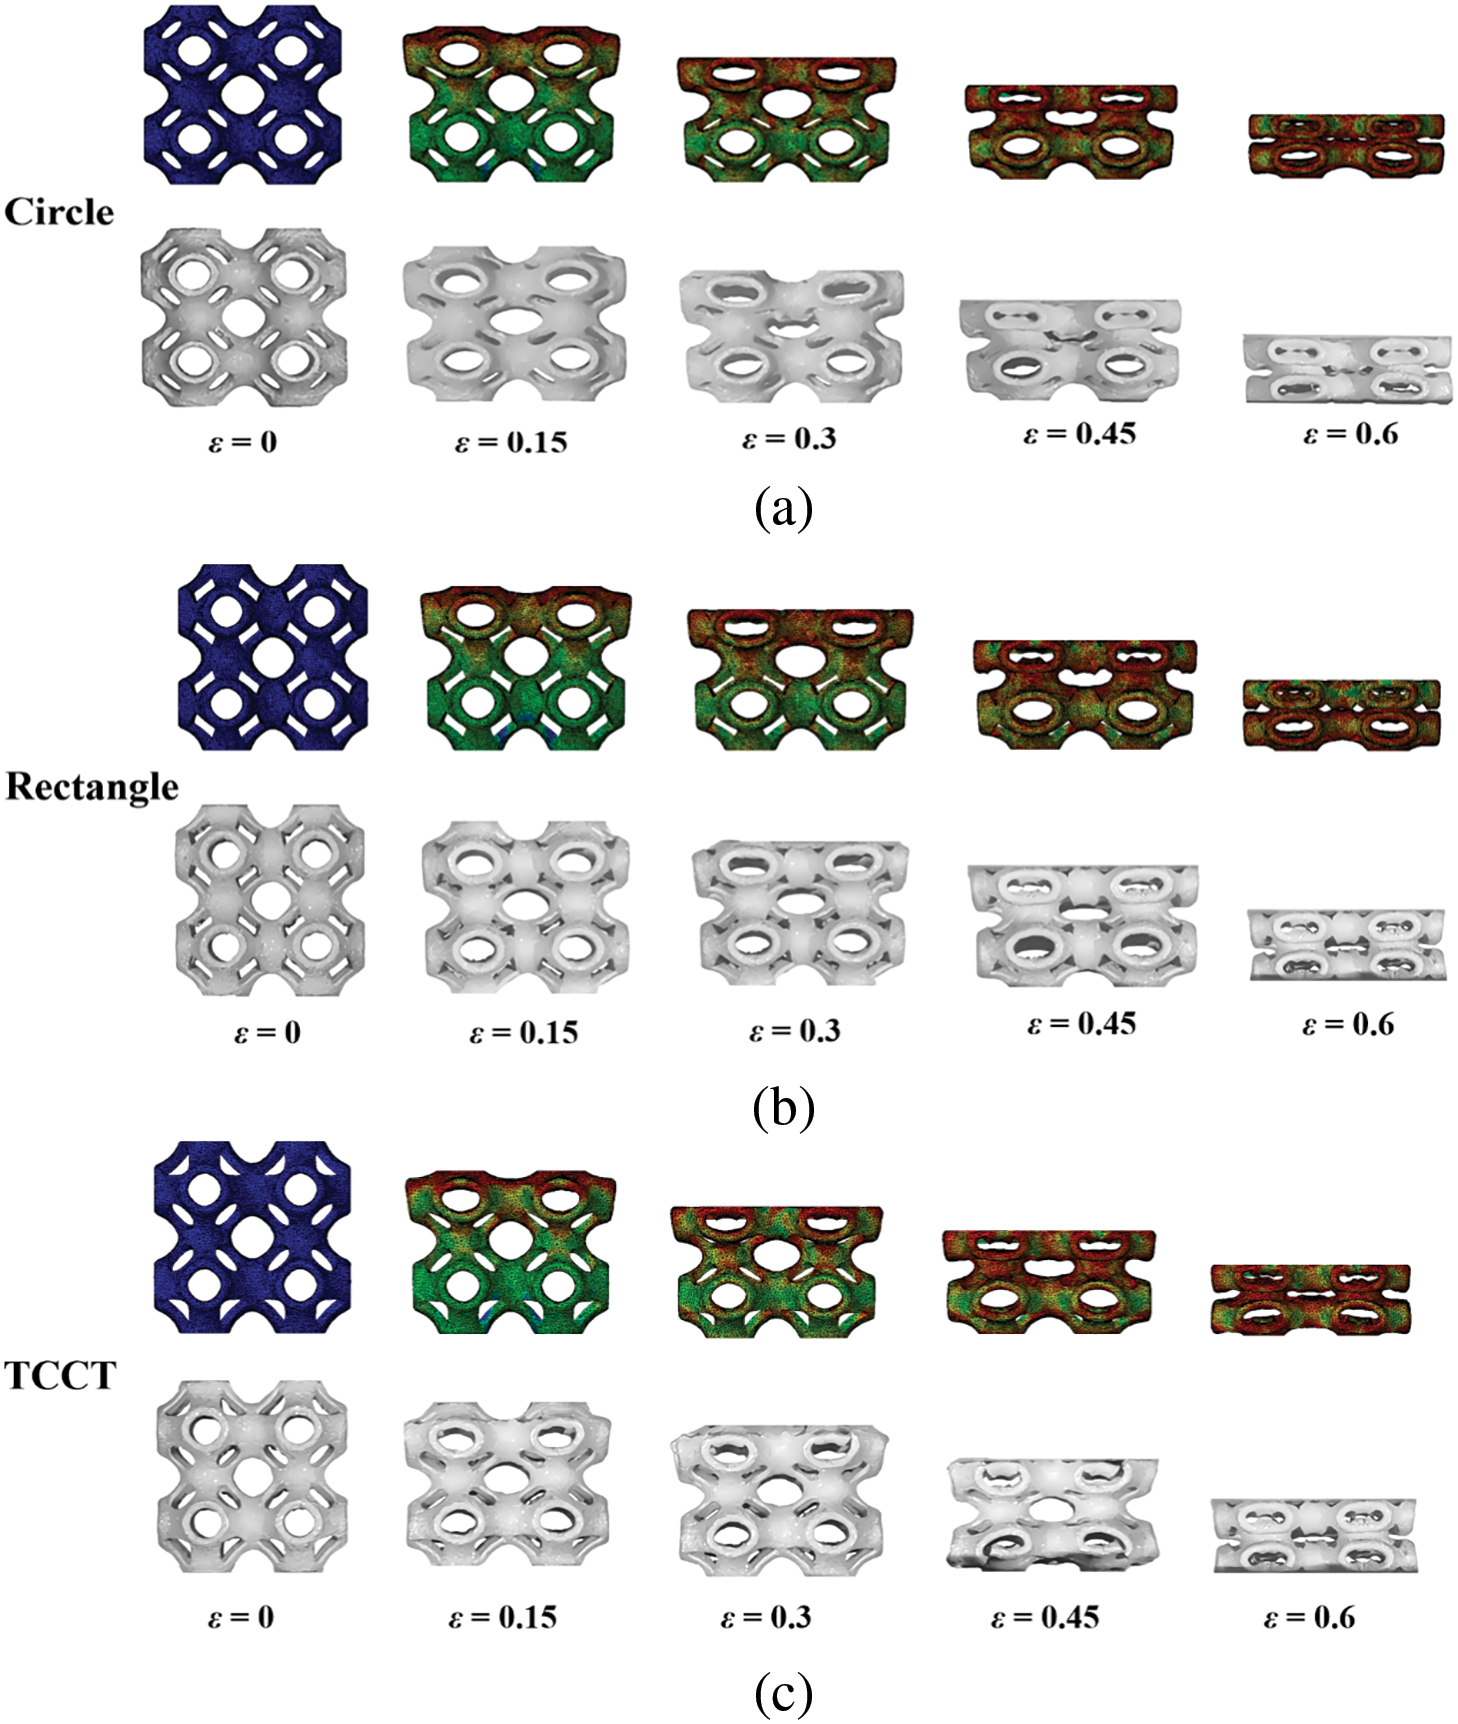
Figure 10: Simulating and experimenting with lattice structures compression deformation: (a) Circle; (b) Rectangle; (c) TCCT
The mechanical properties of lattice structures are of great importance to the design and application of materials. The mechanical properties of lattice structures are evaluated based on three key indicators: Young’s modulus, compressive strength, and toughness. Young’s modulus serves as a classical parameter for material stiffness, characterizing the stress-strain relationship during the elastic deformation stage. Compressive strength indicates the ultimate load-bearing capacity of materials in the elastic deformation stage. Toughness reflects the compressive performance of materials from the perspective of energy dissipation.
Under compressive loading, metallic materials exhibit three characteristic deformation stages in their lattice structure evolution. The first stage is elastic deformation. External forces cause elastic deformation in the material. The lattice spacing changes. The stress-strain curve shows a steep slope in this stage. This stage lasts the shortest time. The second stage is the plastic deformation. As the external force continuously increases, slip or twinning occurs within the material’s lattice, leading to irreversible permanent deformation. The material exhibits nonlinear characteristics in its stress-strain relationship. The third stage is the destruction. When the external force exceeds the material’s bearing capacity, the lattice structure collapses and interatomic bonds fracture. The material is finally compressed into a solid, losing its original mechanical properties. This process comprehensively reflects the complete evolution of metallic materials from elastic deformation to ultimate destruction.
The stress-strain curve serves as a crucial mechanical indicator for characterizing material deformation behavior under applied stress. With stress plotted on the ordinate and strain on the abscissa. Stress-strain curve fully characterizes the mechanical response of materials throughout the complete deformation process, from elastic deformation through plastic deformation to final destruction. The stress-strain curve data can be obtained by converting the force-displacement curve data. The simulated stress-strain curves and elastic deformation curves of the lattice structures with different volume fractions and pore shapes are shown in Fig. 11.
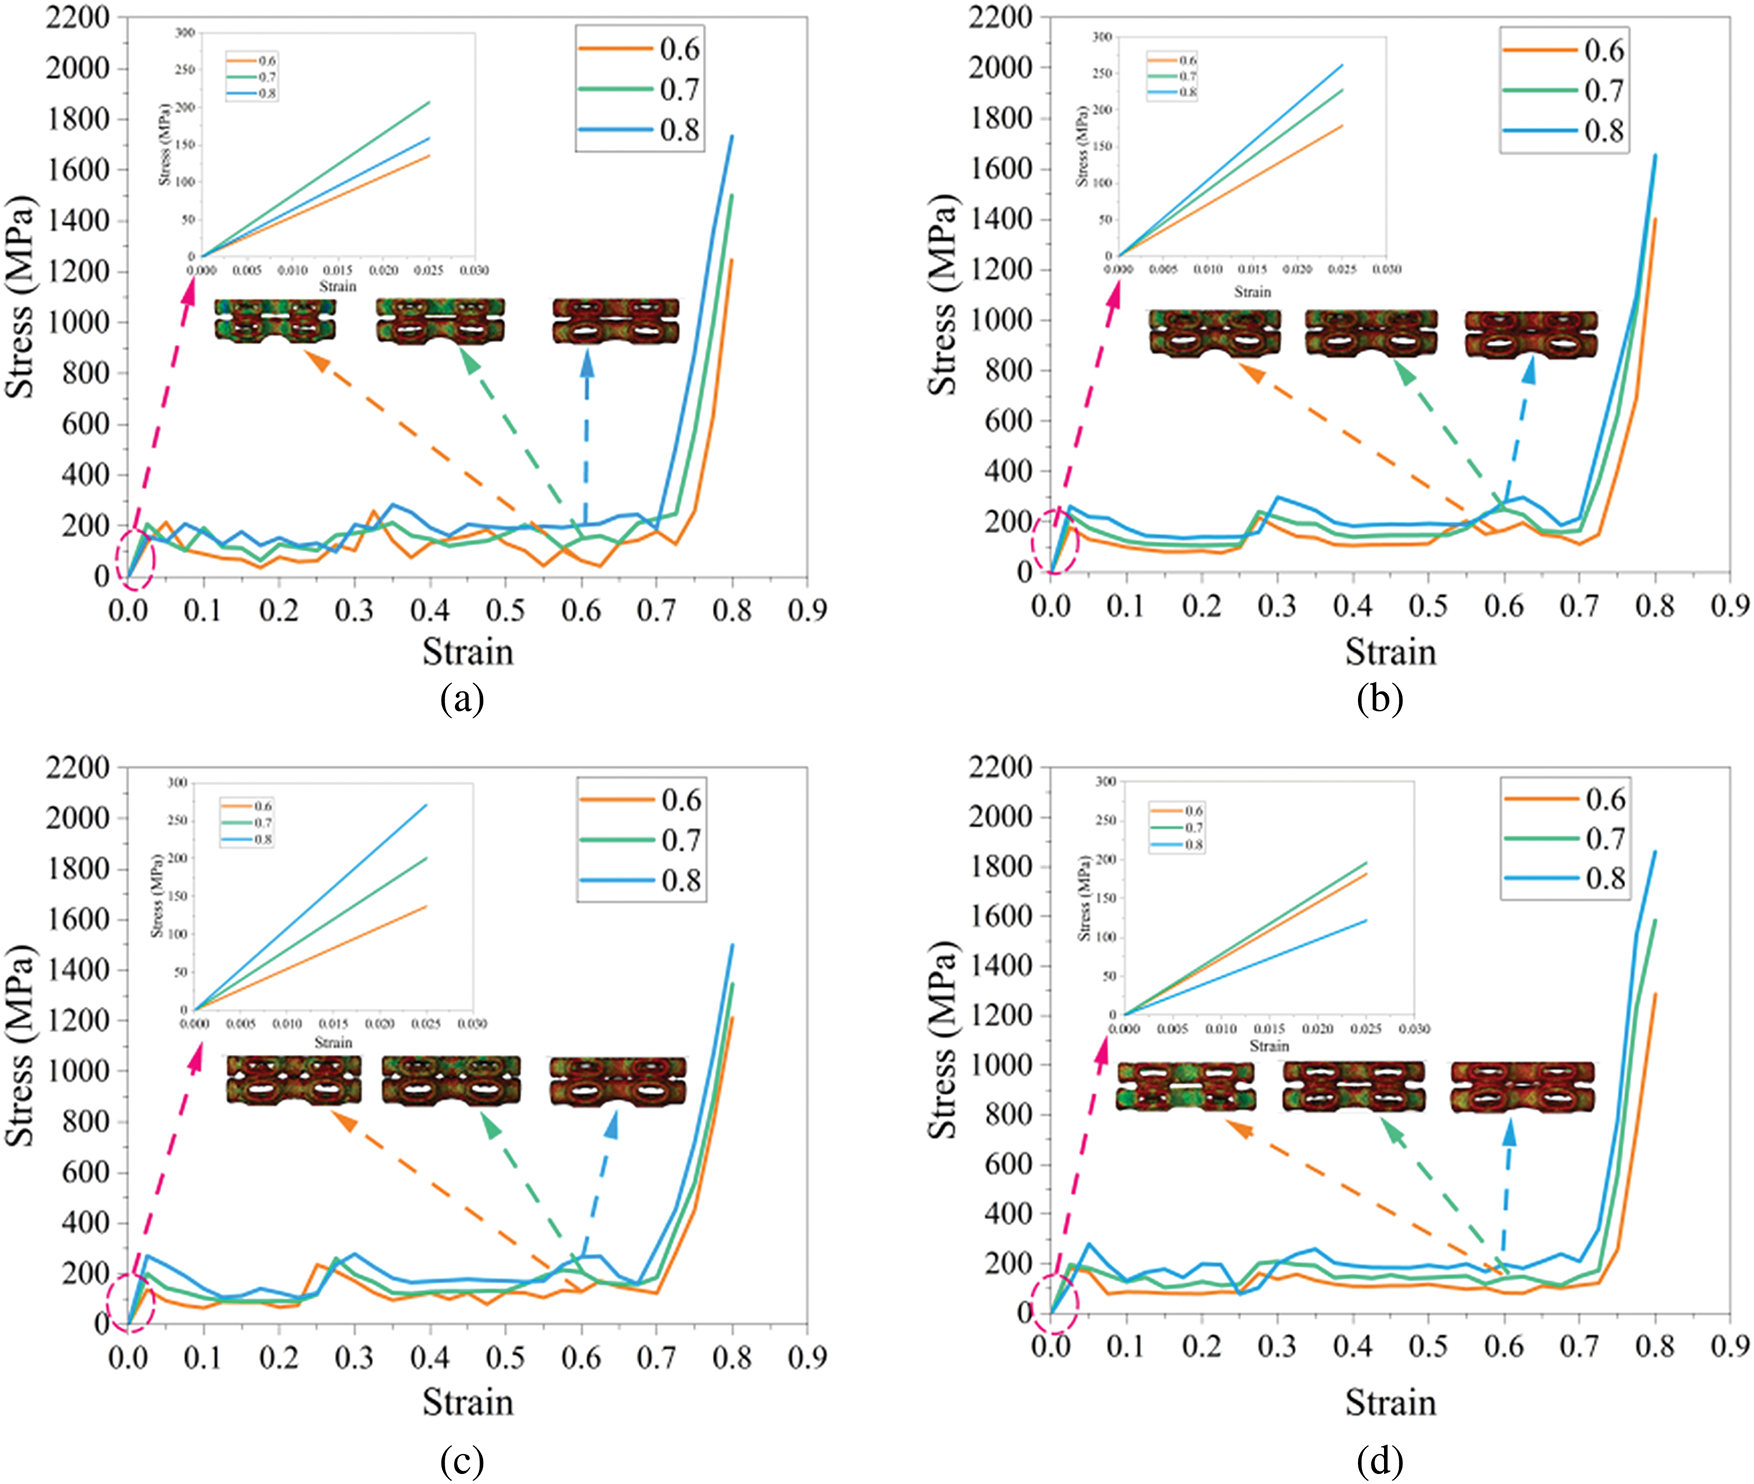
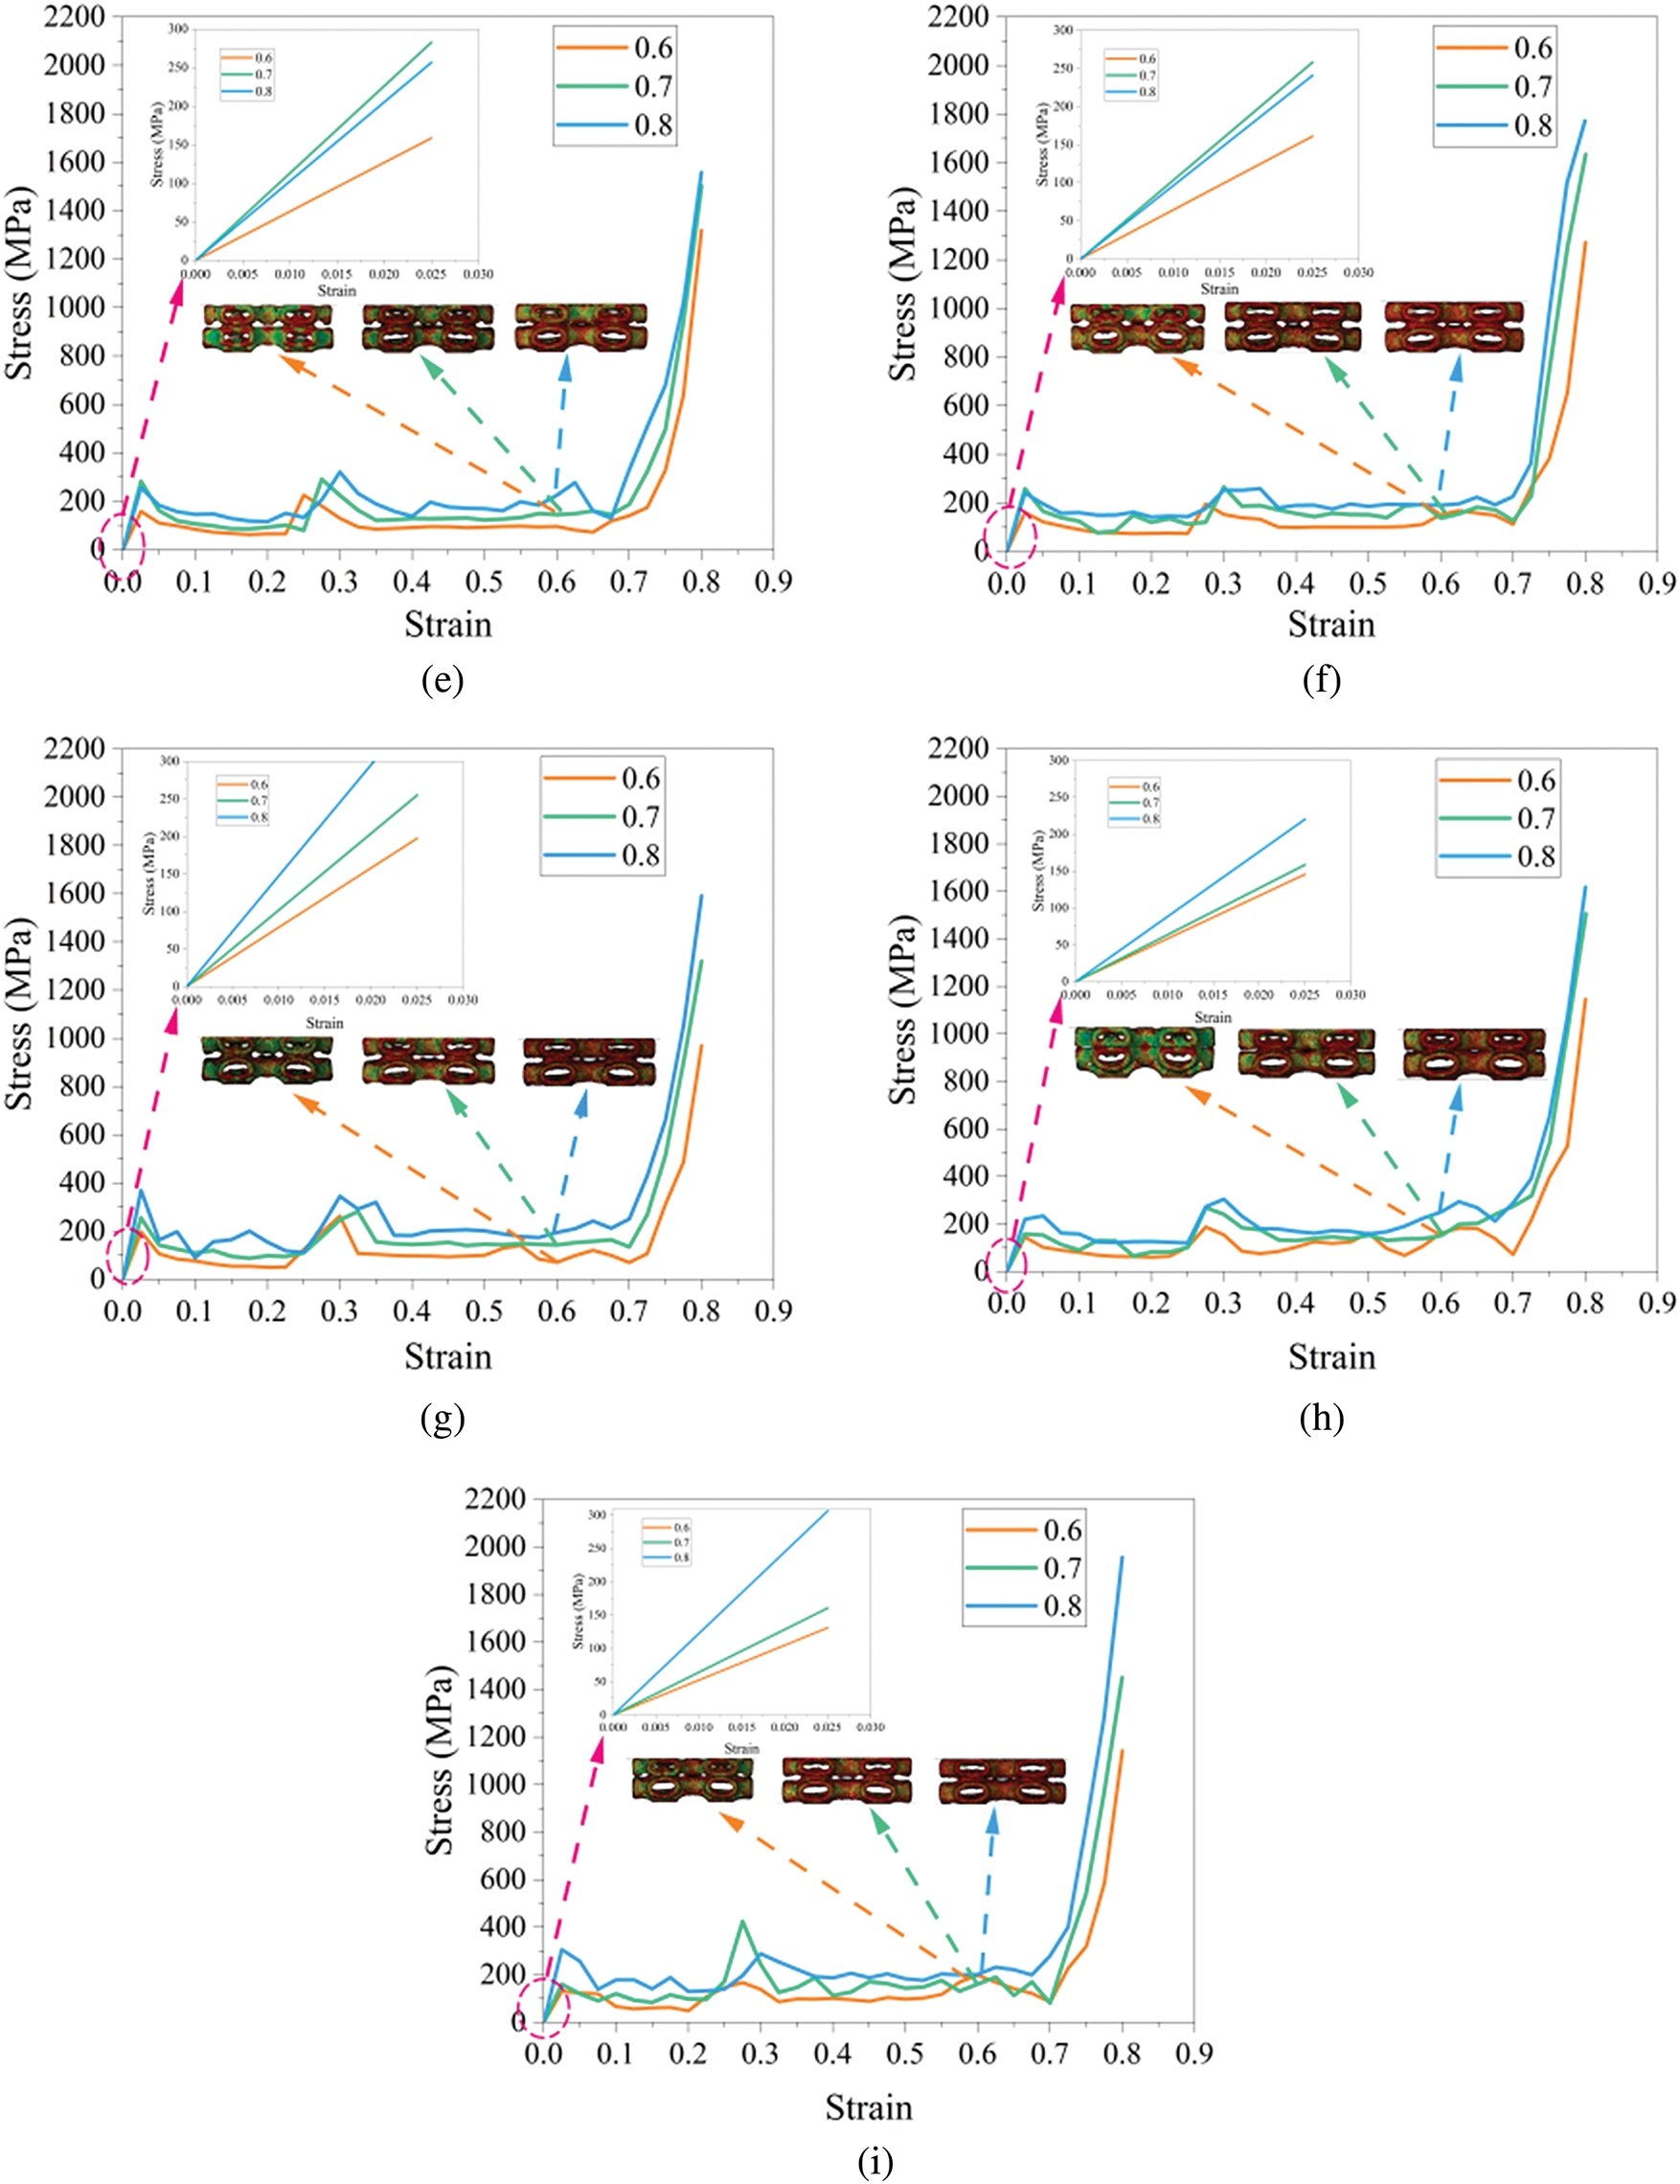
Figure 11: Stress-strain curves and elastic deformation curves of lattice structures: (a) Triangle; (b) Circle; (c) Rectangle; (d) CCTT; (e) TTRR; (f) CCRR; (g) TCCT; (h) RTTR; (i) RCCR
As shown in Fig. 11, under identical pore shape conditions, increased volume fraction reduces the porosity of lattice structures. Concurrently, the load-bearing capacity is significantly enhanced. However, structural destruction initiates more rapidly. Comparative analysis of failure initiation strains reveals that the Circle possesses delayed destruction onset, consequently exhibiting enhanced load-bearing capacity relative to the Triangle and the Rectangle. Analysis of stress-strain curve fluctuations reveals that pore shape significantly influences load-bearing capacity at identical volume fractions. The Circle exhibits minimal curve fluctuations, demonstrating the most stable mechanical response. In contrast, the triangle shows the most pronounced fluctuations with evident curves overlapping across different volume fractions. This phenomenon may be caused by stress concentration effects in the vertex regions. In addition, aperiodic structures exhibit significantly stronger stress-strain curve fluctuations compared to periodic structures. Notably, the CCTT, TTRR, and CCRR show relatively smaller fluctuation amplitudes due to their lower structural heterogeneity.
The elastic deformation curves reveal that the stress values of the Circle, Rectangle, TCCT, RTTR, and RCCR increase with the volume fraction during the elastic deformation stage. However, at a volume fraction of 0.7, CCTT, TTRR, and CCRR exhibit the optimal elastic deformation capability. Comparative analysis indicates that this phenomenon may be associated with the distinctive pore arrangement. At a volume fraction of 0.7, the pore spacing and diameter in these structures reach an optimal ratio. This optimized configuration leads to more continuous load transfer paths, significantly enhancing the overall structural stiffness. Fig. 12 compares the stress-strain curves from compression experiments and simulations. The simulated curves can well predict the variation trends of stress-strain curves during experiments. However, during experimentation, inherent process variations in metal AM and measurement accuracy limitations of sensors prevent a perfect agreement between simulated and experimented curves, inevitably leading to deviations.
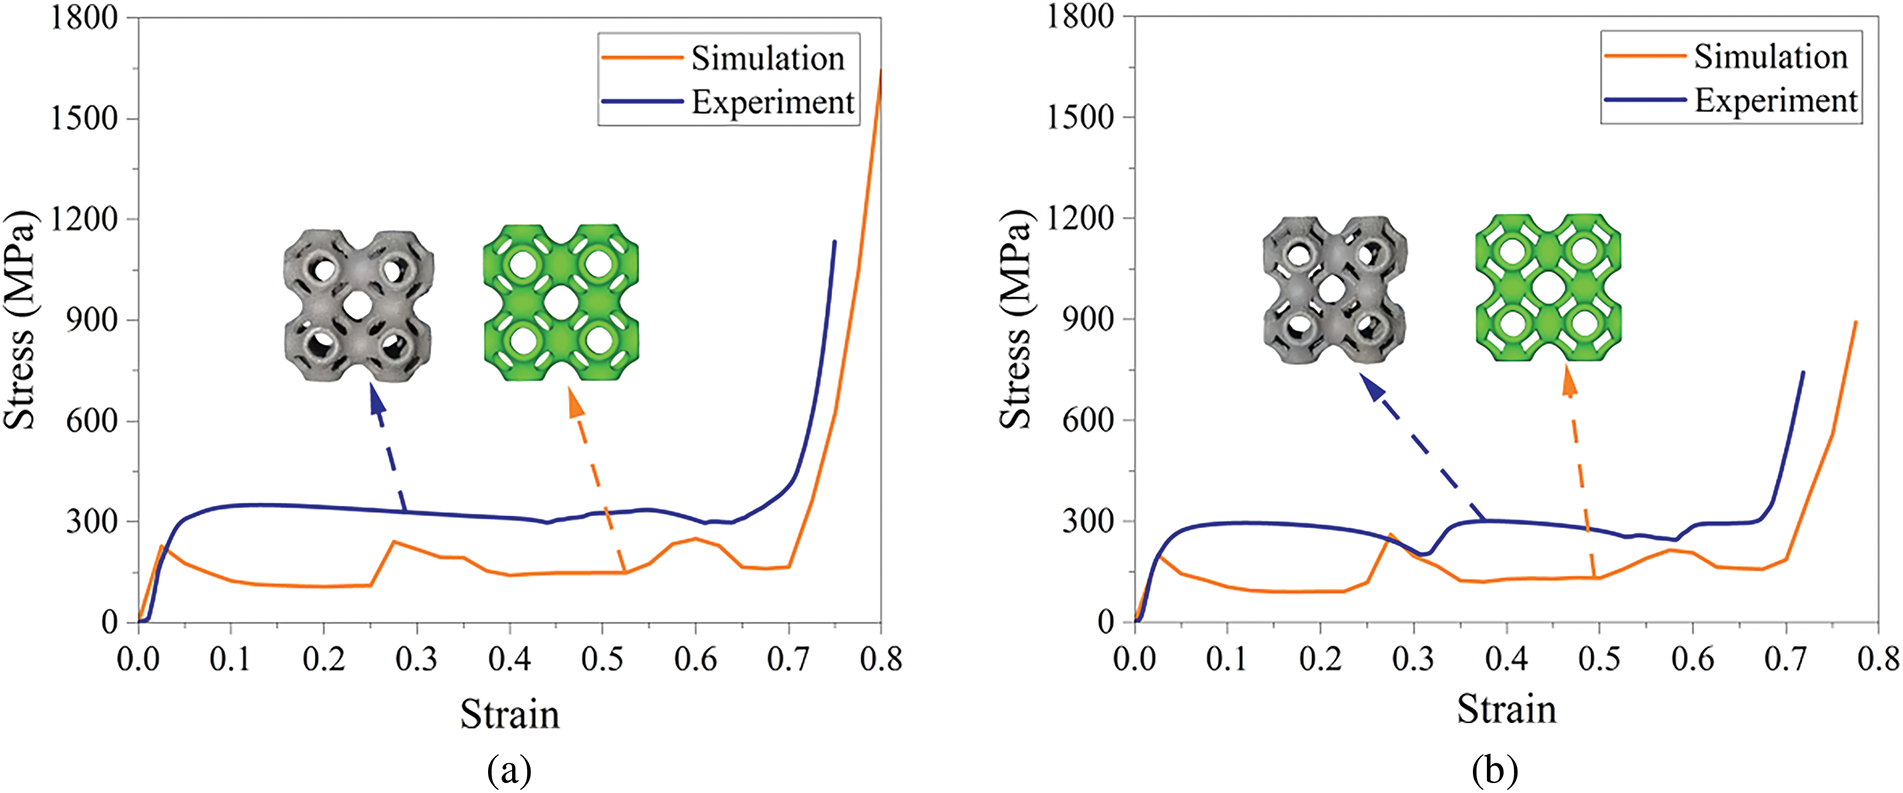
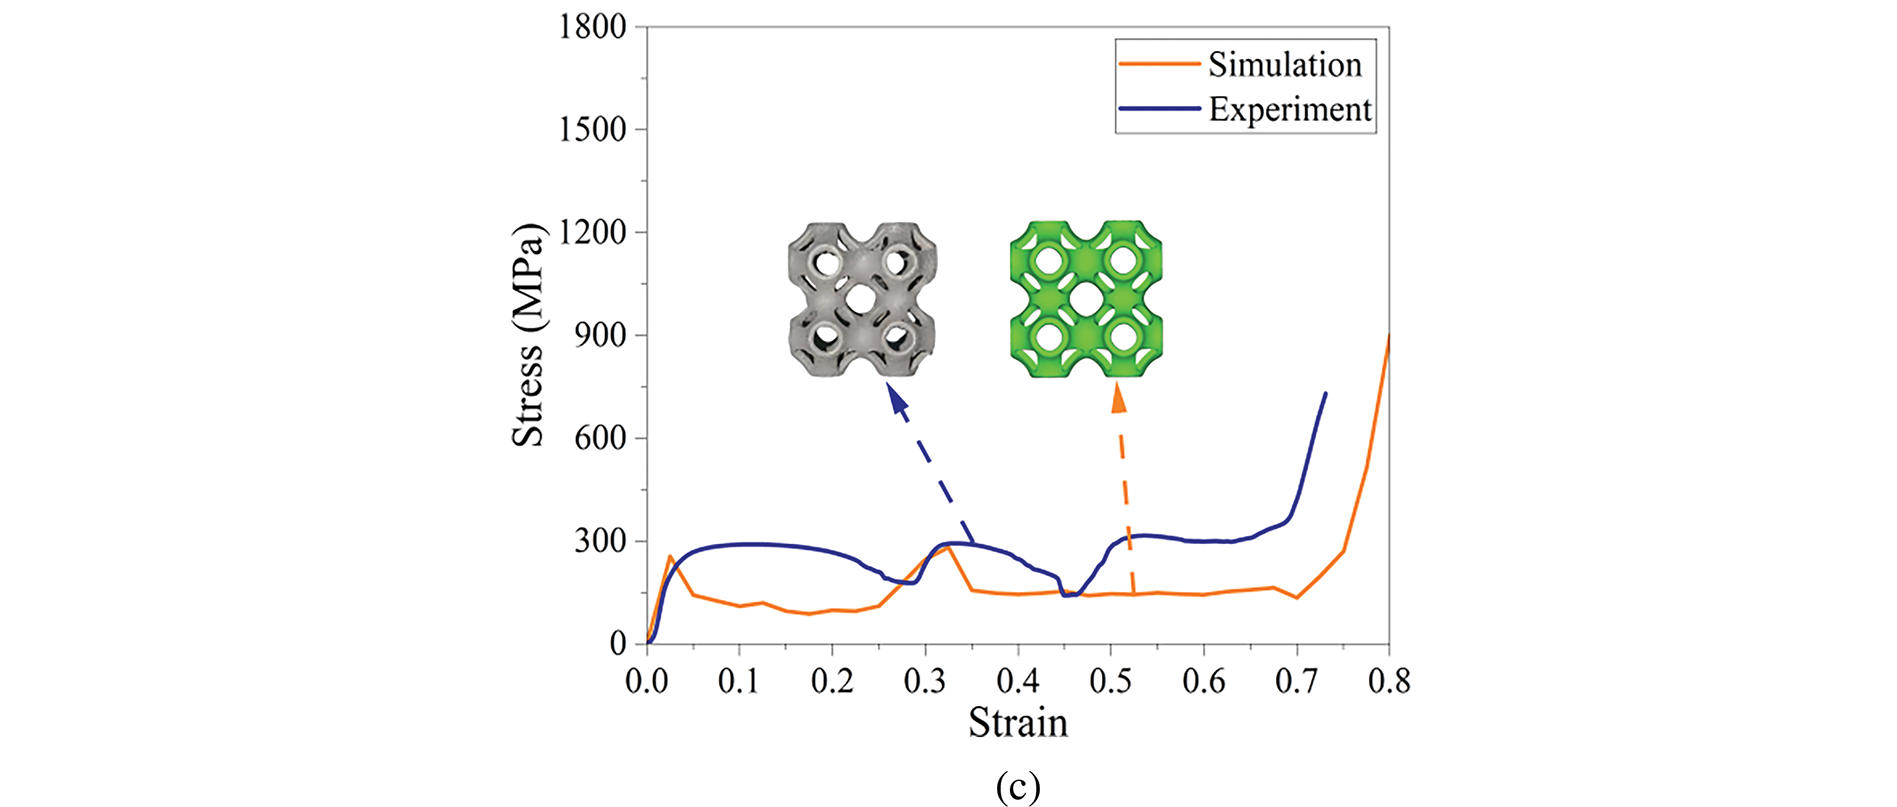
Figure 12: Comparison of stress-strain curves between simulation and experiment: (a) Circle; (b) Rectangle; (c) TCCT
To systematically quantify the mechanical properties of lattice structures, the following evaluation criteria are adopted: Young’s modulus is determined from the slope of the stress-strain curve in the elastic deformation stage; compressive strength is defined as the maximum stress near the destruction stage; toughness is characterized by the area under the stress-strain curve. Through simulated compression tests, mechanical property parameters are obtained for both periodic and aperiodic structures, with detailed data presented in Tables 5 and 6.
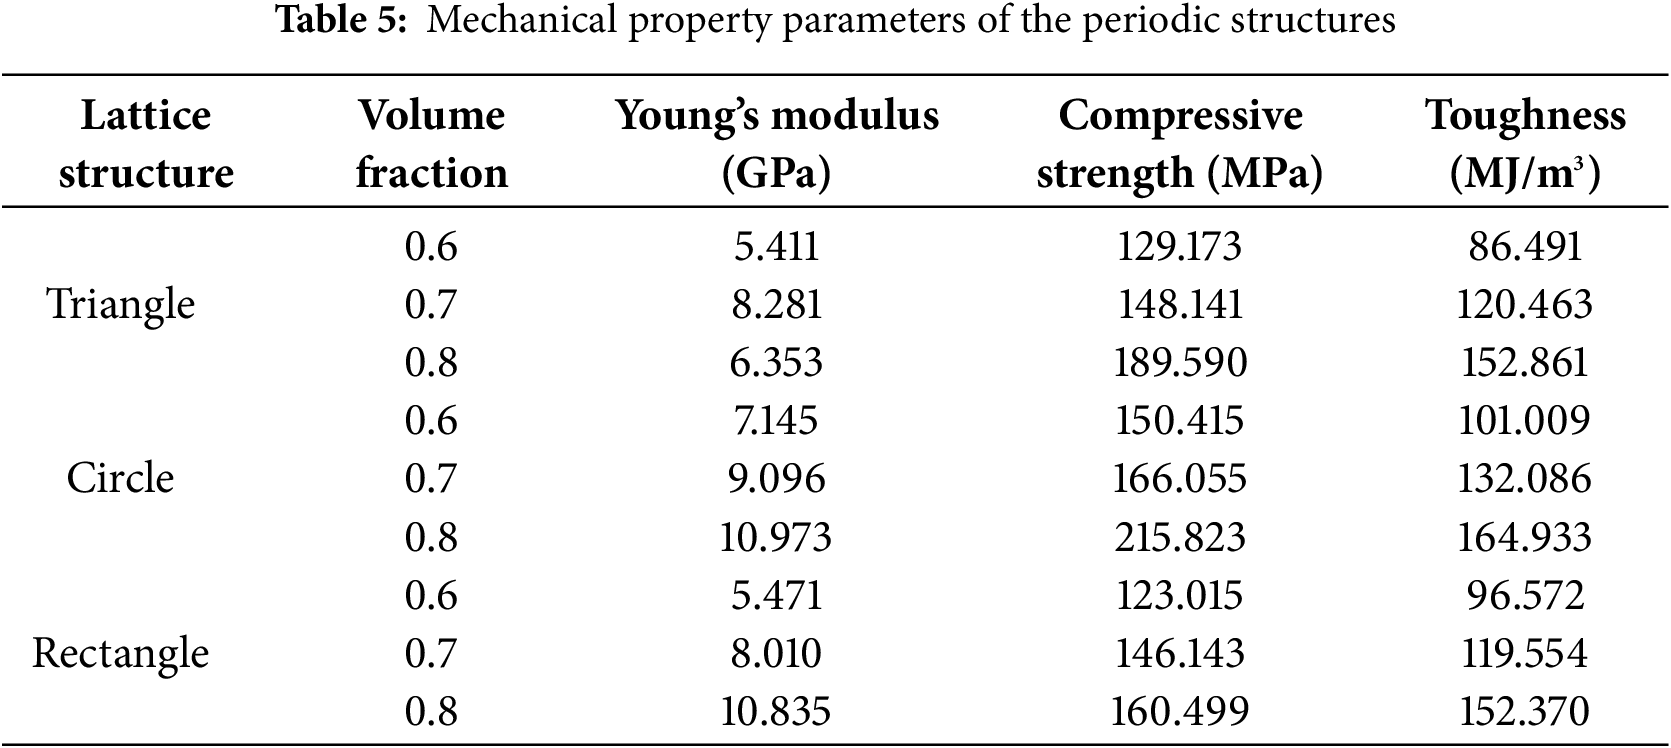
As shown in Table 5, the Circle exhibits the best overall mechanical performance in periodic lattices. Its Young’s modulus is 9.8% and 13.5% higher than those of Triangle and Rectangle, respectively, while compressive strength is improved by 12.1% and 13.6%, and toughness by 9.6% and 10.5%. Although the Triangle shows slightly higher compressive strength than the Rectangle, Young’s modulus and toughness are lower. This discrepancy is primarily attributed to stress distribution variations induced by pore shape. The mechanical properties of the lattice structure are significantly affected by the pore shape. The triangular pores will produce severe stress concentration due to their sharp corners, and the local plastic deformation will occur in advance, reducing Young’s modulus and compressive strength. At the same time, the sharp corner shear stress is larger, easy to crack, and reduces the toughness of the material. The stress concentration of rectangular pores is somewhat milder than that of triangular pores, but still higher than that of circular pores. The stress concentration at the right angle of the rectangular pore can still cause the local yield to occur earlier, but it is still superior to the triangular pore structures. The shear stress of rectangular pores during compression is more regular than that of triangular pores, but not as uniform as that of circular pores. Therefore, the mechanical properties of rectangular pores are better than triangular pores, but not as good as circular pores. In contrast, circular pores achieve the most uniform stress distribution due to their smooth profile, effectively reducing local stress mutations and improving the toughness of the material, thus achieving the best load transfer and mechanical properties.
Further investigation reveals that the volume fraction is positively correlated with the mechanical properties when the pore shape is the same. When the volume fraction increases, the volume of the lattice retained material increases, and Young’s modulus, compressive strength, and toughness are significantly improved. At the same time, the cross-section area of the support structure is increased, which can restrain the occurrence of local buckling and further improve the comprehensive mechanical properties.
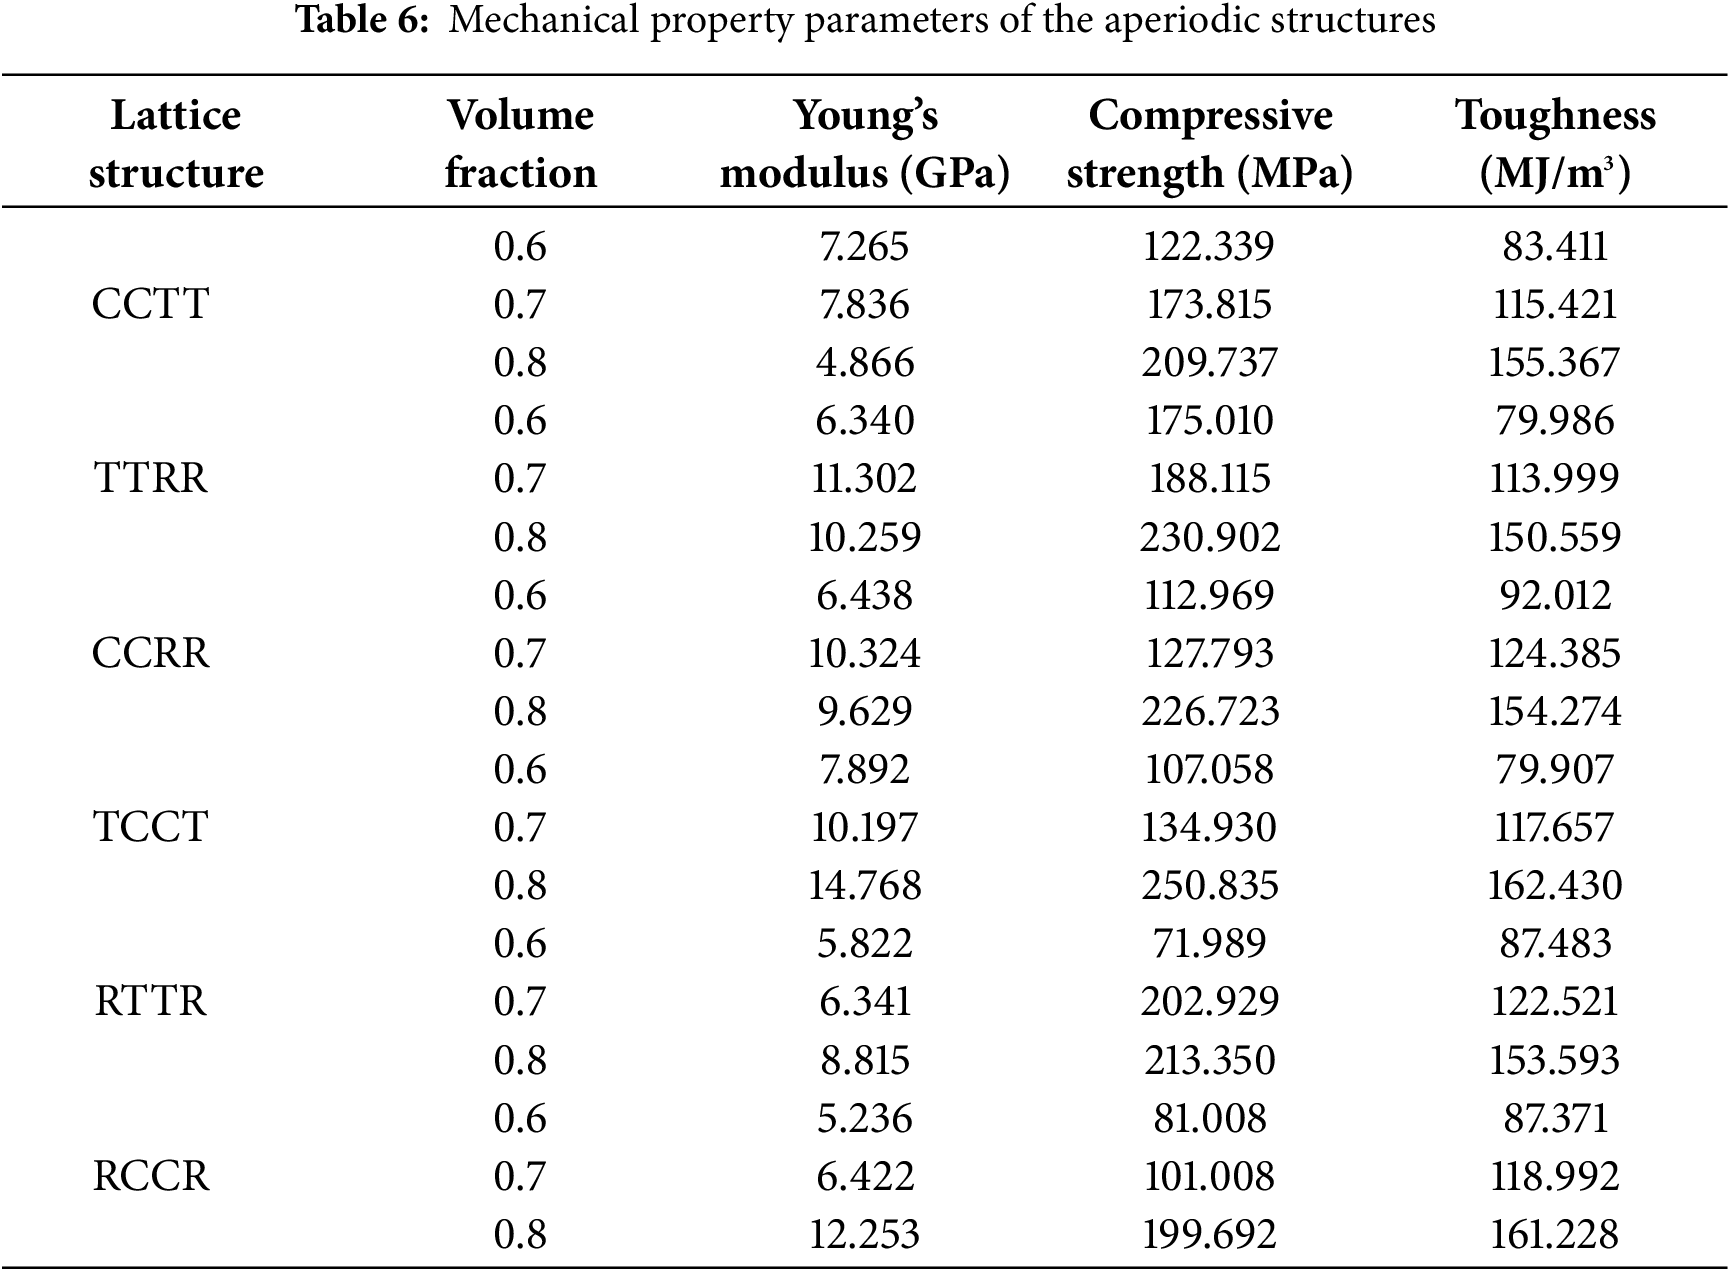
The data in Table 6 indicates that significant variations in mechanical properties are observed among aperiodic structures at different volume fractions. At a volume fraction of 0.6, TCCT is found to possess the highest Young’s modulus (7.892 GPa), while TTRR is demonstrated to exhibit the optimal compressive strength (175.01 MPa), and CCRR is confirmed to show the best toughness (92.012 MJ/m3). At a volume fraction of 0.7, TTRR is detected to achieve maximum values in both Young’s modulus (11.302 GPa) and compressive strength (188.115 MPa), with CCRR maintaining the highest toughness (124.385 MJ/m3). At a volume fraction of 0.8, TCCT is proven to display the most excellent comprehensive mechanical performance, with its Young’s modulus (14.768 GPa), compressive strength (250.835 MPa) and toughness (162.430 MJ/m3) all being significantly superior to other structures. Systematic analysis confirms that TCCT shows the best performance in Young’s modulus. TTRR demonstrates the highest compressive strength. CCRR presents the most outstanding toughness. Comprehensive evaluation reveals that TCCT exhibits optimal overall mechanical properties. The difference in mechanical properties of aperiodic structures mainly stems from their unique microstructure characteristics. The circular pores in the TCCT effectively reduce the global stress concentration and form a continuous load path, while the triangular pores provide additional support, so Young’s modulus is optimal. Due to the symmetry of the structure, the rectangular and triangular pores in TTRR can compensate for a part of the stress concentration, thus improving its compressive strength. The circular pores in CCRR can compensate for the cracks of rectangular pores in the compression process through smooth curvature, to improve its toughness.
Fig. 13 compares Young’s modulus and compressive strength of lattice structures between simulations and compression experiments. Due to inherent manufacturing variations in metal printing and sensor accuracy limitations, discrepancies exist between simulated and experimental data. Nevertheless, the mechanical properties of lattices with different pore shapes can be effectively predicted through simulations.
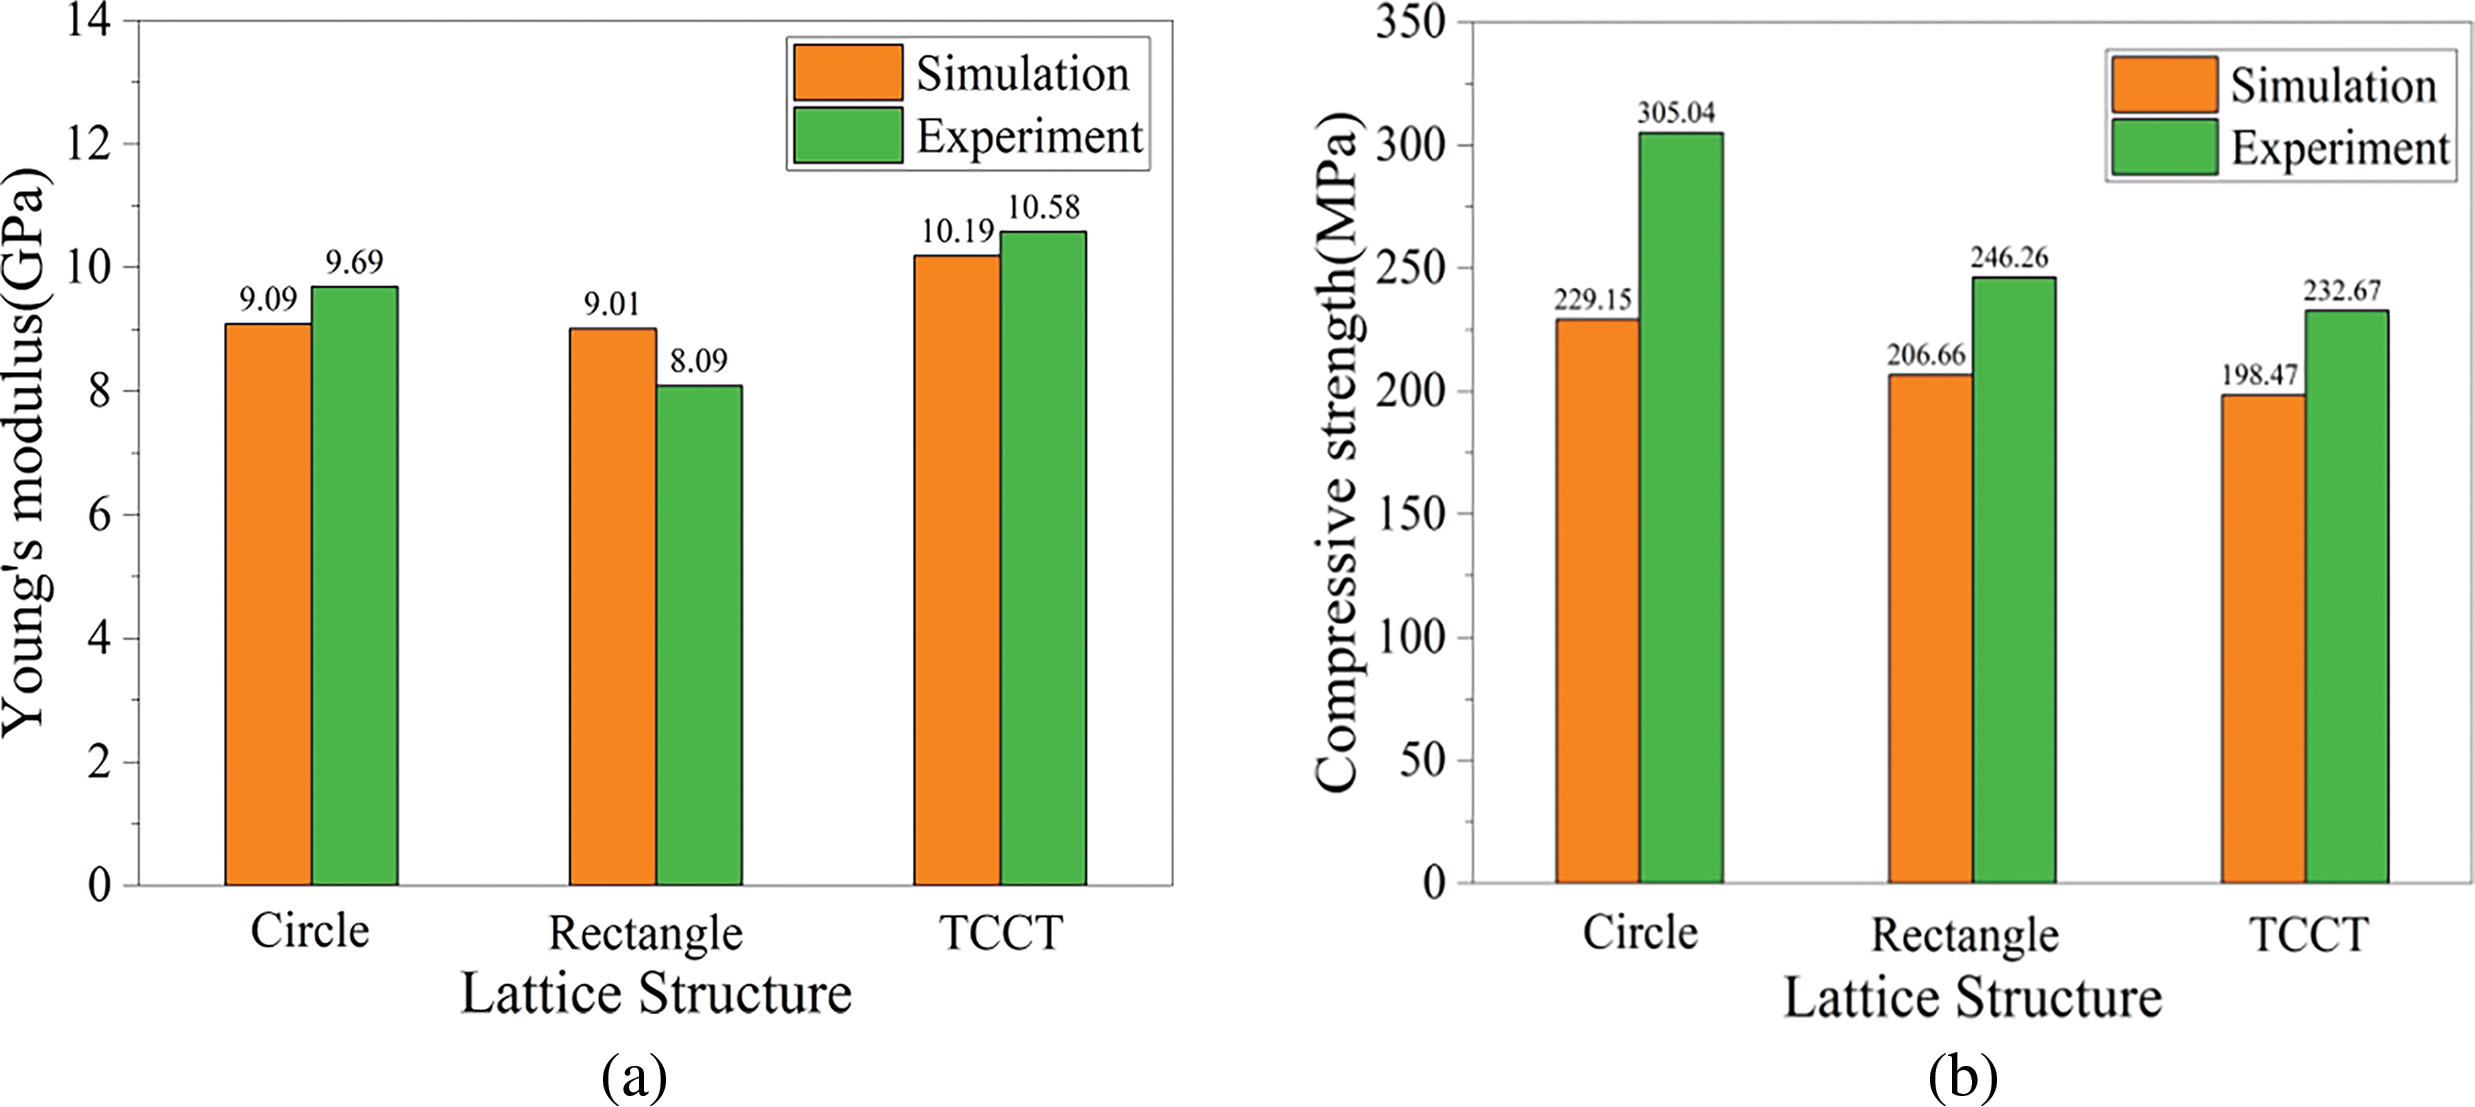
Figure 13: Comparison of mechanical properties between simulation and experiment: (a) Young’s modulus; (b) Compressive strength
4.3 Energy Absorption Properties
Lattice structures effectively dissipate mechanical energy through plastic deformation and fracture mechanisms. This characteristic enables their wide applications in cushioning and energy absorption. Therefore, the study of energy absorption properties of lattice structures is of great significance for engineering applications. Energy absorption per unit volume (EAV) serves as a key metric for evaluating the energy absorption performance of lattice structures. This parameter quantifies the achievable energy absorption density before material densification. Its mathematical expression is as follows:
where W is the energy absorbed per unit volume of the lattice structure, σ is the lattice structure stress, and εe is the dense strain of lattice structures. The densification strain is usually determined according to the analysis of the energy absorption efficiency curve. The strain corresponding to maximum energy absorption efficiency is defined as the densification strain. The energy absorption efficiency (δ) is calculated as:
Compression simulations reveal that lattice structures with identical pore shapes exhibit similar mechanical responses. Their energy absorption curves (EAC) and energy absorption efficiency curves (EAEC) show consistent evolutionary trends. Therefore, this study investigates nine representative lattice structures with a volume fraction of 0.7 to simplify analysis while ensuring representativeness. The energy absorption process and efficiency curve of these structures can fully reflect the energy dissipation characteristics of these porous structures. The energy absorption curve and the energy absorption efficiency curve of the lattice structure are shown in Fig. 14.
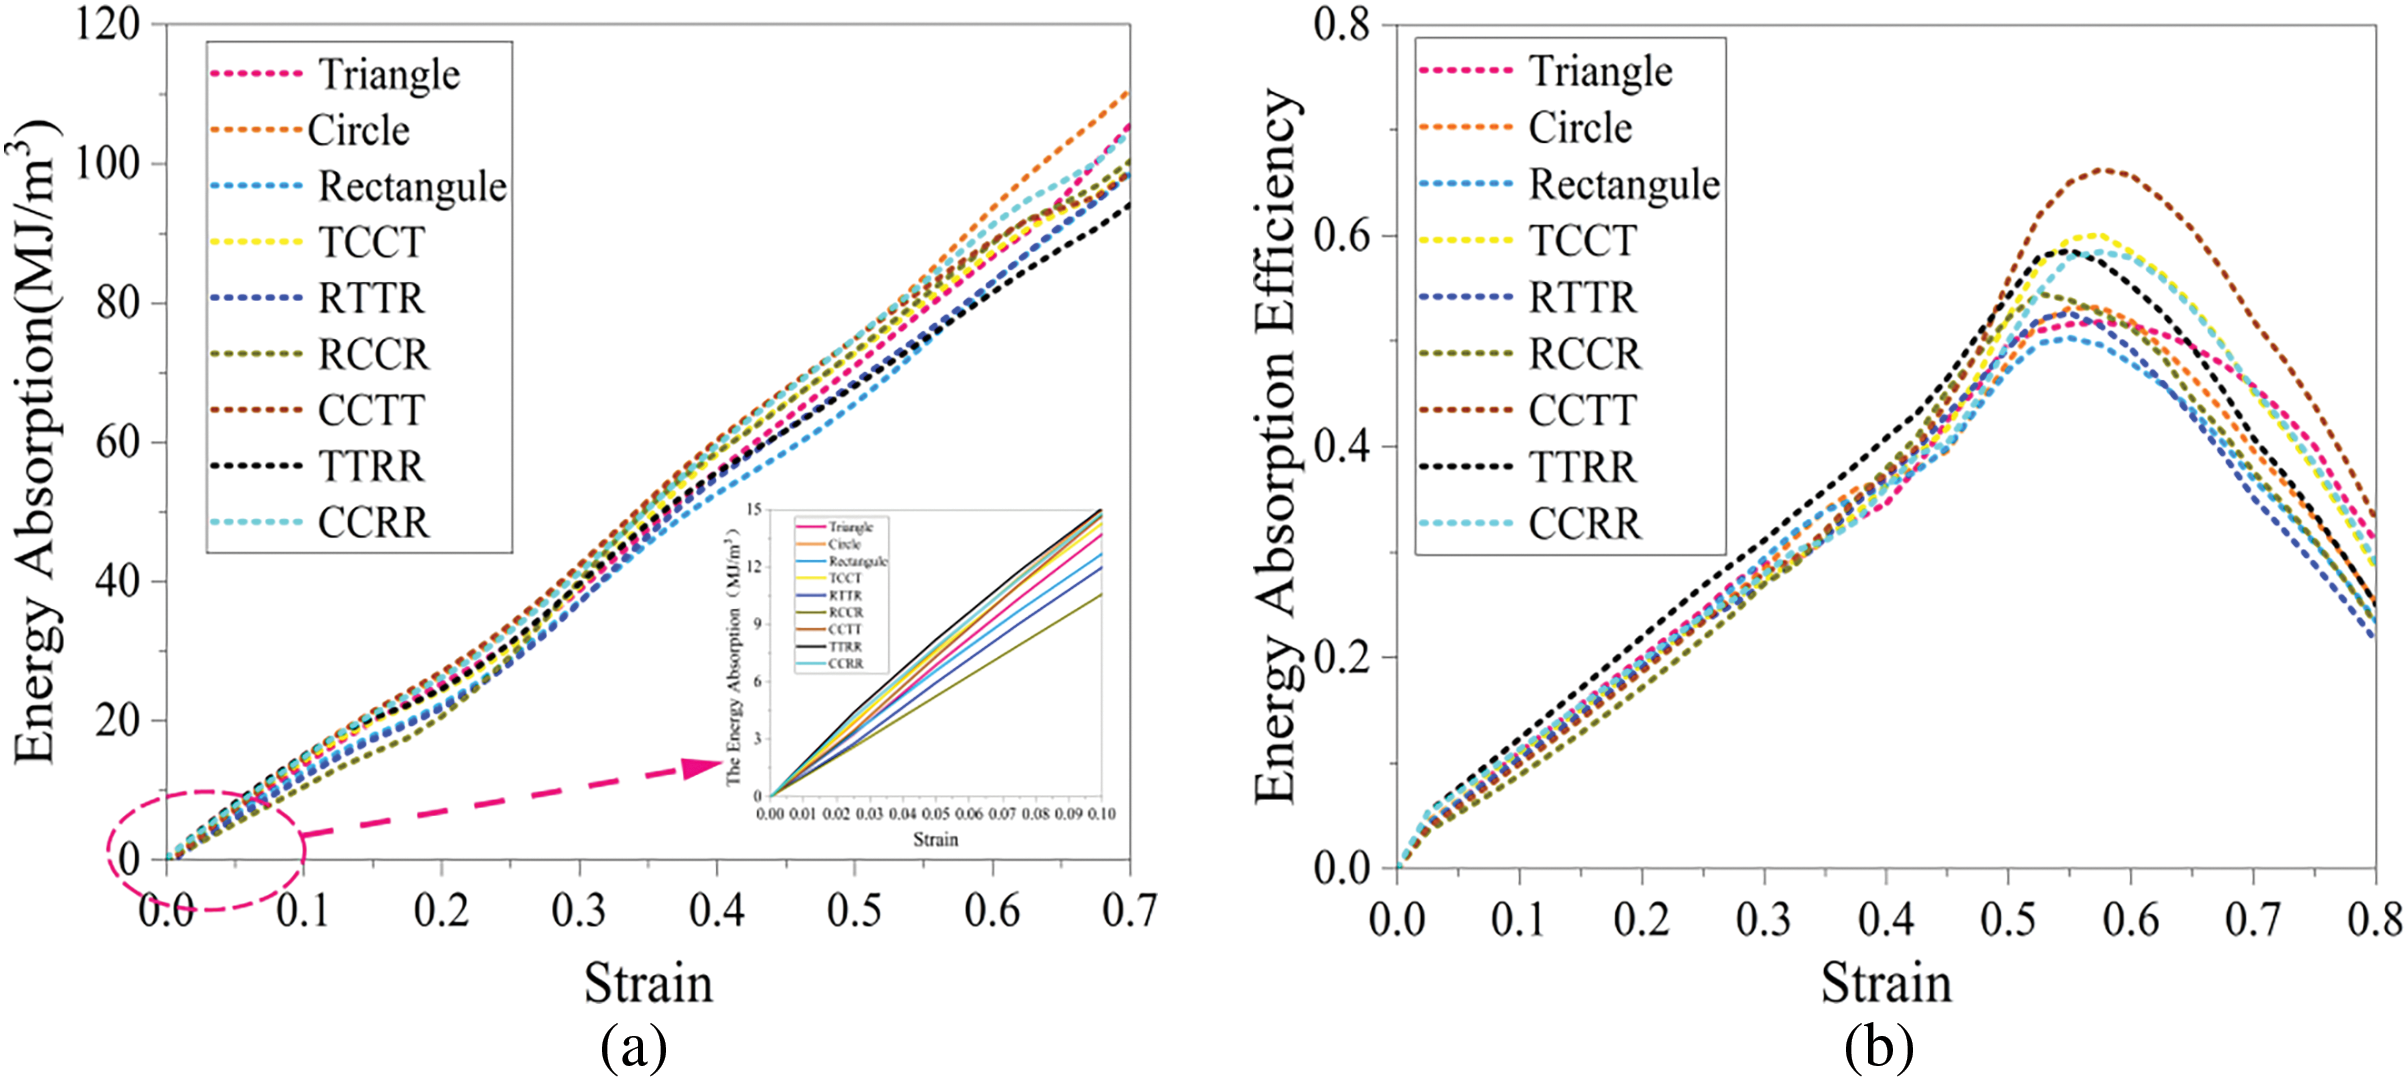
Figure 14: Energy absorption curve and energy absorption efficiency curve of lattice structure: (a) energy absorption curve; (b) Energy absorption efficiency curve
As shown in Fig. 14a, with the increase of strain, the Circle has the largest slope of the energy absorption curve and the best energy absorption capacity. This result verifies the effectiveness of the TO method. TTRR and RTTR exhibit the lowest energy absorption efficiency due to the stress concentration effect at the acute-angle nodes. The triangular and rectangular pores in TTRR and RTTR form high-stress zones at acute or right angles and generate tiny cracks, leading to the early entry of the structure into the densification phase and shortening the effective energy absorption interval. Moreover, the geometric asymmetry of TTRR and RTTR structures makes the load transfer path discontinuous, resulting in low energy dissipation efficiency. Although the stress concentration phenomenon is also relatively obvious in the Triangle and the Rectangle, the energy absorption rate is not low. This may be related to the symmetry of its structure, which compensates for part of the stress. In addition, the energy absorption curves of each pore structure increase approximately linearly from the initial deformation to the intermediate deformation. This indicates that the energy dissipation at this stage is mainly caused by the elastic deformation and regular layered collapse of the structure.
Fig. 14b further reveals the evolution law of energy absorption efficiency. Owing to structural instability, the energy absorption efficiency curves of RTTR and TTRR reach peak values first and subsequently enter the densification stage. The Circle demonstrates the latest peak response in energy absorption efficiency curves due to its superior structural configuration. The Triangle exhibits higher stress density at peak stress. This phenomenon may be attributed to pronounced stress concentration effects at its three acute-angle regions. The three acute angles of the triangular pore structures will simultaneously produce stress concentration under compressive load, forming three local high-stress zones. This makes the structures exhibit a higher stress density. The energy absorption capacity of the lattice structure can also be expressed by the specific energy absorption (SEA). SEA is the energy absorbed per unit volume of material and is used to measure the energy absorption efficiency of the material. The specific energy absorption of the lattice structure is shown in Fig. 15.
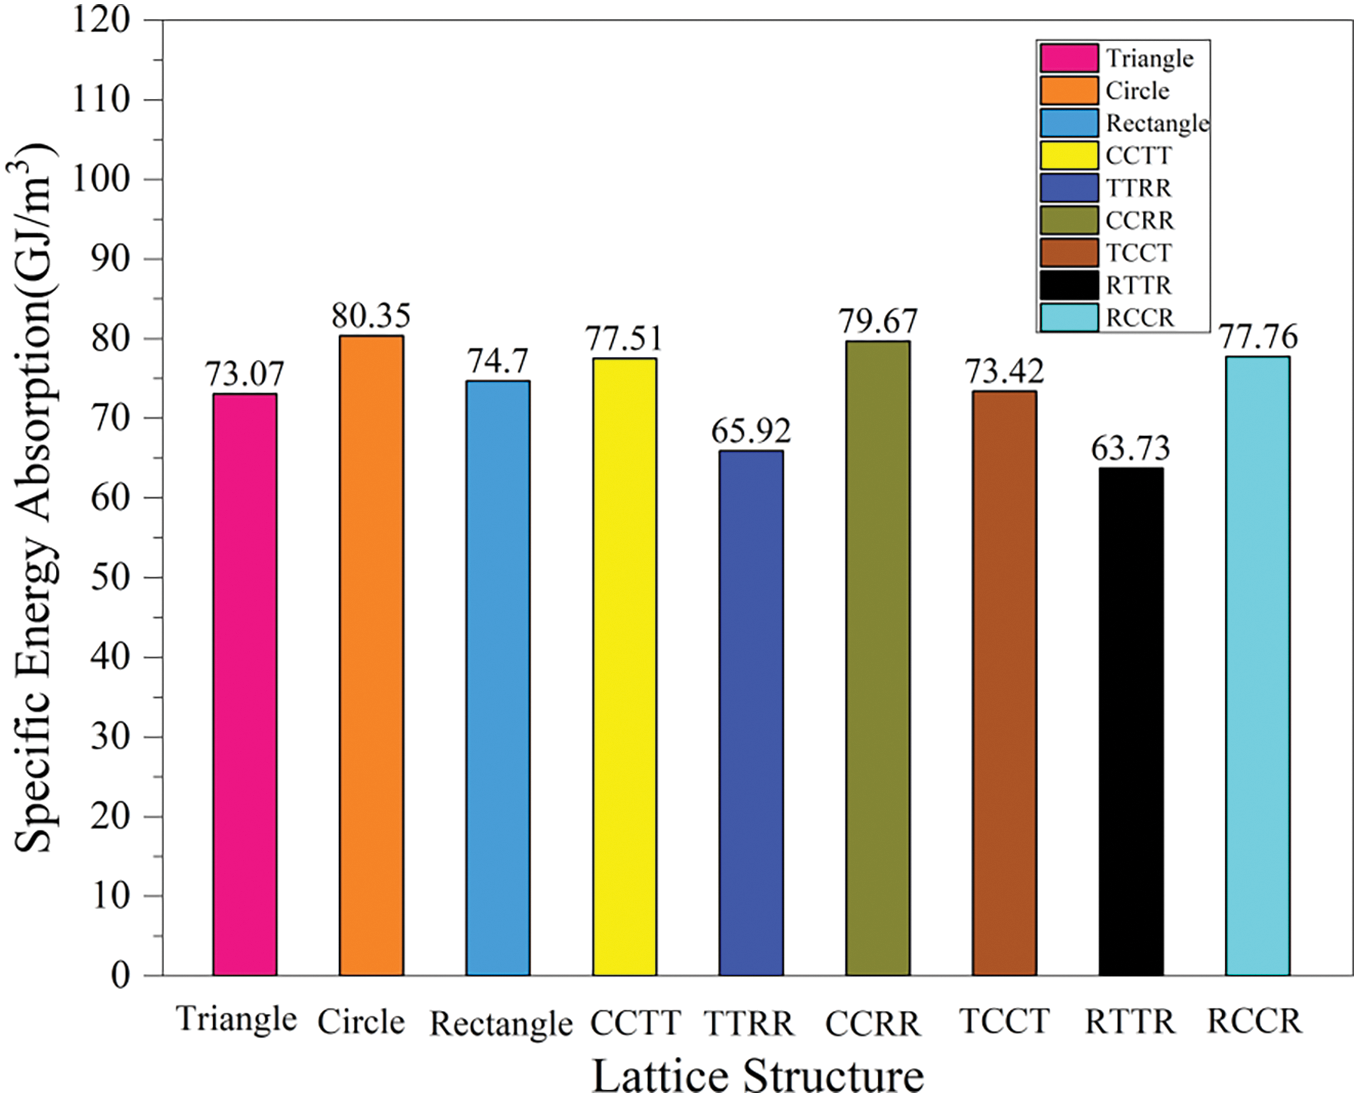
Figure 15: Specific Energy absorption of lattice structures with the volume fraction of 0.7
The results show that the specific energy absorption of the Circle is significantly better than that of the Triangle and Rectangle. The correctness and effectiveness of the TO are verified. The specific energy absorption of the Circle is 9.96% higher than that of the Triangle, and 7.56% higher than that of the Rectangle. Comparing the energy absorption properties of different structures, it is found that the specific energy absorption values of TTRR and RTTR are the lowest. It indicates that its energy absorption efficiency is poor. Further analysis shows that the introduction of circular pores optimizes the stress distribution of the structure, weakens the stress concentration effect, optimizes the load transfer path, and significantly improves the energy absorption capacity of the structure. The research data shows that the energy absorption capacity of CCTT and TCCT is increased by 6.07% and 0.48% respectively compared with that of Triangle after introducing circular pores into triangle and rectangle pore structures. The energy absorption capacity of CCRR and RCCR is 6.65% and 4.10% higher than that of Rectangle, respectively. The energy absorption capacity of TTRR and RTTR is 10.85% and 14.66% lower than that of Triangle, and 13.32% and 17.21% lower than that of Rectangle, respectively. This fully verifies the correctness of the TO and the effectiveness of the proposed design strategy. In addition, the energy absorption capacity of the periodic structures is better than that of the aperiodic structures.
This paper combines TO with AM. Lattice structures with various pore shapes are designed. Through analyzing simulation and experimental results, this study investigates the influence of pore shape on the mechanical properties and energy absorption characteristics of lattice structures. The effectiveness of the experimental methodology and its predictive capability in practical applications has been demonstrated. The conclusions drawn from the research are as follows:
(1) The isotropy of the Circle obtained through topological optimization is superior to that of other lattice structures. The degree of anisotropy increases with the volume fraction.
(2) In periodic structures, the Circle exhibits optimal Young’s modulus, compressive strength, and toughness. Compared with Triangle and Rectangle, Young’s modulus is increased by 9.8% and 13.5%, its compressive strength is increased by 12.1% and 13.6%, and its toughness is increased by 9.6% and 10.5%, respectively. This verifies the effectiveness of the TO method. For the aperiodic structure, TCCT shows the best comprehensive mechanical properties. However, the overall mechanical properties of the periodic structure are better.
(3) Analysis of energy absorption performance in lattice structures reveals that the Circle possesses optimal energy absorption characteristics, while TTRR and RTTR demonstrate the poorest performance. The specific energy absorption of the Circle is 9.96% higher than the Triangle, 7.56% higher than the Rectangle, 21.89% higher than TTRR, and 26.08% higher than RTTR. The effectiveness and correctness of the TO method are verified again.
(4) Simulation and experimental results show that the deformation pattern of the TPMS lattice structure is not sensitive to the pore shape change, and different structures show similar deformation patterns. The effectiveness of the proposed method is verified. In addition, this study is performed only at room temperature. The TPMS lattice structure at different temperatures can be investigated in the future.
Acknowledgement: The authors are thankful for the anonymous reviewers for their helpful and constructive comments.
Funding Statement: This work is supported by the National Natural Science Foundation of China (Grant 52175236).
Author Contributions: The authors confirm their contribution to the paper as follows: study conception and design: Yizhou Wang, Qinghai Zhao, Guoqing Li; data collection: Yizhou Wang, Xudong Li; analysis and interpretation of results: Yizhou Wang, Qinghai Zhao; draft manuscript preparation: Yizhou Wang, Qinghai Zhao. All authors reviewed the results and approved the final version of the manuscript.
Availability of Data and Materials: The data that support the findings of this study are available from the corresponding author upon reasonable request.
Ethics Approval: Not applicable.
Conflicts of Interest: The authors declare no conflicts of interest to report regarding the present study.
References
1. Khan N, Riccio A. A systematic review of design for additive manufacturing of aerospace lattice structures: current trends and future directions. Prog Aerosp Sci. 2024;149(2):101021. doi:10.1016/j.paerosci.2024.101021. [Google Scholar] [CrossRef]
2. Guo S, Zhao R, Li B, Zhang G, Yang D, Yue X, et al. A gradient disordered cellular porous Ti-6Al-4V alloy fabricated by powder bed fusion with high energy absorption and low anisotropy. Thin-Walled Struct. 2025;210:113012. doi:10.1016/j.tws.2025.113012. [Google Scholar] [CrossRef]
3. Borikar GP, Patil AR, Kolekar SB. Additively manufactured lattice structures and materials: present progress and future scope. Int J Precis Eng Manuf. 2023;24(11):2133–80. doi:10.1007/s12541-023-00848-x. [Google Scholar] [CrossRef]
4. Sienkiewicz J, Płatek P, Jiang F, Sun J, Rusinek A. Investigations on the mechanical response of gradient lattice structures manufactured via SLM. Metals. 2020;10(2):213. doi:10.3390/met10020213. [Google Scholar] [CrossRef]
5. Carraturo M, Alaimo G, Marconi S, Negrello E, Sgambitterra E, Maletta C, et al. Experimental and numerical evaluation of mechanical properties of 3D-printed stainless steel 316L lattice structures. J Mater Perform. 2021;30(7):5247–51. doi:10.1007/s11665-021-05737-w. [Google Scholar] [CrossRef]
6. Liu R, Chen W, Zhao J. A review on factors affecting the mechanical properties of additively-manufactured lattice structures. J Mater Eng Perform. 2024;33(10):4685–711. doi:10.1007/s11665-023-08423-1. [Google Scholar] [CrossRef]
7. Ashok D, Raju Bahubalendruni MVA, Johnney Mertens A, Balamurali G. A novel nature inspired 3D open lattice structure for specific energy absorption. J Process Mech Eng. 2022;236(6):2434–40. [Google Scholar]
8. Ge J, Song Y, Chen Z, Zhuo Y, Wei T, Ge C, et al. Effect of geometrical parameters on the mechanical performance of bamboo-inspired gradient hollow-strut octet lattice structure fabricated by additive manufacturing. Micromachines. 2024;15(5):583. doi:10.3390/mi15050583. [Google Scholar] [PubMed] [CrossRef]
9. Yin H, Zhang W, Zhu L, Meng F, Liu J, Wen G, et al. Review on lattice structures for energy absorption properties. Compos Struct. 2023;304:116397. [Google Scholar]
10. Dara A, Mertens J, Gunji B, Raju Bahubalendruni MVA. Quasi-static and dynamic response of open lattice structures for enhanced plateau stresses: simulation and experiment validation. Mater Today Commun. 2025;44:111953. doi:10.1016/j.mtcomm.2025.111953. [Google Scholar] [CrossRef]
11. Wang B, Bai J, Lu S, Zuo W. Structural topology optimization considering geometrical and load nonlinearities. Comput Struct. 2023;289:107190. doi:10.1016/j.compstruc.2023.107190. [Google Scholar] [CrossRef]
12. Gaganelis G, Jantos DR, Mark P, Junker P. Tension/compression anisotropy enhanced topology design. Struct Multidiscip Optim. 2019;59(6):2227–55. doi:10.1007/s00158-018-02189-0. [Google Scholar] [CrossRef]
13. Zhu JH, Hou JI, Gao HH. The affection of fasteners load constraint in topology optimization. Appl Mech Mater. 2014;483:514–7. doi:10.4028/www.scientific.net/amm.483.514. [Google Scholar] [CrossRef]
14. Duan C, Wu D. Inverse design of lattice structures with target mechanical performance via generative adversarial networks considering the effect of process parameters. Adv Eng Inform. 2025;65(3):103221. doi:10.1016/j.aei.2025.103221. [Google Scholar] [CrossRef]
15. Mostofizadeh P, Dorey RA, Mohagheghian I. Effect of temperature variation and strain rate on the mechanical properties of multi-material lattice structures. Mater Des. 2025;250(18):113596. doi:10.1016/j.matdes.2025.113596. [Google Scholar] [CrossRef]
16. Zhou Y, Kim IY. Multi-scale multi-material topology optimization for lattice structures with interface connective microstructures. Eng Optim. 2025;140:1–32. doi:10.1080/0305215x.2025.2465832. [Google Scholar] [CrossRef]
17. Mang C, Tahmasebimoradi A, Lorang X. Analysis of correlation between manufacturing parameters and mechanical strength followed by uncertainty propagation of geometric defects in lattice structures//ASME international mechanical engineering congress and exposition. Am Soc Mech Eng. 2021;85550:V02AT02A062. doi:10.1115/imece2021-69121. [Google Scholar] [CrossRef]
18. Großmann A, Gosmann J, Mittelstedt C. Lightweight lattice structures in selective laser melting: design, fabrication and mechanical properties. Mater Sci Eng. 2019;766(S1):138356. doi:10.1016/j.msea.2019.138356. [Google Scholar] [CrossRef]
19. Gu Y, Qiao J, Liu J, Hao W, Tang C. High-temperature compressive properties of 3D printed polymeric lattice-reinforced cement-based materials. Polymers. 2025;17(6):802. doi:10.3390/polym17060802. [Google Scholar] [PubMed] [CrossRef]
20. Jia H, Duan S, Zhang Z, Yen C, Lu W, Lei H. Homogenization-based topology optimization for self-supporting additive-manufactured lattice-infilled structure. Mater Des. 2022;222(7674):111078. doi:10.1016/j.matdes.2024.113264. [Google Scholar] [CrossRef]
21. Fu J, Ding J, Zhang L, Qu S, Song X, Fu M. Development of conformal shell lattices via laser powder bed fusion and unraveling their mechanical responses via modeling and experiments. Addit Manuf. 2023;62:103406. doi:10.1016/j.addma.2023.103406. [Google Scholar] [CrossRef]
22. Liu F, Tang Y, Xie H, Zhao M, Ren Z, Wang X, et al. Strengthening mechanisms of minimal surface lattices with CT deviation. Int J Mech Sci. 2023;240(11):107932. doi:10.1016/j.ijmecsci.2022.107932. [Google Scholar] [CrossRef]
23. Zhang J, Xie S, He G, Li T, Sun G, Zhou Z, et al. Design of hybrid triply periodic minimal surface structures to enhance structural dynamic compression behavior. Compos Struct. 2025;354(9):118790. doi:10.1016/j.compstruct.2024.118790. [Google Scholar] [CrossRef]
24. Yang L, Li Y, Wu S, Chen P, Wu H, Su J, et al. Tailorable and predictable mechanical responses of additive manufactured TPMS lattices with graded structures. Mater Sci Eng. 2022;843(17):143109. doi:10.1016/j.msea.2022.143109. [Google Scholar] [CrossRef]
25. Lin Y, Wang X, Liang Z, Li D, Liu T, Liao W, et al. Optimization design of multi-scale TPMS lattices based on geometric continuity fusion and strain energy driven. Compos Struct. 2025;354(68):118759. doi:10.1016/j.compstruct.2024.118759. [Google Scholar] [CrossRef]
26. Chen J, Sun Z, Liu B, Ding M, Wang J, Guo B. Design and experimental study of non-vertical struts body and face-centered-cubic lattice structure based on topology optimization. J Mech Eng. 2024;60(23):270–7. (In Chinese). [Google Scholar]
27. Mao Z, Zhao Q, Zhou C. Evaluation of mechanical properties of 316L stainless steel lattice structures based on topology optimization. Mech Solids. 2025;1–19. doi:10.1134/s0025654424606682. [Google Scholar] [CrossRef]
28. Zhang S, Guo H, Gao T, Zhang W. Design and manufacturing method of multi-scale integrated load bearing thin-walled structure for application in next-generation aeroengine based on advanced laser processing technology. Acta Aeronaut Et Astronaut Sin. 2024;45(13):630037. [Google Scholar]
29. Li H, Liu R, Wang H, Xin R, Xu Z, Yu Z. Ant-inspired bionic design method for the support structure of the Fengyun-3 satellite payload infilled with lattice structure. Materials. 2023;16(2):736. doi:10.3390/ma16020736. [Google Scholar] [PubMed] [CrossRef]
30. Bai Y, Gao J, Huang C, Jiang C, Han X. Topology optimized design and validation of sandwich structures with pure-lattice/solid-lattice infill by additive manufacturing. Compos Struct. 2023;319(1):117152. doi:10.1016/j.compstruct.2023.117152. [Google Scholar] [CrossRef]
31. Cheng L, Bai J, To AC. Functionally graded lattice structure topology optimization for the design of additive manufactured components with stress constraints. Comput Methods Appl Mech Eng. 2019;344(5):334–59. doi:10.1016/j.cma.2018.10.010. [Google Scholar] [CrossRef]
32. Wang Y, Zhou X. Research front and trend of specific laser additive manufacturing techniques. Laser Technol. 2021;45(4):475–84. [Google Scholar]
33. Soni N, Renna G, Leo P. Advancements in metal processing additive technologies: selective laser melting (SLM). Metals. 2024;14(9):1081. doi:10.3390/met14091081. [Google Scholar] [CrossRef]
34. Zhou Y, Ma Y, Guan Y. Research progress on laser selective melting technology for high-performance manufacturing of aero-engines. Acta Aeronaut Et Astronaut Sin. 2024;45(13):629508. [Google Scholar]
35. Chalicheemalapalli Jayasankar D, Gnaase S, Kaiser MA, Lehnert D, Tröster T. Advancements in hybrid additive manufacturing: integrating SLM and LMD for high-performance applications. Metals. 2024;14(7):772. doi:10.3390/met14070772. [Google Scholar] [CrossRef]
36. Liu C, Li S. High-resolution topology optimization method of multi-morphology lattice structures based on three-dimensional convolutional neural networks (3D-CNN). Struct Multidiscip Optim. 2023;66(11):235. doi:10.1007/s00158-023-03688-5. [Google Scholar] [CrossRef]
37. Dadashi A, Rahimi G. A comprehensive investigation of the lattice structure mechanical properties based on Schwarz Primitive triply periodic minimal surface: elastic modulus, yield strength, and maximum bearing force in the elastic region. Int J Solids Struct. 2024;295:112776. doi:10.1016/j.ijsolstr.2024.112776. [Google Scholar] [CrossRef]
38. Han W, Hou Y, Shi J, Meng L, Sapanathan T. Experimental and numerical investigation on the mechanical behavior of 3D star-shaped auxetic structure. Compos Struct. 2025;354(5):118803. doi:10.1016/j.compstruct.2024.118803. [Google Scholar] [CrossRef]
Cite This Article
 Copyright © 2025 The Author(s). Published by Tech Science Press.
This work is licensed under a Creative Commons Attribution 4.0 International License , which permits unrestricted use, distribution, and reproduction in any medium, provided the original work is properly cited.
 Downloads
 Citation Tools