
 Submit a Paper
 Propose a Special lssue
 Open Access
ARTICLE
Enhancing Heart Sound Classification with Iterative Clustering and Silhouette Analysis: An Effective Preprocessing Selective Method to Diagnose Rare and Difficult Cardiovascular Cases
Information Technology, Faculty of Computing and Information Technology (FCIT), King Abdulaziz University, Jeddah, 21589, Saudi Arabia
* Corresponding Author: Sami Alrabie. Email:
# These authors contributed equally to this work
(This article belongs to the Special Issue: Exploring the Impact of Artificial Intelligence on Healthcare: Insights into Data Management, Integration, and Ethical Considerations)
Computer Modeling in Engineering & Sciences 2025, 144(2), 2481-2519. https://doi.org/10.32604/cmes.2025.067977
Received 17 May 2025; Accepted 25 July 2025; Issue published 31 August 2025
 View Full Text
 Download PDF
Abstract
In the effort to enhance cardiovascular diagnostics, deep learning-based heart sound classification presents a promising solution. This research introduces a novel preprocessing method: iterative k-means clustering combined with silhouette score analysis, aimed at downsampling. This approach ensures optimal cluster formation and improves data quality for deep learning models. The process involves applying k-means clustering to the dataset, calculating the average silhouette score for each cluster, and selecting the cluster with the highest score. We evaluated this method using 10-fold cross-validation across various transfer learning models from different families and architectures. The evaluation was conducted on four datasets: a binary dataset, an augmented binary dataset, a multiclass dataset, and an augmented multiclass dataset. All datasets were derived from the HeartWave heart sounds dataset, a novel multiclass dataset introduced by our research group. To increase dataset sizes and improve model training, data augmentation was performed using heartbeat cycle segmentation. Our findings highlight the significant impact of the proposed preprocessing approach on the HeartWave datasets. Across all datasets, model performance improved notably with the application of our method. In augmented multiclass classification, the MobileNetV2 model showed an average weighted F1-score improvement of 27.10%. In binary classification, ResNet50 demonstrated an average accuracy improvement of 8.70%, reaching 92.40% compared to its baseline performance. These results underscore the effectiveness of clustering with silhouette score analysis as a preprocessing step, significantly enhancing model accuracy and robustness. They also emphasize the critical role of preprocessing in addressing class imbalance and advancing precision medicine in cardiovascular diagnostics.Keywords
Cardiovascular diseases (CVDs) are the leading cause of death worldwide, taking millions of lives every year, and the death rate is increasing drastically day by day [1]. In 2016 alone, 17.9 million people—almost 31% of all global deaths—died from CVDs, compared to 13 million deaths recorded in 1990 [2]. Recently, a significant upward trend in death rates has been observed in developing countries. In fact, rheumatic heart disease is the most common form of CVD in young adults in the developing world, with an estimated 300,000 new cases each year [3].
The heart, being one of the most important organs of the human body, emits sounds during the mechanical activity of the valves and produces two distinct sounds: Lub and Dub, known as S1 and S2, respectively [4]. In addition to S1 and S2, a third heart sound (S3) and a fourth heart sound (S4) can occur in abnormal heartbeats. The signal from S1 to the following S2 is known as a heartbeat cycle or segment [5]. Sometimes, due to structural defects in the heart valves, a noisy sound known as a murmur is also observed [6]. Since the invention of the stethoscope in the 18th century, auscultation has been the most common and reliable non-invasive method for examining these sound features using a stethoscope. It is widely used for screening and diagnosing CVDs by cardiologists [7,8]. In addition to auscultation, various cardiac diagnostic modalities—such as echocardiograms—are commonly employed to detect cardiovascular diseases, as they provide insights into a range of structural and functional abnormalities of the heart [9]. However, these advanced methods may not always be available and are often costly, heart sounds (HS), also known as phonocardiograms (PCG), provide a cheap and efficient means of diagnosing CVDs. But effective cardiac auscultation requires trained and skilled physicians, as studies show that only 4 out of 10 CVD cases are accurately identified by medical students and primary care physicians, and errors greatly depend on the subjectivity of the analyst [10–13].
The main goal of automatic heart sound analysis is to achieve accurate classification of the cardiovascular diseases present in the cardiac heartbeat cycle. Typically, automatic heart sound and murmur analysis involves several phases: data acquisition and preprocessing, segmentation, feature extraction and selection, and classification [14]. Each phase comprises various methods, and the choice of method significantly influences the model’s performance.
To address the limitations of traditional diagnostic techniques and reduce reliance on expert interpretation, researchers have increasingly turned to artificial intelligence (AI) and machine learning solutions. In the era of AI, a considerable amount of deep learning-based work has been done on automatic disease detection using both 1D (time domain) [15–17] and 2D (time-frequency) [18–22] physiological signals. In the same vein, deep learning has emerged as a powerful tool for heart sound and murmur classification, particularly through the utilization of time-frequency representations and other features extracted from heart sounds. Many studies have used time-frequency representations as images, making them suitable for CNN image models, such as [23].
Among the various deep learning strategies, transfer learning has emerged as a particularly effective approach for improving classification performance on limited or specialized datasets. Transfer learning has been utilized to leverage pre-trained DL models, primarily trained on large-scale datasets such as ImageNet, for heart sound classification. Pre-trained models, especially those trained on ImageNet, have demonstrated good performance on time-frequency representations extracted from heart sounds [24]. Transfer learning approaches have involved using classic machine learning classifiers and feed-forward neural networks, with fine-tuning of pre-trained models proving to be particularly effective in adapting to heart sound datasets [8,24–26].
While model architecture and training strategies are often emphasized, preprocessing remains a foundational yet sometimes overlooked step that can significantly influence classification outcomes. The preprocessing phase is crucial in deep learning models as it enhances performance by highlighting important features and reducing noise and irrelevant information [27]. By ensuring that only high-quality data is used, preprocessing prevents the model from learning incorrect or irrelevant patterns [28]. This process eventually improves model accuracy by selecting better features and eliminating poor-quality or irrelevant data [29]. For example, in image processing, selecting high-quality data can significantly boost the model’s ability to recognize patterns by providing more consistent and varied input [30].
For the task of automated classification using Phonocardiogram (PCG) signals, significant research has primarily focused on datasets from the PhysioNet/CinC Challenge [31], PASCAL datasets [32], and publicly available datasets on GitHub [33]. These collections largely concentrate on binary classifications—distinguishing between healthy and unhealthy states—or on a limited number of common valvular diseases. A recent unique dataset, named the HeartWave dataset [34], encompasses a broad spectrum of approximately nine distinct heart sound classes, including some not present in any other dataset. This dataset includes conditions such as Normal, Aortic Stenosis, Aortic Regurgitation, Pulmonic Stenosis, Pulmonary Regurgitation, Tricuspid Stenosis, Tricuspid Regurgitation, Mitral Stenosis, and Mitral Regurgitation. Notably, Pulmonic Stenosis, Tricuspid Stenosis, and Tricuspid Regurgitation are among the rarest, difficult-to-diagnose classes. In this study, we use the multiclass HeartWave dataset.
All available heart sound datasets, except for one public dataset on GitHub [33], suffer from severe class imbalance. This imbalance poses a significant challenge because deep learning models tend to favor the majority class, leading to biased predictions and poor generalization on underrepresented classes. Balancing such datasets is particularly difficult due to the scarcity of rare cardiovascular conditions and the variability in recording quality and duration. Moreover, many existing studies overlook effective preprocessing techniques that could mitigate these challenges. While some works [23,35] attempt data selection in preprocessing, their biclustering-based approach relies on arbitrary sample counts—retaining clusters with more samples and discarding those with fewer—without assessing cluster quality. This highlights the difficulty of designing systematic, reliable preprocessing strategies that can adapt to the heterogeneous and complex nature of heart sound data. In this context, we argue that robust and data-driven preprocessing methods are still lacking and urgently needed for effective CVD classification.
In this study, we propose a novel downsampling method that systematically selects high-quality samples from overrepresented classes using cluster-based analysis. Unlike random reduction techniques, our approach prioritizes cluster cohesion and separation to retain diagnostically meaningful data while achieving class balance.
Our proposed approach entails utilizing iterative K-means clustering and silhouette scores to enhance data quality during the downsampling process before feeding it into deep learning models. We apply K-means clustering to divide the data into two clusters, grouping data with similar characteristics. We then calculate the average silhouette score for each cluster. The silhouette score measures how similar each data point is to its own cluster compared to other clusters. We retain the cluster with the highest average silhouette score and exclude the cluster with the lowest average score. This process is repeated iteratively until the number of data samples per cluster is reduced to match the number of samples in the smallest class in the dataset. Our method improves data quality by considering the nature of heart sounds and murmurs, which is challenging due to their strong similarities.
Our primary contributions include:
1. Proposing a novel preprocessing method, iterative clustering with silhouette analysis aimed at downsampling, to improve the accuracy of heart sound and murmur classification.
2. Applying the proposed method to the HeartWave dataset, we conducted a thorough benchmarking study using a set of pretrained models to demonstrate the effectiveness of the approach in both binary and multiclass classification, with and without data augmentation.
3. Validating the effectiveness of the proposed method in classifying rare and challenging-to-diagnose classes within datasets, highlighting the potential of the proposed method in handling complex classification tasks.
The paper is structured as follows: In Section 2, recent studies on the classification of heart sounds and murmurs are reviewed in depth. In Section 3, we provide a detailed definition of the silhouette score technique. In Section 4, the datasets used in the study are presented along with their preprocessing approaches. Section 5 provides a detailed overview of the proposed preprocessing approach. Section 7 demonstrates the experimental settings, followed by the presentation of the results in Section 8. A comparative discussion, an outline of future research directions, and a discussion of the limitations of the results are provided in Section 9. Finally, the conclusions of this work are summarized in Section 10.
In this section, we explore the methods of heart sounds and murmurs for classifying heart diseases has been been proposed. Heart sound (PCG) signals can be transformed using either 1D or 2D approaches to prepare the data for deep learning models. 1D transformations preserve the original waveform of the PCG signals, feeding the data into models as time-series input, typically used in 1D-CNN architectures. For instance, Oh et al. [36] applied a 1D CNN model to classify heart sounds directly from their 1D waveform. Similarly, Lee and Kwak [37] and Bao et al. [38] incorporated 1D wavelet transforms in addition to their 2D methods. 2D transformations, in contrast, convert PCG signals into time-frequency representations, such as spectrograms, which can be processed by 2D-CNN models. Notable examples include the Short-Time Fourier Transform (STFT) employed by Singh et al. [39] and Chen et al. [40], as well as the discrete wavelet transform (DWT) used by Das et al. [41]. These 2D transformations capture both temporal and frequency features, allowing for more comprehensive feature extraction in classification tasks. Whether using 1D or 2D transformations, these techniques are critical for converting raw PCG signals into usable formats for deep learning models.
Denoising is essential for improving the classification performance of heart sounds, particularly when dealing with noisy PCG or murmur data. Numerous researchers have employed filtering techniques to reduce noise and enhance signal quality. Chen et al. [40] applied a Butterworth filter to remove noise from PCG signals before converting them into spectrograms. Similarly, Marocchi et al. [42] used filtering to remove spikes from PCG signals as part of the preprocessing phase. Additionally, Li et al. [43] introduced a denoising autoencoder (DAE) for feature extraction, significantly improving model performance. Moreover, the studies in [44–46] denoised the PCG signals to enhance clarity. These studies underscore the importance of denoising techniques in enhancing heart sound classification accuracy by minimizing the impact of noise on the data.
Data augmentation has been widely adopted to address the challenges posed by limited datasets and to improve heart sound classification model performance. Das et al. [41] employed augmentation techniques such as time-stretching and pitch-shifting to diversify the dataset. Boulares et al. [23] used heartbeat cycle segmentation to generate additional training samples. Similarly, Barnawi et al. [35] combined heartbeat cycle segmentation with clustering for sample selection. These augmentation strategies enhance the generalization capabilities of models by artificially expanding the dataset and enabling the models to learn from a broader variety of samples.
Imbalanced datasets can lead to biased classification models that favor the majority class, resulting in poor recall for minority classes—often the most clinically significant. This skews performance metrics like accuracy, giving a false sense of model effectiveness while overlooking rare or complex conditions. In heart sound classification, such imbalance can hinder the detection of critical abnormalities, reduce model generalizability, and compromise clinical reliability. In [47], the authors addressed the limitations of relying solely on either ECG or PCG signals for diagnosing coronary artery disease (CAD), emphasizing the importance of multimodal signal analysis. Leveraging the strength of deep learning for feature extraction, they proposed a hybrid ensemble architecture that combines convolutional neural networks (CNN) and bidirectional long short-term memory (BiLSTM) models. However, the study did not consider the issue of class imbalance in the PhysioNet/CinC Challenge 2016 dataset, which contains 2575 normal samples and only 655 abnormal samples. As a result, the proposed model is likely biased toward the majority (normal) class, potentially affecting its generalizability and diagnostic reliability for detecting abnormal heart conditions.
In [48], the authors proposed WCFormer, an interpretable wavelet convolution transformer for heart sound-based CVD diagnosis. The model integrates wavelet convolution and a global–local feature extractor to enhance interpretability and classification accuracy. Although it achieved strong results, the study used a pre-balanced dataset collected in a controlled laboratory environment, which may limit its generalizability to real-world clinical settings.
In [46], a recent study, the authors combined deep learning with explainable AI (XAI) to enhance heart sound classification. Using the HeartWave dataset with expert-guided manual segmentation, they addressed limitations of automatic segmentation
Lilhore et al. [45] proposed an attention-based CNN–BiLSTM model that incorporates spatial attention in the CNN layers and temporal attention in the BiLSTM to enhance heart sound classification. The model was evaluated on the PCG and PASCAL datasets, demonstrating improved accuracy. The PASCAL dataset used is imbalanced, which may bias the classifier toward majority classes. The study did not address this class imbalance, potentially affecting the reliability of the results.
Li et al. [44] proposed CAFusionNet, a multi-scale CNN architecture that integrates channel attention mechanisms and transfer learning to improve heart sound classification. However, the study employed two imbalanced datasets, which may bias the classifier toward majority classes. This potential bias was not addressed, possibly affecting the model’s generalization and reliability.
Han and Shaout [49] developed ENACT–Heart, an ensemble framework that combines CNNs and Vision Transformers (ViTs) within a mixture of experts (MoE) architecture, achieving high classification accuracy. However, the study does not address the class imbalance present in the PASCAL dataset, which may affect the reliability and generalizability of the results.
Addressing imbalance is therefore essential to ensure fair and accurate AI-driven diagnosis. Sample selection strategies have been explored in various studies, with some relying on random selection methods that fail to address class imbalances. For example, Barnawi et al. [35] used random cluster selection, discarding clusters with fewer samples, which resulted in an imbalanced dataset. Similarly, Boulares et al. [23] applied random segment selection without employing clustering metrics, worsen class imbalance. These random selection techniques, while simple and straightforward, often fail to consider class distribution, leading to potential biases in model training. In contrast, the proposed work emphasizes systematic sample selection to balance the data, ensuring that all classes are equally represented and reducing the impact of imbalanced data. A comparison between existing related work and our proposed work is outlined in Table 1. Fig. 1 summarizes the general framework used in this study, starting with the HeartWave dataset, followed by denoising the PCG signals, transforming the PCG signals into mel spectrogram images, applying the proposed sample selection method, and concluding with the use of pretrained deep learning models to evaluate the impact of the proposed method on classifying heart sounds to detect cardiovascular diseases (CVDs).
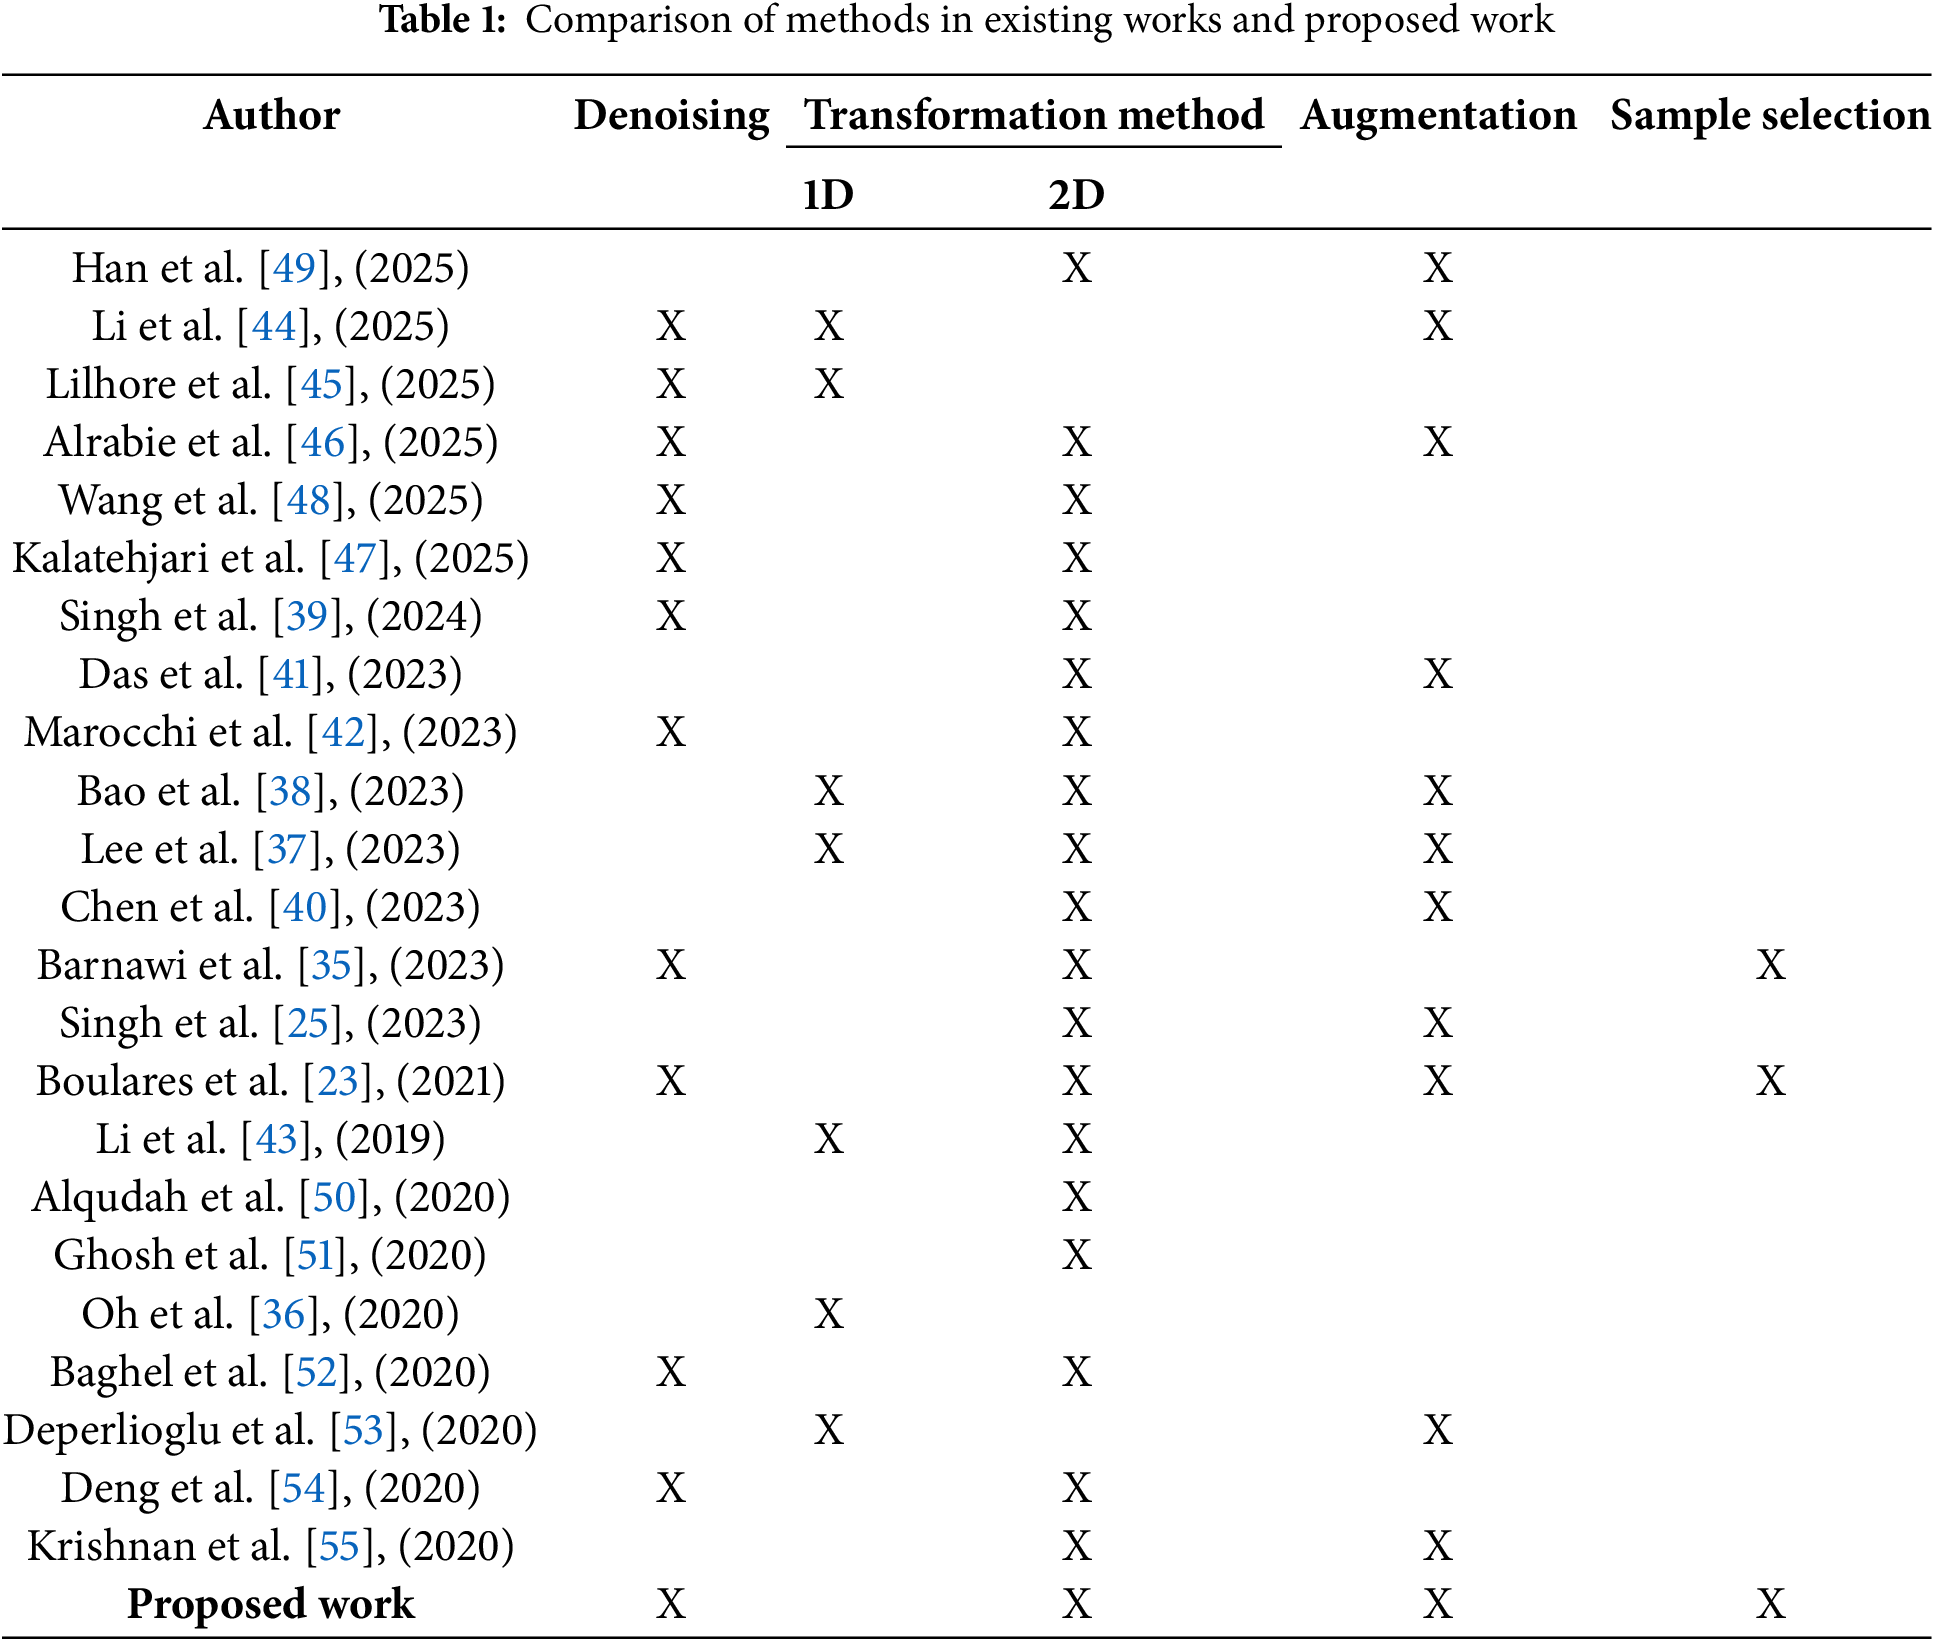

Figure 1: Framework of the proposed work
There are many techniques used to estimate the clustering performance, such as the Rand index [56], the adjusted Rand index [56], the distortion score, the Davies-Bouldin index (DBI) [57], the Calinski-Harabasz index [58] and the silhouette score [59]. The silhouette score considers both intra-cluster cohesion and inter-cluster separation; this provides a more balanced assessment of clustering quality compared to other methods. Additionally, the silhouette score provides insights by evaluating each individual data point, facilitating detailed analysis of cluster boundaries and potential misclassifications [59]. Due to the comprehensive and intuitive nature of the silhouette score, in this work, we employ the silhouette score to evaluate clustering performance. The silhouette score
where
where
where
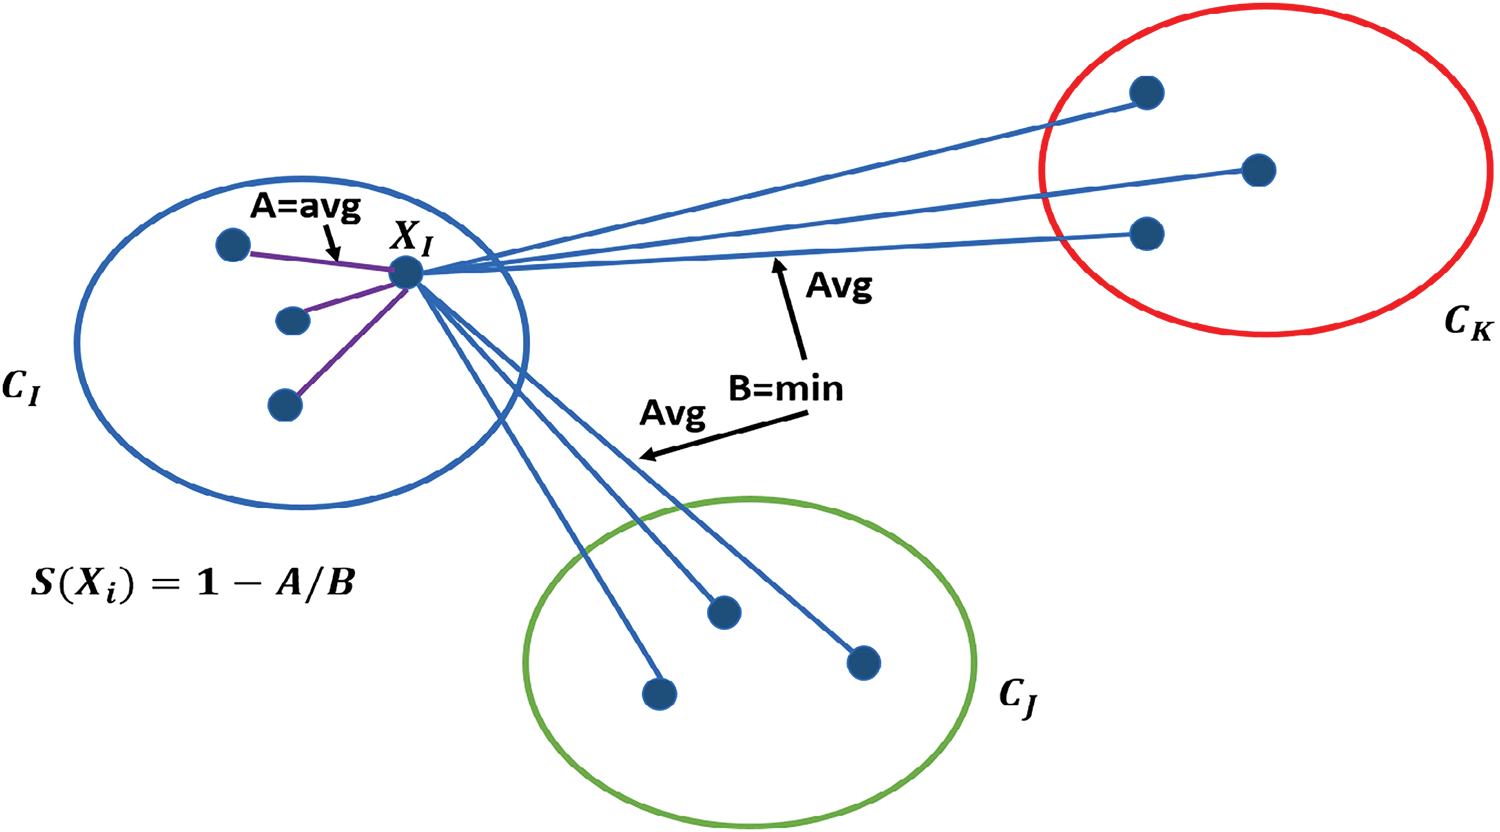
Figure 2: Illustration of silhouette score calculation for a point
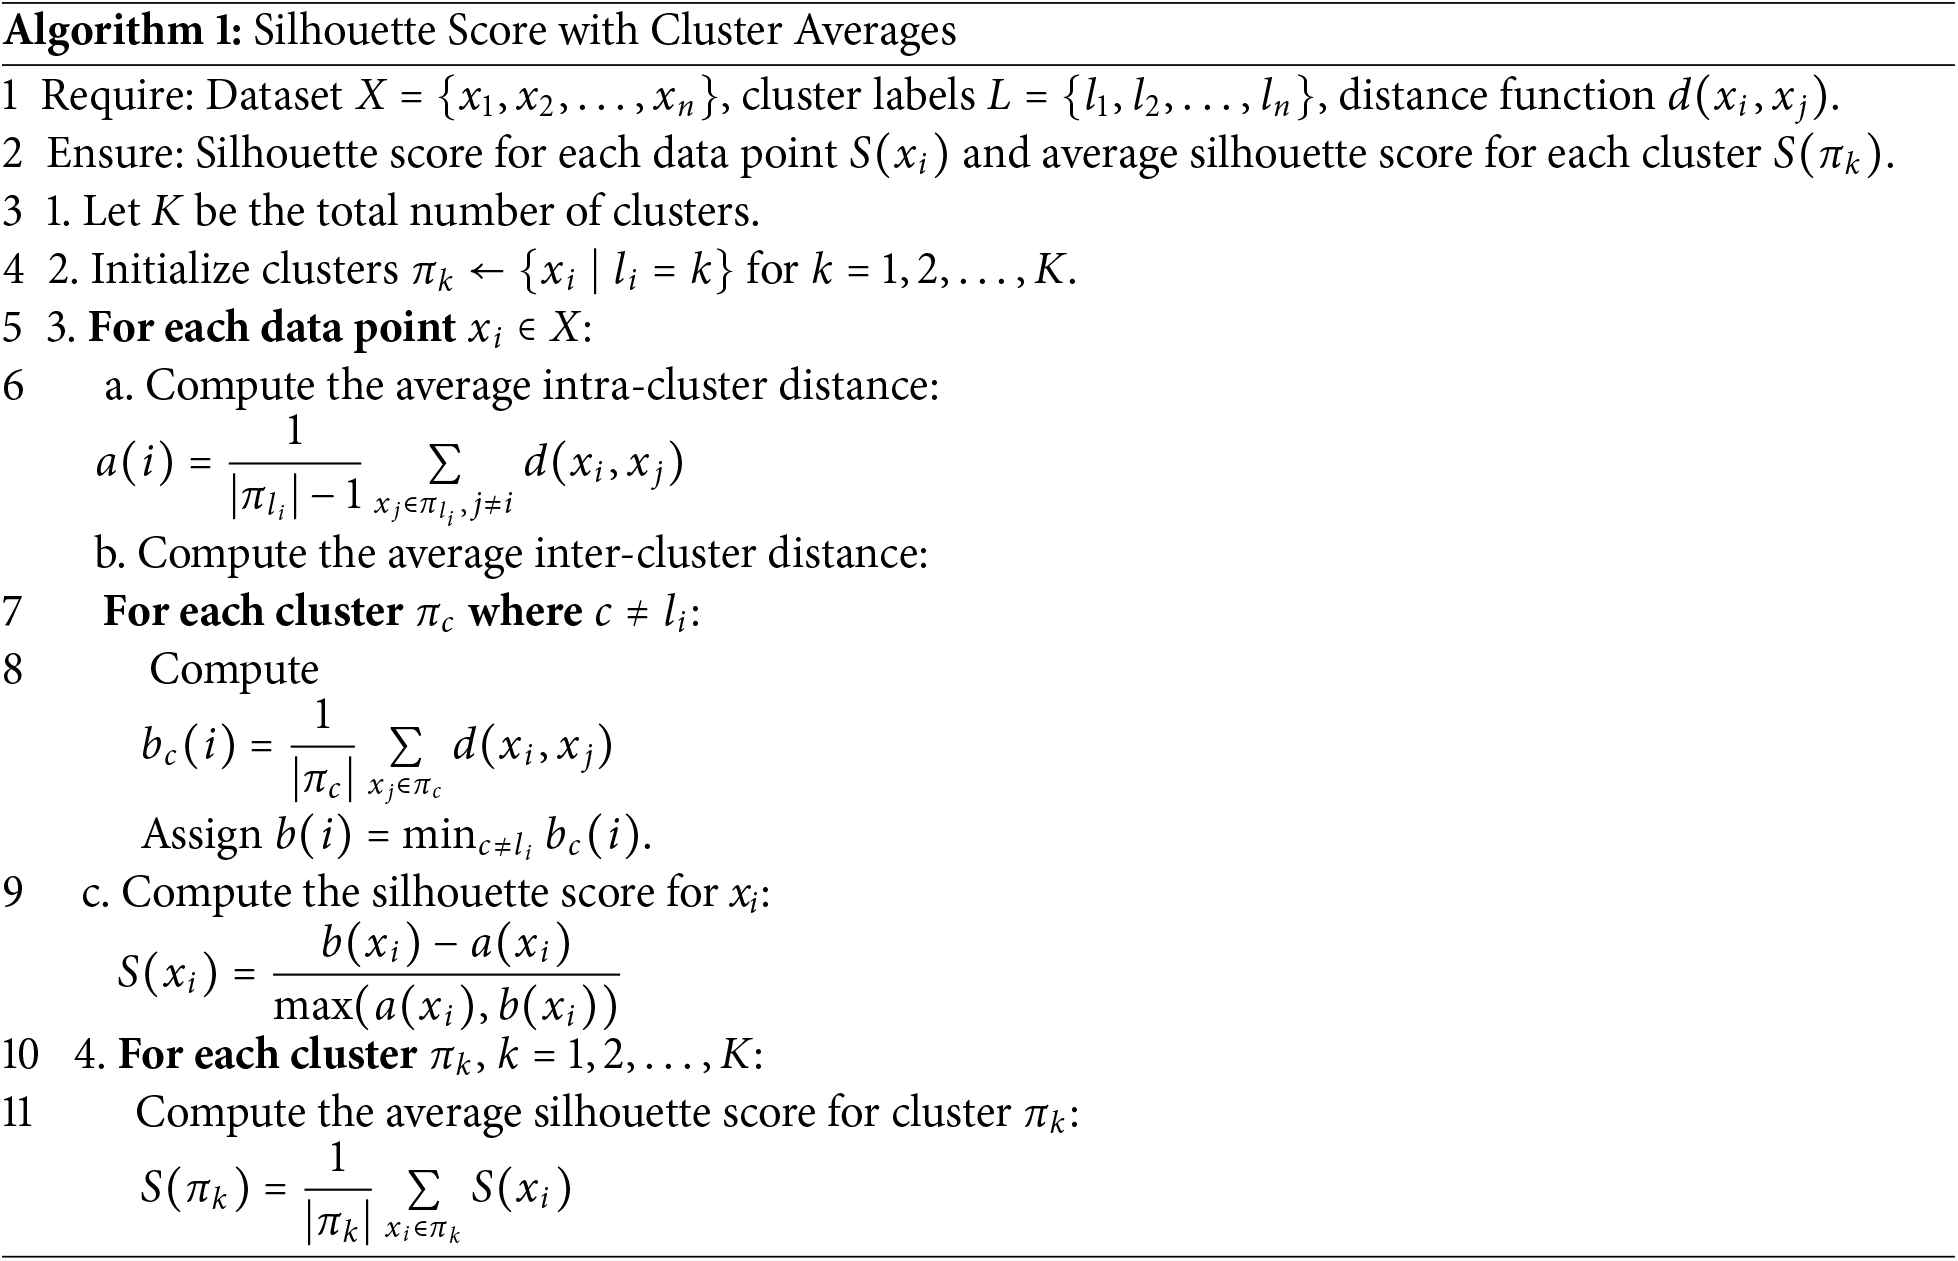
Moreover, Algorithm 1 outlines the step-by-step process for calculating the average silhouette score for each cluster. The iterative k-means clustering method leverages the silhouette score to optimize clustering quality. The silhouette score evaluates how similar samples within a cluster are to each other (intra-cluster similarity) while ensuring they are well-separated from samples in other clusters (inter-cluster separation). By iteratively refining the clustering process based on silhouette scores, the method systematically selects the most cohesive clusters and discards less meaningful ones. This process ensures that only high-quality clusters are retained, preserving meaningful data. As a result, the refined dataset allows machine learning models to learn more effectively, leading to improved performance metrics such as accuracy, precision, recall, and weighted F1-score. The combination of k-means clustering and silhouette analysis provides a robust mechanism to handle class imbalance, ensuring better representation of all classes and ultimately enhancing model generalization.
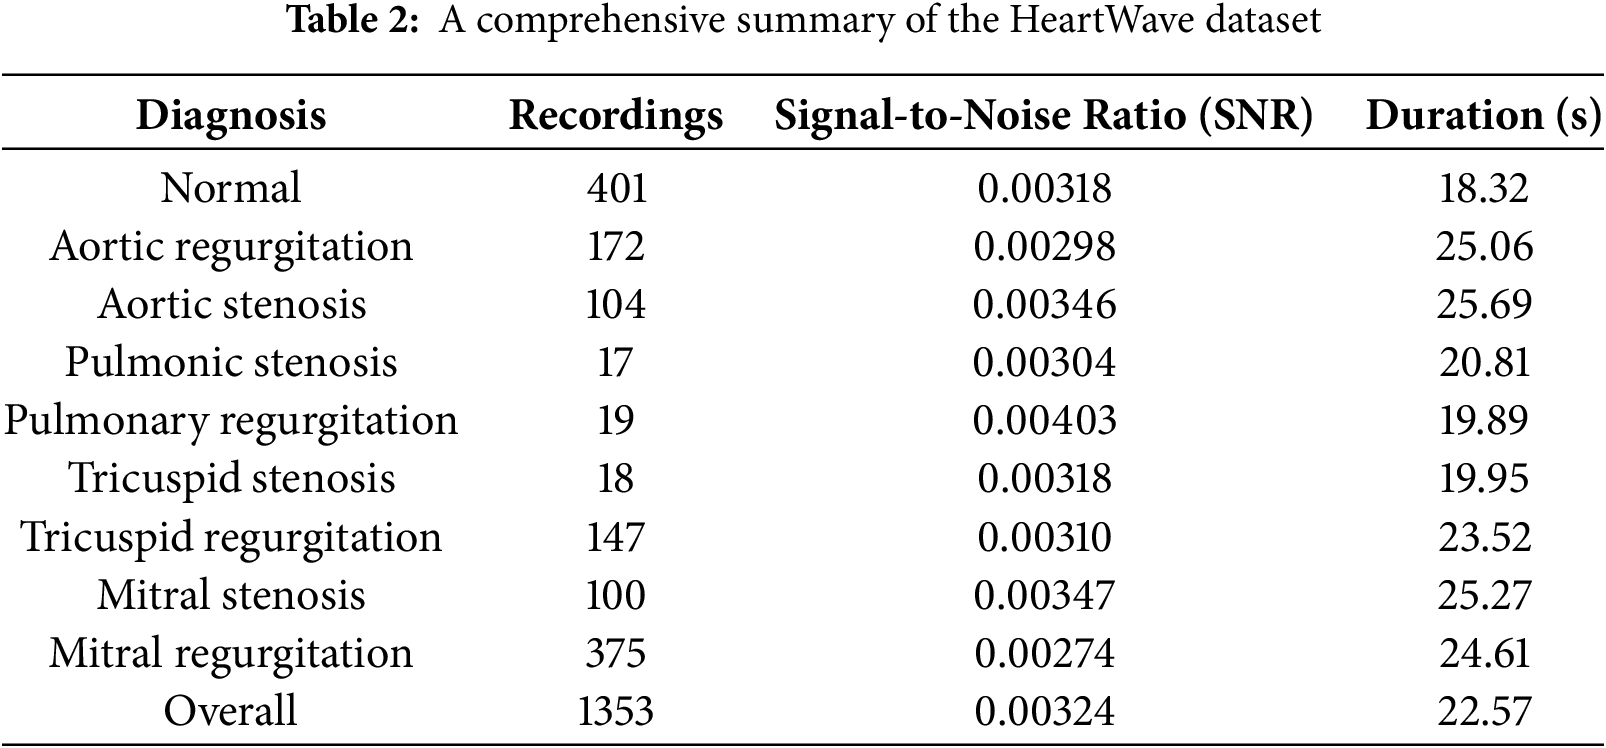
The HeartWave dataset was collected, which includes rare and difficult-to-diagnose diseases, for which no comprehensive dataset previously existed. Current public heart sound datasets are limited in both quantity and the variety of labeled cases, and they lack some of the most common and difficult-to-diagnose classes. This Study utilized the HeartWave dataset [34], a collaborative effort between King Abdulaziz University and three hospitals. The dataset, consisting of 1353 records, provides label annotations at record levels and specifies the chest area from which each recording was obtained. Patient distribution within the dataset comprises 401 recordings from healthy individuals and 952 recordings from patients with various diseases. Predominantly, mitral regurgitation is the most represented condition among diseased patients, followed by aortic regurgitation—both associated with rheumatic fever. Notably, classes like pulmonic stenosis and pulmonic regurgitation have relatively fewer samples compared to other disease classes. The HeartWave dataset includes rare and difficult-to-diagnose classes, each with its own distinct features. These features share similarities based on several characteristics, such as the timing within the cardiac cycle (systolic, diastolic, or both), intensity, shape, pitch, radiation, and location. Despite significant overlap in the frequency spectra of heart sounds, murmurs are often more disordered in nature. The faint similarities between these characteristics further complicate accurate diagnosis [61].
An important aspect of the HeartWave dataset is the inclusion of murmur grades ranging from 1 to 6, accurately reflecting the varying severity and characteristics of murmurs encountered in real-world scenarios. The assignment of murmur grades was conducted through echocardiography referencing. The average record duration is 21.57 s, and all sound records are stored in wave (.wav) format. An overview of the dataset is presented in Table 2.
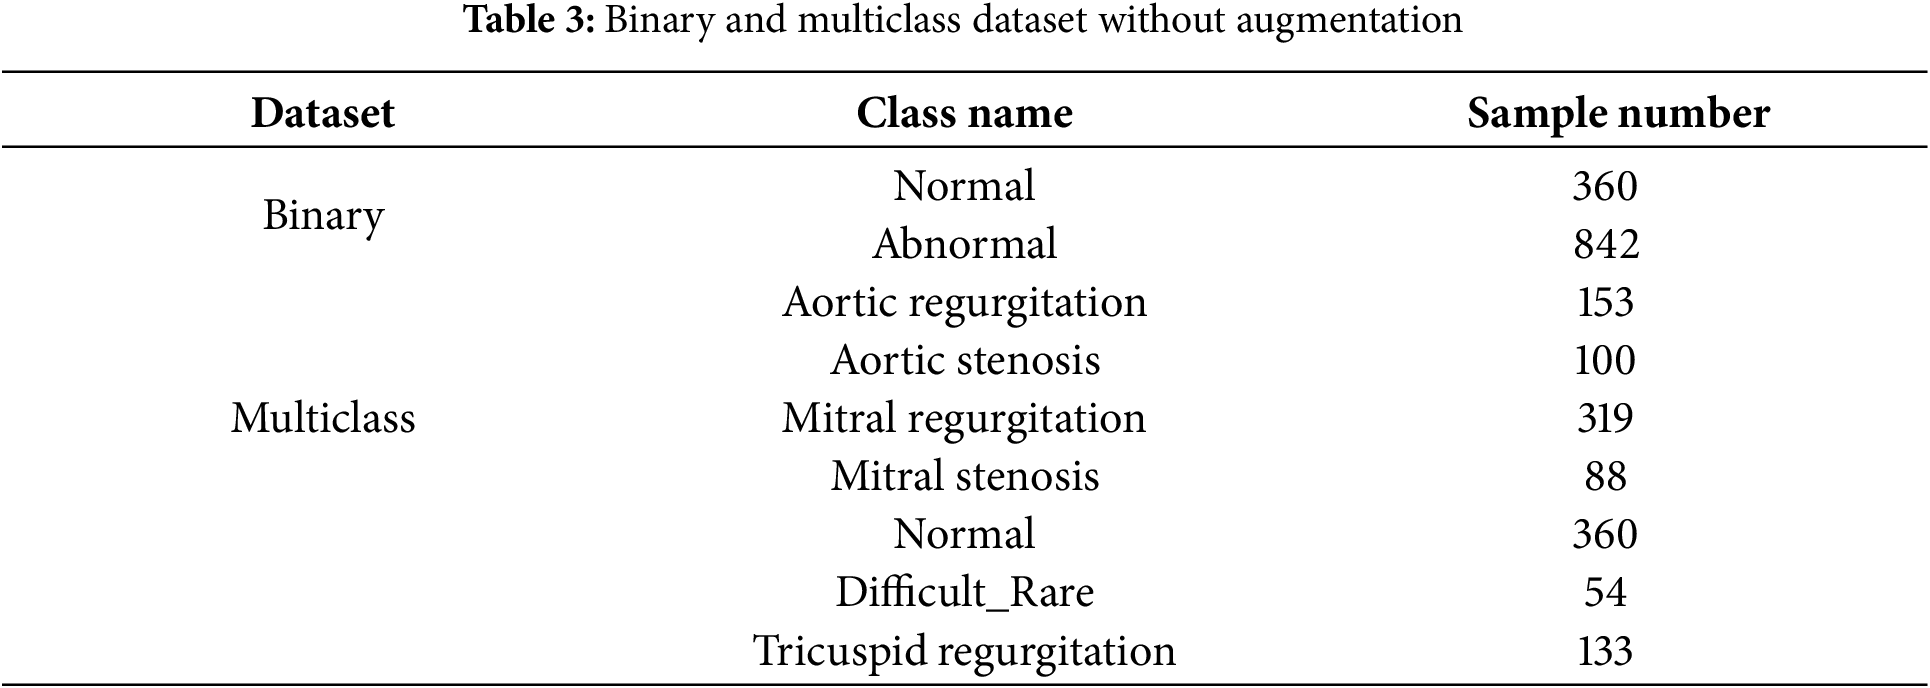
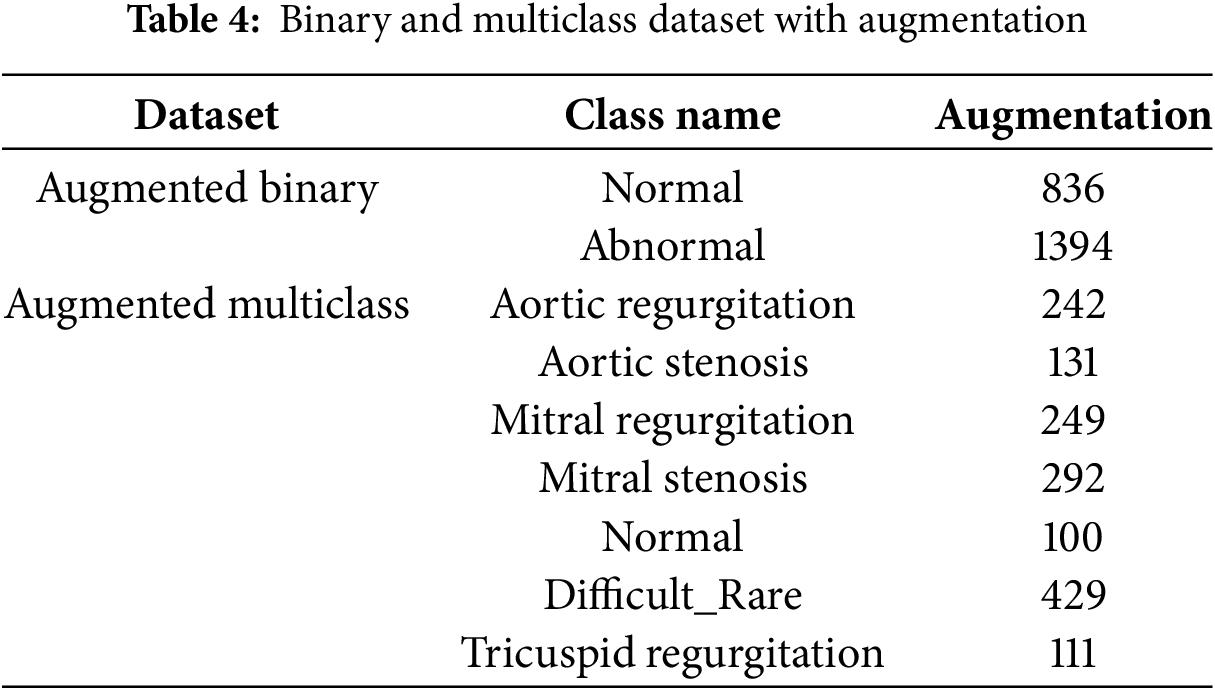
In this work, we use this dataset as four different datasets: binary dataset, augmented binary dataset, mulitlcass dataset, and augmented mulitlcass dataset. In the binary dataset, unhealthy classes merged as abnormal classes, and healthy class remained as normal class. In an augmented binary dataset, we use cardiac heartbeat cycle segmentation as an augmentation method to increase the size of the dataset. In the mulitlcass dataset, we merged three classes, pulmonic stenosis, pulmonic regurgitation, and tricuspid stenosis, as one class and named it the diffcult_rare class due to their small size. In the augmented multiclass dataset, cardiac heartbeat cycle segmentation was applied specifically to the clusters with the highest Silhouette Score after the initial clustering step in multiclass dataset, rather than directly to the original dataset classes. This process, as outlined in the proposed preprocessing approach, was designed to balance the dataset and improve data quality, making it more suitable for training deep learning models.
Table 3 presents the binary and multiclass datasets without augmentation, while Table 4 summarizes the corresponding datasets with augmentation.
Due to the presence of various types of noise in the collected heart sound signals and the concentration of diagnostically relevant information within a specific frequency range, a 4th-order low-pass Butterworth Infinite Impulse Response (IIR) filter with a cutoff frequency of 600 Hz was applied. This choice is motivated by the characteristics of the HeartWave dataset [34], which includes pathological conditions that produce frequency components extending up to 600 Hz. To ensure these important diagnostic features are preserved and not inadvertently removed, 600 Hz was selected as the cutoff point. This filtering process is essential for isolating the relevant frequency components and enhancing overall signal quality [46]. Moreover, the signal-to-noise ratio (SNR) refers to the proportion between the power of the desired signal and the power of the background noise [62]. We retained only the PCG signals with SNR values greater than or equal to zero to ensure that the dataset includes recordings with at least non-negative signal quality. An
4.2.2 Cardiac Heartbeat Cycle Segmentation
The cardiac heartbeat cycle, characterized by the initiation of two distinct heart sounds the first heart sound (S1) and the second heart sound (S2), stems from the heart’s electrical activity driving its mechanical actions. In an electrocardiogram (ECG) signal, SS1 typically follows the QRS complex (comprising the Q wave, R wave, and S wave), which represents ventricular depolarization While ECG signals offer insight into cardiac heartbeat cycles, detecting valvular heart diseases necessitates extracting additional parameters such as S1, S2, systolic, and diastolic durations. However, ECG acquisition poses practical challenges for patients. Murmurs, when present, can obscure the onset of heart sounds, complicating the automated segmentation of cardiac heartbeat cycles without ECG reliance. To overcome this hurdle, we adopted a heartbeat cycle segmentation approach outlined in [23,63].
In this research, the Short-Time Fourier Transform (STFT) technique was employed to generate mel spectrograms from one-dimensional Phonocardiogram (PCG) signals, transforming them into 224 × 224 pixel images. STFT was a well-established and frequently used method for feature extraction from one-dimensional acoustic samples, as it effectively preserved information in both spectral and temporal domains. The STFT was defined mathematically as:
In this equation,
5 Proposed Pre-Processing Approach
In this section, We present a novelty iterative k-means clustering leverage average silhouette analysis approach. Which leverages K-means clustering and Silhouette analysis to achieve effective downsampling. The proposed method combines K-means clustering with silhouette scoring to systematically reduce the number of samples in each class. The proposed method combines K-means clustering with silhouette scoring to systematically reduce the number of samples in each class. The process begins by identifying the class with the smallest number of samples, which is set as the target. K-means is then applied to the other classes to form clusters.
After clustering, the average silhouette score is calculated for each cluster to assess its quality. The cluster with the highest average score is selected. If the number of samples in the selected cluster exceeds the target (the number of samples in the smallest class), K-means clustering is repeated, and the silhouette score is recalculated. This clustering and evaluation process is repeated iteratively. If the number of samples in the selected cluster is less than the target, samples from the other cluster are transferred to reach the target size. This iterative procedure continues until all classes are downsampled to match the size of the smallest class. Once all classes have equal sample sizes, the dataset is considered balanced, and the iterative K-means clustering process is terminated. Fig. 3 illustrates the downsampling process, iterative clustering, and silhouette score calculations, demonstrating how the dataset is balanced and Fig. 4 illustrates the clustering and scoring process, where a pretrained VGG16 model is used as a feature extractor to process the images.
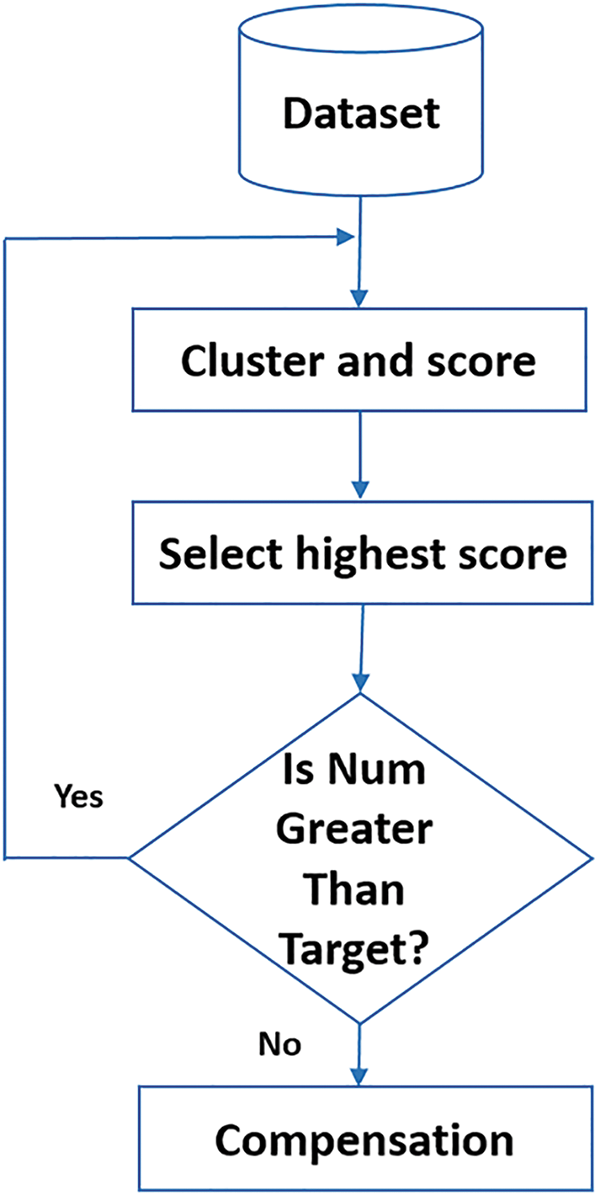
Figure 3: Flowchart of the proposed method: Classes larger than the minimum are clustered, silhouette scores are calculated, and the highest scoring cluster is selected. If the cluster size exceeds the target, clustering is repeated. Otherwise, compensation is applied, and the process iterates until class sizes are balanced
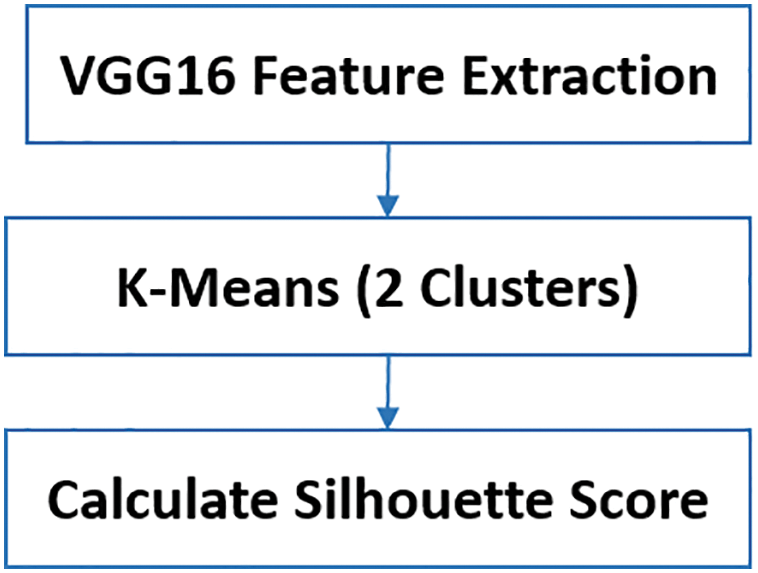
Figure 4: Steps in the cluster and score process: Feature extraction using VGG16, K-Means clustering, and average silhouette score calculation
In our context, downsampling refers to a specific type of sample selection technique aimed at balancing the dataset by reducing the number of samples in overrepresented classes while retaining the most representative samples based on cluster cohesion and separation. This ensures that the resulting datasets are both balanced and of high quality for training deep learning models.
The extracted features are then used as input for K-Means clustering, which partitions the data into two clusters. Finally, the average silhouette score is calculated for each cluster to assess their quality.
Furthermore, to concisely describe the proposed method, it is presented in the form of Algorithm 2. The method systematically adjusts class sizes to match the smallest class in the dataset, thereby ensuring a balanced distribution across all classes. Initially, the smallest class size is identified and designated as the target. For each overrepresented class, features are extracted using a pretrained model such as VGG16, and K-means clustering is applied to partition the samples into two clusters. The average silhouette score is computed for each cluster to evaluate its quality, and the cluster with the higher score—indicating better intra-cluster cohesion and inter-cluster separation—is selected. If the selected cluster size exceeds the target, K-means is reapplied to refine the partitioning. If the cluster size is smaller than the target, additional samples from the other cluster are transferred to reach the desired size. If the cluster size equals the target, no further adjustment is needed. This iterative process is repeated for each class until all classes are downsampled to the target size, resulting in a balanced and high-quality dataset suitable for training deep learning models.

In certain cases, if the size of the selected cluster (i.e., the one with the higher average silhouette score) is smaller than the target class size, additional samples are selectively transferred from the other cluster (with the lower silhouette score) to meet the target size. While this lower-scoring cluster typically reflects lower cohesion and separation, it still consists of original data samples and should not be interpreted as entirely meaningless or irrelevant. Rather, it serves as a secondary source from which representative samples can be drawn when necessary. This strategy ensures that the downsampling process remains systematic and quality-guided, rather than relying on arbitrary or random sample removal. Ultimately, this helps maintain a balanced, high-quality dataset for training deep learning models.
In this section, we applied the proposed preprocessing approach to the four datasets: a binary dataset, augmented binary dataset, a multiclass dataset, and augmented multiclass dataset augmented. We will analyze each of these datasets using the proposed preprocessing approach in the next subsections.
6.1 Binary Clustering Downsampling
In the binary dataset, the normal class has 360 samples, and the abnormal class has 842 samples. Fig. 5 shows binary clustering downsampling approach. We applied the proposed algorithm in order to balance the dataset. The aim is to keep the normal class 360 as it the minimum class and use the proposed method to downsampling the abnormal class. For the abnormal class, after the first iteration of K-means clustering, the first cluster has 263 samples with an average silhouette score of 0.1, and the second cluster has 579 samples with an average silhouette score of 0.21. The second cluster is retained as it has the higher average silhouette score and its sample number is bigger than the normal class. A second iteration of K-means clustering on the retained 579-sample abnormal cluster results in two new clusters: the first with 270 samples and an average silhouette score of −0.02, and the second with 307 samples and an average silhouette score of 0.16. The second cluster (307 samples) is retained and added 53 samples from the 270 cluster to be 360 samples. For both classes, normal and abnormal 360 samples considered. Fig. 6 shows the silhouette values distribution of this clustering. For Cluster 307, the majority of the silhouette values are positive, clustering around 0.15 to 0.25, indicating relatively well-clustered and better clustering quality compared to Cluster 270. The silhouette values for Cluster 270 are centered around 0, with values ranging roughly between −0.25 and 0.25, and a significant concentration of silhouette values around the 0 mark. This near-zero and slightly negative average silhouette score indicates that the data points in Cluster 270 are poorly clustered and suggest potential overlaps.
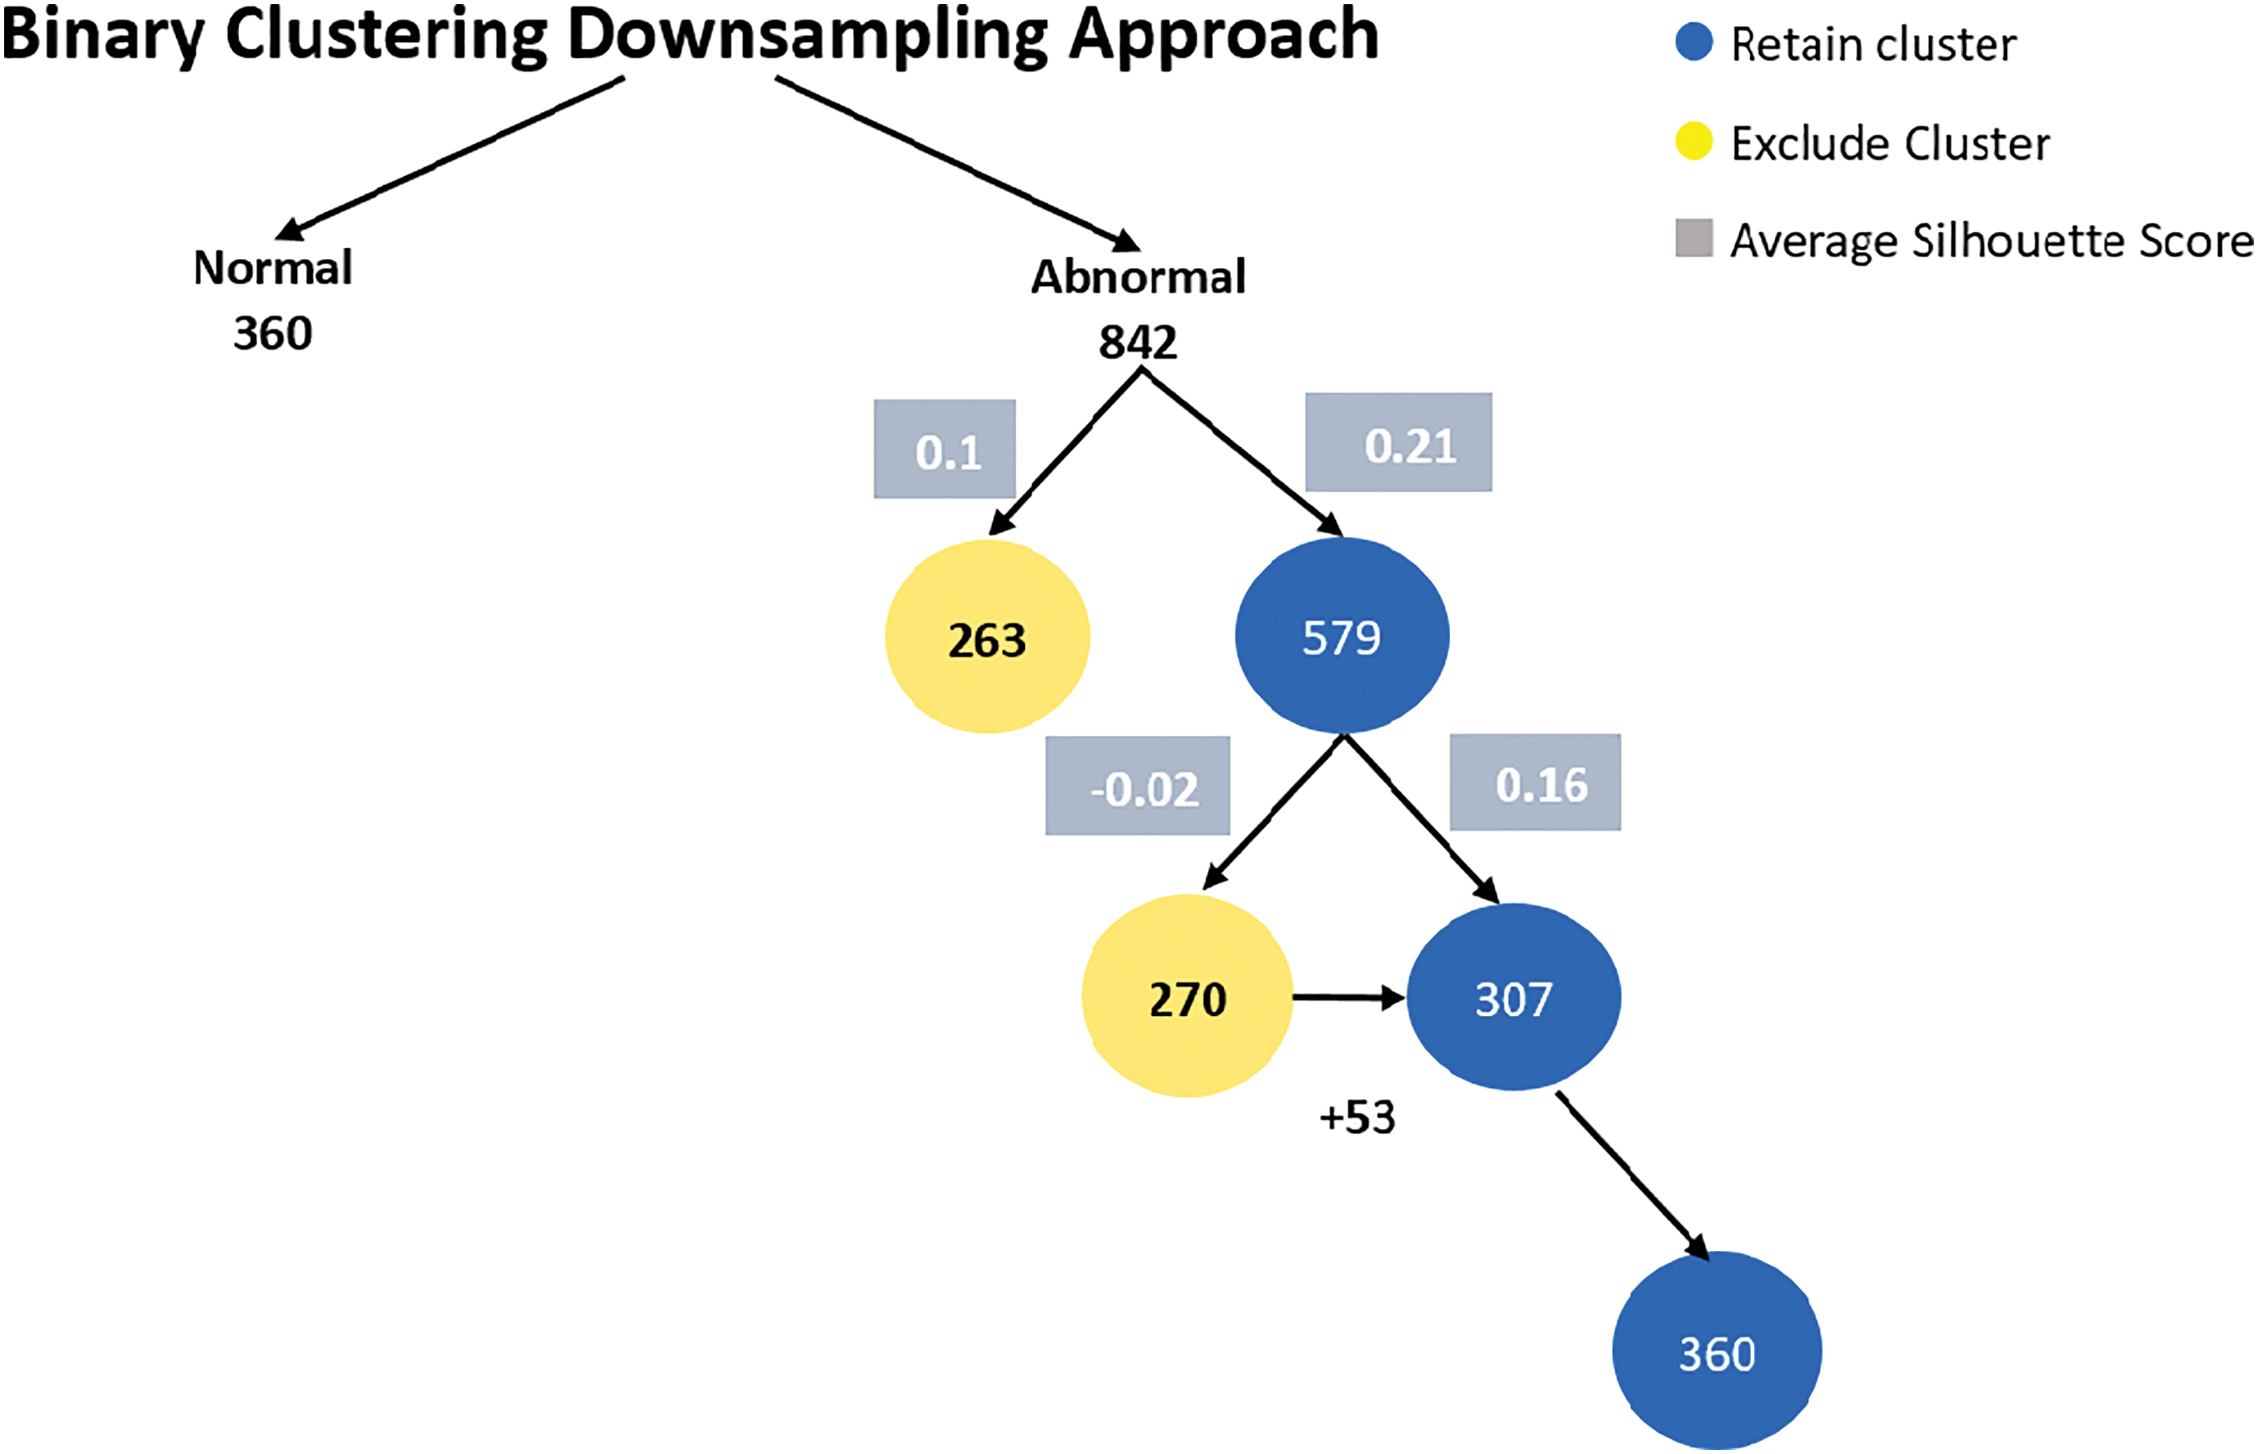
Figure 5: Binary clustering downsampling approach
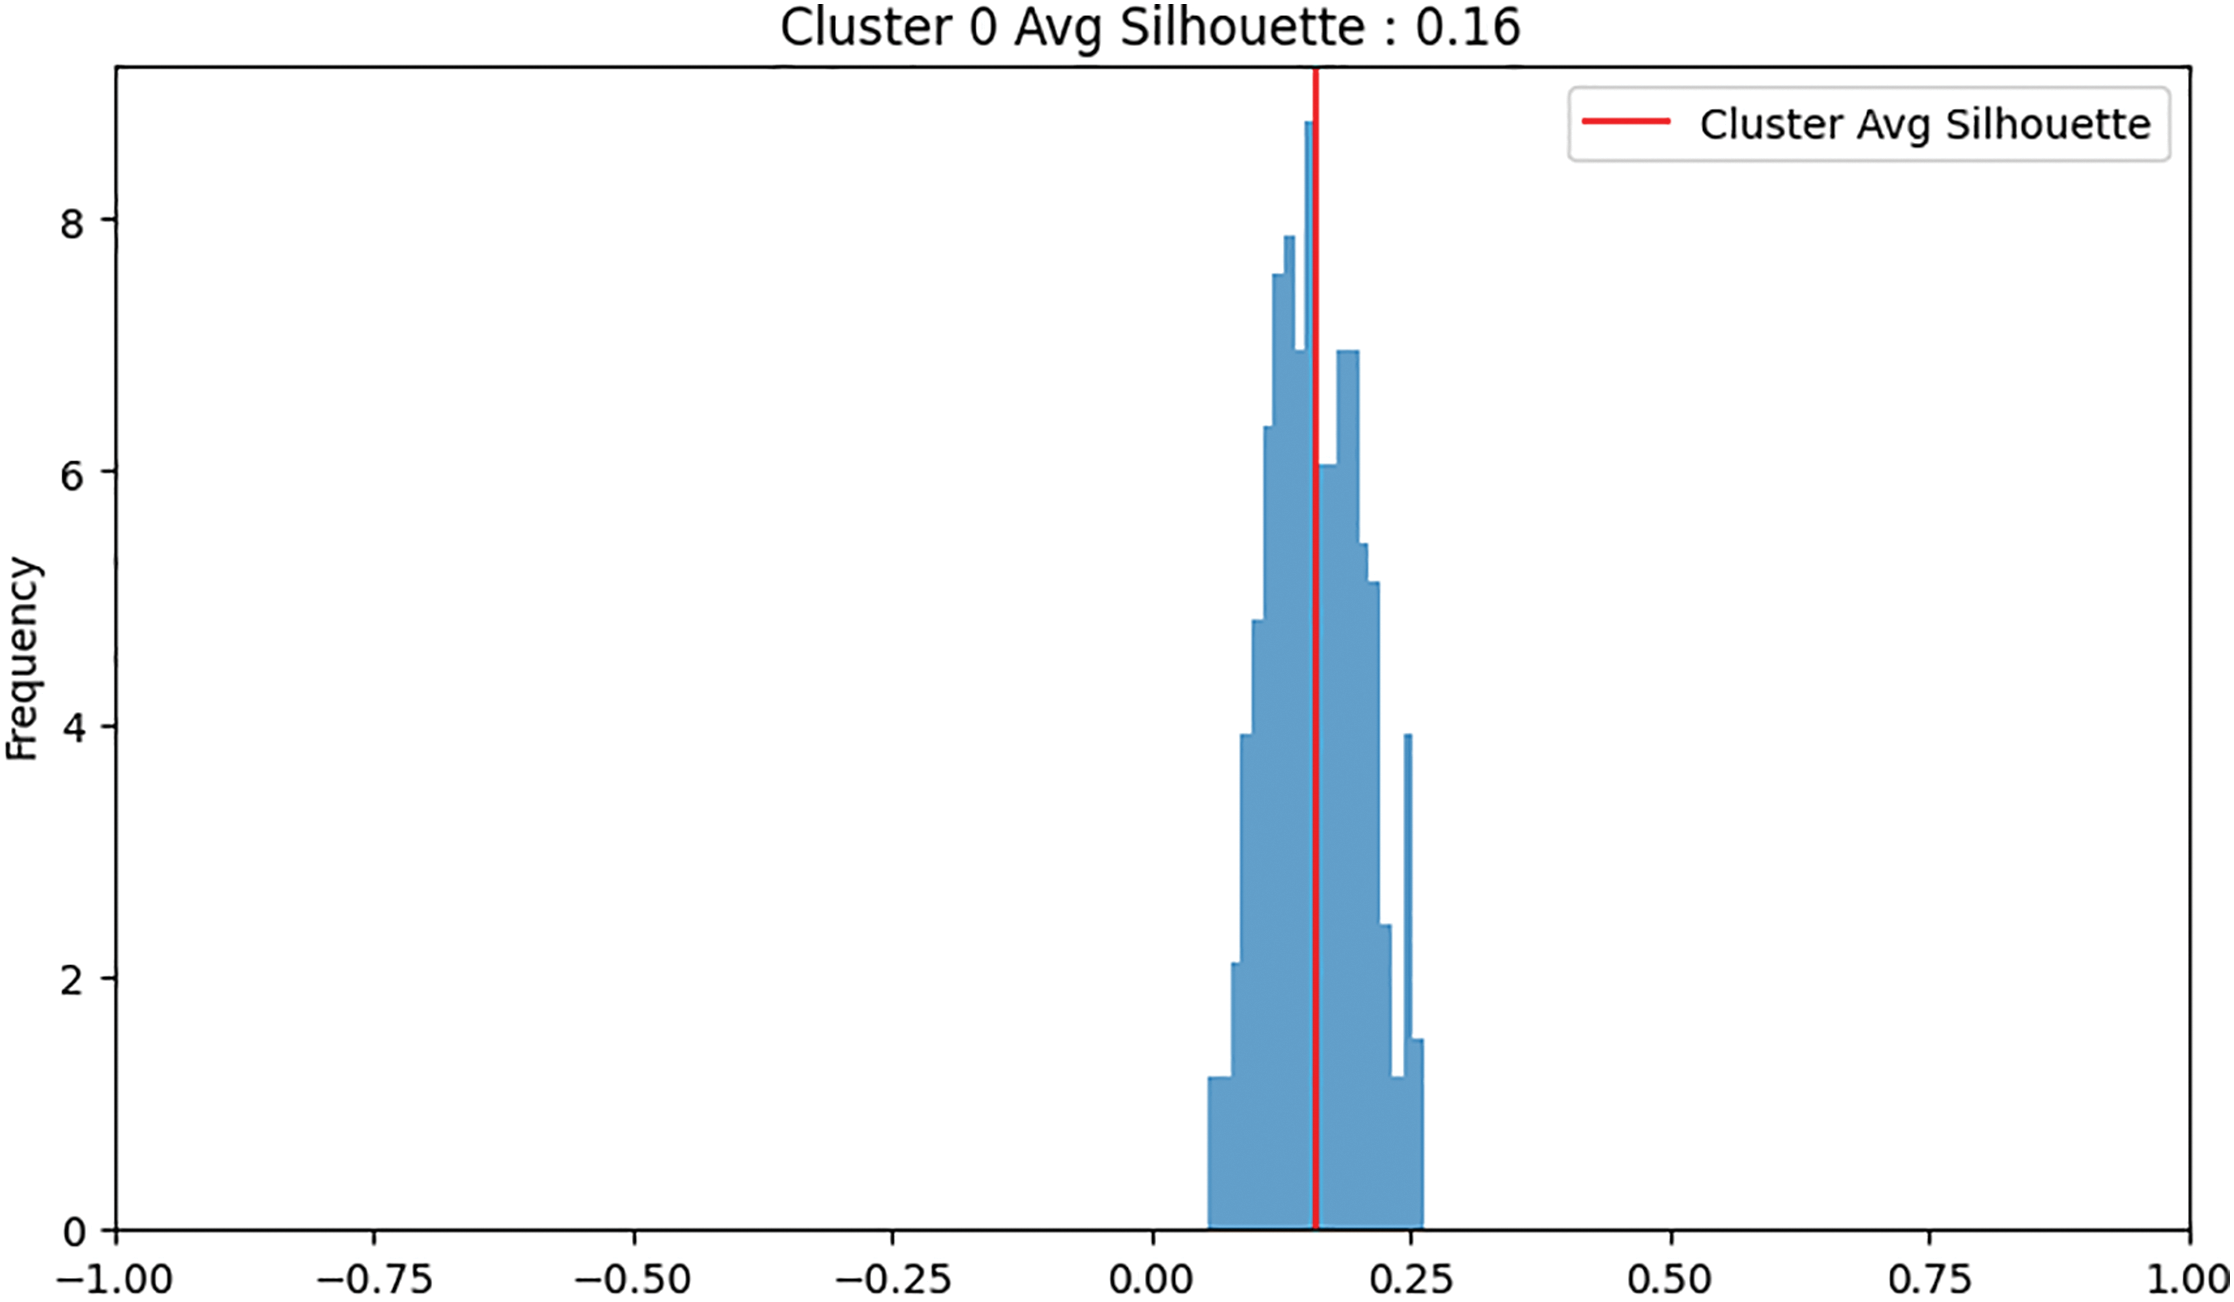
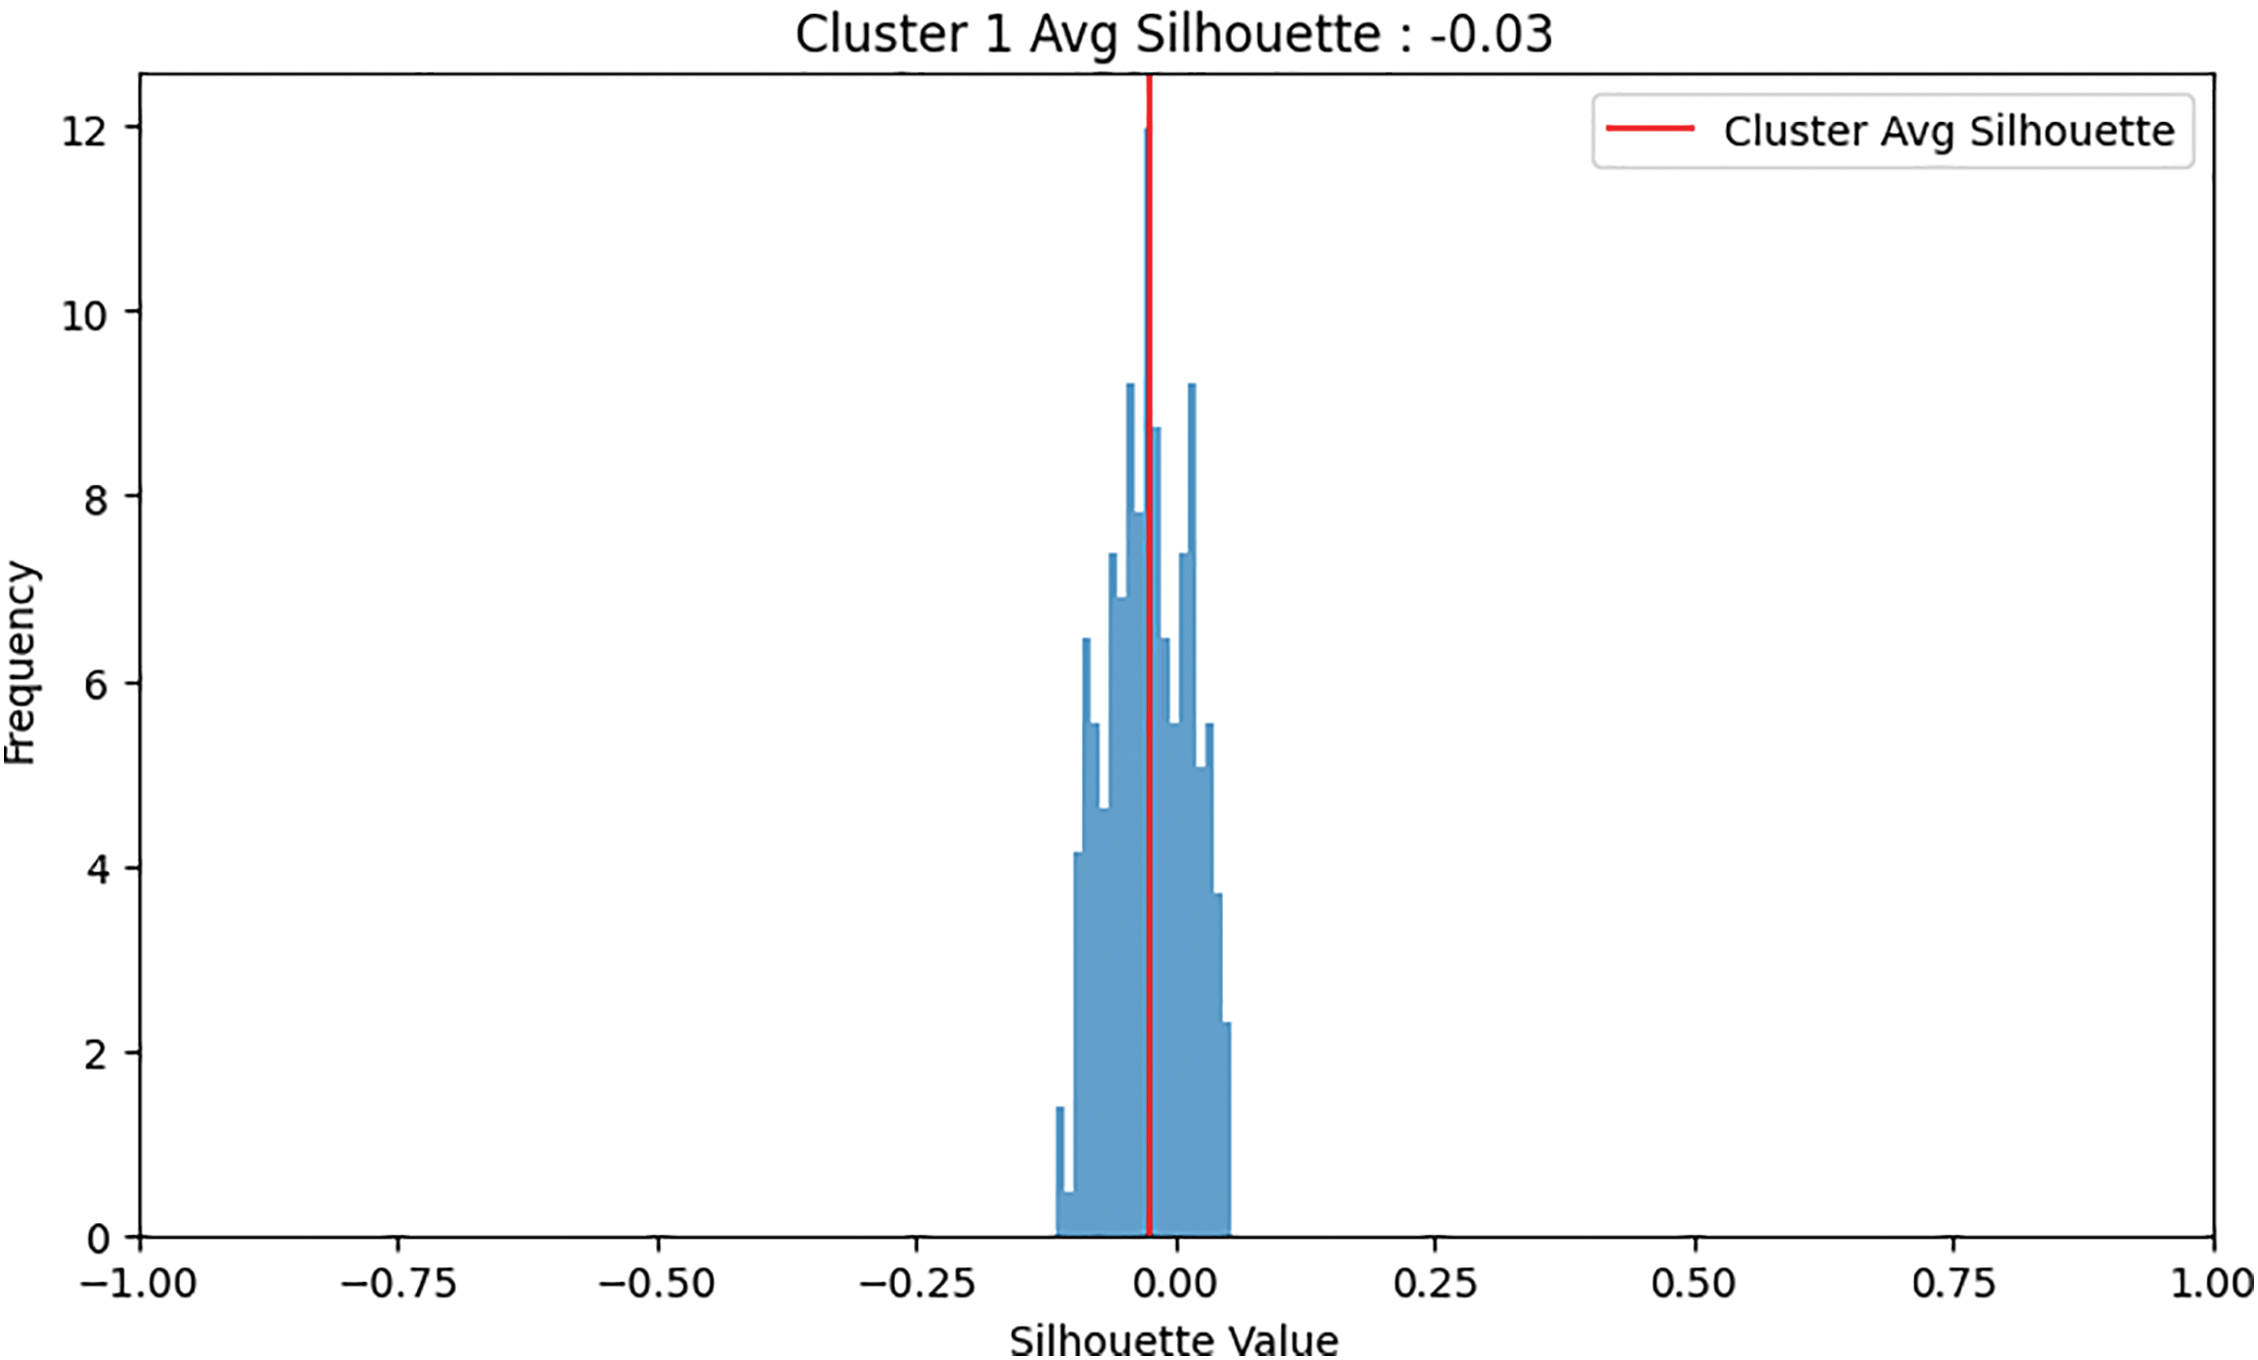
Figure 6: An example of clustering: Cluster 0 was retained due to its higher average silhouette score, whereas Cluster 1 was discarded
6.1.1 Augmented Binary Dataset Clustering Downsampling
In the augmented binary dataset. We use our augmentation method for both classes, normal and abnormal 360. The result of the augmentation, the number of samples for the normal class is 836 and kept as minimum class, and for the abnormal class, it is 1394. The proposed method applied to abnormal class to downsampling. For the abnormal class, after the first K-means clustering to the 1394, the first cluster has 320 samples with an average silhouette score of 0.07, and the second cluster has 1074 samples with an average silhouette score of 0.21. The second cluster (1074 samples) is retained as it has a higher average silhouette score and the its sample number is bigger than normal class. Applying a second iteration of K-Means clustering to the abnormal second cluster (1074 samples), the first cluster has 450 samples with an average silhouette score of 0.03, and the second cluster has 624 samples with an average silhouette score of 0.06. The cluster with 624 samples is retained and 212 samples added (compensation) to it from 450 cluster to be 836 samples. Fig. 7 shows augmented binary dataset clustering downsampling approach.
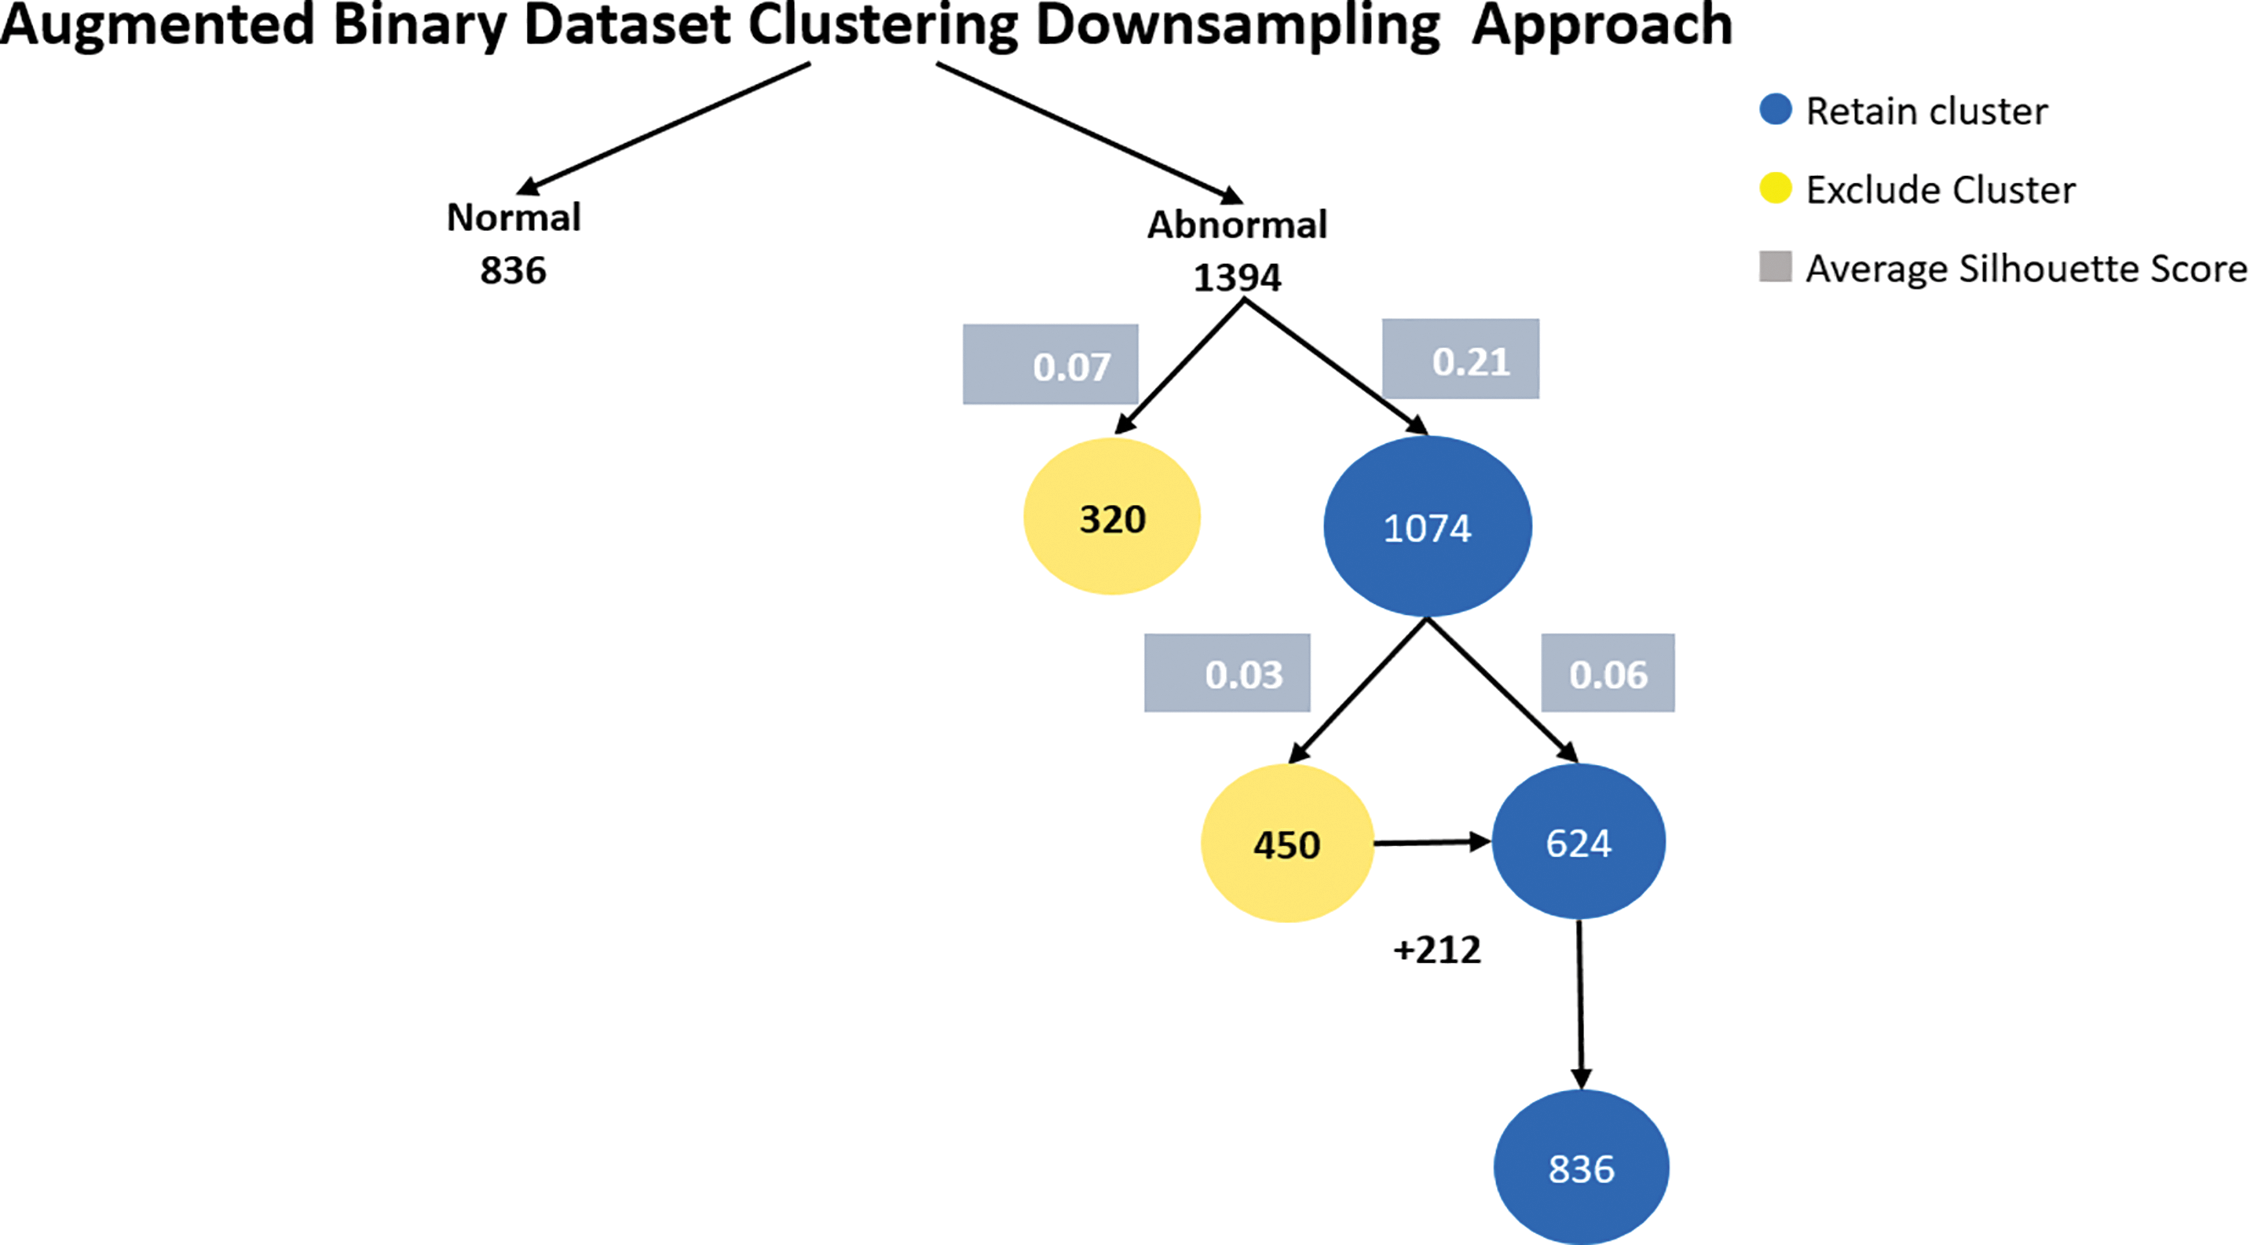
Figure 7: Augmented binary dataset clustering downsampling approach
6.1.2 Multiclass Dataset Downsampling Clustering Approach
In the multiclass dataset, the combined (difficult and rare) class contains only 54 samples, so difficult and rare class considered the minimum class. We use our proposed method to downsampling others classes.
The aortic regurgitation class consists of 153 samples. Applying K-means clustering, the first cluster contains 100 samples with an average silhouette score of 0.12, while the second cluster contains 53 samples with an average silhouette score of 0.26. The second cluster is retained due to its higher average silhouette score and one sample added to it.
The aortic stenosis class is composed of 100 samples. The first cluster contains 81 samples with an average silhouette score of 0.18, and the second cluster contains 19 samples with an average silhouette score of 0.22. The second cluster is retained. 35 samples were added to the second cluster from the first cluster, the becomes 54 samples.
The mitral regurgitation class consists of 319 samples. The first cluster contains 202 samples with an average silhouette score of 0.06, while the second cluster contains 117 samples with an average silhouette score of 0.22. Applying k-means to the second cluster 117, resulted in two clusters, the first cluster was 37 samples with an average silhouette score of 0.07, and the second cluster was 80 with an average silhouette score of 0.15. Applying k-means to the second cluster 80 got the two clusters, the first cluster 35 with an average silhouette score of 0.01 and the second cluster 45 with an average silhouette score of 0.11. 9 samples were added to 45 cluster for balancing.
The mitral stenosis class contains 88 samples. The first cluster has 23 samples with an average silhouette score of 0.09, and the second cluster has 65 samples with an average silhouette score of 0.26. K-means applied to second cluster resulted in two clusters, first cluster samples number is 23 and 0.1 an average silhouette score and second cluster 54 samples with 0.13 it retained as its samples equal to the minimum class.
The normal class contains 360 samples. Applying K-means clustering, the first cluster has 273 samples with an average silhouette score of 0.13, and the second cluster has 87 samples with an average silhouette score of 0.27. The second cluster is retained. After applying K-means clustering to 87 clusters two clusters were generated, the first cluster with 41 samples with a 0.03 average score and the second cluster with 46 with an average score of 0.15. Nine samples added to the second cluster resulting in a final set of 54 samples.
Lastly, the tricuspid regurgitation class contains 133 samples. Applying K-means clustering, the first cluster has 79 samples with an average silhouette score of 0.1, and the second cluster has 54 samples with an average silhouette score of 0.19. The second cluster is retained as it has the same sample number of the minimum class and a higher average silhouette score. Fig. 8 explicitly describes multiclass dataset downsampling clustering approach.
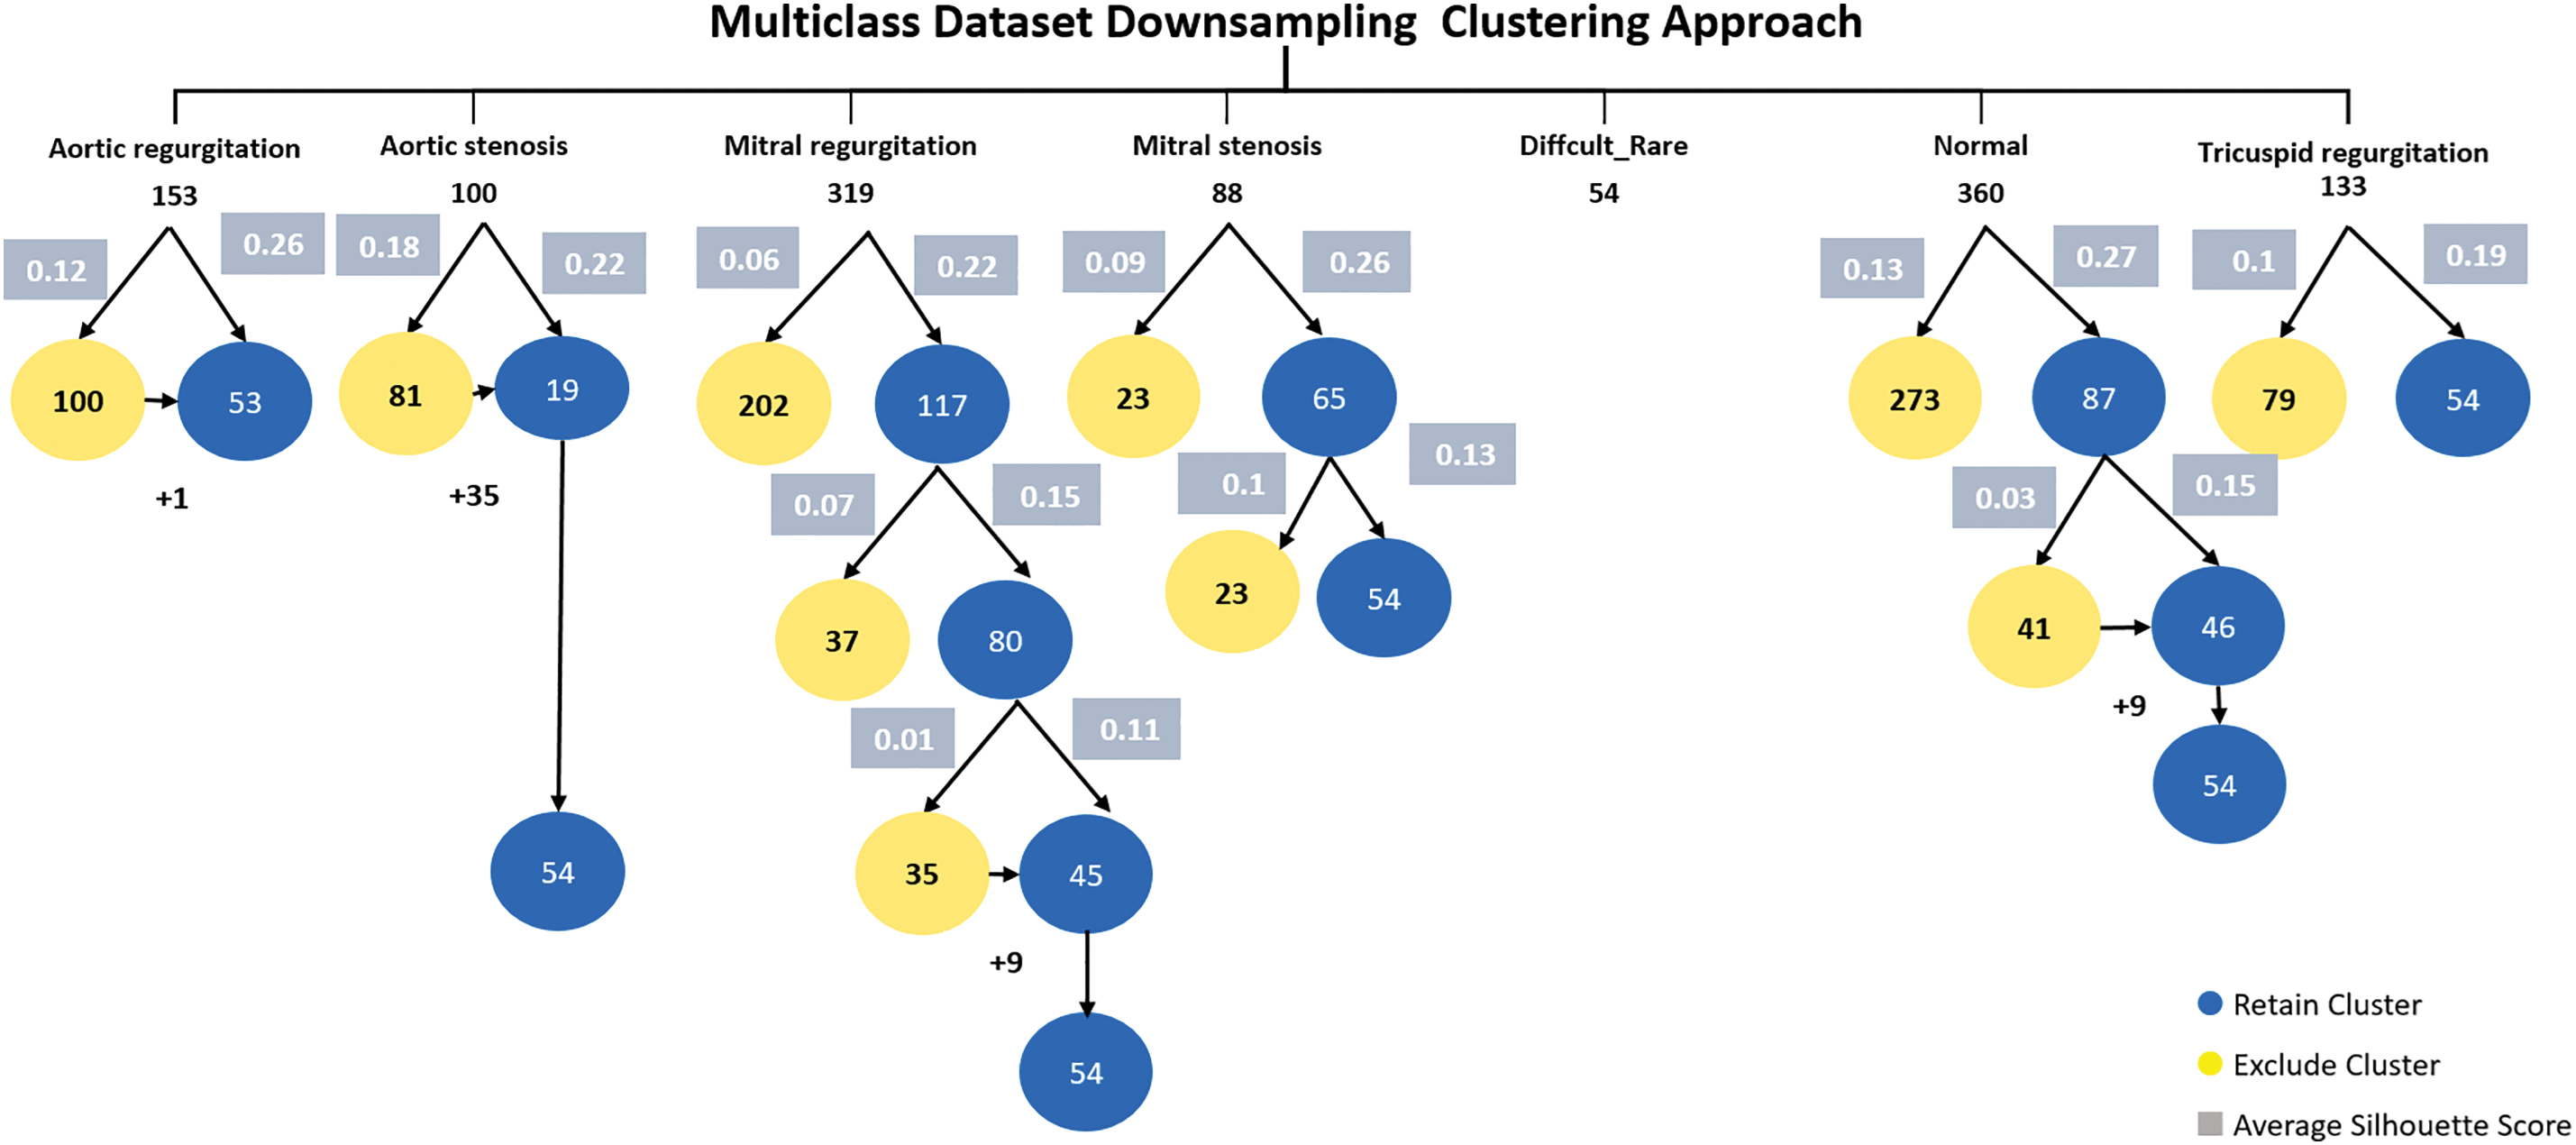
Figure 8: Multiclass dataset downsampling clustering approach
6.1.3 Augmented Multiclass Dataset Downsampling Clustering
In the augmented multiclass dataset downsampling clustering approach, we first selected the best clusters with the highest average silhouette scores from the multiclass dataset. Next, we applied heartbeat cycle augmentation. Finally, we use the proposed sample selection method to downsample the dataset classes to match the size of the smallest class (balancing). Fig. 9 shows the augmented multiclass Dataset downsampling clustering.
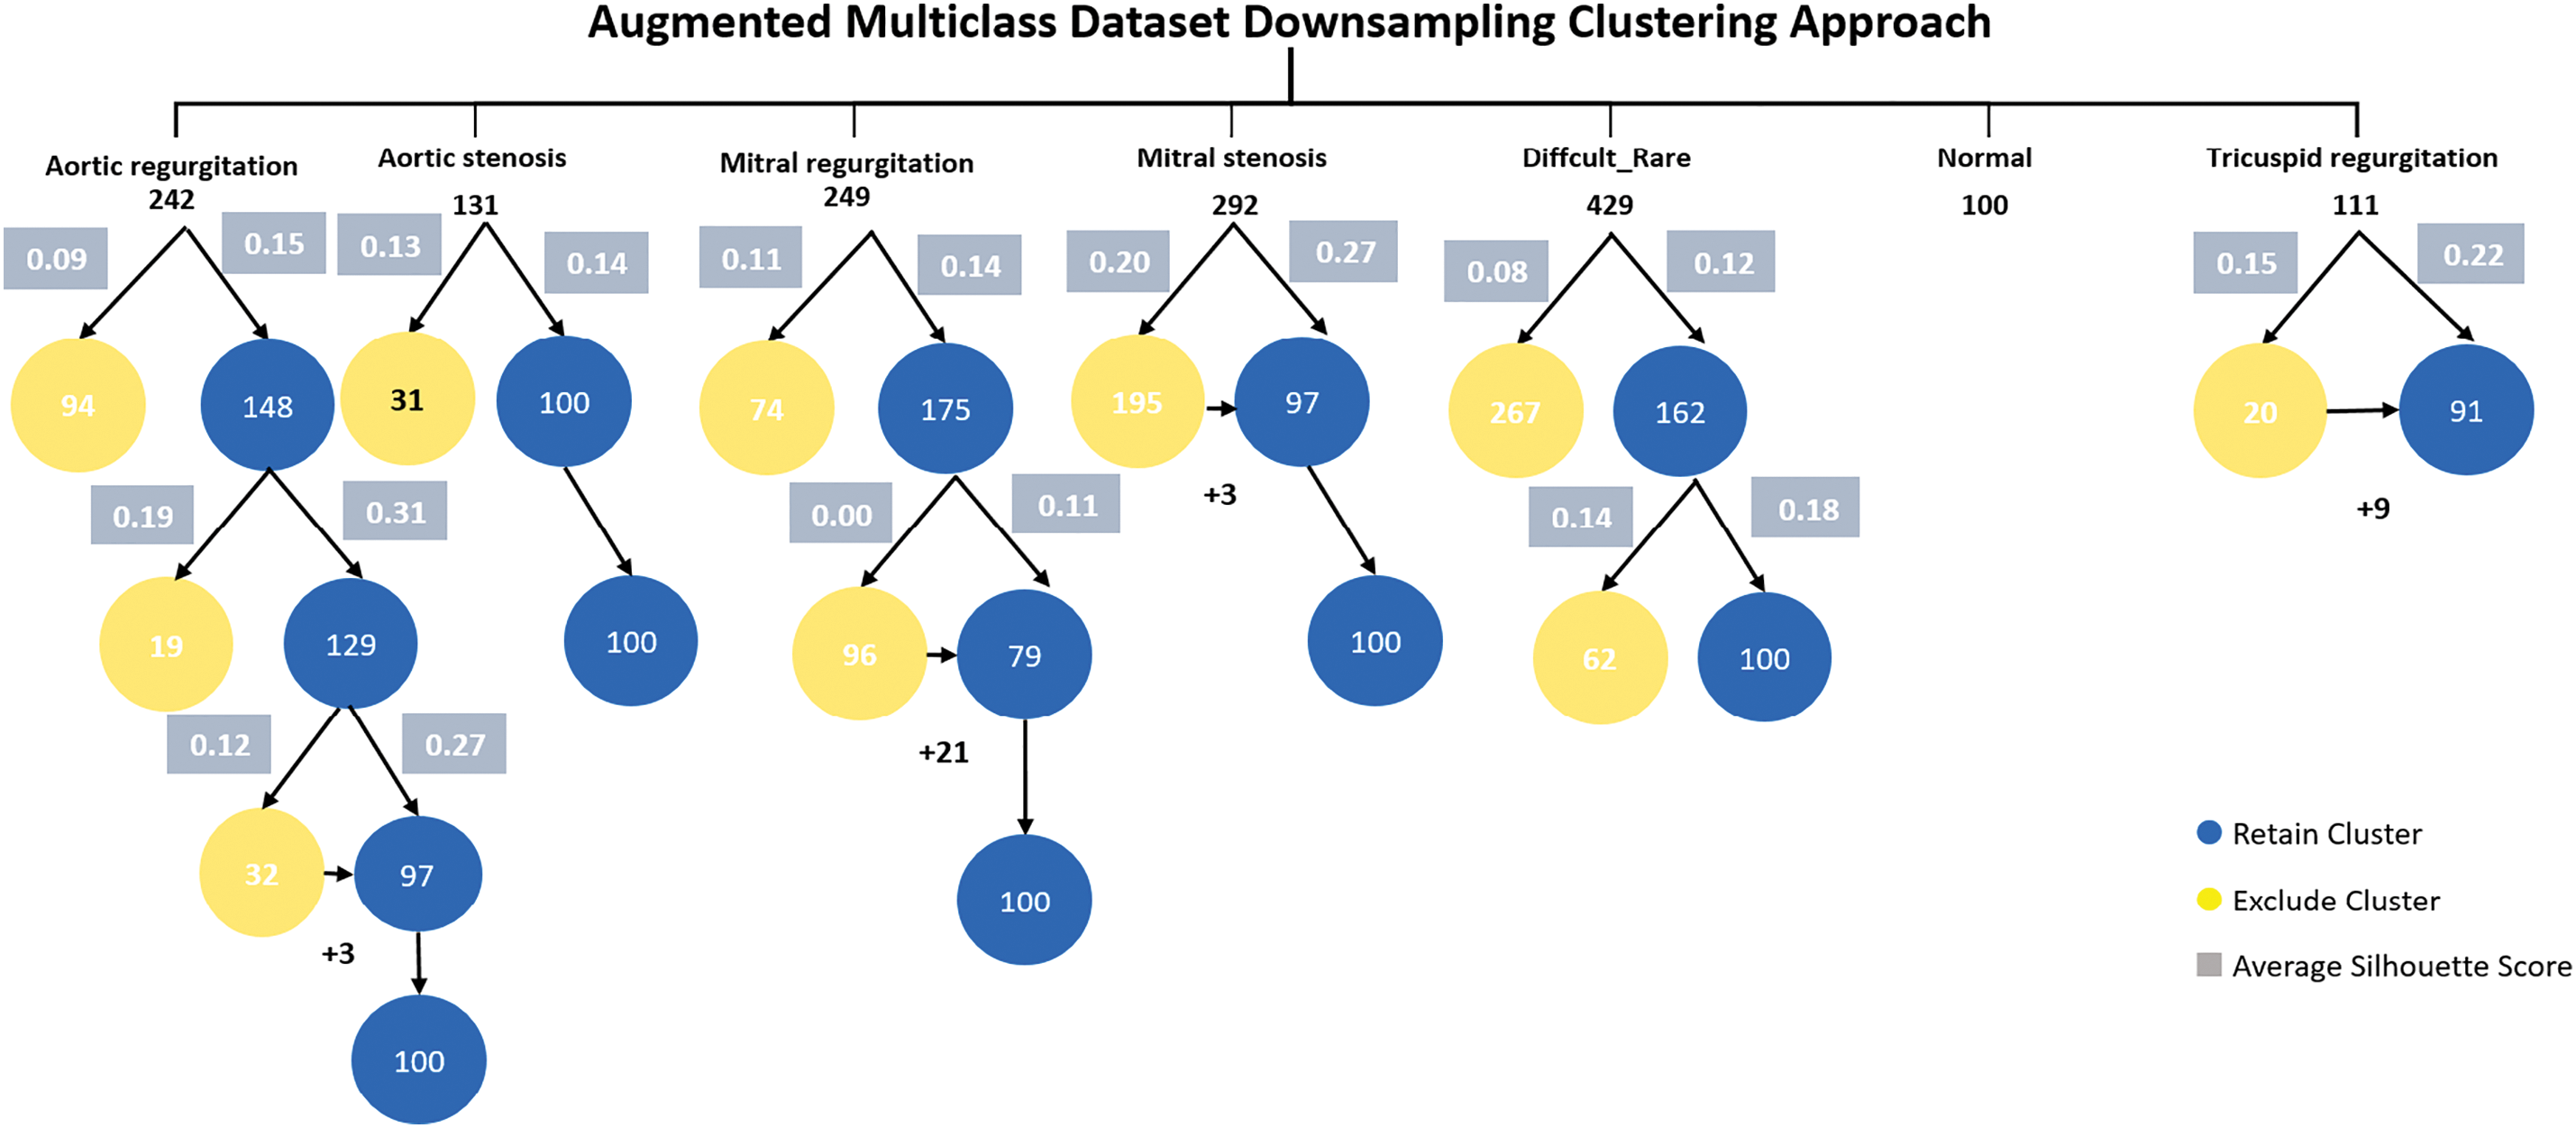
Figure 9: Augmented multiclass dataset downsampling clustering approach
The aortic regurgitation class consisted of 242 samples. Implementing the initial K-means clustering, the first cluster had 94 samples with an average silhouette score of 0.09, while the second cluster had 148 samples with an average silhouette score of 0.15. The second cluster was retained due to its better average silhouette score. In the next K-means clustering iteration, the first cluster had 19 samples with an average silhouette score of 0.19 and was discarded. The second cluster had 129 samples with an average silhouette score of 0.31. In the next K-means clustering iteration, the first cluster had 32 samples with an average silhouette score of 0.12 and the second cluster had 97 samples with an average silhouette score of 0.27. Later cluster kept and 3 samples added to it to equal the minimum class in the dataset which is normal class 100 sample size.
The aortic stenosis class contained 131 samples. Applying the first K-means clustering, the first cluster had 31 samples with an average silhouette score of 0.13, and the second cluster had 100 samples with an average silhouette score of 0.14. The latter cluster was retained due to its higher average silhouette score with and its samples number matching the minimum class.
The mitral regurgitation class consists of 249 samples. After applying the first K-means clustering, the first cluster is 74 and the average silhouette score 0.11 and the second cluster is 175 samples with an average of silhouette score is 0.14, this cluster kept. In the second K-means clustering, the first cluster is 96 samples with an average of silhouette score is 0.00. The second cluster is 79 samples and the average of silhouette score is 0.11. This cluster retained as an optimal cluster of mitral regurgitation with addition 21 samples from the first cluster to be balanced with minimum class.
The mitral stenosis class consists of 292 samples. After implementing the first K-means clustering, The first cluster is 195 samples with an average of silhouette score is 0.20 and the second cluster is 97 samples with average of silhouette score is 0.27 and it retained as better cluster for mitral stenosis with 3 samples added.
The difficult and rare class contains of 429 samples. After applying first K-means iteration clustering, the first cluster is 267 samples and the average of silhouette score is 0.08. The second cluster is 162 with an average of silhouette score is 0.12, this cluster retained. after applying second K-means iteration clustering, the first cluster is 62 and the average of silhouette score is 0.14. The second cluster is 100 samples with an the average of silhouette score is 0.18. The second cluster retained an optimal cluster of the difficult and rare class.
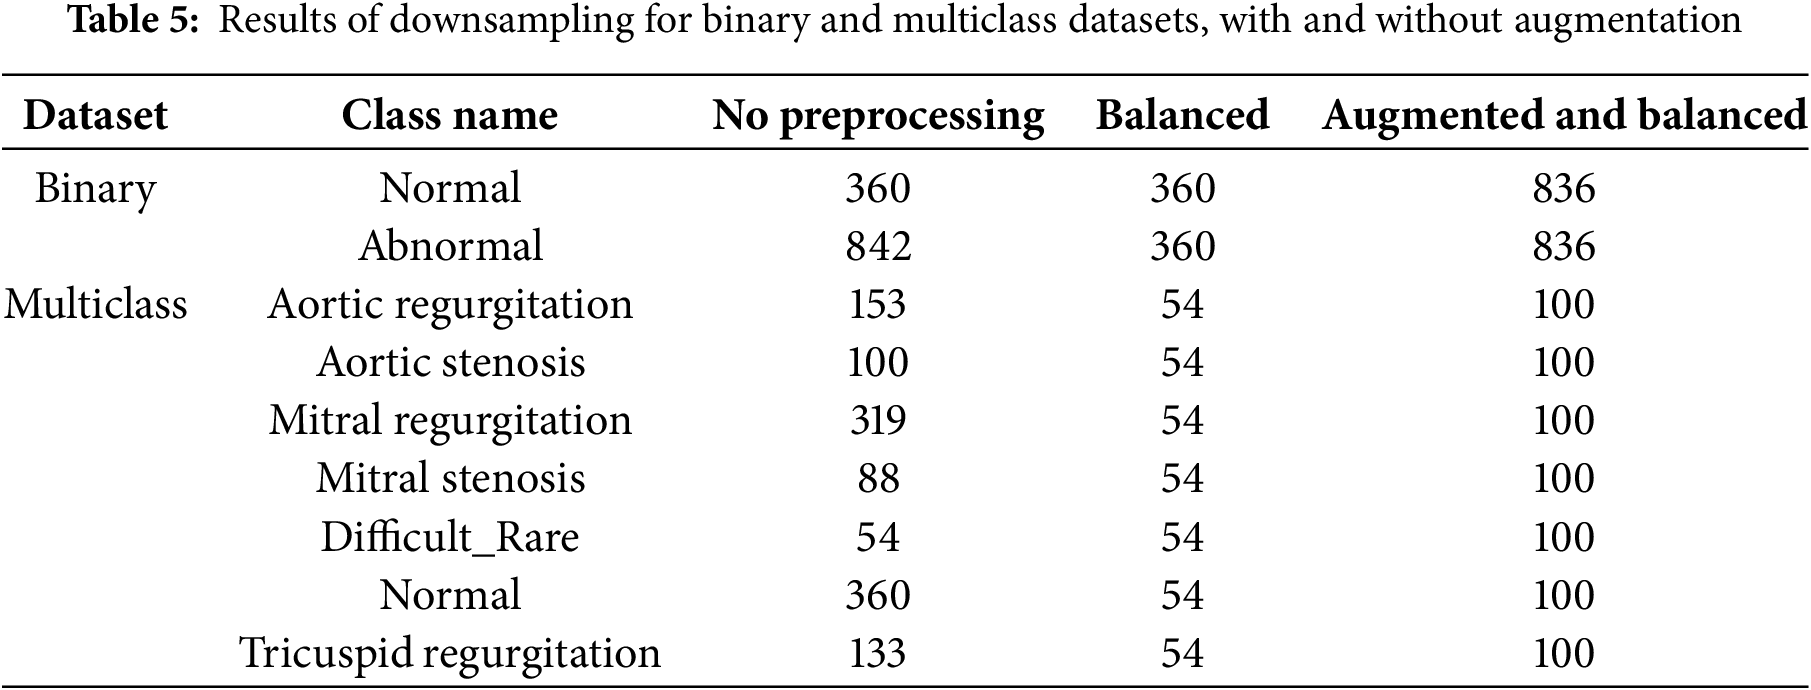
The tricuspid regurgitation class consists of 111 samples. After applying first K-means iteration clustering, the first cluster had 20 samples with 0.15 score and the second cluster had 91 samples with higher score 0.22, later cluster kept and 9 samples were added to it for balancing. Table 5 displays the outcomes of downsampling applied to binary and multiclass datasets, both with and without the use of augmentation.
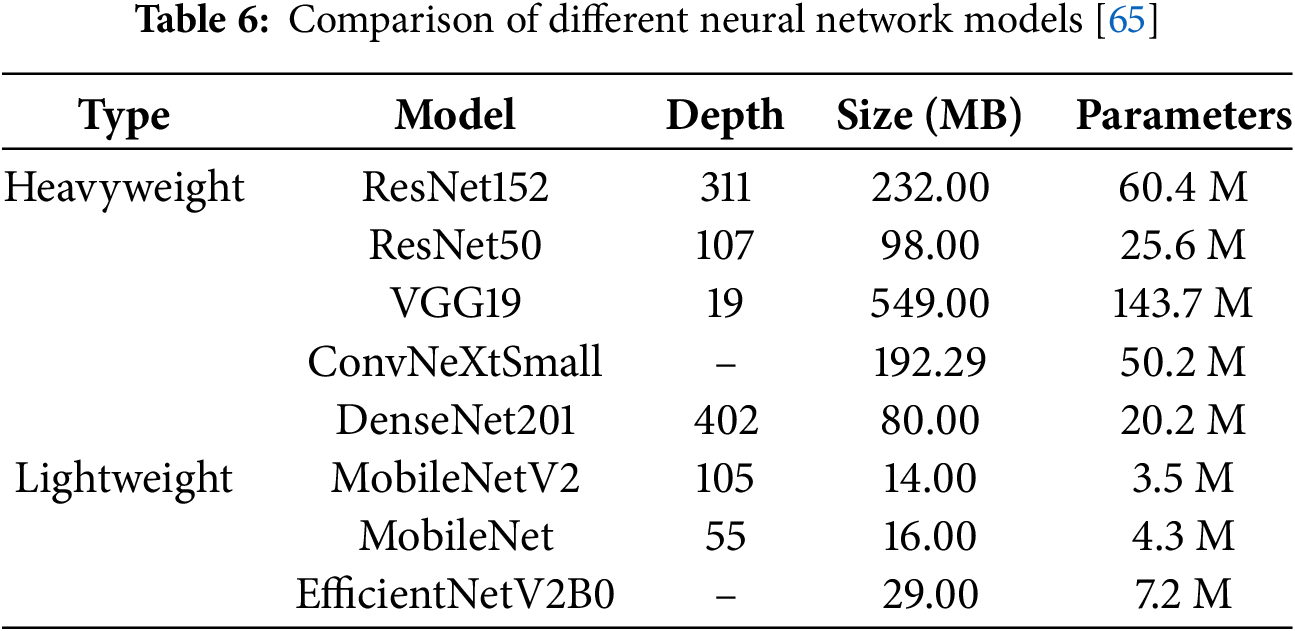
Transfer learning is a machine learning methodology that leverages a pre-trained model developed for a specific task as the foundation for solving a different, but related, task. This approach reuses the knowledge acquired from one domain to enhance the performance of a model in a new, potentially distinct yet related domain [64]. In our study, we employed eight pre-trained models to classify heart diseases, categorizing them into two groups: heavyweight and lightweight models. The heavyweight models, including ResNet152, ResNet50, VGG19, ConvNeXtSmall, and DenseNet201, are characterized by greater depth, larger sizes, and a higher number of parameters. Conversely, the lightweight models, consisting of MobileNetV2, MobileNet, and EfficientNetV2B0, are designed with smaller sizes, shallower depths, and fewer parameters. An overview of the eight neural network models utilized in this study presented is in Table 6. We analyze the structure of MobileNetV2 as an example lightweight model and ResNet150 as an example heavyweight model.
MobileNetV2 and ResNet152 differ significantly in their architectural design and complexity. MobileNetV2 is a lightweight model optimized for efficiency, employing an inverted residual structure with bottleneck layers. It utilizes depthwise separable convolutions to reduce computational costs, which split traditional convolutions into depthwise and pointwise operations. This design results in fewer parameters and layers, making MobileNetV2 compact and well-suited for resource-constrained environments like mobile devices [66]. Fig. 10 shows the architecture of MobileNetV2 model, it consists of an initial fully convolutional layer with 32 filters, followed by 19 residual bottleneck layers.
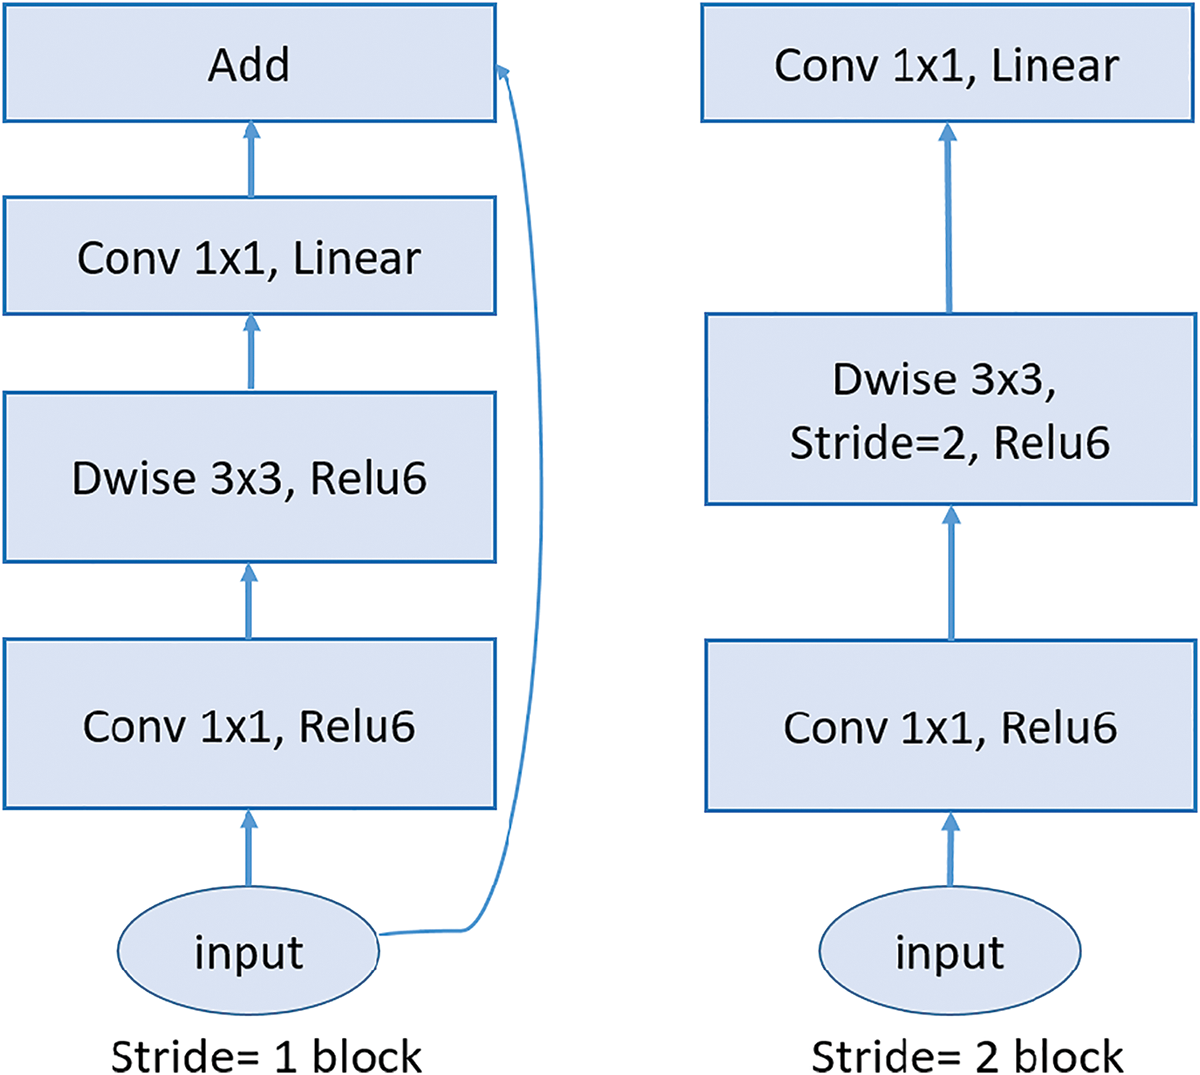
Figure 10: MobileNetV2 architecture: The diagram illustrates the core building blocks of the MobileNetV2 architecture, highlighting the inverted residual structure. The left block shows the stride-1 configuration, with residual connections, while the right block depicts the stride-2 configuration, which reduces spatial dimensions without residual connections
In contrast, ResNet152 is a heavyweight model designed for high-capacity learning and superior performance on complex tasks. It features a much deeper architecture composed of residual blocks interconnected by skip connections. These skip connections mitigate the vanishing gradient problem, enabling the effective training of very deep networks and allowing ResNet152 to capture intricate patterns in data. Unlike MobileNetV2, ResNet152 incorporates standard convolutions in its residual blocks, which significantly increases its computational demands while enhancing its ability to extract detailed features [67]. Fig. 11 illustrates the architecture of ResNet150, showcasing its extensive depth and complexity. Structurally, MobileNetV2 is characterized by its compactness and computational efficiency, making it well-suited for resource-constrained tasks, whereas ResNet152 excels in scenarios requiring high accuracy and detailed feature representation.
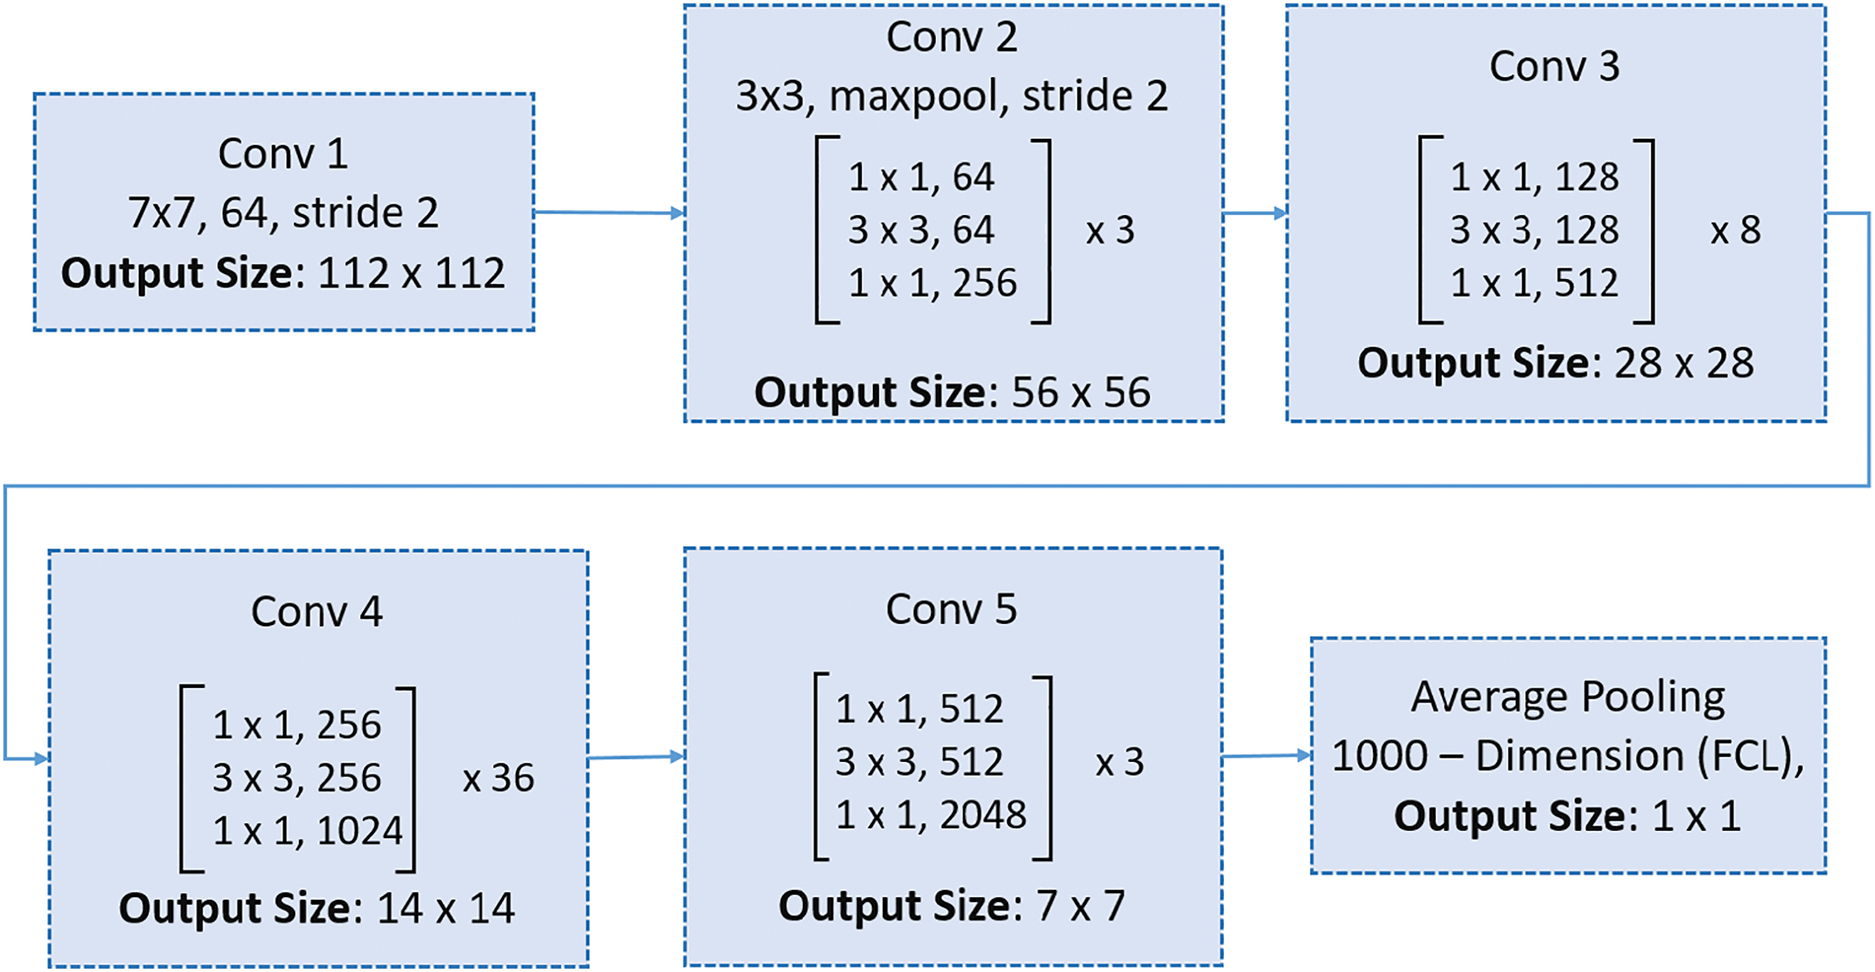
Figure 11: ResNet150 architecture: The structure includes an initial convolutional layer, five stages of residual blocks with bottleneck layers, and a final average pooling layer followed by a fully connected layer for classification
To adapt these pre-trained architectures originally designed for image data for heart sound classification, we converted the 1D heart sound signals into 2D time-frequency spectrogram images. This transformation allowed the models to process the data in a format they were trained to recognize. Additionally, we augmented the models by adding three dense layers to enable the learning of more complex functions and improve classification performance.
To assess the performance of classifier models, overall accuracy and Weighted F1 Score were being employed to measure their effectiveness.
Accuracy is a fundamental metric that measures the overall correctness of a classification model [68]. It is defined as:
The weighted F1 score is a variation of the F1 score that takes into account the support (the number of true occurrences) of each class [68]. It is particularly useful in imbalanced datasets where some classes are more common than others.
When using the weighted F1 score of each class, it is multiplied by its support, so classes with more instances have a bigger influence on the overall result. To normalize the result, it is then divided by the total number of instances. This metric important in our case due to the class imbalance present in the dataset. It accounts for both precision and recall while considering the support (i.e., the number of instances) of each class, making it a more informative metric for imbalanced multiclass classification tasks.
7.1.3 Area Under the ROC Curve (AUC)
The AUC is a widely used metric to evaluate the performance of classification models. It represents the probability that a randomly chosen positive sample is ranked higher by the model than a randomly chosen negative sample. The AUC value ranges from 0 to 1, where a value of 1 indicates perfect classification, 0.5 represents random guessing, and 0 indicates perfect misclassification. The AUC is computed from the ROC curve, which plots the True Positive Rate (TPR) against the False Positive Rate (FPR) at various threshold values. The mathematical formula for AUC is given as: The Area Under the ROC Curve (AUC) is mathematically defined as:
where:
• True Positive Rate (TPR) is the proportion of correctly identified positive samples:
• False Positive Rate (FPR) is the proportion of incorrectly identified negative samples:
To ensure a comprehensive and reliable evaluation of the proposed method, we employed three complementary performance metrics—Accuracy, Weighted F1 Score, and AUC—to rigorously assess its effectiveness and robustness across diverse evaluation dimensions.
The pretrained deep learning architectures are implemented using the TensorFlow and Keras frameworks. The training and evaluation of all models are conducted on an NVidia A100 GPU. For binary classification tasks, the binary crossentropy loss function is utilized, while for multiclass classification tasks, the categorical crossentropy loss function is employed. Both models utilize the Adam optimizer. The batch size is configured to 5. To prevent overfitting, we use early stopping callback with validation accuracy, patience of 10 epochs and restoring the best weights. We also used a learning rate schedule with an exponential decay, starting at 0.0001 and decaying by 4% every 100K steps so that the model converges stably.
This study aimed to investigate the effectiveness of the proposed preprocessing method, Iterative Clustering with Silhouette Analysis, in the classification of heart sounds and murmurs. The proposed preprocessing method was applied to four different datasets: a binary dataset, an augmented binary dataset, a multiclass dataset, and an augmented multiclass dataset. We evaluated the performance of this method using 10-fold cross-validation with pretrained deep learning models. The heavyweight models included ResNet50, ResNet152, VGG19, DenseNet201, and ConvNeXtSmall, while the lightweight models included MobileNet, MobileNetV2, and EfficientNetV2B0. These models were assessed for their effectiveness in enhancing classification accuracy for cardiovascular diseases. Key metrics, including accuracy, weighted F1 score, and AUC (Area Under the ROC Curve), were calculated across all folds, and their averages were reported. In this section, we present the experimental results.
8.1 Binary Dataset Classification
The experiment was conducted using the binary dataset both without the proposed preprocessing method (baseline) and with it applied. Overall, the average accuracy and weighted F1 score of all models showed significant improvements after applying the proposed preprocessing method, as compared to the baseline results (see Table 7). Specifically, the Area Under the Curve (AUC) improvement ranged from 8.1% to 18.95%, the Weighted F1 Score improvement ranged from 8.4% to 9.3% as a result of data balancing, and the average accuracy improvement ranged from 7.8% to 8.7%.
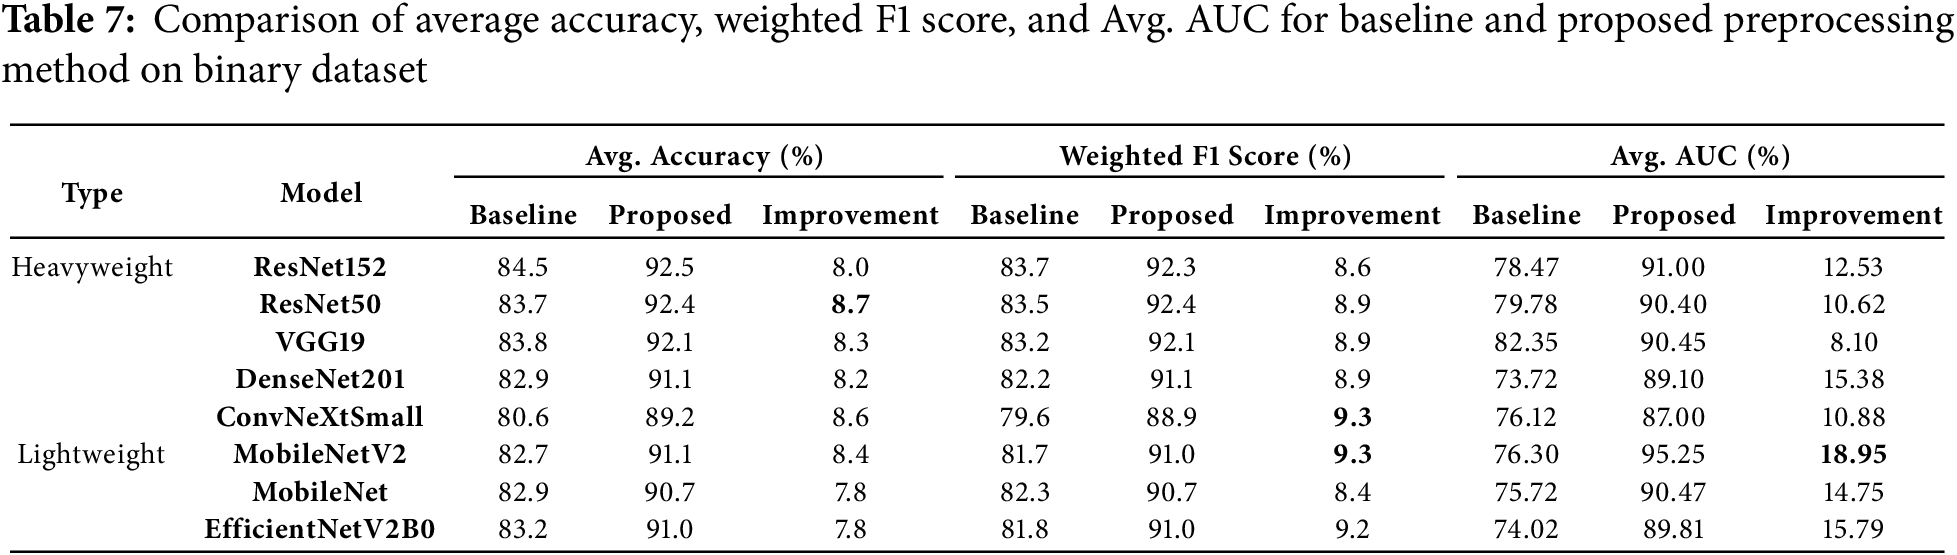
ResNet50 emerged as a standout model, achieving the highest average weighted F1 score of 92.4%, with a significant improvement of 8.9% from its baseline score. Additionally, it recorded a notable average AUC improvement of 10.62%, highlighting the preprocessing method’s impact on this heavyweight model.
ResNet152 led in accuracy, attaining the highest average accuracy of 92.5%, with an 8.0% improvement. It also recorded an 8.6% improvement in weighted F1 score and a substantial 12.53% gain in average AUC, showcasing its robust performance when paired with the preprocessing method.
Among lightweight models, MobileNetV2 stood out with the highest average AUC after preprocessing at 95.25%, marking a remarkable gain of 18.95%, the largest improvement across all models. This was accompanied by significant improvements in average accuracy (86.1%) and weighted F1 score (85.9%). Similarly, EfficientNetV2B0 demonstrated the highest average AUC improvement among lightweight models, at 15.79%, reflecting the scalability of the preprocessing method for simpler architectures.
DenseNet201 exhibited strong generalization capabilities, with a 15.38% AUC improvement, rising from 73.72% to 89.1%, and consistent gains in accuracy and weighted F1 score. ConvNeXtSmall, despite having the lowest baseline arage accuracy (80.6%), showed strong adaptability, with an 8.6% accuracy gain, a 9.3% improvement in weighted F1 score, and a 10.88% increase in AUC.
Overall, lightweight models, particularly MobileNetV2 and EfficientNetV2B0 exhibited the largest AUC improvements, underscoring the efficiency of the preprocessing method in enhancing simpler architectures. Among heavyweight models, ResNet152 and ResNet50 consistently achieved high accuracy and weighted F1 scores, reflecting their robustness with the proposed method.
Fig. 12 show the confusion matrices of the performance of the kfold10 ResNet152 model in classifying heart diseases without using proposed preprocessing method on the binary dataset and after applying proposed method. The ResNet152 model illustrates the true positive rates (TPR) for the normal and abnormal classes. Initially, without the proposed preprocessing method, the true positive rate for the normal class was 0.64. However, with the implementation of the proposed preprocessing method the true positive rate improved significantly to (TPR = 1.0). For the abnormal class, the initial true positive rate was 0.95% before applying the proposed preprocessing method. Post application of proposed method, the true positive rate slightly decreased to 0.92. The results confirm that the proposed preprocessing method effectively optimize the dataset balance, improving model performance across a range of models architectures.
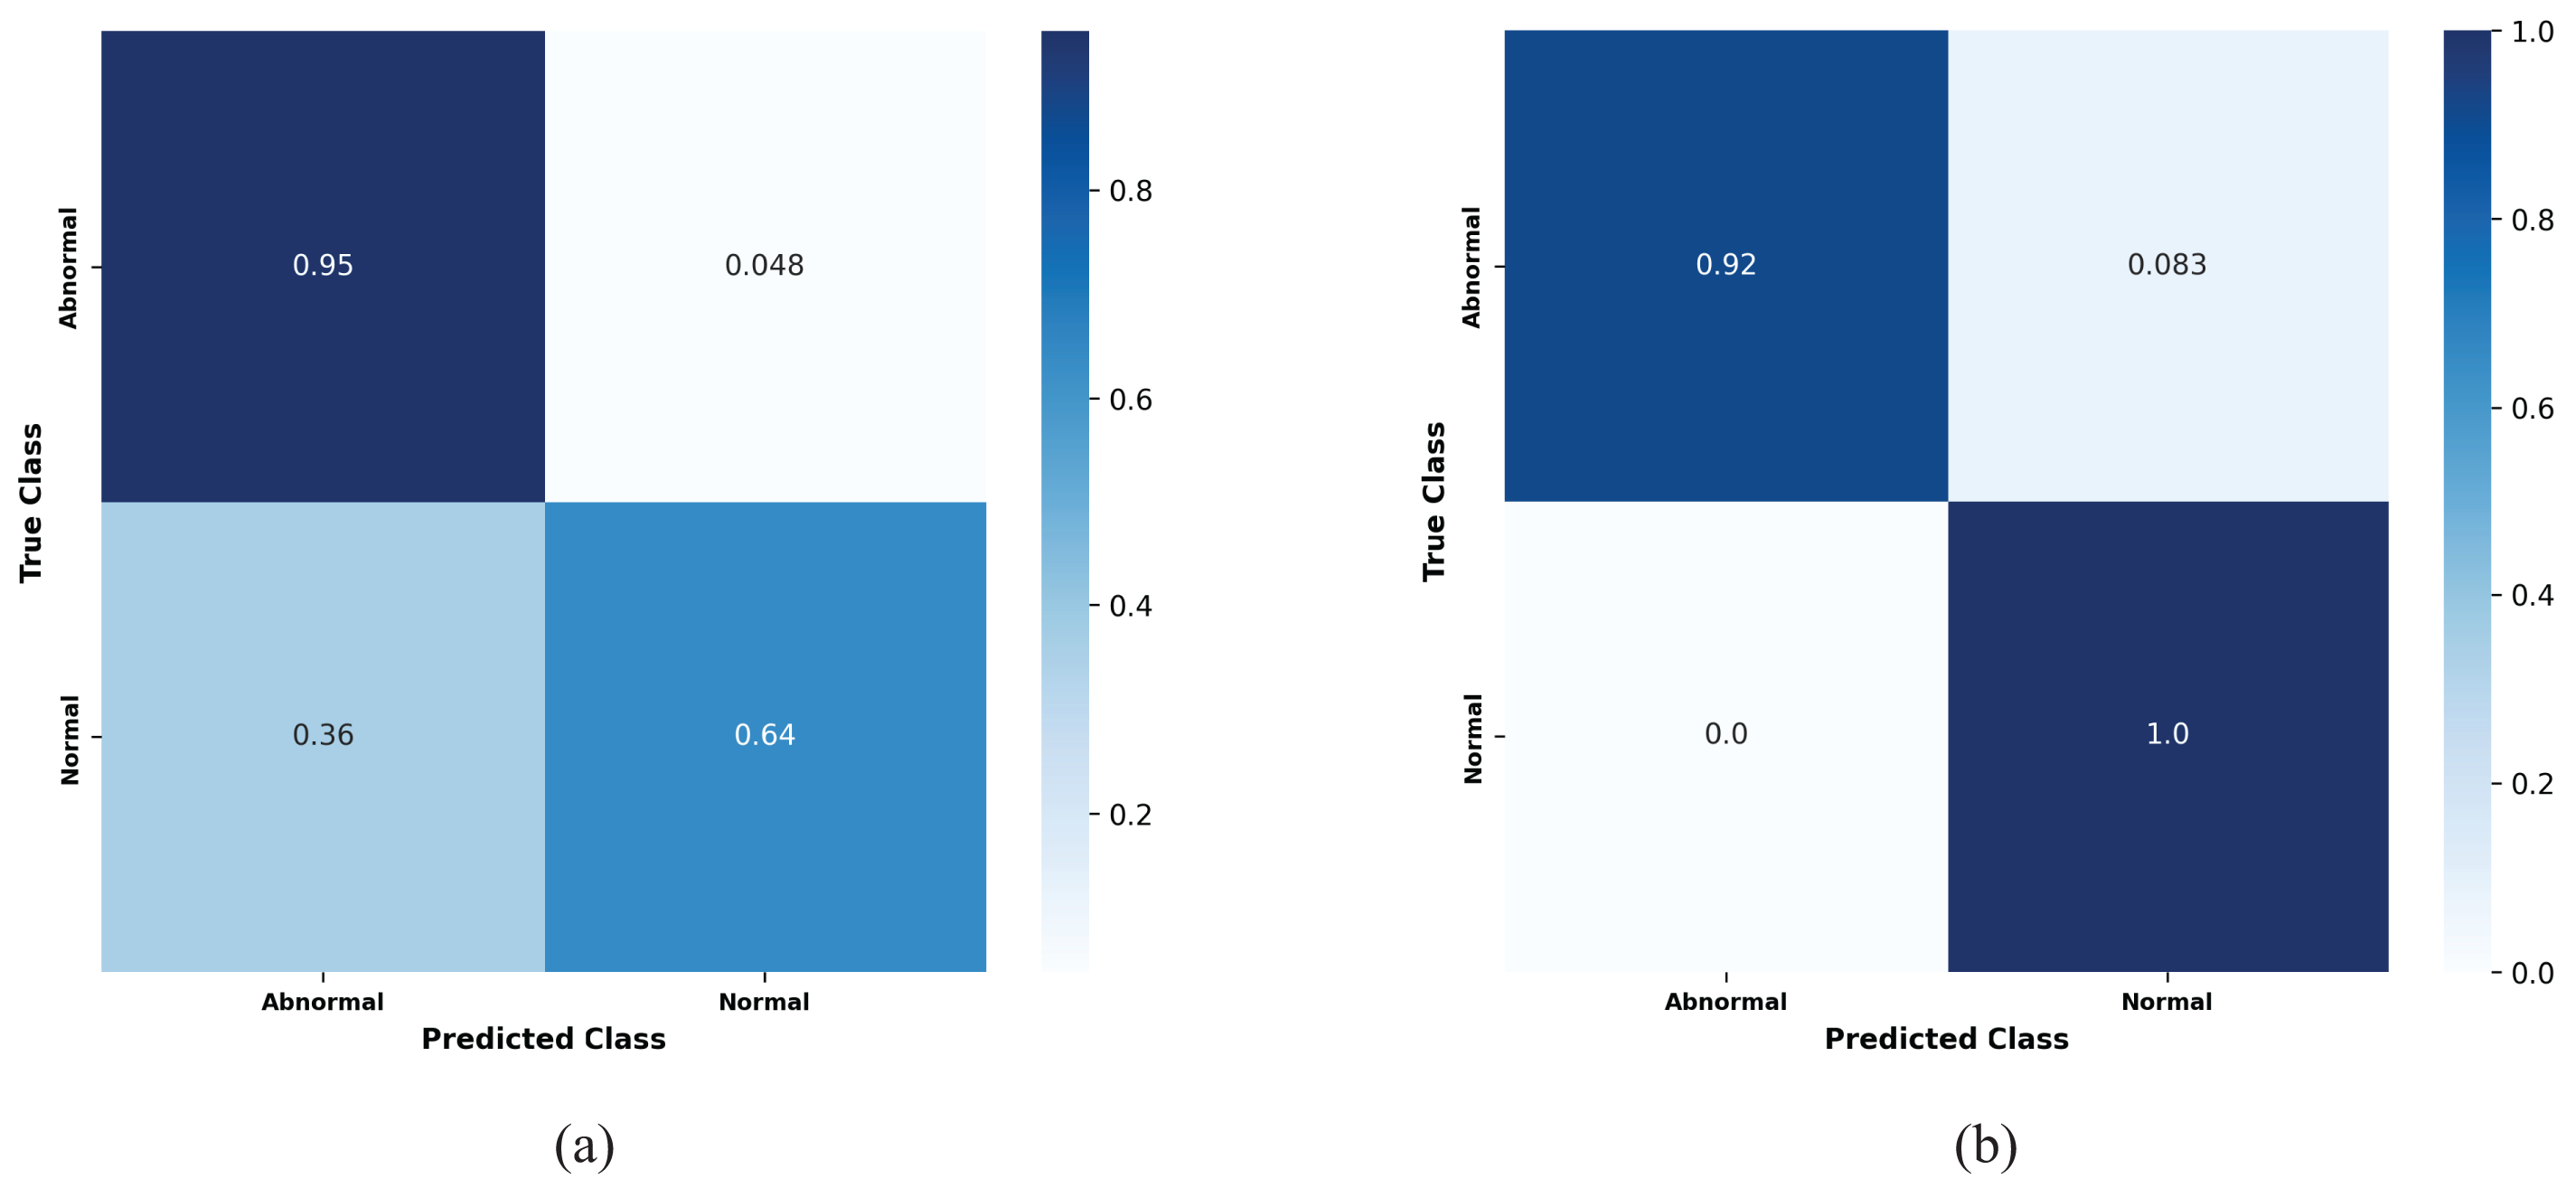
Figure 12: Confusion matrices for the kfold10 ResNet152 model showing the true positive rates for normal and abnormal classes: (a) Before applying the proposed preprocessing method, and (b) after applying the proposed preprocessing on the binary dataset
As an example, Fig. 13 illustrates the two ROC AUC curves representing the performance of the MobileNetV2 model on the k-fold1 binary dataset before and after applying the proposed preprocessing method. Prior to preprocessing, the model achieved an AUC of 0.79591, reflecting a limited ability to distinguish between Normal and Abnormal classes, as indicated by a less pronounced True Positive Rate (TPR) curve. However, after applying the proposed preprocessing method, the AUC improved significantly to 0.94595, demonstrating enhanced model performance. The sharper ROC curve after preprocessing highlights the model’s increased confidence and accuracy in classifying the two classes, thereby showcasing the effectiveness of the proposed method in improving classification outcomes.
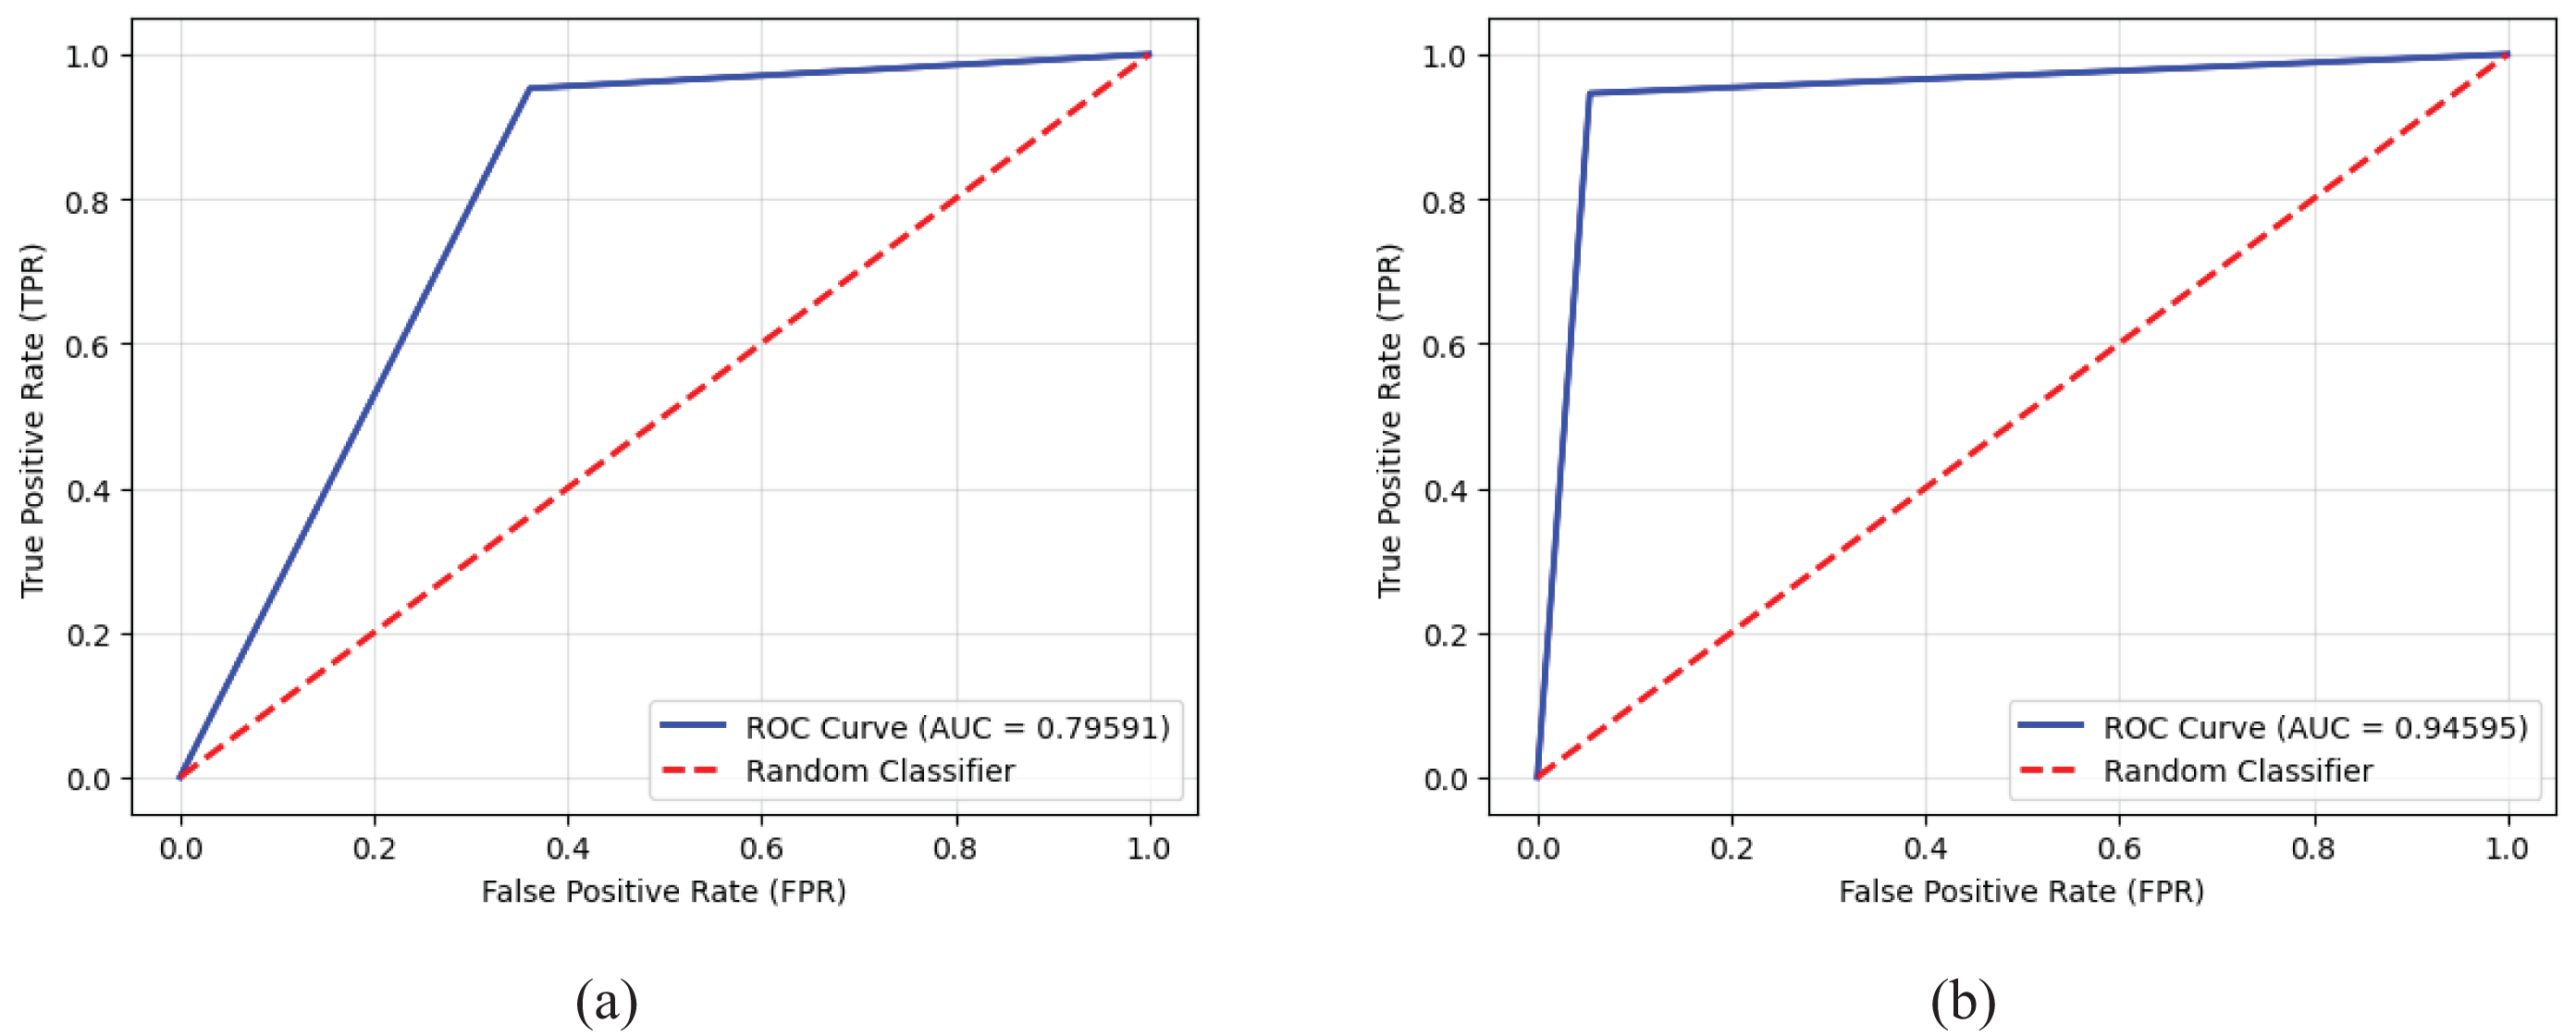
Figure 13: Receiver operating characteristic (ROC) curves and AUC values for the MobileNetV2 model on the k-fold1 binary dataset, illustrating the true positive rates for normal and abnormal classes: (a) Performance before applying the proposed preprocessing method, highlighting baseline results, and (b) enhanced performance after implementing the proposed preprocessing method, demonstrating its impact on classification accuracy
These findings confirm the robustness and scalability of the proposed preprocessing method for binary heart sound classification task, regardless of model complexity.
8.2 Augmented Binary Dataset Classification
The results of this experiment indicate that the proposed method leads to varying degrees of improvement across different models. Average AUC improvements ranged from 3.96% to 12.68%, weighted F1 score improvements ranged from 0.2% to 5.3%, and average accuracy improvements ranged from 0.1% to 4.8%, as shown in Table 8.
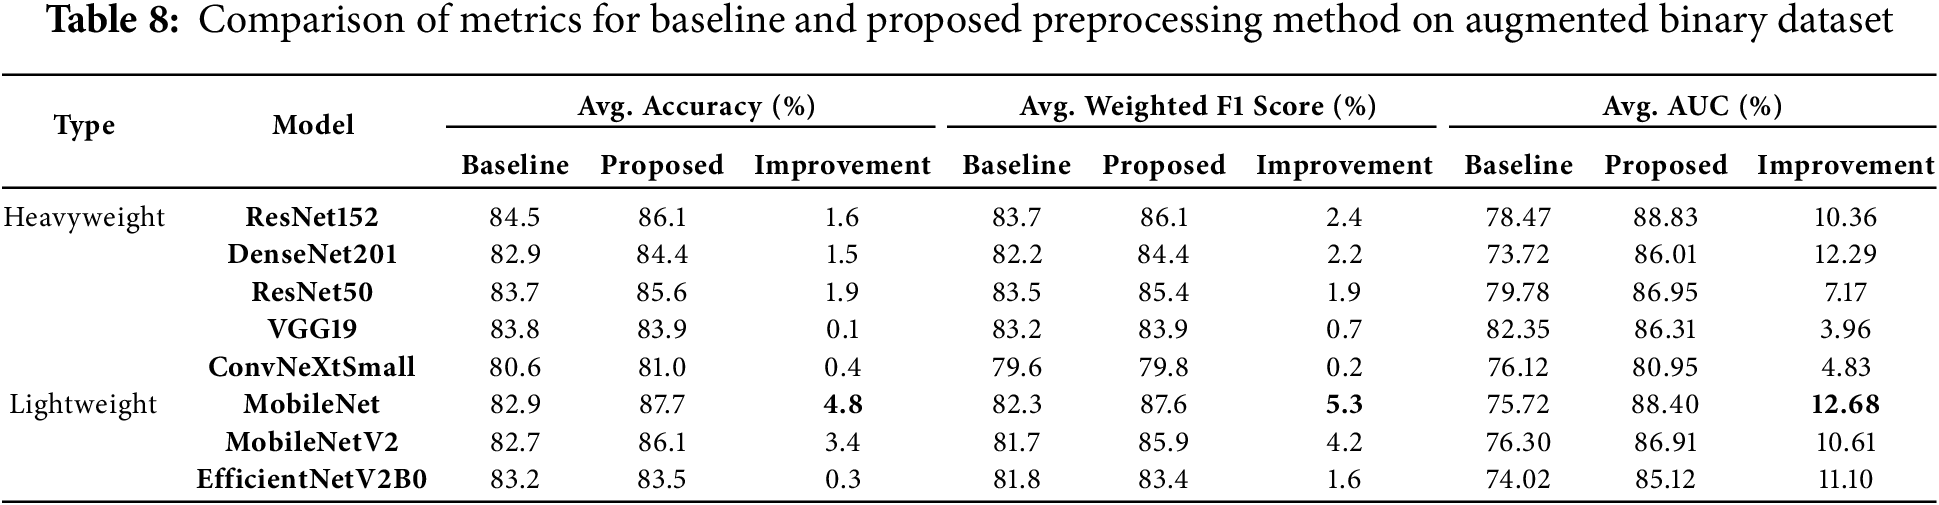
Lightweight models showed exceptional performance improvements with the proposed preprocessing method. MobileNet emerged as the top-performing lightweight model, achieving the highest average accuracy (87.7%) and weighted F1 score (87.6%). It recorded substantial gains of 4.8% in accuracy and 5.3% in weighted F1 score. Additionally, MobileNet achieved the highest improvement in average AUC, with a remarkable gain of 12.68%, showcasing the preprocessing method’s efficiency in enhancing lightweight architectures. MobileNetV2 also stood out, recording a 10.61% gain in average AUC and significant improvements of 4.2% in weighted F1 score and 3.4% in average accuracy, further validating the method’s effectiveness for lightweight models.
Among heavyweight models, DenseNet201 achieved the highest average AUC improvement (12.29%), increasing from 73.72% to 86.01%. It also demonstrated improvements in accuracy (1.5%) and weighted F1 score (2.2%), highlighting its ability to generalize effectively with the preprocessing method. Similarly, ResNet152 achieved the highest average accuracy among heavyweight models at 86.1%, reflecting a gain of 1.6%. It also recorded notable improvements in weighted F1 score (2.4%) and average AUC (10.36%), demonstrating its robustness and ability to leverage the preprocessing method effectively.
EfficientNetV2B0 exhibited consistent performance improvements, achieving an 11.1% gain in average AUC and modest gains in accuracy (0.3%) and weighted F1 score (1.6%). These results emphasize the scalability of the proposed preprocessing method and its adaptability to simpler architectures. VGG19, while maintaining robust baseline performance, showed moderate improvements, achieving a 3.96% increase in average AUC, along with smaller gains in weighted F1 score (0.7%) and accuracy (0.1%). This indicates VGG19’s strong baseline capabilities but limited adaptability to the preprocessing strategy.
Lastly, ConvNeXtSmall, despite starting with a relatively low baseline accuracy of 80.6%, recorded a 4.83% improvement in average AUC. However, its gains in accuracy (0.4%) and weighted F1 score (0.2%) were minimal, indicating limited responsiveness to the preprocessing strategy. This highlights the varying adaptability of models to the proposed method.
Overall, the proposed preprocessing method provided significant performance improvements across diverse architectures. Lightweight models, particularly MobileNet and MobileNetV2, benefited the most, with substantial gains across all metrics, especially in average AUC. Heavyweight models like DenseNet201 and ResNet152 demonstrated strong improvements, especially in average AUC and weighted F1 scores, validating the robustness of the preprocessing method. While ConvNeXtSmall and VGG19 showed more moderate adaptability, their improvements confirm the method’s effectiveness across different architectures and complexities.
8.3 Multiclass Dataset Classification
The application of the proposed preprocessing method to the multiclass dataset demonstrated notable improvements across various models. These gains included an increase in average AUC ranging from 3.2% to 8.86%, improvements in average accuracy from 0.10% to 3.40%, and enhancements in average weighted F1 scores ranging from 1.20% to 4.70% after applying the method. Table 9 provides a comprehensive summary of the average accuracy, average AUC and weighted F1 scores for the models, both without preprocessing (baseline) and with the proposed preprocessing method, along with the percentage improvements observed on the multiclass dataset.
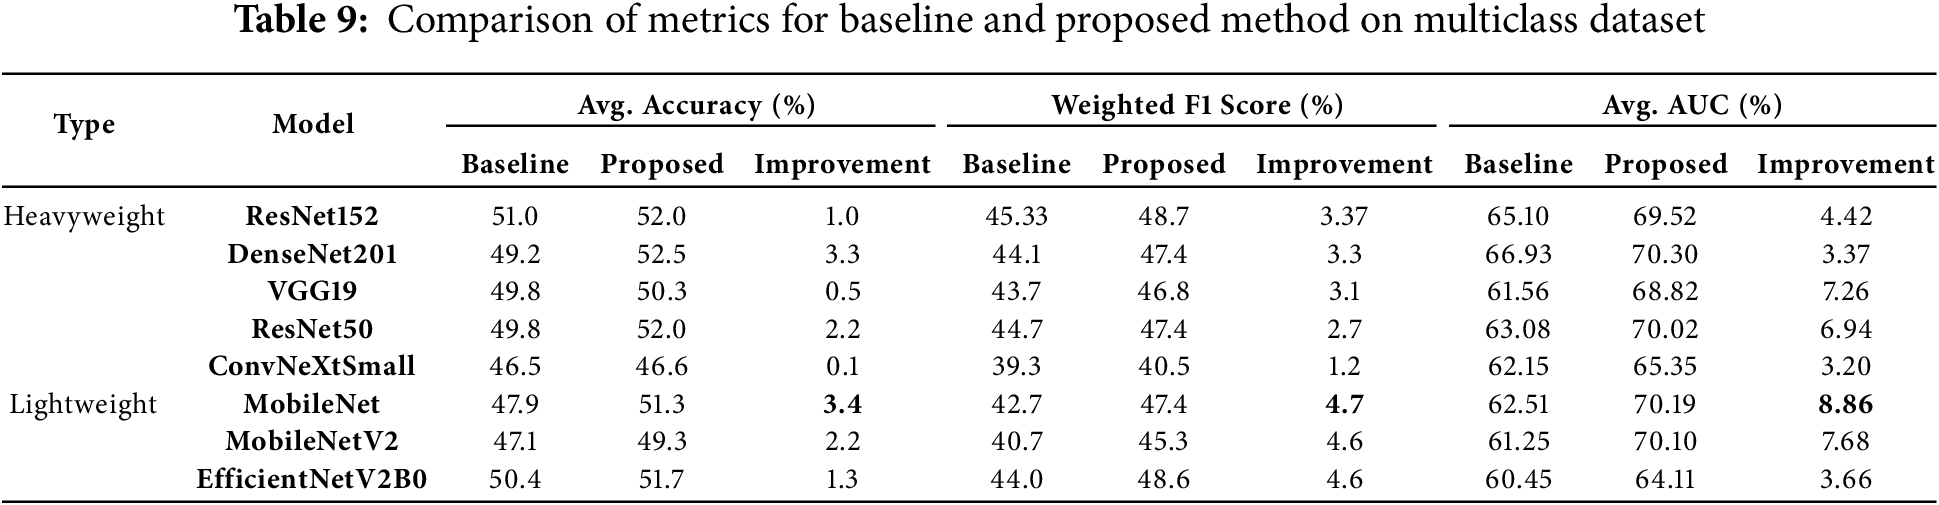
DenseNet201 reached the highest average accuracy of 52.5%, with a notable improvement of 3.3%. Moreover, it recorded a 3.3% increase in weighted F1 score, reflecting its strong response to the balanced data presented by the proposed preprocessing method. This highlights the model’s ability to generalize effectively when paired with the preprocessing strategy. MobileNet, a lightweight model, stood out by recording the largest improvement in average AUC, with an impressive gain of 8.86%. It also achieved substantial improvements in weighted F1 score (4.7%) and average accuracy (3.4%). These results underscore the adaptability of the proposed preprocessing method in enhancing the performance of simpler architectures like MobileNet. ResNet152, another heavyweight model, demonstrated the highest average weighted F1 score of 48.7%, with a notable 3.37% improvement. This showcases its robustness and effectiveness in leveraging the balanced data provided by the proposed preprocessing method, solidifying its position as a high-performing architecture under the proposed approach. MobileNetV2, another lightweight model, showed remarkable results, achieving an average AUC of 70.10% with a significant improvement of 7.68%. These findings highlight the scalability of the proposed preprocessing method for lightweight models, which benefit greatly from the enhanced data downsampling. Furthermore, ResNet50 recorded a significant improvement of 6.94% in average AUC, alongside a 2.2% increase in accuracy. These results validate the impact of the proposed preprocessing method on heavyweight architectures, demonstrating its capability to enhance even complex models.
In summary, the downsampling proposed preprocessing method led to substantial improvements across all metrics, with lightweight models like MobileNet and MobileNetV2 benefiting the most in terms of average AUC and F1 score improvements. Heavyweight models like DenseNet201 and ResNet152 also displayed strong performance, particularly in accuracy and F1 scores. These findings confirm the robustness and scalability of the proposed preprocessing method for multiclass heart sound classification.
8.4 Augmented Multiclass Dataset Classification
In our study on augmented multiclass dataset classification, the results demonstrated a remarkable increase in average AUC, ranging from 11.13% to 21.25%, average accuracy, ranging from 13.40% to 22.9%, and average weighted F1 scores, ranging from 16.5% to 27.1%. These findings highlight the significant benefits of data balancing achieved through the proposed preprocessing method. Table 10 illustrates the average accuracy, average weighted F1 scores and average AUC of the models with no preprocessing vs. proposed preprocessing method, along with the percentage of improvements on the augmented multiclass dataset classification.

MobileNetV2 demonstrated the most significant performance improvements across all metrics, making it the most responsive model to the proposed preprocessing method. It achieved an exceptional 22.9% increase in average accuracy, rising from 47.1% to 70.0%. Additionally, it recorded a remarkable 27.1% improvement in weighted F1 score and a substantial 21.25% gain in average AUC, showcasing the method’s effectiveness in enhancing this lightweight model.
ResNet152, a heavyweight model, achieved the highest average AUC among all models, reaching 81.42% with an impressive improvement of 18.91%. It also recorded the highest weighted F1 score of 67.9%, with a significant gain of 22.57%, and an 18.8% increase in average accuracy. These results highlight ResNet152’s robust generalization capabilities when paired with the proposed preprocessing method.
Among other lightweight models, MobileNet demonstrated substantial improvements, with an 18.4% increase in average accuracy, a 21.1% gain in weighted F1 score, and an average AUC improvement of 18.59%. These results confirm the efficiency of the proposed method in enhancing simpler architectures for multiclass classification tasks.
For heavyweight models, DenseNet201 achieved notable gains, with a 20.2% improvement in weighted F1 score, an 18.1% increase in average accuracy, and an 11.13% improvement in average AUC. These findings underscore its adaptability and strong performance with the proposed preprocessing method. Similarly, ResNet50 exhibited robust enhancements, with a 19.8% improvement in average accuracy, a 22.2% increase in weighted F1 score, and an 18.33% gain in average AUC, reinforcing its effectiveness.
The confusion matrix in Fig. 14a illustrates the true positive rates (TPR) for each class before applying the proposed preprocessing method. As expected in an imbalanced dataset, the model struggled to accurately classify certain rare and difficult cases, with significant confusion observed between classes representing similar heart conditions. For instance, the Aortic regurgitation class had a low TPR of 0.25, and a notable portion of misclassifications were directed toward the Mitral regurgitation class, which itself had a TPR of 0.5. These results suggest that the model found it difficult to differentiate between these two conditions, likely due to the similar clinical features they share. The highest classification accuracy was achieved for the Normal class, with a TPR of 0.81, as this class tends to be overrepresented in the dataset. However, several misclassifications were observed in more challenging cases, such as the Difficult Rare class, which had an extremely low TPR of 0.17, and Mitral stenosis, which achieved a TPR of 0.67. Additionally, the Tricuspid regurgitation class experienced frequent misclassification with the Aortic regurgitation class, with a TPR of only 0.36. These findings highlight the limitations of the model in correctly identifying the challenges heart conditions, where misclassification could lead to critical diagnostic errors. After applying the proposed preprocessing method, which utilizes k-means clustering and Silhouette Score analysis to balance the dataset, the model’s performance improved substantially, as demonstrated in Fig. 14b. For the Aortic regurgitation class, the TPR increased significantly from 0.25 to 0.7, and the confusion with the Mitral regurgitation class was notably reduced. This indicates that the balanced data allowed the model to better distinguish between these two closely related conditions. Similarly, the Aortic stenosis class achieved a perfect classification with a TPR of 1.0, reflecting the effectiveness of the preprocessing in eliminating misclassifications for this condition. Moreover, the improvements were particularly remarkable for classes that were previously difficult to classify. The Difficult Rare class, which initially had a TPR of 0.17, improved to 0.9 following the application of the proposed work, indicating that the model became significantly more proficient at detecting these rare cases. Other notable improvements were seen in the Mitral regurgitation class, where the TPR increased from 0.5 to 0.64, and the Mitral stenosis class, which rose from 0.67 to 0.9. Even the Normal class, which already had high classification accuracy, saw further improvement with a TPR of 0.9. These improvements highlight the impact of the proposed method in enhancing the model’s ability to accurately classify both rare and difficult heart conditions. By addressing the class imbalance, the method successfully minimized misclassifications between challenging classes, leading to a significant enhancement in the model’s overall classification performance. The increased TPR values across all classes, particularly for rare and difficult-to-classify conditions, underscore the method’s effectiveness in preparing the model for real-world diagnostic applications.
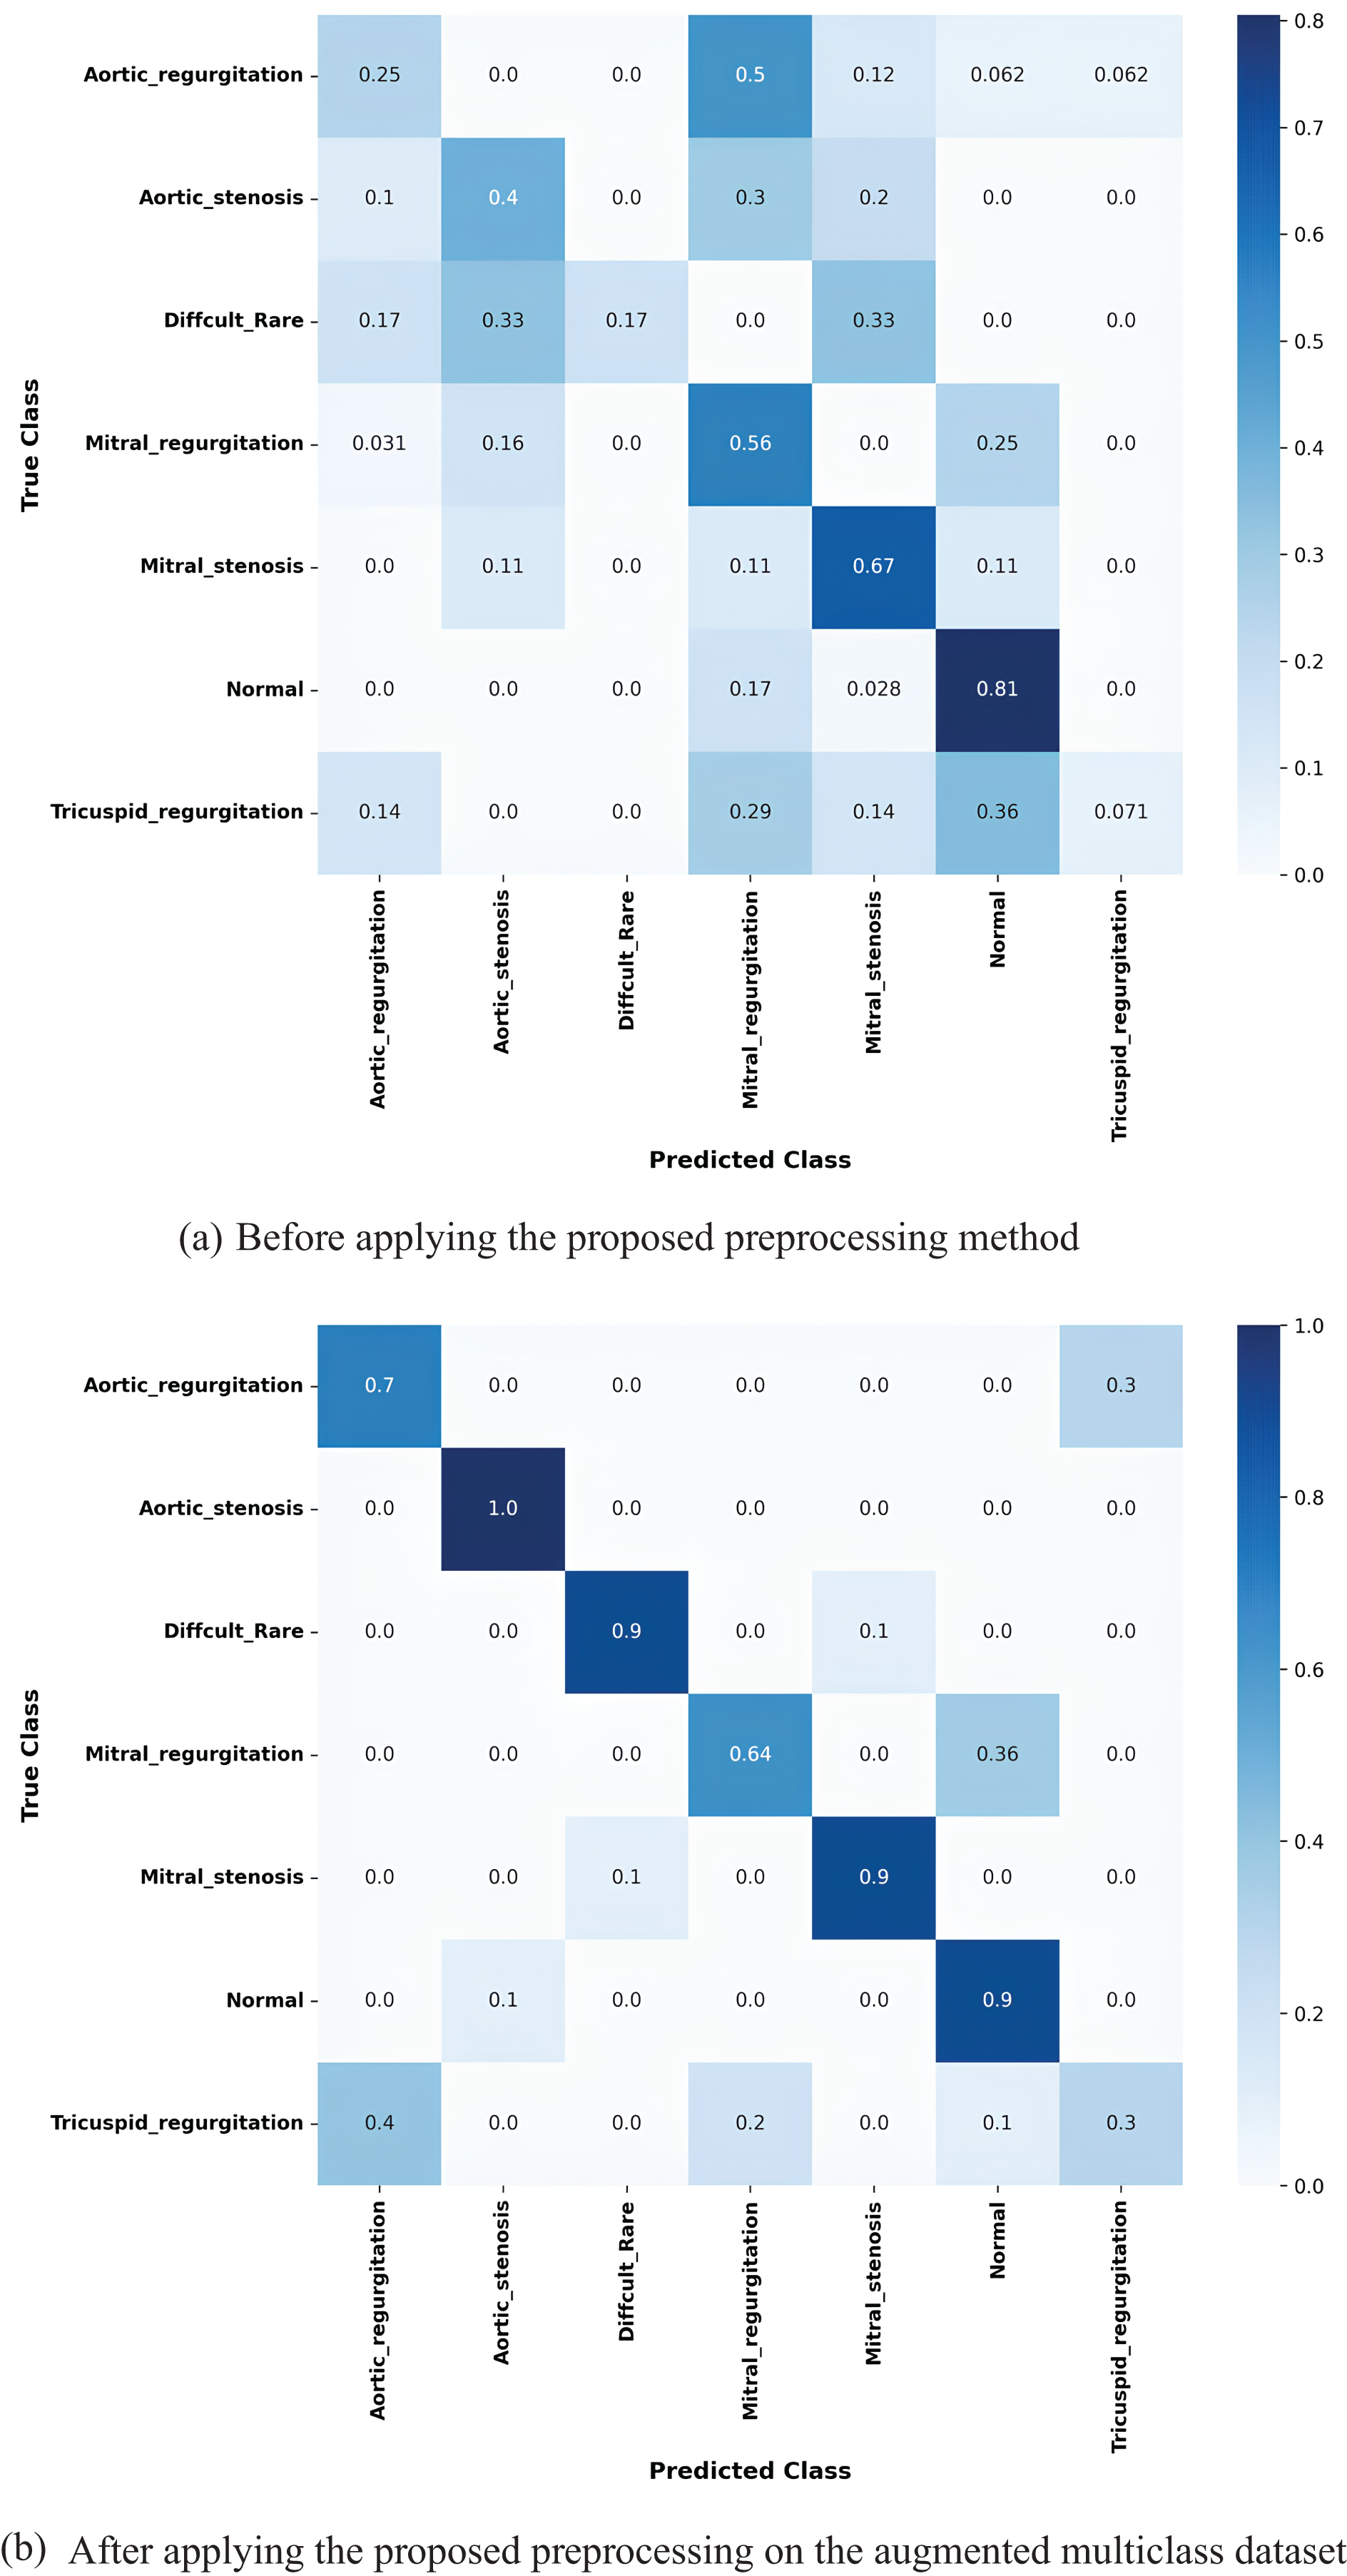
Figure 14: Confusion matrices for the k-fold 3 MobileNetV2 model showing the true positive rates for each class: (a) before applying the proposed preprocessing method, and (b) after applying the proposed preprocessing to the augmented multiclass dataset
Fig. 15 presents the Receiver Operating Characteristic (ROC) curves and AUC values for the MobileNetV2 model on the k-fold3 augmented multiclass dataset, highlighting the results before and after applying the proposed preprocessing method. Before preprocessing, the curves exhibit limited performance, with several classes showing lower AUC values and less distinct True Positive Rate (TPR) progressions. Specifically, the macro AUC value is only 0.41, with some classes, such as Aortic regurgitation and Tricuspid regurgitation, having AUCs as low as 0.00.
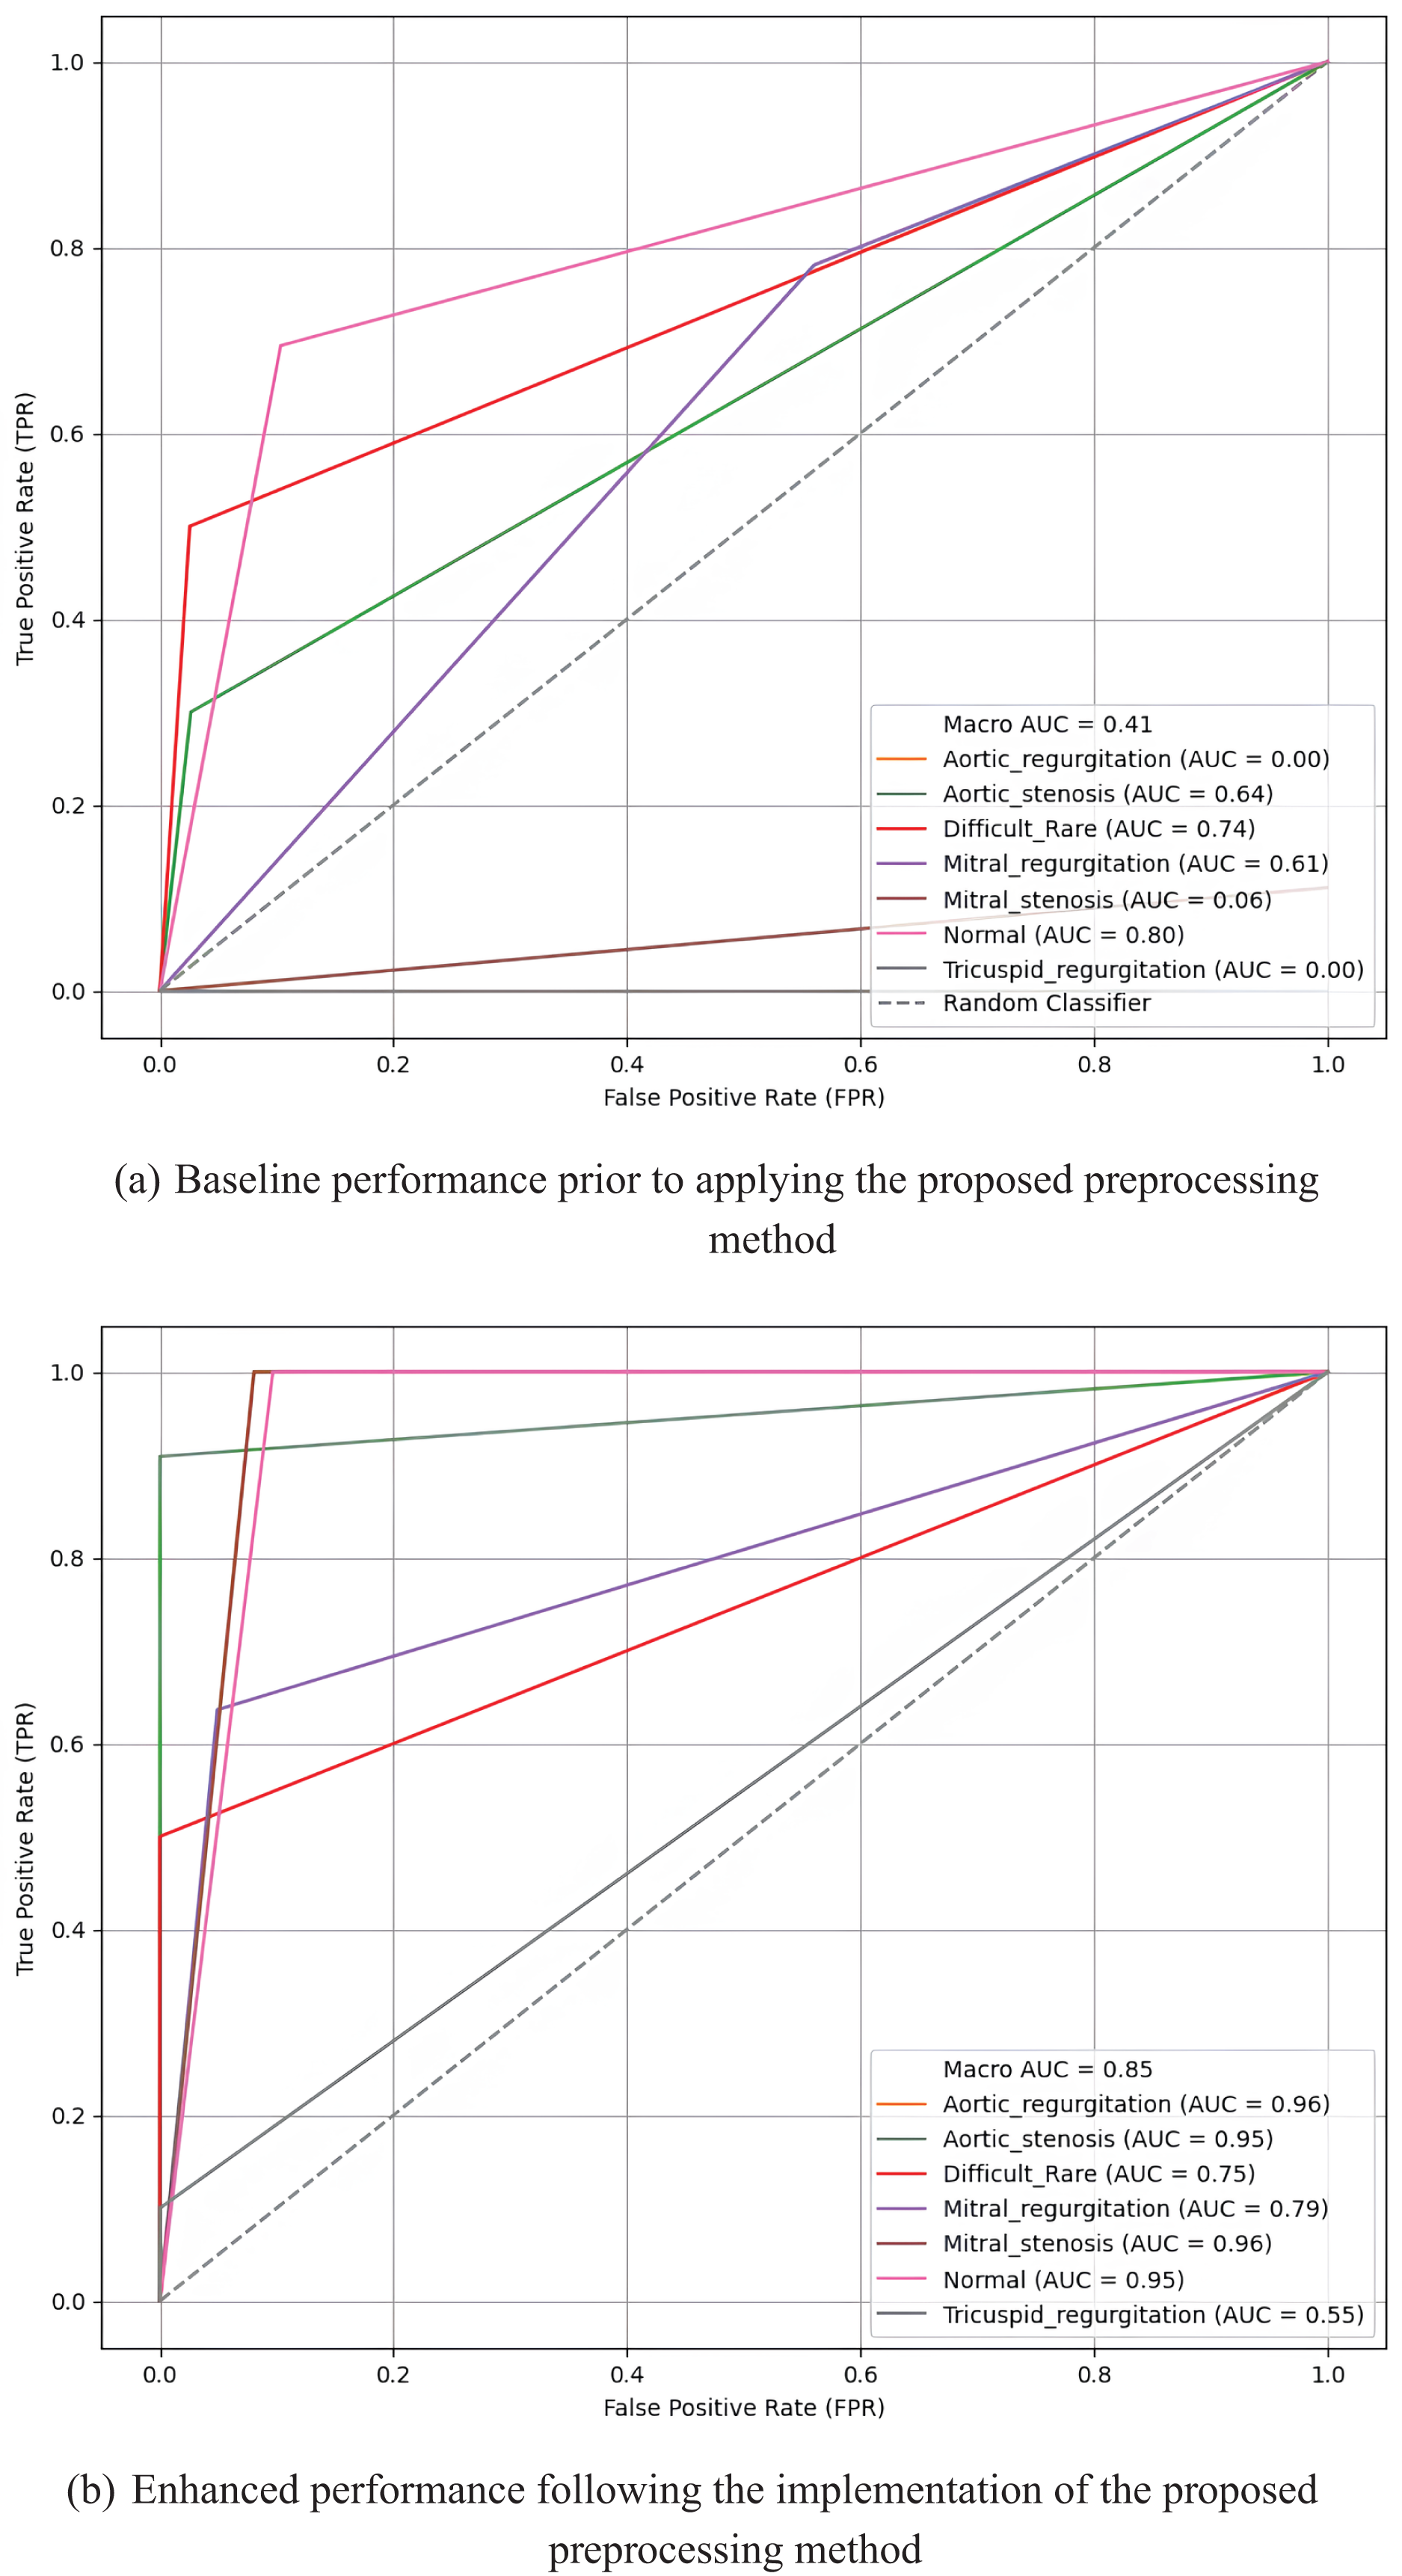
Figure 15: Receiver operating characteristic (ROC) curves and AUC values for the MobileNetV2 model on the k-fold3 augmented multiclass dataset, illustrating the true positive rates across multiple classes before (a) and after (b) applying the proposed preprocessing method
In contrast, after applying the proposed preprocessing method, the ROC curves for most classes demonstrate significant sharpening and improvement. The macro AUC increases substantially to 0.85, indicating enhanced overall model performance. Individual classes, such as Aortic regurgitation and Mitral stenosis, achieve high AUCs of 0.96, reflecting the model’s improved ability to distinguish between classes. The sharper and more elevated curves after preprocessing underscore the effectiveness of the proposed method in boosting classification accuracy across all multiclass categories.
These findings highlight the proposed preprocessing method’s ability to significantly enhance performance across diverse models, particularly lightweight models like MobileNetV2 and MobileNet, while also achieving remarkable improvements in heavyweight models such as ResNet152, DenseNet201, and ResNet50. The results emphasize the scalability and effectiveness of the preprocessing approach in boosting model performance for multiclass heart sound classification.
8.5 Impact of Downsampling on Accuracy
The results before and after applying the proposed downsampling method reveal a significant improvement in both accuracy and weighted F1-score, emphasizing the effectiveness of downsampling in handling class imbalance. Table 11 illustrates the recall (true positive rate) for each class before and after applying the proposed method, using the MobileNetV2 model on fold 3 as an example. Before downsampling, the model achieved an overall accuracy of 51% and a weighted F1-score of 48%. This low performance was largely driven by the poor recall for minority classes such as Difficult Rare (17%) and Tricuspid Regurgitation (7.1%), which were heavily overshadowed by the dominance of majority classes like Normal (recall = 81%). This imbalance meant that the model struggled to generalize to underrepresented samples, leading to significant misclassifications and a disproportionate focus on majority classes.
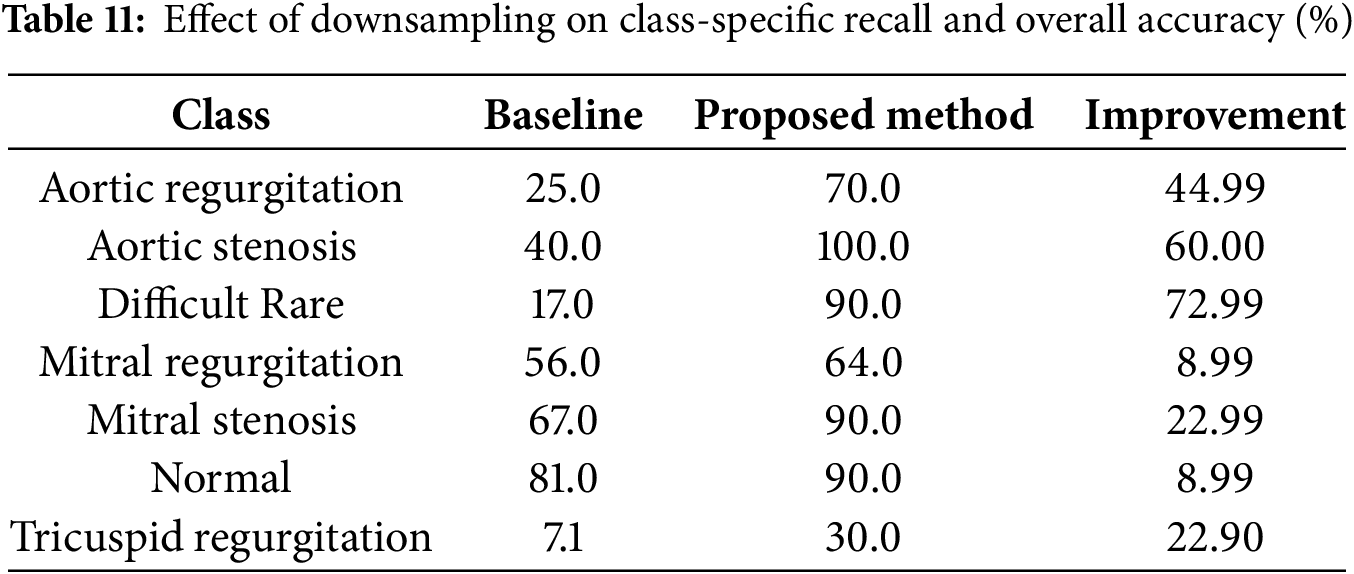
After applying the proposed downsampling method, the overall accuracy increased to 76%, and the weighted F1-score improved to 75%. This substantial improvement reflects the model’s enhanced ability to classify samples across all classes more effectively. The balanced representation achieved through downsampling ensured fair contributions from all classes, particularly the minority ones, without compromising the performance of majority classes.
A closer look at class-specific performance highlights the positive impact of downsampling, as shown in Table 11. Recall for Difficult Rare improved significantly from 17% to 90%, demonstrating the method’s success in addressing underrepresented classes. Similarly, recall for Tricuspid Regurgitation increased from 7.1% to 30%, showing meaningful gains for even the most challenging classes. On the other hand, majority classes such as Normal retained strong performance, with recall improving from 81% to 90%, and Aortic Stenosis achieved a perfect recall of 100%. These results confirm that the downsampling method maintains high sensitivity for majority classes while elevating the performance of minority ones.
The alignment between the weighted F1-score and accuracy after downsampling underscores the method’s ability to balance contributions from all classes. Weighted F1-score, which accounts for both precision and recall, improved to 75%, closely matching the overall accuracy of 76%. This indicates that the improvements in class-specific recall directly enhanced the model’s overall performance, particularly by reducing false negatives for minority classes.
In conclusion, the proposed downsampling method substantially improves the model’s performance by addressing class imbalance. The 25% increase in accuracy and the 27% improvement in weighted F1-score highlight the method’s ability to ensure fair contributions from both majority and minority classes. This makes the approach particularly valuable for imbalanced datasets in medical diagnostics, where consistent and reliable classification is critical.
8.6 Comparison with Existing Works
We conducted a comparison of our proposed preprocessing method with existing works, as shown in Table 12. In [23,35], the authors utilized biclustering as a preprocessing technique to enhance model performance. Their approach involves clustering samples into two clusters, retaining the more significant clusters with higher sample relevance, while discarding less significant ones. However, the discarded clusters may contain rich and useful data samples, which could potentially impact model performance. This method achieved notable results. For instance, in [35], the PhysioNet 2016 dataset was used, yielding strong performance metrics with an accuracy of 91.5%, precision of 87.3%, a True Positive Rate (TPR) of 86%, and a True Negative Rate (TNR) of 87.3%. Similarly, in [23], the authors applied their method to the PASCAL 2011 dataset, optimizing accuracy and other metrics. However, they observed lower precision and sensitivity (TPR) in certain classes, highlighting a trade-off in balancing performance across metrics.
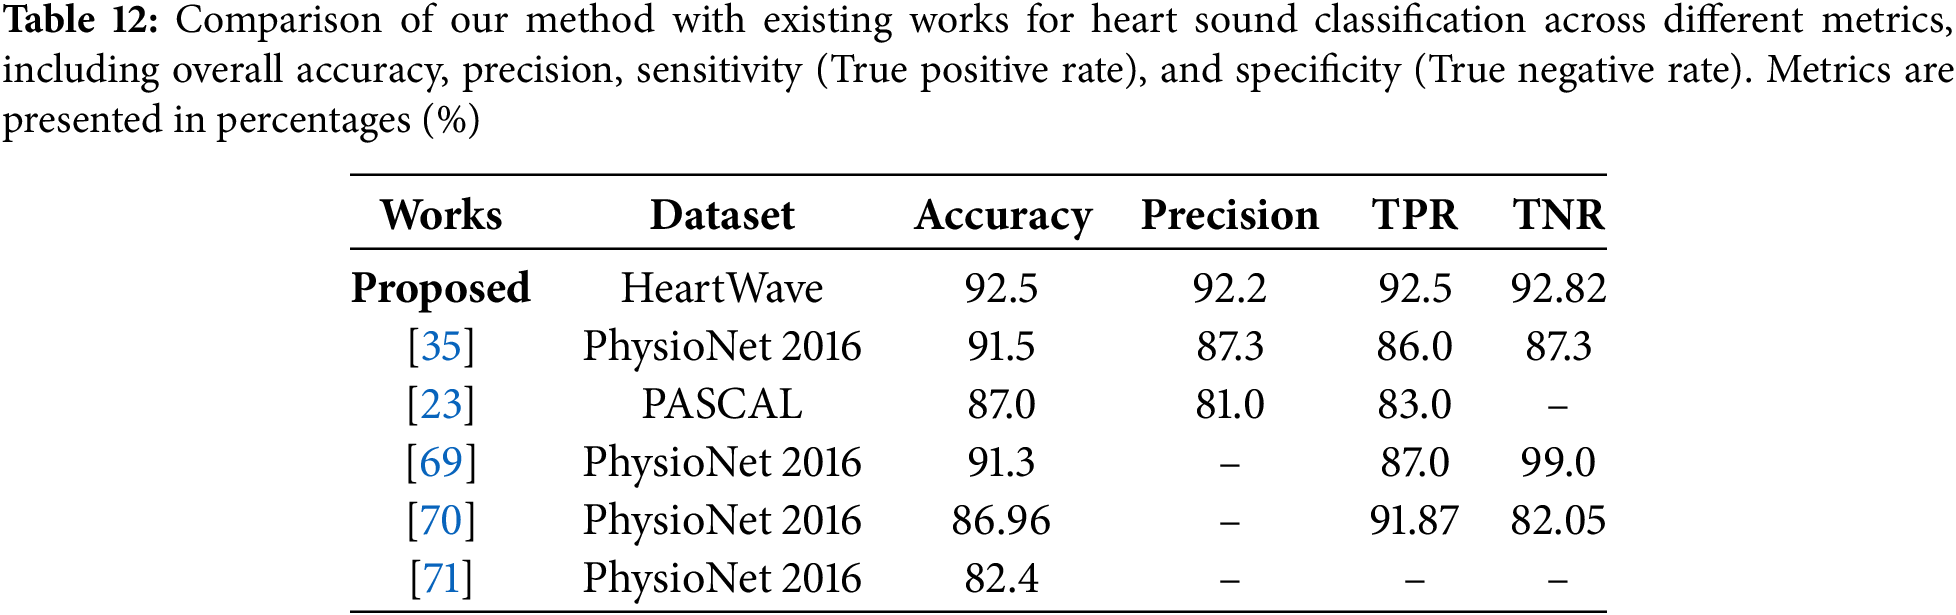
In [69], Synthetic minority oversampling technique (SMOTE) was used to balance the heart sound dataset. However, this technique may be unsuitable for heart sound data, as it ignores the temporal and physiological structure of phonocardiograms. Despite achieving 91.3% accuracy, 87% TPR, and 99% TNR, the use of synthetic samples may limit clinical relevance. Moreover, the dataset included 2575 normal and 655 abnormal samples, indicating a reverse imbalance. In this case, downsampling the normal class could have been more appropriate.
In contrast, reference [70] employed domain-specific features (motifs) and frequency-domain features (Mel-frequency cepstral coefficients, MFCC) using the PhysioNet 2016 dataset. Their approach achieved good accuracy (86.96%), TPR (sensitivity) of 91.87%, and TNR (specificity) of 82.05%, demonstrating its effectiveness in heart sound classification using combined temporal and spectral features. Despite this, their method did not achieve the highest overall performance across all metrics. Meanwhile, reference [71], also using the PhysioNet 2016 dataset, employed a hybrid feature selection approach that combined temporal alignment techniques such as Dynamic Time Warping (DTW) with spectral features like Mel-Frequency Cepstral Coefficients (MFCCs) and wavelet transform features. Clustering was used to group heartbeats and generate canonical templates for classification. Unfortunately, this method resulted in the lowest accuracy among the compared works, underscoring its limitations. As highlighted in Table 12, our method outperformed all others, achieving the highest results across most key metrics: accuracy (92.5%), precision (92.2%), TPR (sensitivity) (92.5%), and TNR (specificity) (92.82%), showing a superior balance across all metrics, which is especially critical in medical applications. These metrics are particularly important for cardiovascular disease detection, where both accuracy and reliability are paramount. The superior performance of our method is attributed to its systematic downsampling strategy, which retains the most relevant and informative data. Unlike random downsampling, our approach effectively addresses the data imbalance problem by preserving critical information, resulting in significant improvements across all performance metrics.
To sum up, the classification results for the four different datasets convincingly prove the effectiveness of our proposed preprocessing systematic downsampling method in enhancing the performance of various transferred pretrained deep learning models for binary and multiclass classification of heart sounds. Significant improvements were observed in overall an average AUC scores, an average accuracies and an average weighted F1-scores, indicating a robust enhancement in model accuracy. These progressions underscore the possibility of our preprocessing method facilitating more accurate cardiovascular diagnoses.
The results of our study emphasize the effectiveness and robustness of the proposed preprocessing method in addressing the challenges of imbalanced datasets, leading to significant improvements in heart sound and murmurs classification. Experiments conducted on four datasets, a binary dataset, an augmented binary dataset, a multiclass dataset, and an augmented multiclass dataset demonstrate the method’s scalability and adaptability across diverse classification scenarios. By leveraging iterative clustering with average silhouette analysis, the proposed preprocessing method optimizes cluster quality, enhances data cohesion, and ensures better representation of all classes. These findings highlight the critical role of preprocessing in boosting the performance of deep learning models for heart sound classification. The results, such as the significant improvements in accuracy, weighted F1 score and AUC score across various models, underscore how this targeted downsampling enhances model generalization and addresses the challenges of class imbalance effectively.
The results reveal a clear distinction between the performance of lightweight and heavyweight models when applied with the proposed preprocessing method. Lightweight models, such as MobileNet and MobileNetV2, showed remarkable adaptability and scalability, achieving the most significant improvements across all metrics. For instance, MobileNetV2 on the augmented multiclass dataset demonstrated the highest gains, with a 22.9% increase in average accuracy, a 27.1% improvement in weighted F1 score, and a remarkable 21.25% rise in average AUC. Similarly, MobileNet achieved a high AUC of 95.25% on the binary dataset, with an improvement of 18.95%, displaying the method’s effectiveness in enhancing class separation for simpler classification tasks. In contrast, heavyweight models demonstrated robust baseline metrics but showed more modest improvements, particularly in complex datasets. ResNet152, for example, achieved an average accuracy improvement of 1.0%, a weighted F1 score improvement of 3.37%, and an average AUC improvement of 4.42% on the multiclass dataset, highlighting its reliance on architectural strength rather than preprocessing. DenseNet201, however, displayed strong generalization capabilities, achieving an average AUC improvement of 12.29%, underscoring its ability to benefit from the preprocessing method even in more challenging scenarios.
The proposed preprocessing method effectively addresses class imbalance, a critical issue in heart sound classification tasks, by ensuring that downsampled clusters maintain high quality and cohesiveness, as assessed by silhouette scores. This approach prevents the loss of critical information during downsampling, allowing models to generalize effectively and achieve higher accuracy. For instance, MobileNetV2 demonstrated a significant improvement in accuracy, achieving 91.1% on the binary dataset (an 8.4% gain), and 70.0% on the augmented multiclass dataset (a 22.9% increase).
The improvements in weighted F1-score across both binary and multiclass datasets emphasize the importance of addressing class imbalance. By efficiently balancing the dataset through k-means clustering and silhouette score analysis, the method ensures that rare, difficult, and small-sized classes are better represented during training. This, in turn, significantly enhances recall and precision, enabling models to perform well even in challenging classification scenarios.
The overall accuracy and weighted F1-score are both influenced by the model’s ability to correctly classify samples, but the weighted F1-score provides a more comprehensive measure by balancing precision and recall, especially in imbalanced datasets. In imbalanced datasets, high accuracy does not necessarily indicate a high true positive rate, as it can be dominated by correct predictions in the majority class while overlooking poor performance in minority classes. By balancing the dataset through downsampling, the proposed method ensures that weighted F1-score provides a more reliable confirmation of accuracy by incorporating both precision and recall. As shown in Table 11, the recall (true positive rate) for underrepresented classes, such as Difficult Rare and Aortic Regurgitation, improved significantly after applying the proposed method, with gains of +73% and +45%, respectively. Majority classes, such as Normal, retained high performance with recall improving from 81% to 90%. These improvements reflect the method’s ability to maintain a balance between minority and majority classes, demonstrating its robustness in addressing class imbalance and its critical role in enhancing overall classification performance.
Unlike prior approaches, such as those by Boulares et al. [23] and Barnawi et al. [35], which relied on arbitrary cluster selection, our method employs a systematic iterative clustering process guided by silhouette scores. This ensures that the clusters are not only numerous but also meaningful and well-defined. By focusing on cluster cohesiveness and quality, the proposed method effectively mitigates the challenges of class imbalance, resulting in significant performance gains across all metrics. The results demonstrate that the proposed method adapts well to datasets of varying complexity. In binary datasets, the method significantly improved class separation, with MobileNetV2 achieving a high AUC of 95.25%, an improvement of 18.95%. In multiclass datasets, the method excelled in capturing complex decision boundaries through augmentation, leading to improved generalization. This is evidenced by MobileNetV2’s substantial gains in all three metrics on the augmented multiclass dataset, highlighting the preprocessing method’s scalability and adaptability.
In prior works, Boulares et al. [23] and Barnawi et al. [35], selection methods such as clustering have demonstrated their effectiveness in improving model performance using public datasets like PhysioNet/CinC 2016 and PASCAL heart sound datasets. Similarly, our proposed selection method has proven to be even more effective by systematically identifying high-quality clusters based on cohesion and representativeness. This has resulted in significant improvements in model performance. The success of our method not only underscores its robustness but also indicates its strong potential for generalization to other public or new heart sound datasets. By addressing class imbalance and enhancing data representation, the method provides a scalable and adaptable approach for improving classification accuracy across diverse datasets. As part of our future work, we aim to extend the evaluation of our method to additional public and private datasets to validate its generalization ability further and to explore its impact on accuracy in broader applications.
The ROC curves and AUC values for the MobileNetV2 model provide clear evidence of the impact of the proposed preprocessing method on both binary and augmented multiclass datasets. For the binary dataset, the preprocessing method significantly enhanced the model’s ability to distinguish between Normal and Abnormal classes, as demonstrated by the AUC improvement from 0.79 to 0.94, with a sharper ROC curve indicating increased classification confidence and accuracy. Similarly, for the augmented multiclass dataset, the preprocessing method addressed the limitations observed in the baseline performance, where many class-specific ROC curves were flat, reflecting poor separation and low AUC values. After applying the method, the macro-average AUC improved substantially from 0.41 to 0.85, with sharper and more distinct curves for most classes, such as Aortic stenosis and Mitral stenosis. These results underscore the effectiveness of the proposed preprocessing technique in enhancing the model’s classification performance, both in binary and multiclass scenarios, by improving its ability to separate classes and generalize across complex datasets.
While the proposed preprocessing method demonstrated notable improvements, its impact on augmented binary datasets was less pronounced, the issue arises from the limitations of the augmentation method, which lacks sufficient accuracy and fails to provide precise segmentation. Additionally, some recordings in the normal and abnormal classes include noisy samples. These noisy samples introduce False Positives (FP), as the augmentation process heavily relies on accurately identifying the S1 and S2 components of the heartbeat cycle, making it unable to generate reliable augmented samples. Consequently, poorly segmented samples contribute to misclassifications, increasing both False Positives (FP) and False Negatives (FN), thereby reducing overall classification performance. This challenge is particularly prominent in the augmented binary dataset, which consists of only two classes. In this dataset, the abnormal class aggregates all abnormal recordings from the multiclass dataset. This aggregation worsen the impact of noisy and poorly segmented samples, as the binary dataset lacks the resolution to differentiate between abnormal subcategories. In the binary context, segmentation errors lead to False Negatives (FN) in the abnormal class and False Positives (FP) in the normal class. Conversely, in the multiclass dataset, segmentation errors are less detrimental, as misclassified segments from the abnormal class are more likely to be reassigned to their respective abnormal subcategories, increasing True Positives (TP) across classes. To investigate this issue further, we conducted an experiment where manual segmentation was applied. This manual approach significantly reduced False Positives (FP) and False Negatives (FN) while improving True Positive (TP) predictions across both classes, leading to enhanced binary classification performance. These findings clarify why the segmentation process in the augmented binary dataset was ineffective and highlight the importance of accurate segmentation for reliable augmentation.
To address the shortcomings related to segmentation inaccuracies, we propose further investigation through the following: (1) enhancing heart cycle segmentation using expert-guided manual annotation, and (2) leveraging explainable AI techniques to understand how deep learning models may misclassify poorly segmented samples. Additionally, we suggest incorporating attention mechanisms to improve model performance. The proposed preprocessing method should also be applied to other publicly available heart sound datasets—such as the PhysioNet/CinC Challenge and the PASCAL dataset—and further extended to other medical domains to assess its generalizability and effectiveness. Moreover, future work will include comparisons with baseline balancing techniques, such as random undersampling and class weighting, to more comprehensively validate the advantages of our proposed approach. Lastly, in addition to the Silhouette Score, other clustering evaluation metrics—such as the Davies–Bouldin Index and the Calinski–Harabasz Score—will be considered to provide a more robust assessment of cluster quality.
The proposed preprocessing method significantly enhances data quality and model performance for heart sound classification tasks. It improves representation for minority classes, leading to substantial gains in weighted F1 score, AUC score, and overall classification accuracy. Lightweight models, such as MobileNetV2, exhibited the most significant improvements, emphasizing the method’s scalability and adaptability to diverse architectures and datasets. These findings highlight the potential of this preprocessing strategy to improve diagnostic accuracy in medical applications, particularly in detecting rare and complex cardiovascular conditions.
The experimental evidence and insights discussed above clearly validate the core contributions of this work: (1) the development of a novel iterative clustering-based downsampling method guided by silhouette analysis, (2) its successful application and benchmarking across binary, multiclass, and augmented datasets using diverse pretrained models, and (3) its strong performance in enhancing the classification of rare and diagnostically complex heart sound conditions.
This paper proposes a preprocessing pipeline that employs iterative k-means clustering with silhouette score analysis for downsampling, using the HeartWave dataset. This approach provides valuable insights into how systematic data balancing can enhance model performance in classifying heart sounds and murmurs. To augment the dataset, heartbeat cycle segmentation was applied. This paper derived four datasets from the original HeartWave data: binary, augmented binary, multiclass, and augmented multiclass. PCG signals were filtered using a Butterworth filter and assessed for signal-to-noise ratio (SNR), then transformed into mel spectrogram images suitable for deep learning models.
The proposed preprocessing method was evaluated using 10-fold cross-validation across a range of transfer learning models representing diverse architectures, including both lightweight and heavyweight networks. Results demonstrated notable improvements in average accuracy, AUC, and weighted F1-score, affirming the effectiveness of the proposed approach. For example, in the augmented multiclass dataset, MobileNetV2 achieved an improvement of 21.25% in average AUC, 22.90% in average accuracy, and 27.10% in weighted F1-score compared to its performance without preprocessing. In the binary classification task, the enhanced MobileNetV2 model attained an 18.95% increase in average AUC, reaching a value of 95.25%. This study represents the first comprehensive assessment of the HeartWave dataset, which contains recordings of complex and difficult-to-diagnose cardiovascular conditions. The results highlight the importance of effective preprocessing techniques in improving the diagnostic performance of deep learning models applied to phonocardiogram (PCG) signals, contributing meaningfully to the advancement of precision medicine.
Despite the overall success, the method showed limited effectiveness on the augmented binary dataset due to segmentation inaccuracies, particularly in detecting the S1 and S2 components. These errors introduced noise into the dataset, leading to occasional misclassifications and reduced performance in certain cases. Future work will focus on improving segmentation accuracy, incorporating explainable AI and attention mechanisms, and validating the approach on additional datasets. Furthermore, alternative clustering metrics will be explored to enhance the robustness and generalizability of the preprocessing pipeline.
Acknowledgement: Not applicable.
Funding Statement: This work was supported by the Deanship of Scientific Research (DSR), King Abdulaziz University, Jeddah, under grant No. IPP: 533-611-2025. The authors, therefore, gratefully acknowledge DSR technical and financial support.
Author Contributions: Sami Alrabie contributed to methodology design, implementation, data analysis, and writing the original draft. Ahmed Barnawi was responsible for supervision, project administration, and manuscript revision. All authors reviewed the results and approved the final version of the manuscript.
Availability of Data and Materials: The original contributions presented in the study are included in the article, further inquiries can be directed to the corresponding author.
Ethics Approval: Not applicable.
Conflicts of Interest: The authors declare no conflicts of interest to report regarding the present study.
References
1. World Health Organization. Cardiovascular diseases (CVDs) [Internet]. [cited 2023 Aug 26]. Available from: https://www.who.int/news-room/fact-sheets/detail/cardiovascular-diseases-(cvds). [Google Scholar]
2. American College of Cardiology. CVD causes one-third of deaths worldwide: study examines global burden of CVD from 1990 to 2015 [Internet]. [cited 2023 Aug 26]. Available from: https://www.acc.org/latest-in-cardiology/articles/2017/05/17/16/02/cvd-causes-one-third-of-deaths-worldwide. [Google Scholar]
3. International Medical Volunteers Association. Cause of death in developing countries [Internet]. [cited 2023 Aug 26]. Available from: https://www.imva.org/pages/deadtxt.htm#:~:text=Severe%20poverty%20is%20the%20root,inadequate%20sanitation%2C%20and%20contaminated%20water. [Google Scholar]
4. Bourouhou A, Jilbab A, Nacir C, Hammouch A. Heart sounds classification for a medical diagnostic assistance. Int J Online Biomed Eng (iJOE). 2019;15(11):88–103. doi:10.3991/ijoe.v15i11.10804. [Google Scholar] [CrossRef]
5. Varghees VN, Ramachandran KI. A novel heart sound activity detection framework for automated heart sound analysis. Biomed Signal Process Control. 2014;13(6):174–88. doi:10.1016/j.bspc.2014.05.002. [Google Scholar] [CrossRef]
6. Levine SA. Auscultation of the heart. Br Heart J. 1948;10(4):213. doi:10.1136/hrt.10.4.213. [Google Scholar] [PubMed] [CrossRef]
7. Barabása C, Jafari M, Plumbley MD. A robust method for S1/S2 heart sounds detection without ECG reference based on music beat tracking. In: Proceedings of the 10th International Symposium on Electronics and Telecommunications; 2012 Nov 15–16; Timisoara, Romania. p. 307–10. [Google Scholar]
8. Alaskar H, Alzhrani N, Hussain A, Almarshed F. The implementation of pretrained AlexNet on PCG classification. In: Proceedings of the International Conference on Intelligent Computing; 2019 Dec 6–8; Chongqing, China. p. 784–94. [Google Scholar]
9. Olatunji DE, Zannu JD, Mukamakuza CP, Uiso GN, Buol C, Aman MMM, et al. Machine learning-based analysis of ECG and PCG signals for rheumatic heart disease detection: a scoping review (2015–2025). arXiv:2505.18182. 2025. [Google Scholar]
10. Alam U, Asghar O, Khan SQ, Hayat S, Malik RA. Cardiac auscultation: an essential clinical skill in decline. Br J Cardiol. 2010;17(1):8. [Google Scholar]
11. Reed TR, Reed NE, Fritzson P. Heart sound analysis for symptom detection and computer-aided diagnosis. Simul Model Pract Theory. 2004;12(2):129–46. doi:10.1016/j.simpat.2003.11.005. [Google Scholar] [CrossRef]
12. Avendano-Valencia LD, Ferrero JM, Castellanos-Dominguez G. Improved parametric estimation of time frequency representations for cardiac murmur discrimination. In: Proceedings of the 2008 Computers in Cardiology; 2008 Sep 14–17; Bologna, Italy. p. 157–60. [Google Scholar]
13. Mangione S, Nieman LZ. Cardiac auscultatory skills of internal medicine and family practice trainees: a comparison of diagnostic proficiency. JAMA. 1997;278(9):717–22. doi:10.1001/jama.1997.03550090041030. [Google Scholar] [CrossRef]
14. Dwivedi AK, Imtiaz SA, Rodriguez-Villegas E. Algorithms for automatic analysis and classification of heart sounds-a systematic review. IEEE Access. 2018;7:8316–45. doi:10.1109/access.2018.2889437. [Google Scholar] [CrossRef]
15. Shuvo SB, Ali SN, Swapnil SI, Hasan T, Bhuiyan MIH. A lightweight CNN model for detecting respiratory diseases from lung auscultation sounds using EMD-CWT-based hybrid scalogram. IEEE J Biomed Health Inform. 2021;25(7):2595–603. doi:10.1109/jbhi.2020.3048006. [Google Scholar] [PubMed] [CrossRef]
16. Huda N, Khan S, Abid R, Shuvo SB, Labib MM, Hasan T. A low-cost, low-energy wearable ECG system with cloud-based arrhythmia detection. In: 2020 IEEE Region 10 Symposium (TENSYMP); 2020 Jun 5–7; Dhaka, Bangladesh. p. 1840–3. [Google Scholar]
17. Ali SN, Shuvo SB, Al-Manzo MIS, Hasan MD, Hasan T. An end-to-end deep learning framework for real-time denoising of heart sounds for cardiac disease detection in unseen noise. TechRxiv. 2023. doi:10.36227/techrxiv.19950155.v3. [Google Scholar] [CrossRef]
18. Gaona AJ, Arini PD. Deep recurrent learning for heart sounds segmentation based on instantaneous frequency features. arXiv:2201.11320. 2022. [Google Scholar]
19. Pranata YD, Wang K-C, Wang J-C, Idram I, Lai J-Y, Liu J-W, et al. Deep learning and SURF for automated classification and detection of calcaneus fractures in CT images. Comput Methods Programs Biomed. 2019;171(5):27–37. doi:10.1016/j.cmpb.2019.02.006. [Google Scholar] [PubMed] [CrossRef]
20. Souza JC, Diniz JOB, Ferreira JL, da Silva GLF, Silva AC, de Paiva AC. An automatic method for lung segmentation and reconstruction in chest X-ray using deep neural networks. Comput Methods Programs Biomed. 2019;177(5):285–96. doi:10.1016/j.cmpb.2019.06.005. [Google Scholar] [PubMed] [CrossRef]
21. Based Shuvo S. An automated end-to-end deep learning-based framework for lung cancer diagnosis by detecting and classifying the lung nodules. arXiv:2305.00046. 2023. [Google Scholar]
22. Alam SS, Shuvo SB, Ali SN, Ahmed F, Chakma A, Jang YM. Benchmarking deep learning frameworks for automated diagnosis of ocular toxoplasmosis: a comprehensive approach to classification and segmentation. IEEE Access. 2024;12(7):22759–77. doi:10.1109/access.2024.3359701. [Google Scholar] [CrossRef]
23. Boulares M, Alotaibi R, AlMansour A, Barnawi A. Cardiovascular disease recognition based on heartbeat segmentation and selection process. Int J Environ Res Public Health. 2021;18(20):10952. doi:10.3390/ijerph182010952. [Google Scholar] [PubMed] [CrossRef]
24. Koike T, Qian K, Kong Q, Plumbley MD, Schuller BW, Yamamoto Y. Audio for audio is better? An investigation on transfer learning models for heart sound classification. In: Proceedings of the 2020 42nd Annual Int. Conf. IEEE Eng. Med. Biol. Soc. (EMBC); 2020 Jul 20–24; Montreal, QC, Canada. p. 74–7. doi:10.1109/embc44109.2020.9175450. [Google Scholar] [PubMed] [CrossRef]
25. Singh SA, Majumder S, Mishra M. Classification of short unsegmented heart sound based on deep learning. In: Proceedings of the 2019 IEEE International Instrumentation and Measurement Technology Conference (I2MTC); 2019 May 20–23; Auckland, New Zealand. p. 1–6. [Google Scholar]
26. Demir F, Şengür A, Bajaj V, Polat K. Towards the classification of heart sounds based on convolutional deep neural network. Health Inf Sci Syst. 2019;7(1):1–9. doi:10.1007/s13755-019-0078-0. [Google Scholar] [PubMed] [CrossRef]
27. Goodfellow I, Bengio Y, Courville A. Deep learning. Cambridge, MA, USA: MIT Press; 2016. [Google Scholar]
28. Maharana K, Mondal S, Nemade B. A review: data pre-processing and data augmentation techniques. Global Transitions Proceedings. 2022;3(1):91–9. doi:10.1016/j.gltp.2022.04.020. [Google Scholar] [CrossRef]
29. Kotsiantis SB, Kanellopoulos D, Pintelas PE. Data preprocessing for supervised learning. Int J Comput Sci. 2006;1(2):111–7. [Google Scholar]
30. Shorten C, Khoshgoftaar TM. A survey on image data augmentation for deep learning. J Big Data. 2019;6(1):1–48. doi:10.1186/s40537-019-0197-0. [Google Scholar] [CrossRef]
31. Liu C, Springer D, Li Q, Moody B, Juan RA, Chorro FJ, et al. An open access database for the evaluation of heart sound algorithms. Physiol Meas. 2016;37(12):2181. doi:10.1088/0967-3334/37/12/2181. [Google Scholar] [PubMed] [CrossRef]
32. Bentley P, Nordehn G, Coimbra M, Mannor S, Getz R. The PASCAL classifying heart sounds challenge 2011 (CHSC2011) results [Internent]. [cited 2025 Jul 24]. Available from: http://www.peterjbentley.com/heartchallenge/index.html. [Google Scholar]
33. Yaseen, Son G-Y, Kwon S. Classification of heart sound signal using multiple features. Appl Sci. 2018;8(12):2344. doi:10.3390/app8122344. [Google Scholar] [CrossRef]
34. Alrabie S, Barnawi A. HeartWave: a multiclass dataset of heart sounds for cardiovascular diseases detection. IEEE Access. 2023;11:118722–36. doi:10.1109/access.2023.3325749. [Google Scholar] [CrossRef]
35. Barnawi A, Boulares M, Somai R. Simple and powerful PCG classification method based on selection and transfer learning for precision medicine application. Bioengineering. 2023;10(3):294. doi:10.3390/bioengineering10030294. [Google Scholar] [PubMed] [CrossRef]
36. Oh SL, Zhang Y, Sheikh Abdullah SNH, Acharya UR. Classification of heart sound signals using a novel deep WaveNet model. Entropy. 2020;22(9):920. doi:10.3390/e22090920. [Google Scholar] [CrossRef]
37. Lee J-A, Kwak K-C. Heart sound classification using wavelet analysis approaches and ensemble of deep learning models. Appl Sci. 2023;13(21):11942. doi:10.3390/app132111942. [Google Scholar] [CrossRef]
38. Bao X, Xu Y, Lam H-K, Trabelsi M, Chihi I, Sidhom L, et al. Time-frequency distributions of heart sound signals: a comparative study using convolutional neural networks. Biomed Eng Adv. 2023;5:100093. doi:10.1016/j.bea.2023.100093. [Google Scholar] [CrossRef]
39. Singh SA, Devi ND, Singh KN, Thongam K, Reddy B, Majumder S. An ensemble-based transfer learning model for predicting the imbalance heart sound signal using spectrogram images. Multimed Tools Appl. 2024;83(13):39923–42. doi:10.1007/s11042-023-17186-9. [Google Scholar] [CrossRef]
40. Chen J, Guo Z, Xu X, Zhang L-B, Teng Y, Chen Y, et al. A robust deep learning framework based on spectrograms for heart sound classification. IEEE/ACM Trans Comput Biol Bioinform. 2024;21(4):936–47. doi:10.1109/TCBB.2023.3247433. [Google Scholar] [PubMed] [CrossRef]
41. Das S, Ahsan SMM, Rahman M, Karim MS. A voting approach for heart sounds classification using discrete wavelet transform and CNN architecture. SN Comput Sci. 2024;5(2):251. doi:10.1007/s42979-023-02580-9. [Google Scholar] [CrossRef]
42. Marocchi G, Bianchi L, Rossi M, Simoni F. Abnormal heart sound classification and model interpretability: a transfer learning approach with deep learning. J Vasc Dis. 2023;2(4):215–27. doi:10.3390/jvd2040023. [Google Scholar] [CrossRef]
43. Li F, Liu M, Zhao Y, Kong L, Dong L, Liu X, et al. Feature extraction and classification of heart sound using 1D convolutional neural networks. EURASIP J Adv Signal Process. 2019;2019(1):1–11. doi:10.1186/s13634-019-0651-3. [Google Scholar] [CrossRef]
44. Li M, He Z, Wang H. Heart sound classification based on multi-scale feature fusion and channel attention module. Bioengineering. 2025;12(3):290. doi:10.3390/bioengineering12030290. [Google Scholar] [PubMed] [CrossRef]
45. Lilhore UK, Simaiya S, Alhussein M, Dalal S, Aurangzeb K, Hussain A. An attention-driven hybrid deep neural network for enhanced heart disease classification. Expert Syst. 2025;42(2):e13791. doi:10.1111/exsy.13791. [Google Scholar] [CrossRef]
46. Alrabie S, Barnawi A. Are artificial intelligence models listening like cardiologists? Bridging the gap between artificial intelligence and clinical reasoning in heart-sound classification using explainable artificial intelligence. Bioengineering. 2025;12(6):558. doi:10.3390/bioengineering12060558. [Google Scholar] [PubMed] [CrossRef]
47. Kalatehjari E, Hosseini MM, Harimi A, Abolghasemi V. Advanced ensemble learning-based CNN-BiLSTM network for cardiovascular disease classification using ECG and PCG signal. Biomed Signal Process Control. 2025;108(1):107846. doi:10.1016/j.bspc.2025.107846. [Google Scholar] [CrossRef]
48. Wang S, Hu J, Du Y, Yuan X, Xie Z, Liang P. WCFormer: an interpretable deep learning framework for heart sound signal analysis and automated diagnosis of cardiovascular diseases. Expert Syst Appl. 2025;276:127238. doi:10.1016/j.eswa.2025.127238. [Google Scholar] [CrossRef]
49. Han J, Shaout A. ENACT-Heart–ENsemble-based assessment using CNN and transformer on heart sounds. 2025. arXiv:2502.16914. [Google Scholar]
50. Alqudah AM, Alquran H, Qasmieh IA. Classification of heart sound short records using bispectrum analysis approach images and deep learning. Netw Model Anal Health Inform Bioinform. 2020;9(1):1–16. doi:10.1007/s13721-020-00272-5. [Google Scholar] [CrossRef]
51. Ghosh SK, Ponnalagu RN, Tripathy RK, Acharya UR. Automated detection of heart valve diseases using chirplet transform and multiclass composite classifier with PCG signals. Comput Biol Med. 2020;118(5):103632. doi:10.1016/j.compbiomed.2020.103632. [Google Scholar] [PubMed] [CrossRef]
52. Baghel N, Dutta MK, Burget R. Automatic diagnosis of multiple cardiac diseases from PCG signals using convolutional neural network. Comput Methods Programs Biomed. 2020;197(12):105750. doi:10.1016/j.cmpb.2020.105750. [Google Scholar] [PubMed] [CrossRef]
53. Deperlioglu O, Kose U, Gupta D, Khanna A, Sangaiah AK. Diagnosis of heart diseases by a secure internet of health things system based on autoencoder deep neural network. Comput Commun. 2020;162(4):31–50. doi:10.1016/j.comcom.2020.08.011. [Google Scholar] [PubMed] [CrossRef]
54. Deng M, Meng T, Cao J, Wang S, Zhang J, Fan H. Heart sound classification based on improved MFCC features and convolutional recurrent neural networks. Neural Netw. 2020;130(1):22–32. doi:10.1016/j.neunet.2020.06.015. [Google Scholar] [PubMed] [CrossRef]
55. Krishnan PT, Balasubramanian P, Umapathy S. Automated heart sound classification system from unsegmented phonocardiogram (PCG) using deep neural network. Phys Eng Sci Med. 2020;43(2):505–15. doi:10.1007/s13246-020-00851-w. [Google Scholar] [PubMed] [CrossRef]
56. Warrens MJ, van der Hoef H. Understanding the adjusted rand index and other partition comparison indices based on counting object pairs. J Classif. 2022;39(3):487–509. doi:10.1007/s00357-022-09413-z. [Google Scholar] [CrossRef]
57. Davies DL, Bouldin DW. A cluster separation measure. IEEE Trans Pattern Anal Mach Intell. 1979;PAMI-1(2):224–7. doi:10.1109/TPAMI.1979.4766909. [Google Scholar] [CrossRef]
58. Calinski T, Harabasz J. A dendrite method for cluster analysis. Commun Stat. 1974;3(1):1–27. doi:10.1080/03610927408827101. [Google Scholar] [CrossRef]
59. Rousseeuw PJ. Silhouettes: a graphical aid to the interpretation and validation of cluster analysis. J Comput Appl Math. 1987;20:53–65. doi:10.1016/0377-0427(87)90125-7. [Google Scholar] [CrossRef]
60. Shutaywi M, Kachouie NN. Silhouette analysis for performance evaluation in machine learning with applications to clustering. Entropy. 2021;23(6):759. doi:10.3390/e23060759. [Google Scholar] [PubMed] [CrossRef]
61. Alrabie S, Boulares M, Barnawi A. An efficient framework to build up heart sounds and murmurs datasets used for automatic cardiovascular diseases classifications. In: Enabling machine learning applications in data science. Cham, Switzerland: Springer; 2021. p. 17–27 doi:10.1007/978-981-33-6129-4_2. [Google Scholar] [CrossRef]
62. Hoult DI, Richards RE. The signal-to-noise ratio of the nuclear magnetic resonance experiment. J Magn Reson (1969). 1976;24(1):71–85. doi:10.1016/0022-2364(76)90233-X. [Google Scholar] [CrossRef]
63. Janson R. Review of complexes. A simplified approach to electrocardiography. Philadelphia, PA, USA: WB Saunders Company; 1986. [Google Scholar]
64. Alrabie S, Barnawi A. Evaluation of pre-trained CNN models for cardiovascular disease classification: a benchmark study classification: a benchmark study. Inf Sci Lett. 2023;12(7):3317–38. doi:10.18576/isl/120755. [Google Scholar] [CrossRef]
65. Keras Team. Keras applications documentation [Internet]. [cited 2024 Feb 10]. Available from: https://keras.io/api/applications/. [Google Scholar]
66. Sandler M, Howard A, Zhu M, Zhmoginov A, Chen L-C. MobileNetV2: Inverted residuals and linear bottlenecks. In: Proceedings of the IEEE Conference on Computer Vision and Pattern Recognition; 2018 Jun 18–23; Salt Lake City, UT, USA. p. 4510–20. [Google Scholar]
67. He K, Zhang X, Ren S, Sun J. Deep residual learning for image recognition. In: Proceedings of the IEEE Conference on Computer Vision and Pattern Recognition; 2016 Jun 27–30; Las Vegas, NV, USA. p. 770–8. [Google Scholar]
68. Sokolova M, Lapalme G. A systematic analysis of performance measures for classification tasks. Inf Process Manag. 2009;45(4):427–37. doi:10.1016/j.ipm.2009.03.002. [Google Scholar] [CrossRef]
69. Unnikrishnan B, Singh PR, Yang X, Chua MCH. Semi-supervised and unsupervised methods for heart sounds classification in restricted data environments. arXiv:2006.02610. 2020. [Google Scholar]
70. Nogueira DM, Ferreira CA, Jorge AM. Classifying heart sounds using images of MFCC and temporal features. In: Progress in Artificial Intelligence: 18th EPIA Conference on Artificial Intelligence, EPIA 2017. Cham, Switzerland: Springer; 2017. p. 186–203. [Google Scholar]
71. Ortiz JJG, Phoo CP, Wiens J. Heart sound classification based on temporal alignment techniques. In: 2016 Computing in Cardiology Conference (CinC); 2016 Sep 11–14; Vancouver, BC, Canada. p. 589–92. [Google Scholar]
Cite This Article
 Copyright © 2025 The Author(s). Published by Tech Science Press.
This work is licensed under a Creative Commons Attribution 4.0 International License , which permits unrestricted use, distribution, and reproduction in any medium, provided the original work is properly cited.
 Downloads
 Citation Tools