
 Submit a Paper
 Propose a Special lssue
 Open Access
ARTICLE
Developing Hybrid XGBoost Model to Predict the Strength of Polypropylene and Straw Fibers Reinforced Cemented Paste Backfill and Interpretability Insights
1 School of Resources and Safety Engineering, Central South University, Changsha, 410083, China
2 Universidad Politécnica de Madrid–ETSI Minas y Energía, Ríos Rosas 21, Madrid, 28003, Spain
3 Department of Civil and Environmental Engineering, Politecnico Di Milano, Piazza Leonardo da Vinci, 32, Milano, 20133, Italy
* Corresponding Author: Enming Li. Email:
Computer Modeling in Engineering & Sciences 2025, 144(2), 1607-1629. https://doi.org/10.32604/cmes.2025.068211
Received 23 May 2025; Accepted 28 July 2025; Issue published 31 August 2025
 View Full Text
 Download PDF
Abstract
With the growing demand for sustainable development in the mining industry, cemented paste backfill (CPB) materials, primarily composed of tailings, play a crucial role in mine backfilling and underground support systems. To enhance the mechanical properties of CPB materials, fiber reinforcement technology has gradually gained attention, though challenges remain in predicting its performance. This study develops a hybrid model based on the adaptive equilibrium optimizer (adap-EO)-enhanced XGBoost method for accurately predicting the uniaxial compressive strength of fiber-reinforced CPB. Through systematic comparison with various other machine learning methods, results demonstrate that the proposed hybrid model exhibits excellent predictive performance on the test set, achieving a coefficient of determination (R2) of 0.9675, root mean square error (RMSE) of 0.6084, and mean absolute error (MAE) of 0.4620. Input importance analysis reveals that cement-tailings ratio, curing time, and concentration are the three most critical factors affecting material strength, with cement-tailings ratio showing a positive correlation with strength, concentrations above 70% significantly improving material strength, and curing periods beyond 28 days being essential for strength development. Fiber parameters contribute secondarily but notably to material strength, with fiber length exhibiting an optimal range of approximately 12 mm. This study not only provides a high-precision strength prediction model but also reveals the inherent correlations between various parameters and material performance, offering scientific basis for mixture optimization and engineering applications of fiber-reinforced CPB materials.Keywords
During the mining process, a variety of waste materials can be generated, depending on the type of mining, such as tailings, waste rock, mine water and chemical residuals. For the disposal of tailings, the cemented paste backfill (CPB) is a kind of effective and sustainable method because it can reduce the stacking and storage of tailings [1–3]. The main function of CPB is to consume tailings and provide support for working faces to facilitate mining operations. The uniaxial compressive strength (UCS) is a significant indicator to assess the CPB goodness [4].
Traditionally, the UCS of CPB is measured through destructive testing, where CPB slurry is cast into molds and cured for various durations before being subjected to mechanical loading. However, this kind of approach needs to wait for curation time and delays mining operations for long-time curation specimen. To expedite strength assessment, non-destructive testing methods such as electrical resistivity and ultrasonic pulse velocity have been explored [5–8]. Although non-destructive testing methods are effective in some contexts, their performance is often influenced by material anisotropy and moisture content, leading to inconsistencies. Moreover, these methods primarily capture surface-level properties and struggle to account for the complex and nonlinear relationships between mix design parameters and UCS.
In contrast, artificial intelligence-based models can learn from historical data and model multi-factor interactions [9–12]. In addition, they can provide rapid and lower-cost predictions, making them a promising alternative or complement to traditional testing methods of CPB factors [13–15]. For instance, Yu et al. (2023) [16] developed a neural network optimized by particle swarm optimization to predict strength degradation of cement-based materials under sulphate attack, using key mix and exposure parameters. Results show superior performance over traditional models, offering a promising tool for assessing residual strength in marine environments. Yu et al. (2025) [17] employed an improved whale optimization algorithm enhances gaussian process regression performance for predicting self-compacting concrete compressive strength, outperforming other models with higher accuracy and robustness. Sensitivity analysis highlights the water-to-binder ratio as the most influential input factor. Moreover, there are also some applications in the prediction of CPB strength. Qi et al. (2018) [18] integrated boosted regression trees and particle swarm optimization to predict unconfined compressive strength based on 585 unconfined compressive strength tests with different proportioning schemes. Some physical and chemical properties of tailings, the cement-tailings ratio, the solid content and the curing time were adopted to be inputs. The R value was used to evaluate the performance of the proposed model and the testing set could reach 0.93 correlation coefficient (R) value. Liu et al. (2020) [19] conducted 870 hydraulic servo tests to obtain the UCS of CPB specimens and employed seven machine learning techniques to establish the intelligent CPB strength predictive models. It can be found that support vector regression, random forest, back-propagation and decision tree models show better performance than k-nearest neighbors, mixed logistic regression and logistic regression. Guo et al. (2025) [20] developed a particle swarm optimization-optimized eXtreme Gradient Boosting (XGBoost) model to predict the UCS of CPB containing coarse aggregate. The model achieves excellent performance (R2), with predicted values closely matching actual results. Feature importance analysis identifies the cement-sand ratio as the most influential factor, followed by curing age, slurry concentration, and coarse aggregate ratio. The model significantly reduces the UCS testing cycle while maintaining high accuracy. Adiguzel Tuylu et al. (2025) [21] investigated the potential of several machine learning (ML) algorithms to predict the UCS of CPB with various fly ash substitutions. Using data from laboratory tests, models including XGBoost, random forest, artificial neural networks, and linear regression were trained and evaluated. Among them, XGBoost achieved the highest accuracy (R = 0.922). Ngo et al. (2023) [22] used ML models, including XGBoost, random forest, and hybrid approaches with particle swarm optimization and hill climbing, to predict the UCS of CPB. 359 samples were trained. XGBoost achieved the best performance (R2 = 0.9889). SHapley Additive exPlanations (SHAP) and partial dependence plots revealed that cement/tailing ratio, curing age, solid content, and Fe2O3 content most significantly affect UCS. The approach offered better mix design decisions for CPB in mining. Qi et al. (2023) [23] developed a deep neural network (DNN) model to predict the UCS of CPB using a global dataset of 986 samples. The model incorporated 14 input features and achieved high accuracy (R = 0.967 on the test set). Feature importance analysis showed that the cement–tailings ratio, mass concentration, and curing time are the most influential parameters. The DNN model significantly reduces time and cost in UCS estimation, promoting sustainable tailings utilization in mining operation.
In addition, to improve the mechanical strength of CPB and prevent its cracking, some fiber-reinforced CPB are developed [24–26]. Meanwhile, some intelligent prediction models are also established. For instance, Li et al. (2021) [4] employed support vector regression and meta-heuristic algorithms to predict the fiber-reinforced UCS of CPB. The predicted results indicated that meta-heuristic algorithms performed better than grid search method. The salp swarm algorithm was more helpful to optimize the hyper-parameters in support vector regression and could produce 0.9475 coefficient of determination (R2) value for the testing set. Yu et al. (2021) [27] combined extreme learning machine and salp swarm algorithm to predict the UCS of fiber-reinforced CPB from 720 UCS tests. The predicted results indicated that the optimized extreme learning machine predictive model outperformed than artificial neural network, support vector regression and none-optimized extreme learning machine method and could achieve 0.9494 R for the testing set.
These studies proposed various intelligent and fast prediction scenarios to the CPB strength. However, the studies about the prediction of fiber-reinforced CPB strength are still rare. In addition, current investigations about fiber-reinforced CPBs fail to provide interpretable insights for the variable contribution to the prediction model development [4,27]. To address these research gaps, this study presents the following contributions. An adaptive Equilibrium Optimizer (adap-EO) is constructed by incorporating fitness-based random dispersion mechanisms and dual-parameter control strategies, which enhances the global search capability. Building upon this foundation, a hybrid adap-EO-XGBoost predictive framework is established, demonstrating superior predictive accuracy for uniaxial compressive strength of fiber-reinforced CPB. Furthermore, comprehensive interpretability analysis through SHAP (SHapley Additive exPlanations) methodology reveals the underlying relationships between fiber parameters and material strength. These methodological contributions advance the understanding of fiber-reinforced CPB behavior and offer practical guidance for sustainable mining applications through both enhanced prediction accuracy and improved model interpretability.
2.1 Adaptive Equilibrium Optimizer Method
The Equilibrium Optimizer (EO), which serves as the foundation of this research methodology, draws inspiration from the physical principles of mass and volume balance control in natural systems. The EO algorithm simulates a natural control volume system in which particles approach equilibrium by adjusting their concentrations [28]. The initialization process employs a uniform random distribution to generate the initial population:
where rand is a random vector with values in the range [0, 1], Cmin represents the lower limit of particle concentration, and Cmax represents the upper limit of particle concentration. In EO, each particle navigates by referencing a candidate pool of equilibrium states consisting of the current four best particles and their arithmetic mean, thereby guiding the search process toward a potential global optimum [28,29]. This equilibrium state candidate pool and the concentration update mechanism can be expressed as:
where Ceq is the particle concentration randomly selected from the equilibrium pool; G is the generation factor representing the current iteration stage; F is an exponential term used to control global and local search behaviors; V is a constant set to 1; λ is a random number introduced to create disturbance; Ceq1, Ceq2, Ceq3, Ceq4 are the concentrations of the four best-performing particles in the current population; and Ceq(avg) is the average value of these four particles. In EO, parameters F and G are primarily used to adjust the exploration and exploitation processes, calculated as follows:
where a1 is a constant, r1 and r2 represent random vectors between [0, 1], and GCF and GP denote the generation rate control factor and generation probability, respectively.
The EO method has received widespread attention due to its strong performance in numerical optimization and engineering design [30]. However, when dealing with complex optimization tasks, EO still exhibits insufficient exploration and is prone to becoming trapped in local optimum. To overcome these deficiencies, this paper constructs an adaptive EO method (adap-EO) that enhances search agent performance by introducing an intelligent dispersion mechanism [31]. The main improvements are as follows:
(1) Introduction of a fitness-based random dispersion mechanism that triggers a random dispersion strategy when a search agent’s fitness falls below the group average:
where fitavg(iter) represents the average fitness value of all search agents in the iter-th iteration:
(2) The adap-EO optimizes the construction method of the equilibrium candidate pool by dynamically selecting the best search agents through a sorting function:
(3) The adap-EO improves the calculation method of the exponential term by introducing a dual-parameter control mechanism:
where a1 is used to control exploration intensity and a2 is used to control exploitation efficiency, enabling adap-EO to adaptively adjust the balance between exploration and exploitation during the iteration process.
In summary, adap-EO effectively enhances EO’s global search capability and reduces the risk of becoming trapped in local optima through multiple improvements, including a fitness-based random dispersion mechanism, optimized equilibrium candidate pool construction, and dual-parameter-controlled exploration-exploitation balance. This provides a more effective solution tool for complex optimization problems [31].
To comprehensively evaluate the predictive performance of the proposed model, this study utilized four metrics for quantitative assessment: Root Mean Square Error (RMSE), coefficient of determination (R2), Overall Index (OI), and Mean Absolute Error (MAE). These metrics reflect the degree of agreement between predicted and actual values from different perspectives, providing a scientific basis for objective evaluation of model performance [32–34]. Among them, RMSE is a commonly used indicator for assessing prediction model accuracy, with smaller values indicating higher model prediction precision; R2 is an important measure of model goodness of fit, with values closer to 1 indicating stronger predictive capability; OI is a composite indicator that integrates multiple evaluation criteria, with higher OI values indicating better comprehensive performance; MAE has lower sensitivity to outliers compared to RMSE, providing an alternative measurement of prediction error. The specific calculation formulas for these metrics are as follows:
where yi represents the actual CPB strength value, ŷi represents the CPB strength value predicted by the model, EC represents the efficiency coefficient, n represents the corresponding sample size, and y represents the average of the actual CPB strength values.
3 Data Collection and Description
The whole experiment was conducted in Fankou Lead-Zinc Mine which is located in Shaoguan, Guangdong province of China, shown as Fig. 1. Currently, the filling aggregates used in the Fankou Lead-Zinc Mine mainly come from three sources: fine tailings, classified tailings, and rod-milled sand. Rod-milled sand consists of coarse particles (less than 3 mm in size) obtained by rod milling underground waste rock and is mainly used in combination with classified tailings. Classified tailings are the filter cakes obtained after desliming the raw tailings with a cyclone (particles larger than 0.019 mm) and filtering them using a ceramic filter. The fine tailings are the filter cakes produced by filtering the overflow (particles smaller than 0.019 mm) from the cyclone classification of the raw tailings using a bag filter. Among these filling aggregates, the classified tailings are used widely in the mine because they can contribute better strength performance. The fine tailings result in poor consolidation and reduced mechanical strength of the backfill body, which may compromise the stability of underground structures. As a result, every year, there is a surplus of tailings at the Fankou Lead-Zinc Mine, with most of the excess tailings being discharged into the tailing reservoir. Therefore, to improve the utilization efficiency of tailings and mitigate the negative impact on the environment, the tailings used for making CPB specimens are collected from ore processing plants without filtration and sedimentation process.
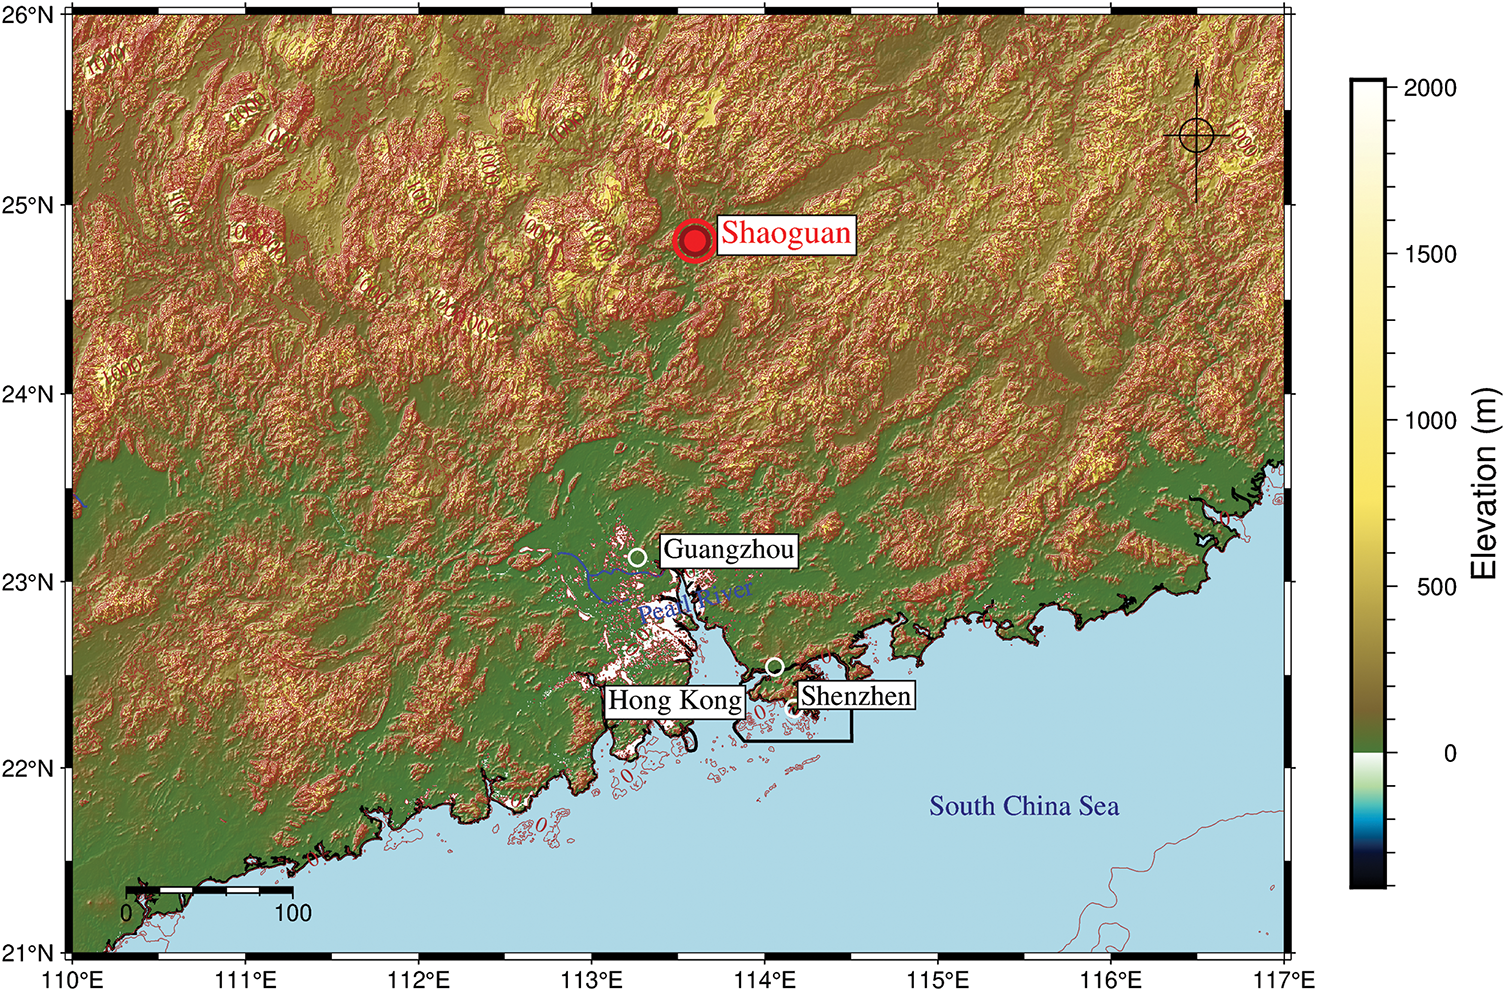
Figure 1: General location of Fankou Lead-Zinc Mine (outlined by a red circle)
In this study, a database which contains 144 UCS tests was used [4], in which 44 specimens are reinforced by fibers: 36 specimens are with straw fibers and 8 specimens are added with polypropylene (PP) fibers. To characterize the properties of fibers, three parameters are used, i.e., fiber length (Fl), weight (Fw) and tensile strength (Fs), see Table 1. In addition to fiber properties, other five CPB parameters are also considered, i.e., cement-tailings ratio (CT), concentration (Co), curing time (T) and cement 28-day minimum strength of cement (S). The cement-tailings ratio was designed to be 1:2, 1:3, 1:4, 1:5, 1:6, 1:8, and 1:10. The concentration included 66%, 68%, 70%, 72% and 73%. The curing time were 3, 7 and 28 days. Two kinds of cement were selected, i.e., Fankou Dachang cement and Portland 42.5 R cement. These factors were combined to meet different mining operations. The general data distribution of influencing factors and measured UCS value have been demonstrated in Fig. 2, where the number of occurrences in a given frequency bin can be reflected.
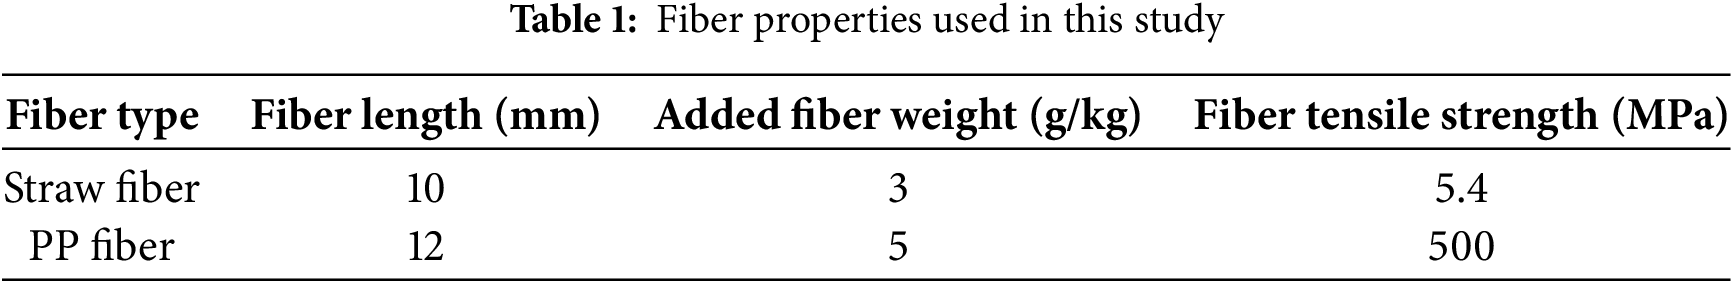
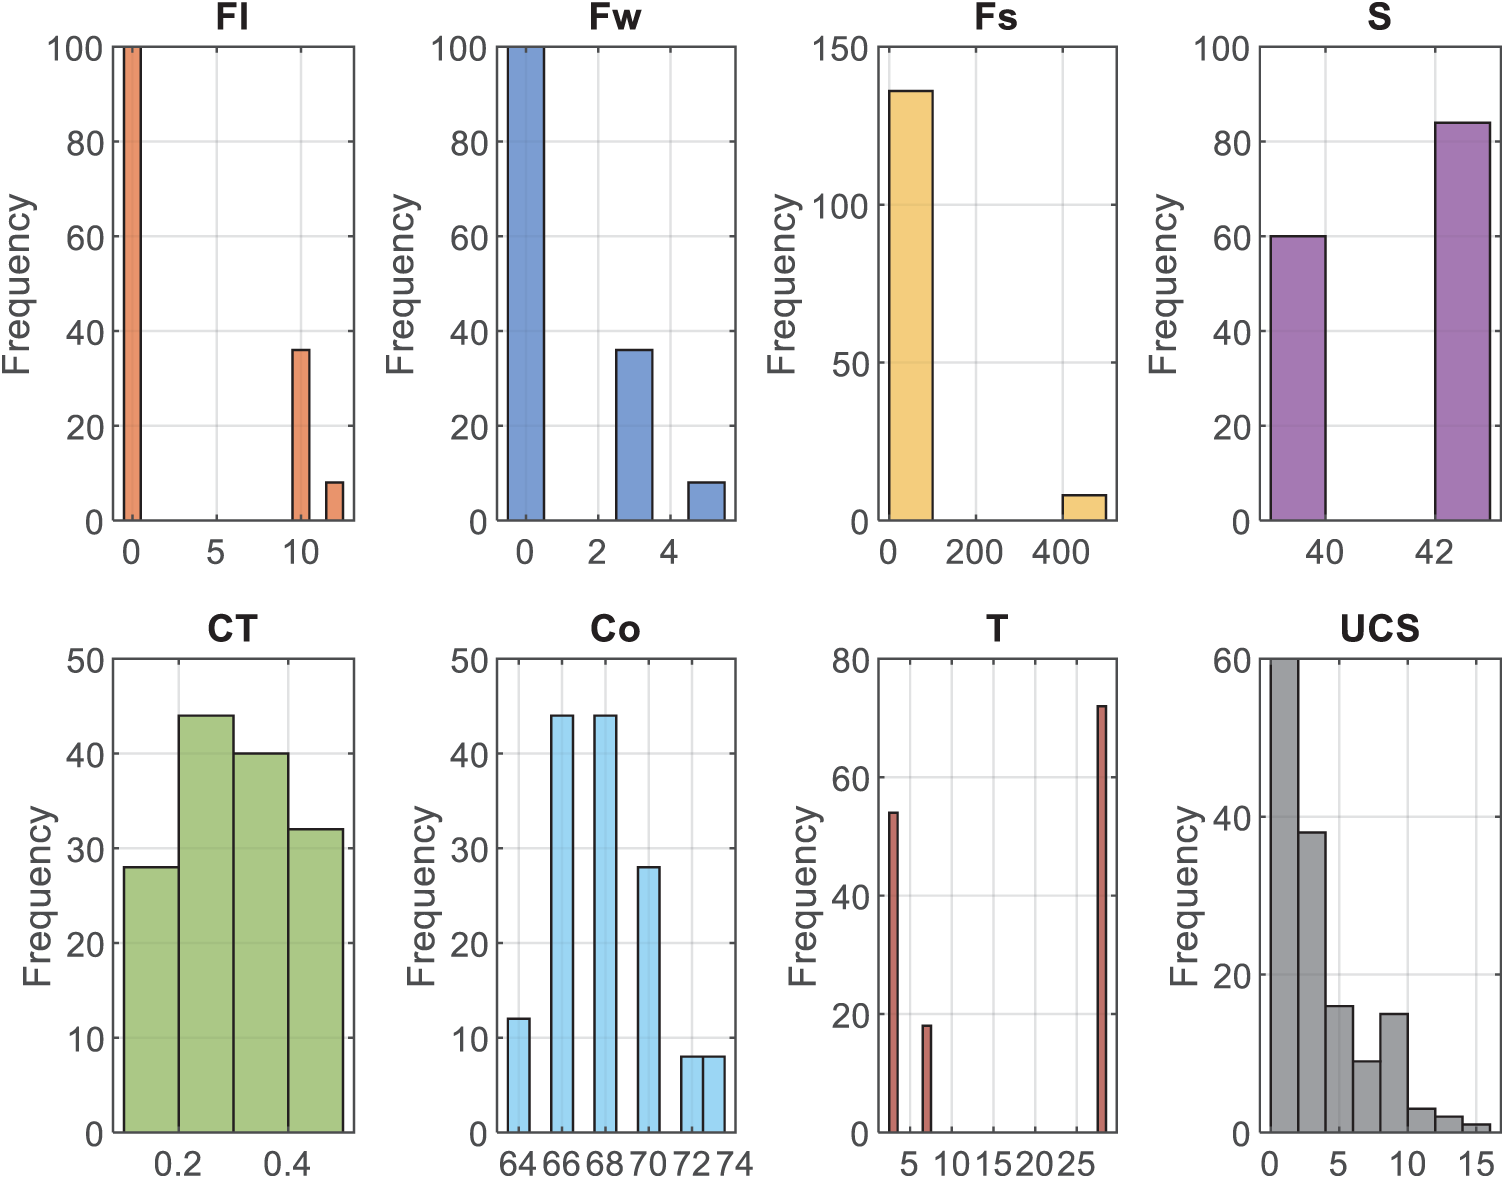
Figure 2: Data distribution of influential factors and UCS
To measure the correlation between different influential factors and UCS of CPB specimens, distance correlation [35] was employed. Distance correlation aims to capture nonlinear and arbitrarily shaped relationships between variables. The calculated results have been shown by heat map and the higher value means the stronger correlation in Fig. 3. According to the distance correlation results, it can be found that the curation time has the strongest correlation with UCS and the cement strength has the lower correlation with UCS. The cement strength has the lowest correlation with UCS. It is noted that a high degree of correlation exists between the three fiber-related variables. However, removing any fiber factor during the model development process, no significant improvement in predictive performance was observed. Therefore, to enhance the model interpretability and fully explore the influence of fiber factors, all of them were retained as inputs. Finally, to develop the prediction model of fiber-reinforced CPB strength, the whole dataset was divided into training set and testing set with the ratio of 8:2. The training set is used to establish the prediction model and the testing set wouldn’t participate in the model establishment and use for validating the model generalization.
Figure 3: Distance correlation between influential factors and UCS
4 Construction of CPB Strength Model
In the machine learning modeling process, it is typically necessary to select from multiple learners. Such comparisons should consider the consistent performance of different models across multiple data partitions, determining through comparison whether a particular model significantly outperforms other candidates overall. To this end, this paper introduces non-parametric statistical methods to ensure the statistical robustness and scientific validity of the comparison process. Among these, the Friedman test is a rank-based non-parametric method suitable for handling multi-group comparison problems in repeated measurements or paired data. Its basic principle is that if multiple models perform similarly across multiple experiments, their average ranks should be close; conversely, significant differences in average ranks indicate that at least some models perform significantly differently [36]. The original Friedman statistic is defined as follows:
where Nt is the number of datasets, λ is the number of learners, and Rj represents the average rank of the j-th model across all data partitions. For small sample sizes, to improve the accuracy of the test, Iman and Davenport (1980) [37] proposed a modified version, formulated as follows:
If the Friedman test result is significant, indicating that there is a statistically significant performance difference between at least one pair of models, the Nemenyi test is further applied to determine critical differences (CD) between models, calculated as follows:
where qα is the critical value based on the significance level.
Before establishing the prediction model, to evaluate the applicability of different machine learning methods in predicting the strength of fiber-reinforced CPB materials, eight mainstream learners, namely Multilayer Perceptron (MLP) [38], Support Vector Machine (SVM) [39], k-Nearest Neighbors (KNN) [40], Light Gradient Boosting Machine (LGBM) [41], Decision Tree (DT) [42], Random Forest [43], eXtreme Gradient Boosting (XGBoost) [20] and Categorical Boosting (CatBoost) [44], were selected as candidate regression methods. To ensure the stability and generalizability of the evaluation results, a multiple repetition experimental approach was adopted, systematically testing the performance of each model on multiple data subsets, with error scores as the performance evaluation metric. Specifically, in each experiment, the error performance of various models under different data partitions was recorded, ranked according to error magnitude, and finally, the average ranks across all experiments were calculated to obtain the relative performance ordering of each model overall. Fig. 4 illustrates the distribution of average ranks for each candidate model across multiple experiments and the analysis of their statistically significant differences. The upper part of the distribution graph reflects the error distribution of each model, while the lower part of the difference graph further reveals the significant relationships between models.
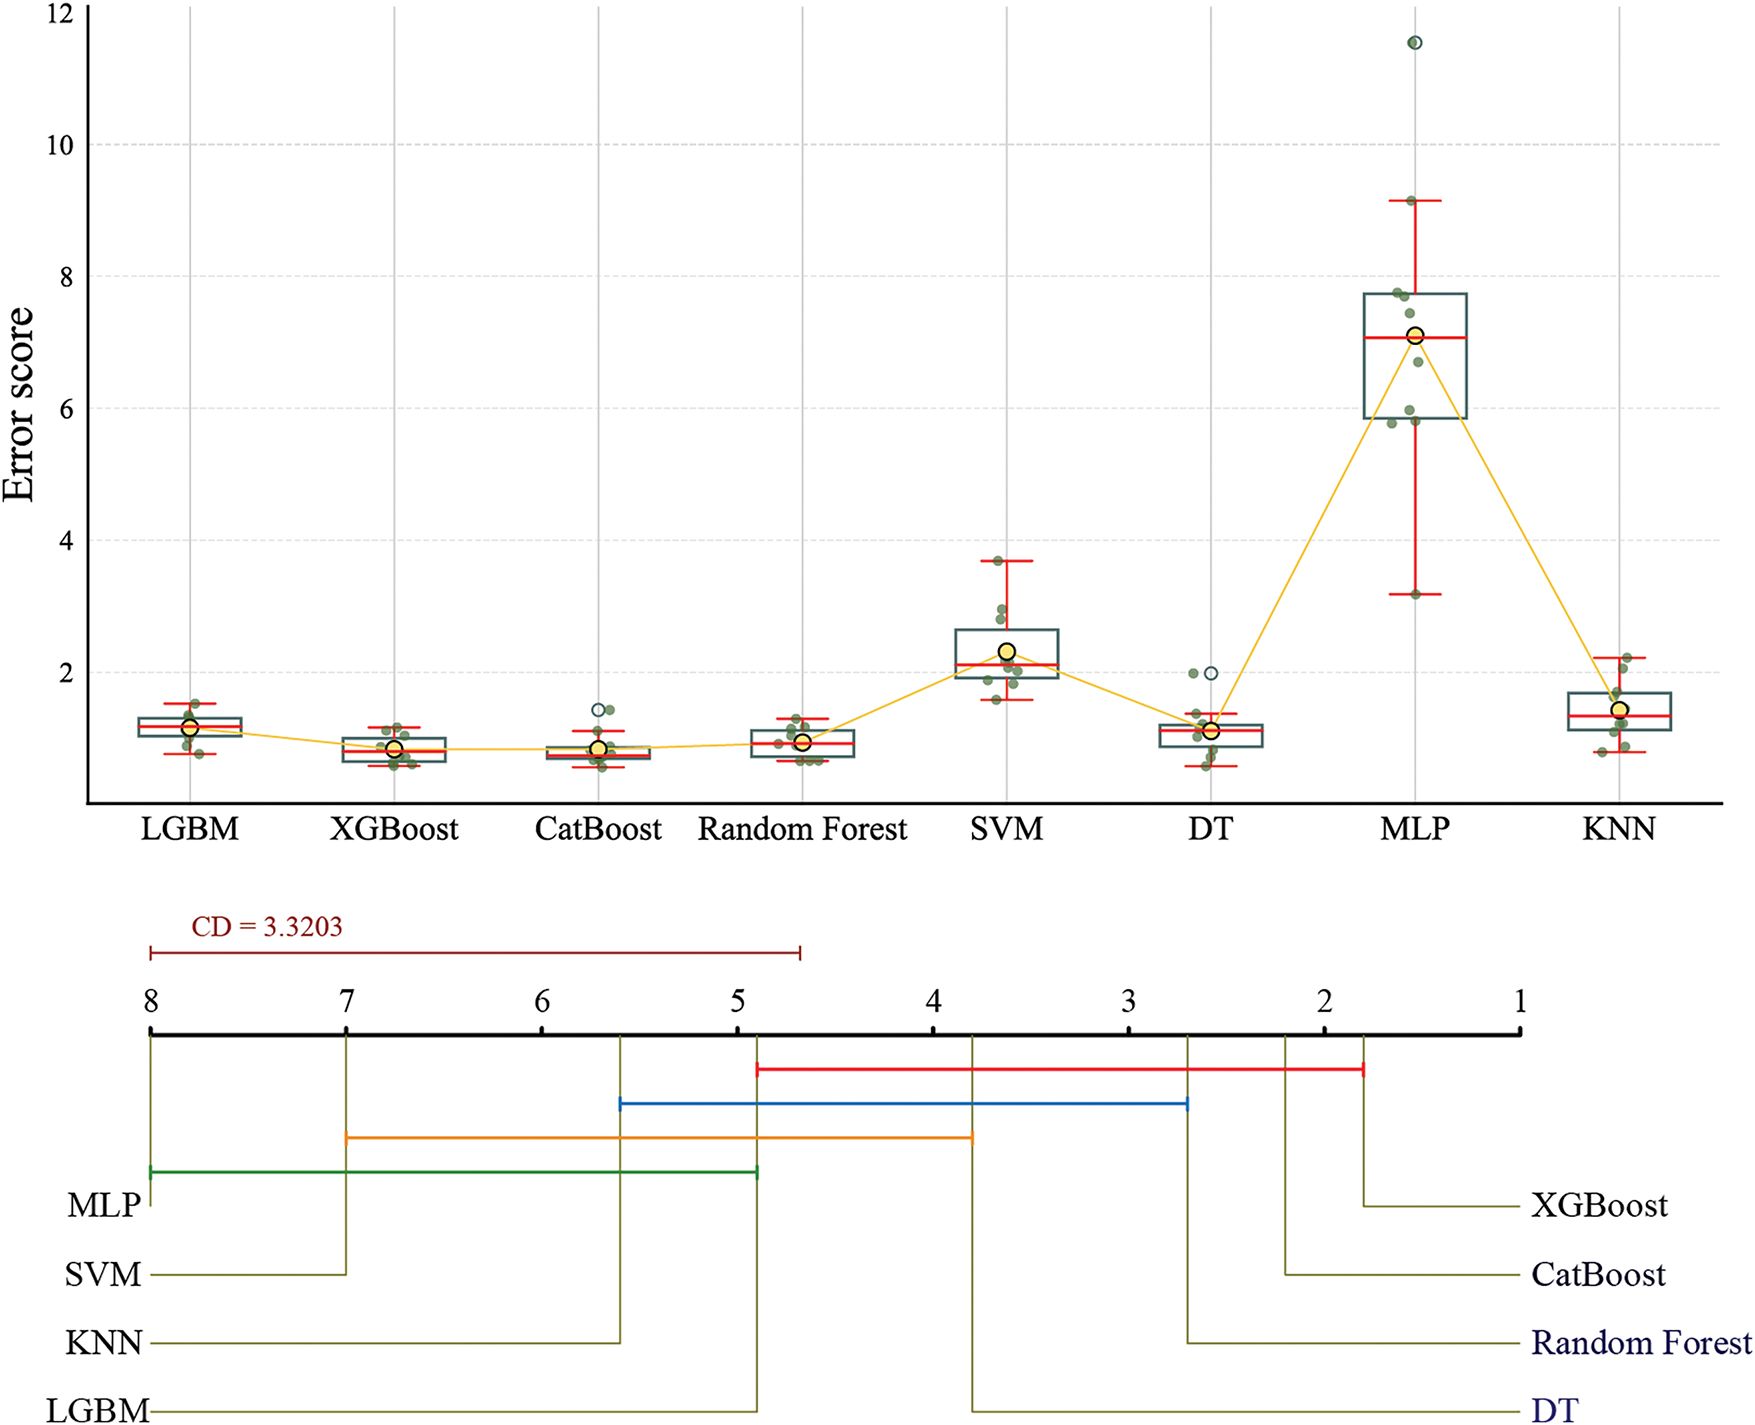
Figure 4: Performance comparison of ML models for CPB strength prediction
From the figure, it can be observed that XGBoost’s average rank is positioned at the leftmost, indicating its excellent performance in most experiments with relatively low error levels. More importantly, the difference in average ranks between XGBoost and models such as SVM, MLP, KNN, and LGBM exceeds the significance threshold, indicating statistically significant differences between these models. Additionally, XGBoost also demonstrates excellent error stability, with a relatively small fluctuation range in the box plot and fewer outliers, further proving the higher consistency and reliability of its prediction results. Based on the above analysis, XGBoost was determined to be the optimal benchmark model for predicting CPB strength performance in this study.
4.2 Performance Evaluation of the Adap-EO Method
To verify the optimization capability and stability of the constructed adap-EO method in predicting the strength of reinforced cemented paste backfill materials, this study conducted a systematic comparison with the classical EO, Particle Swarm Optimization (PSO), and Artificial Bee Colony (ABC) algorithms. Considering that this method will ultimately be integrated into the XGBoost model for hyperparameter optimization of multi-dimensional nonlinear problems, the assessment of its search precision, convergence speed, and global optimization capability is particularly crucial.
To ensure comprehensive and scientific evaluation, as shown in Table 2, this paper selected six standard test functions widely used in meta-heuristic algorithm research [45,46]. These functions cover different optimization scenarios from smooth unimodal to complex multimodal, effectively simulating various problem complexities that may be encountered in actual material strength performance prediction. This process not only helps assess the theoretical performance advantages of adap-EO but also establishes a foundation for its application in subsequent hybrid models.
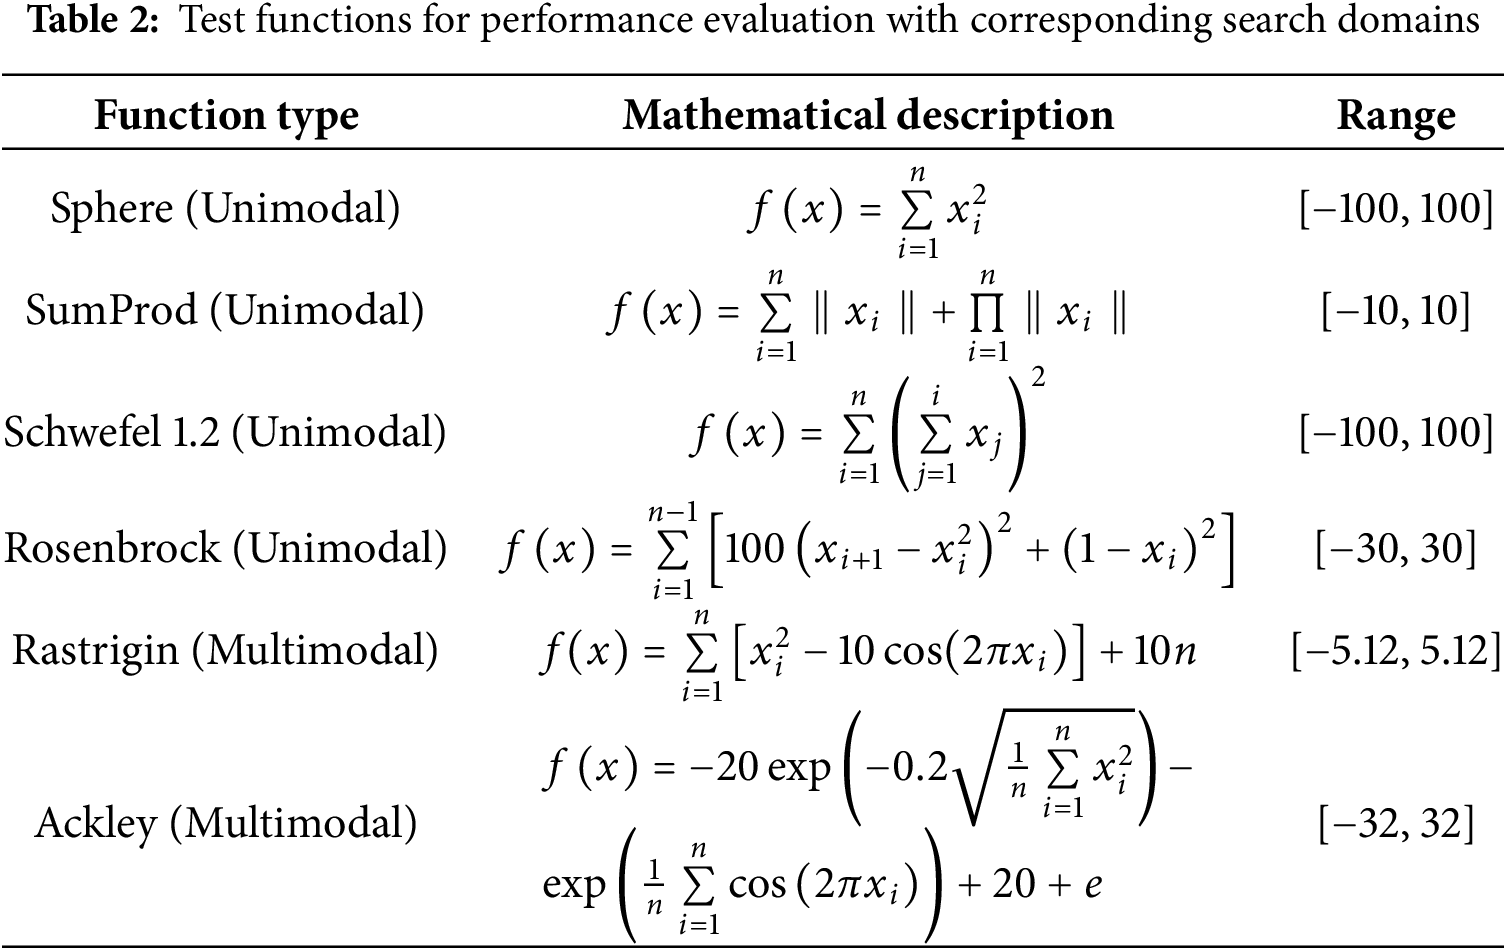
To systematically evaluate the optimization capability of the adap-EO algorithm from multiple dimensions, these functions encompass a wide range of scenarios from low-dimensional smooth functions to complex high-dimensional multimodal functions. They are divided into two categories: unimodal functions to measure the algorithm’s local search capability and convergence speed, and multimodal functions to primarily examine its ability to escape local optima and perform global searches [31]. The selected unimodal functions include Sphere, SumProd, Schwefel 1.2, and Rosenbrock functions, which have clear global optima and progressive search difficulties, effectively testing differences in convergence efficiency between algorithms. For the multimodal category, Rastrigin and Ackley functions with multiple local extrema were selected; these functions feature highly nonlinear characteristics, significant noise disturbances, and complex search spaces, making them ideal tools for testing algorithm robustness and global optimization capability. All test functions were evaluated within appropriate search ranges to ensure the challenge and representativeness of the tests. This combination of test functions provides a solid foundation for comprehensive evaluation of algorithm performance [47].
As shown in Fig. 5, the experimental results include three-dimensional visualizations of each test function and corresponding convergence curves. The performance of each algorithm during the optimization process can be clearly observed from the convergence curves. For all test functions, the adap-EO method demonstrated excellent convergence performance. Particularly in the first 20 iterations, the convergence speed of the adap-EO method was significantly faster than the other three algorithms. This advantage was especially evident in unimodal functions such as Sphere, SumProd, and Schwefel 1.2, where adap-EO could quickly approach the global optimum. When handling complex functions with long, curved valleys like the Rosenbrock function, adap-EO also exhibited superiority, with its fitness value decreasing much faster than PSO and ABC algorithms, and the final fitness value was also lower than the standard EO method. For multimodal functions like Rastrigin and Ackley with multiple local optima, the adap-EO method could effectively avoid being trapped in local optima and find near-global optimal solutions within relatively fewer iterations. Particularly with the Ackley function, adap-EO could achieve lower fitness values after approximately 10 iterations, while other algorithms required more iterations to reach similar levels.
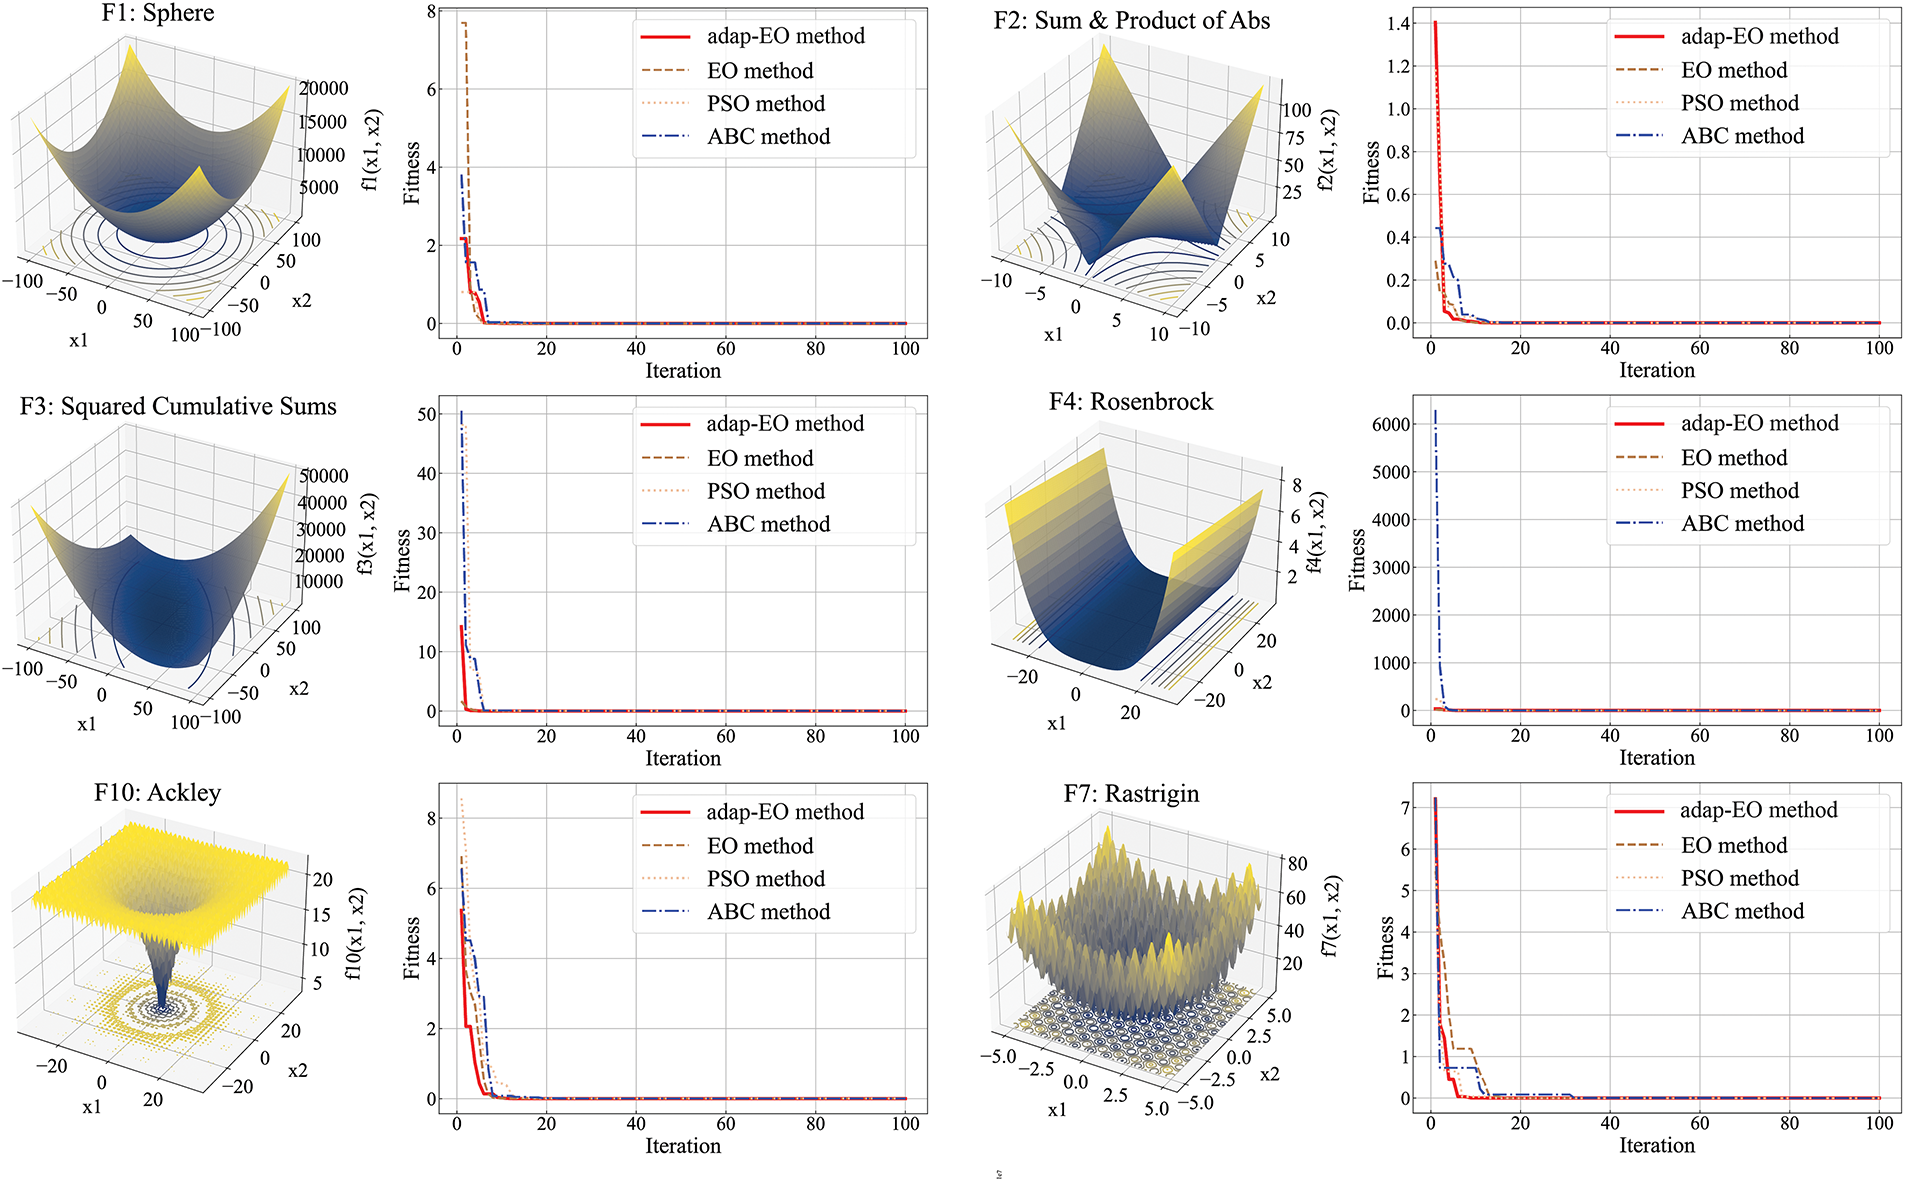
Figure 5: Performance comparison of optimization methods
Overall, the experimental results indicate that the adap-EO method outperforms traditional EO, PSO, and ABC algorithms in both convergence speed and final optimization quality. This advantage has been verified across various test functions, demonstrating the method’s strong robustness and broad applicability. These results provide strong support for subsequently applying adap-EO in the development and optimization of hybrid models.
4.3 Development and Optimization of the Hybrid Model
In the aforementioned experiments, the advantages of the adap-EO method have been verified, demonstrating its potential in improving model prediction accuracy. Therefore, this section combines adap-EO with the XGBoost model, aiming to address more complex prediction problems, particularly for the strength prediction of fiber-reinforced CPB materials. As a powerful ensemble learning method, XGBoost can effectively handle high-dimensional, nonlinear problems. To optimize its performance, this study selected three key hyperparameters—number of base learners (n_estimators), learning rate, and subsample ratio—as optimization targets. In the optimization process of adap-EO method, there are two key parameters which influence the optimization performance, i.e., the population size and iteration number. A large population size can greatly increase the computational time. On the other hand, a very small population may cause instability in fitness evaluations because it cannot fully explore the parameter domain. To explore the balance point between computational resources and optimization effects under different configurations, this paper designed experimental configurations with various population sizes (adap-EO-20, adap-EO-40, adap-EO-60, adap-EO-80, adap-EO-100, and adap-EO-120) through trial and error. This setup facilitates analysis of how population size affects both model performance and runtime. In addition, the number of iterations also plays a critical role in determining optimization time and search effectiveness. Too few iterations may prevent the algorithm from adequately exploring the solution space, leading to suboptimal results. However, increasing the iteration count beyond 200 yields minimal gains in the objective function while substantially raising computation time. Therefore, during the experimental process, each configuration underwent 200 iterations, recording changes in key metrics including model fitness values and execution times.
As observed in Fig. 6, as the number of iterations increased, the fitness values under each configuration showed a gradual downward trend, eventually reaching a stable state, indicating continuous improvement in model performance. By comparing the fitness changes and execution times of various configurations, it can be found that although larger population sizes might bring slight performance improvements, they are accompanied by significant increases in computation time. As shown by the red line in Fig. 6, the average execution time of adap-EO-120 is significantly higher than other configurations. Further analysis indicates that the adap-EO-80 configuration achieved a better balance between optimization effect and computational efficiency. Its computational efficiency is notably higher than configurations with larger population sizes, while the optimization effect remains at a high level.
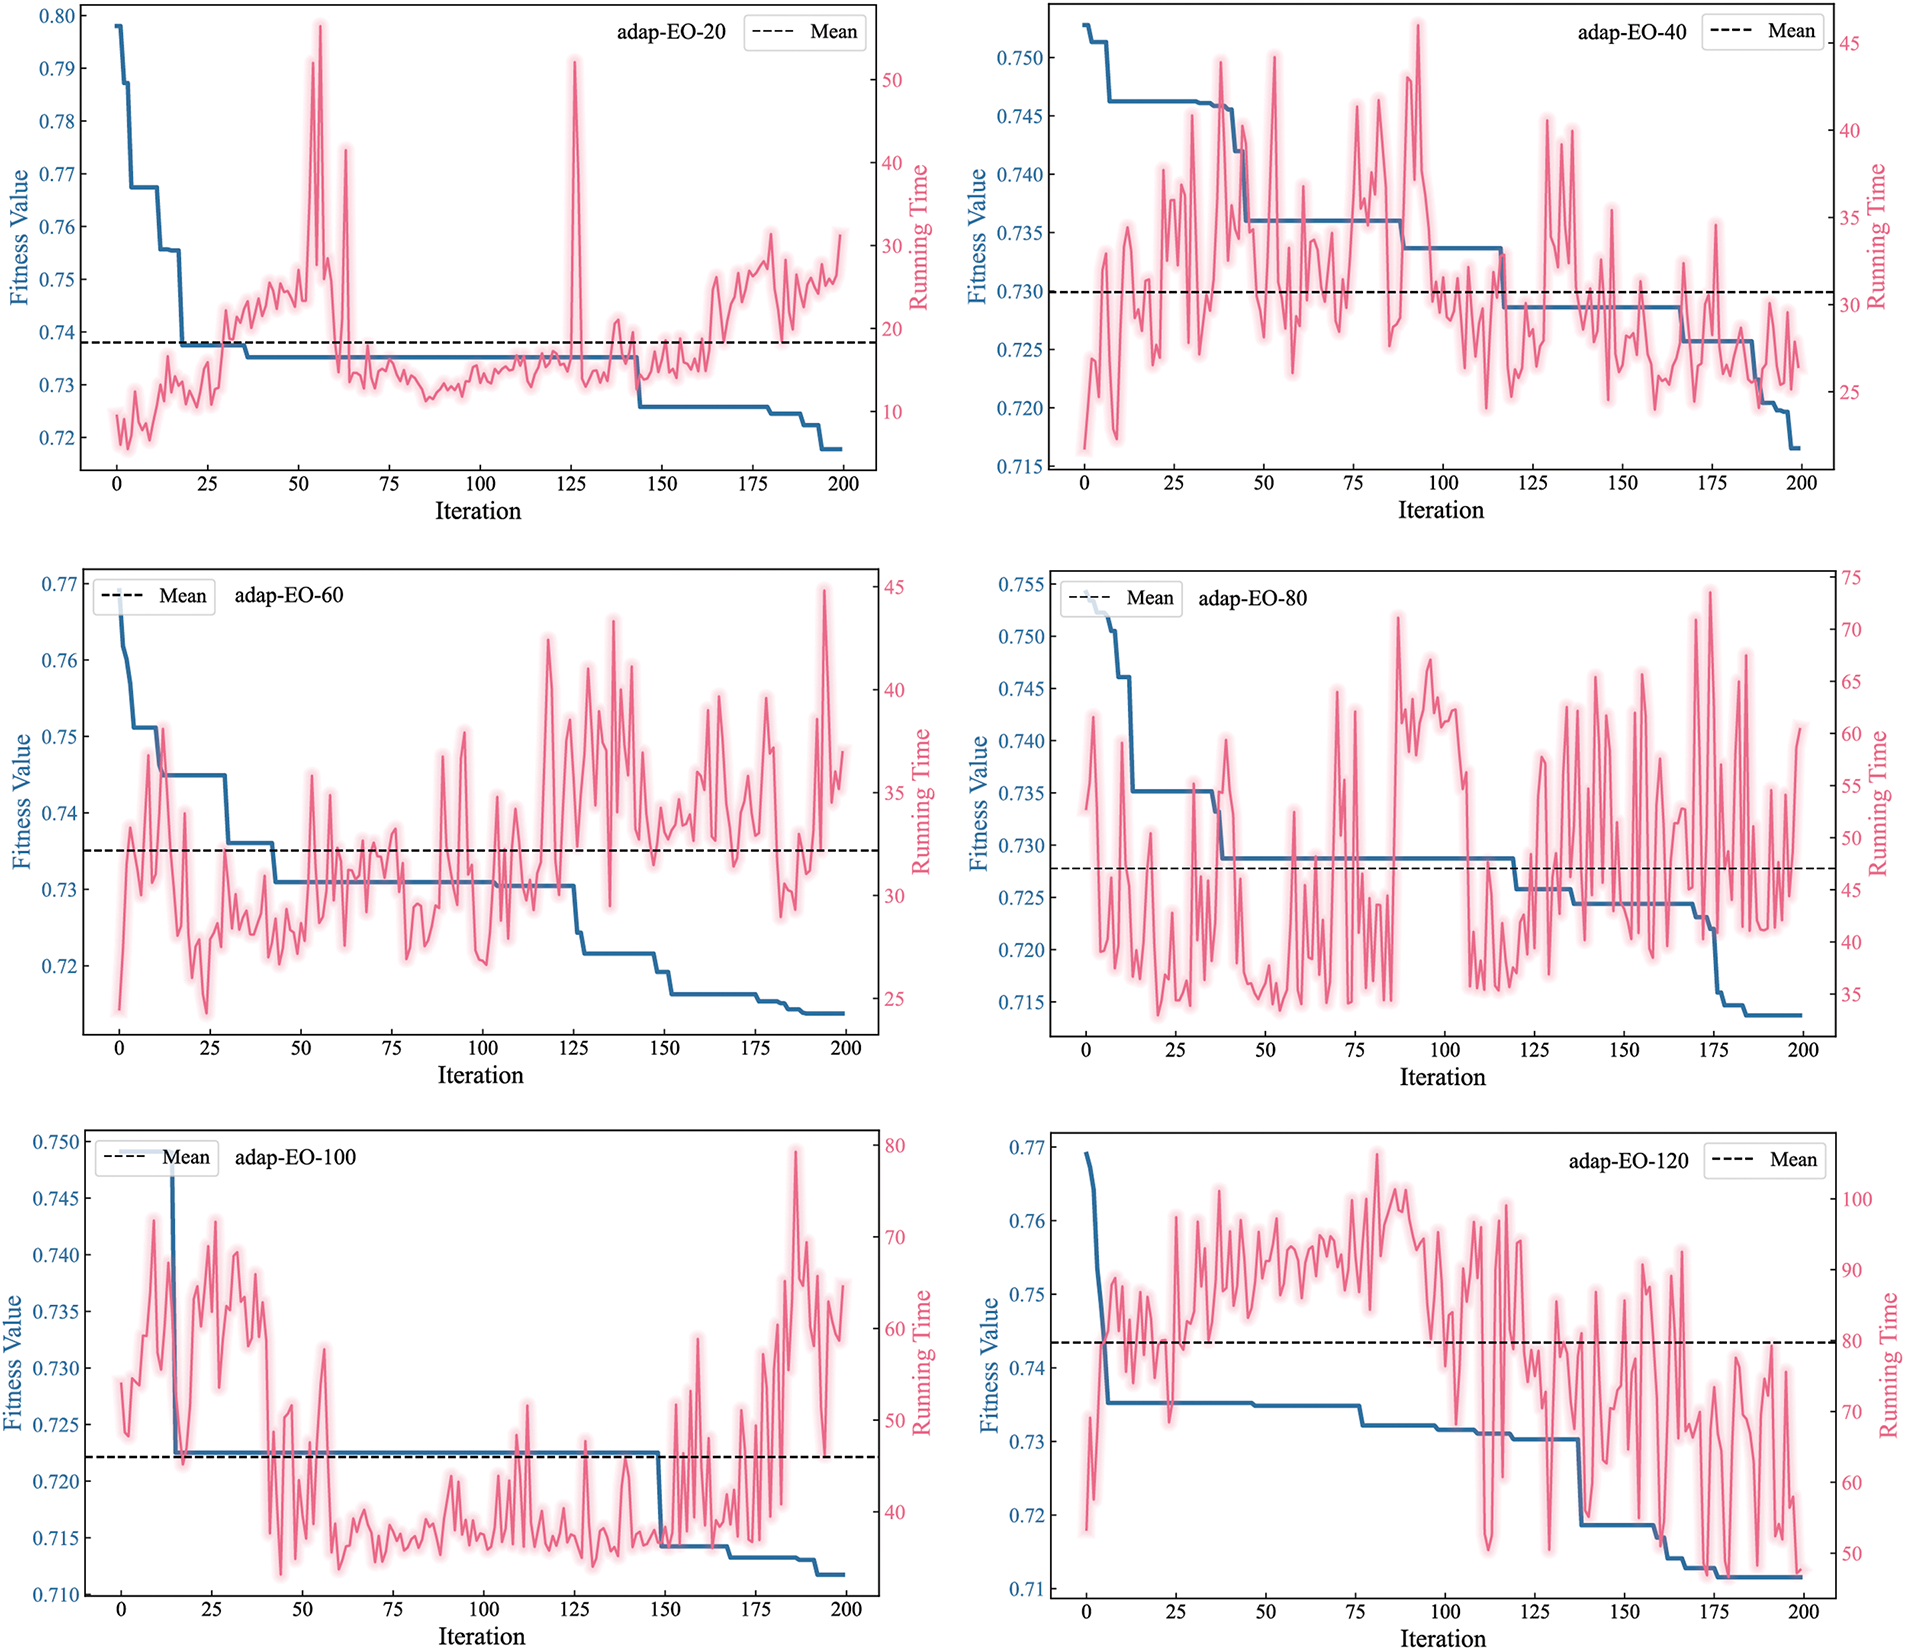
Figure 6: Convergence performance and computational efficiency analysis with different population sizes
Fig. 7 visually demonstrates the relationship between the model’s main hyperparameters and fitness values through parallel coordinate plots. Parallel coordinate plots can effectively display the impact of different hyperparameter configurations on model performance, especially in high-dimensional parameter spaces. From the figure, it can be observed that adap-EO-80 exhibits a distinct parameter convergence pattern. Compared to other configurations, it presents a more concentrated parameter distribution, with deeper blue lines showing clear convergence trends, indicating a more stable and efficient parameter search process. In contrast, adap-EO-20 and adap-EO-40 configurations display more dispersed parameter distributions, suggesting that smaller population sizes struggle to adequately explore the parameter space, potentially leading to searches becoming trapped in local optima. In conclusion, based on the optimization results of adap-EO-80 (optimal parameter combination: n_estimators = 549, learning_rate = 0.0648, subsample = 0.2508), this study constructed the final hybrid model adap-EO-XGBoost for CPB strength prediction.
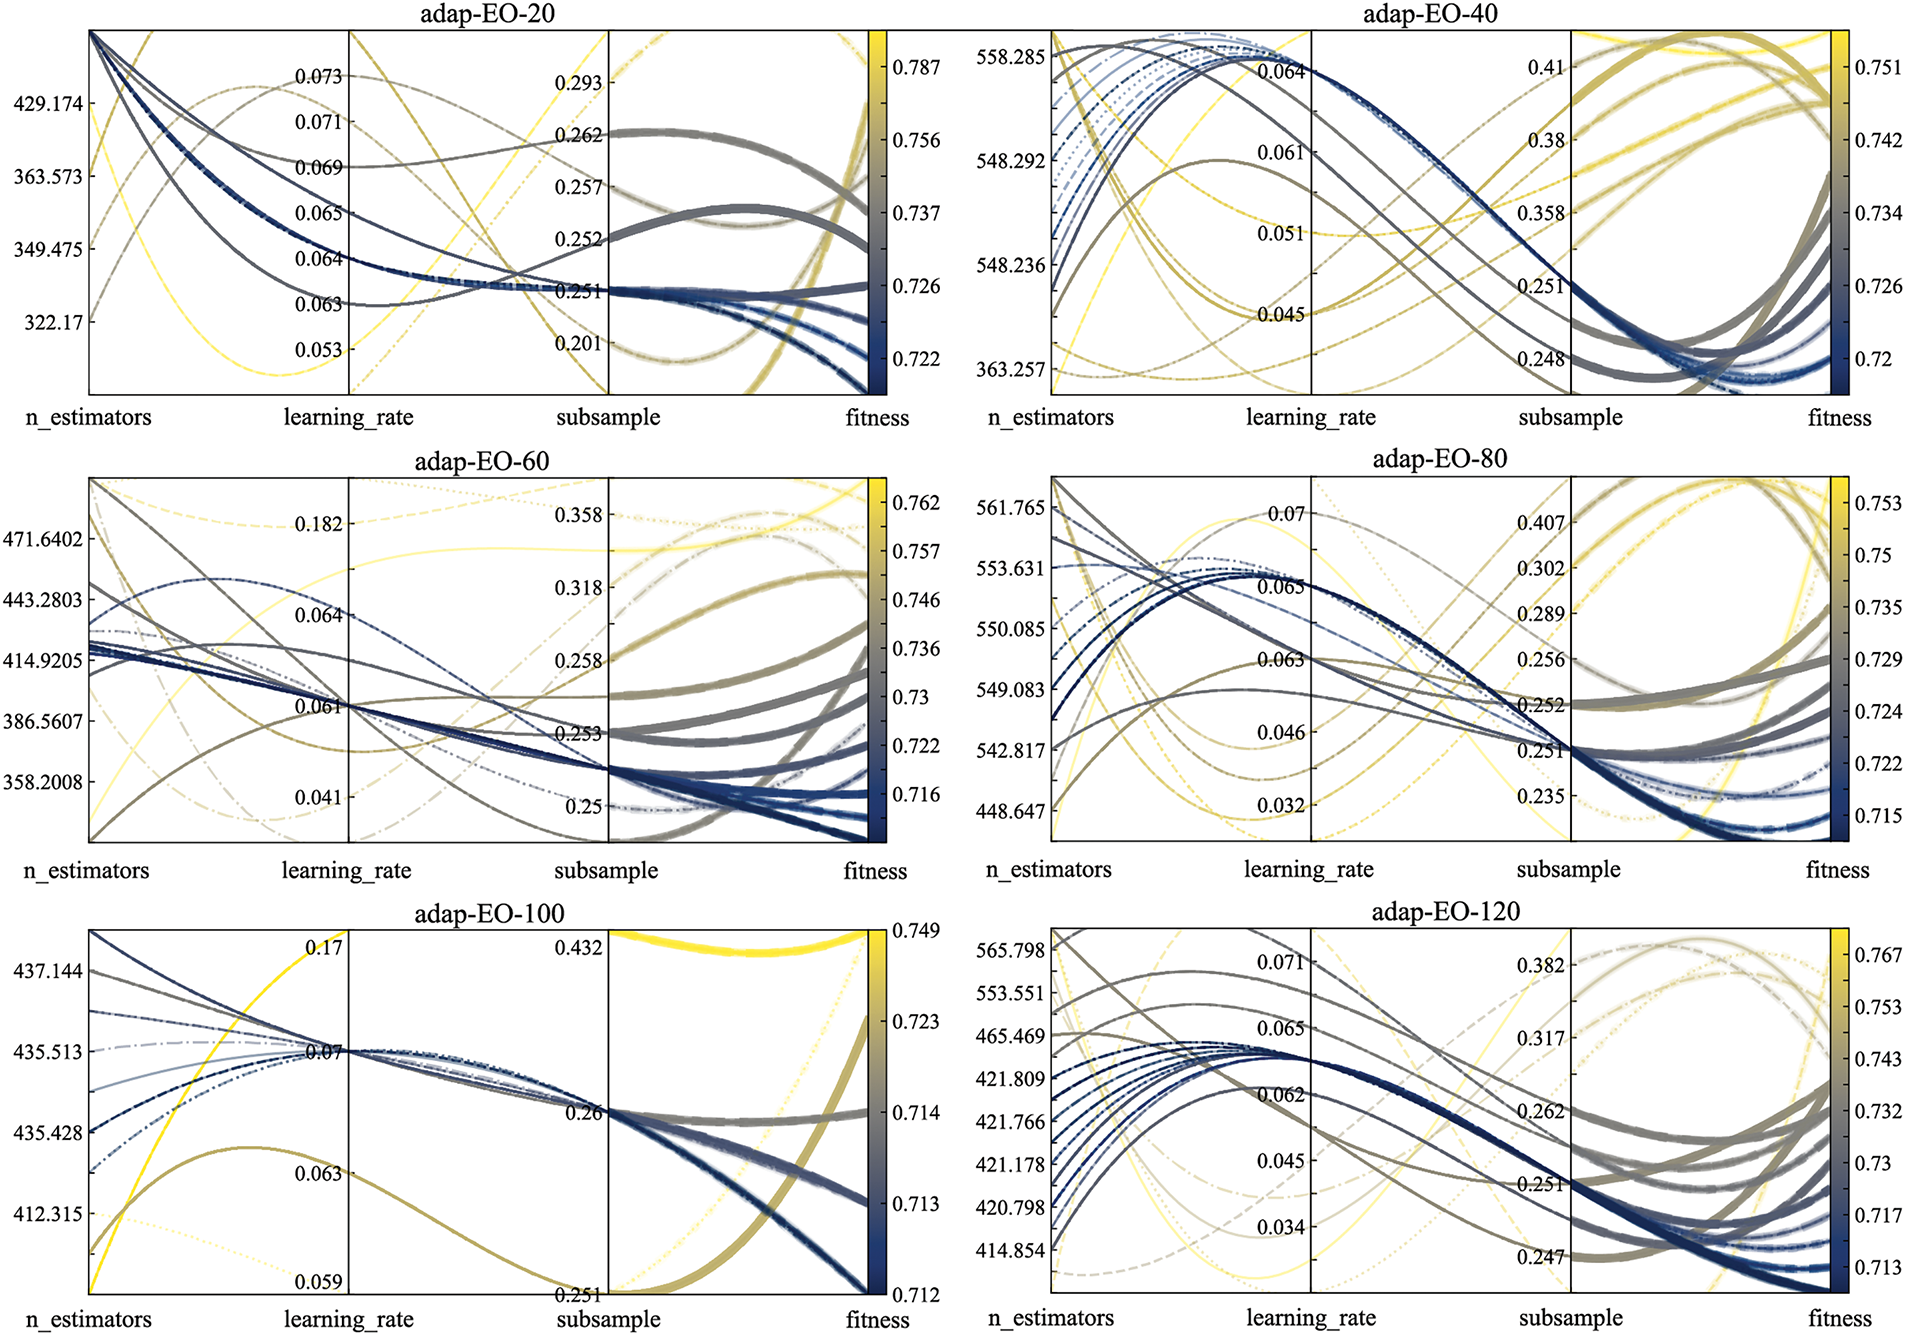
Figure 7: Optimization results of adap-EO-XGBoost in parameter space
The practical value of CPB performance prediction models is primarily reflected in their ability to accurately predict unknown data, rather than merely fitting training data. This study aims to develop a prediction model that can accurately assess the strength of PP and straw reinforced CPB materials with good generalization capabilities. To comprehensively evaluate the predictive performance of the proposed adap-EO-XGBoost hybrid model, this section presents a comprehensive comparison with various mainstream machine learning algorithms.
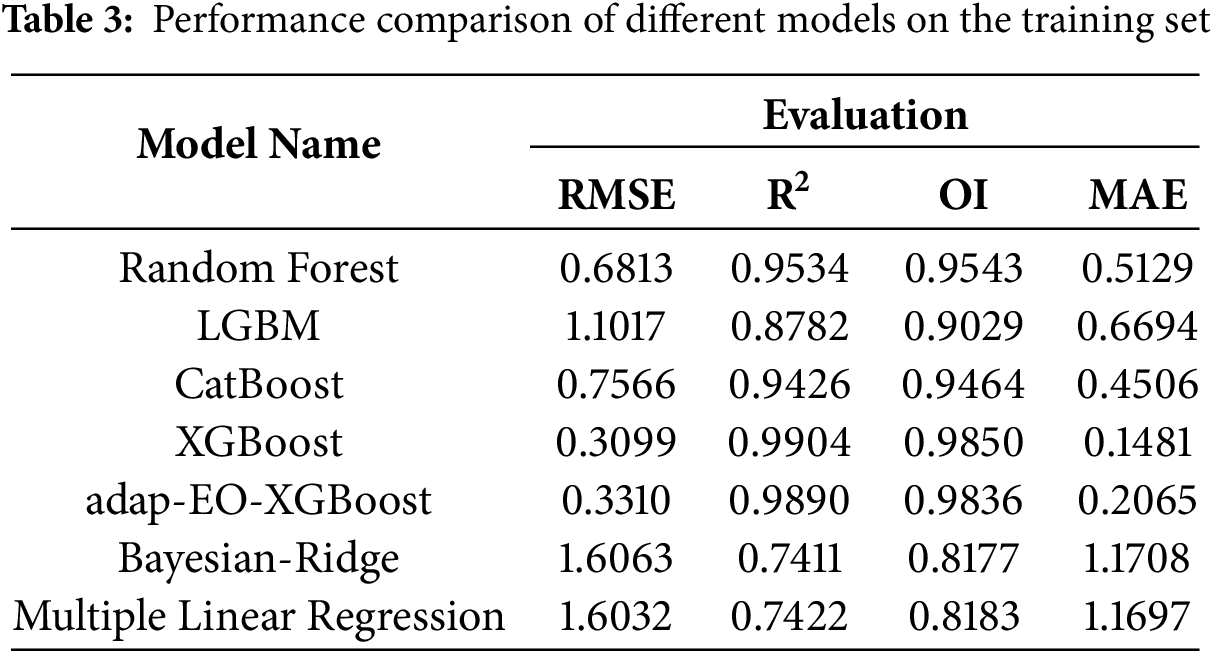
This research selected six typical machine learning algorithms as baseline models, including ensemble learning methods such as Random Forest, LGBM, CatBoost, as well as traditional Multiple Linear Regression and Bayesian-Ridge Regression. Tables 3 and 4 show the performance metric comparisons of various models on the training and test sets, respectively. From Table 3, it can be observed that the standard XGBoost model performs most prominently on the training set, with an RMSE of 0.3099, R2 as high as 0.9904, OI index reaching 0.9850, and MAE of only 0.1481, indicating the model’s extremely strong fitting capability for training data. This is closely followed by the adap-EO-XGBoost hybrid model, with metrics comparable to the standard XGBoost. Random Forest and CatBoost also perform well, while LGBM, Bayesian-Ridge, and Multiple Linear Regression show relatively weaker performance on the training set.
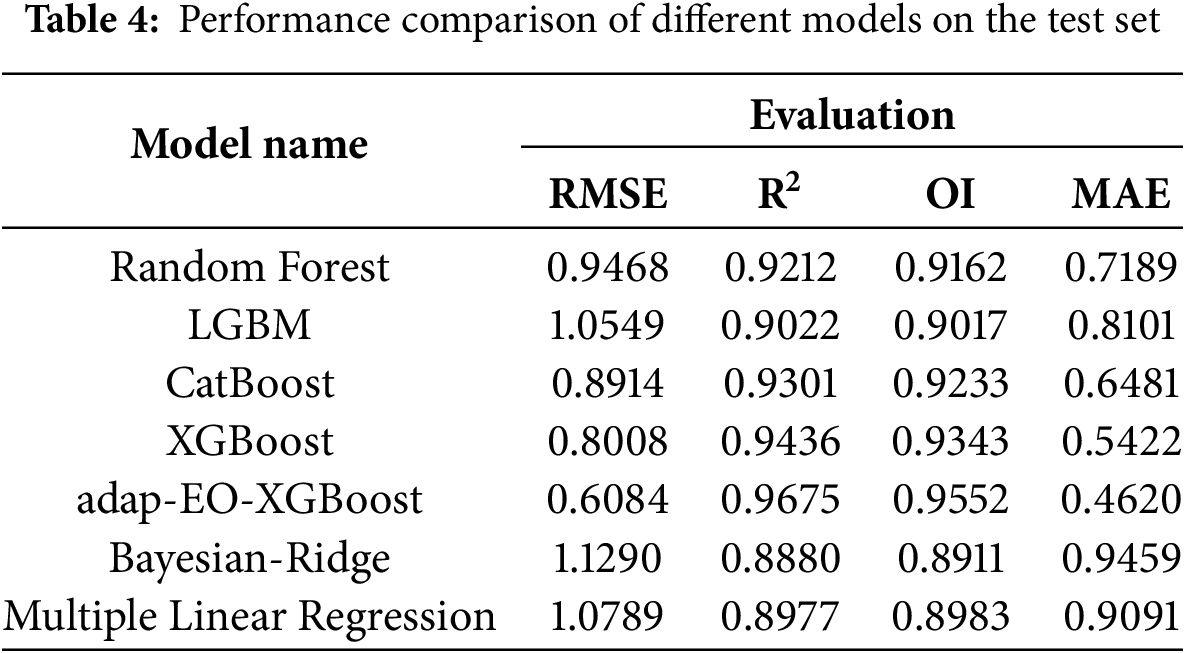
However, from the perspective of evaluating a model’s actual application value, performance on unseen test datasets often provides more objective and meaningful assessment results. As shown in Table 4, the adap-EO-XGBoost model demonstrates significant advantages on the test set, with RMSE reduced to 0.6084, R2 reaching 0.9675, OI at 0.9552, and MAE as low as 0.4620, outperforming all other models across all metrics. Notably, although the standard XGBoost model achieved optimal results on the training set, its performance significantly declined on the test set, indicating obvious overfitting issues with the standard XGBoost model. Similarly, Random Forest performed well on the training set but also showed significant performance degradation on the test set. Linear models such as Multiple Linear Regression and Bayesian-Ridge Regression performed relatively poorly on both datasets, suggesting their difficulty in effectively capturing the complex nonlinear relationships between CPB material strength and influencing factors. In addition, it is noted that a better R2 is generated compared with original study (training set: 0.9245 and testing set: 0.9475) [4].
To further analyze the performance enhancement effect of the adap-EO method on the XGBoost model, Fig. 8 illustrates a comparison of prediction effectiveness before and after optimization. It is evident that the standard XGBoost model displays significantly more dispersed error distribution on the test set, with a far greater average deviation than adap-EO-XGBoost. In practical engineering applications, the standard XGBoost might lead to reduced reliability of model prediction results. In contrast, adap-EO-XGBoost demonstrates superior generalization capability and prediction stability. This result conclusively proves the effectiveness of adap-EO in performance optimization, not only improving the model’s prediction accuracy on unseen data but also effectively mitigating the overfitting problem.
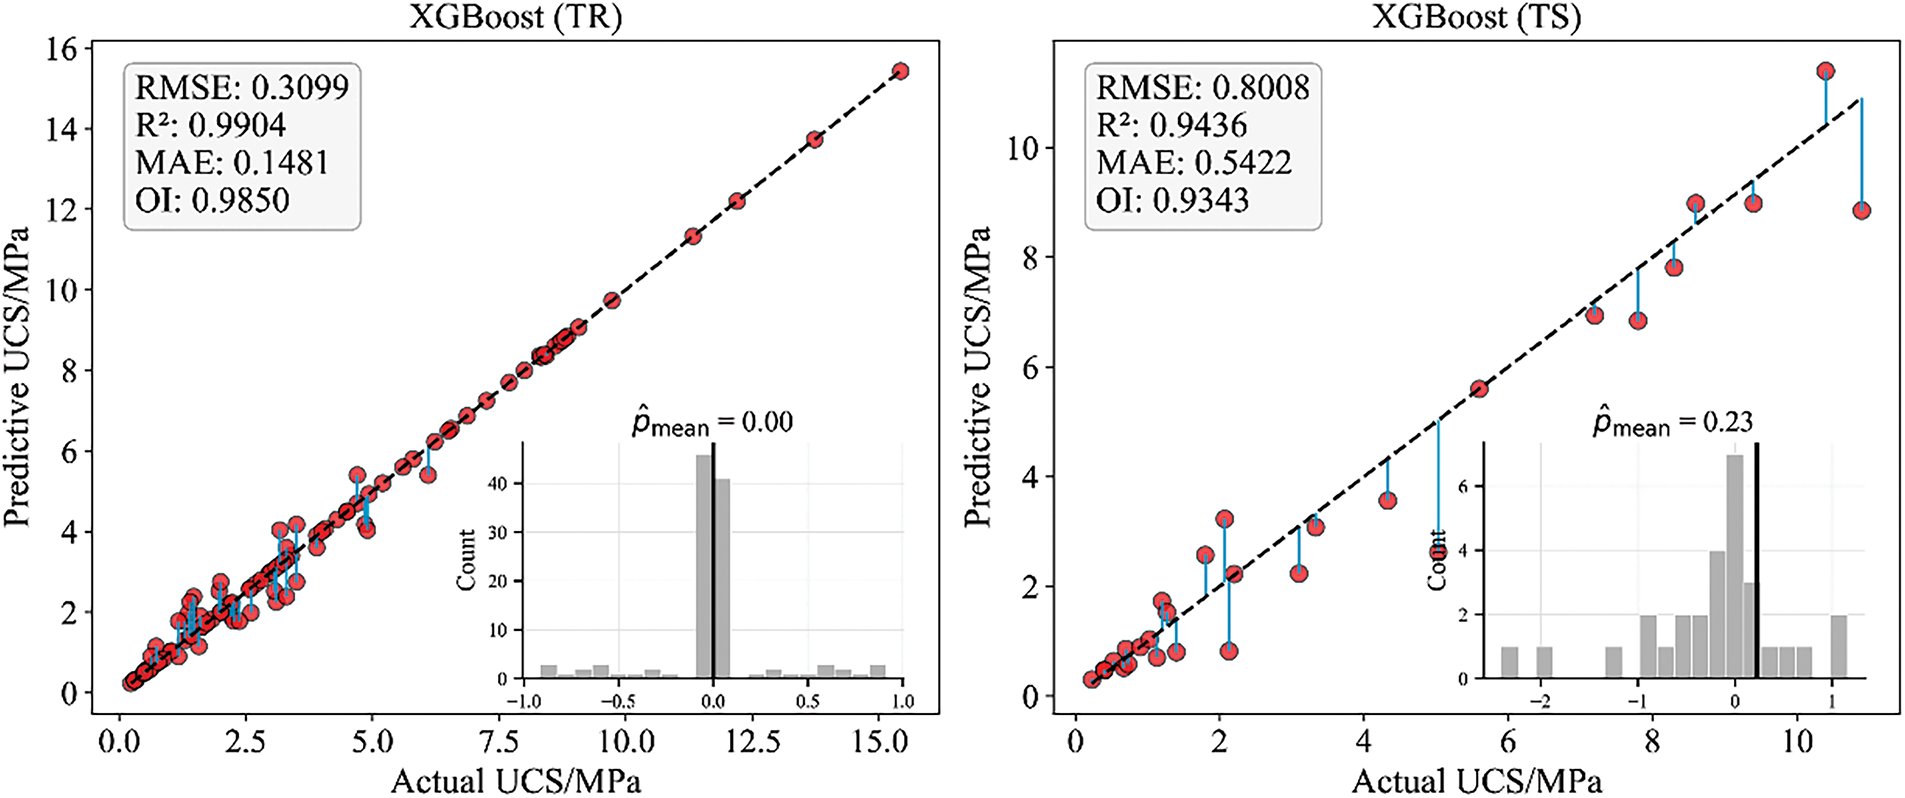
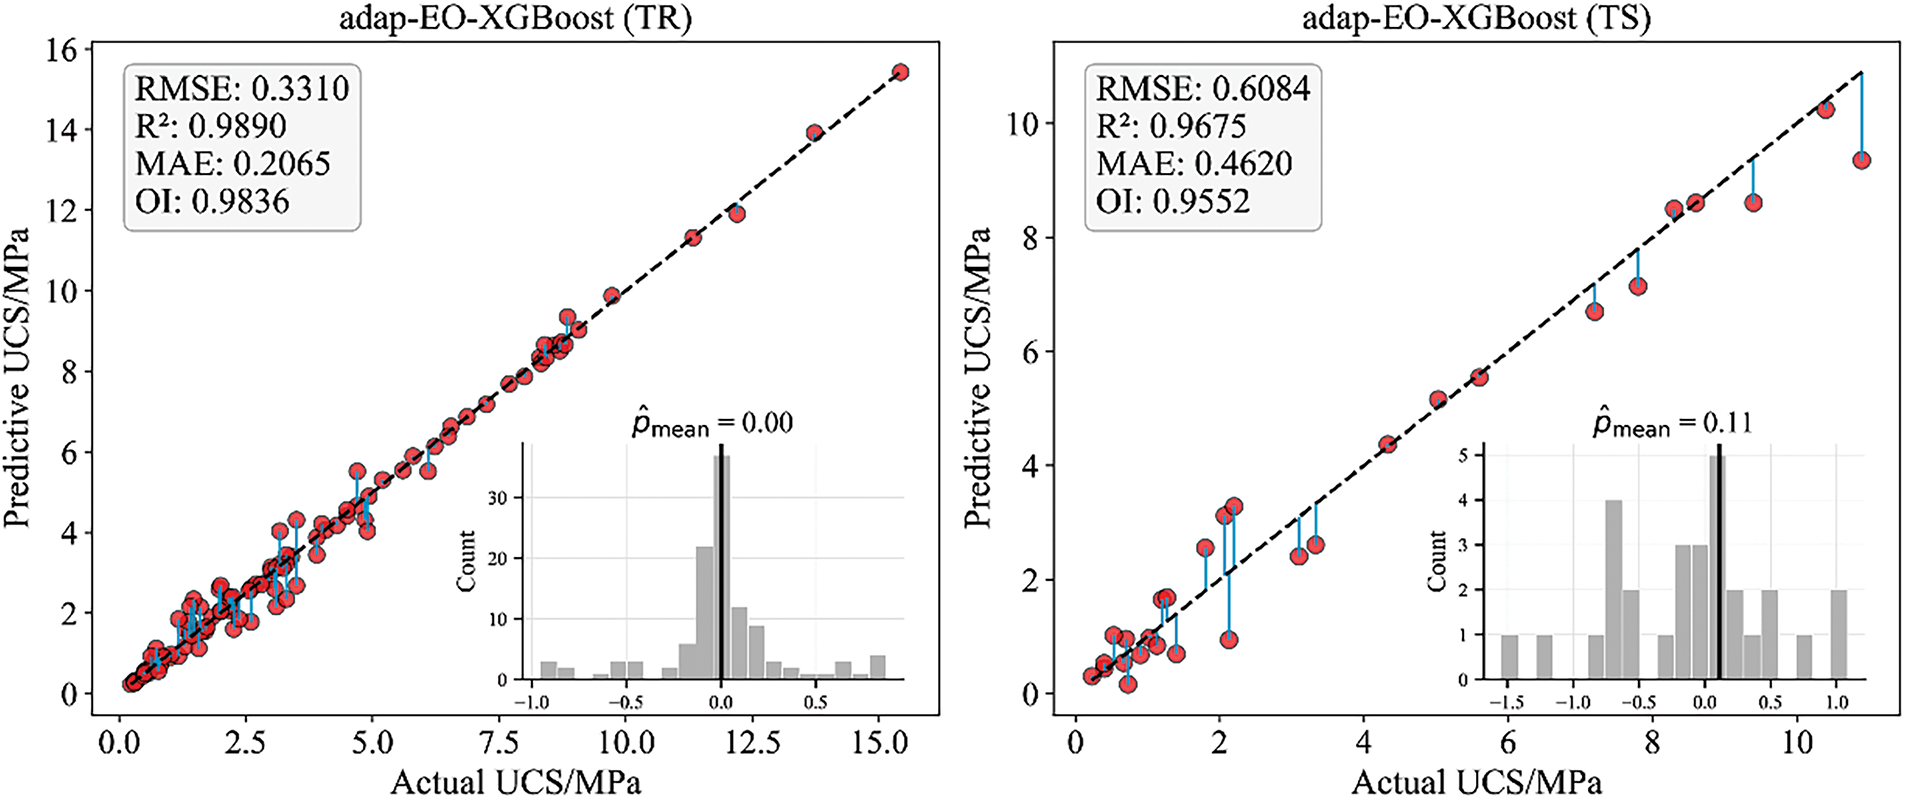
Figure 8: Distribution of predicted versus actual values for the CPB strength
For a more intuitive demonstration of each model’s predictive performance, Fig. 9 presents comparison curves of predicted versus actual values across six models at sample points. The left chart displays all prediction results, while the right chart magnifies specific key regions to more clearly observe differences in model prediction accuracy. From Fig. 9, it is clearly visible that the prediction curve of adap-EO-XGBoost almost completely overlaps with the actual value curve, with particularly outstanding prediction accuracy at peak points and regions with significant fluctuations. Although Random Forest and CatBoost generally align with actual values in overall trend, they exhibit obvious underestimation at multiple peak points (as shown in the magnified region on the right), which might lead to conservative estimates of material strength in practical applications. LGBM shows considerable deviations in multiple regions on the right, indicating insufficient prediction stability. Bayesian-Ridge, as a linear model, demonstrates good grasp of the overall trend but shows evident deficiencies in capturing nonlinear change characteristics, resulting in lower prediction accuracy in multiple fluctuation regions. Comprehensively, the adap-EO-XGBoost hybrid model demonstrates significant advantages in predicting the strength of fiber-reinforced CPB materials. It consistently outperforms other models, particularly in regions with substantial material strength fluctuations, demonstrating stronger adaptability and robustness.
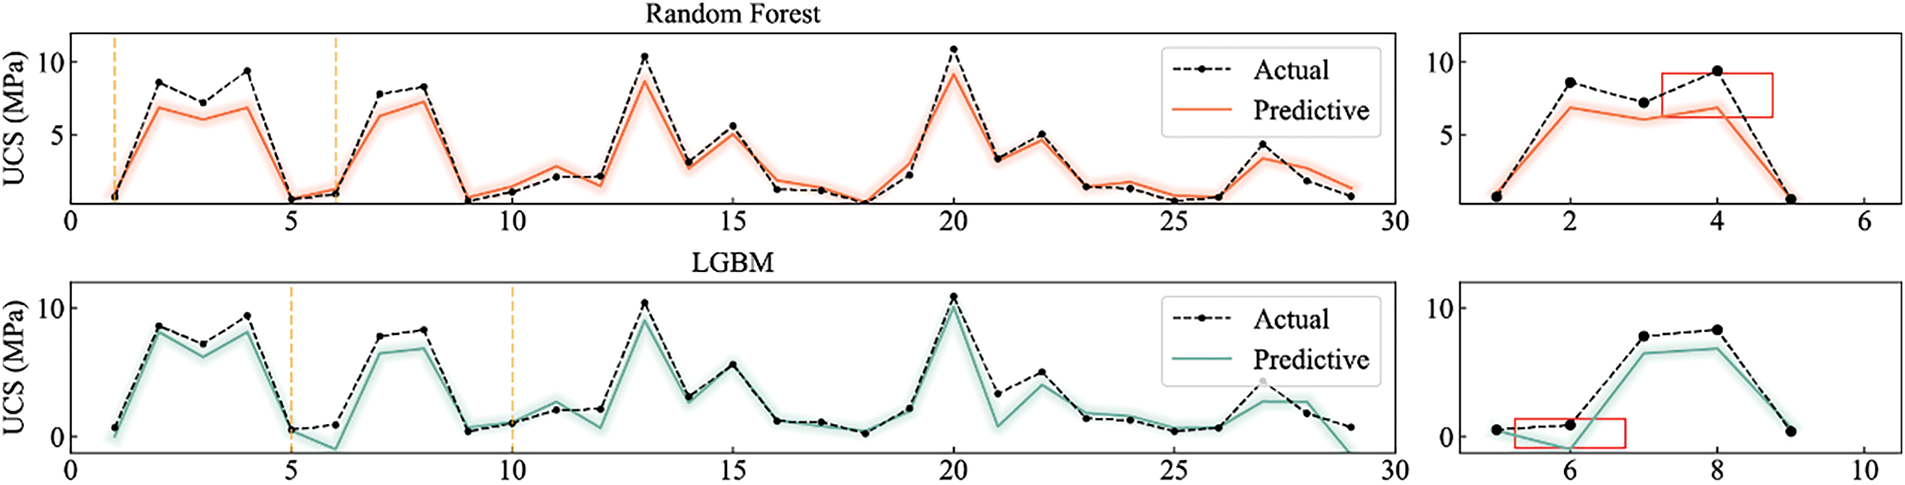
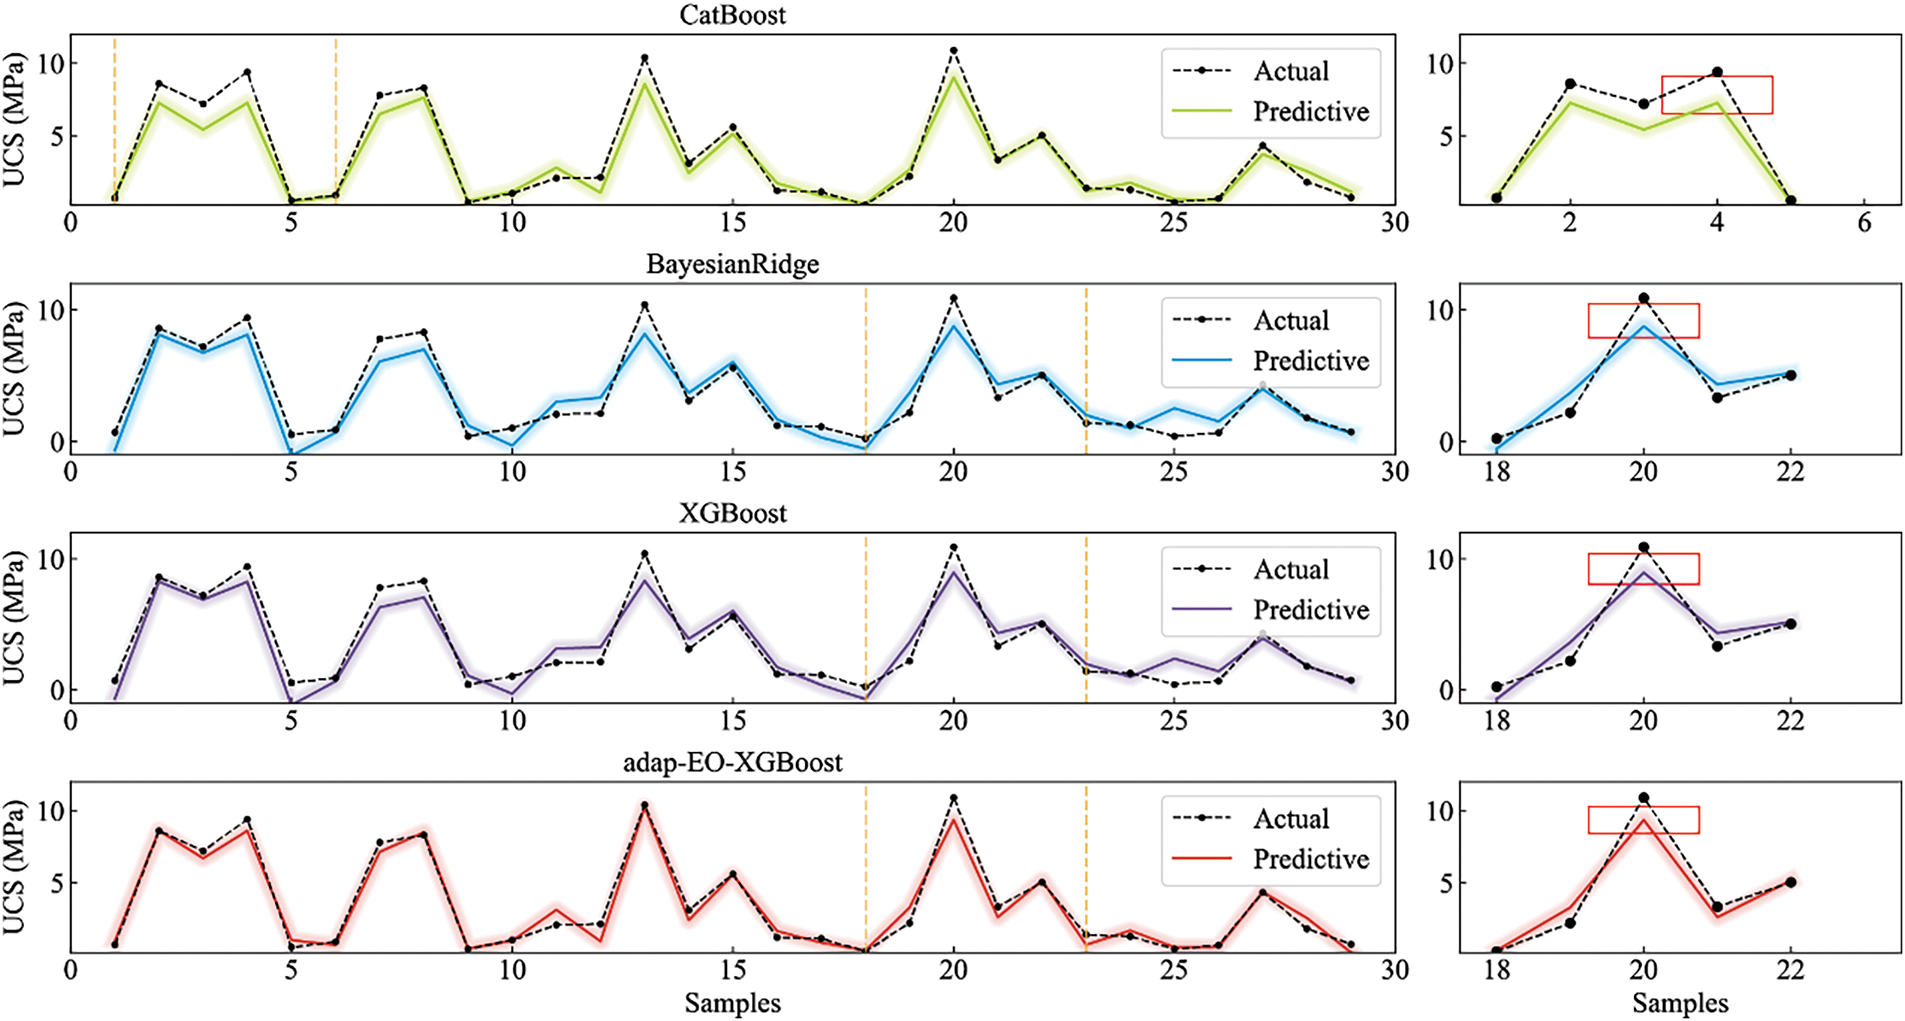
Figure 9: Comparative analysis of prediction performance across different models
5.2.1 Overall Feature Analysis
To gain deeper understanding of how various factors contribute to the strength of fiber-reinforced CPB materials, this study employed SHAP (SHapley Additive exPlanations) methodology to conduct input importance analysis on the adap-EO-XGBoost model. SHAP values, based on the game theory concept of Shapley values, effectively quantify both the magnitude and direction of each feature’s impact on model prediction results, providing a powerful tool for model interpretability [48,49]. The SHAP analysis employed in this study produces the input feature importance based on the model development, while in the original study [4], the sensitivity analysis failed to consider the interaction between models and input features. Fig. 10 illustrates the distribution of SHAP values for seven input variables affecting CPB material strength. The horizontal axis represents the SHAP value magnitude, reflecting the degree and direction of feature influence on model output; the vertical axis lists the seven input variables, including cement-tailings ratio (CT), concentration (Co), curing time (T), fiber length (Fl), fiber weight (Fw), fiber tensile strength (Fs), and cement 28-day minimum strength of cement (S).
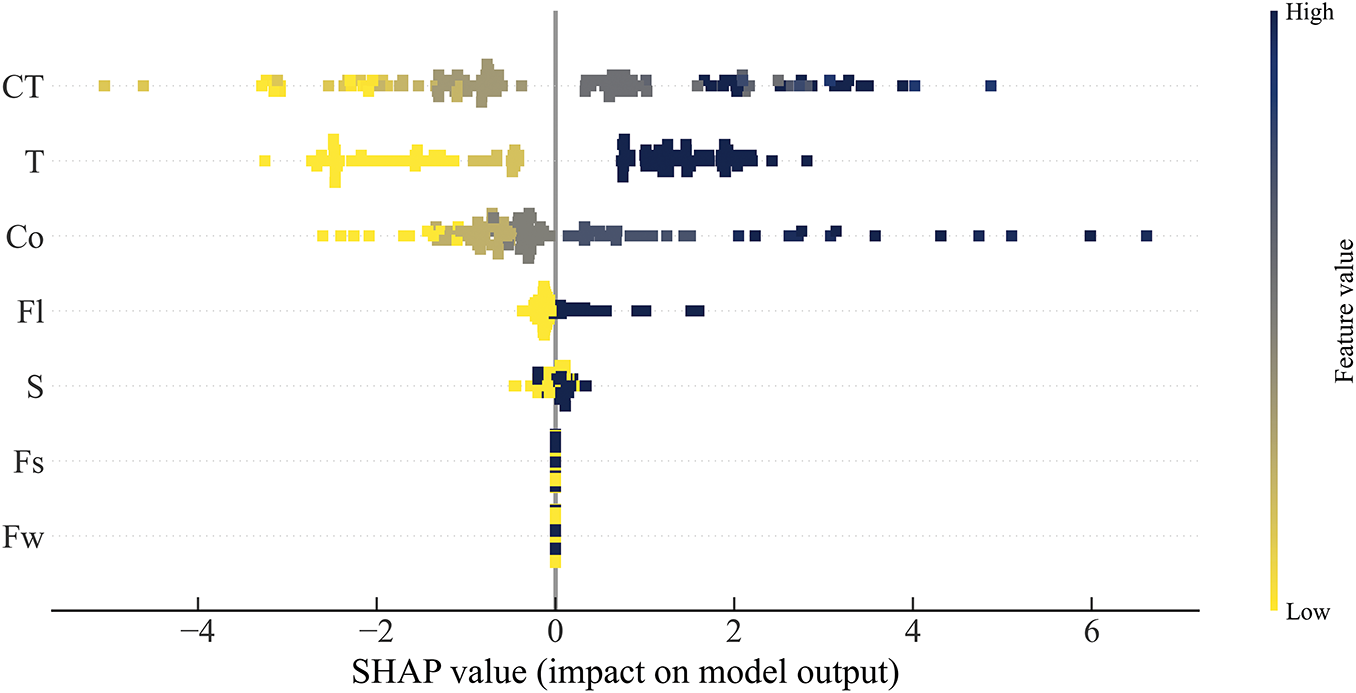
Figure 10: SHAP value analysis for key variables influencing CPB material strength
From Fig. 10, it can be clearly observed that CT, T, and Co are the three most significant factors influencing CPB strength, as they display the widest distribution ranges of SHAP values, with considerable extension in both positive and negative directions. Specifically, higher CT values typically correspond to positive SHAP values, indicating that increasing the cement-to-tailings ratio significantly enhances CPB strength; curing time T shows a similar trend, with longer curing periods generally producing positive impacts, which aligns with the mechanism of strength increase as cement hydration reactions progress over time; the influence of Co is more complex, with high concentration values corresponding to positive SHAP values in most cases, but also showing negative impacts in some instances, possibly related to decreased workability when concentration becomes excessive.
The influence of fiber length Fl is primarily concentrated near zero value with a slight positive bias, suggesting its relatively moderate impact on strength with an overall reinforcing effect. The SHAP value distributions for S, Fs, and Fw are relatively narrow and mainly concentrated near zero, indicating that these three factors have comparatively minor influences on CPB material strength.
5.2.2 Feature Dependency Analysis
To further explore the specific relationship patterns between various influencing factors and strength, Fig. 11 presents scatter plots showing the dependency relationships between parameter values and corresponding SHAP values for five major features. The horizontal axis represents feature values, the vertical axis represents SHAP values, and the yellow curve represents the overall trend.
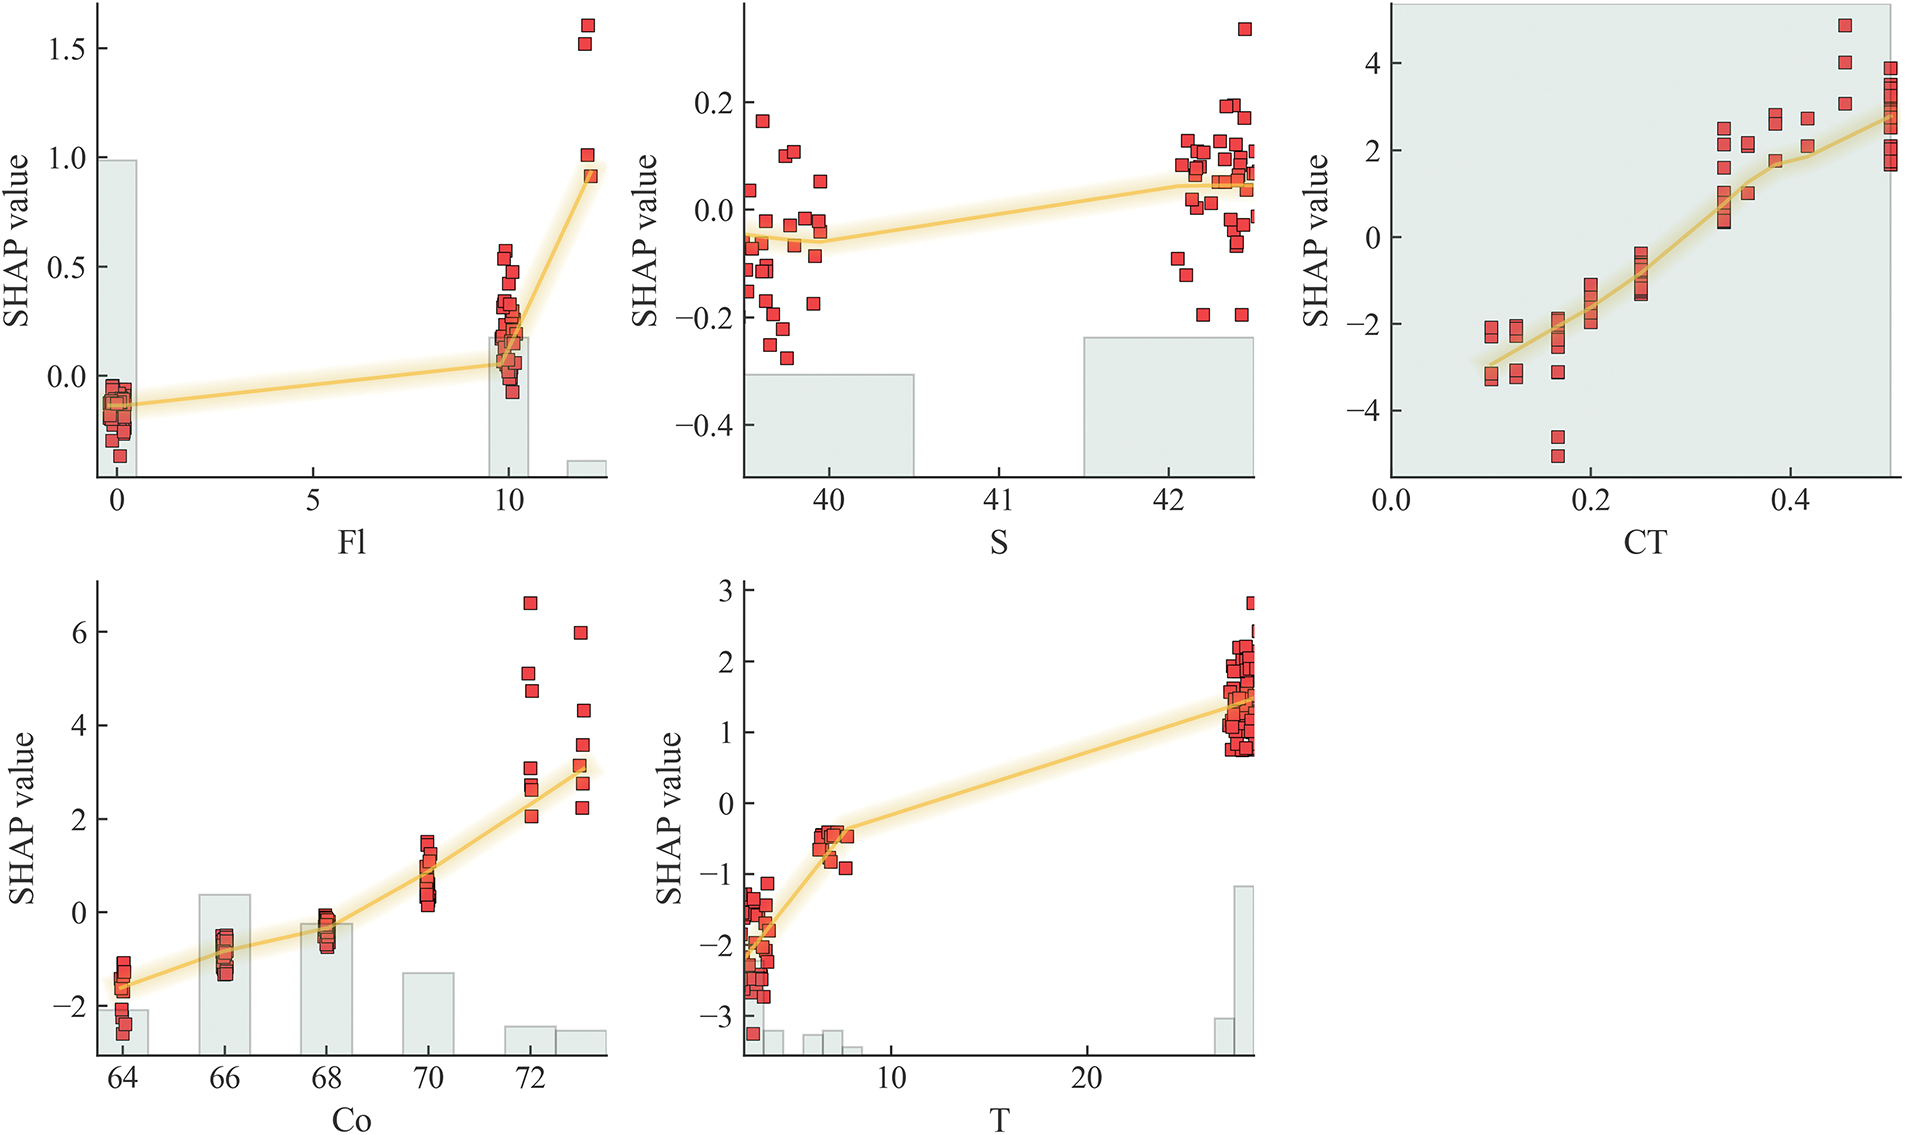
Figure 11: Dependency analysis for key variables influencing CPB material strength
From the figure, it is evident that there is a clear positive correlation between CT and SHAP values. As CT values increase, SHAP values generally show a linear growth trend, indicating that increasing cement content is an effective approach to enhancing CPB material strength. Notably, when CT values are in a lower range (approximately 0.1–0.3), SHAP values increase rapidly, while the growth rate moderates in higher ranges. This nonlinear relationship provides important reference for optimizing cement content. The relationship between Co and SHAP values exhibits complex nonlinear characteristics. At lower concentration values (approximately 64–68%), SHAP values are negative, indicating that low concentrations are unfavorable for strength development. When concentration increases to approximately 70% and above, SHAP values rapidly become positive and increase substantially, suggesting that appropriately high concentration ratios can significantly improve CPB material strength. This result may be related to increased material density and reduced porosity at higher concentrations. The relationship between T and SHAP values displays typical time-dependent characteristics. In the initial period (0–8 days), SHAP values rapidly increase from negative values to near zero; when curing time extends beyond 28 days, SHAP values demonstrate stable positive contributions, indicating that sufficient curing time is critical for obtaining high-strength CPB materials. The influence of Fl presents interesting non-monotonic change characteristics. When fiber length approaches zero, SHAP values are negative, indicating that the absence of fibers reduces material strength. As fiber length increases, SHAP values rapidly rise to positive values, with the highest SHAP values observed at 12 mm corresponding to PP fibers, while lower values at 10 mm correspond to straw fibers. This pattern reveals that the superior performance is attributed to the inherent material properties of different fiber types rather than length optimization alone. PP fibers demonstrate better reinforcement effects due to their superior tensile strength, chemical stability, and compatibility with the cement matrix compared to natural straw fibers, which may be more susceptible to degradation and have variable mechanical properties [4,50]. The higher SHAP values observed for PP fibers indicate their more effective contribution to CPB strength enhancement. The relationship between S and SHAP values is relatively simple, showing an overall weak positive correlation trend but with considerable fluctuation. This indicates that cement strength has a relatively limited impact on the final CPB material strength and may be overshadowed by the effects of other factors.
Based on the comprehensive analysis above, it can be determined that cement-tailings ratio, concentration, and curing time are the three most critical factors affecting the strength of fiber-reinforced CPB, while the influence of other parameters is relatively secondary. This conclusion provides a scientific basis for mixed ratio optimization in practical engineering applications. It is recommended that, when resources permit, priority should be given to appropriately increasing the cement-tailings ratio and concentration while ensuring adequate curing time to achieve CPB material strength that meets engineering requirements. Simultaneously, optimization of fiber parameters should involve fine adjustments after the major parameters have been determined, to achieve optimal reinforcement effects.
It is noted that there are still some points need to be improved in the future studies. At first, more samples and potential influential factors can be collected to enhance the model generalization and interpretability, such as the size of the tailings, the chemical composition and curing time. Secondly, more hyper-parameters such as max_depth and colsample_bytree can be considered and tuned to improve the model performance. Finally, more advanced algorithms can be adopted and compared to provide a better prediction scenario for CPB strength.
This study developed a hybrid XGBoost model based on the adap-EO method for predicting the uniaxial compressive strength of fiber-reinforced cemented paste backfill (CPB) materials, and conducted in-depth analysis of factors influencing material performance. Based on the research results, the following main conclusions were drawn:
1. The proposed adap-EO-XGBoost hybrid model demonstrated excellent performance in predicting CPB material strength, with evaluation metrics on the test set (R2 = 0.9675, RMSE = 0.6084, MAE = 0.4620, OI = 0.9552) significantly outperforming standard XGBoost and other methods. The constructed adap-EO method effectively mitigated the overfitting problem of XGBoost, improving the prediction accuracy and generalization ability on unseen data. It provides a reliable method for performance prediction of complex nonlinear CPB material systems.
2. Input importance analysis results indicated that cement-tailings ratio, curing time, and concentration are the three most critical factors affecting CPB material strength. The cement-tailings ratio showed a positive correlation with material strength, with more significant influence in the low-value region; concentration influence exhibited nonlinear characteristics, with high concentrations above 70% significantly improving material strength; curing time displayed typical time-dependent characteristics, with curing periods beyond 28 days being essential for strength development.
3. Fiber parameters (length, weight, and tensile strength) contributed relatively secondarily but notably to CPB material strength. In particular, PP fibers contribute more than straw fibers to the CPB strength due to its higher tensile strength. This finding provides important guidance for the rational application of fiber materials in engineering practice, indicating that fiber parameters should be finely adjusted after determining the main mix proportion factors.
4. Based on the research results, it is recommended to prioritize increasing the cement-tailings ratio and concentration in practical engineering applications while ensuring adequate curing time to achieve CPB material strength. This study not only provides a high-precision strength prediction model but also reveals the inherent correlations between various parameters and material performance, offering scientific basis and technical support for mix optimization and engineering applications of fiber-reinforced CPB materials.
Acknowledgement: The authors express their appreciation to the National Natural Science Foundation of China, the Distinguished Youth Science Foundation of Hunan Province of China and China Scholarship Council. The authors want to show appreciation to Fankou Lead-zinc mine for providing experimental sites and equipment.
Funding Statement: This research was funded by the National Natural Science Foundation of China (Grant 42177164), and the Distinguished Youth Science Foundation of Hunan Province of China (2022JJ10073). Enming Li is supported by China Scholarship Council with the grant number of 202006370006.
Author Contributions: Study conception and design: Yingui Qiu, Jian Zhou; data collection: Enming Li; methodology: Yingui Qiu, Enming Li; visualization analysis: Yingui Qiu, Jian Zhou; analysis and interpretation of results: Yingui Qiu; writing—review & editing: Yingui Qiu, Enming Li, Bin Xi, Jian Zhou, Pablo Segarra; draft manuscript preparation: Yingui Qiu, Enming Li, Bin Xi, Jian Zhou. All authors reviewed the results and approved the final version of the manuscript.
Availability of Data and Materials: The data that support the findings of this study are available from the Corresponding Author, Enming Li, upon reasonable request.
Ethics Approval: Not applicable.
Conflicts of Interest: The authors declare no conflicts of interest to report regarding the present study.
References
1. Qi C, Fourie A. Cemented paste backfill for mineral tailings management: review and future perspectives. Miner Eng. 2019;144:106025. doi:10.1016/j.mineng.2019.106025. [Google Scholar] [CrossRef]
2. Fang K, Fall M. Effects of curing temperature on shear behaviour of cemented paste backfill-rock interface. Int J Rock Mech Min Sci. 2018;112(4):184–92. doi:10.1016/j.ijrmms.2018.10.024. [Google Scholar] [CrossRef]
3. Fang K, Fall M. Insight into the mode I and mode II fracture toughness of the cemented backfill-rock interface: effect of time, temperature and sulphate. Constr Build Mater. 2020;262(5):120860. doi:10.1016/j.conbuildmat.2020.120860. [Google Scholar] [CrossRef]
4. Li E, Zhou J, Shi X, Jahed Armaghani D, Yu Z, Chen X, et al. Developing a hybrid model of salp swarm algorithm-based support vector machine to predict the strength of fiber-reinforced cemented paste backfill. Eng Comput. 2021;37(4):3519–40. doi:10.1007/s00366-020-01014-x. [Google Scholar] [CrossRef]
5. Xu W, Tian X, Cao P. Assessment of hydration process and mechanical properties of cemented paste backfill by electrical resistivity measurement. Nondestruct Test Eval. 2018;33(2):198–212. doi:10.1080/10589759.2017.1353983. [Google Scholar] [CrossRef]
6. Liu L, Xin J, Qi C, Jia H, Song KI. Experimental investigation of mechanical, hydration, microstructure and electrical properties of cemented paste backfill. Constr Build Mater. 2020;263(1):120137. doi:10.1016/j.conbuildmat.2020.120137. [Google Scholar] [CrossRef]
7. Yılmaz T, Ercikdi B, Karaman K, Külekçi G. Assessment of strength properties of cemented paste backfill by ultrasonic pulse velocity test. Ultrasonics. 2014;54(5):1386–94. doi:10.1016/j.ultras.2014.02.012. [Google Scholar] [PubMed] [CrossRef]
8. Yılmaz T, Ercikdi B. Predicting the uniaxial compressive strength of cemented paste backfill from ultrasonic pulse velocity test. Nondestruct Test Eval. 2016;31(3):247–66. doi:10.1080/10589759.2015.1111891. [Google Scholar] [CrossRef]
9. Arachchilage CB, Fan C, Zhao J, Huang G, Liu WV. A machine learning model to predict unconfined compressive strength of alkali-activated slag-based cemented paste backfill. J Rock Mech Geotech Eng. 2023;15(11):2803–15. doi:10.1016/j.jrmge.2022.12.009. [Google Scholar] [CrossRef]
10. Hu Y, Li K, Zhang B, Han B. Strength investigation of the cemented paste backfill in alpine regions using lab experiments and machine learning. Constr Build Mater. 2022;323(1):126583. doi:10.1016/j.conbuildmat.2022.126583. [Google Scholar] [CrossRef]
11. Yu Y, Rashidi M, Samali B, Yousefi AM, Wang W. Multi-image-feature-based hierarchical concrete crack identification framework using optimized SVM multi-classifiers and D-S fusion algorithm for bridge structures. Remote Sens. 2021;13(2):240. doi:10.3390/rs13020240. [Google Scholar] [CrossRef]
12. Yu Y, Zhang C, Gu X, Cui Y. Expansion prediction of Alkali aggregate reactivity-affected concrete structures using a hybrid soft computing method. Neural Comput Applic. 2019;31(12):8641–60. doi:10.1007/s00521-018-3679-7. [Google Scholar] [CrossRef]
13. Fan C, Arachchilage CB, Zhang N, Jiang B, Liu WV. Machine learning with SHapley additive explanations for evaluating mine truck productivity under real-site weather conditions at varying temporal resolutions. Int J Min Reclam Environ. 2024;38(10):810–32. doi:10.1080/17480930.2024.2348877. [Google Scholar] [CrossRef]
14. Pang H, Qi W, Song H, Pang H, Liu X, Chen J, et al. Predictive modelling of Alkali-Slag cemented tailings backfill using a novel machine learning approach. Materials. 2025;18(6):1236. doi:10.3390/ma18061236. [Google Scholar] [PubMed] [CrossRef]
15. Fan C, Zhang N, Jiang B, Liu WV. Rapid estimation of truck cycle time in open-pit mine haulage based on feature-optimized machine learning. Min Metall Explor. 2025;42(2):665–84. doi:10.1007/s42461-025-01225-0. [Google Scholar] [CrossRef]
16. Yu Y, Zhang C, Xie X, Yousefi AM, Zhang G, Li J, et al. Compressive strength evaluation of cement-based materials in sulphate environment using optimized deep learning technology. Dev Built Environ. 2023;16(47):100298. doi:10.1016/j.dibe.2023.100298. [Google Scholar] [CrossRef]
17. Yu Y, Wang G, Huseien GF, Zou Z, Ding Z, Zhang C. Intelligent prediction of compressive strength of self-compacting concrete incorporating silica fume using hybrid IWOA-GPR model. Mater Today Commun. 2025;45:112282. doi:10.1016/j.mtcomm.2025.112282. [Google Scholar] [CrossRef]
18. Qi C, Fourie A, Chen Q, Zhang Q. A strength prediction model using artificial intelligence for recycling waste tailings as cemented paste backfill. J Clean Prod. 2018;183(3):566–78. doi:10.1016/j.jclepro.2018.02.154. [Google Scholar] [CrossRef]
19. Liu J, Li G, Yang S, Huang J. Prediction models for evaluating the strength of cemented paste backfill: a comparative study. Minerals. 2020;10(11):1041. doi:10.3390/min10111041. [Google Scholar] [CrossRef]
20. Guo J, Li Z, Wang X, Gu Q, Zhang M, Jiang H, et al. Prediction of unconfined compressive strength of cemented tailings backfill containing coarse aggregate using a hybrid model based on extreme gradient boosting. Num Anal Meth Geomech. 2025;49(8):2047–58. doi:10.1002/nag.3972. [Google Scholar] [CrossRef]
21. Adiguzel Tuylu AN, Tuylu S, Adiguzel D, Namli E, Gungoren C, Demir I. Optimizing strength prediction for cemented paste backfills with various fly ash substitution: computational approach with machine learning algorithms. Minerals. 2025;15(3):234. doi:10.3390/min15030234. [Google Scholar] [CrossRef]
22. Ngo QT, Ngo CT, Nguyen QH, Nguyen HN, Nguyen LQ, Nguyen KQ, et al. Data-driven approach in investigating and predicting unconfined compressive strength of cemented paste backfill. Mater Today Commun. 2023;37(1):107065. doi:10.1016/j.mtcomm.2023.107065. [Google Scholar] [CrossRef]
23. Qi C, Zheng J, Yang X, Chen Q, Wu M. Application of deep neural network in the strength prediction of cemented paste backfill based on a global dataset. Constr Build Mater. 2023;391(47):131827. doi:10.1016/j.conbuildmat.2023.131827. [Google Scholar] [CrossRef]
24. Sun W, Gao T, Zhao J, Cheng H. Research on fracture behavior and reinforcement mechanism of fiber-reinforced locally layered backfill: experiments and models. Constr Build Mater. 2023;366(5):130186. doi:10.1016/j.conbuildmat.2022.130186. [Google Scholar] [CrossRef]
25. Chen X, Shi X, Zhang S, Chen H, Zhou J, Yu Z, et al. Fiber-reinforced cemented paste backfill: the effect of fiber on strength properties and estimation of strength using nonlinear models. Materials. 2020;13(3):718. doi:10.3390/ma13030718. [Google Scholar] [PubMed] [CrossRef]
26. Libos ILS, Cui L. Time- and temperature-dependence of compressive and tensile behaviors of polypropylene fiber-reinforced cemented paste backfill. Front Struct Civ Eng. 2021;15(4):1025–37. doi:10.1007/s11709-021-0741-9. [Google Scholar] [CrossRef]
27. Yu Z, Shi XZ, Chen X, Zhou J, Chong QC, Song CQ, et al. Artificial intelligence model for studying unconfined compressive performance of fiber-reinforced cemented paste backfill. Trans Nonferrous Met Soc China. 2021;31(4):1087–102. doi:10.1016/s1003-6326(21)65563-2. [Google Scholar] [CrossRef]
28. Faramarzi A, Heidarinejad M, Stephens B, Mirjalili S. Equilibrium optimizer: a novel optimization algorithm. Knowl-Based Syst. 2020;191:105190. doi:10.1016/j.knosys.2019.105190. [Google Scholar] [CrossRef]
29. Zhong K, Xiao F, Gao X. Wind farm layout optimization using adaptive equilibrium optimizer. J Supercomput. 2024;80(11):15245–91. doi:10.1007/s11227-024-05986-1. [Google Scholar] [CrossRef]
30. Ding H, Liu Y, Wang Z, Jin G, Hu P, Dhiman G. Adaptive guided equilibrium optimizer with spiral search mechanism to solve global optimization problems. Biomimetics. 2023;8(5):383. doi:10.3390/biomimetics8050383. [Google Scholar] [PubMed] [CrossRef]
31. Wunnava A, Naik MK, Panda R, Jena B, Abraham A. A novel interdependence based multilevel thresholding technique using adaptive equilibrium optimizer. Eng Appl Artif Intell. 2020;94:103836. doi:10.1016/j.engappai.2020.103836. [Google Scholar] [CrossRef]
32. Elsheikh AH, Sharshir SW, Abd Elaziz M, Kabeel AE, Guilan W, Haiou Z. Modeling of solar energy systems using artificial neural network: a comprehensive review. Sol Energy. 2019;180(2):622–39. doi:10.1016/j.solener.2019.01.037. [Google Scholar] [CrossRef]
33. Wang X, Wei Y, Jiang T, Hao F, Xu H. Elastic-plastic criterion solution of deep roadway surrounding rock based on intermediate principal stress and Drucker-Prager criterion. Energy Sci Eng. 2024;12(6):2472–92. doi:10.1002/ese3.1756. [Google Scholar] [CrossRef]
34. Nguyen BM, Hoang B, Nguyen T, Nguyen G. nQSV-Net: a novel queuing search variant for global space search and workload modeling. J Ambient Intell Hum Comput. 2021;12(1):27–46. doi:10.1007/s12652-020-02849-4. [Google Scholar] [CrossRef]
35. Székely GJ, Rizzo ML. Partial distance correlation with methods for dissimilarities. Ann Stat. 2014;42(6):2382–12. doi:10.1214/14-aos1255. [Google Scholar] [CrossRef]
36. Qiu Y, Zhou J. Methodology for constructing explicit stability formulas for hard rock pillars: integrating data-driven approaches and interpretability techniques. Rock Mech Rock Eng. 2025;58(5):5475–502. doi:10.1007/s00603-025-04387-x. [Google Scholar] [CrossRef]
37. Iman RL, Davenport JM. Approximations of the critical region of the fbietkan statistic. Commun Stat—Theory Methods. 1980;9(6):571–95. doi:10.1080/03610928008827904. [Google Scholar] [CrossRef]
38. Gardner MW, Dorling SR. Artificial neural networks (the multilayer perceptron)—a review of applications in the atmospheric sciences. Atmos Environ. 1998;32(14–15):2627–36. doi:10.1016/s1352-2310(97)00447-0. [Google Scholar] [CrossRef]
39. Awad M, Khanna R. Support vector regression. In: Efficient learning machines. Berkeley, CA, USA: Apress; 2015. p. 67–80. [Google Scholar]
40. Kramer O. K-Nearest neighbors. In: Dimensionality reduction with unsupervised nearest neighbors, Vol. 51. Berlin/Heidelberg, Gearmany: Springer Berlin Heidelberg; 2013. p. 13–23. [Google Scholar]
41. Fan J, Ma X, Wu L, Zhang F, Yu X, Zeng W. Light gradient boosting machine: an efficient soft computing model for estimating daily reference evapotranspiration with local and external meteorological data. Agric Water Manag. 2019;225(9):105758. doi:10.1016/j.agwat.2019.105758. [Google Scholar] [CrossRef]
42. de Ville B. Decision trees. WIREs Comput Stats. 2013;5(6):448–55. [Google Scholar]
43. Breiman L. Random forests. Mach Learn. 2001;45(1):5–32. [Google Scholar]
44. Dorogush AV, Ershov V, Gulin A. CatBoost: gradient boosting with categorical features support. arXiv:1810.11363. 2018. [Google Scholar]
45. Naik MK, Panda R. A novel adaptive cuckoo search algorithm for intrinsic discriminant analysis based face recognition. Appl Soft Comput. 2016;38(2):661–75. doi:10.1016/j.asoc.2015.10.039. [Google Scholar] [CrossRef]
46. Mirjalili S, Gandomi AH, Mirjalili SZ, Saremi S, Faris H, Mirjalili SM. Salp swarm algorithm: a bio-inspired optimizer for engineering design problems. Adv Eng Softw. 2017;114:163–91. doi:10.1016/j.advengsoft.2017.07.002. [Google Scholar] [CrossRef]
47. Mirjalili S, Mirjalili SM, Lewis A. Grey wolf optimizer. Adv Eng Softw. 2014;69:46–61. doi:10.1016/j.advengsoft.2013.12.007. [Google Scholar] [CrossRef]
48. Eini N, Janizadeh S, Bateni SM, Jun C, Kim Y. Estimating equilibrium scour depth around non-circular bridge piers using interpretable hybrid machine learning models. Ocean Eng. 2024;312(2):119246. doi:10.1016/j.oceaneng.2024.119246. [Google Scholar] [CrossRef]
49. Efremov C, Le TT, Paramasivam P, Rudzki K, Osman SM, Chau TH. Improving syngas yield and quality from biomass/coal co-gasification using cooperative game theory and local interpretable model-agnostic explanations. Int J Hydrogen Energy. 2024;96:892–907. doi:10.1016/j.ijhydene.2024.11.329. [Google Scholar] [CrossRef]
50. Chen X, Shi X, Zhou J, Chen Q, Li E, Du X. Compressive behavior and microstructural properties of tailings polypropylene fibre-reinforced cemented paste backfill. Constr Build Mater. 2018;190(28):211–21. doi:10.1016/j.conbuildmat.2018.09.092. [Google Scholar] [CrossRef]
Cite This Article
 Copyright © 2025 The Author(s). Published by Tech Science Press.
This work is licensed under a Creative Commons Attribution 4.0 International License , which permits unrestricted use, distribution, and reproduction in any medium, provided the original work is properly cited.
 Downloads
 Citation Tools