
 Submit a Paper
 Propose a Special lssue
 Open Access
ARTICLE

AI-Driven GIS Modeling of Future Flood Risk and Susceptibility for Typhoon Krathon under Climate Change
1 Department of Harbor and River Engineering, National Taiwan Ocean University, Keelung, 202301, Taiwan
2 Center of Excellence for Ocean Engineering, National Taiwan Ocean University, Keelung, 202301, Taiwan
3 Keelung City Fire Department, Keelung City Government, Keelung, 204004, Taiwan
* Corresponding Author: Cheng-Yu Ku. Email:
Computer Modeling in Engineering & Sciences 2025, 144(3), 2969-2990. https://doi.org/10.32604/cmes.2025.070663
Received 21 July 2025; Accepted 05 September 2025; Issue published 30 September 2025
 View Full Text
 Download PDF
Abstract
Amid growing typhoon risks driven by climate change with projected shifts in precipitation intensity and temperature patterns, Taiwan faces increasing challenges in flood risk. In response, this study proposes a geographic information system (GIS)-based artificial intelligence (AI) model to assess flood susceptibility in Keelung City, integrating geospatial and hydrometeorological data collected during Typhoon Krathon (2024). The model employs the random forest (RF) algorithm, using seven environmental variables excluding average elevation, slope, topographic wetness index (TWI), frequency of cumulative rainfall threshold exceedance, normalized difference vegetation index (NDVI), flow accumulation, and drainage density, with the number of flood events per unit area as the output. The RF model demonstrates high accuracy, achieving the accuracy of 97.45%. Feature importance indicates that NDVI is the most critical predictor, followed by flow accumulation, TWI, and rainfall frequency. Furthermore, under the IPCC AR5 RCP8.5 scenarios, projected 50-year return period rainfall in Keelung City increases by 42.40%–64.95% under +2°C to +4°C warming. These projections were integrated into the RF model to simulate future flood susceptibility. Results indicate two districts in the study area face the greatest increase in flood risk, emphasizing the need for targeted climate adaptation in vulnerable urban areas.Keywords
Floods are among the most frequent and devastating natural hazards worldwide, causing significant economic losses, infrastructure damage, and threats to human lives [1–3]. In recent decades, the increasing intensity and frequency of extreme weather events, attributed to climate change, have demonstrated the urgency of developing flood prediction systems [4,5]. Simultaneously, rapid urbanization has altered land use patterns, reduced natural drainage capacity, and increased flood susceptibility, especially in coastal and densely populated cities [6–9]. Recent extreme floods driven by climate change have caused widespread damage to lives and property, highlighting the urgent need for improved flood risk prediction. Stochastic simulation models, such as Markov-based approaches, have been widely applied to extend hydrological records and capture flood variability under changing climatic conditions [10]. In addition, the integration of data-driven approaches, particularly machine learning (ML) models, has emerged as a promising solution to support proactive disaster risk reduction and urban resilience planning [11–13].
Traditional flood prediction models heavily rely on hydrological and hydraulic modeling and require extensive physical data. These models may struggle to adapt to rapidly changing environmental and anthropogenic variables. They typically depend on predefined physical laws and parameters, such as rainfall-runoff relationships, soil infiltration rates, and river discharge capacities, which are often site-specific and sensitive to data quality [14–18]. Moreover, calibrating these models for large or data-scarce regions remains a significant challenge, particularly under the increasing uncertainty brought by climate variability. In contrast, ML particularly deep learning approaches such as deep neural networks (DNN), random forest (RF), artificial neural network (ANN), and support vector machine (SVM), offers a powerful alternative by identifying complex, non-linear relationships between multiple input features and flood events [19–21]. These ML models are capable of learning from historical data and improving prediction accuracy over time without relying heavily on predefined physical equations. ML models can incorporate diverse data types, including remote sensing, weather forecasts, topography, and socioeconomic variables, allowing for scalable and adaptive flood risk assessment across different spatial and temporal scales which make ML approaches especially advantageous in urban and climate-sensitive contexts [22–25]. Furthermore, geographic information system (GIS) technologies play a crucial role in flood analysis by providing spatial data visualization and analysis tools, essential for flood risk mapping. GIS allows for the integration of multiple layers of environmental and infrastructural data, offering insights into flood-prone areas based on topography, land use, and historical flood events. This integration enhances the effectiveness of both traditional models and ML approaches, providing a comprehensive framework for flood risk management [26–29].
This study proposes a GIS-integrated artificial intelligence (AI) framework for flood susceptibility assessment in Keelung City, utilizing geospatial and hydrometeorological data from Typhoon Krathon (2024). The model adopts the RF algorithm, incorporating seven key environmental predictors: mean elevation, slope gradient, topographic wetness index (TWI), exceedance frequency of cumulative rainfall thresholds, normalized difference vegetation index (NDVI), flow accumulation, and drainage density. The response variable is defined as the density of recorded flood events per unit area. To optimize model performance, Bayesian optimization is employed for hyperparameter tuning, thereby improving the robustness and accuracy of predictions.
2 Study Area and Geospatial Datasets
Keelung City is located in the northeastern part of Taiwan and serves as a major port city in the northern region. The total area of the city is approximately 132.8 km2, and it is administratively divided into seven districts: Zhongzheng, Zhongshan, Anle, Xinyi, Renai, Qidu, and Nuannuan, comprising a total of 157 villages and neighborhoods. The population is primarily concentrated around the port and city center areas. The city features significant elevation changes, ranging from sea level to 882 m at its highest point in Nuannuan District. The slope varies widely across the city, from flat plains to steep mountainous terrain with gradients up to 86.9 degrees, with much of the terrain classified as hilly. Keelung has a well-developed river network. The main river system is the Keelung River and its tributaries, including Dawulun River, Shicuokeng River, as well as the Nanrong, Xiding, and Tianliao Rivers, which belong to the Keelung Harbor catchment. Due to the surrounding steep terrain, most tributaries are characterized by rapid flows and narrow channels, leading to swift river level rises during heavy rainfall. Additionally, the widespread impervious surfaces in the low-lying areas around Keelung Port contribute to increased surface runoff, significantly heightening the risk of flooding.
Flooding conditions vary significantly among Keelung’s districts, reflecting the combined effects of topography, river distribution, and levels of urbanization. The interaction between terrain and climatic factors plays a crucial role in flood generation. During northeast monsoons or typhoons, moisture-laden air masses are forced upward by the mountainous terrain, intensifying rainfall on the windward slopes. Combined with the city’s high level of urban development and the extensive coverage of impervious surfaces, surface runoff is intensified while infiltration capacity is diminished, further exacerbating flood risks.
Typhoon Krathon, the 18th tropical cyclone in the Northwest Pacific during 2024, originated over the eastern waters of the Philippines in early October (Fig. 1). According to data from the Central Weather Administration (CWA) of Taiwan [30], Typhoon Krathon reached a maximum sustained wind speed of 51 m/s and a minimum central pressure of 915 hPa, classifying it as a strong typhoon. Based on the CWA’s typhoon track classification system, Krathon followed a Type VII path (Fig. 1), passing through the western waters of Taiwan without making landfall on the island. Although such typhoons do not directly strike Taiwan, their outer circulation and associated meteorological interactions can still cause significant impacts in northern Taiwan.
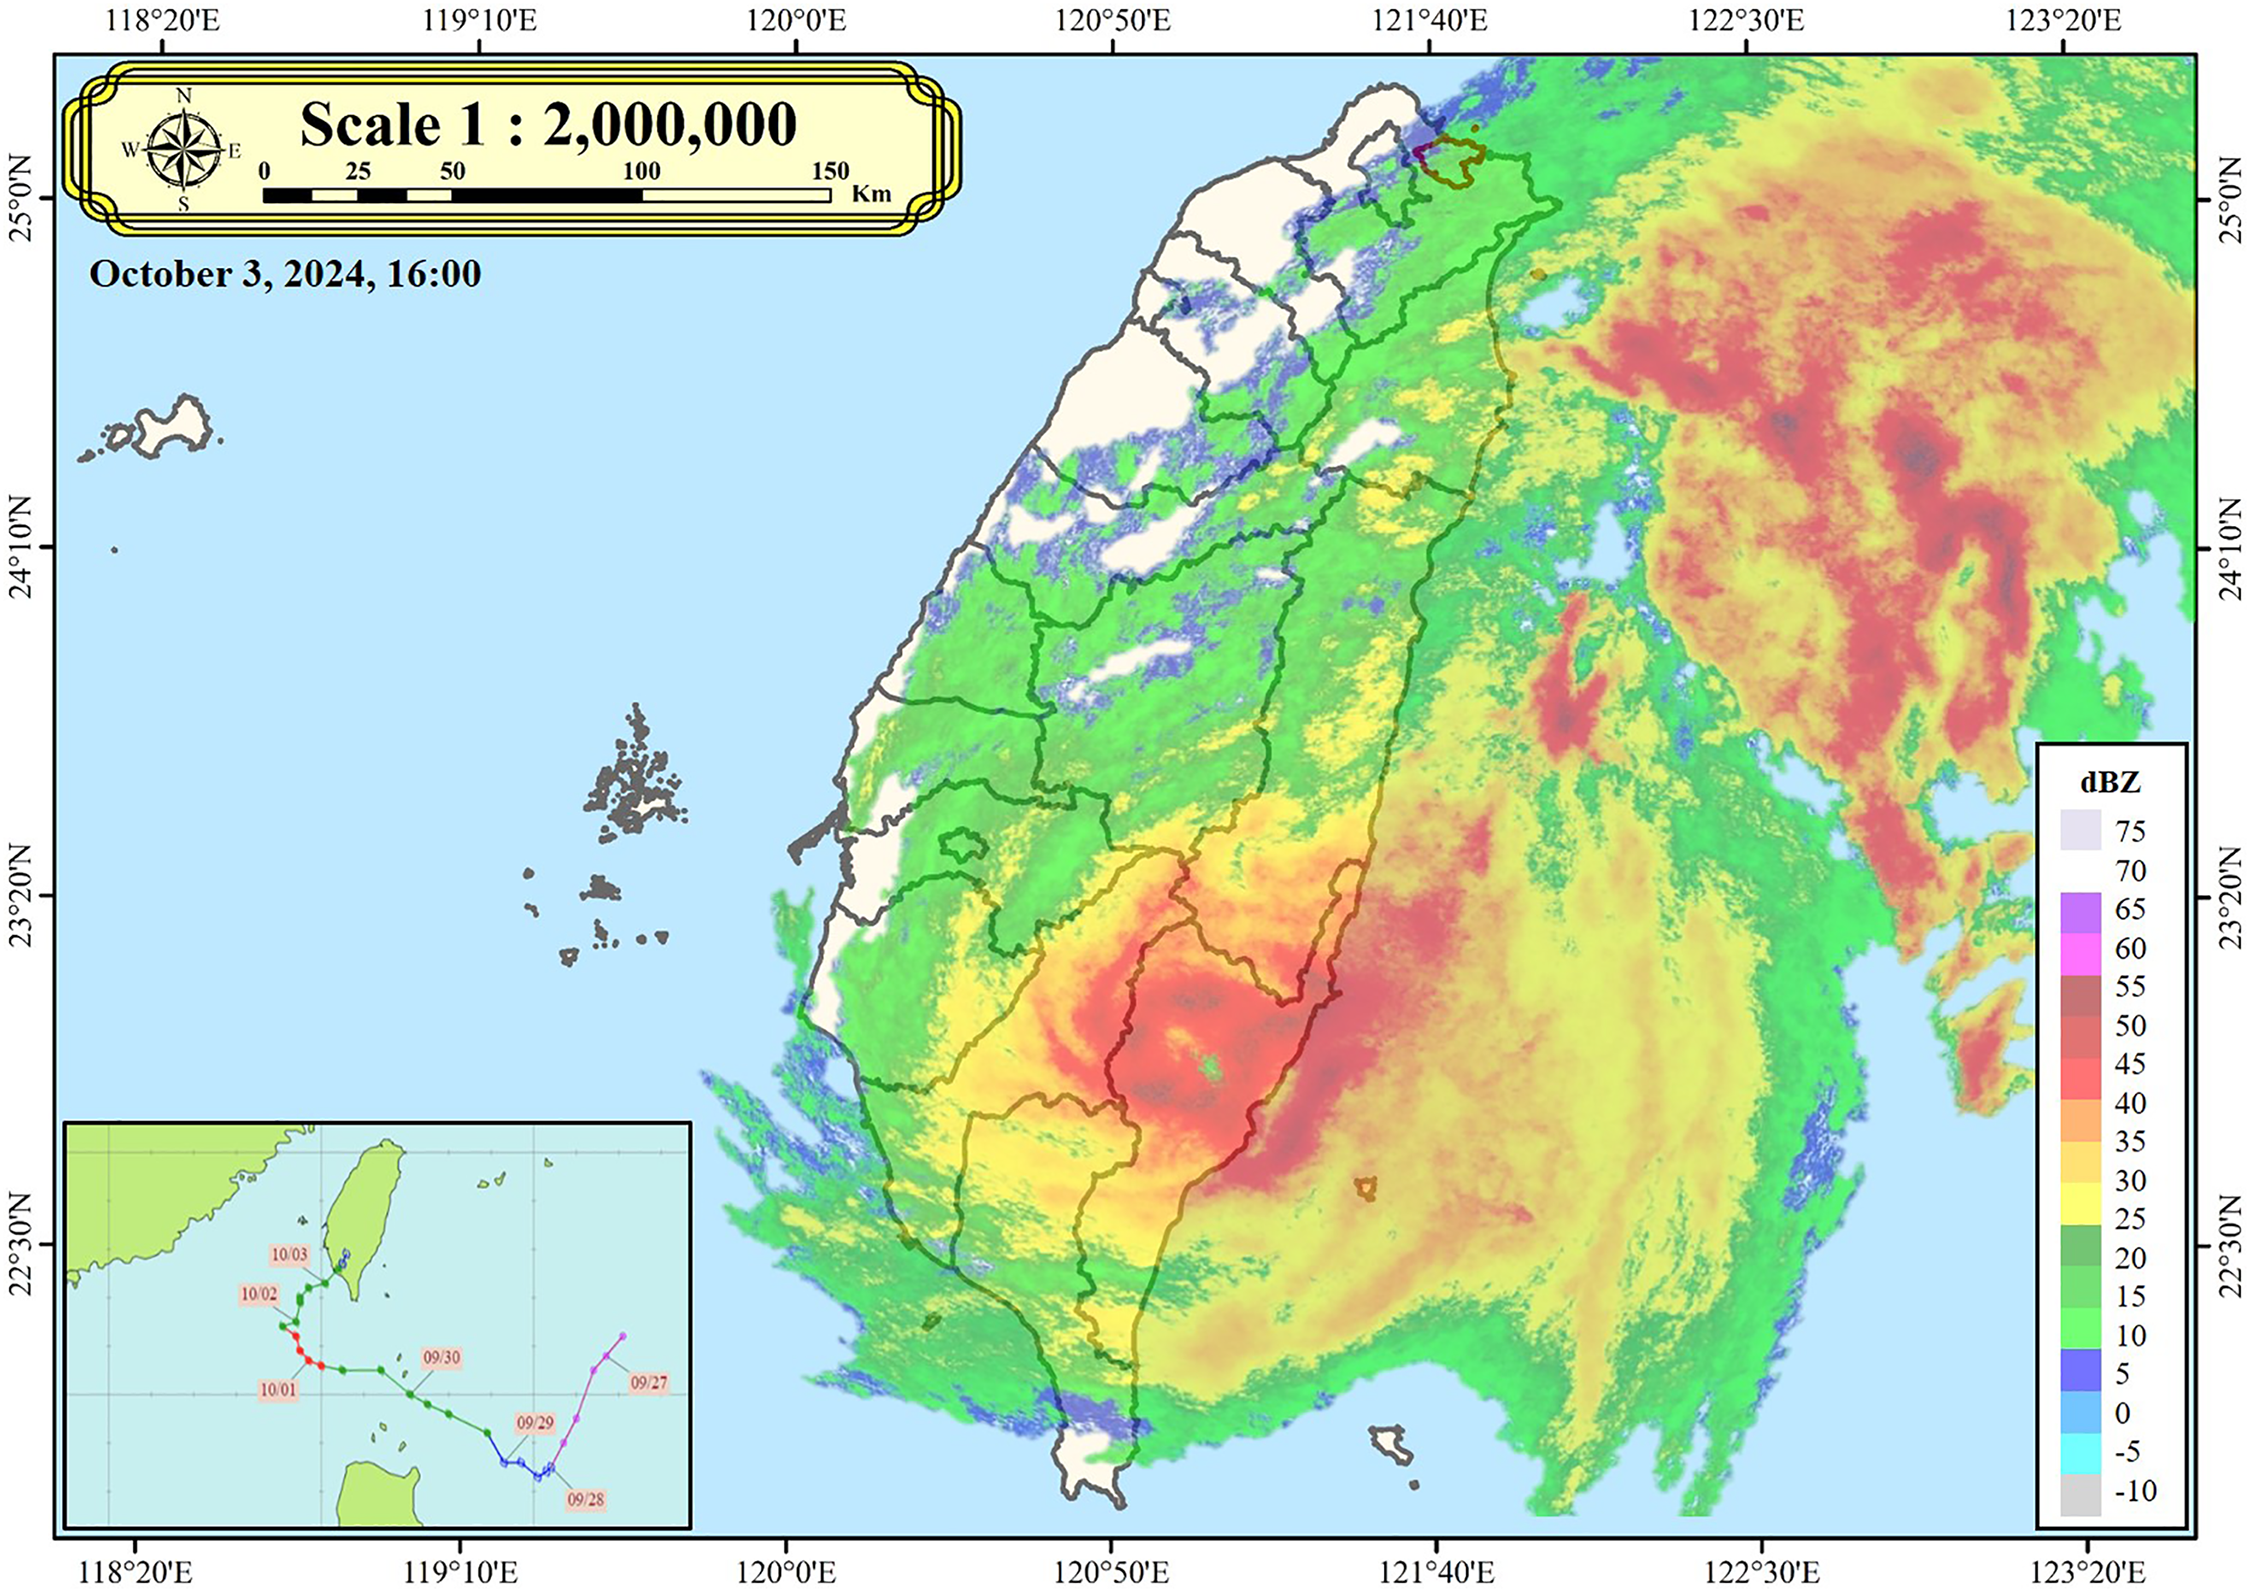
Figure 1: Typhoon Krathon potential track map and radar reflectivity image [33]
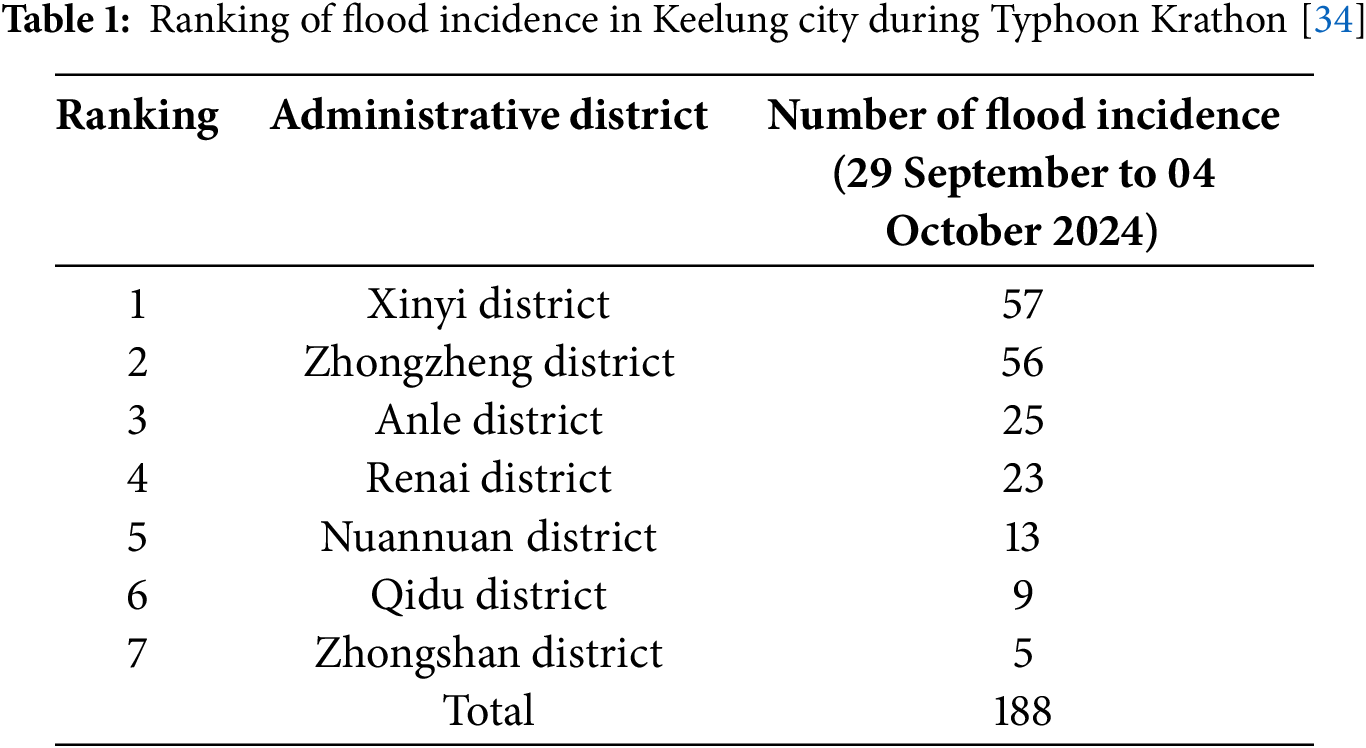
The resulting flood disaster in Keelung City is illustrated in Fig. 2 and summarized in Table 1. Typhoon Krathon had a severe impact on Keelung City, with flooding being the most critical issue. Multiple low-lying areas experienced substantial inundation, breaking historical rainfall records since the establishment of local meteorological stations. Based on flood incident records obtained from the Keelung City Fire Department, this study employed GIS to compile and analyze the affected locations. The results indicated that Xinyi District and Zhongzheng District were the most severely impacted, with 57 and 56 recorded flooding incidents, respectively. GIS analysis further revealed that most of the flood events occurred in low-lying areas and near tributary convergence zones.
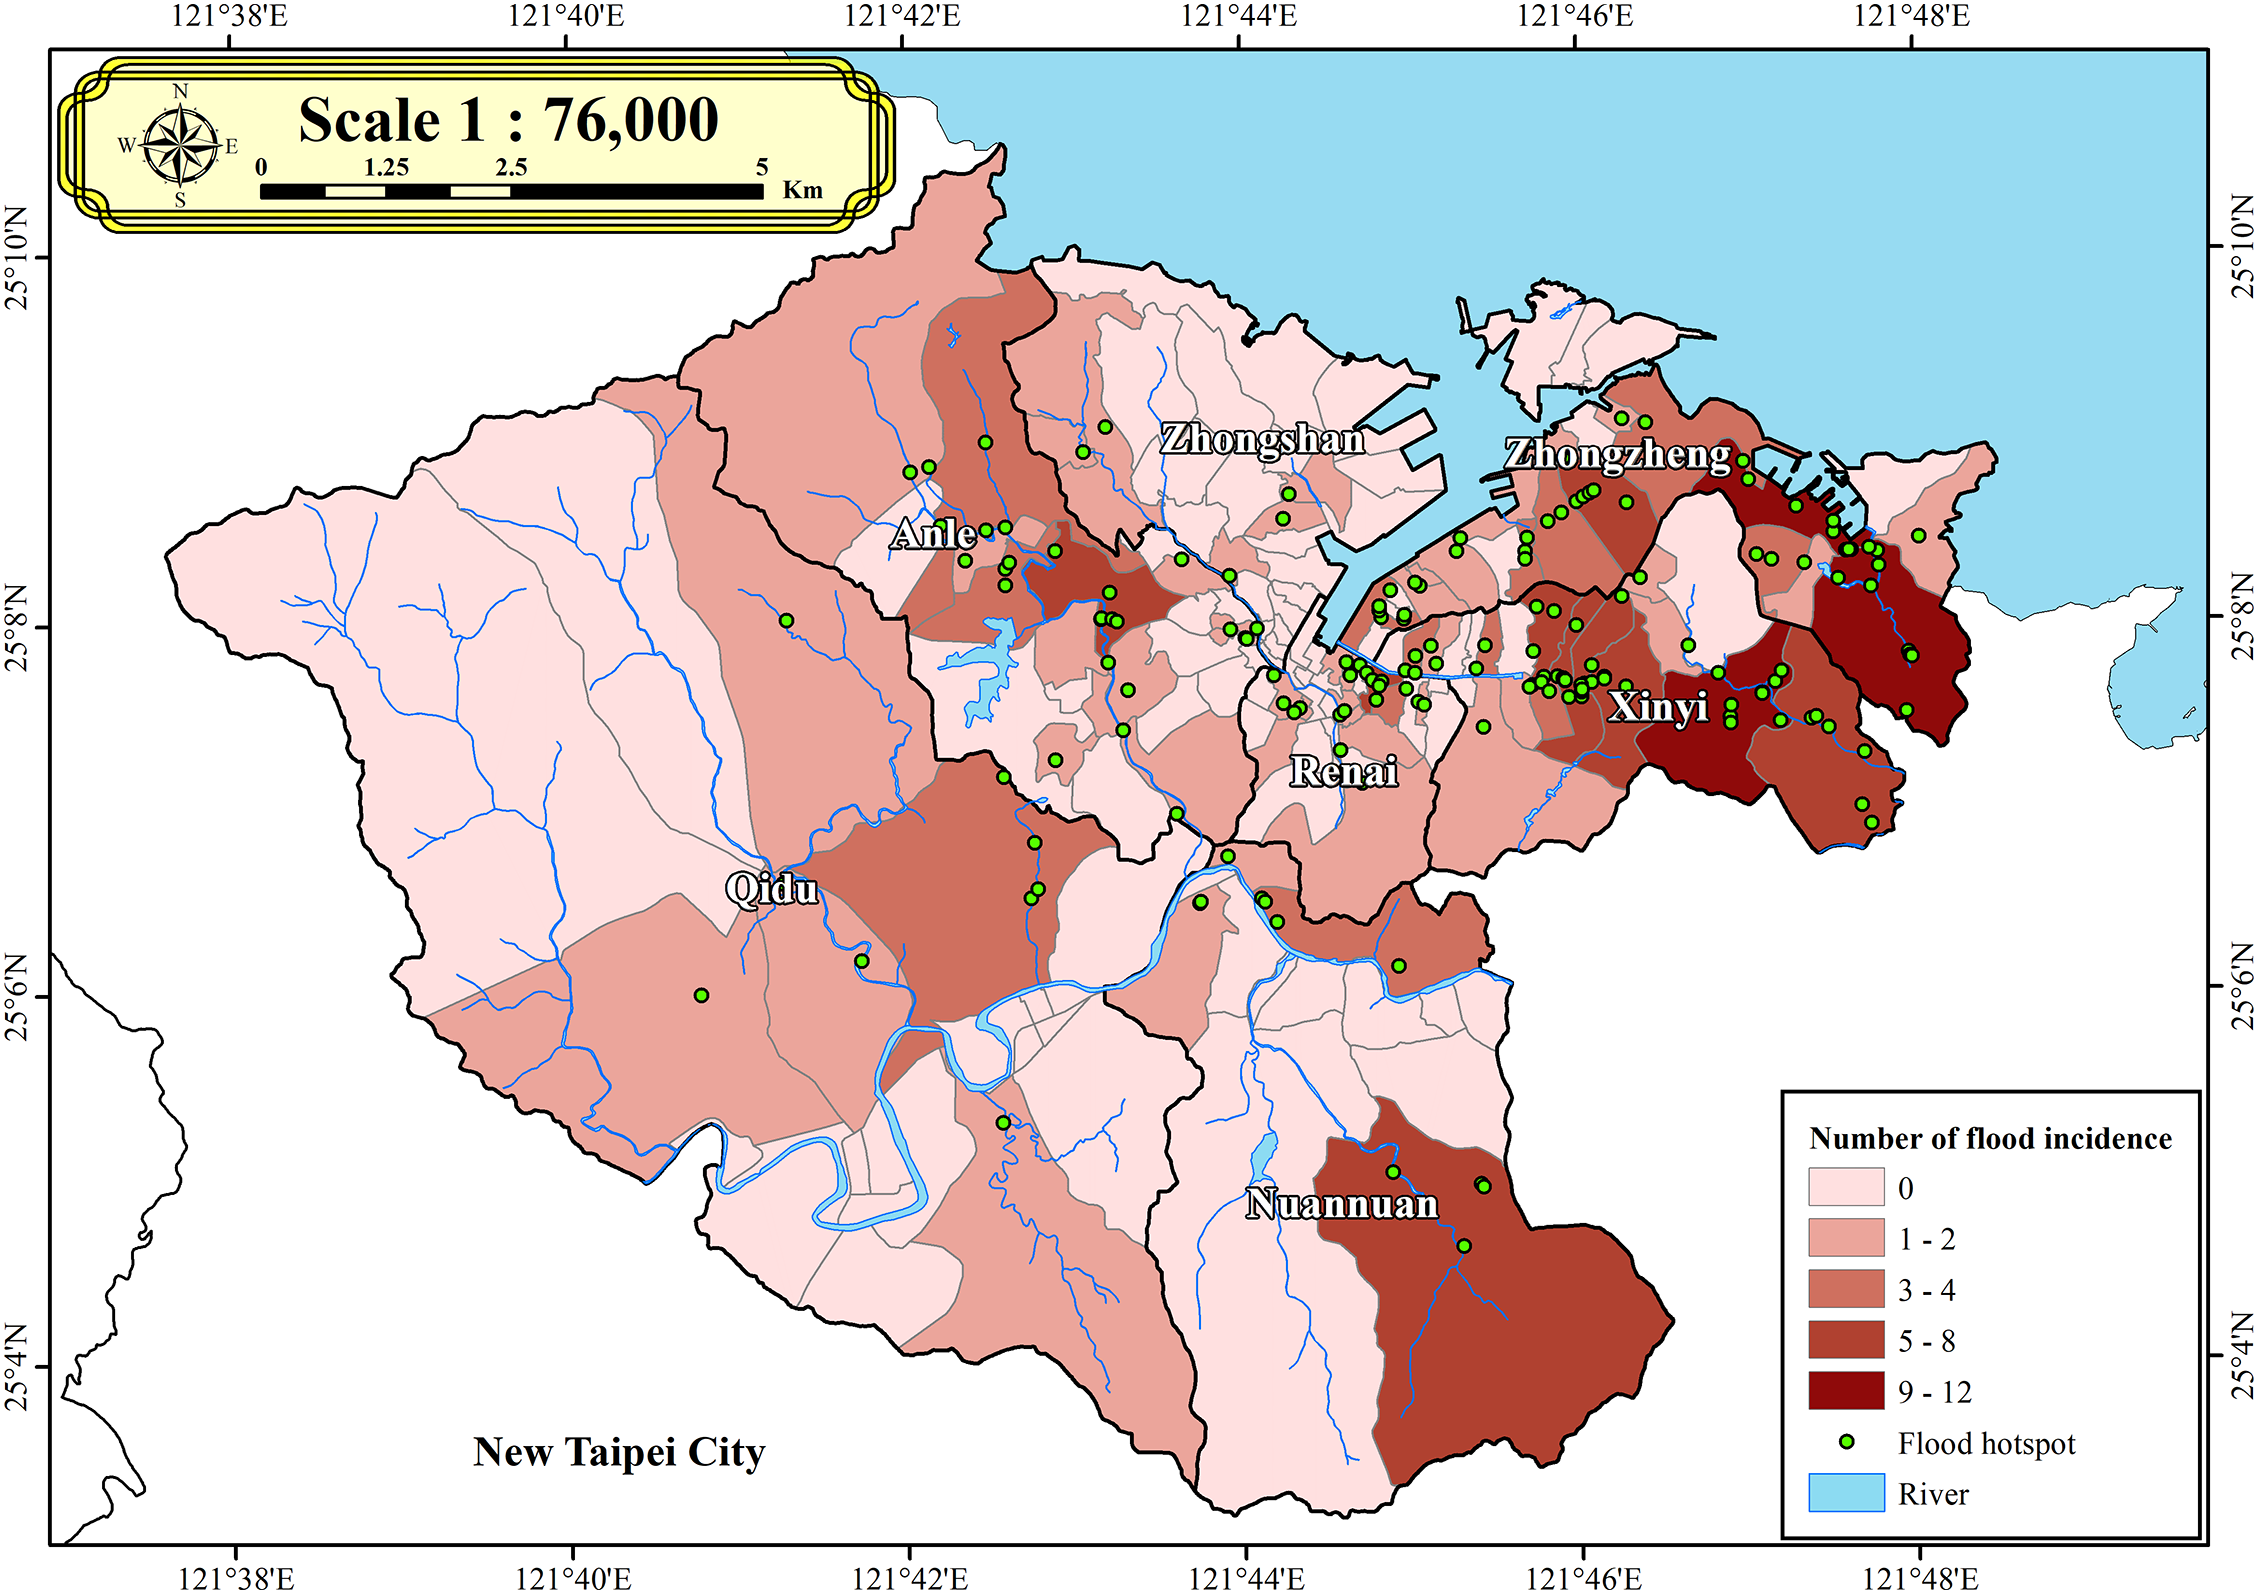
Figure 2: Spatial distribution of flood hotspots during Typhoon Krathon
During Krathon’s passage through the Taiwan Strait, it coincided with the intensification of the northeast monsoon, forming a classic typhoon–monsoon co-effect interaction. This leads to prolonged heavy rainfall along Taiwan’s northeastern coast [31,32]. Unlike the short-duration, high-intensity rainfall typically associated with direct typhoon strikes, this event exhibited long-lasting and extreme cumulative precipitation. The Keelung weather station recorded a maximum 24-h cumulative rainfall of 450.5 mm during the event, surpassing historical records and significantly exceeding the design capacity of Keelung’s flood system. This highlights that Typhoon Krathon may appear distant from northern Taiwan in terms of track, their hydrometeorological impacts can be profound under certain circulation patterns.
Recent research on climate change suggests a rising occurrence and intensification of extreme weather events as global temperatures continue to increase. The case of Typhoon Krathon underscores the extreme rainfall potential when interacting with the northeast monsoon, presenting new challenges for disaster risk reduction in northern Taiwan.
This study focuses on Typhoon Krathon as the primary case for flood susceptibility analysis. All hydrometeorological datasets incorporated into the RF model, including flood incidence records and rainfall data, are derived directly from Typhoon Krathon’s impact on Keelung City on 03 October 2024. Building on this case, this study aims to develop machine learning models specifically trained on this type of typhoon track to improve predictions of rainfall spatial distribution and intensity under future climate change scenarios.
2.3 Geospatial Dataset and Preprocessing
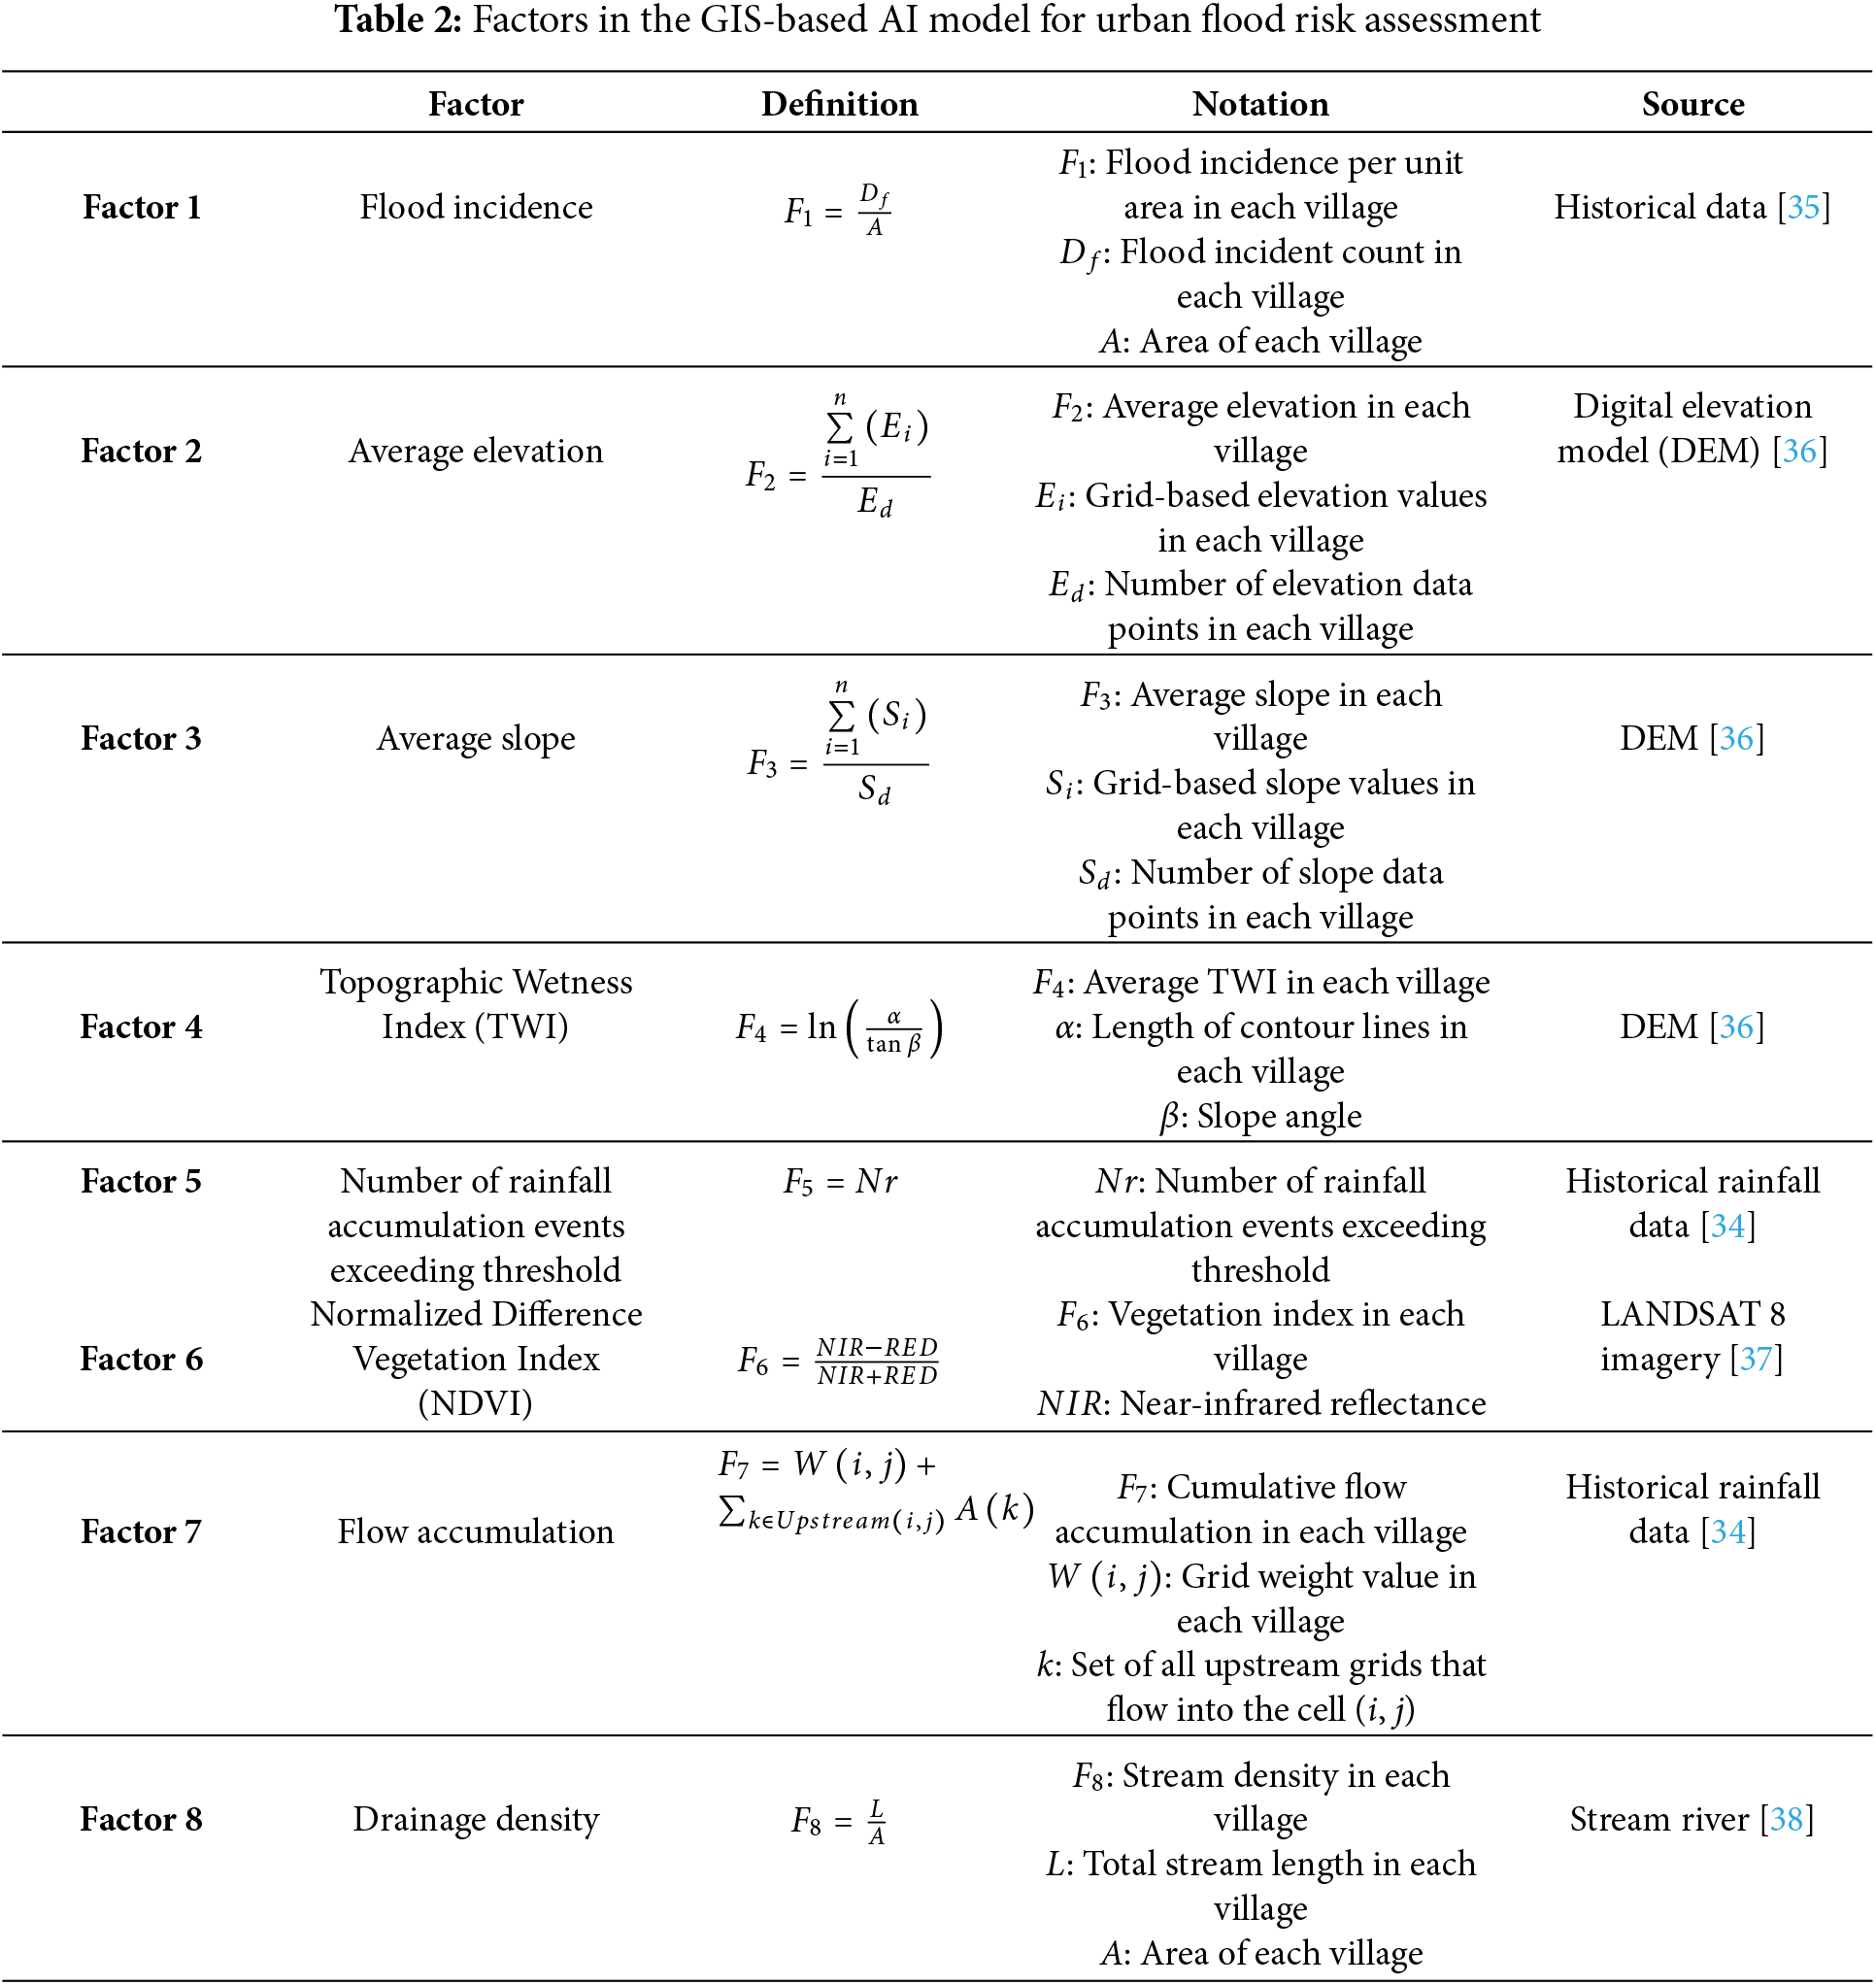
This study employed a range of multi-source datasets to enhance the accuracy and reliability of the flood hazard prediction model. As presented in Table 2, the key fundamental datasets used in the research are described as follows.
First, a 10-m resolution digital elevation model (DEM) dataset from the year 2022 was obtained from the Department of Land Administration, Ministry of the Interior, Taiwan. The DEM data provided essential topographic elevation information for the study area, enabling the derivation of slope, TWI, and flow accumulation—critical input layers for geospatial analysis.
Second, historical flood event point data were collected from the Keelung City Fire Department. These records contain spatial and temporal information, as well as severity levels, for flood events that occurred between 2012 and 2024. This dataset served as the basis for calculating the flood occurrence frequency per unit area in each administrative village and was crucial for model training and validation, enabling identification of high-risk flood zones.
Third, precipitation data were acquired from the Central Weather Administration under the Ministry of Transportation and Communications. These datasets provided detailed spatiotemporal rainfall distributions, allowing analysis of the correlation between rainfall intensity and flood events and supporting the modeling of threshold-based rainfall accumulation associated with flood occurrences.
Lastly, satellite imagery from Landsat 8 and 9, captured in 2024, was acquired from the United States Geological Survey (USGS). These remote sensing datasets provided key environmental parameters, including land cover, vegetation condition, and surface water distribution within the study area. Vegetation indices derived from the imagery were instrumental in assessing the effects of land use changes on flood risk.
All raw data underwent rigorous preprocessing, including spatial and temporal synchronization and outlier detection, to ensure data quality. Moreover, GIS techniques were used to integrate datasets from diverse sources into a unified spatial reference system. This integration enabled the construction of high-quality, multidimensional input features for the ML model. Such comprehensive data integration allowed for a more holistic analysis of both natural and anthropogenic factors influencing flood hazards and significantly improved the performance of the predictive model.
Factor 1, defined as the number of flood disaster occurrences per unit area in each village, was derived from historical disaster point data related to Typhoon Krathon, which impacted Keelung City on 03 October 2024. Typhoon Krathon resulted in a record-breaking daily maximum rainfall of 408 mm, as recorded at the Keelung weather station.
After digitization, the flood disaster frequency in each village was normalized by its corresponding area. As shown in Fig. 3a, coastal areas such as Zhongshan and Zhongzheng Districts, as well as Renai District surrounding the Port of Keelung, exhibit significantly higher flood disaster frequencies per unit area compared to inland areas like Qidu and Nuannuan Districts. The analysis indicates that Zhaolian Village in Renai District recorded the highest number of flood events per unit area. Furthermore, areas with higher flood frequencies per unit area are primarily concentrated in low-lying regions around the Port of Keelung.
where
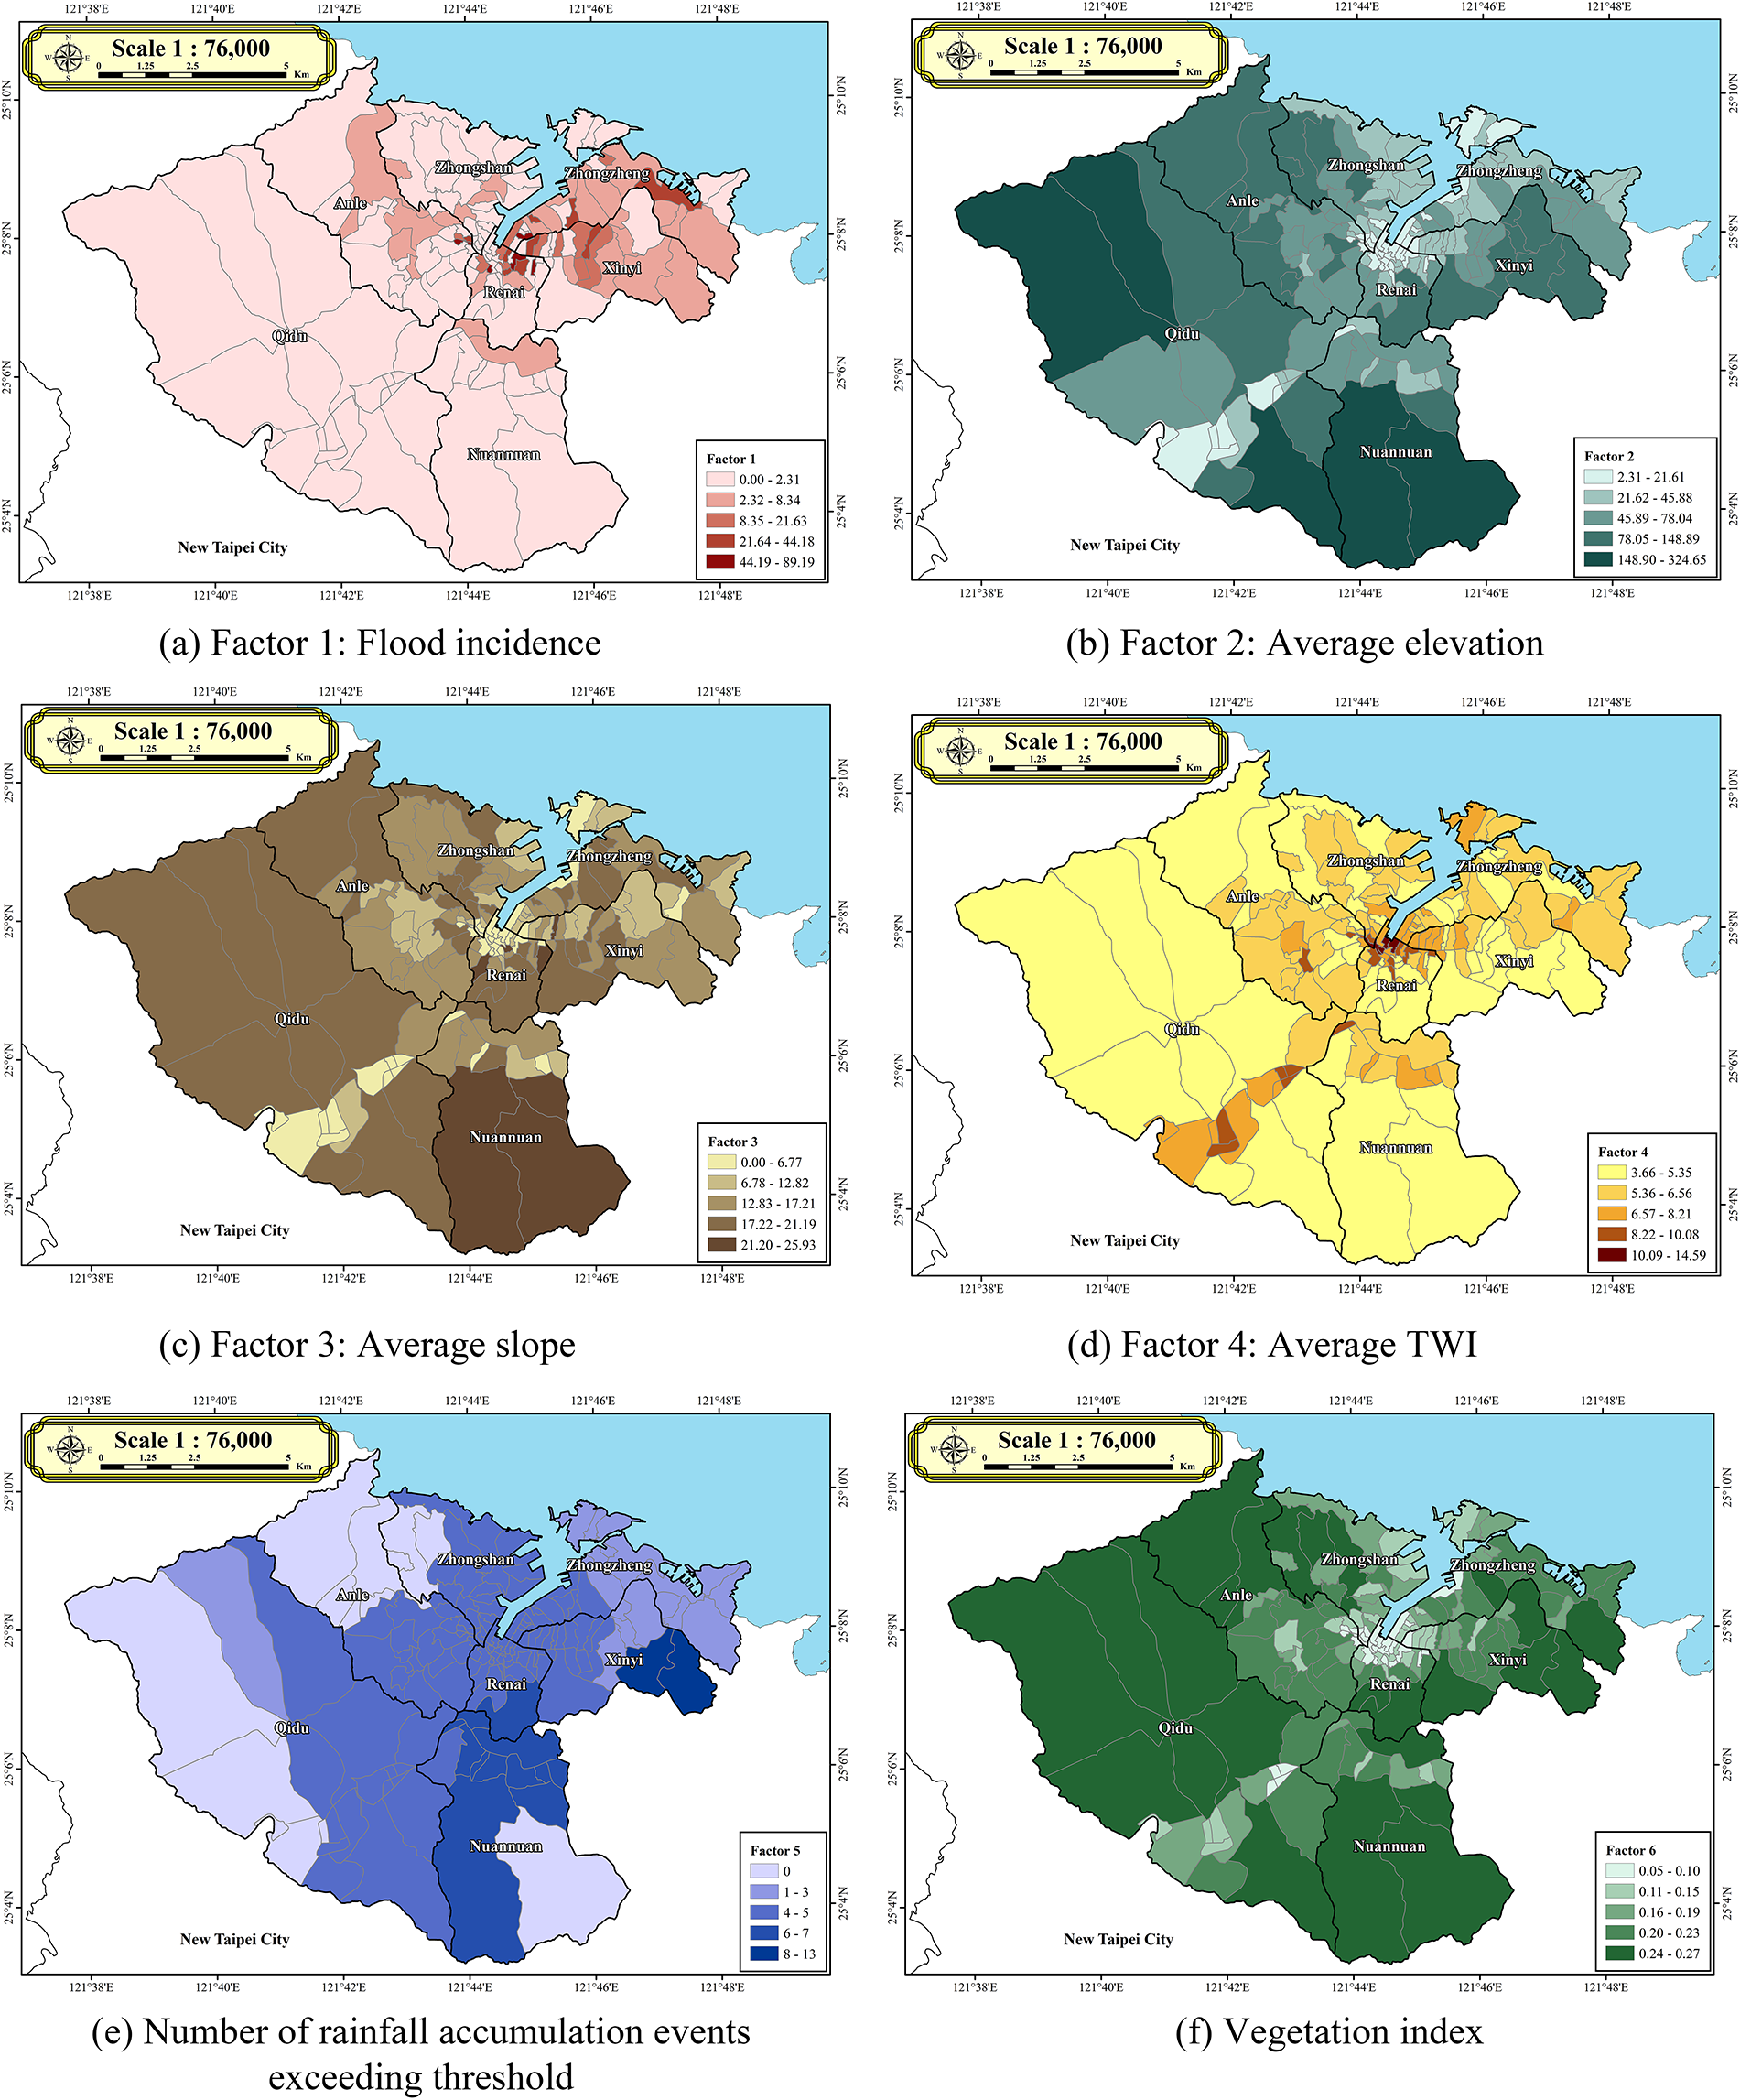
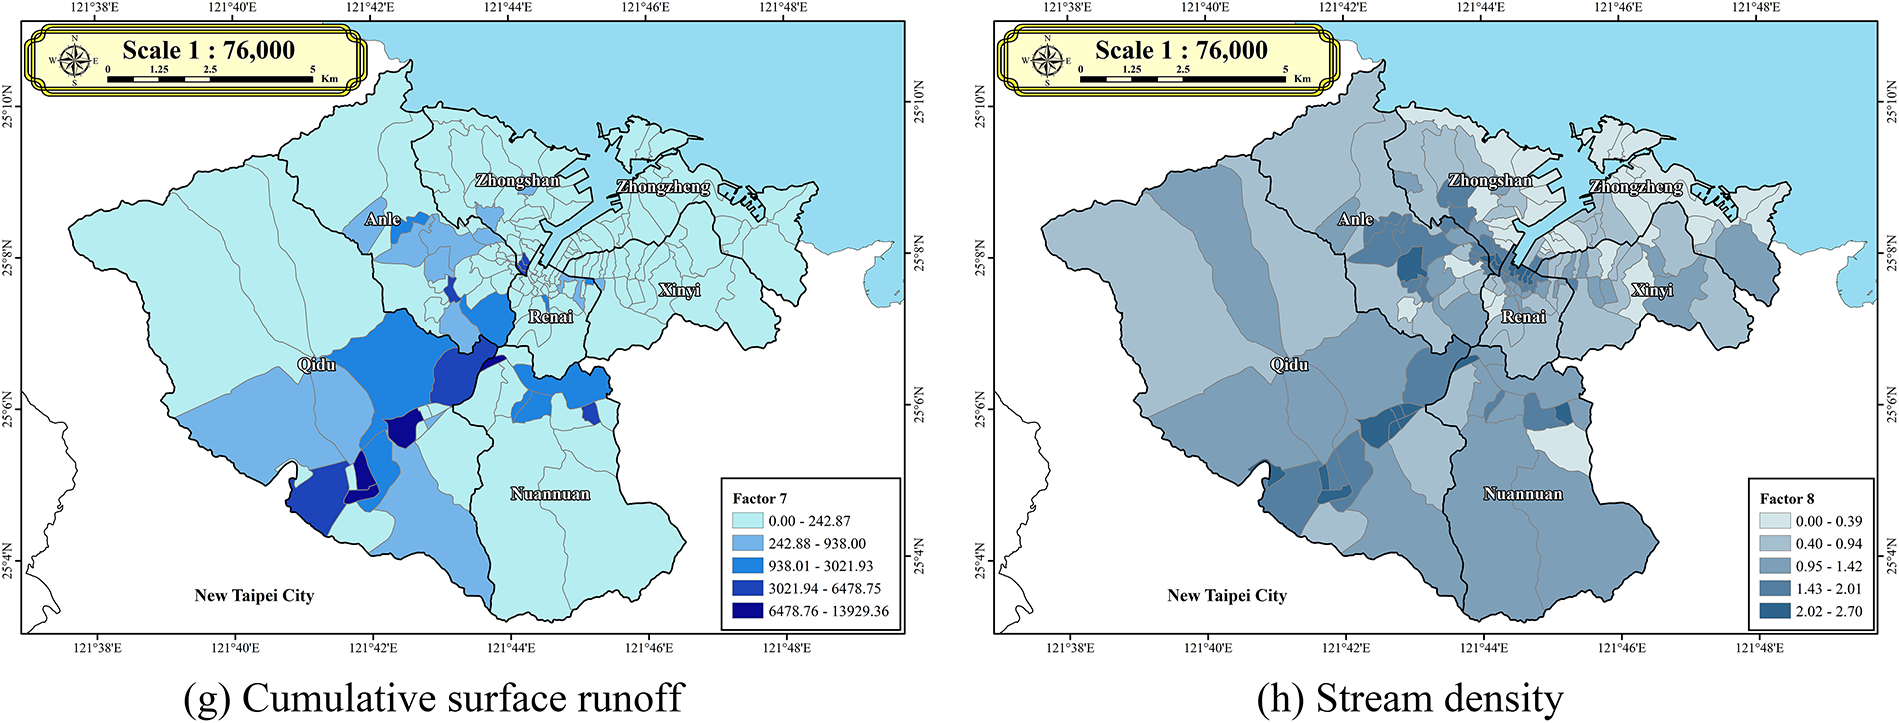
Figure 3: GIS variables for various flood incident factors
Factor 2, representing elevation, was obtained from the DEM provided by the Department of Land Administration, Ministry of the Interior. As shown in Fig. 3b, the highest average elevation in Keelung City is found in Nuandong Village of Nuannuan District, reaching approximately 324.65 m. Areas with lower average elevations are primarily concentrated around Keelung Harbor and along the Keelung River.
where
Factor 3, representing slope, was derived from the DEM provided by the Department of Land Administration, Ministry of the Interior. The data were processed and aggregated to present the average slope for each village within the GIS. As shown in Fig. 3c, the steepest average slope is found in Dingxiang Village of Nuannuan District, reaching approximately 25.93 degrees. Areas with lower average slopes are primarily concentrated around Keelung Harbor and along the Keelung River.
where
2.3.4 Topographic Wetness Index (TWI)
Factor 4, the TWI, was derived using the DEM provided by the Department of Land Administration, Ministry of the Interior. The TWI values for each village in Keelung City were computed using built-in tools within the GIS. TWI effectively quantifies the spatial distribution characteristics of flood-affected surfaces. The results indicate that areas with high TWI values typically correspond to zones with low slopes and high flow accumulation—conditions that favor water convergence and therefore present elevated flood risk. The analysis further confirms that regions with higher TWI values are primarily concentrated around Keelung Harbor and the Keelung River, consistent with the city’s historical flood-prone areas. As shown in Fig. 3d, elevated TWI values are observed near the harbor and city center, whereas lower values are generally found in the western part of Qidu District and the southern part of Nuannuan District.
where
2.3.5 Number of Rainfall Accumulation Events Exceeding Threshold
One of the primary causes of flood disasters is the frequency of short-duration, high-intensity rainfall events. Therefore, Factor 5, defined as the number of times accumulated rainfall exceeds a specified threshold, serves as a key indicator in this study. To determine an effective threshold, various hourly rainfall accumulations during Typhoon Krathon’s peak impact on Taiwan (03 October 2024) were tested. The results indicated that the number of events in which 3-h cumulative rainfall exceeded 70 mm yielded the best performance in the model’s output layer. Consequently, this threshold was selected for Factor 5 to analyze the spatial characteristics of short-duration heavy rainfall in Keelung City. As shown in Fig. 3e, the number of threshold-exceeding rainfall events is relatively high in the southern part of Renai District, Xinyi District, and the northern part of Nuannuan District, while lower values are observed in the western and northern areas of Qidu District. To simulate the spatial distribution of rainfall, the Thiessen Polygon Method was employed. This method divides the study area into polygons based on the locations of rainfall stations, assigning each polygon the rainfall value recorded at the corresponding station—an approach well-suited for unevenly distributed stations. Using this method, the spatial rainfall pattern during Typhoon Krathon was analyzed, and the 3-h rainfall threshold of 70 mm was confirmed as the most effective input for flood risk assessment.
2.3.6 Normalized Difference Vegetation Index (NDVI)
In this study, Factor 6, village-level NDVI, was derived using satellite imagery data from Landsat 8 and 9 provided by the USGS. The NDVI values were processed and aggregated within a GIS to represent the average vegetation index per village in Keelung City.
NDVI is based on the differential reflectance of vegetation in specific spectral bands: healthy vegetation reflects more near-infrared (NIR) light and absorbs more red light. Therefore, higher NDVI values indicate denser and healthier vegetation coverage. NDVI values correspond to various surface cover types: values below 0 typically represent water bodies or snow-covered areas; values between 0–0.1 indicate barren land or rock; values from 0.2–0.5 suggest shrubland or deciduous forests; and values between 0.6–0.8 are indicative of tropical rainforest conditions.
As shown in Fig. 3f, NDVI values in Keelung City range from approximately 0.05 to 0.27, demonstrating significant spatial variation. Higher NDVI regions (0.24–0.27), shown in dark green, are concentrated in the peripheral areas of Anle District, the outskirts of Zhongshan District, and parts of Xinyi District, indicating better vegetation coverage. Conversely, lower NDVI values (0.05–0.10), represented in light green, are mostly found in urbanized core areas, where vegetation is sparse.
Lower NDVI values are associated with increased flood risk. Vegetation plays a critical role in mitigating flood hazards by enhancing surface infiltration, slowing down runoff velocity, and improving soil water retention. Urban areas, characterized by impervious surfaces and reduced natural vegetation, typically exhibit lower NDVI values and therefore face heightened vulnerability to flooding events.
where
In this study, Factor 7, flow accumulation by village, was derived using the 5-m DEM provided by the Department of Land Administration, Ministry of the Interior. Utilizing built-in tools within a GIS, flow accumulation values were calculated for each village within Keelung City. The results reveal clear spatial variability in flow accumulation across the city. As shown in Fig. 3g, darker blue areas indicate regions with higher flow accumulation, primarily located in the southern part of Qidu District and the western part of Nuannuan District—areas largely situated within the Keelung River basin. Conversely, light blue to white areas represent zones with lower accumulation, typically corresponding to higher elevations or regions outside major flow convergence paths.
It is important to note that the flow accumulation values were computed using ArcGIS tools and represent relative indices rather than actual measured discharge values. Nevertheless, these indices effectively identify potential runoff convergence zones, particularly along the main course of the Keelung River. Areas with high flow accumulation are typically key pathways for surface runoff during rainfall events and are thus considered high-risk zones for flood hazards.
where
In this study, Factor 8, stream density by village, was derived using the 5-m DEM provided by the Department of Land Administration, Ministry of the Interior. Utilizing built-in tools within a GIS, stream density values were computed for each village within Keelung City. As shown in Fig. 3h, areas with higher stream density are primarily concentrated around Keelung Port, the Keelung River, and the Dawulun River, highlighted by darker blue regions on the map. Stream density is directly correlated with flood risk. Regions with higher stream density typically experience greater surface runoff. When rainfall intensity exceeds the drainage capacity, these areas become more susceptible to flood hazards.
where
3 Artificial Intelligence Model for Flood Susceptibility Assessment
The RF algorithm (Fig. 4) employs ensemble learning by building multiple decision trees, each trained independently using bootstrapped training subsets and randomly sampled input features to enhance model robustness. This dual-randomization strategy applied to both data and features promotes model diversity and reduces inter-tree correlation, thereby enhancing generalization performance and mitigating overfitting. Each decision tree is grown recursively under constraints such as maximum depth or minimum sample size for splits. Predictions are aggregated across trees by averaging for regression or majority voting for classification enhancing generalization and reducing overfitting through randomized tree construction.
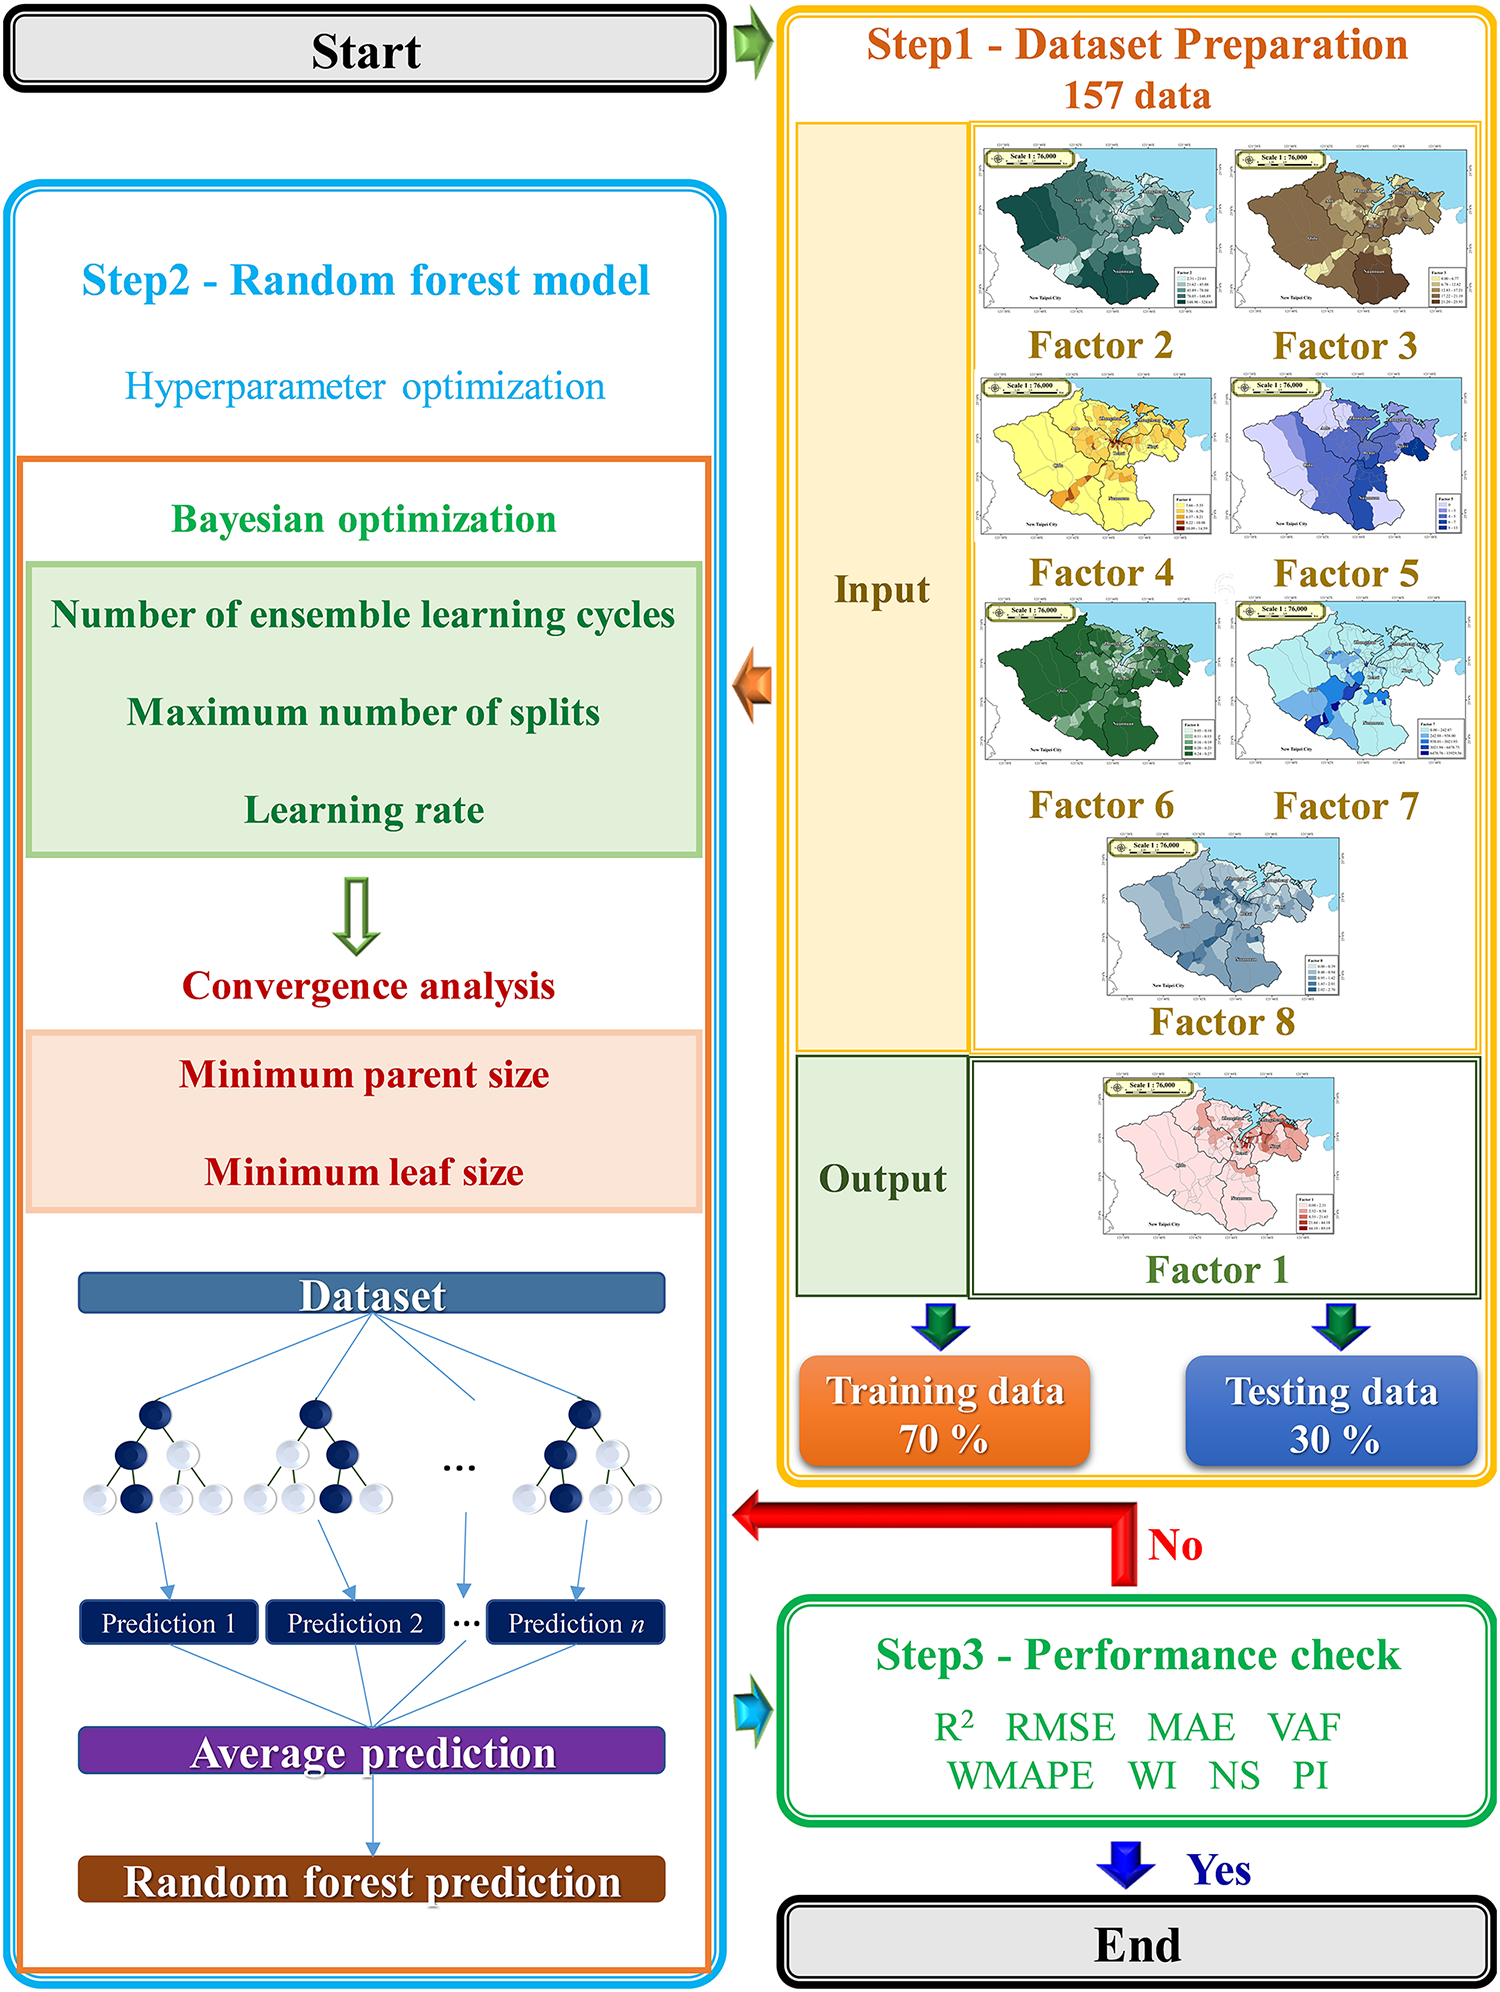
Figure 4: Flowchart of the GIS-based AI model for urban flood risk assessment
Fig. 4 presents the flowchart of the proposed GIS-based AI framework for urban flood risk assessment. In Step 1, data preprocessing and preparation are carried out. The model incorporates eight input variables (denoted as Factors 1 through 8) and one output variable, with a total of 157 data records. Of these, 70% (110 records) are allocated for model training, while the remaining 30% (47 records) are reserved for testing purposes. Step 2 involves the construction of the RF model. Hyperparameter tuning is performed using Bayesian optimization to identify the optimal number of ensemble learning cycles, learning rate, and maximum number of splits. Furthermore, convergence analysis is employed to determine appropriate values for the minimum parent size and minimum leaf size parameters. Upon achieving an optimized model configuration, the process proceeds to Step 3, which entails performance evaluation. A set of statistical performance metrics is utilized to assess the model’s predictive accuracy and generalization capability. Once convergence is achieved and the model satisfies the predefined performance criteria, the modeling procedure is concluded.
The performance of the proposed model was assessed using a suite of evaluation metrics, including the coefficient of determination (R2), root mean square error (RMSE), variance accounted for (VAF), performance index (PI), mean absolute error (MAE), Willmott’s index of Agreement (WI), weighted mean absolute percentage error (WMAPE), and Nash–Sutcliffe efficiency coefficient (NS) to validate the accuracy of the model developed in this study [10]. The definitions of the aforementioned performance metrics are as follows:
In the above equation,
4.1 Hyperparameter Optimization
This study firstly conducted a hyperparameter analysis to evaluate model performance under different configurations. The dataset was split into a training set comprising 70% of the data and a testing set comprising the remaining 30% to facilitate model evaluation. The proposed AI-model type was set to regression, with the splitting criterion defined by the MSE. All variables were included in the sampling strategy (Number of variables to sample = All), and surrogate splits were enabled to improve handling of missing values or alternative splits. Pruning was disabled to allow full tree growth. The quadratic error tolerance was set to 10−6, ensuring a high level of precision during model fitting. The minimum parent size and minimum leaf size were configured as 10 and 1, respectively, to control tree complexity and avoid overfitting. The maximum number of splits was limited to 41, balancing model flexibility and interpretability. For ensemble learning, 341 learning cycles were performed, facilitating gradual convergence and reducing the risk of overshooting during optimization. These hyperparameter settings were selected based on preliminary tuning to achieve optimal performance in the regression tasks.
Table 3 summarizes the predictive performance achieved using various hyperparameter optimization techniques. Among the three methods, Bayesian optimization consistently outperformed grid search and random search across most evaluation metrics. The coefficient of determination (R²) value achieved by Bayesian optimization was 0.83, higher than 0.78 (random search) and 0.73 (grid search). In terms of RMSE, Bayesian optimization yielded the lowest error at 7.85 × 10⁻³, compared to 9.03 × 10⁻³ for random search and 8.44 × 10⁻³ for grid search.
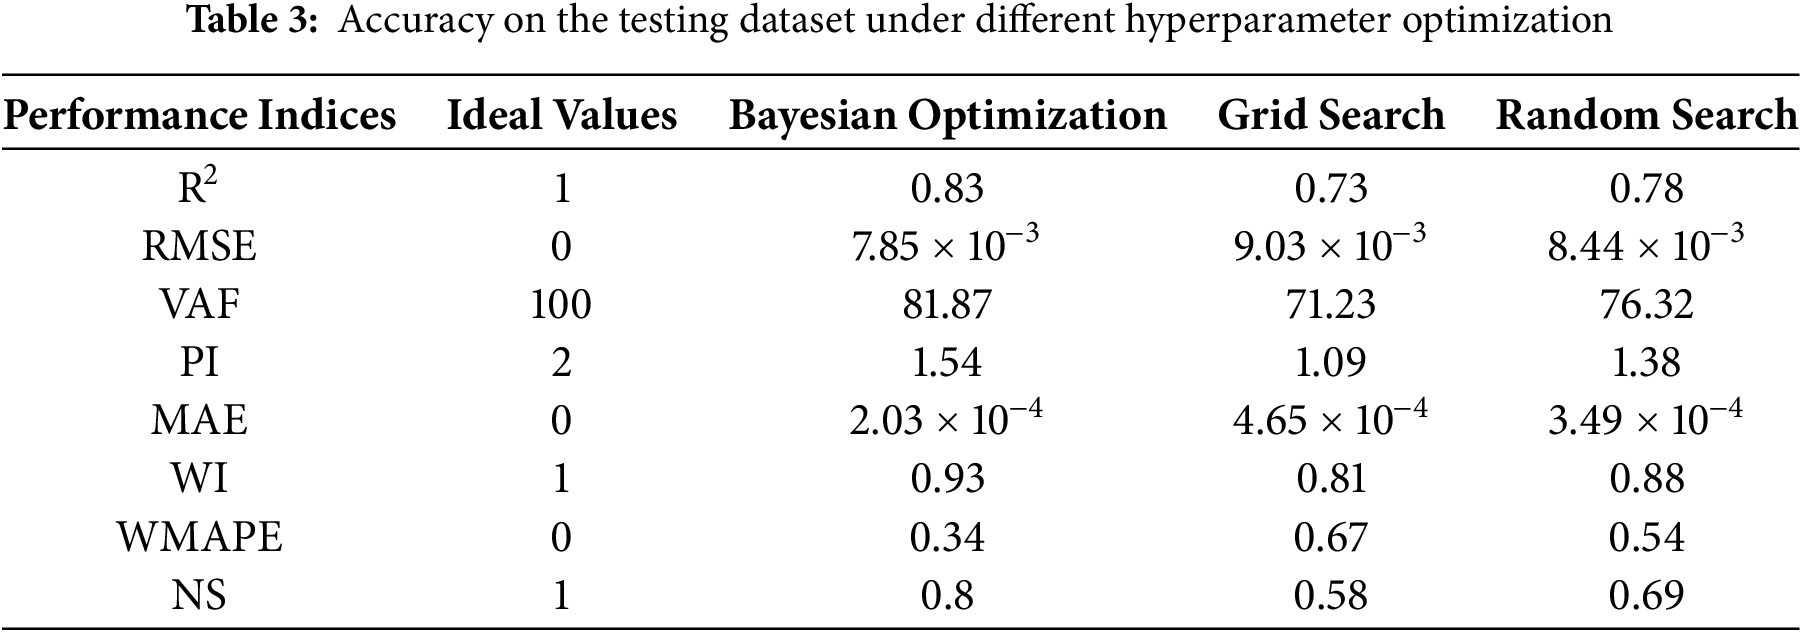
For VAF, Bayesian optimization reached 81.87%, while random search and grid search achieved 76.32% and 71.23%, respectively. The PI of Bayesian optimization was 1.54, higher than 1.38 (random search) and 1.09 (grid search). In terms of MAE, Bayesian optimization obtained the lowest value at 2.03 × 10⁻⁴, compared to 4.65 × 10⁻⁴ (random search) and 3.49 × 10⁻⁴ (grid search). The WI for Bayesian optimization was 0.93, outperforming random search (0.88) and grid search (0.81). In WMAPE, Bayesian optimization had the best performance with a value of 0.34, compared to 0.54 (random search) and 0.67 (grid search). Finally, in terms of NS, Bayesian optimization achieved 0.80, while random search and grid search reported 0.69 and 0.58, respectively. These results confirm the quantitative advantage of Bayesian optimization in hyperparameter tuning.
The convergence analysis of hyperparameters related to minimum parent and leaf size is illustrated in Fig. 5. The vertical axis represents the R² as the error metric, while the horizontal axis shows the values of the minimum leaf size and minimum parent size. As observed, the optimal performance is achieved when the minimum leaf size is set to 1 and the minimum parent size is set to 10, corresponding to the highest R² value in the evaluation.
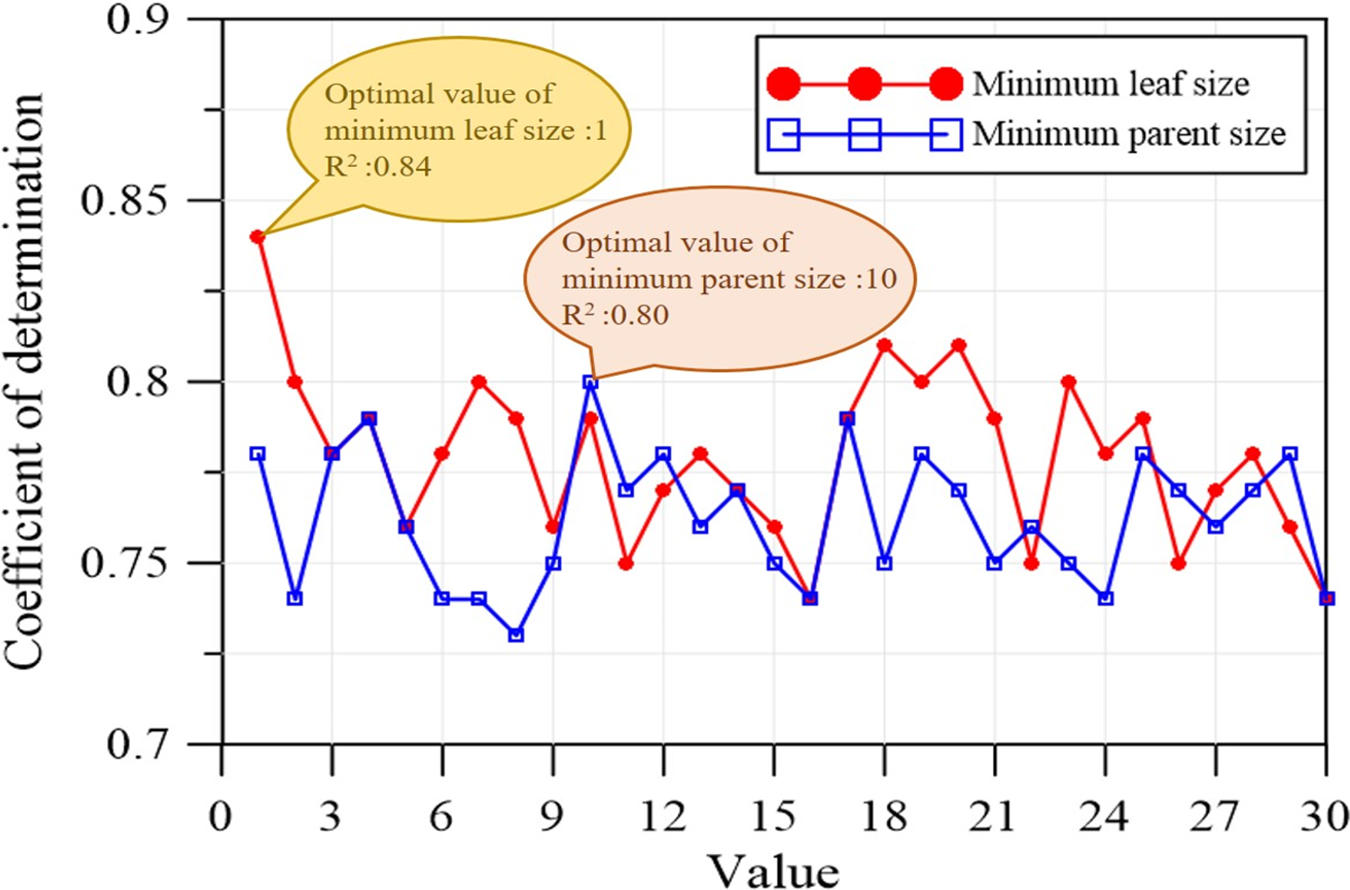
Figure 5: Hyperparameter analysis of the proposed AI model
Based on the optimized hyperparameters described in the previous section, an AI-based flood prediction model was developed and applied to flooding disaster analysis in Keelung City. Fig. 6 illustrates the model’s performance in predicting flood incidence using the RF regression algorithm. The results indicate that the model achieved strong statistical performance. The scatter plot shows a high degree of linear correlation between predicted and observed values for both the training dataset (red dots) and the testing dataset (blue dots), with points closely distributed around the ideal 1:1 prediction line. Quantitative evaluation reveals that the majority of data points fall within a ±20% error tolerance range, indicating a high level of predictive accuracy.
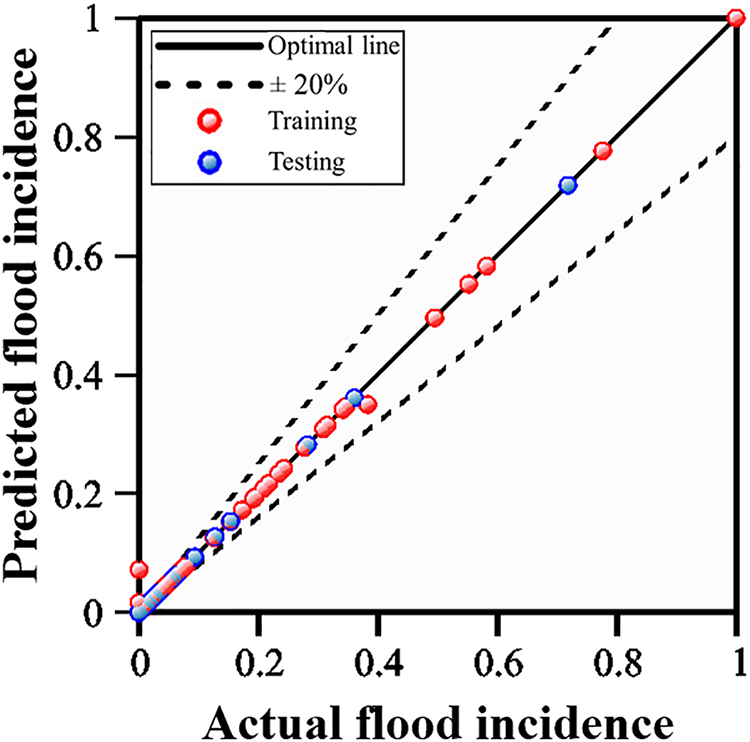
Figure 6: Performance of proposed AI model for flood susceptibility assessment
Furthermore, the distribution patterns between training and testing datasets are highly consistent, demonstrating the model’s robust generalization capability. The prediction results remain stable across the entire range of flood severity levels, confirming the model’s reliability under varying conditions. Overall, the proposed RF model exhibited excellent predictive performance in this study, characterized by high accuracy, low bias, and strong generalization ability, thereby validating its applicability for flood risk assessment in Keelung City.
The trained RF model was further applied to predict the flood incidence per unit area across administrative villages in Keelung City. The model outputs were systematically compared with historical flood records obtained from official sources. Fig. 7 presents this comparison, where Fig. 7a shows the predicted flood incidence from this study, and Fig. 7b displays the observed flood data [35]. Spatial analysis and statistical evaluation revealed a high degree of similarity between the predicted and observed spatial distribution patterns. The predicted flood frequency per unit area across districts exhibited a spatial distribution that closely matched the historical flood incidence data. Quantitatively, the RF model achieved a prediction accuracy of 97.45%, demonstrating strong agreement between model estimates and observed data. These results confirm the model’s reliability and effectiveness in capturing the spatial characteristics of flood disasters in the study area. However, it is important to note that the predicted flood incidence tends to underestimate the severity of flooding compared with observations under the Typhoon Krathon scenario. This discrepancy is largely attributable to the inherent uncertainties involved in downscaling extreme typhoon events within the RF model framework. Nevertheless, the RF model overall shows high robustness, achieving a classification accuracy of 97.45% and effectively identifying spatial patterns of flood-prone areas.
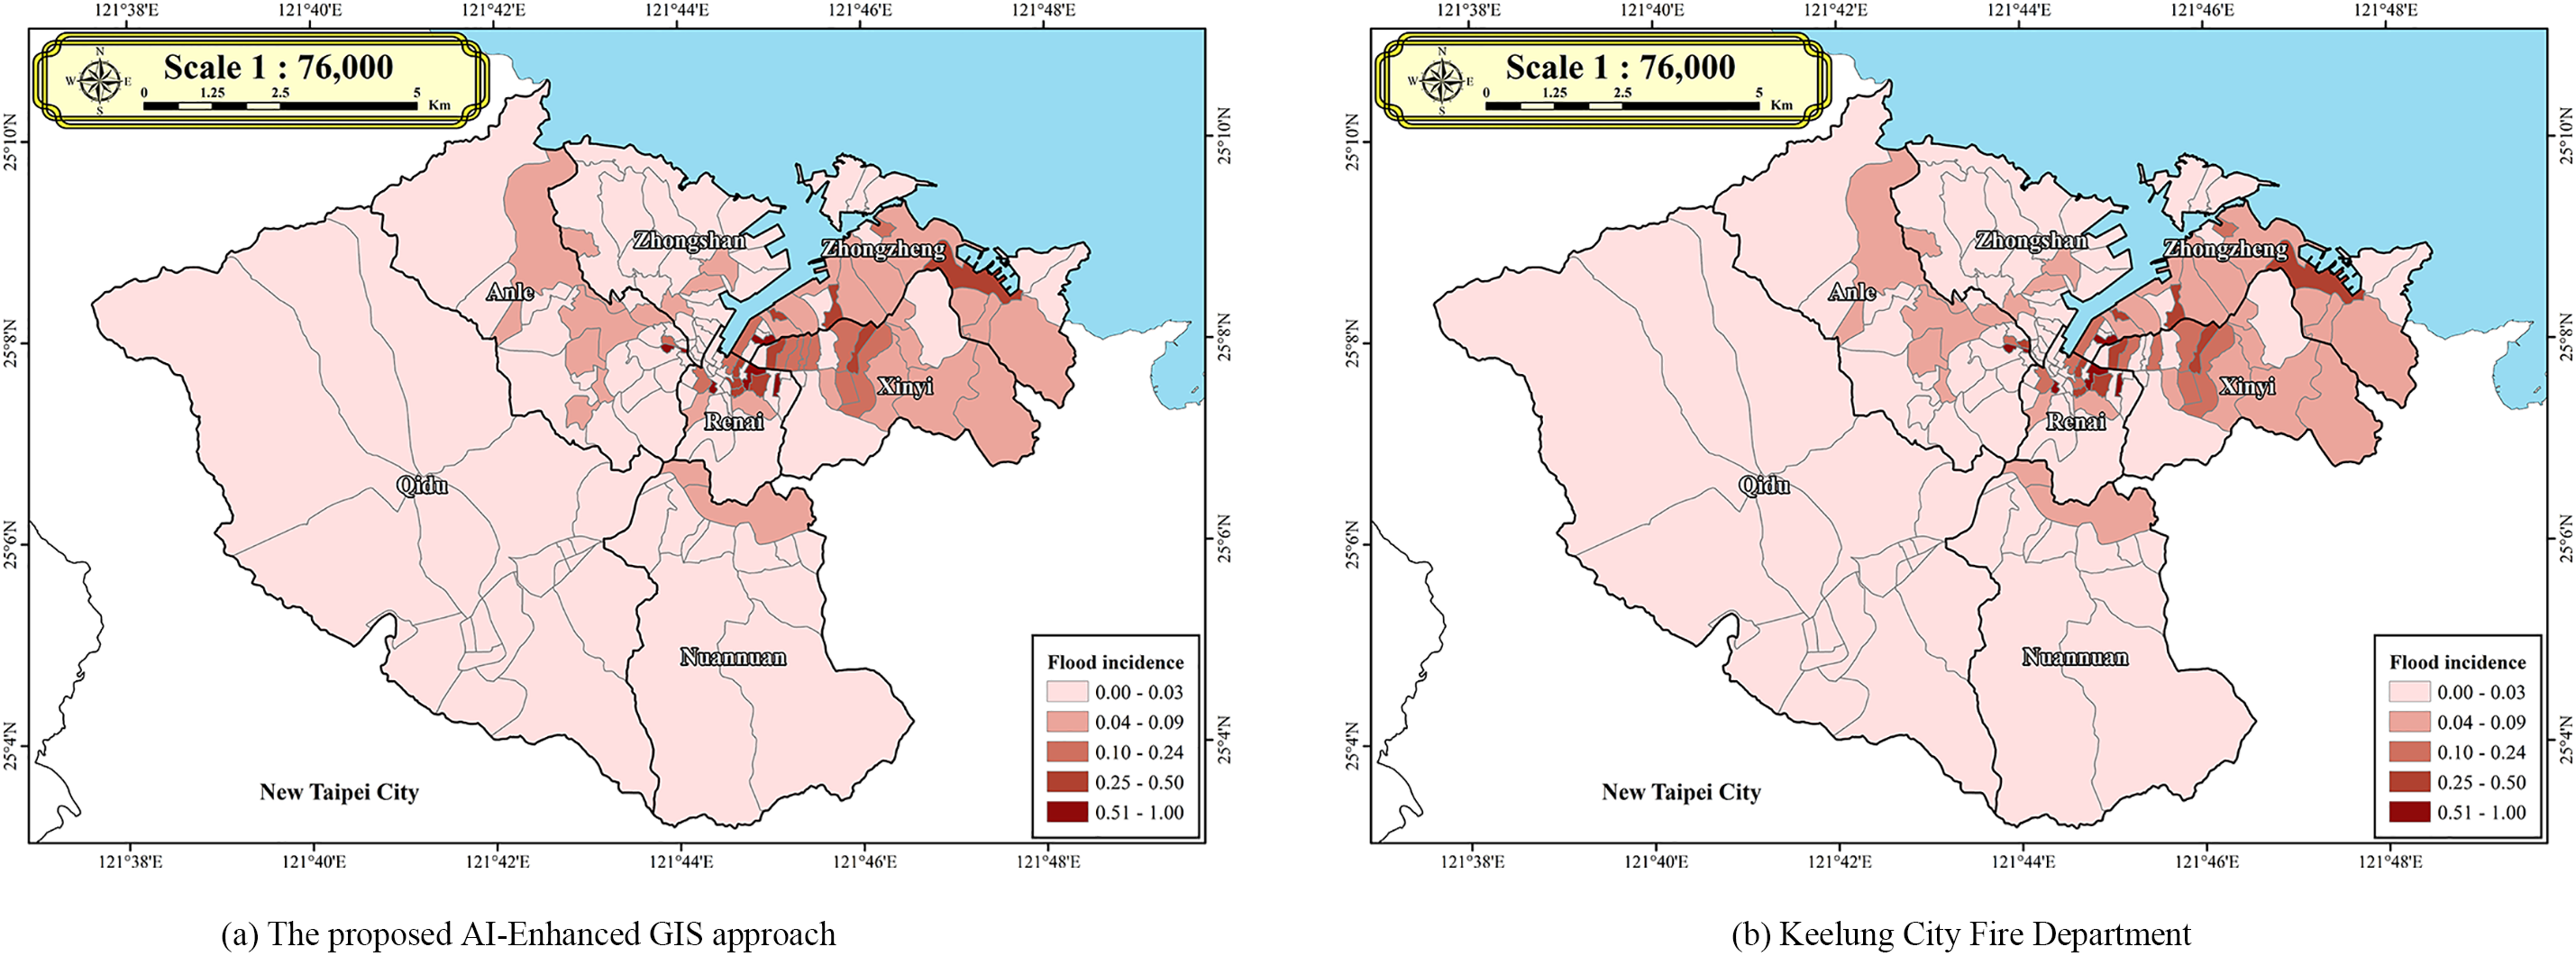
Figure 7: Comparison of the flood incidence in Keelung city during Typhoon Krathon
4.3 Comparative Evaluation of AI Model in Flood Prediction
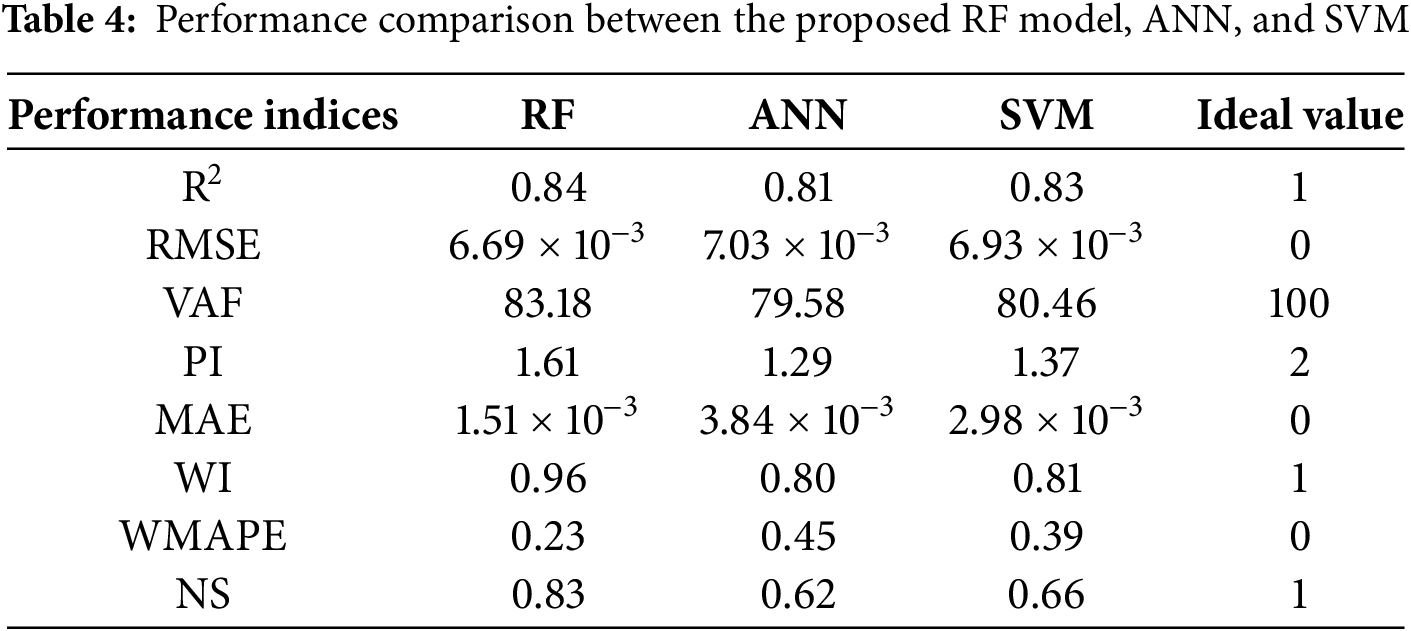
To assess predictive performance, the proposed RF model was compared with three ML models: ANN, and SVM. Table 4 presents the results across 50 independent test runs. The RF model achieved the highest R² value (0.84), exceeding SVM (0.83), and ANN (0.81). It also recorded the lowest RMSE (6.69 × 10⁻³), MAE (1.51 × 10⁻³), and WMAPE (0.23), indicating superior prediction accuracy and error control. In terms of VAF, RF reached 83.18%, outperforming SVM (80.46%), and ANN (79.58%). The RF model also showed the highest WI (0.96) and NSE (0.83), confirming strong agreement and efficiency. Although SVM had the highest PI (1.37), RF followed closely with 1.61. Specifically, RF demonstrated superior performance due to its ability to effectively handle heterogeneous geospatial and hydro-meteorological input variables, its robustness against noise and overfitting, and its suitability for relatively small-to-medium datasets. In contrast, ANN requires large training datasets and careful hyperparameter tuning to achieve stable performance, while SVM is more sensitive to parameter settings and less effective when dealing with nonlinear, high-dimensional features. Overall, the RF model consistently outperformed other models across most metrics, validating its robustness and effectiveness in flood prediction applications.
5.1 Climate Change Scenario Description
The proposed model was applied to simulate future flood risk under the Intergovernmental Panel on Climate Change (IPCC) Fifth Assessment Report (AR5) Representative Concentration Pathway 8.5 (RCP8.5) scenario. According to AR5 projections, under the RCP8.5 pathway, the global average surface temperature is expected to increase by approximately 4°C by the year 2100. In northern Taiwan, historical precipitation data from 1960 to 2020 revealed complex spatiotemporal variability, with a notable increase in rainfall intensity. Specifically, the daily maximum rainfall associated with a 50-year return period under a +2°C warming scenario is estimated to reach 581 mm. This represents a 42.40% increase compared to the observed peak of 408 mm recorded during Typhoon Krathon in Keelung City. Such an increase underscores the potential intensification of extreme rainfall events under future climate conditions. To incorporate the effects of climate change into the modeling framework, the rainfall input variable (Factor 5) was adjusted through a proportional scaling method. This adjustment aimed to simulate future flood susceptibility based on projected extreme precipitation events under different global warming scenarios (+2°C, +3°C, and +4°C). The adjustment process began by identifying the number of exceedances of a 3-h cumulative rainfall threshold of 70 mm as the most suitable rainfall indicator, based on model performance. This threshold was applied consistently across all climate scenarios. Future 50-year return period projections under +2°C, +3°C, and +4°C warming conditions reached 581 mm, 631 mm, and 673 mm, respectively, representing increases of 42.40%, 54.66%, and 64.95%, as demonstrated in Fig. 8.

Figure 8: Projected extreme precipitation under different global warming scenarios
These percentages were then used as scaling coefficients (1.424, 1.547, and 1.650, respectively) applied to the original input values of Factor 5, which measured the frequency of threshold exceedances. This proportional adjustment enabled the transformation of baseline rainfall frequencies to reflect future climate scenarios. By incorporating these scaled values into the RF model, together with other fixed spatial inputs such as topography, vegetation cover, and land use, the model could estimate the spatial distribution of flood incidents across administrative districts in Keelung City.
5.2 Prediction under Climate Change Scenarios
Fig. 9 depicts the projected spatial distribution of flood incidence per unit area across Keelung City under original, +2°C, +3°C, and +4°C global warming scenarios. Results show a clear upward trend in flood frequency with increasing temperatures. Xinyi and Zhongzheng Districts exhibit the most significant rise in predicted flood events, indicating heightened vulnerability in these low-lying or hydrologically sensitive areas. The spatial heterogeneity of flood amplification underscores the uneven impact of climate change across urban districts.

Figure 9: Spatial distribution of predicted flood incidence in Keelung City under climate change
The identification of Xinyi, Zhongzheng and Renai districts as future flood hotspots provides actionable insights for urban adaptation. Specifically, city planners may prioritize drainage infrastructure upgrades in high-risk catchments to alleviate peak runoff, integrate permeable pavements and detention ponds to enhance infiltration, and expand green infrastructure such as urban wetlands and green roofs to mitigate surface flooding. In addition, zoning regulations can be refined to restrict new developments in highly vulnerable zones while promoting adaptive land use strategies. By linking model outputs with practical strategies such as targeted drainage upgrades, zoning adjustments, and green infrastructure deployment, this study demonstrates how predictive modeling can directly inform planning and policy decisions. Such integration of science and practice is essential for enhancing resilience in flood-prone urban areas under climate change.
The model incorporates climate-adjusted rainfall inputs, scaled according to projected 50-year return period precipitation intensities under RCP8.5 scenarios. The analysis reveals a nonlinear increase in extreme rainfall with warming, contributing to a disproportionate escalation in flood risk. By combining geospatial data, machine learning, and climate projections, the study establishes a robust framework for assessing flood susceptibility under future climate conditions. These findings support targeted adaptation planning and infrastructure resilience in regions most at risk from climate-induced hydrological hazards.
This study presents a GIS-integrated AI framework for flood susceptibility assessment in Keelung City, based on geospatial and hydrometeorological data collected during Typhoon Krathon. While the analysis demonstrates strong model performance and predictive capability, several limitations have been identified, and future research directions are outlined below.
(1) In this study, our primary focus is on flood incidence data associated with Typhoon Krathon, which encompasses both rainfall-driven flooding and documented cases of coastal flooding. During Typhoon Krathon’s impact on Keelung City (03 October 2024), extensive flood records were collected, particularly in coastal districts. For example, Zhongzheng District reported 56 flood incidents and Renai District reported 23 incidents, several of which are linked to coastal flooding processes, as shown in Fig. 1. These records are incorporated into the training dataset, providing a more realistic and event-driven foundation for evaluating flood susceptibility using the RF model.
(2) The rainfall inputs introduced in Section 5.1 exceed the range of the Typhoon Krathon training dataset. This may introduce a level of extrapolation and associated uncertainty, reflecting the inherent limitations of machine learning models when applied beyond their original training domain. Despite this, the RF model effectively captures the relative spatial distribution of flood-prone areas and provides valuable scenario-based insights for climate adaptation planning when interpreted with caution. While storm surges and other coastal flooding processes are acknowledged and reserved for future study, this analysis focuses on rainfall-driven impacts of Typhoon Krathon to rigorously evaluate the proposed RF-based framework under an extreme typhoon scenario.
(3) Previous work has demonstrated the feasibility of using machine learning methods for flood susceptibility assessment in Keelung City, where a GIS-based artificial neural network model achieved a correlation coefficient of 0.81 [39], confirming that non-typhoon-driven flood events can also be effectively analyzed using machine learning techniques. In this study, Typhoon Krathon was selected as the primary case for flood susceptibility analysis to explore the RF model’s ability to capture extreme event impacts. Building on this case, we aim to further develop machine learning models trained on similar typhoon tracks to enhance the prediction of rainfall distribution and intensity under future climate change scenarios.
(4) The proposed AI-based RF framework relies on high-resolution geospatial and hydrometeorological data, enabling detailed modeling but limiting direct applicability in data-scarce regions. In areas with coarse or incomplete datasets, accuracy and interpretability may be reduced. Potential adaptations include using downscaled global datasets, hybrid approaches combining physical and ML models, and simplified ML techniques to balance data availability and performance. Future studies should evaluate these strategies to enhance scalability and applicability across diverse geographic and climatic settings.
(5) While this study demonstrates the potential of a GIS-based RF framework for flood susceptibility assessment, several limitations must be noted. The reliance on a single climate scenario (RCP8.5) introduces uncertainty; testing additional RCPs could provide broader projections. RF, though robust with heterogeneous data, may not fully capture spatiotemporal dynamics, suggesting future exploration of hybrid or physics-informed models. Susceptibility mapping accuracy also depends on input data resolution, with biases potentially arising from downscaling and preprocessing. Despite these constraints, the framework offers a strong foundation for integrating climate projections into flood risk management, with future work focusing on scenario testing and dynamic modeling. Moreover, while this study integrates RCP8.5 rainfall projections, uncertainties inherent in general circulation model (GCM) or regional climate model (RCM) downscaling may affect the magnitude and spatial distribution of projected rainfall. Relying solely on a single high-emission scenario limits the exploration of possible futures; incorporating multiple scenarios, such as RCP4.5, would provide a more comprehensive assessment and strengthen adaptation planning.
This study developed a GIS-based AI model for flood susceptibility assessment in Keelung City, integrating a RF algorithm with geospatial and hydrometeorological data from the 2024 Typhoon Krathon event. The proposed RF-based framework effectively identifies high-risk flood-prone areas and simulates typhoon-induced flood scenarios. The key findings are summarized as follows.
(1) Integration of event-based and climate-projected data: This study developed a GIS-based RF framework using geospatial and hydrometeorological data from Typhoon Krathon (2024), enabling realistic simulation of both current and future flood susceptibility. Comprehensive hyperparameter tuning optimized model performance, resulting in 97.45% prediction accuracy and strong alignment with observed flood records. Benchmarking against ANN and SVM confirmed the proposed RF model’s superior performance, demonstrating its robustness and effectiveness for flood prediction applications.
(2) Feature importance analysis: The study identifies NDVI as the most influential predictor of flood susceptibility, followed by flow accumulation, TWI, and rainfall frequency. This provides novel insights into the role of vegetation indices and topographic factors in urban flood risk.
(3) Climate change projections: Notably, under the IPCC AR5 RCP8.5 scenario, projected 50-year return period rainfall in Keelung City increases by 42.40%–64.95% under +2°C to +4°C warming. The analysis revealed that Xinyi District is projected to experience the highest increase in flood frequency, followed by Renai District, indicating that flood risk is likely to intensify in specific low-lying or vulnerable areas. These findings highlight the spatial variability of flood hazard amplification under progressive warming conditions and offer critical insights for targeted adaptation planning and infrastructure reinforcement in urban flood-prone regions.
Acknowledgement: The authors would like to acknowledge the Keelung City Fire Department for their valuable support in providing essential data that contributed to this study. During the preparation of this study, the authors used ChatGPT-5 to assist with language editing. The authors have thoroughly reviewed the output and take full responsibility for the content.
Funding Statement: This study is partially supported by the National Science and Technology Council (NSTC), Taiwan (NSTC 114-2119-M-019-003).
Author Contributions: Cheng-Yu Ku: conceptualization; Chih-Yu Liu: methodology, investigation, and writing; Ming-Han Tsai: validation, and visualization; Jia-Yi You: data curation, and supervision. All authors reviewed the results and approved the final version of the manuscript.
Availability of Data and Materials: Datasets utilized in this study are accessible upon reasonable request from the corresponding author.
Ethics Approval: Not applicable.
Conflicts of Interest: The authors declare no conflicts of interest to report regarding the present study.
References
1. Tabari H. Climate change impact on flood and extreme precipitation increases with water availability. Sci Rep. 2020;10(1):13768. doi:10.1038/s41598-020-70816-2. [Google Scholar] [PubMed] [CrossRef]
2. Tellman B, Sullivan JA, Kuhn C, Kettner AJ, Doyle CS, Brakenridge GR, et al. Satellite imaging reveals increased proportion of population exposed to floods. Nature. 2021;596(7870):80–6. doi:10.1038/s41586-021-03695-w. [Google Scholar] [PubMed] [CrossRef]
3. Wing OEJ, Lehman W, Bates PD, Sampson CC, Quinn N, Smith AM, et al. Inequitable patterns of US flood risk in the anthropocene. Nat Clim Chang. 2022;12(2):156–62. doi:10.1038/s41558-021-01265-6. [Google Scholar] [CrossRef]
4. Wu W, Emerton R, Duan Q, Wood AW, Wetterhall F, Robertson DE. Ensemble flood forecasting: current status and future opportunities. Wires Water. 2020;7(3):e1432. doi:10.1002/wat2.1432. [Google Scholar] [CrossRef]
5. Shahabi H, Shirzadi A, Ghaderi K, Omidvar E, Al-Ansari N, Clague JJ, et al. Flood detection and susceptibility mapping using sentinel-1 remote sensing data and a machine learning approach: hybrid intelligence of bagging ensemble based on K-nearest neighbor classifier. Remote Sens. 2020;12(2):266. doi:10.3390/rs12020266. [Google Scholar] [CrossRef]
6. Wang Y, Chen AS, Fu G, Djordjević S, Zhang C, Savić DA. An integrated framework for high-resolution urban flood modelling considering multiple information sources and urban features. Environ Model Softw. 2018;107(1):85–95. doi:10.1016/j.envsoft.2018.06.010. [Google Scholar] [CrossRef]
7. Kreibich H, Van Loon AF, Schröter K, Ward PJ, Mazzoleni M, Sairam N, et al. The challenge of unprecedented floods and droughts in risk management. Nature. 2022;608(7921):80–6. doi:10.1038/s41586-022-04917-5. [Google Scholar] [PubMed] [CrossRef]
8. Rashidiyan M, Rahimzadegan M. Investigation and evaluation of land use—land cover change effects on current and future flood susceptibility. Nat Hazards Rev. 2024;25(1):04023049. doi:10.1061/nhrefo.nheng-1854. [Google Scholar] [CrossRef]
9. Abijith D, Saravanan S, Parthasarathy KSS, Reddy NM, Niraimathi J, Ali Bindajam A, et al. Assessing the impact of climate and land use change on flood vulnerability: a machine learning approach in coastal region of Tamil Nadu, India. Geosci Lett. 2025;12(1):1. doi:10.1186/s40562-025-00377-7. [Google Scholar] [CrossRef]
10. Ekwueme BN, Ibeje AO. Comparison of Monte Carlo schemes in the modeling of extreme flood in tropical rain forest basins. KSCE J Civ Eng. 2023;27(12):5175–89. doi:10.1007/s12205-023-0980-5. [Google Scholar] [CrossRef]
11. Nguyen DT, Chen ST. Real-time probabilistic flood forecasting using multiple machine learning methods. Water. 2020;12(3):787. doi:10.3390/w12030787. [Google Scholar] [CrossRef]
12. Chang LC, Liou JY, Chang FJ. Spatial-temporal flood inundation nowcasts by fusing machine learning methods and principal component analysis. J Hydrol. 2022;612(9):128086. doi:10.1016/j.jhydrol.2022.128086. [Google Scholar] [CrossRef]
13. Pour MA, Ghiasi MB, Karkehabadi A. Applying machine learning tools for urban resilience against floods. arXiv:2412.06205. 2024. [Google Scholar]
14. Gude V, Corns S, Long S. Flood prediction and uncertainty estimation using deep learning. Water. 2020;12(3):884. doi:10.3390/w12030884. [Google Scholar] [CrossRef]
15. Kabir S, Patidar S, Xia X, Liang Q, Neal J, Pender G. A deep convolutional neural network model for rapid prediction of fluvial flood inundation. J Hydrol. 2020;590(4):125481. doi:10.1016/j.jhydrol.2020.125481. [Google Scholar] [CrossRef]
16. Tang Y, Sun Y, Han Z, Soomro SEH, Wu Q, Tan B, et al. Flood forecasting based on machine learning pattern recognition and dynamic migration of parameters. J Hydrol Reg Stud. 2023;47:101406. doi:10.1016/j.ejrh.2023.101406. [Google Scholar] [CrossRef]
17. Yan X, Xu K, Feng W, Chen J. A rapid prediction model of urban flood inundation in a high-risk area coupling machine learning and numerical simulation approaches. Int J Disaster Risk Sci. 2021;12(6):903–18. doi:10.1007/s13753-021-00384-0. [Google Scholar] [CrossRef]
18. Liu Z, Coleman N, Patrascu FI, Yin K, Li X, Mostafavi A. Artificial intelligence for flood risk management: a comprehensive state-of-the-art review and future directions. Int J Disaster Risk Reduct. 2025;117(4):105110. doi:10.1016/j.ijdrr.2024.105110. [Google Scholar] [CrossRef]
19. Kordrostami S, Alim MA, Karim F, Rahman A. Regional flood frequency analysis using an artificial neural network model. Geosciences. 2020;10(4):127. doi:10.3390/geosciences10040127. [Google Scholar] [CrossRef]
20. Asaly S, Gottlieb LA, Yair Y, Price C, Reuveni Y. Predicting eastern Mediterranean flash floods using support vector machines with precipitable water vapor, pressure, and lightning data. Remote Sens. 2023;15(11):2916. doi:10.3390/rs15112916. [Google Scholar] [CrossRef]
21. Situ Z, Wang Q, Teng S, Feng W, Chen G, Zhou Q, et al. Improving urban flood prediction using LSTM-DeepLabv3+ and Bayesian optimization with spatiotemporal feature fusion. J Hydrol. 2024;630(9):130743. doi:10.1016/j.jhydrol.2024.130743. [Google Scholar] [CrossRef]
22. Maspo NA, Bin Harun AN, Goto M, Cheros F, Haron NA, Mohd Nawi MN. Evaluation of Machine Learning approach in flood prediction scenarios and its input parameters: a systematic review. IOP Conf Ser Earth Environ Sci. 2020;479(1):012038. doi:10.1088/1755-1315/479/1/012038. [Google Scholar] [CrossRef]
23. Sit M, Demiray BZ, Xiang Z, Ewing GJ, Sermet Y, Demir I. A comprehensive review of deep learning applications in hydrology and water resources. Water Sci Technol. 2020;82(12):2635–70. doi:10.2166/wst.2020.369. [Google Scholar] [PubMed] [CrossRef]
24. Pham BT, Avand M, Janizadeh S, Phong TV, Al-Ansari N, Ho LS, et al. GIS based hybrid computational approaches for flash flood susceptibility assessment. Water. 2020;12(3):683. doi:10.3390/w12030683. [Google Scholar] [CrossRef]
25. Towfiqul Islam ARM, Talukdar S, Mahato S, Kundu S, Eibek KU, Pham QB, et al. Flood susceptibility modelling using advanced ensemble machine learning models. Geosci Front. 2021;12(3):101075. doi:10.1016/j.gsf.2020.09.006. [Google Scholar] [CrossRef]
26. Arabameri A, Saha S, Chen W, Roy J, Pradhan B, Bui DT. Flash flood susceptibility modelling using functional tree and hybrid ensemble techniques. J Hydrol. 2020;587(8):125007. doi:10.1016/j.jhydrol.2020.125007. [Google Scholar] [CrossRef]
27. Costache R, Bao Pham Q, Corodescu-Rosca E, Cîmpianu C, Hong H, Thi Thuy Linh N, et al. Using GIS, remote sensing, and machine learning to highlight the correlation between the land-use/land-cover changes and flash-flood potential. Remote Sens. 2020;12(9):1422. doi:10.3390/rs12091422. [Google Scholar] [CrossRef]
28. Dawson G, Butt J, Jones A, Fraccaro P. Flood susceptibility mapping at the country scale using machine learning approaches. Appl AI Lett. 2023;4(4):e88. doi:10.1002/ail2.88. [Google Scholar] [CrossRef]
29. Singha C, Rana VK, Pham QB, Nguyen DC, Łupikasza E. Integrating machine learning and geospatial data analysis for comprehensive flood hazard assessment. Environ Sci Pollut Res Int. 2024;31(35):48497–522. doi:10.1007/s11356-024-34286-7. [Google Scholar] [PubMed] [CrossRef]
30. Central Weather Administration, Ministry of Transportation and Communications [Internet]. [cited 2025 Sep 1]. Available from: https://www.cwa.gov.tw/V8/E/P/Typhoon/TY_WARN.html. [Google Scholar]
31. Du X, Liu JT. Particle dynamics of the surface, intermediate, and benthic nepheloid layers under contrasting conditions of summer monsoon and typhoon winds on the boundary between the Taiwan Strait and East China Sea. Prog Oceanogr. 2017;156(7117):130–44. doi:10.1016/j.pocean.2017.06.009. [Google Scholar] [CrossRef]
32. Hsu LH, Su SH, Tseng WW, Chu JL, Su JL, Lin LY. The climatological perspective of remote rainfall events triggered by the northeasterly wind and the outer circulation of typhoon in Taiwan. J Geophys Res Atmos. 2024;129(15):e2023JD040680. doi:10.1029/2023JD040680. [Google Scholar] [CrossRef]
33. Central Weather Administration (CWA). Weather Graphs [Internet]. [cited 2025 Sep 1]. Available from: https://www.cwa.gov.tw/V8/E/P/Typhoon/TY_NEWS.html. [Google Scholar]
34. National Fire Agency, Ministry of the Interior. Emergency management information cloud [Internet]. [cited 2025 Sep 1]. Available from: https://portal2.emic.gov.tw/SSO2_Develop/. [Google Scholar]
35. Keelung City Fire Department, Keelung City Government [Internet]. [cited 2025 Sep 1]. Available from: https://www.klfd.klcg.gov.tw/en/klfd2/2127.html. [Google Scholar]
36. Department of Land Administration, Ministry of the Interior (MOI) [Internet]. [cited 2025 Sep 1]. Available from: https://www.land.moi.gov.tw/enhtml//downlist/30. [Google Scholar]
37. United States Geological Survey (USCS). LANDSAT 8 imagery [Internet]. [cited 2025 Sep 1]. Available from: https://www.usgs.gov/landsat-missions/landsat-8. [Google Scholar]
38. Water Resources Agency, Ministry of Economic Affairs (MOEA); 2024 [Internet]. [cited 2025 Sep 1]. Available from: https://gic.wra.gov.tw/Gis/Gic/API/QuickMapJs/Map.aspx?type=display-d&cX=238850&cY=2609438&cL=0&layerename=RIVERPOLY. [Google Scholar]
39. Khoirunisa N, Ku CY, Liu CY. A GIS-based artificial neural network model for flood susceptibility assessment. Int J Environ Res Public Health. 2021;18(3):1072. doi:10.3390/ijerph18031072. [Google Scholar] [PubMed] [CrossRef]
Cite This Article
 Copyright © 2025 The Author(s). Published by Tech Science Press.
This work is licensed under a Creative Commons Attribution 4.0 International License , which permits unrestricted use, distribution, and reproduction in any medium, provided the original work is properly cited.
 Downloads
 Citation Tools