
 Submit a Paper
 Propose a Special lssue
 Open Access
ARTICLE

Hybrid Taguchi and Machine Learning Framework for Optimizing and Predicting Mechanical Properties of Polyurethane/Nanodiamond Nanocomposites
1 School of Mechanical Engineering, VIT-AP University, Besides A.P. Secretariat, Amaravati, 522237, India
2 Deanship of Scientific Research, Engineering Sciences Research Center (ESRC), Imam Mohammad Ibn Saud Islamic University (IMSIU), Riyadh, 11432, Saudi Arabia
* Corresponding Author: Santosh Kumar Sahu. Email:
Computer Modeling in Engineering & Sciences 2025, 145(1), 483-519. https://doi.org/10.32604/cmes.2025.069395
Received 22 June 2025; Accepted 24 September 2025; Issue published 30 October 2025
 View Full Text
 Download PDF
Abstract
This study investigates the mechanical behavior of polyurethane (PU) nanocomposites reinforced with nanodiamonds (NDs) and proposes an integrated optimization–prediction framework that combines the Taguchi method with machine learning (ML). The Taguchi design of experiments (DOE), based on an L9 orthogonal array, was applied to investigate the influence of composite type (pure PU, 0.1 wt.% ND, 0.5 wt.% ND), temperature (145°C–165°C), screw speed (50–70 rpm), and pressure (40–60 bar). The mechanical tests included tensile, hardness, and modulus measurements, performed under varying process parameters. Results showed that the addition of 0.5 wt.% ND substantially improved PU performance, with tensile strength increasing by 117%, Young’s modulus by 10%, and hardness by 21% at optimal conditions of 145°C, 70 rpm, and 50 bar. SEM analysis revealed ductile fracture in pure PU and brittle fracture in the optimized PU/ND composite. ANOVA confirmed that composite type was the most influential factor, contributing 70.27%, 87.14%, and 74.16% to tensile strength, modulus, and hardness, respectively. Regression modeling demonstrated a deviation of less than 10% between predicted and experimental values, validating the framework. To further strengthen predictive capability, computational modeling and analytical procedures were employed through machine learning frameworks. Random Forest achieved R2/MSE values of 0.95/0.53 (tensile), 0.95/4.03 (modulus), and 0.94/2.44 (hardness). XGBoost performed better, with 0.98/0.12, 0.98/0.77, and 0.98/0.60, while Gradient Boosting provided the highest accuracy with 0.99/0.03, 0.99/0.02, and 0.99/0.01. Residual plots supported these results, showing wide fluctuations for RF and tightly clustered residuals near zero for GB and XGB, highlighting their superior accuracy, precision, and generalization. Overall, the integrated Taguchi–ML framework demonstrates a robust and efficient strategy for optimizing processing parameters and accurately predicting the performance of high-strength PU–ND nanocomposites.Keywords
Injection molding is one of the most widely used manufacturing processes for the mass production of plastic components, meeting the growing demand in industries such as medical, electronics, and automotive, which together account for nearly one-third of all plastic products. Globally, more than half of polymer processing machinery is dedicated to injection molding, highlighting its central role in modern manufacturing [1,2]. This technique is particularly crucial for shaping thermoplastic polymers due to its efficiency, scalability, and precision [3]. Polymers are high-molecular-weight compounds composed of long chains of repeating units [4]. Their processability, reproducibility, and affordability make them indispensable in diverse engineering applications [5]. Among the broad class of polymers, polyurethane (PU) has received significant attention for advanced applications. These polymers possess tunable mechanical, thermal, and chemical properties, enabling their use in fields ranging from biomedical devices and aerospace engineering to flexible electronics and soft robotics [6]. Polyurethane (PU) is a class of thermoplastic elastomer that combines the properties of conventional polymers with those of elastomeric rubbers [7]. It is widely used due to its low density, ease of processing, and cost-effectiveness. However, PU suffers from relatively low tensile and hardness properties compared to other engineering polymers [8]. This limitation has driven extensive research on reinforcing fillers into the PU matrix to improve its mechanical performance while retaining its inherent flexibility.
Numerous studies have reported significant enhancements in PU properties through the incorporation of nanofillers. Sahu et al. [9] achieved a 26% increase in tensile strength and a 21% rise in Young’s modulus by introducing 0.05 wt.% graphene into PU. Halloysite nanotubes (HNTs) improved tensile strength by 30.4% and tensile modulus by 47.2% at 8 wt.% loading [10], while 10 wt.% HNTs enhanced tensile modulus and Shore D hardness to 4.91 GPa and 76.57, respectively [11]. Mini-sized graphene (MG) at 3 wt.% increased tensile strength and modulus by 81% and 126.7%, respectively [12]. Reinforcement with reduced graphene oxide (RGO) at 5 wt.% raised nanoindentation hardness by 139% [13], and 0.02 wt.% graphene oxide (GO) improved tensile strength by 60% [14]. Nanofillers, including carbon nanotubes (CNTs), multi-walled carbon nanotubes (MWCNTs), and single-walled carbon nanotubes (SWCNTs), have shown consistent improvements in mechanical performance. PU/MWCNT composites exhibited modulus increases of 100%, 70%, and 25% at 2 wt.% loading [15], while a 7 wt.% MWCNT addition enhanced tensile and stiffness properties by 23 and 15 times, respectively [16]. CNT-reinforced PU composites reached tensile strengths of 15.4 MPa with elongation at break of 420% [17]. The incorporation of 2 wt.% pCNT resulted in an increase of up to 10.8% in the Young’s modulus of PU [18], whereas another study reported a 122% increase in tensile strength with 1 wt.% CNTs [19]. Similarly, 0.1 wt.% CNTs raised tensile strength by 97% and elongation at break by 25% [20], and at just 0.01 wt.%, SWCNTs improved tensile strength by 25 MPa [21]. A further 3 wt.% MWCNT addition increased tensile strength and modulus by 39% and 49% [22], while 10 wt.% MWCNTs increased elastic modulus and hardness by 124% and 53% [23]. Other nanofillers also demonstrated beneficial effects. Nanosilicon at 5 wt.% increased compressive, tensile, and shear strengths by 29.4%, 257.6%, and 202.1%, respectively [24]. PU/ND nanofiber membranes with 5.5 wt.% ND showed 29%, 105%, and 66% improvements in modulus, tensile strength, and elongation at break, respectively [25]. Nano-SiO2 (0.4 wt.%) combined with 25 wt.% PU enhanced flexural, tensile, and interlaminar shear strengths by 33.87%, 20.75%, and 66.54% [26].
The literature demonstrates that nanofillers such as carbon nanotubes (CNTs), halloysite nanotubes (HNTs), graphene oxide (GO), and nanosilicon can significantly enhance the performance of polyurethane (PU) [27–29]. The novelty of the present work lies in the use of nanodiamonds (NDs), which possess exceptional hardness, high tensile strength, superior chemical stability, and excellent dispersibility [30,31], yet have been rarely studied in the context of PU–ND nanocomposites [32]. This knowledge gap necessitates a systematic investigation of their mechanical behavior. Accordingly, the objectives of the work are to develop and optimize high-performance PU/ND nanocomposites, with a particular focus on tensile and hardness properties. To achieve this, a hybrid Taguchi–machine learning (ML) framework is employed. The Taguchi method ensures efficient experimental design and parameter selection, while analysis of variance (ANOVA) is used to quantify the relative contribution of each factor to mechanical performance. Furthermore, ML models are applied to accurately predict and optimize the results. This integrated methodology not only addresses PU’s inherent limitation of low tensile strength but also establishes a novel and robust pathway for designing next-generation PU–ND nanocomposites.
Polyurethane (PU) granules were procured from shape memory polymer (SMP)Technology, Inc., Japan, while the nanodiamond (ND) fillers were supplied by Nano Research Element, India. The PU pellets had a diameter ranging from 7 to 8 mm, with a density of approximately 0.834 g/cm³ and a glass transition temperature (Tg) of around 65°C. The ND fillers were provided in powder form, with a particle size of less than 100 nm, a density of 3.18 g/cm³, a purity greater than 99%, and a specific surface area of 350 m2/g. A transmission electron microscopy (TEM) test of the as-supplied ND powder was carried out to understand the size and morphology of the nanoparticle. The TEM morphology of the ND nanoparticle is presented in Fig. 1a. The particle size distribution diagram of ND is shown in Fig. 1b. It was observed that the higher frequency is around 6 nm, which indicates that most of the particles are in the 6 nm nanoscale range.

Figure 1: (a) TEM image, (b) Particle size distribution of ND
2.2 Fabrication of Composite Samples
Composite samples were prepared using a polyurethane (PU) matrix reinforced with nanodiamond (ND) fillers at loadings of 0.1 and 0.5 wt.%. The overall fabrication process is presented in Fig. 2. Prior to incorporation into the polymer, the as-received ND particles were chemically functionalized to improve their interfacial compatibility with PU, following a reported procedure [33]. In this step, pristine NDs were subjected to oxidative treatment using a mixed acid solution of concentrated sulfuric acid (98%) and nitric acid (70%) in a 3:1 volume ratio. The mixture was sonicated in a Branson 2510 bath and then transferred into hot water maintained at 90°C, where it was stirred continuously for 10 h. The resulting suspension was diluted with distilled water, filtered, and thoroughly washed to remove residual acids. The obtained powder was oven-dried at 80°C for 4 h. This treatment introduced oxygenated groups, predominantly carboxyl functionalities, onto the nanodiamond surface, yielding carboxylated nanodiamonds (ND–(COOH)n). The presence of these functional groups was expected to enhance dispersion and strengthen interfacial interactions with the PU matrix. For composite fabrication, the required amount of functionalized ND was weighed on a precision balance and dispersed in ethanol at a ratio of 1:0.5 (ND to ethanol by weight). The suspension was magnetically stirred and sonicated to produce a homogeneous nanofluid. PU pellets were then added to the dispersion and manually stirred on a hot plate using a glass rod to promote uniform mixing. The mixture was subsequently oven-dried for 24 h to eliminate residual ethanol and moisture. The dried material was transferred to an injection molding machine, where tensile test specimens were molded according to ASTM standards. Pure PU samples and PU/ND composites containing 0.1 and 0.5 wt.% nanodiamonds were successfully fabricated for further characterization.

Figure 2: Fabrication steps
Tensile testing was conducted according to the ASTM D638 standard test method using a Tinius Olsen H10KL universal testing machine (UTM). The tests were performed under controlled standard atmospheric conditions, with a constant crosshead speed (strain rate) of 2 mm/min. The tensile testing setup is illustrated in Fig. 3. The test was performed five times for each sample, and the average value was recorded.

Figure 3: Tensile testing machine
The hardness of the samples was evaluated using a Micro Vickers hardness tester (model FMV1-MC-AT, RS Scientific) equipped with a diamond indenter. A load of 1N was applied to the sample surface, with a dwell time of 20 s. Each sample was tested in five replicates, and the average result was noted. The hardness value (HV) was calculated using Eq. (1) [34]:
where F is the applied load in newton’s (N), and d is the diagonal length of the square impression in millimeters (mm).
2.5 Scanning Electron Microscope
Scanning Electron Microscope (SEM) analysis was conducted on a ZEISS EVO10 instrument at an accelerating voltage of 5–15 kV. SEM test was used to analyze the fracture surfaces of PU and PU composites after tensile testing, primarily to assess the mechanisms governing the fracture behavior. Before imaging, all samples were gold-sputtered to improve conductivity.
2.6 Taguchi Design of Experiments
The Taguchi method offers an efficient statistical approach for experimental design, widely used in engineering and industrial applications. It aims to minimize the cost and time of experimentation while maintaining high quality and reliability in the results. The method employs orthogonal arrays to systematically study the effects of multiple process parameters at various levels with a reduced number of experimental runs [35]. In this study, injection molding process parameters- namely composition, temperature, speed, and pressure-were selected, each at three different levels as presented in Table 1. To efficiently evaluate these parameters, the Taguchi design employed an L9 orthogonal array, reducing the total number of experiments required from 81 (in a full factorial design) to just 9. The detailed arrangement of these nine experimental runs based on the selected parameter levels is outlined in Table 2 [36,37].


2.7 Signal-to-Noise Ratio (S/N Ratio)
In the Taguchi method, experimental results are converted into a Signal-to-Noise (S/N) ratio, which serves as an objective function for optimization. The S/N ratio expresses the relationship between the desirable signal and undesirable noise, improving data resolution and aiding in the identification of optimal process conditions. Taguchi recommends evaluating deviations from target performance using the S/N ratio to quantify variability and consistency in quality characteristics. S/N ratio analysis typically categorizes quality characteristics into three types: “smaller-the-better”, “larger-the-better”, and “nominal-the-best”. In this study, the “larger-the-better” criterion was selected to maximize mechanical performance parameters. The S/N ratio for this category is calculated using Eq. (2) [38]:
where,
2.8 Analysis of Variance (ANOVA)
Analysis of Variance (ANOVA) is a statistical method used to determining the influence of multiple input factors on output responses in experimental studies. By partitioning the overall variability, ANOVA provides a systematic way to assess the relative contribution of each factor and their significance on the observed outcomes [39]. In this study, ANOVA was applied to examine the effects of key injection molding process parameters—composition, temperature, speed, and pressure, on the mechanical properties of polymer-based composites. The experimental design followed an L9 orthogonal array, enabling efficient analysis with a reduced number of trials. This approach facilitated a clear understanding of the extent to which each processing parameter influenced the performance characteristics of the fabricated components.
2.9 Computational Modeling and Analysis Using Machine Learning Models
Machine learning algorithms were employed to predict the tensile strength, Young’s modulus, and hardness of PU/ND nanocomposites. Random Forest Regression, Gradient Boosting, and XGBoost were selected for their robustness in modeling continuous numerical outputs [40–42]. A design of experiments (DOE) based on an L9 orthogonal array was established, followed by the preparation and testing of samples for mechanical characterization. The experimental results were then used as input for the ML models. K-fold cross-validation with K = 5 was adopted to ensure reliable performance evaluation. In this method, the dataset was divided into five equal subsets; in each iteration, four subsets were used for training while the remaining one served as validation, and this process was repeated five times so that every subset was used once for validation. The averaged performance across all folds provided a more robust and unbiased assessment of the models compared to a single train-test split. Hyperparameters were tuned within this framework to balance accuracy and generalization. In addition, feature importance analysis was performed to quantify the relative contribution of each input parameter, thereby enhancing interpretability. This integrated approach effectively linked experimental design with ML predictions, offering valuable insights into the influence of processing parameters on mechanical performance. Eqs. (3)–(5) illustrate the formulation used for obtaining Mean Squares Error (MSE) Root Mean Squared Error (RMSE) and Relative Root Mean Squared Error (RRMSE) from ML models.
where n = No. of observations,
Before training, the dataset was preprocessed by normalizing input features for consistent scaling and eliminating redundant variables to reduce noise. Feature selection was guided by correlation analysis and domain expertise to retain the most relevant parameters. Hyperparameter tuning was conducted within this cross-validation framework using grid search and randomized search strategies to optimize key parameters such as tree depth, learning rate, and the number of estimators. All experiments were implemented in Python using the Scikit-learn and XGBoost libraries within the Google Colab environment, enabling efficient model development, hyperparameter optimization, and evaluation.
2.9.1 Random Forest Regression
Random Forest Regression is an ensemble learning method that models both linear and nonlinear relationships between input variables. It operates by constructing multiple decision trees during training and generating predictions through the averaged outputs of these trees. This approach improves model stability, reduces variance, and minimizes the risk of overfitting. The prediction generated by the Random Forest Regression model is expressed mathematically in Eq. (6) [43].
where,
Gradient Boosting is an ensemble learning technique in which models are built sequentially, with each new model trained to minimize the errors of the previous one in predicting the target variable. This iterative refinement enhances predictive accuracy step by step. The general formulation of Gradient Boosting is presented in Eq. (7) [44].
where
XGBoost is an advanced implementation of Gradient Boosting designed to deliver superior speed and predictive performance. It integrates features such as regularization, parallel computation, and robust handling of missing data, which collectively enhance both efficiency and accuracy. Owing to these advantages, XGBoost has become a widely adopted algorithm for structured data analysis and competitive machine learning tasks. The general formulation of XGBoost is provided in Eq. (5), while its objective function is defined in Eq. (8) [45].
where
M = No. of Boosting rounds,
L=
3.1 Tensile Strength and Young’s Modulus Experimental Results
Universal Testing Machine (UTM) experiments were conducted to evaluate the tensile strength and Young’s modulus of nanodiamond (ND)-reinforced polyurethane (PU) composites. The Taguchi L9 orthogonal array was applied to optimize the injection molding parameters—composition, temperature, speed, and pressure—during sample fabrication. The results revealed that the incorporation of 0.5 wt.% ND significantly enhanced the mechanical properties. Tensile strength improved from 6.16 to 13.4 MPa, while Young’s modulus increased from 162 to 179 MPa, as shown in Fig. 4. These findings underscore the substantial influence of ND dispersion and processing parameters on the mechanical behavior of the composites. The remarkable improvement in tensile strength is primarily due to the uniform dispersion of NDs within the PU matrix, which facilitates efficient stress transfer from the polymer chains to the rigid ND particles. Similarly, the enhancement in modulus is attributed to the intrinsic stiffness of NDs and the formation of strong interfacial bonds between ND surface functional groups and the PU matrix, restricting polymer chain mobility and thereby improving load-bearing capacity. In addition, precise control of processing parameters—such as molding temperature, injection speed, and pressure—minimizes filler agglomeration, improves matrix–filler wetting, and ensures a homogeneous microstructure. This synergistic effect of nanoscale reinforcement and optimized processing results in composites with superior strength, stiffness, and overall performance, making PU–ND systems highly promising for advanced industrial applications [46,47].

Figure 4: Tensile Strength and Young’s modulus vs. samples
3.2 Hardness Experimental Results
Microhardness testing was carried out to evaluate the effect of nanodiamond (ND) reinforcement in polyurethane (PU) composites. Injection molding parameters were optimized using the Taguchi L9 orthogonal array, and the results are presented in Fig. 5, where the number of experiments is plotted on the x-axis and hardness (HV) on the y-axis. The incorporation of 0.5 wt.% ND significantly enhanced the hardness, with values ranging from 69 to 84 Shore. This improvement can be attributed to the exceptional intrinsic hardness and stiffness of ND particles, which serve as rigid reinforcements within the PU matrix and resist localized deformation under applied loads. The presence of surface functional groups on NDs promotes strong interfacial bonding with the polymer, enabling efficient stress transfer and reducing chain mobility at the surface. In addition, optimized injection molding parameters—including controlled temperature, pressure, and speed—facilitate uniform filler dispersion, minimize defects, and improve packing density and surface resistance. The combined effects of nanoscale reinforcement and processing optimization account for the observed variations in hardness, confirming the potential of PU–ND composites for advanced structural and functional applications [48,49].
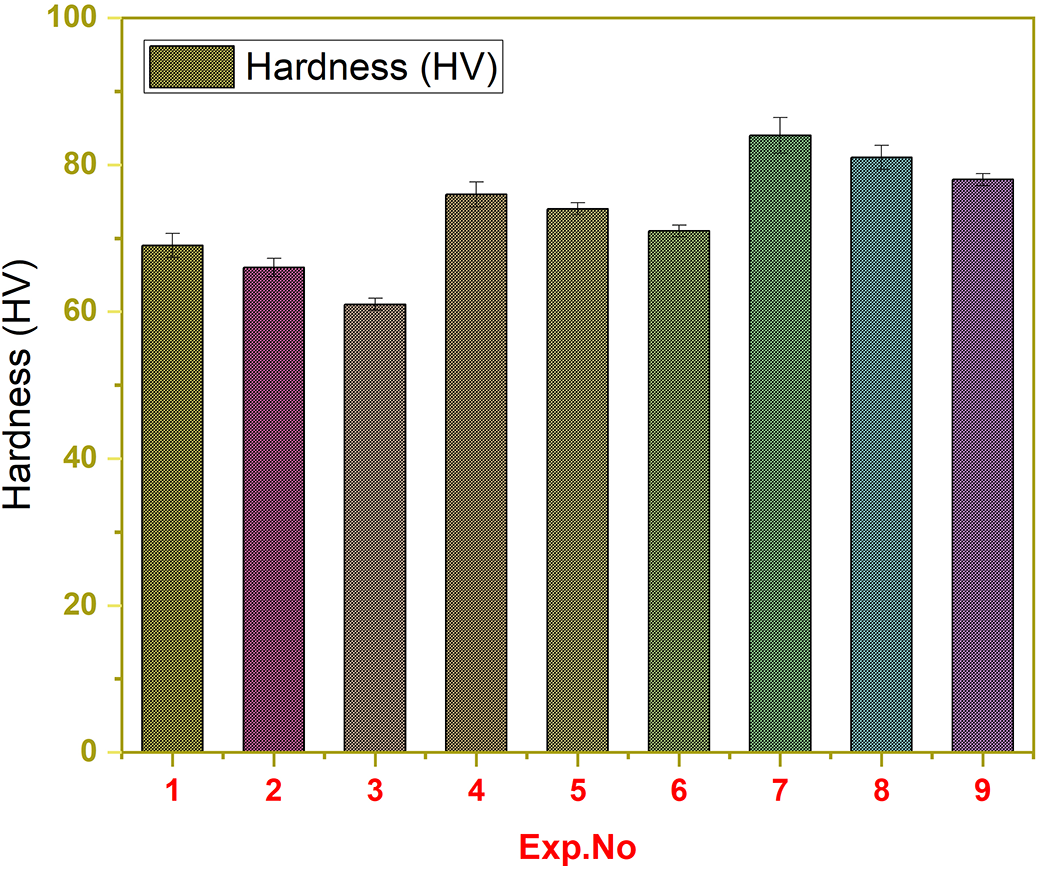
Figure 5: Experimental hardness
3.3 Taguchi Analysis of Tensile Strength, Young’s Modulus, and Hardness
The significance of each process parameter and its relative influence on the mechanical properties was evaluated using Analysis of Variance (ANOVA). Signal-to-Noise (S/N) ratios for the injection molding parameters were calculated using Minitab 21 software to assess process robustness and determine the optimal conditions for maximizing tensile strength. For the response variables—tensile strength, Young’s modulus, and hardness—the “larger-the-better” quality characteristic was selected, since higher values are preferable for these mechanical properties. The analysis was carried out with a 95% confidence level to ensure the reliability of the results. Table 3 presents the experimental data obtained from three replicates, along with their corresponding signal-to-noise (S/N) ratios. The mean effects demonstrate how tensile strength varies across different levels of each factor and illustrate the influence of parameter changes on the response. The delta values, which indicate the strength of each factor’s effect, reveal that the composite material has the greatest impact (delta = 8.060), followed by temperature (delta = 2.787). Speed and pressure show comparatively smaller effects, with delta values of 0.603 and 0.230, respectively. These results rank the factors influencing tensile strength as follows: composite material (Rank 1), temperature (Rank 2), speed (Rank 3), and pressure (Rank 4), as detailed in Table 4.


Fig. 6a shows the main effects plot for tensile strength, where the composite type is the most influential factor, followed by temperature, speed, and pressure. The mean response increases significantly with changes in composite material but decreases with rising temperature. Similarly, Fig. 6b presents the main effects plot for Young’s modulus, confirming that composite material has the strongest impact, with temperature next, speed moderate, and pressure minimal. These results emphasize that optimizing composite composition and controlling temperature are critical for maximizing mechanical performance.
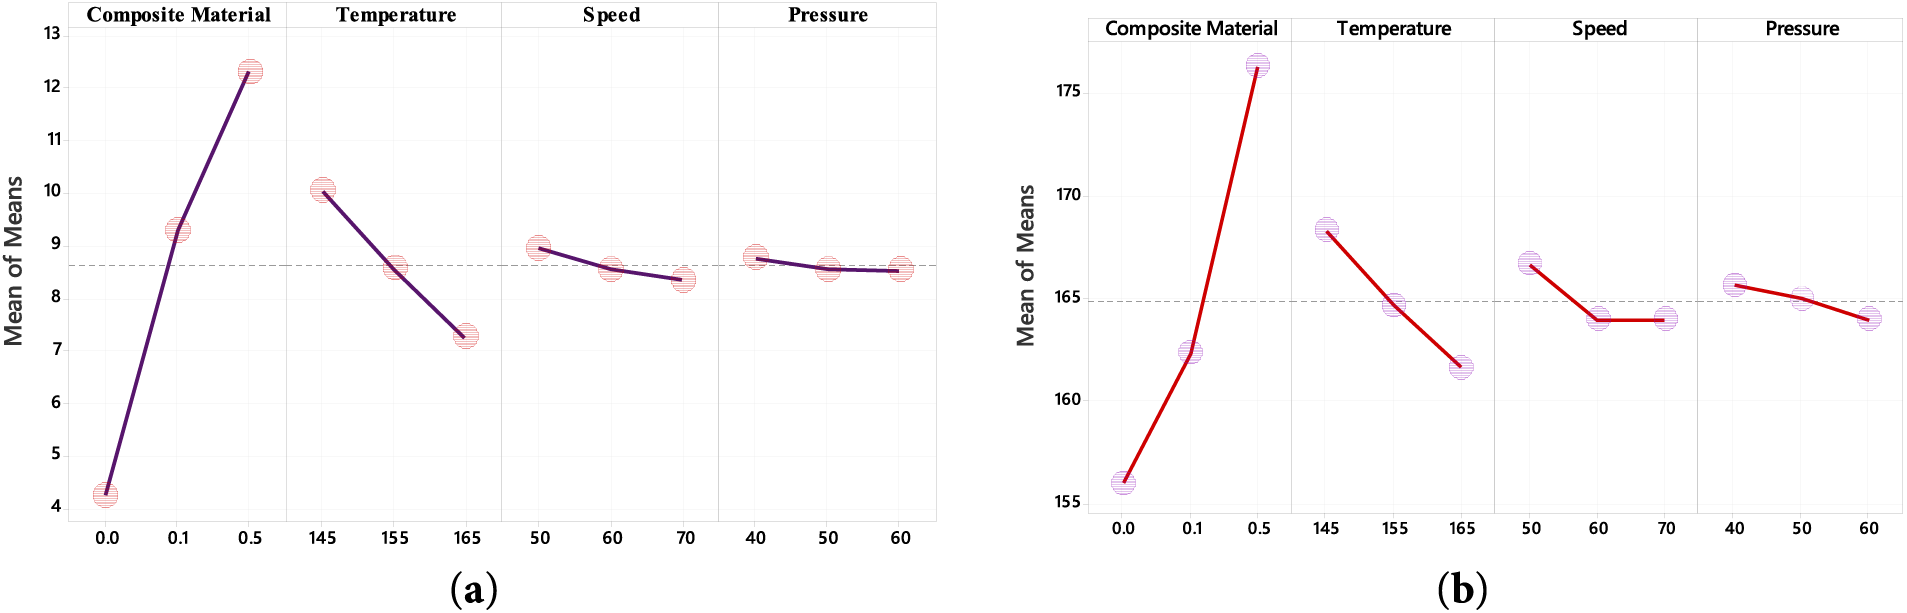
Figure 6: Main effects plots for (a) Tensile strength (b) Young’s modulus
Signal-to-noise (S/N) ratios were calculated for each process parameter at its respective levels, as presented in Table 5. The Delta values represent the range of S/N ratios across these levels, indicating the influence of each parameter on tensile strength. Among all the parameters, the composite material exhibited the highest Delta value of 9.76, followed by temperature with 3.86, speed with 2.06, and pressure with 1.77. Based on these Delta values, the parameters were ranked in order of importance as: composite material (Rank 1), temperature (Rank 2), speed (Rank 3), and pressure (Rank 4). This analysis clearly shows that the composite material is the most critical factor to optimize to achieve maximum tensile strength in the composites.

Fig. 7a illustrates the use of the Taguchi design to identify the optimal control factors based on the signal-to-noise (S/N) ratios, which measure the robustness of the process parameters against variations caused by noise factors. The S/N ratio analysis reveals that the composite material is the most influential factor, whereas pressure has the least effect. In Fig. 7b, it is shown that composite material and temperature significantly impact the S/N ratio, while speed and pressure have only minor effects due to their lower fractional influence on the response. The S/N ratio results summarized in Table 6 confirm this ranking, with composite material as Rank 1, temperature as Rank 2, speed as Rank 3, and pressure as Rank 4.
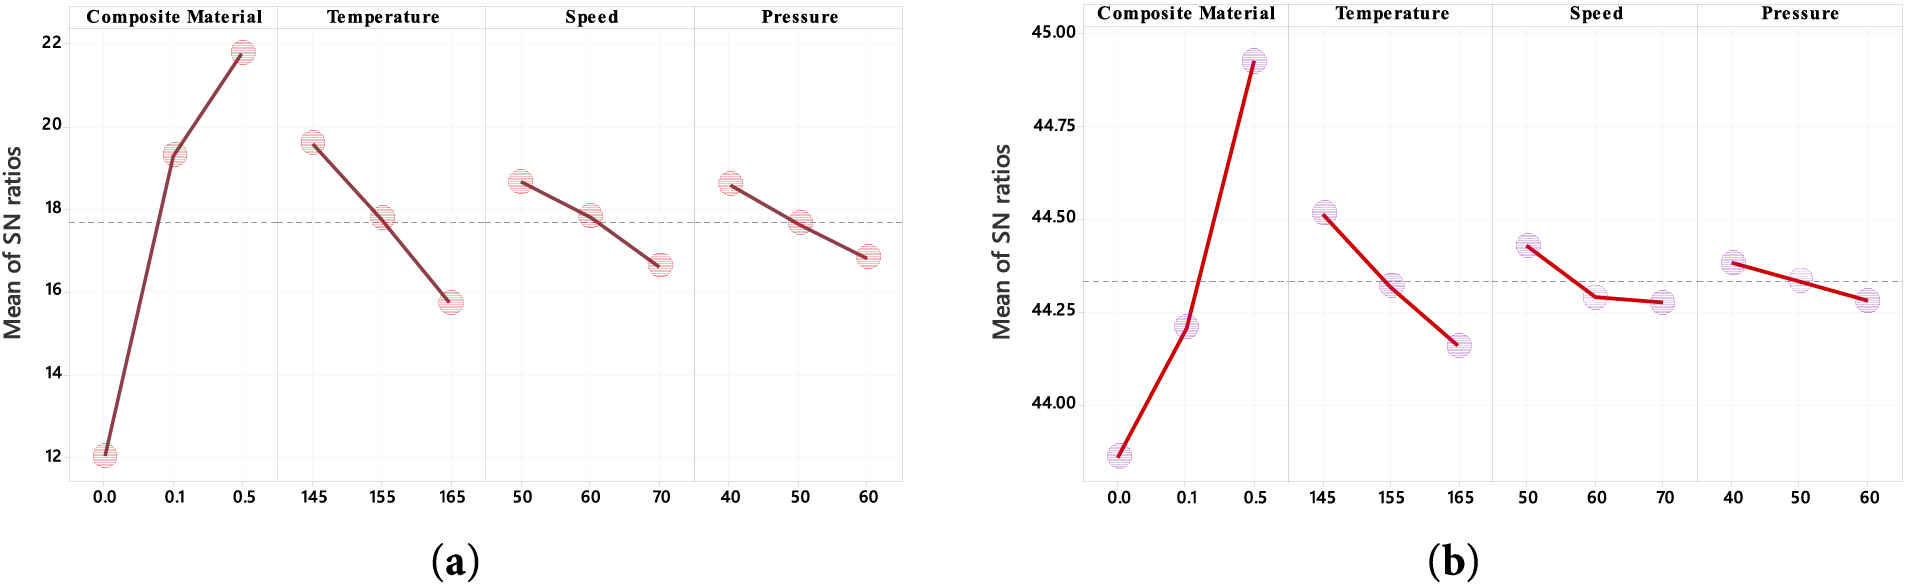
Figure 7: Main effect plot for (a) tensile strength (b) Young’s modulus of S/N ratio
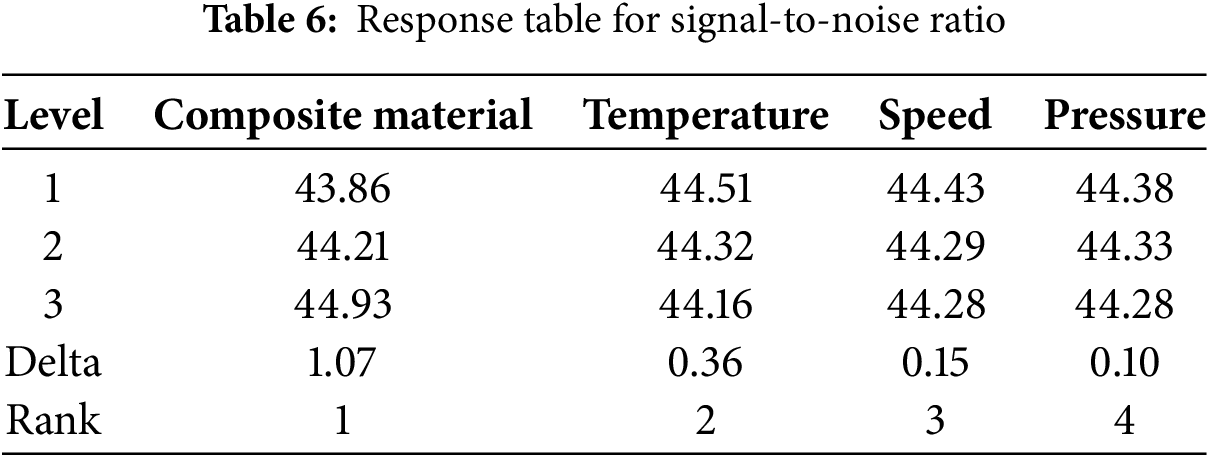
The mean effects on Young’s modulus at different levels of each factor, along with their impact on the response variable, are also presented. The delta values indicate the extent of influence each parameter exerts: composite material has the greatest effect (delta = 20.3), followed by temperature (delta = 6.7). Speed and pressure exhibit much smaller effects, with delta values of 2.7 and 1.7, respectively. These results establish that composite material (Rank 1) has the strongest influence on Young’s modulus, followed by temperature (Rank 2), speed (Rank 3), and pressure (Rank 4), as detailed in Table 7. Table 6 displays the signal-to-noise (S/N) ratios for each factor across different levels. The Delta values represent the influence of each factor on Young’s modulus, showing that the composite material is the most significant factor (Delta = 1.07), followed by temperature (0.36), speed (0.15), and pressure (0.10). This ranking confirms that the composite material is the key parameter to optimize for enhancing Young’s modulus and overall composite performance. The “larger-the-better” criterion was applied for these properties, indicating that higher values are more desirable. Corresponding experimental hardness results and their S/N ratios are presented in Table 8.


The main effect on hardness was analyzed across different levels of each factor to assess how changes in parameters influence the response variable. The Delta values indicate the strength of each factor’s effect, with composite material having the greatest impact (Delta = 15.67), followed by temperature (Delta = 6.33). Pressure and speed have comparatively smaller contributions, with Delta values of 1.00 and 0.67, respectively. As summarized in Table 8, the ranking shows composite material as the most significant factor (Rank 1), followed by temperature (Rank 2), speed (Rank 3), and pressure as the least influential (Rank 4). These results suggest that variations in composite material and temperature are the primary drivers for improving the hardness of the composite, while speed and pressure have minimal effect, as also reflected in Table 9.
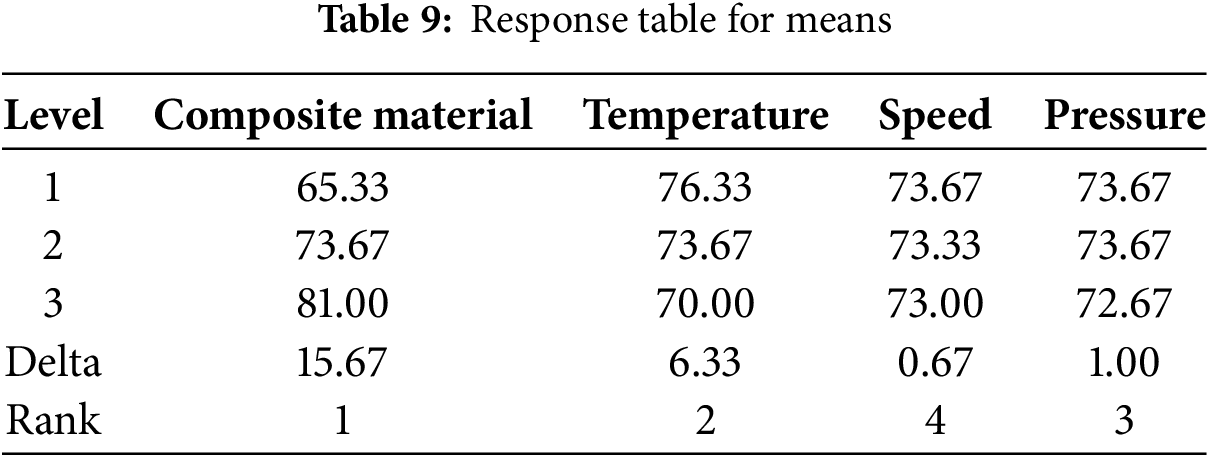
Fig. 8a presents the main effects plots for hardness, illustrating that the composite material is the most significant factor, followed by temperature, pressure, and speed. These results highlight that composite material and temperature should be prioritized to achieve the highest hardness, while speed has the least influence. The main effects plot for the Signal-to-Noise (S/N) ratios, shown in Fig. 8b, is commonly used to evaluate the impact of process parameters. Among all parameters studied, composite material and temperature exert a major effect on the S/N ratio, whereas pressure and speed have only a minor influence.
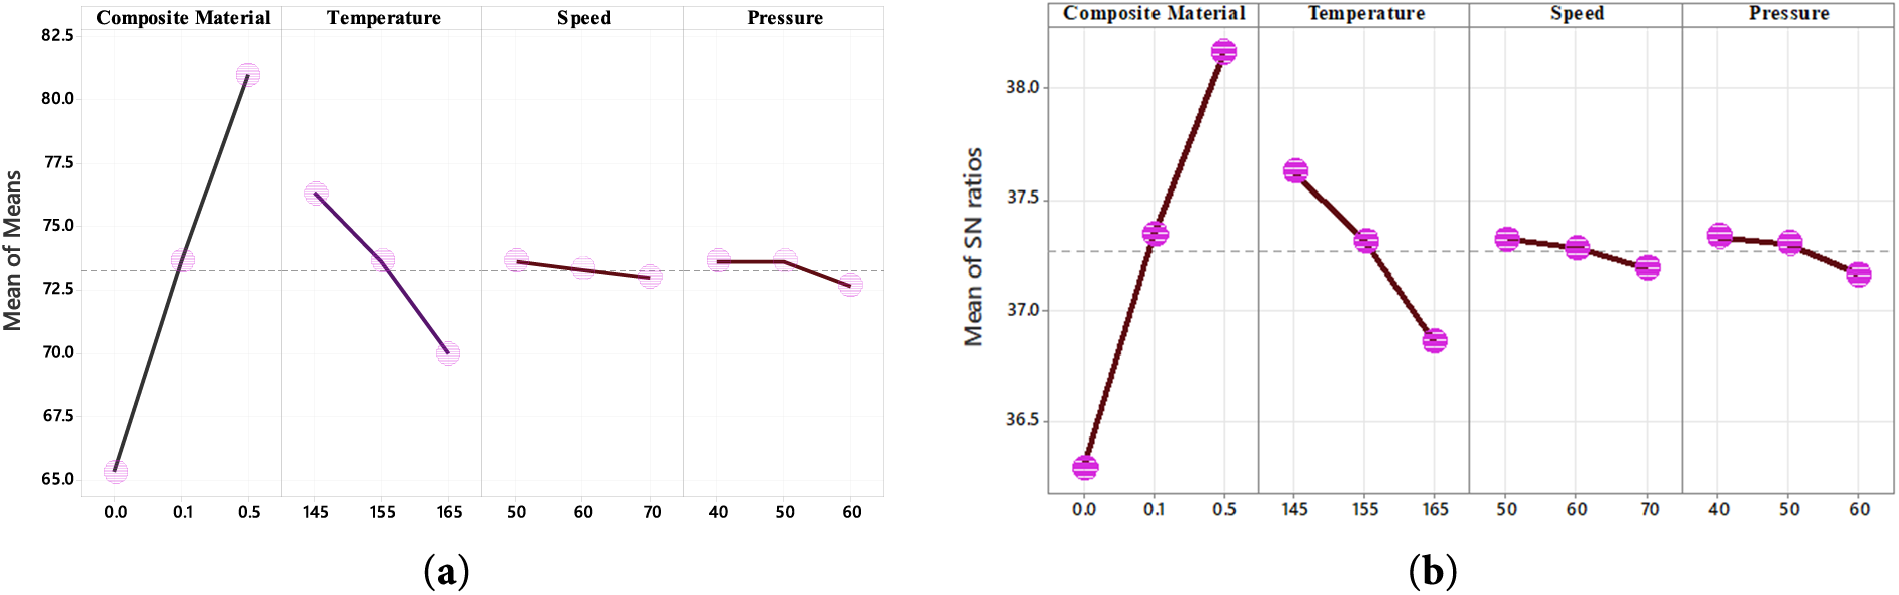
Figure 8: (a) Main effects plot for means (b) Main effect plot for S/N ratio
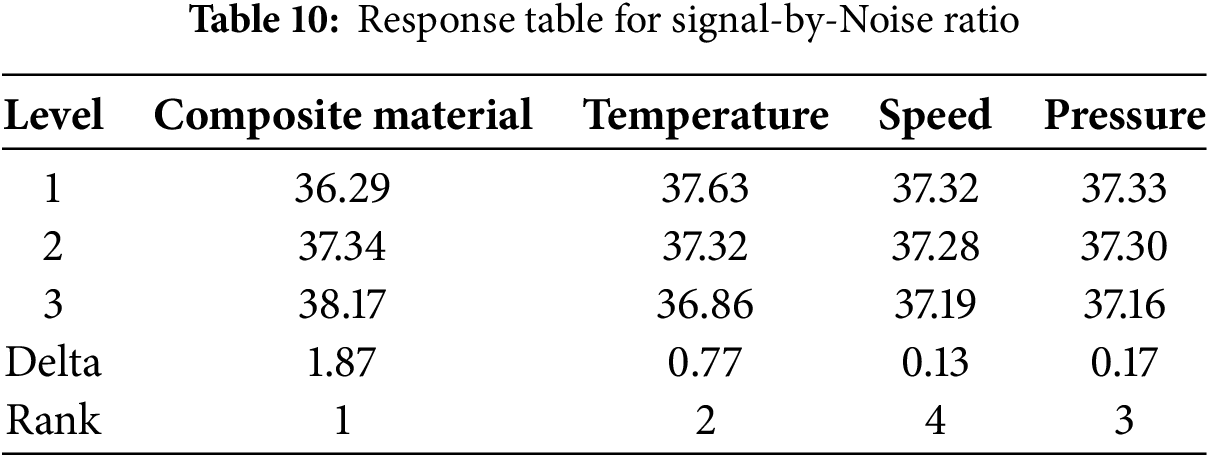
Table 10 presents the influence of each factor on the signal-to-noise (S/N) ratio. The composite material ranks first with the highest delta value of 1.87, followed by temperature with a delta of 0.77. Pressure ranks third with a delta value of 0.17, while speed has the lowest impact, with a delta of 0.13.
3.4 Analysis of Variance for Tensile Strength, Young’s Modulus, and Hardness
3.4.1 Analysis of Variance for Tensile Strength
Tensile test data obtained using the Taguchi L9 orthogonal array were analyzed through ANOVA to evaluate the effects of composite material, temperature, pressure, and speed. Using the “larger-the-better” criterion at a 95% confidence level, the results (Table 11) showed that composite material (70.27%) and temperature (10.42%) were the most dominant factors, followed by the interaction of temperature * speed (6.25%), while the remaining factors contributed less than 10%. These findings confirm that composite composition and temperature play the most significant roles in determining tensile strength of PU–ND nanocomposites.

A linear regression model was developed to evaluate the relationship between the process variables—composite material (C), temperature (T), speed (N), and pressure (P)—and tensile strength. The predictive regression equation for PU–ND composites is given in Eq. (9).
Regression Equation for tensile strength:
Experimental tensile strength values were obtained from tests, while predicted values were generated using regression analysis. Model accuracy was evaluated by comparing experimental results with ANOVA predictions, as shown in Fig. 9. The results showed close agreement, with trials 1–3 yielding the lowest strengths (2.54–6.16 MPa), trials 4–6 showing intermediate values (8.90–10.55 MPa), and trials 7–9 achieving the highest strengths (11.02–13.4 MPa). Since the deviation between experimental and predicted values was less than 10%, the regression model was considered accurate in capturing the influence of variables on tensile strength.
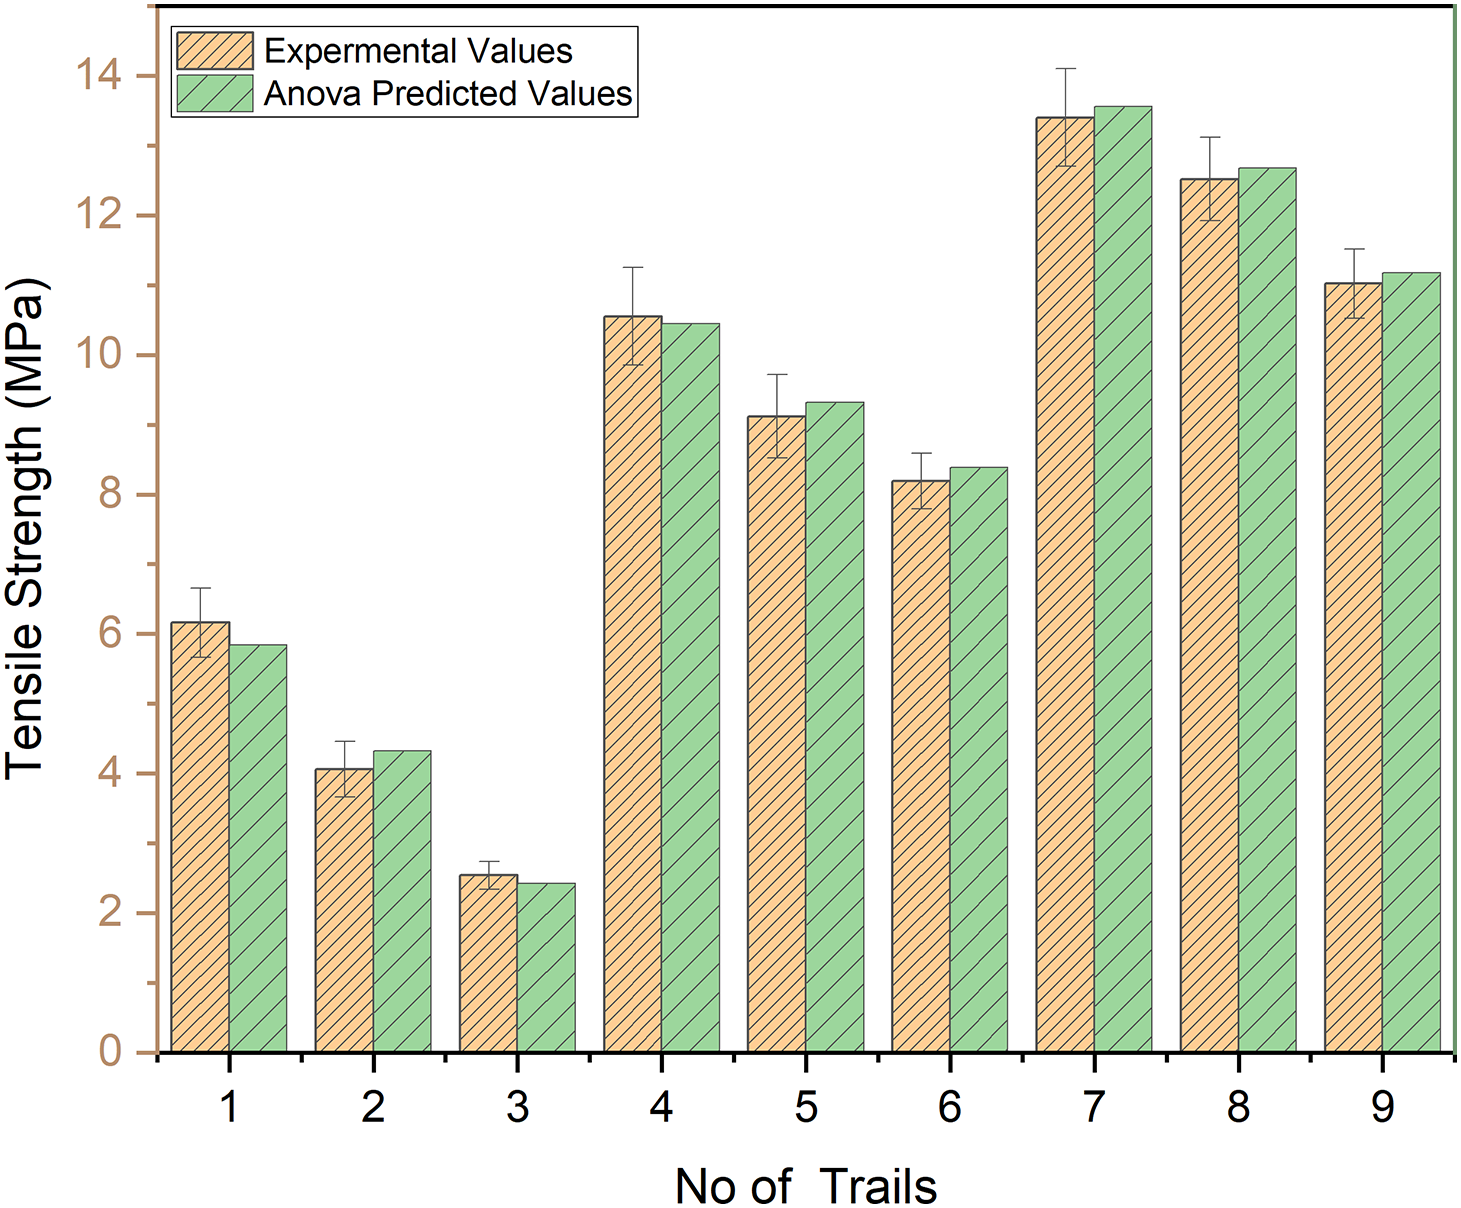
Figure 9: Tensile strength experimental vs. ANOVA predicted values
The interaction plot for tensile strength of the polyurethane/nanodiamond nanocomposite illustrates how different processing factors influence the material’s mechanical performance. The plot clearly shows that increasing the nanodiamond content from 0.0 to 0.5 wt.% results in a significant improvement in tensile strength across all temperatures, speeds, and pressures. This enhancement is attributed to the reinforcing effect of nanodiamonds, which improves load transfer and interfacial bonding within the polymer matrix. Conversely, temperature has a consistent negative impact on tensile strength; as temperature increases from 145°C to 165°C, tensile strength decreases due to thermal softening of the polyurethane matrix. The effects of speed and pressure on tensile strength are more complex, exhibiting nonlinear and interaction-dependent behaviors. Overall, the interaction plot emphasizes the crucial role of nanodiamonds in enhancing tensile strength and highlights the importance of optimizing multiple processing parameters to achieve the best mechanical performance, as illustrated in Fig. 10.
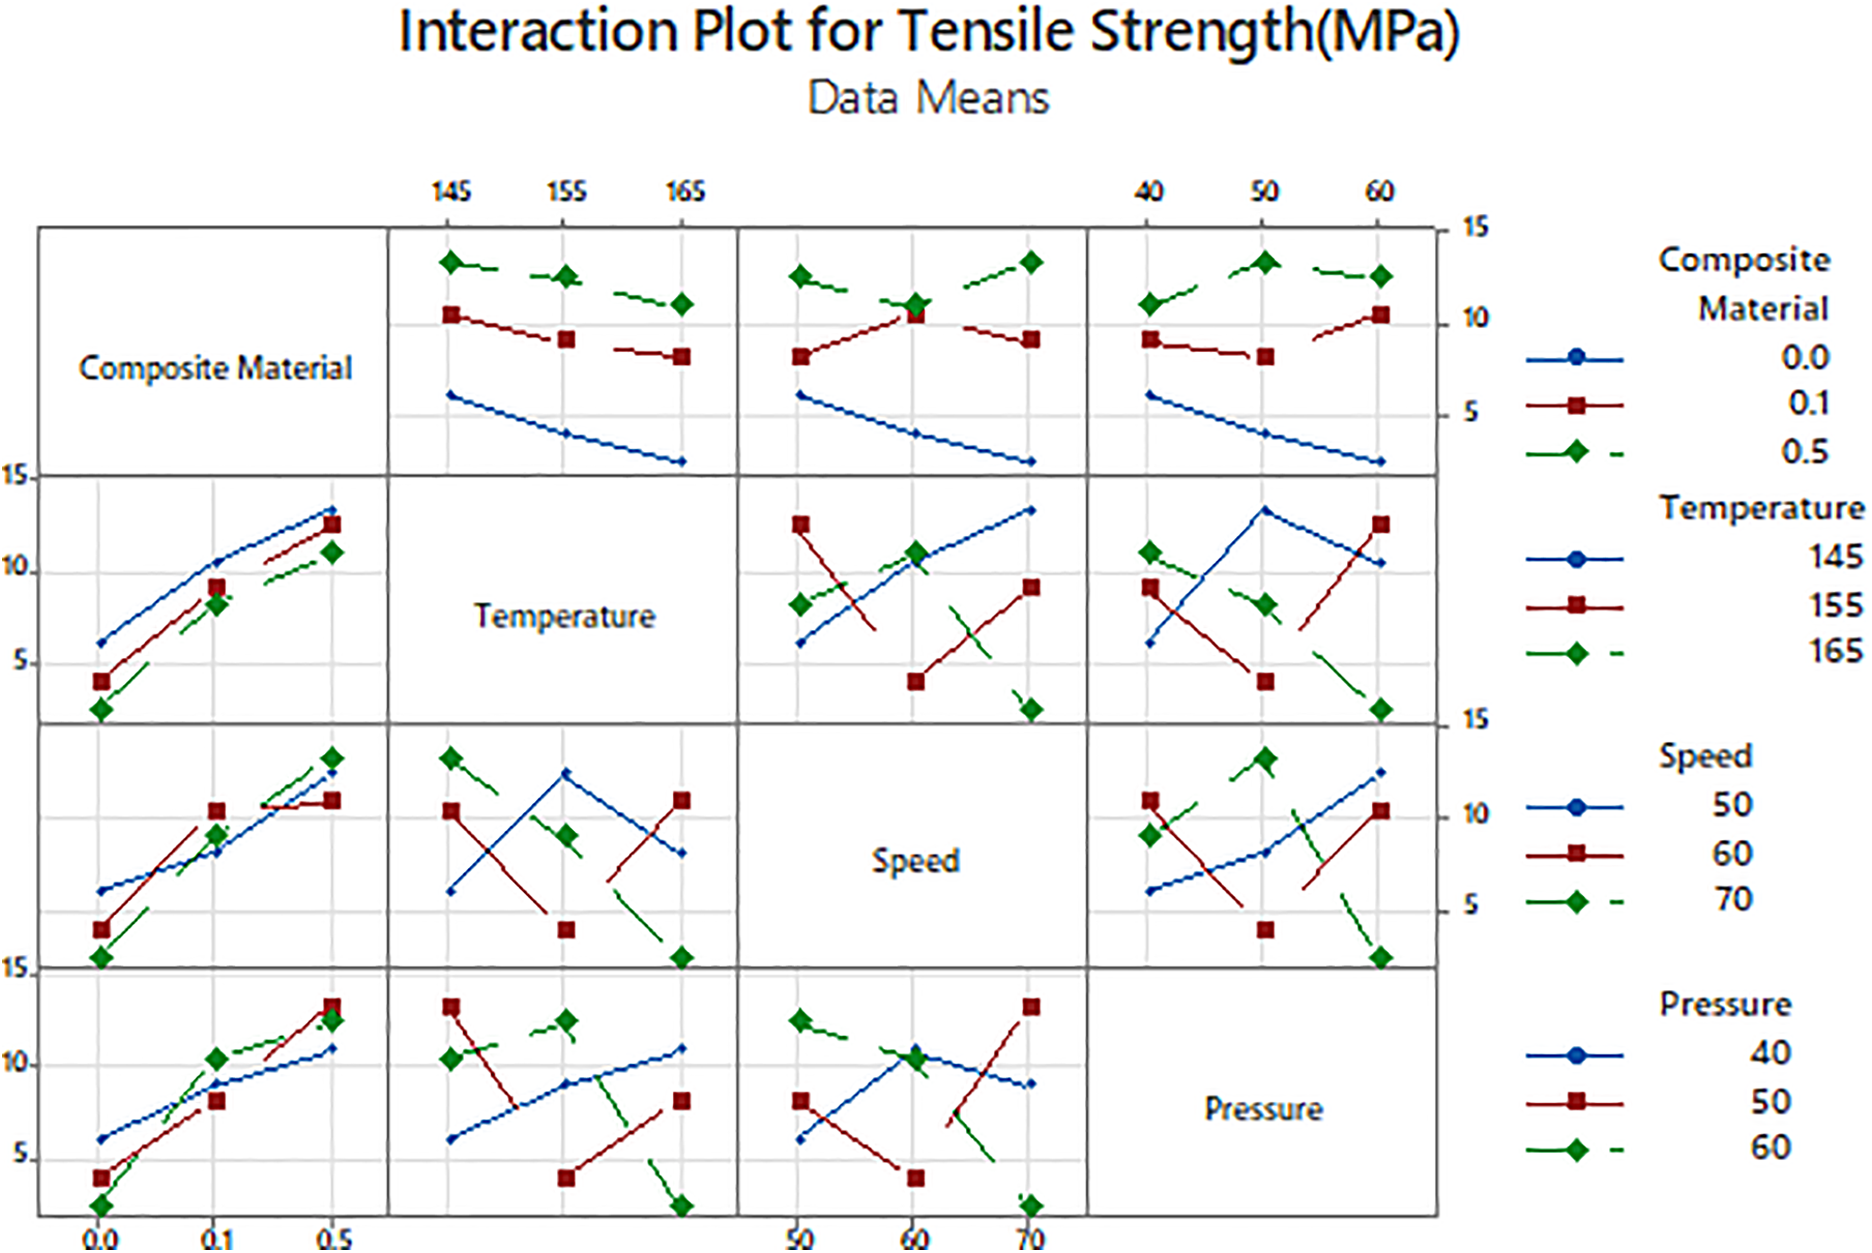
Figure 10: Interaction plots for tensile strength
Fig. 11a shows a contour plot illustrating the effect of composite material concentration (wt.%) and temperature (°C) on tensile strength (MPa). Tensile strength increases significantly with higher composite material content, especially beyond 0.1 wt.%, indicating that nanodiamond reinforcement effectively enhances the mechanical properties of the polyurethane matrix. However, tensile strength slightly decreases as the temperature rises from 145°C to 165°C, particularly at lower composite levels, suggesting that the matrix softens at elevated temperatures. The plot highlights that maximum tensile strength values (>12 MPa) are achieved at higher composite loadings combined with lower processing temperatures. Fig. 11b presents a contour plot showing the relationship between tensile strength (MPa), composite material content (wt.%), and processing speed (m/s). The graph reveals that increasing the composite material from 0.0 to 0.5 wt.% results in a marked improvement in tensile strength, particularly at higher composite percentages where values exceed 12 MPa. In contrast, variations in processing speed from 50 to 70 m/s have a comparatively smaller impact on tensile strength than composite content. The dark green region at high composite loadings indicates that, regardless of speed variations, the nanodiamond reinforcement is dominant in enhancing mechanical strength. This demonstrates that increasing composite content is more influential than adjusting processing speed for improving tensile strength. Fig. 11c presents contour plots illustrating the effect of composite concentration (0.0 to 0.5 wt.%) and pressure (40 to 60 bar) on tensile strength. Tensile strength increases significantly, exceeding 12 MPa, as composite concentration rises within this range. In contrast, the influence of pressure is relatively minor, producing only slight improvements in tensile strength. The darkest regions on the plot, indicating the highest tensile strength, consistently correspond to higher composite content levels regardless of the applied pressure. This confirms that composite concentration is the dominant factor in enhancing tensile strength, while pressure plays a comparatively minor role.
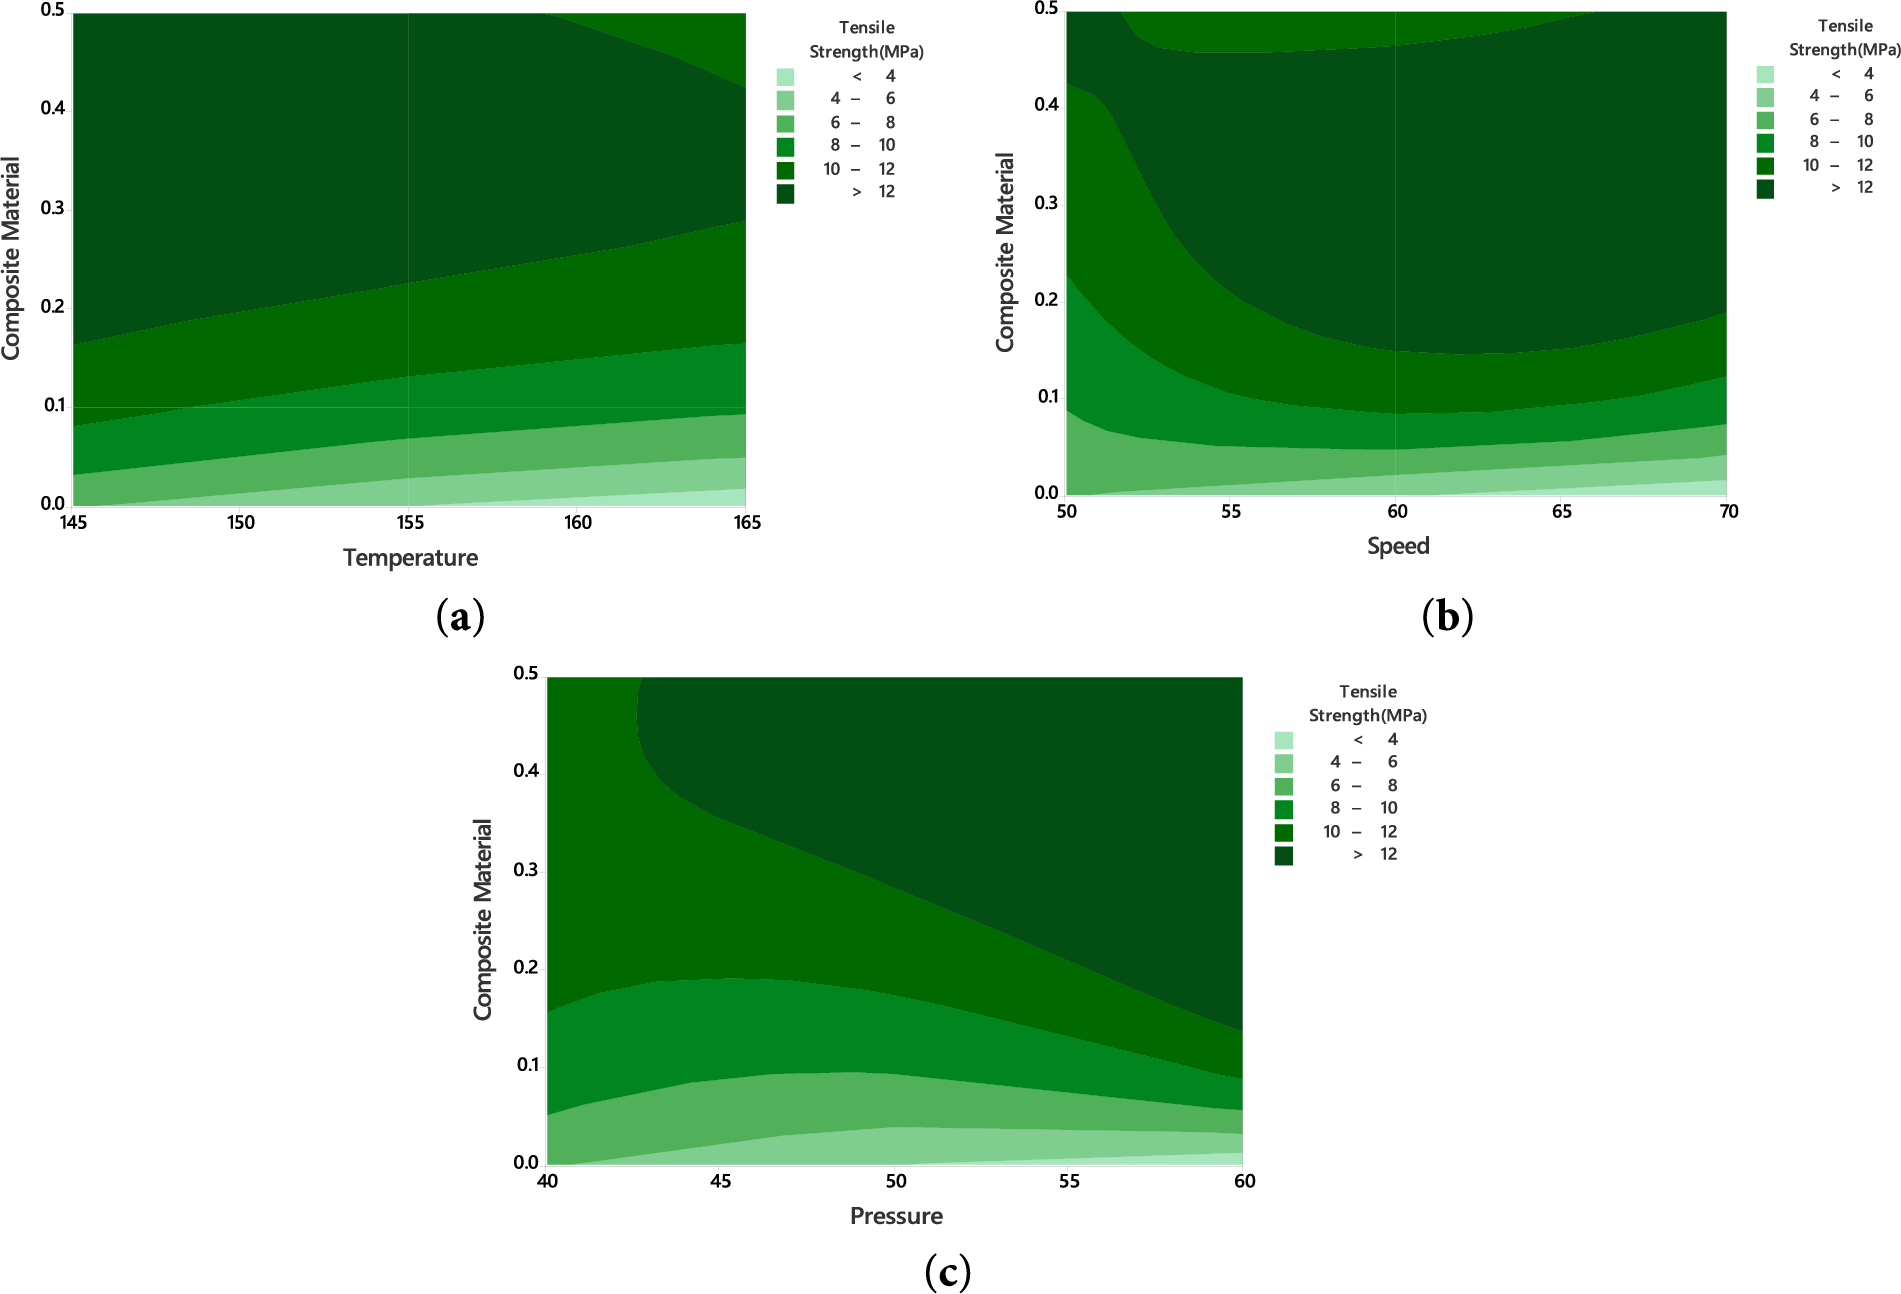
Figure 11: Tensile strength for (a) composite material vs. Temperature (b) composite material vs. Speed (c) composite material vs. Pressure
3.4.2 Analysis of Variance for Young’s Modulus
The analysis of variance (ANOVA) was performed using the Taguchi method with composite material, temperature, speed, and pressure as factors, applying the “larger-is-better” criterion at a 95% confidence level. As shown in Table 12, composite material was the most dominant factor, contributing 87.14%, followed by temperature at 9.07%, while the remaining factors contributed less than 10%. The relatively high modulus values in PU/ND composites are attributed to the brittle fracture behavior observed in the 0.5 wt.% ND sample.

The regression equation for Young’s modulus, presented as Eq. (8), enables the analysis of the relationship between the predictor variables and the response variable using a linear regression approach. This analysis examines the interaction effects of injection molding parameters such as composite material (C) content, temperature (T), speed (N), and pressure (P). The regression model helps visualize these interactions and predict the corresponding Young’s modulus values as represented in Eq. (10).
Regression Equation for Young’s modulus:
Experimental values were obtained directly from physical testing, while predicted values were generated through regression analysis. A comparison between experimental and ANOVA predicted values was performed to validate the accuracy of the Young’s modulus measurements, as shown in Fig. 12. When the deviation between experimental and predicted values is less than 10%, the regression model is considered accurate.

Figure 12: Young’s modulus experimental vs. ANOVA predicted values
If the deviation between the experimental and ANOVA-predicted values is less than 10%, the regression model is considered accurate. The interaction plot in Fig. 13 demonstrates the influence of the four factors, composite material, temperature, speed, and pressure, on Young’s modulus. In this plot, each line represents a level of the second factor, while the average response for the first factor is shown along the x-axis. It is evident that increasing the nanodiamond concentration from 0.0 wt.% to 0.5 wt.% leads to a significant improvement in Young’s modulus across all temperature, speed, and pressure levels. In contrast, the effects of speed and pressure exhibit non-linear behavior due to their interactions with other factors.

Figure 13: Interaction plot for Young’s modulus
Contour Plots of Young’s Modulus
Fig. 14a presents a contour plot illustrating that Young’s modulus increases with rising composite content but tends to decrease as the temperature increases. The highest stiffness values (>175 MPa) are achieved at high composite concentrations combined with low temperatures. Conversely, the lowest stiffness occurs when composite content is low and temperature is high. Fig. 14b shows the relationship between Young’s modulus, composite content, and processing speed. It reveals that Young’s modulus improves as both composite content and speed increase. Values exceeding 175 MPa are observed at high composite content and high processing speeds, while lower modulus values occur with low composite content and slower speeds. Fig. 14c depicts the influence of composite content and pressure on Young’s modulus. The modulus increases with higher composite loading and higher pressure, with values above 175 MPa occurring at elevated levels of both factors. In contrast, lower modulus values (<160 MPa) are seen at low composite contents and lower pressures.
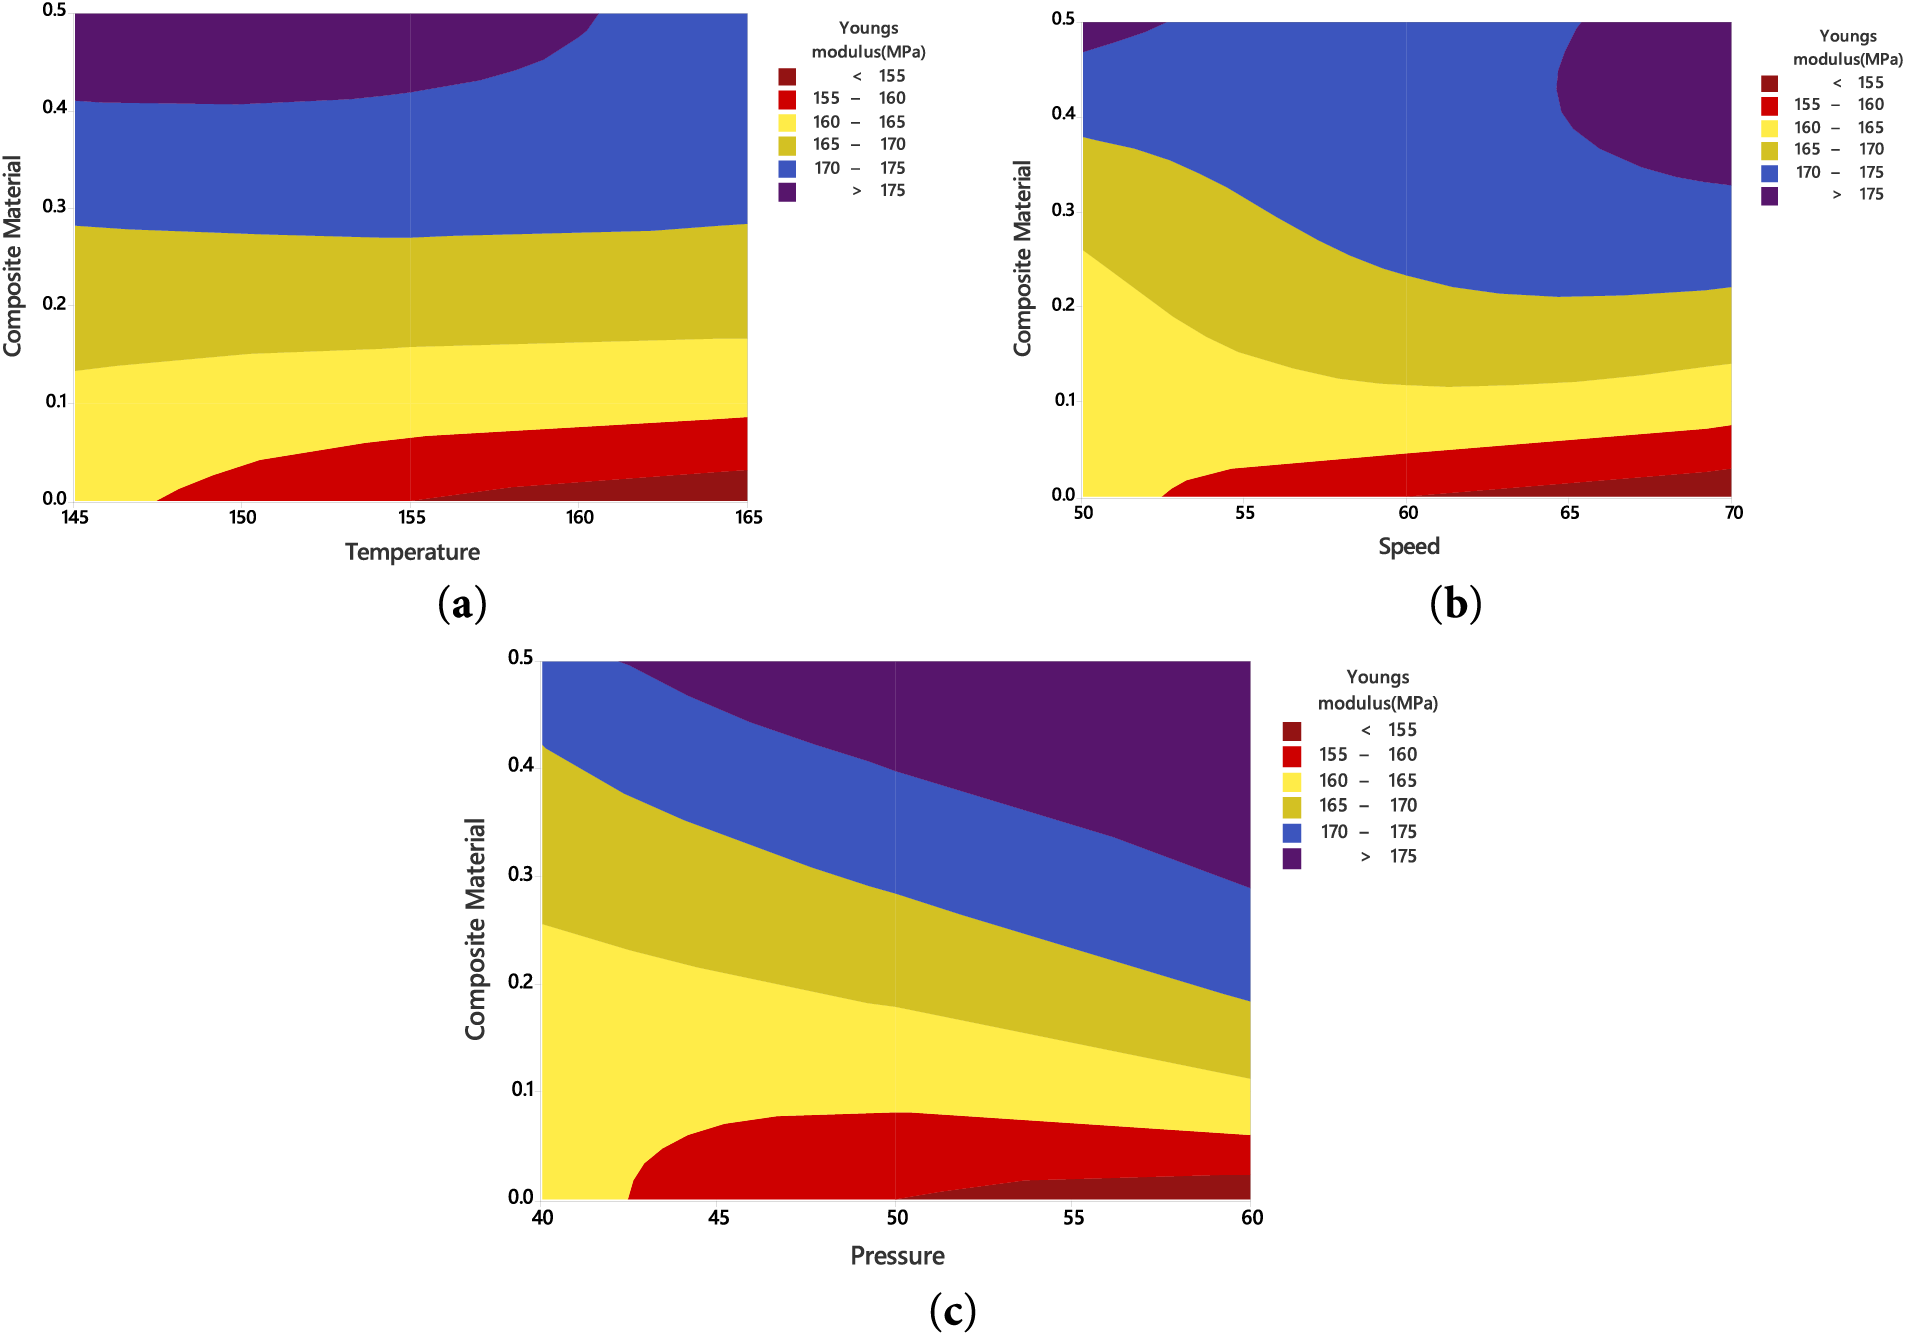
Figure 14: Contour plots of Young’s modulus vs. (a) Composite material, temperature (b) Composite material, speed (c) Composite material, pressure
3.4.3 Analysis of Variance for Hardness
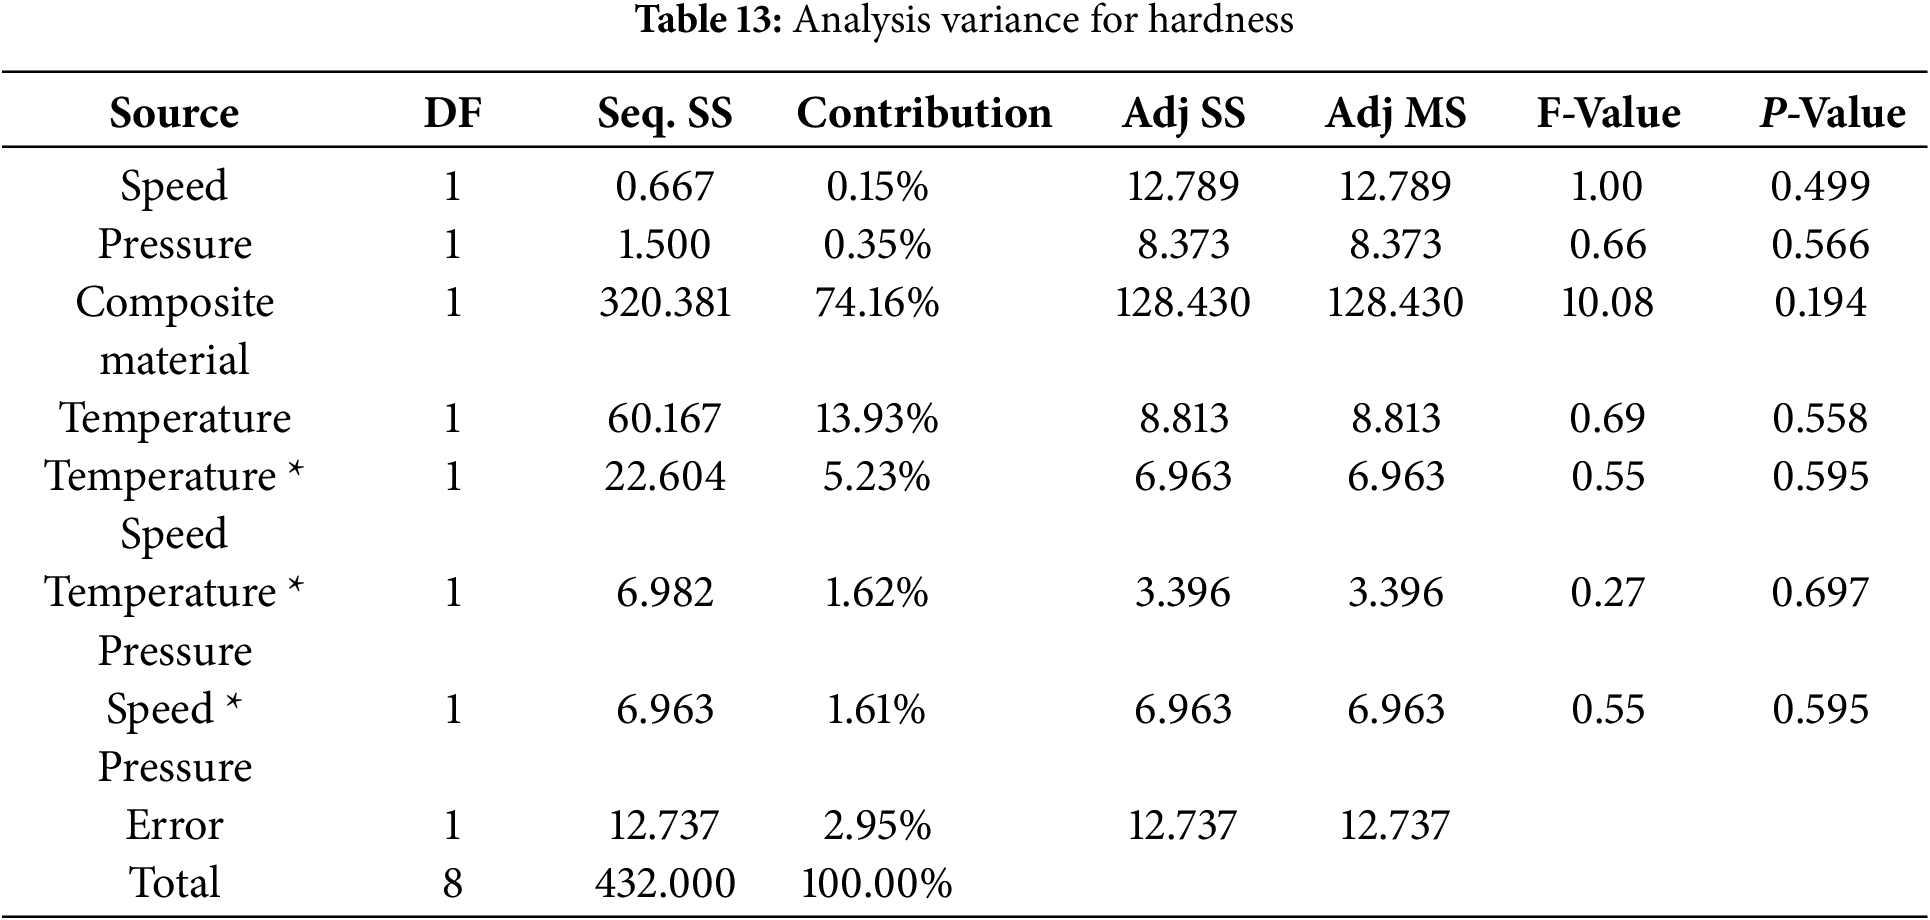
Analysis of variance (ANOVA) for Hardness analysis was carried out using the Taguchi method with composite material, temperature, speed, and pressure as parameters, applying the “larger-is-better” criterion at a 95% confidence level. As shown in Table 13, composite material had the highest contribution (74.16%), followed by temperature (13.93%) and the temperature * speed interaction (5.23%), while the remaining factors had minimal effects. Overall, composite material and temperature were the most significant factors. The relatively high hardness values in PU–ND composites are attributed to the brittle fracture behavior of the 0.5 wt.% ND sample.
A linear regression model was developed to relate hardness to the process variables—composite material (C), temperature (T), speed (N), and pressure (P). The regression Eq. (11) illustrates these relationships, allowing evaluation of factor interactions and accurate prediction of hardness values.
Regression Equation for Hardness:
Fig. 15 compares the experimental hardness values with those predicted by the regression model. The difference between the experimental and ANOVA-predicted results is less than 10%, confirming the model’s validity and reliability.
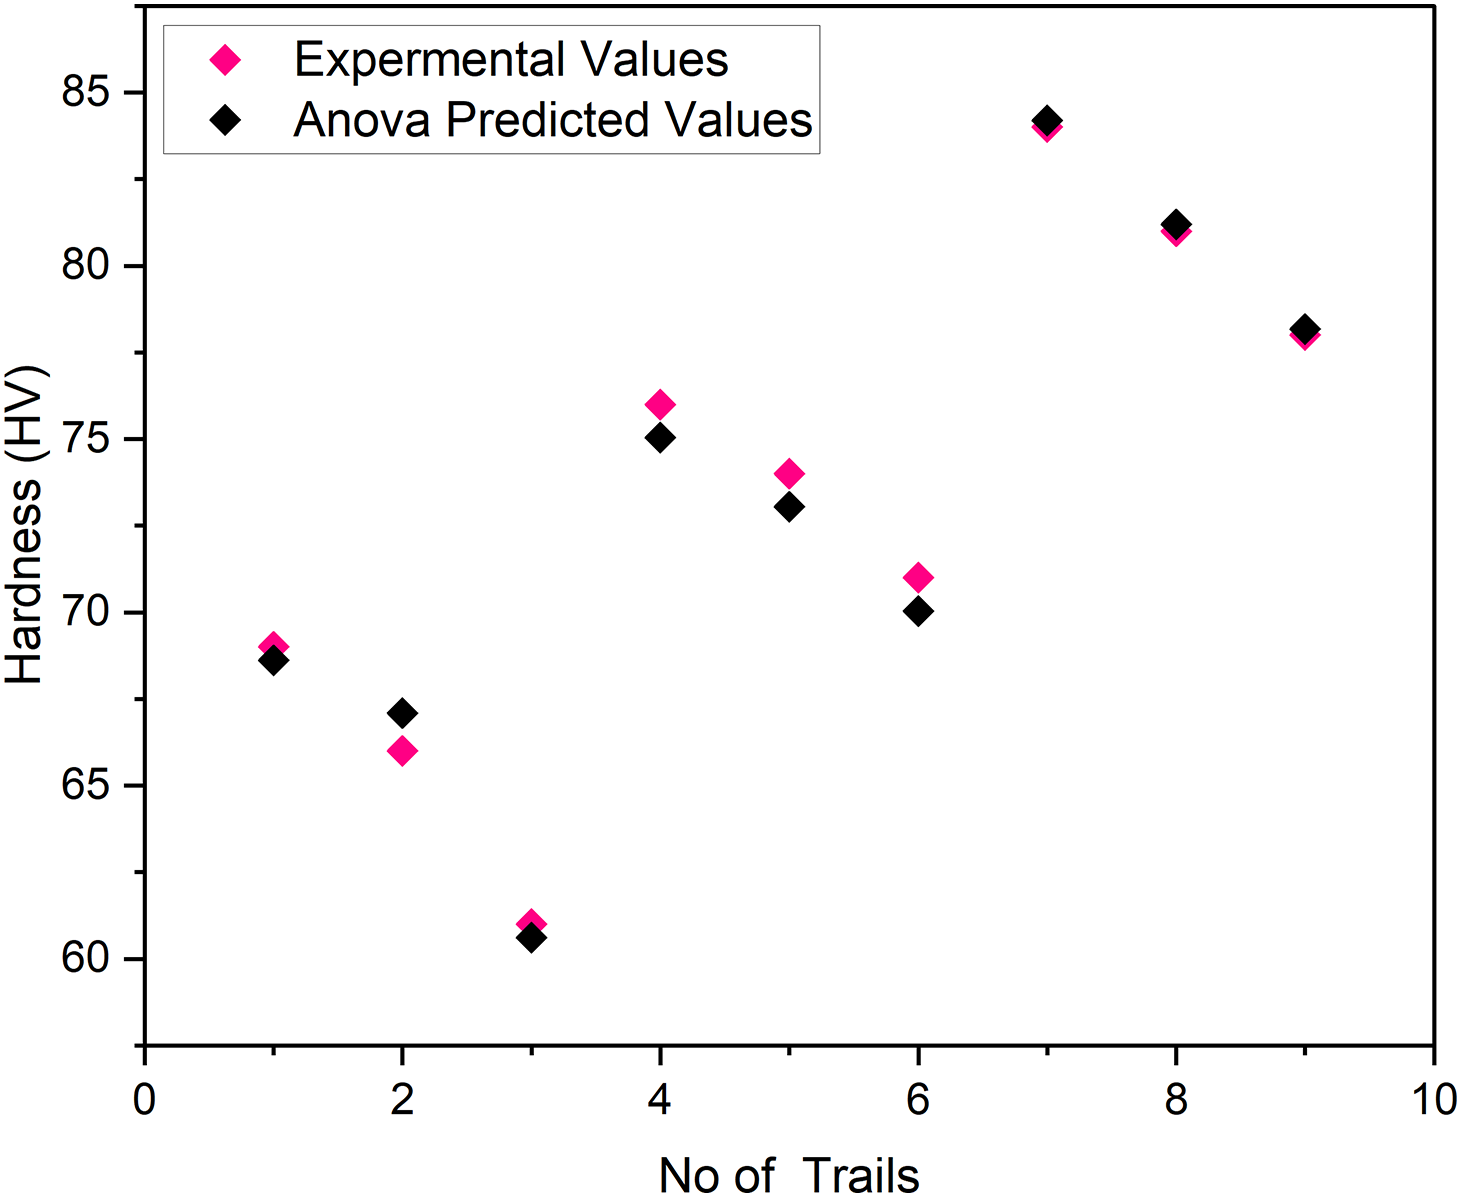
Figure 15: Experimental vs. ANOVA predicted values of hardness
Fig. 16 illustrates the interaction effects of composite material, temperature, speed, and pressure on hardness. The interaction plot reveals that composite material and temperature are the most influential factors affecting hardness, whereas speed and pressure have a much smaller impact. The contour plot in Fig. 17a shows how hardness varies with composite material concentration and temperature. Hardness increases significantly with higher composite content, reaching maximum values above 80. In contrast, low composite content combined with lower temperatures results in minimum hardness values below 65. Overall, the figure highlights that composite material content has a stronger influence on hardness compared to temperature.
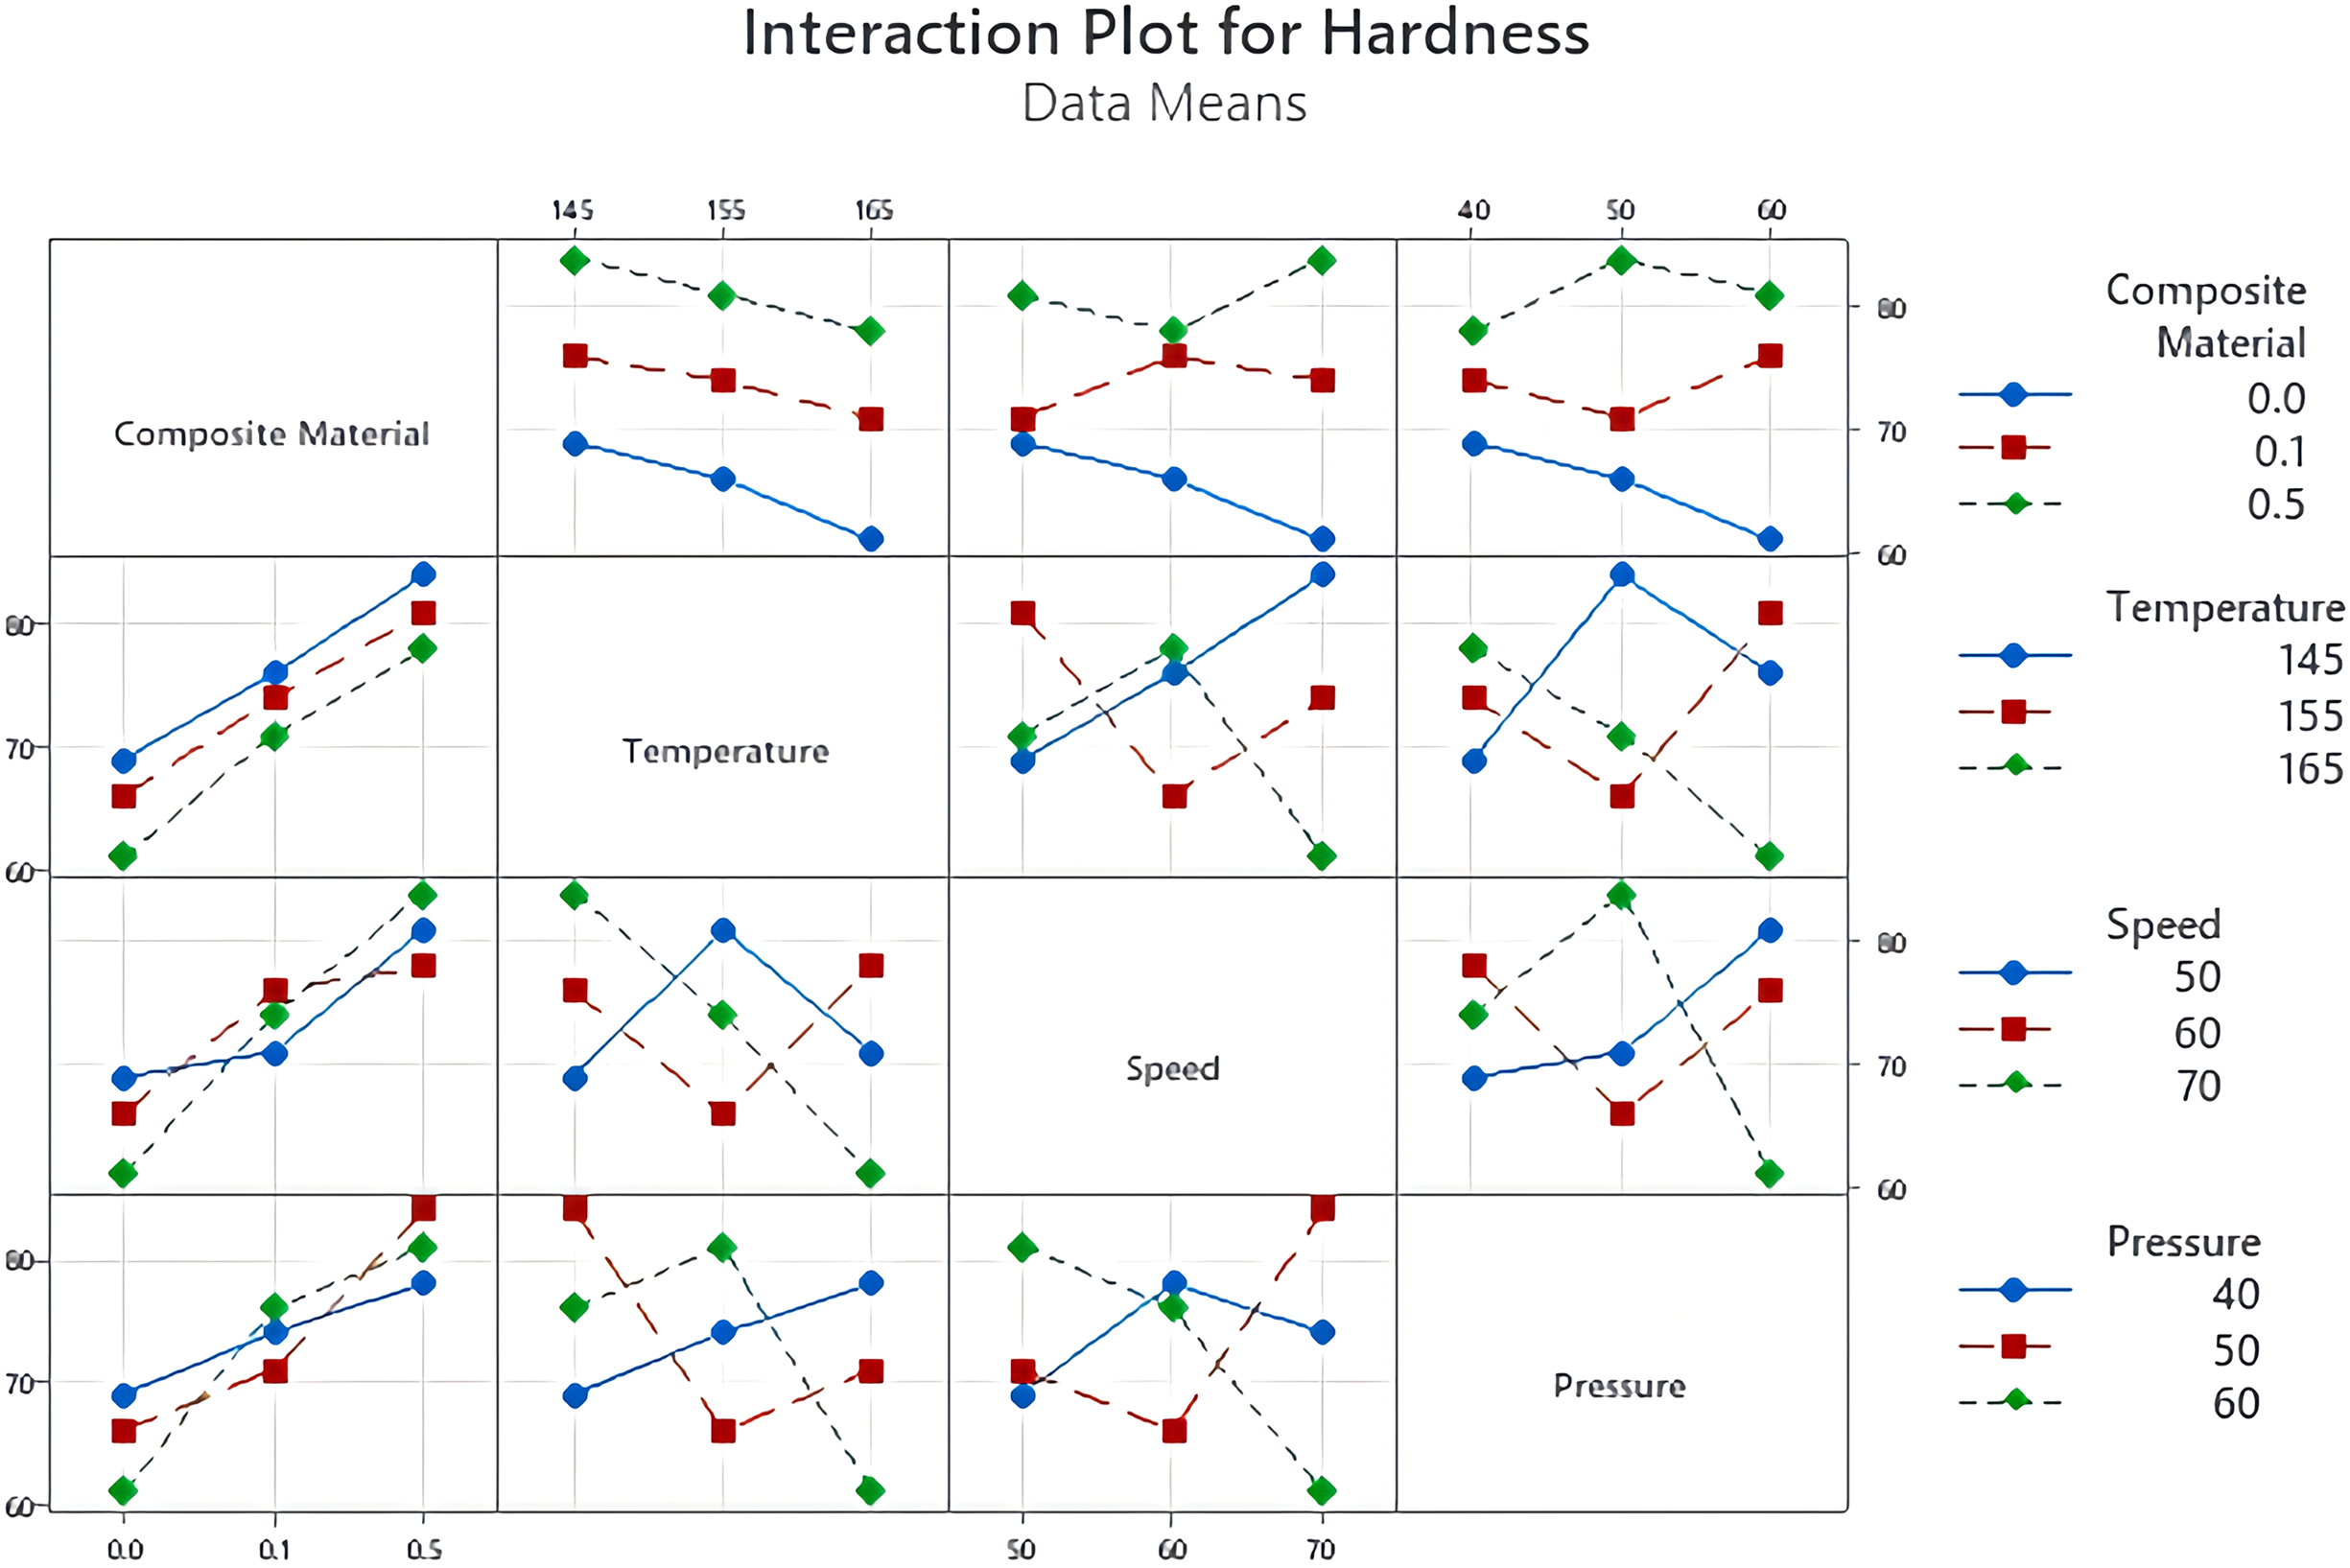
Figure 16: Interaction plot for hardness
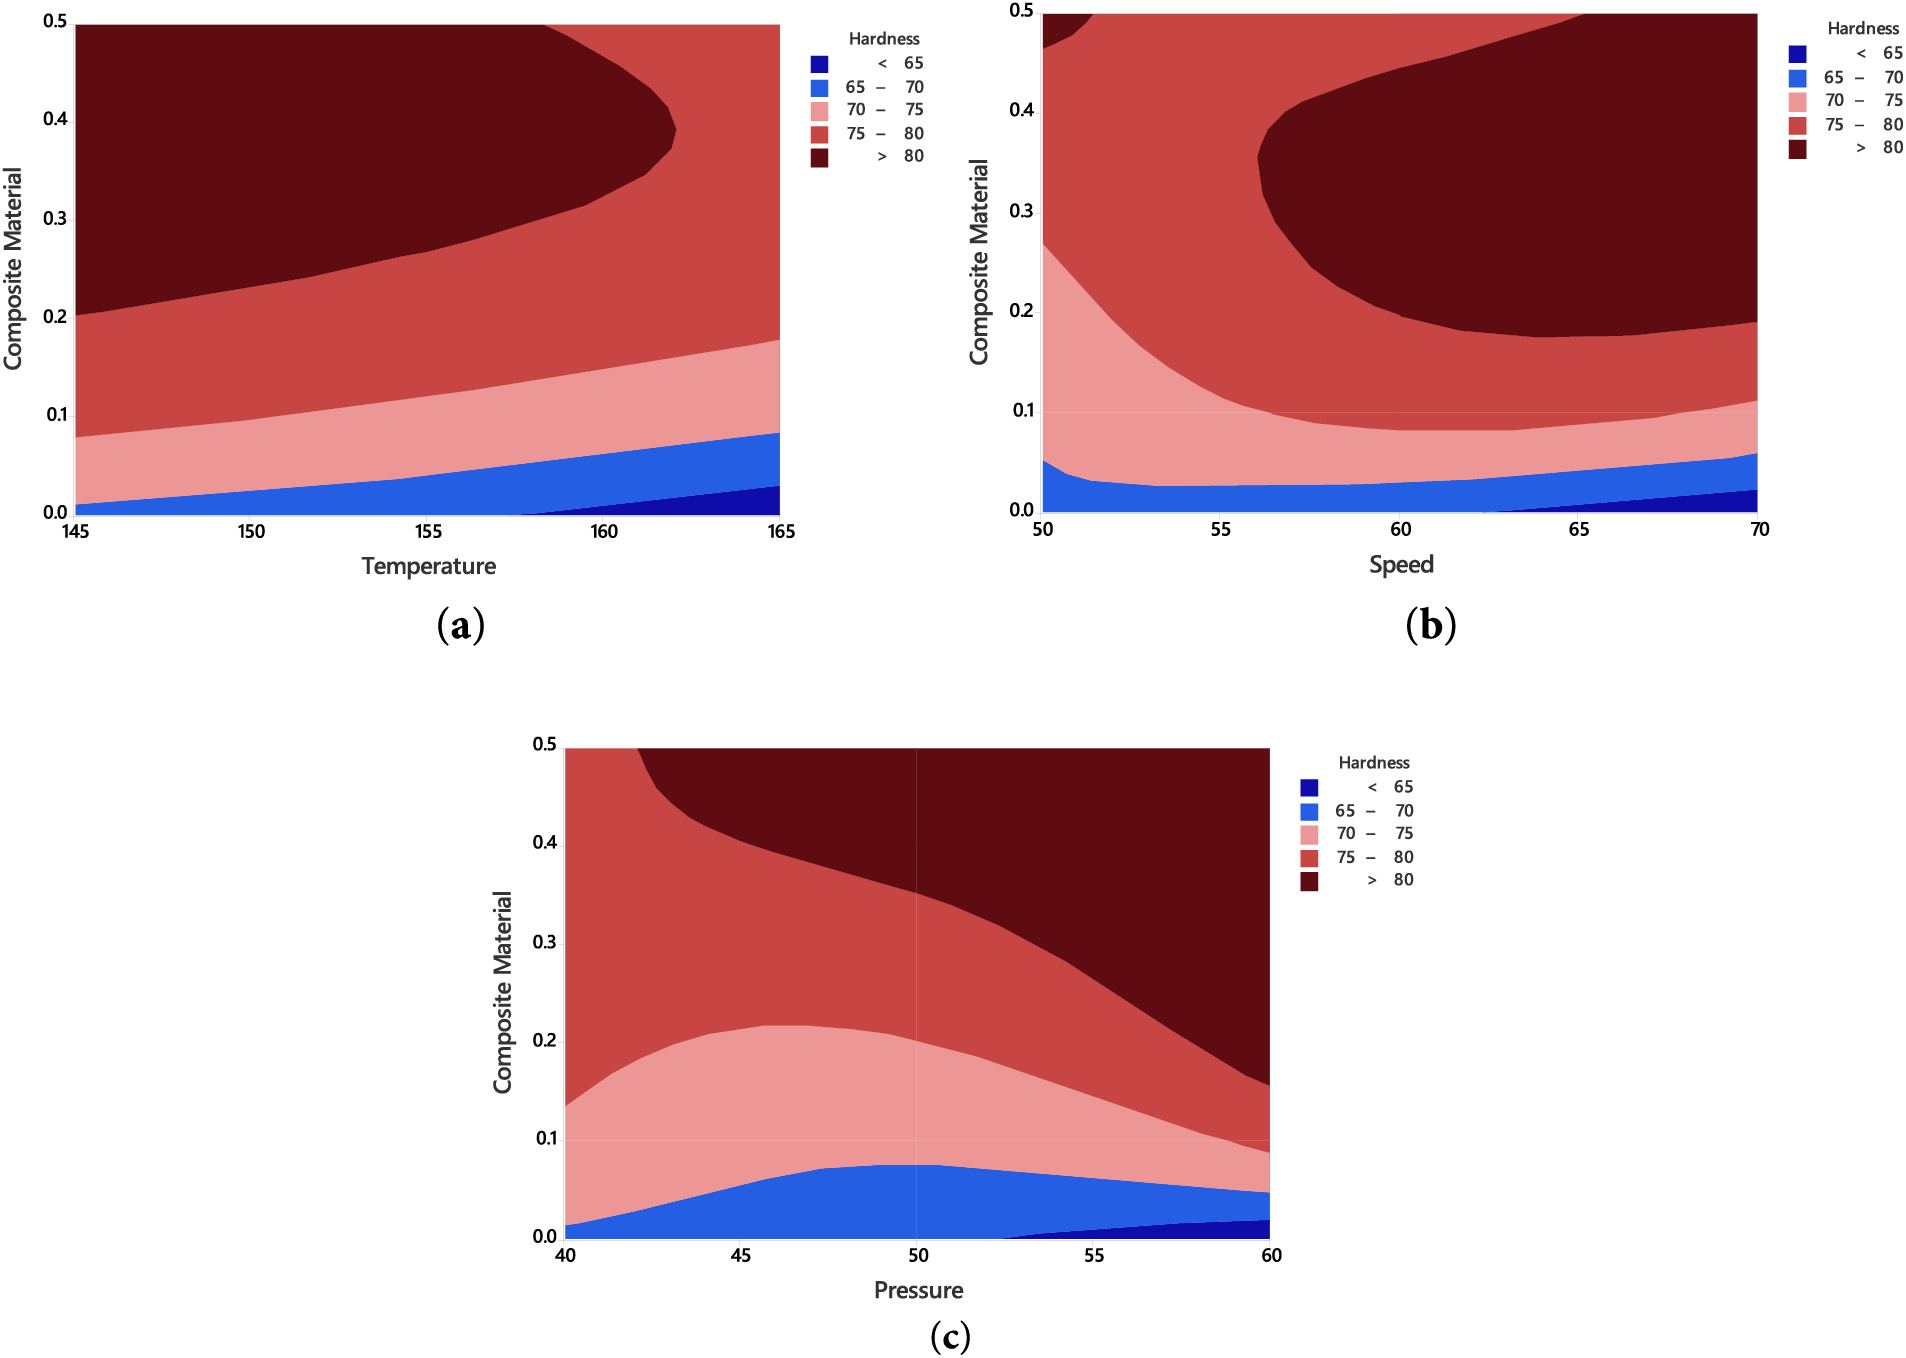
Figure 17: Contour plots of hardness, (a) Composite material vs. temperature (b) Composite material vs. speed (c) Composite material vs. pressure
The contour plot in Fig. 17b shows that hardness increases with both composite material content and processing speed. Lower hardness values (<65) occur at low composite content and speed, while peak hardness values (>80) are achieved at higher composite content levels. This indicates that both composite content and speed positively influence hardness, with composite material having the stronger effect. Similarly, Fig. 17c presents the contour plot of hardness as a function of composite material content and pressure. Hardness remains low (<65) when both composite content and pressure are low, but increases above 80 at higher composite contents across all pressure levels. Again, composite material content has a more pronounced impact on hardness than pressure.
3.5 Computational Modeling and Analysis Using Machine Learning Models
3.5.1 Random Forest Regression
Tensile Strength, Young’s Modulus, and Hardness Regression Results
Random Forest Regression proved to be an effective algorithm for capturing complex nonlinear interactions among variables. Fig. 18a illustrates the comparison between actual and predicted tensile strength values. The model achieved an R2 value of 0.95, with a mean squared error (MSE) of 0.53, root mean squared error (RMSE) of 0.73, mean absolute error (MAE) of 0.66, and mean absolute percentage error (MAPE) of 11.51. Similarly, Fig. 18b presents the comparison for Young’s modulus, where the actual values are plotted on the x-axis and the predicted values on the y-axis. The yellow dots represent individual data points, while the black diagonal line corresponds to the ideal prediction line (y = x). In this case, the model again achieved an R2 value of 0.95, with an MSE of 4.03, RMSE of 2.00, MAE of 1.87, and MAPE of 1.15. Fig. 18c shows the actual vs predicted hardness values from the Random Forest regression model. Each of the yellow dots corresponds to a sample’s actual hardness value, which is plotted on the X-axis, along with predicted hardness on the Y-axis. The black diagonal line signifies a perfect fit where predicted equals actual values (y = x). Most points lie close to this line, indicating strong prediction accuracy. The model achieved an R2 of 0.94, MSE of 2.44, RMSE of 1.56, MAE of 1.34, and MAPE of 1.88.


Figure 18: Actual vs. Predicted values of (a) tensile strength (b) Young’s modulus (c) Hardness
Tensile Strength, Young’s Modulus, and Hardness Confusion Matrix
Fig. 19a displays the confusion matrix graph from a Random Forest classification model categorizing tensile strength into four classes: Low, Medium, High, and Very High based on their positions in the overall distribution using confusion matrices. The 0th, 25th, 50th, 75th, and 100th percentiles determined categorization thresholds. Values up to the 25th percentile were considered low, between the 25th and 50th percentile were medium, between the 50th and 75th percentile were high, and those beyond the 75th percentile were very high. With such quantile-based binning, the class distribution was upheld to be balanced rather than imbalanced. This allows for a more acceptable interpretation of categorization findings inside the confusion matrices. The rows represent true labels, while the columns show predicted labels. The confusion matrix, Fig. 19a, shows that the model correctly classified as 3 at Low (3/3). The Medium category had two samples that were accurately classified as (2/2). The High category contained 2 samples: one was correctly predicted as High and the other was misclassified as Very High. Very high samples were predicted correctly (2/2). In general, 8 out of 9 samples were correctly classified. These results show the model’s reliable and robust predictive capability [50]. Fig. 19b shows the confusion matrix for a Random Forest classification model predicting Young’s modulus categories: Low, Medium, High, and Very High. Actual class labels are given vertically and predicted labels horizontally. For the Low category, all 3 actual samples were correctly classified as Low (3/3). In the Medium category, 2 samples were incorrectly classified as low. In the high category, 1 sample was incorrectly misclassified as high and medium. In the very High category, instances were accurately classified as (2/2) [51].
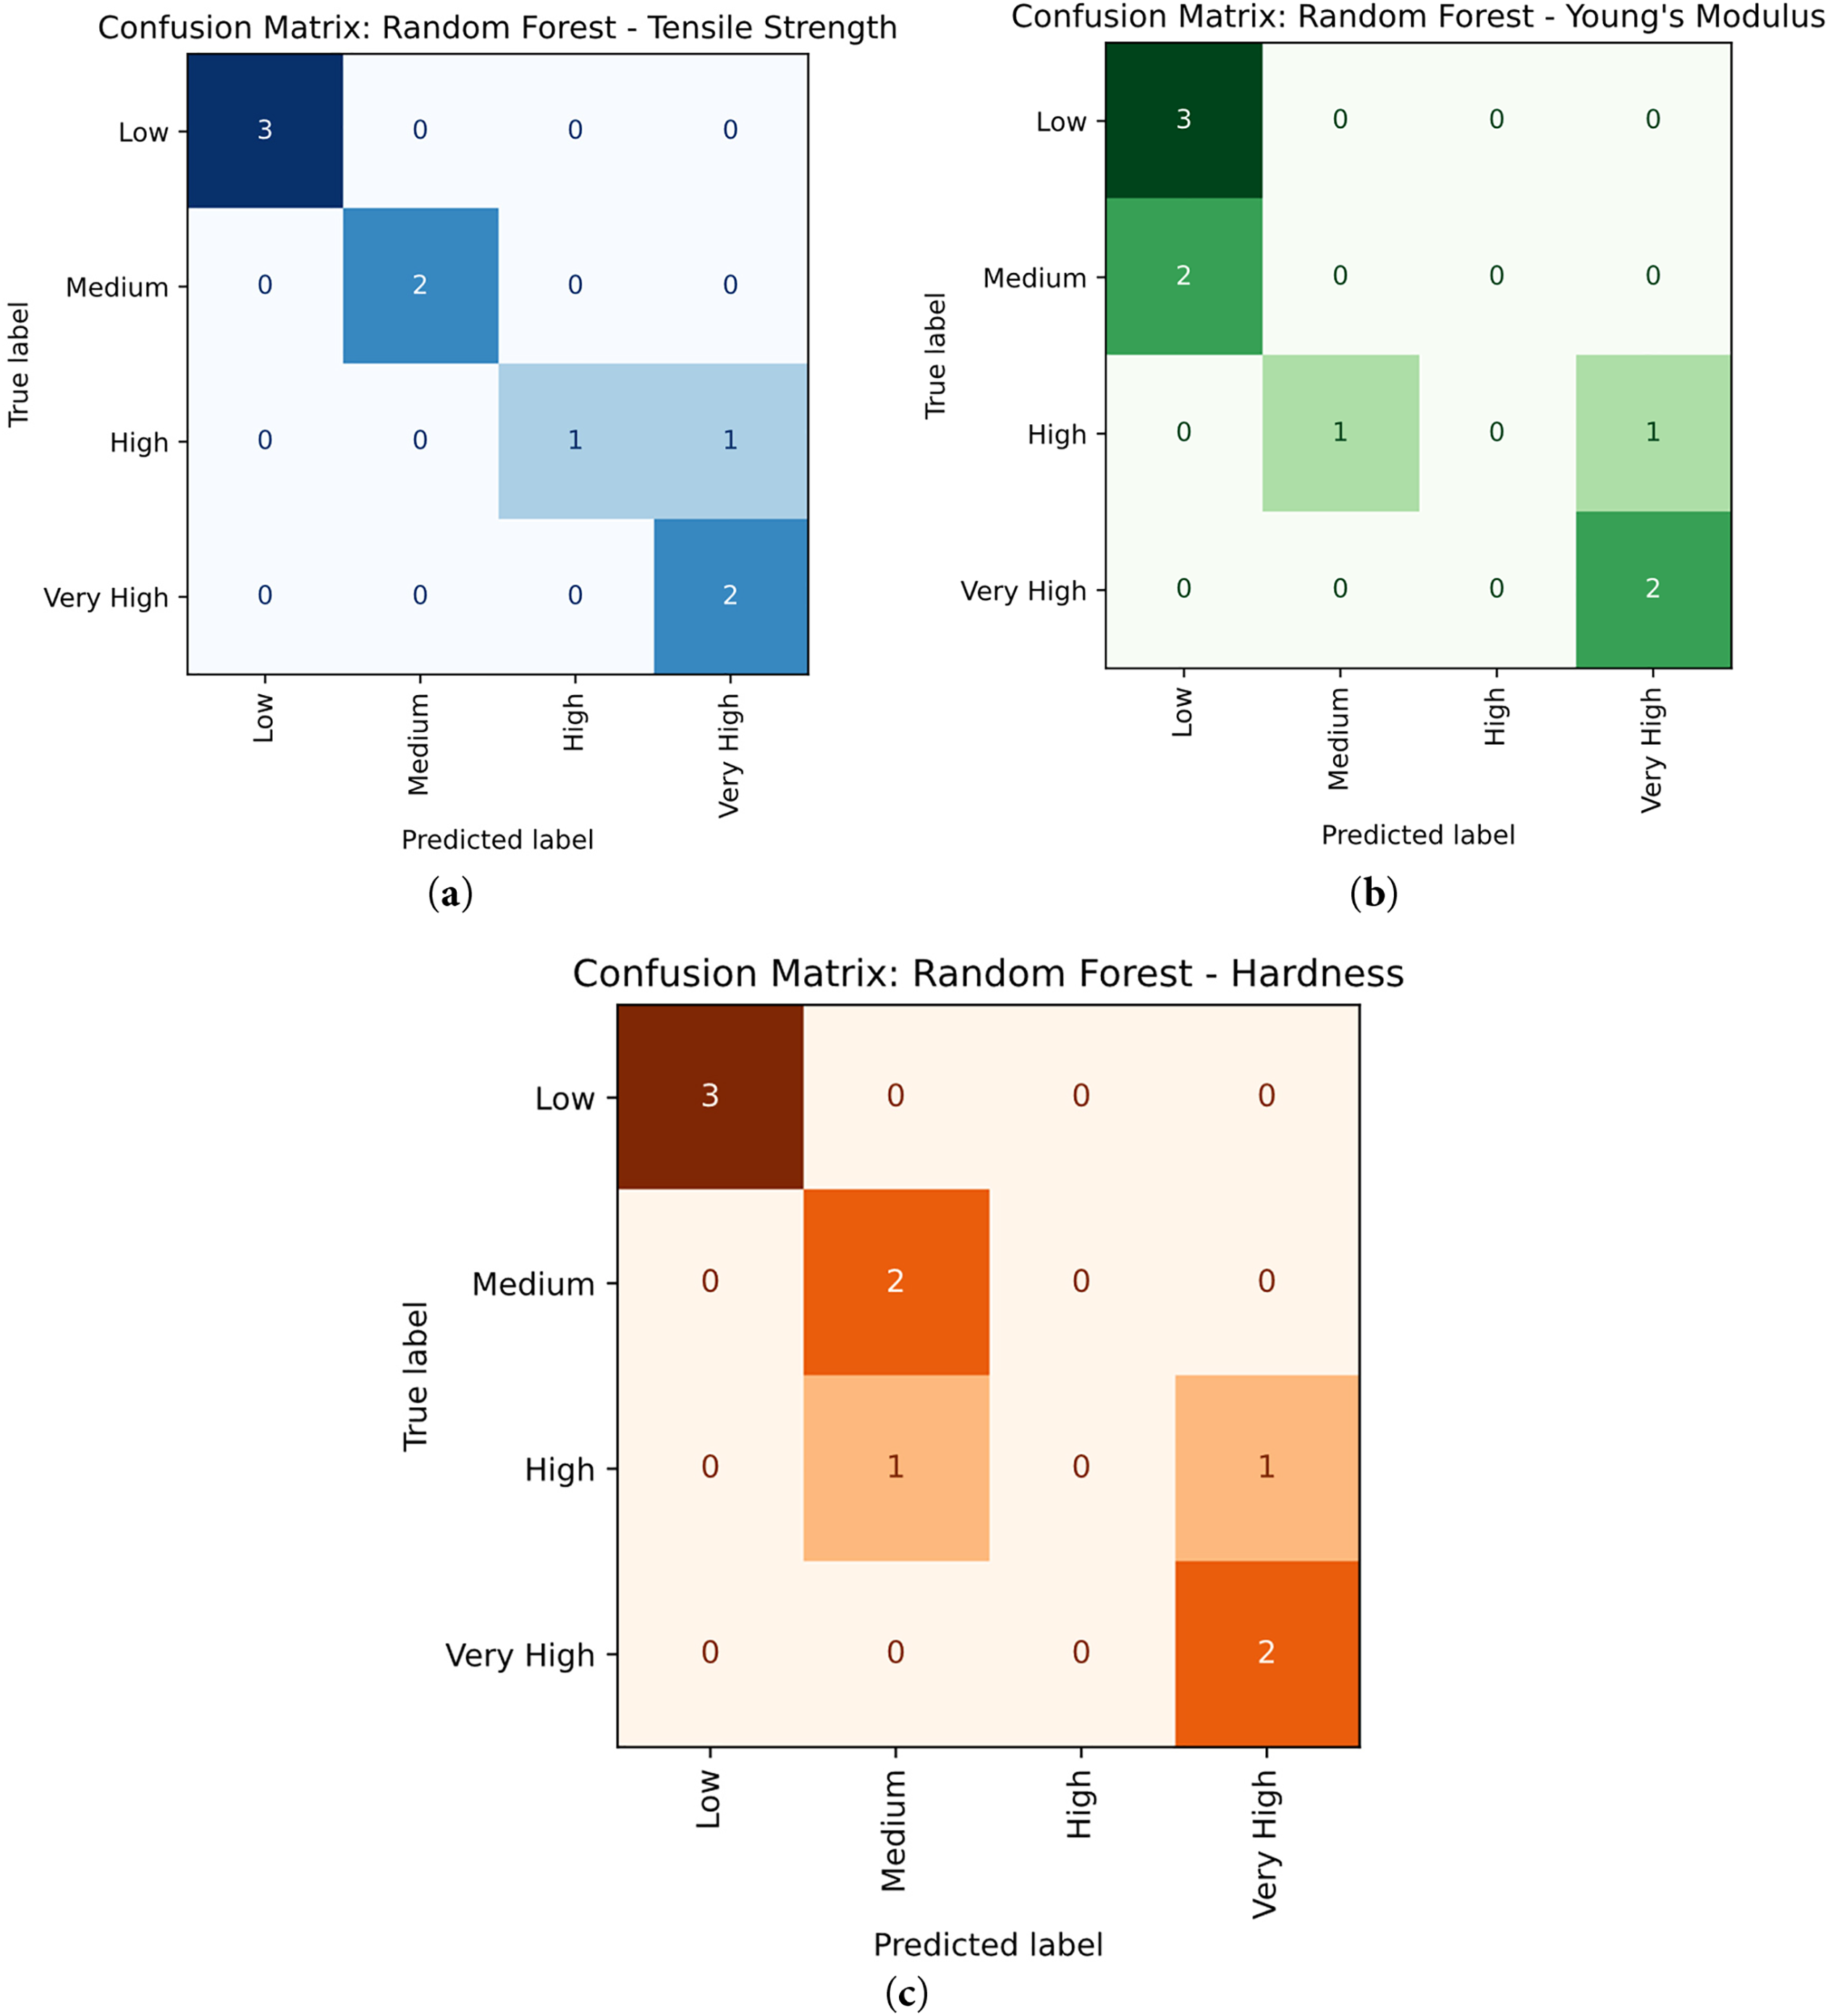
Figure 19: (a) Actual vs. Predicted values of confusion matrices of tensile strength (b) Young’s modulus (c) Hardness
Fig. 19c shows the confusion matrix for hardness, illustrating the classification performance of a Random Forest model across four categories: Low, Medium, High, and Very High. The confusion matrix shows the categorization in all categories. The models in the low (3/3) and middle (2/2) categories were accurately identified. Both high incidences were incorrectly classed as medium and extremely high. Very High category incidents were correctly classed as 2/2. These findings show the model’s consistent overall performance, notably in the low and medium categories [52].
Tensile Strength, Young’s Modulus, and Hardness Regression Results
Fig. 20a shows the results of Gradient Boosting Regression for tensile strength, achieving an R2 value of 0.99, an MSE of 0.03, an RMSE of 0.05, an MAE of 0.04, and a MAPE of 0.93, indicating higher prediction accuracy compared to Random Forest Regression in Fig. 20b Gradient Boosting Regression for Young’s modulus where the R2 value was 0.99, with an MSE of 0.02, an RMSE of 0.14, an MAE of 0.12, and a MAPE of 0.07. Fig. 20c presents the actual and predicted hardness data points using the Gradient Boosting Regression model. The model achieved an R2 value of 0.99, with an MSE of 0.01, an RMSE of 0.11, an MAE of 0.09, and a MAPE of 0.13.
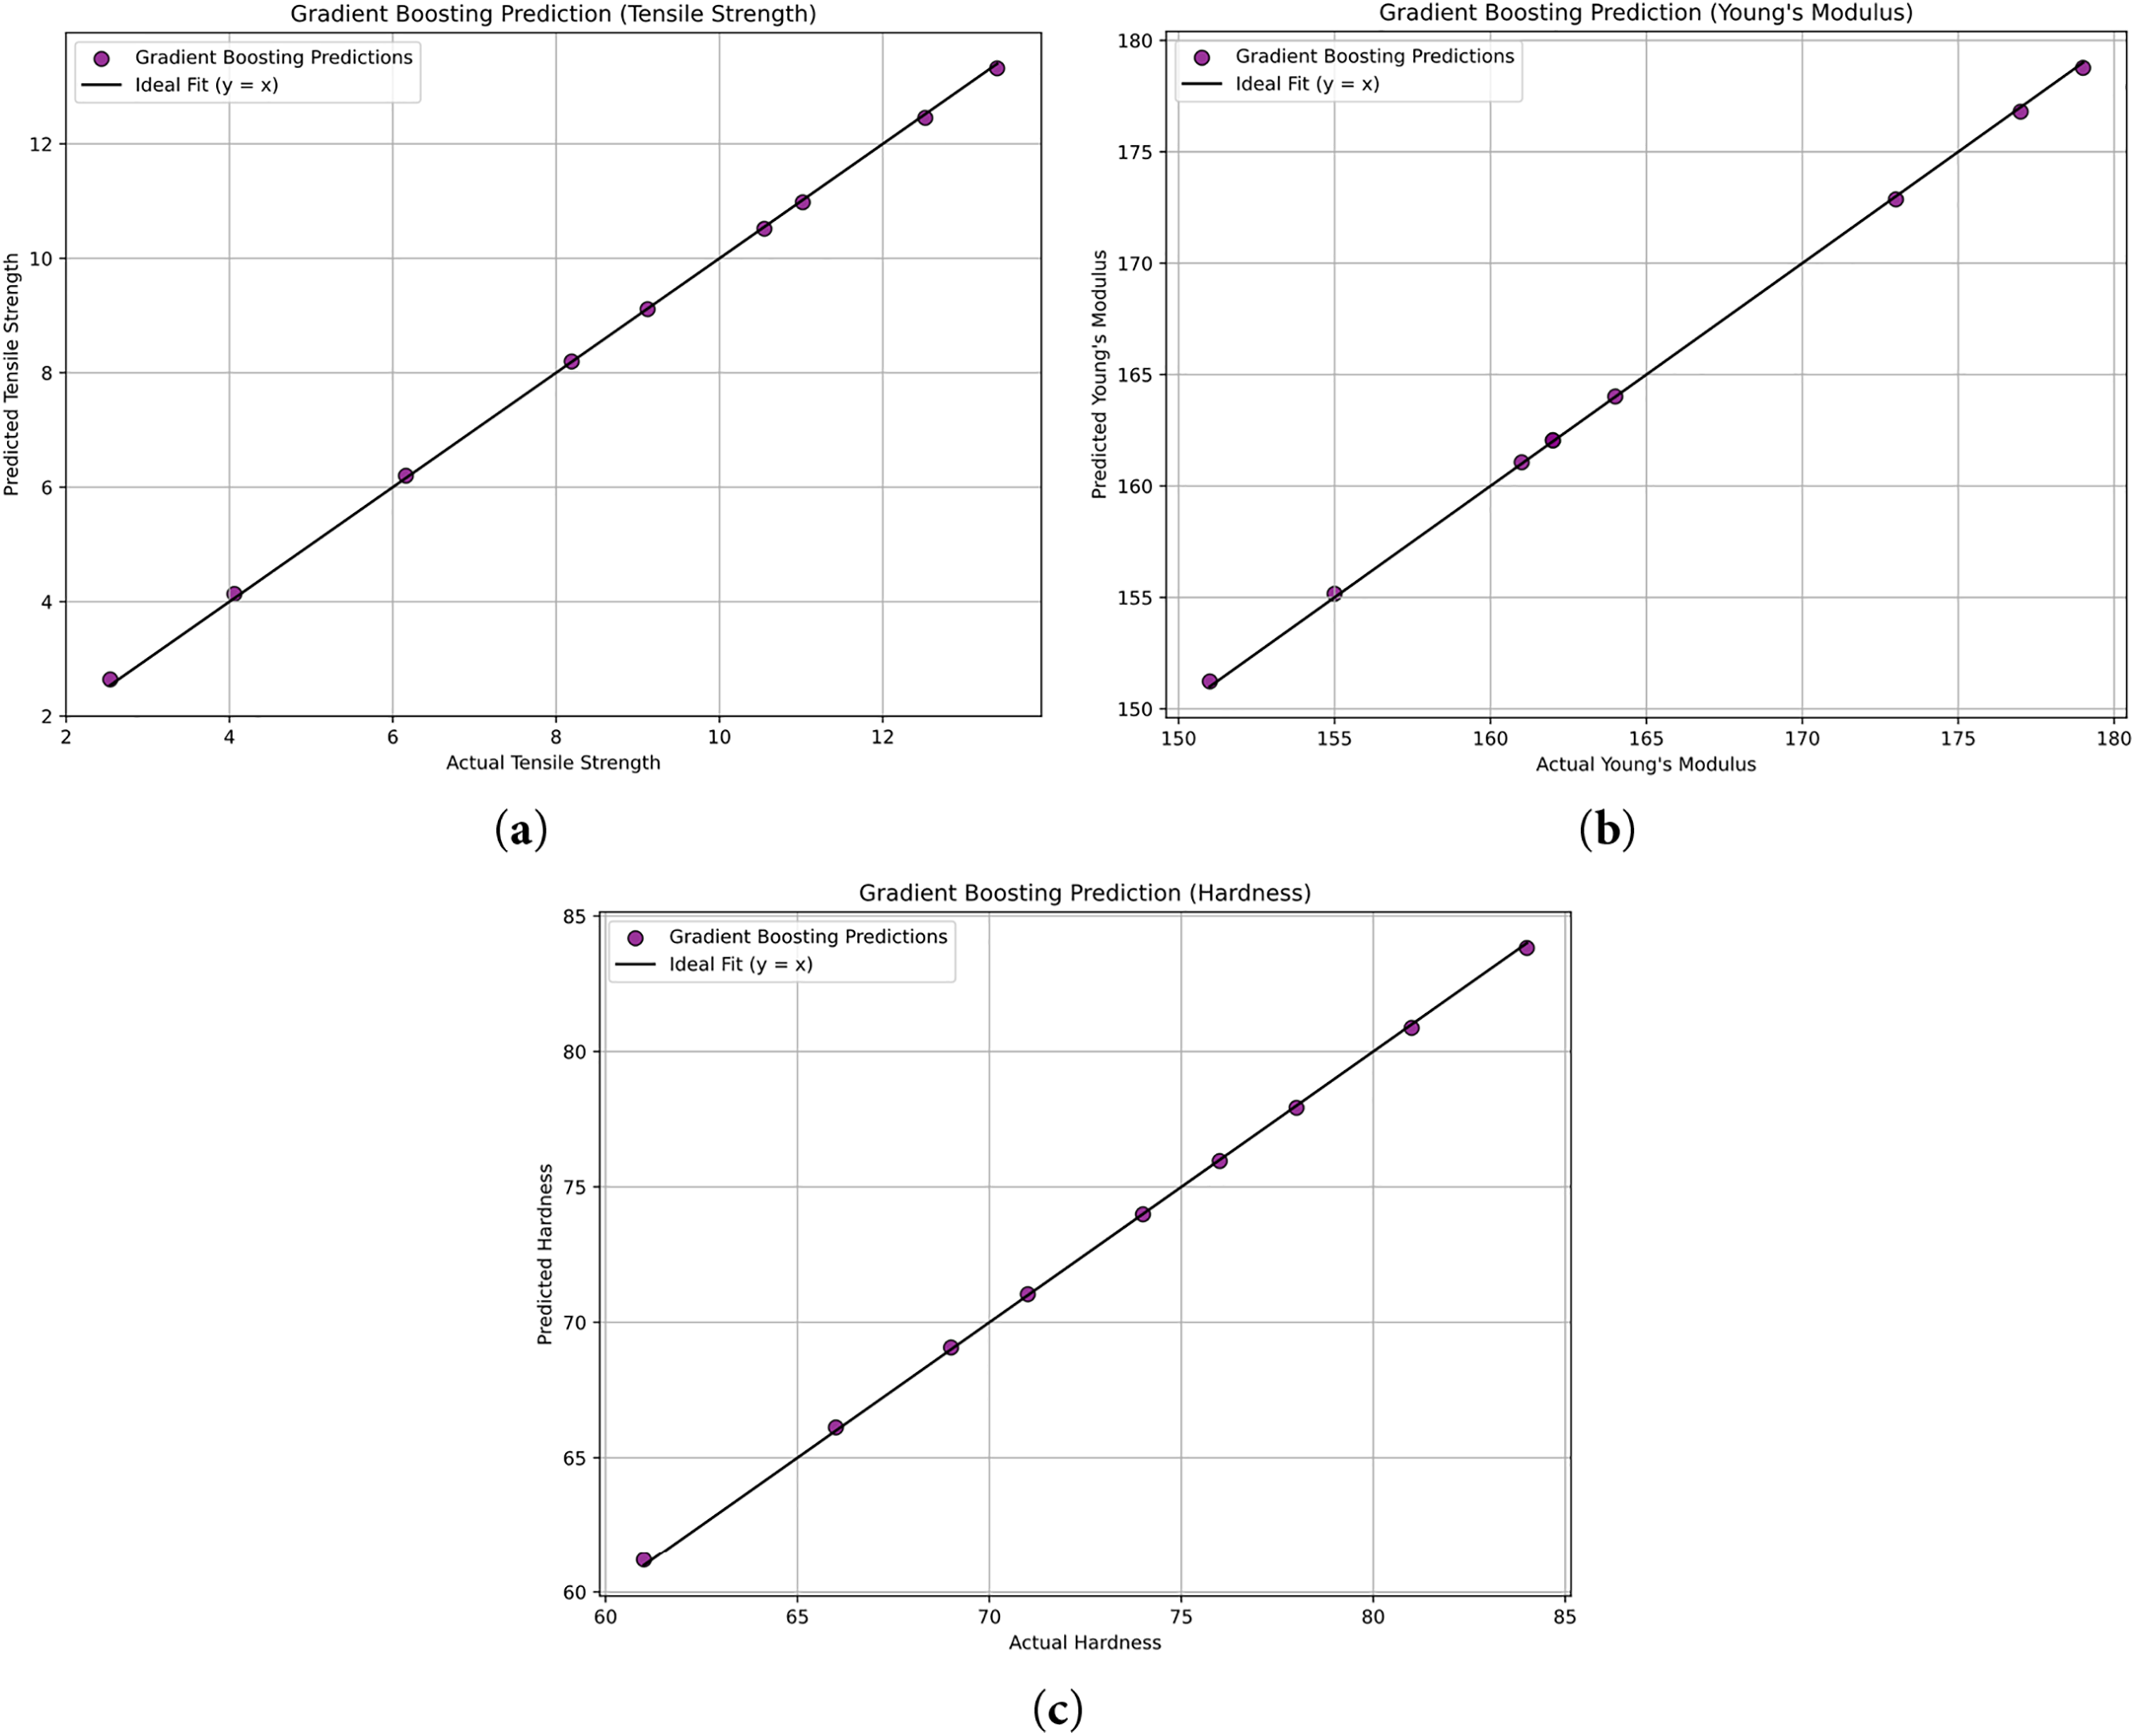
Figure 20: Actual vs. predicted values of (a) tensile strength (b) Young’s modulus (c) Hardness
Tensile Strength, Young’s Modulus, and Hardness Confusion Matrix
Fig. 21a displays a confusion matrix for tensile strength, which is used to evaluate the Gradient Boosting Classification model on four custom categories: Low, Medium, High, and Very High. The matrix compares true class labels with predicted ones, with rows representing actual values and columns indicating predicted values. The confusion matrix shows that in the Medium (2/2), High (2/2), and Very High (2/2) were correctly classified, at the Low category, 2 of 3 cases were accurately classified, with one misclassified as Medium. The confusion matrix highlights the classification accuracy of the Gradient Boosting model across the four categories [53]. Fig. 21b displays a confusion matrix illustrating the performance of the gradient Boost classified in four custom categories: Low, Medium, High, and Very High. The model accurately classified 2 out of 3 Low instances, with one incorrectly predicted as Medium. Both High (2/2) and Very High (2/2) categories were correctly classified with 2 instances each. However, both Medium instances were misclassified as High. In total, the model correctly predicted 6 out of 9 instances, indicating a reasonable classification accuracy [54]. The confusion matrix for hardness in Fig. 21c illustrates the performance of the Gradient Boosting model on four custom classes: Low, Medium, High, and Very High for hardness. The model demonstrated strong predictive accuracy, correctly classifying 8 out of 9 instances. It achieved perfect predictions for all cases in the Medium (2/2), High (2/2), and Very High (2/2) categories. A single misclassification occurred in the Low category, where 2 out of 3 cases were correctly identified, while 1 was misclassified as Medium. These results confirm the model’s reliable and robust predictive capability [53].
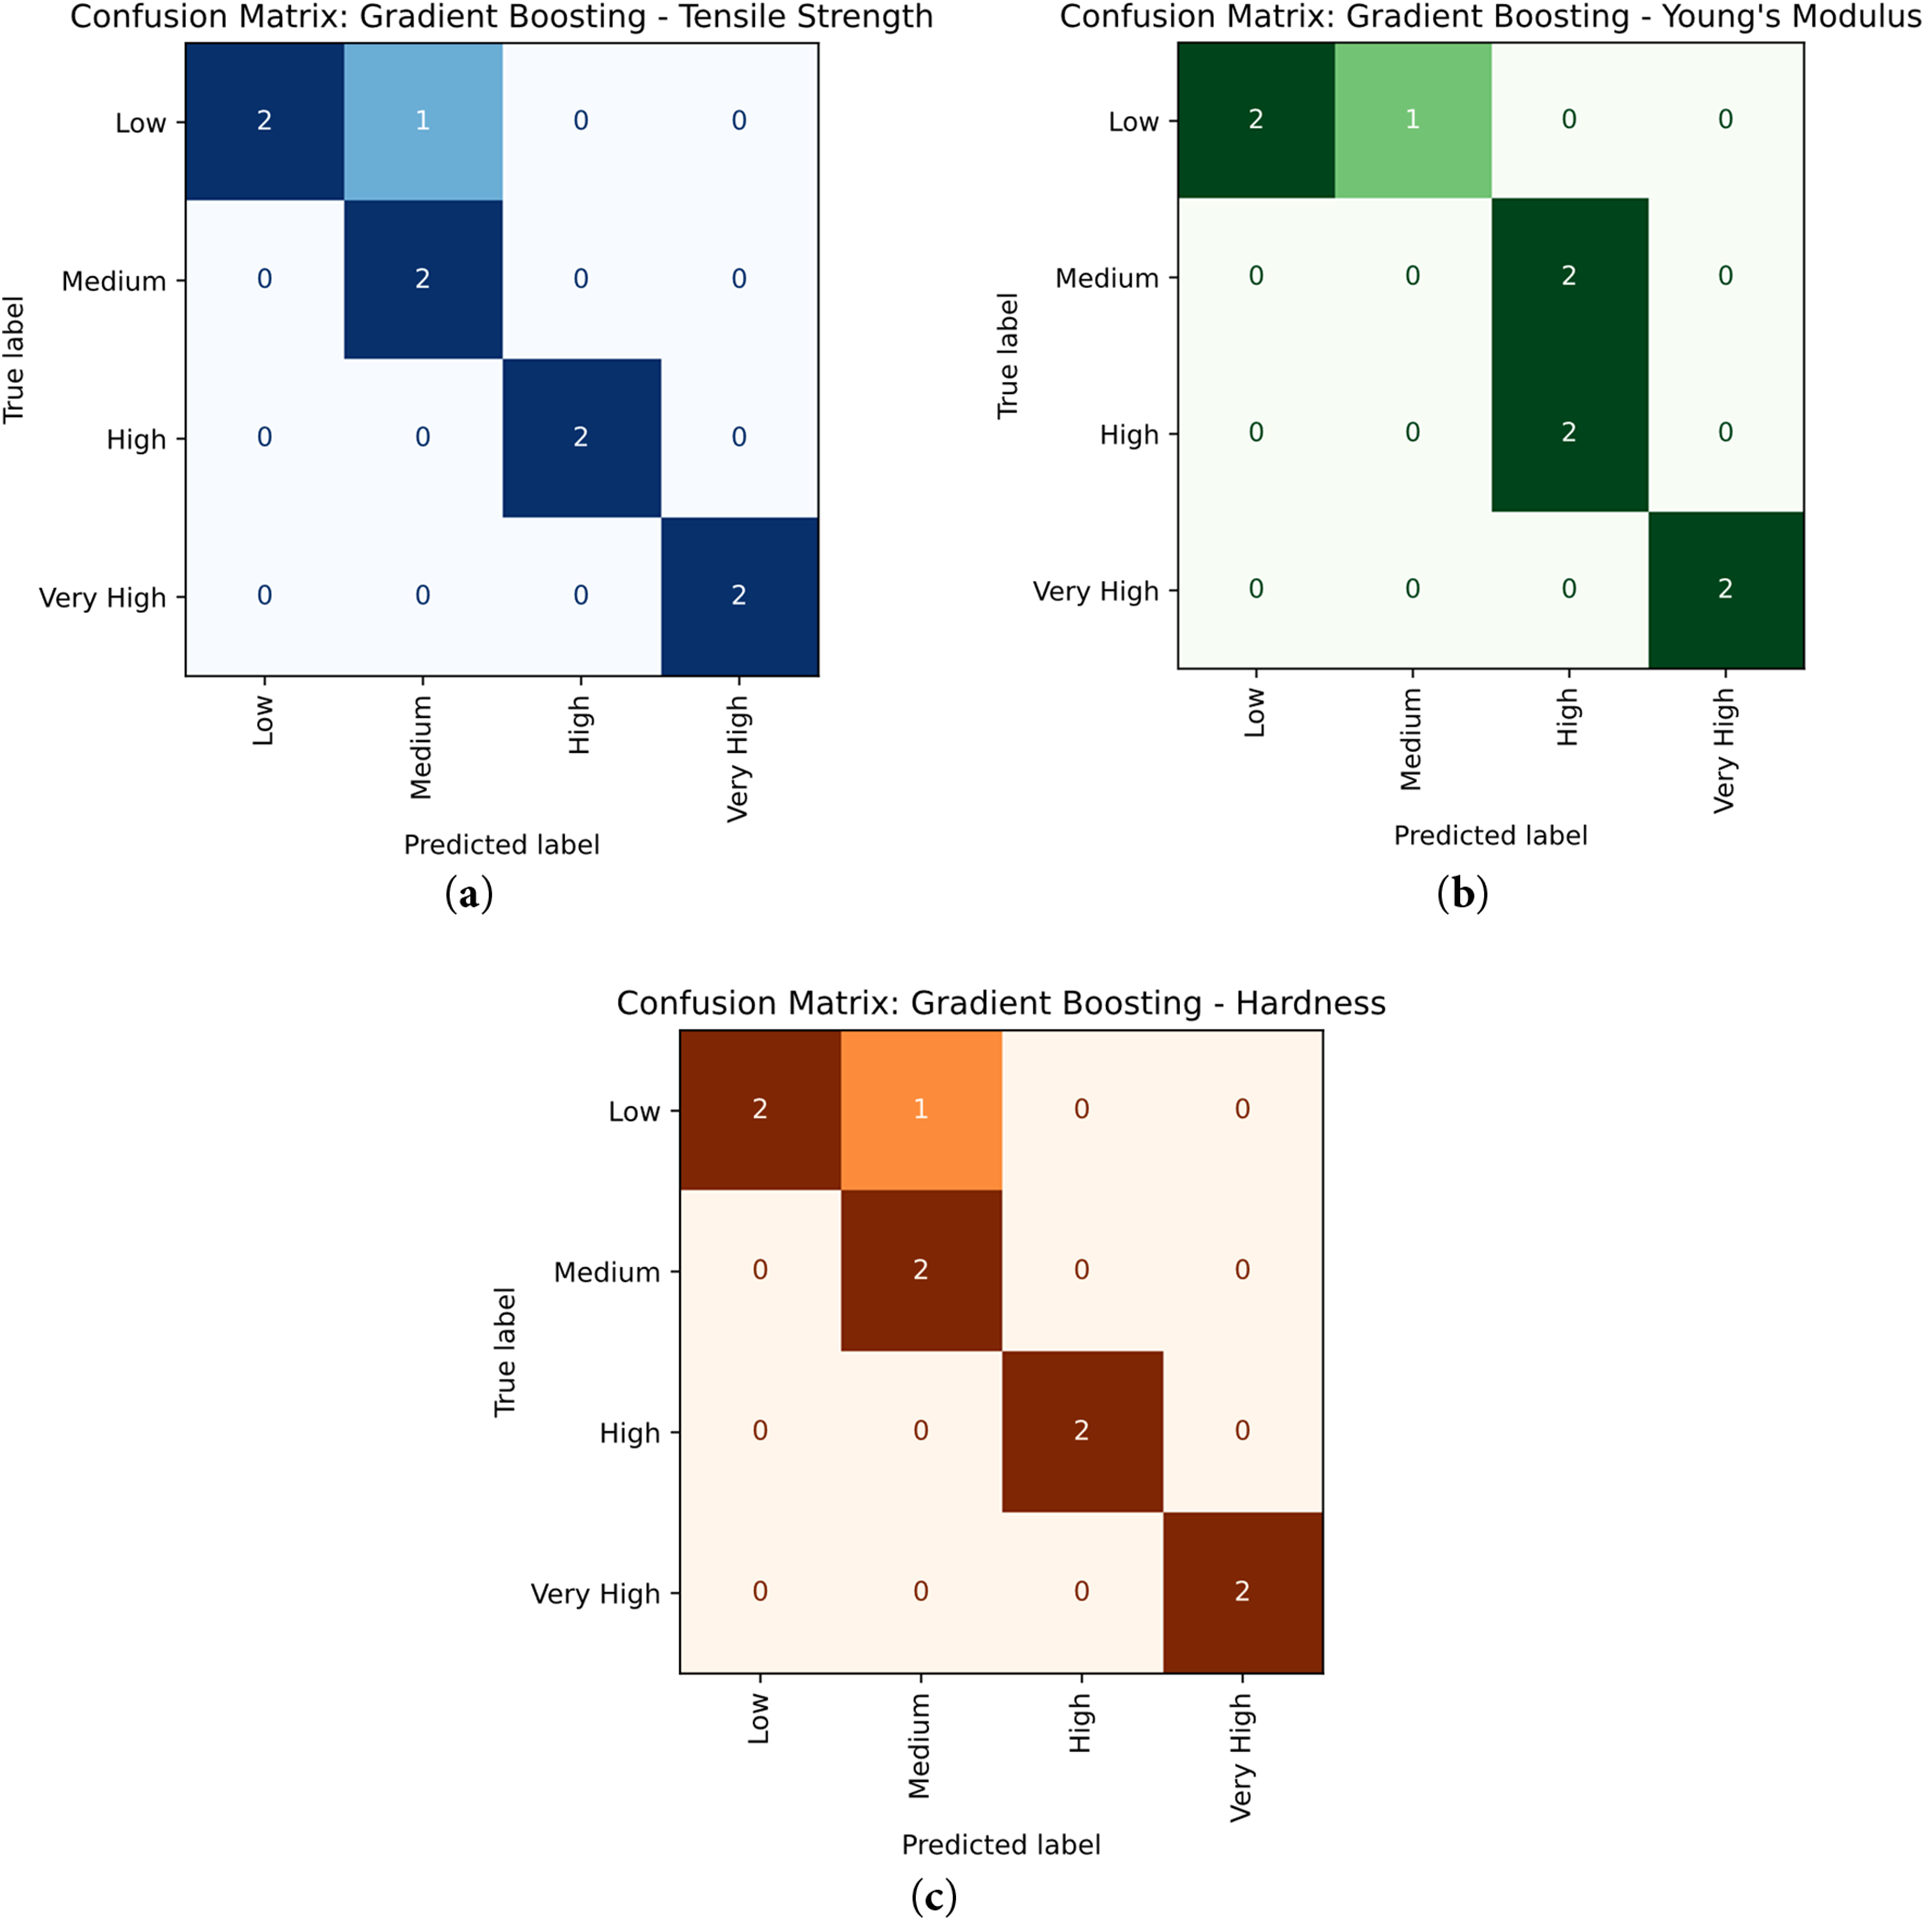
Figure 21: (a) Actual vs. Predicted values of confusion matrices of tensile strength (b) Young’s modulus (c) Hardness
Tensile Strength, Young’s Modulus, and Hardness Regression Results
Fig. 22a presents the performance of the XGBoost regression model in predicting tensile strength. The model achieved an R2 value of 0.98, with an MSE of 0.12, an RMSE of 0.35, an MAE of 0.24, and a MAPE of 5.25. Fig. 22b shows the actual vs. predicted values for Young’s Modulus using the XGBoost regression model. The model achieved an R2 value of 0.98, with an MSE of 0.77, an RMSE of 0.88, an MAE of 0.62, and a MAPE of 0.37. Fig. 22c shows the comparison of actual vs. predicted hardness values using the XGBoost regression model. The model achieved an R2 value of 0.98, with an MSE of 0.60, an RMSE of 0.77, an MAE of 0.54, and a MAPE of 0.77.
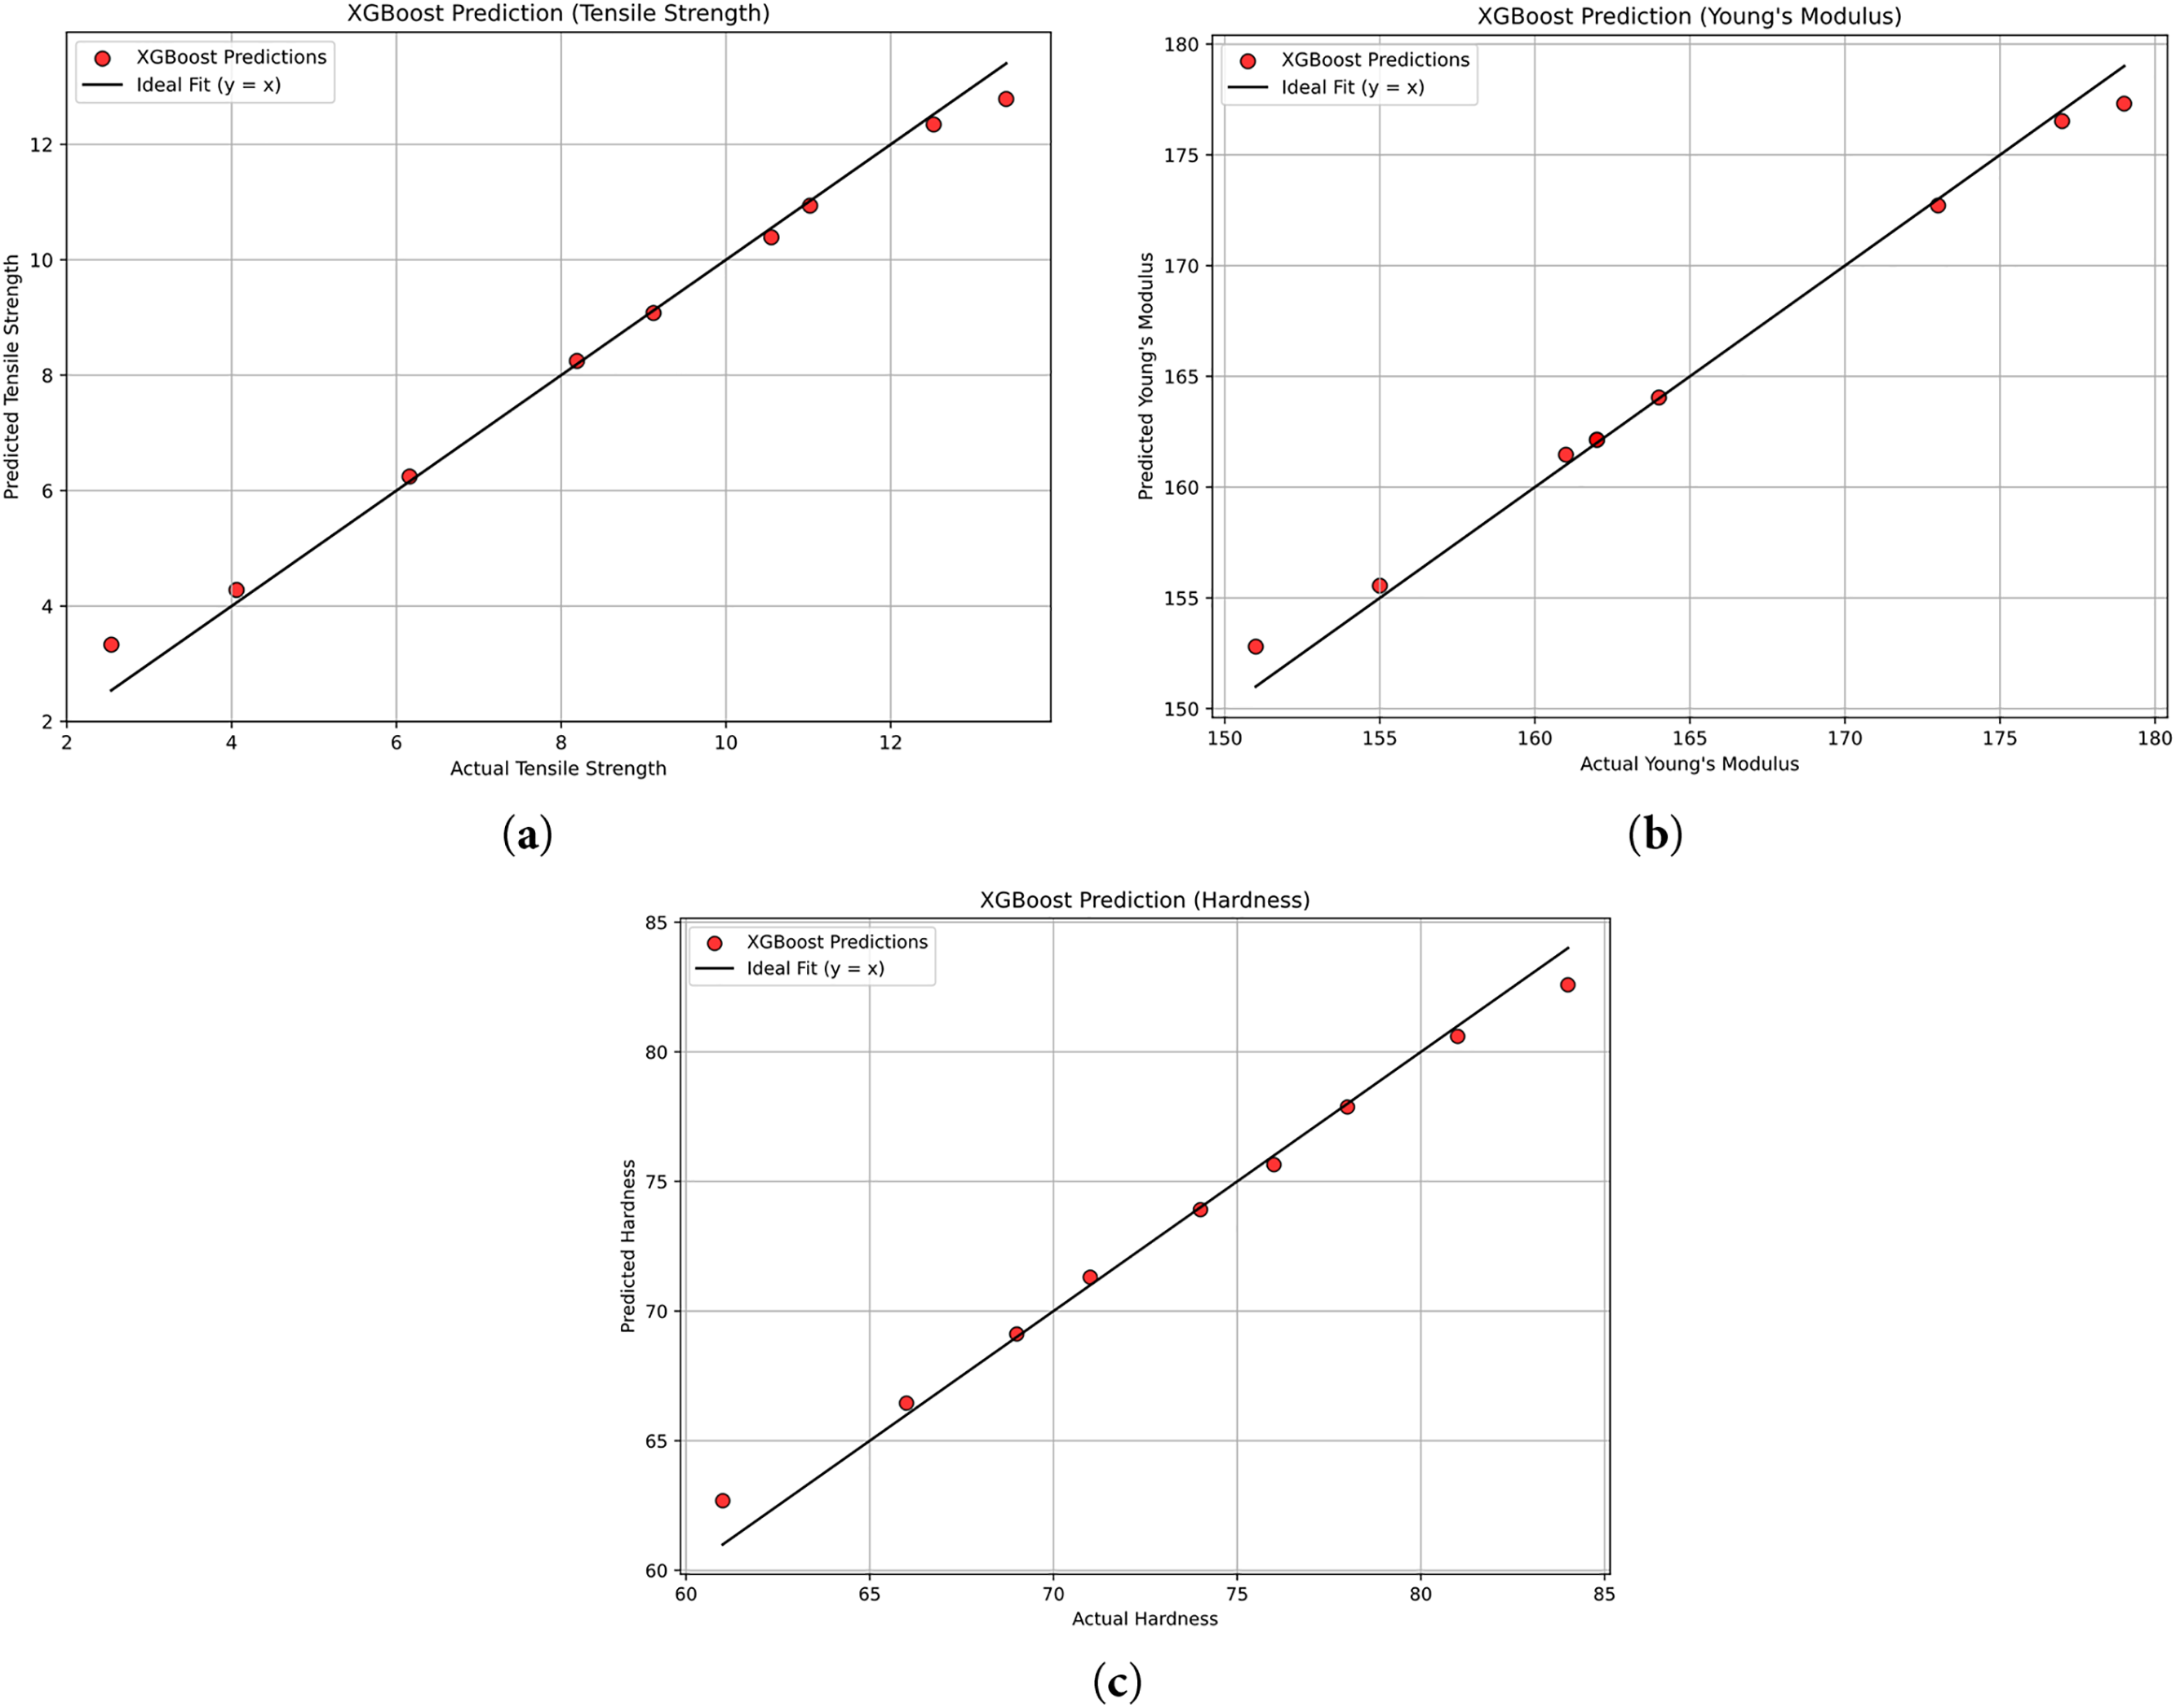
Figure 22: (a) Actual vs. Predicted values of tensile strength (b) Young’s modulus (c) Hardness
Tensile Strength, Young’s Modulus, and Hardness Confusion Matrix
Fig. 23a presents a confusion matrix evaluating the performance of the XGBoost classification model in predicting custom tensile strength categories: Low, Medium, High, and Very High. True class labels are shown along the vertical axis, while predicted labels appear along the horizontal axis. Diagonal elements represent correct classifications, and off-diagonal elements indicate misclassifications. The confusion matrix shows that XG boosting was correct classification in the Medium (2/2), High (2/2), and Very High (2/2) were correctly classified, at the Low category, 2 of 3 cases were accurately classified, with one misclassified as Medium. The confusion matrix highlights the classification accuracy of the XG Boosting model across the four categories [53]. Fig. 23b displays a confusion matrix for Young’s modulus illustrating the performance of the XGBoost classifier in four custom categories: Low, Medium, High, and Very High. The model accurately classified 2 out of 3 Low instances, with one incorrectly predicted as Medium. Both High and Very High categories were correctly classified with 2 instances each. However, both Medium instances were misclassified as High. In total, the model correctly predicted 6 out of 9 instances, indicating a reasonable classification accuracy [54]. Fig. 23c illustrates the performance of the XGBoosting model on four custom classes: Low, Medium, High, and Very High for hardness. The model demonstrated strong predictive accuracy, correctly classifying 8 out of 9 instances. It achieved perfect predictions for all cases (2 each) in the Medium, High, and Very High categories. A single misclassification occurred in the Low category, where 2 out of 3 cases were correctly identified, while 1 was misclassified as Medium. These results confirm the model’s reliable and robust predictive capability [53].
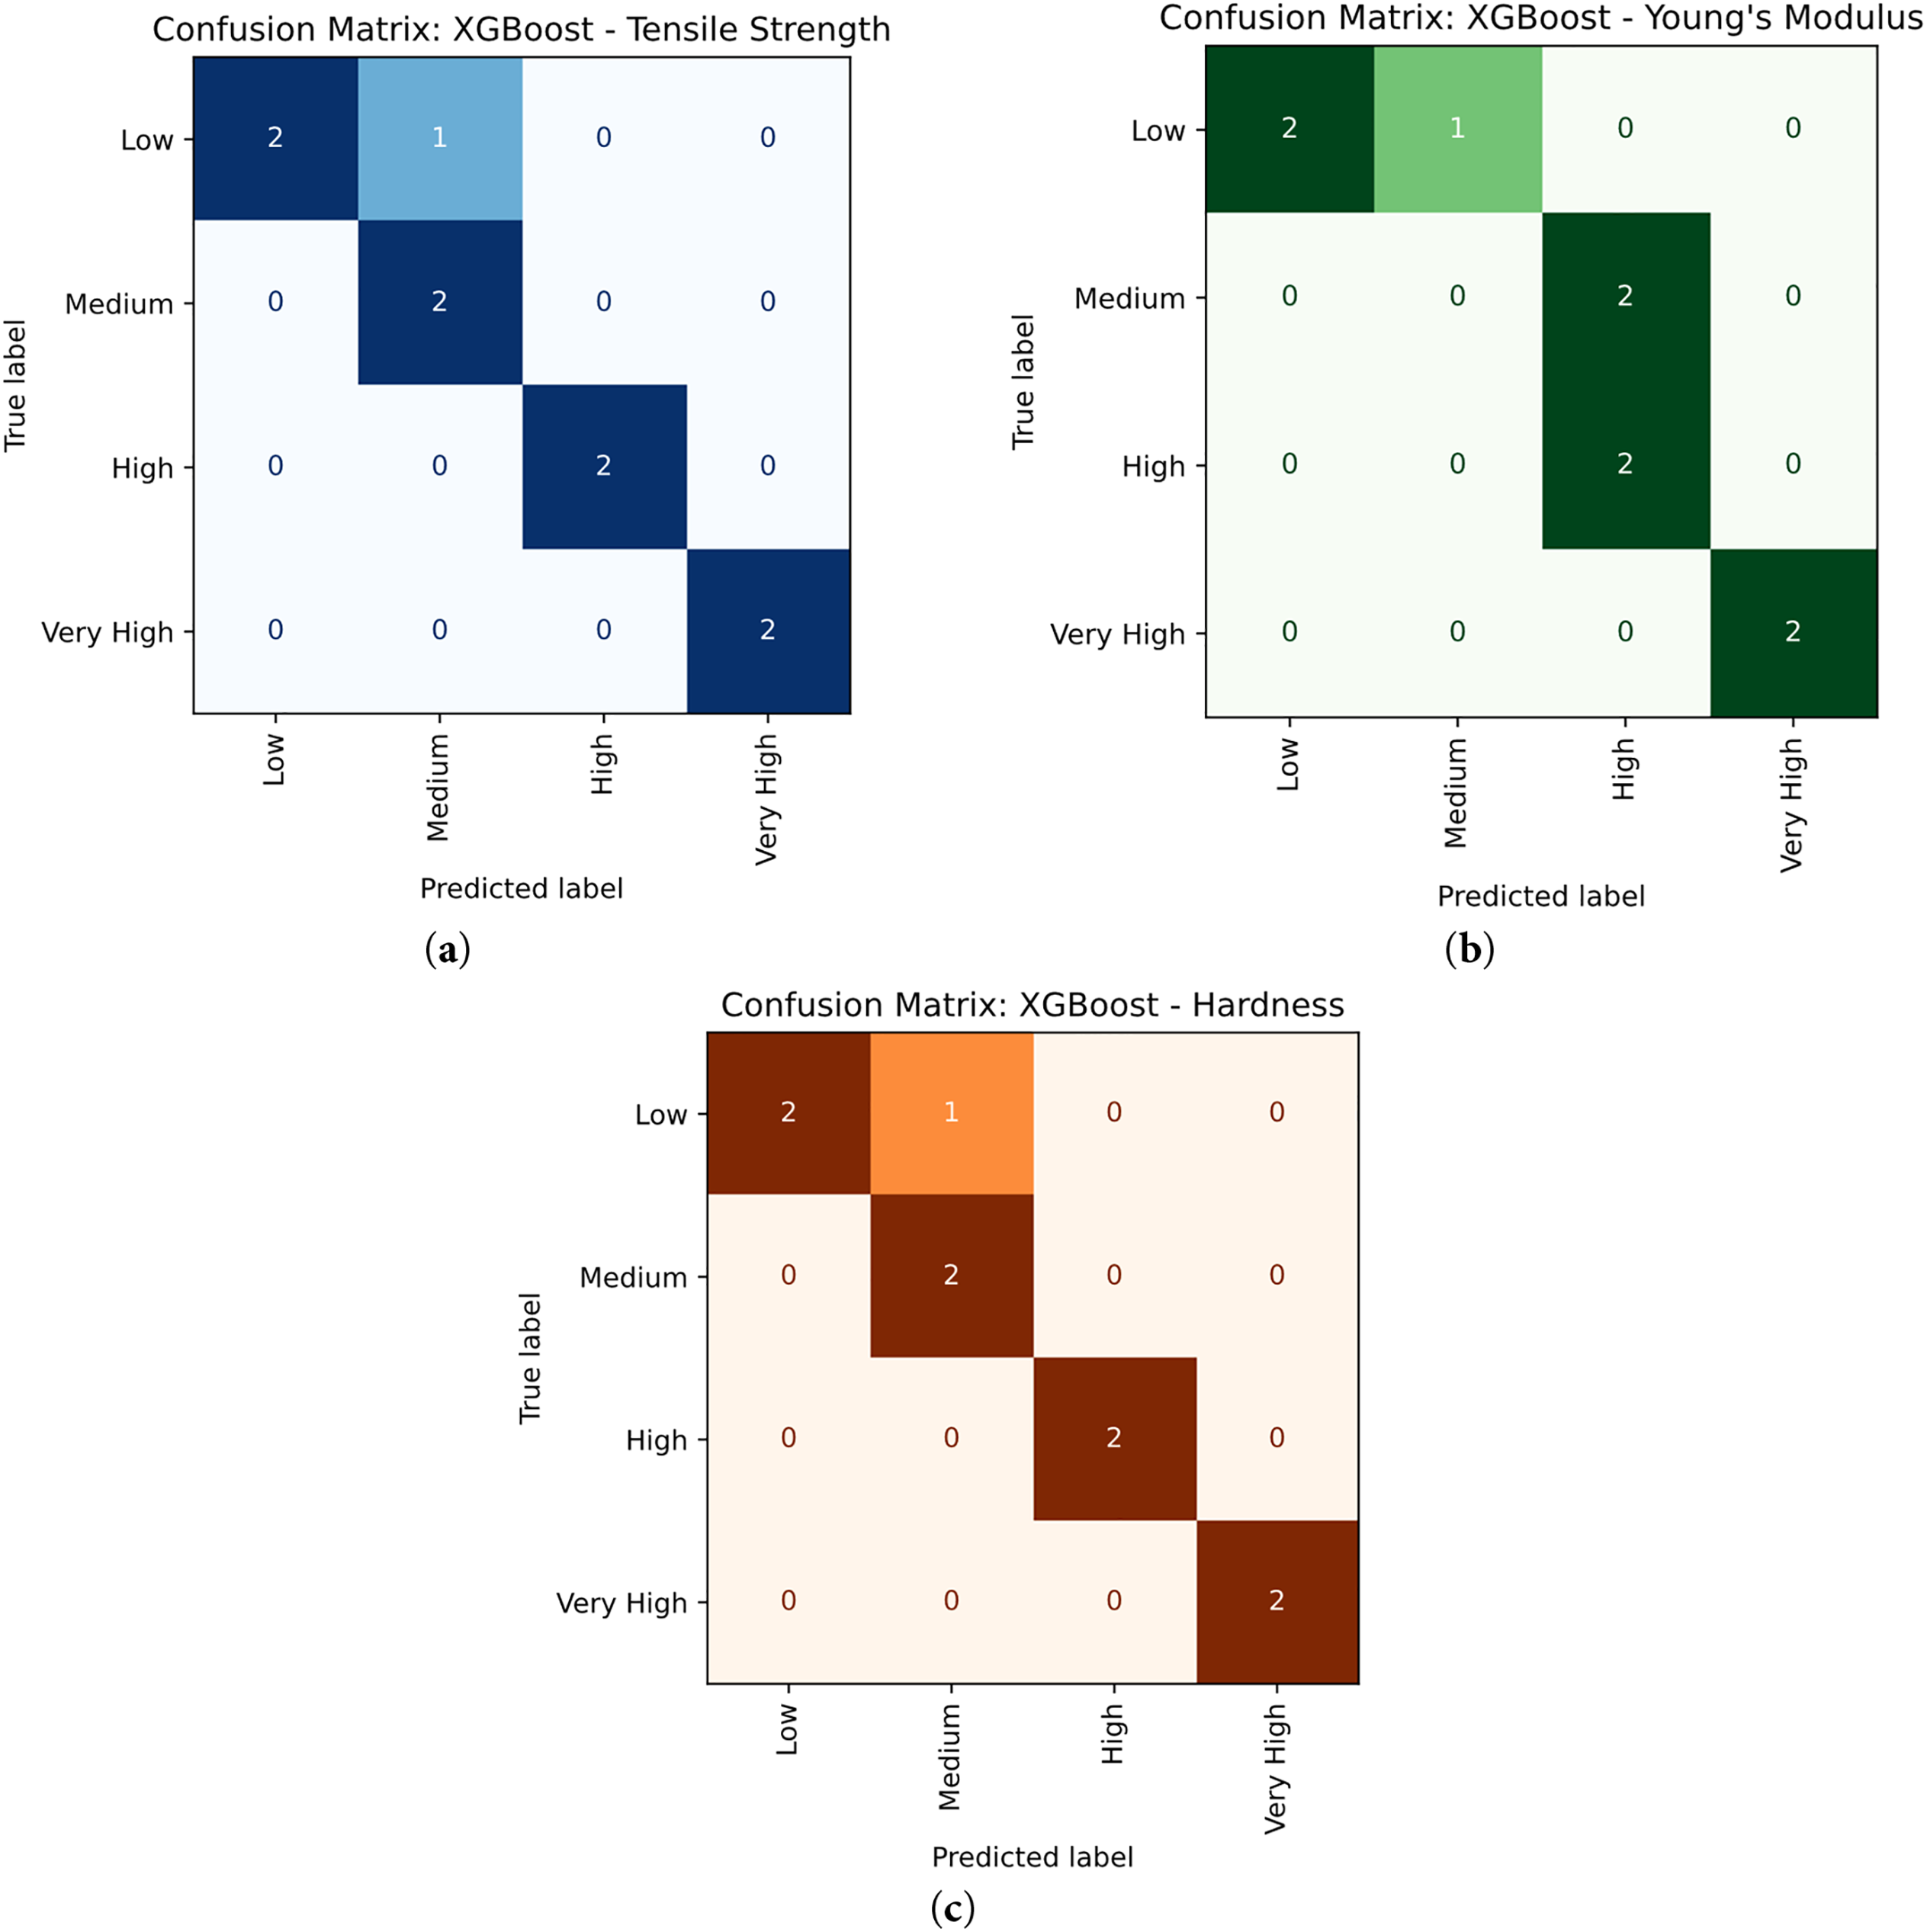
Figure 23: Actual vs. Predicted values of confusion matrices of (a) tensile strength (b) Young’s modulus (c) Hardness
3.6 Pearson Correlation Matrix
The Pearson correlation matrix shown in Fig. 24 analyzes the dataset for this study, focusing primarily on the relationships between injection molding parameters and mechanical properties. Tensile strength, Young’s modulus, and hardness exhibit a strong positive correlation (r > 0.94), indicating that an increase in one property is closely associated with increases in the others. The composite material composition shows a strong positive correlation with tensile strength (r = 0.84), hardness (r = 0.86), and Young’s modulus (r = 0.93), suggesting that increasing the composite content may reduce mechanical performance at higher temperatures. Other process parameters, such as temperature, injection speed, and injection pressure, show low correlations with the mechanical properties, indicating a relatively minor direct influence [55–57].
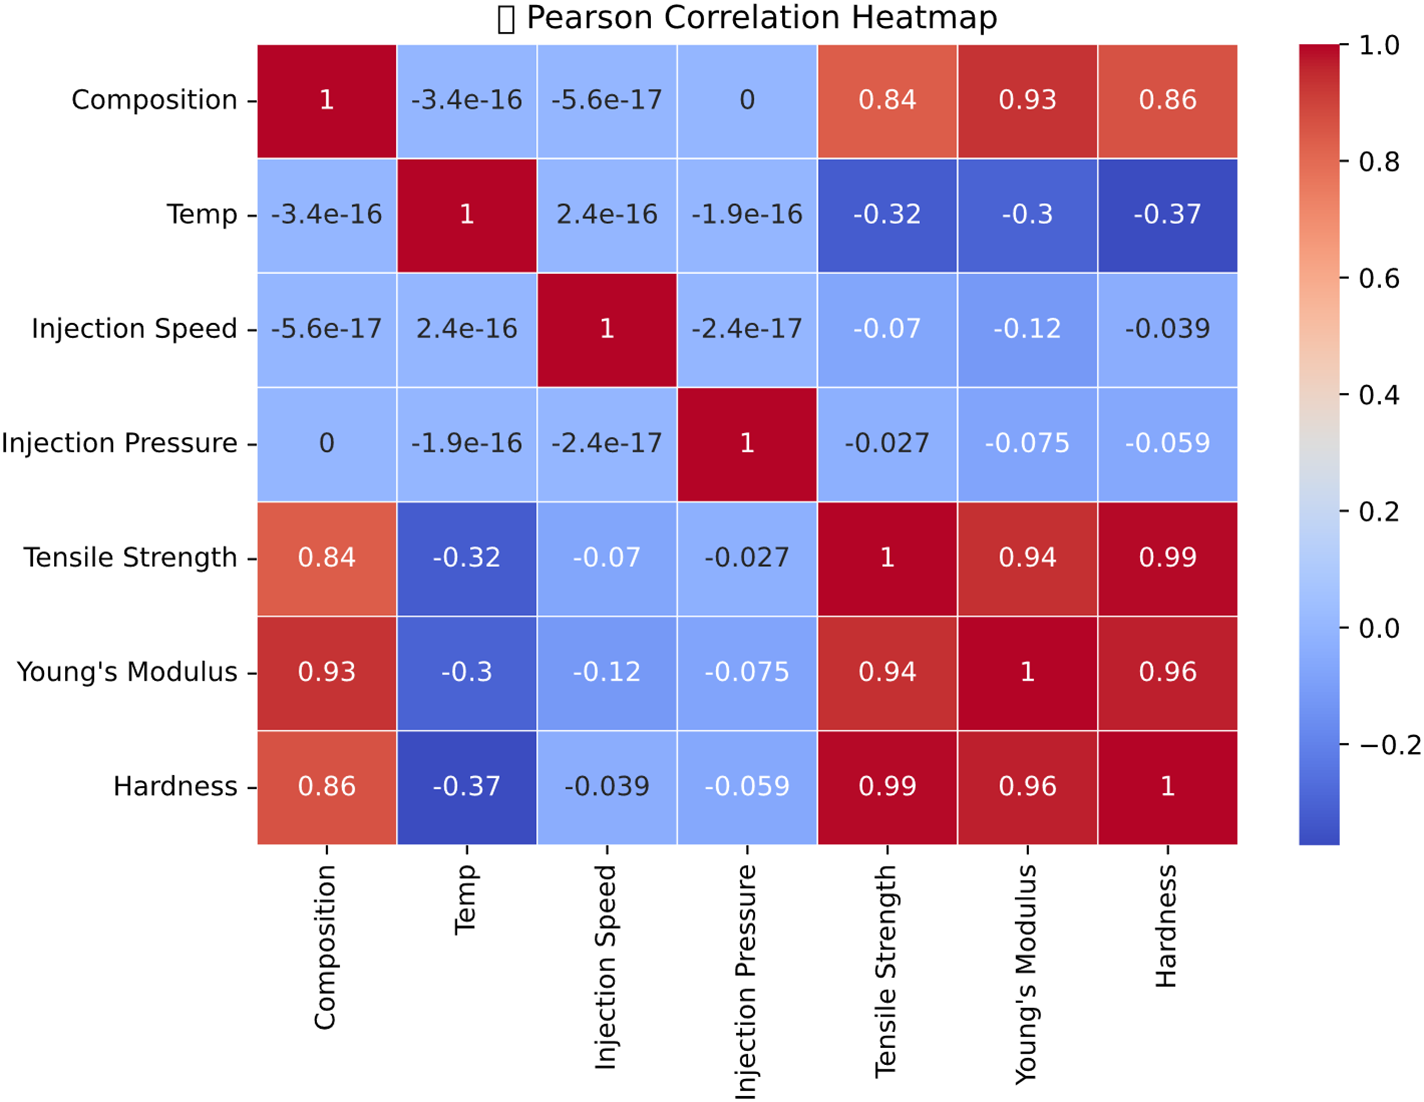
Figure 24: Personal correlation heat map
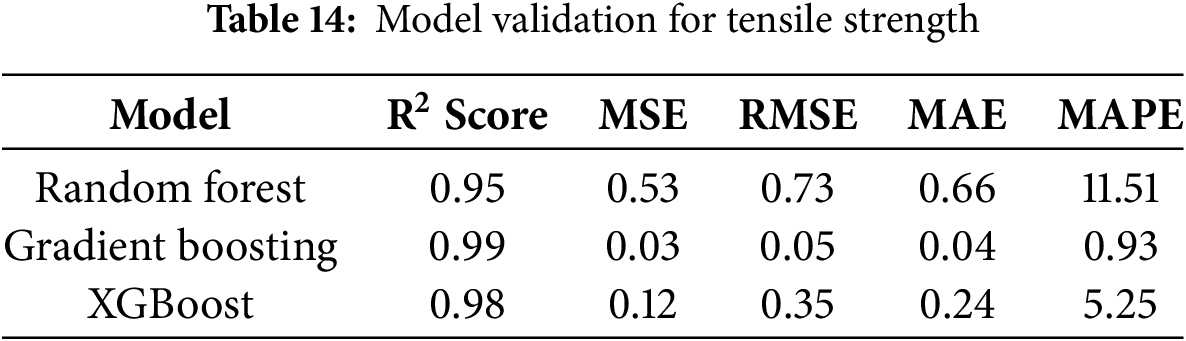
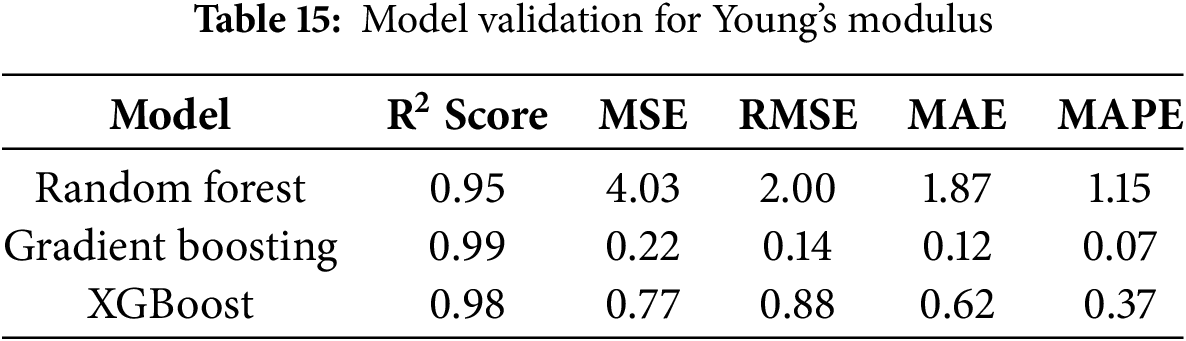
The 5-fold cross-validation results (Tables 14–16) highlight clear performance differences among the models in predicting tensile strength, Young’s modulus, and hardness. For tensile strength (Table 14), Gradient Boosting outperformed Random Forest and XGBoost, achieving the highest coefficient of determination (R2 = 0.99) along with the lowest mean squared error (MSE = 0.03), root mean squared error (RMSE = 0.05), mean absolute error (MAE = 0.04), and mean absolute percentage error (MAPE = 0.93), indicating near-perfect prediction accuracy. A similar trend was observed for Young’s modulus (Table 15), where Gradient Boosting again showed superior performance with R2 = 0.99 and substantially lower error values (MSE = 0.22, RMSE = 0.14, MAE = 0.12, MAPE = 0.07) compared to Random Forest (R2 = 0.95) and XGBoost (R2 = 0.98). For hardness prediction (Table 16), Gradient Boosting maintained its dominance with R2 = 0.99 and minimal errors (MSE = 0.01, RMSE = 0.11, MAE = 0.09, MAPE = 0.13), whereas Random Forest and XGBoost exhibited higher deviations. Overall, Gradient Boosting consistently provided the most accurate and reliable predictions across all mechanical properties, demonstrating superior robustness and generalization capability relative to Random Forest and XGBoost.

The residual plots of tensile strength, Young’s modulus, and hardness obtained from Random Forest (RF), Gradient Boosting (GB), and XGBoost (XGB) models are presented in Fig. 25a–c. Fig. 25a shows the residuals for tensile strength, where the RF model exhibits large variations, shifting between underestimation and overestimation. In contrast, the GB and XGB models produce residuals that are more tightly distributed around zero, indicating higher accuracy and precision. Fig. 25b presents the residuals for Young’s modulus, where the RF model shows greater deviations, reflecting lower predictive accuracy, while the GB and XGB models remain closer to the experimental values. Similarly, Fig. 25c illustrates the residuals for hardness, where the RF model again displays significant dispersion, whereas the GB and XGB models yield residuals with smaller deviations from zero, demonstrating better generalization. Overall, both GB and XGB outperform RF across all three properties, with GB showing slightly more consistent predictive performance.
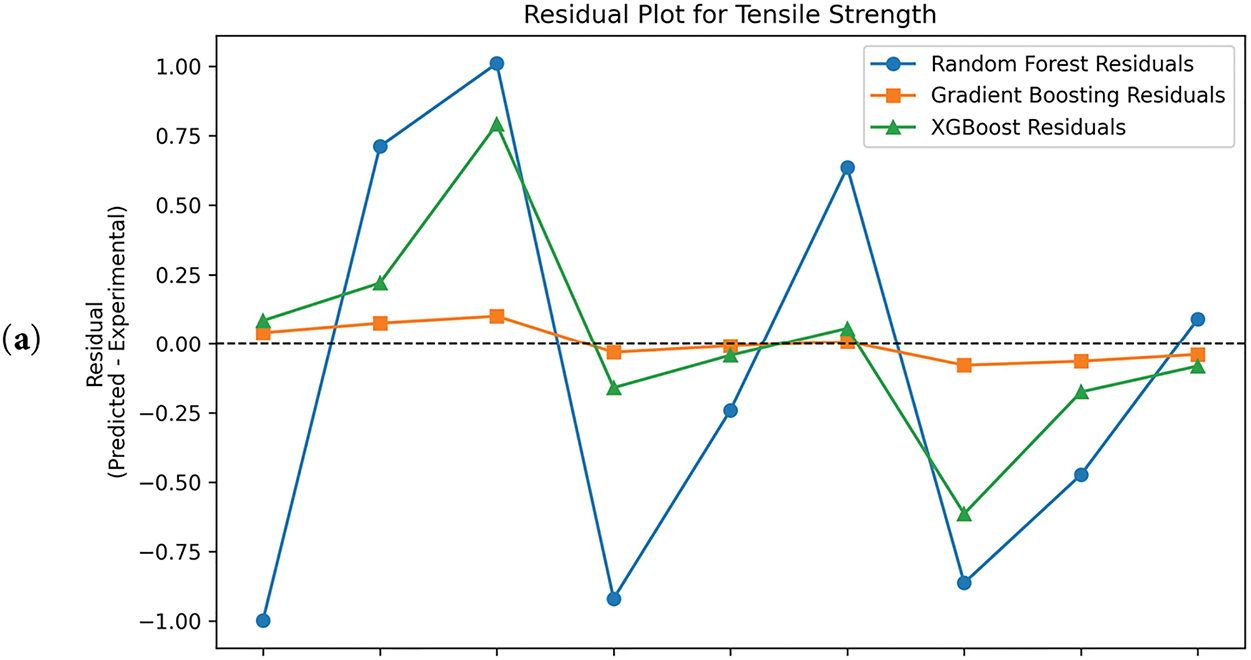

Figure 25: Residual plots for (a) Tensile strength experimental vs. predicted (b) Young’s modulus experimental vs. predicted (c) Hardness experimental vs. predicted results
This SEM investigation compares the fracture behavior of pure PU and 0.5 wt.% PU/nanodiamond nanocomposite after tensile test. For pure PU, shown in Fig. 26a, the fracture is ductile in nature, evidenced by the presence of microvoids formed during deformation [57]. In contrast, Fig. 26b illustrates the fracture surface of the 0.5 wt.% PU/ND sample, which exhibits clear river patterns. This change in fracture behavior is attributed to the addition of nanodiamonds (NDs), which enhance the stiffness and strength of the composite but reduce ductility at higher ND concentrations [58].
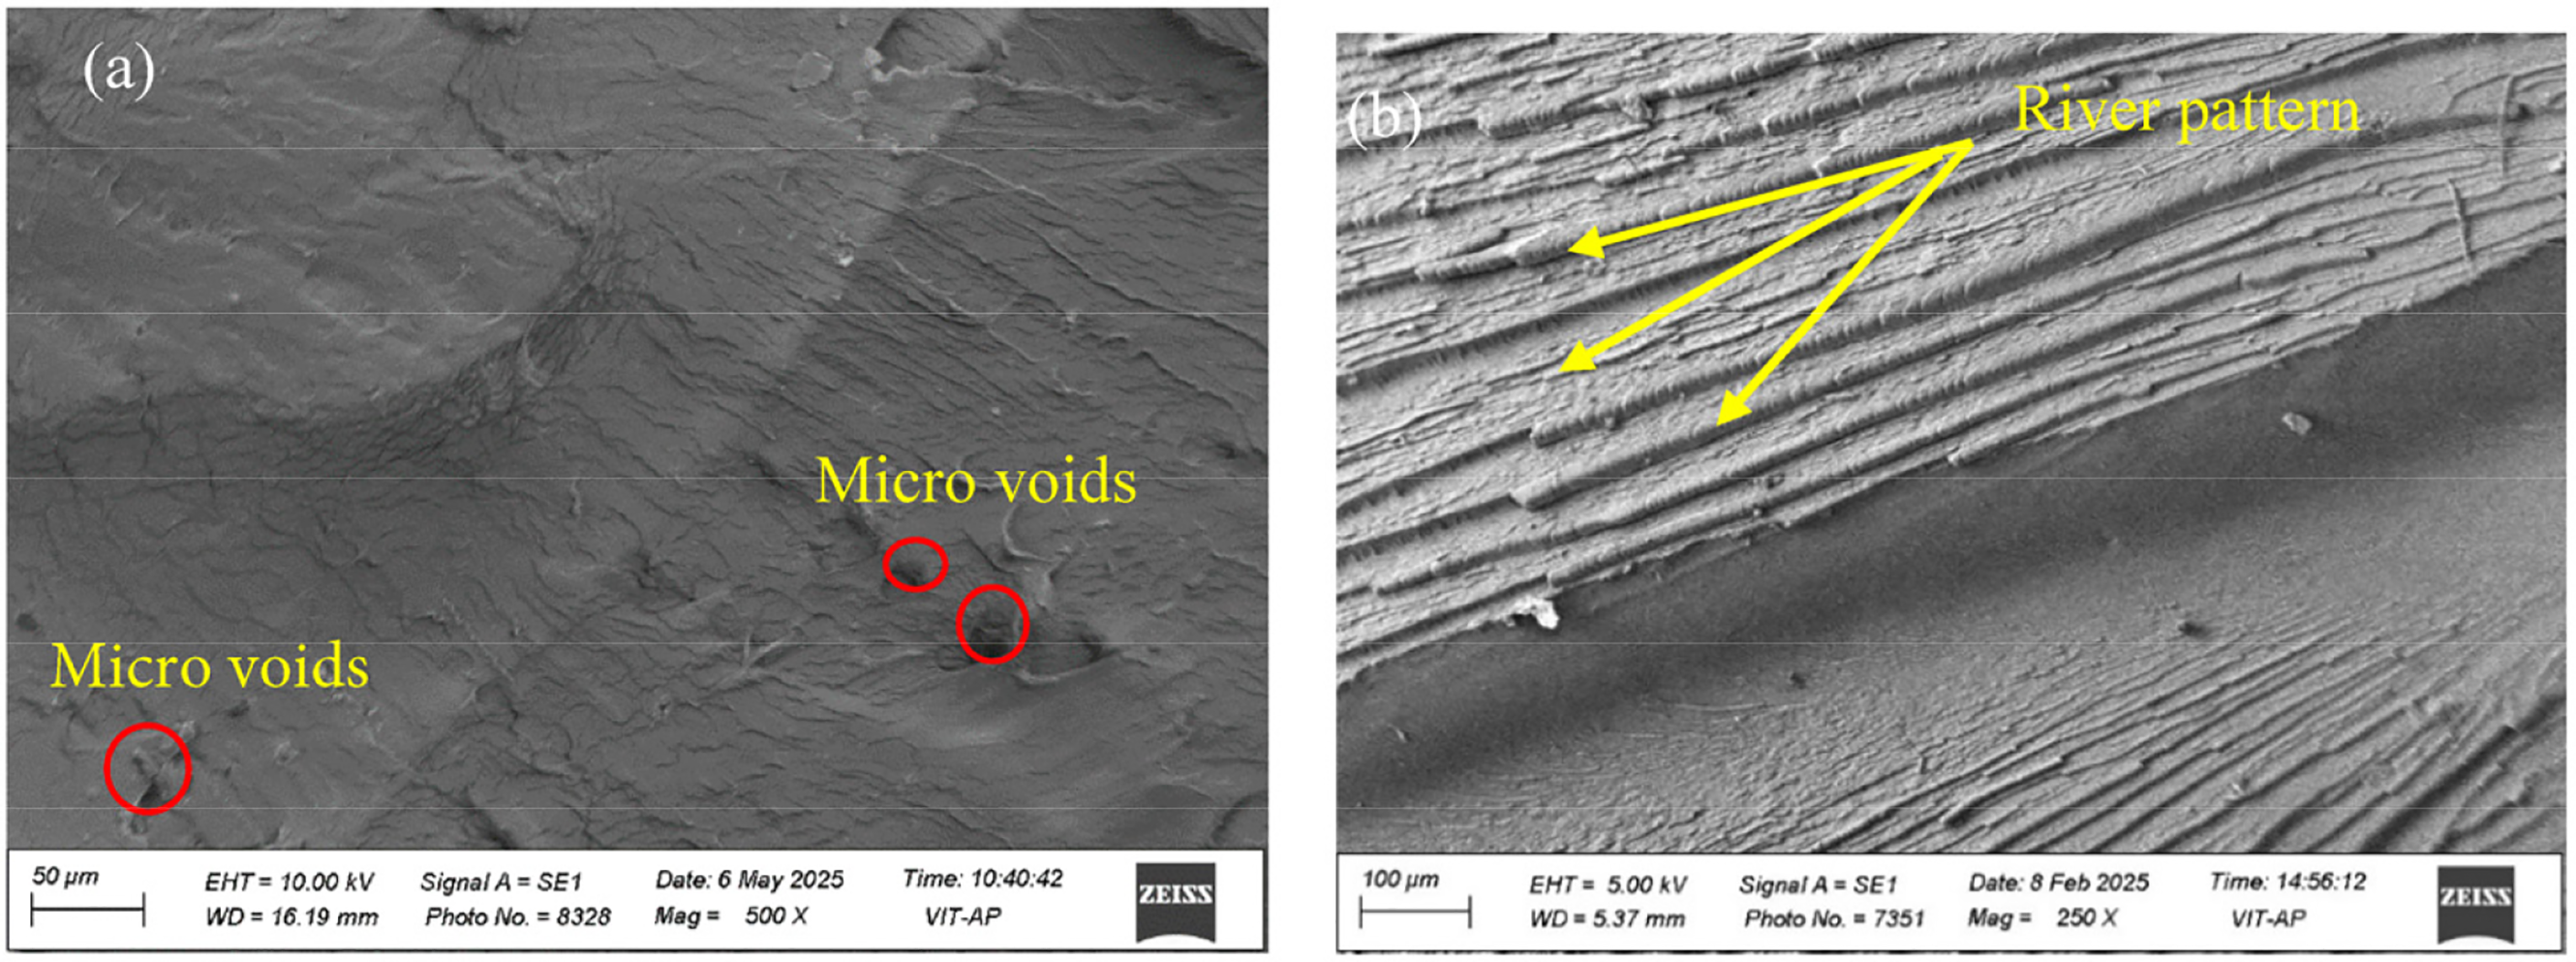
Figure 26: SEM images of (a) Pure PU (b) 0.5 wt.% of PU/ND
This study successfully demonstrates the use of a Hybrid Taguchi-Machine Learning Framework for predicting the mechanical properties of Polyurethane/Nanodiamond nanocomposites. The key findings are as follows:
• Incorporation of nanodiamonds enhances the tensile strength, Young’s modulus, and hardness of PU-ND composites.
• At 145°C (lower optimum) temperature, pure PU, 0.1 wt.% PU/ND, and 0.5 wt.% PU/ND exhibits improved tensile strength, Young’s modulus, and hardness.
• Composite material composition was identified as the most contributing factor affecting tensile strength, Young’s modulus, and hardness, followed by temperature, injection speed, and pressure.
• The deviation between experimental and ANOVA-predicted values for tensile strength, Young’s modulus, and hardness was less than 10%, indicating accurate regression models.
• Computational modeling and analytical procedures, such as Random Forest, Gradient Boosting, and XGBoost, were employed to predict tensile strength, Young’s modulus, and hardness. Among these, Gradient Boosting demonstrated higher accuracy compared to Random Forest and XGBoost regression.
• SEM analysis revealed that pure PU exhibited a ductile fracture surface, while the 0.5 wt.% ND-filled sample showed brittle fracture characteristics.
• The integration of Taguchi methods with machine learning provides a powerful and efficient approach for enhancing material design and mechanical performance.
Nevertheless, this study has a limitation in employing only the Taguchi L9 design. While the L9 array ensures experimental efficiency, it restricts the exploration of higher-order interactions and provides only a limited dataset size. Future work will therefore extend this approach to higher-level Taguchi designs, enabling a more comprehensive assessment of complex factor interactions. Moreover, investigations will include different filler loadings and hybrid filler systems to further improve the mechanical performance and expand the applicability of PU/ND nanocomposites [59–61].
Acknowledgement: The authors acknowledge and thank E Krishna Murty (Sr. Technical Assistant, VIT-AP University, Amaravati) and Loya Prasad (Technical Assistant, VIT-AP University, Amaravati) for their support during the sample preparation and testing process.
Funding Statement: This work was supported and funded by the Deanship of Scientific Research at Imam Mohammad Ibn Saud Islamic University (IMSIU) (grant number IMSIU-DDRSP2503).
Author Contributions: Conceptualization, Markapudi Bhanu Prasad, Santosh Kumar Sahu; methodology, Markapudi Bhanu Prasad, Borhen Louhichi, Santosh Kumar Sahu; software, Markapudi Bhanu Prasad, Borhen Louhichi, Santosh Kumar Sahu; investigation, Markapudi Bhanu Prasad, Borhen Louhichi, Santosh Kumar Sahu; formal analysis, Markapudi Bhanu Prasad, Borhen Louhichi, Santosh Kumar Sahu; resources, Santosh Kumar Sahu; writing—original draft preparation, Markapudi Bhanu Prasad; writing—review and editing, Borhen Louhichi, Santosh Kumar Sahu; visualization, Borhen Louhichi, Santosh Kumar Sahu; supervision, Santosh Kumar Sahu. All authors reviewed the results and approved the final version of the manuscript.
Availability of Data and Materials: All data generated or analyzed during this study are included in this published article.
Ethics Approval: Not applicable.
Conflicts of Interest: The authors declare that they have no known competing financial interests or personal relationships that could have appeared to influence the work reported in this paper.
References
1. Fu H, Xu H, Liu Y, Yang Z, Kormakov S, Wu D, et al. Overview of injection molding technology for processing polymers and their composites. ES Mater Manuf. 2020;8:3–23. [Google Scholar]
2. Czepiel M, Bańkosz M, Sobczak-Kupiec A. Advanced injection molding methods: review. Materials. 2023;16(17):5802. doi:10.3390/ma16175802. [Google Scholar] [PubMed] [CrossRef]
3. Aravand A. Composite injection overmoulding. In: Design and manufacture of structural composites. Cambridge, UK: Woodhead Publishing; 2023. p. 323–45. [Google Scholar]
4. Parida SK, Satpathy A, Dalai A, Mishra S. Introduction of polymers and polymer composites: basic fundamentals. In: Polymer composites: fundamentals and applications. Singapore: Springer Nature; 2024. p. 1–37. [Google Scholar]
5. AlMaadeed MAA, Ponnamma D, El-Samak AA. Polymers to improve the world and lifestyle: physical, mechanical, and chemical needs. Polym Sci Innovat Applicat Elsevier. 2020;7(2):1–19. doi:10.1016/b978-0-12-816808-0.00001-9. [Google Scholar] [CrossRef]
6. Vijayan VM, Mathai S, Thomas V. Polymeric biomaterials and current trends for advanced applications. In: Progress in polymer research for biomedical, energy and specialty applications. Boca Raton, FL, USA: CRC Press; 2022. p. 15–43. [Google Scholar]
7. Nuhu I, Awang N, Ali WW, Yajid MAM. Enhancement of polyurethane mechanical properties through optimization of its pristine microstructure. Mater Today Proc. 2024;110(4):158–62. doi:10.1016/j.matpr.2023.11.085. [Google Scholar] [CrossRef]
8. Sanaka R, Sahu SK. FEM based RVE modeling for estimating axial modulus of polyurethane composite reinforced with MXene. Int J Interact Des Manuf. 2024;18(5):3259–69. doi:10.1007/s12008-023-01485-4. [Google Scholar] [CrossRef]
9. Sahu SK, Sreekanth PSR, Saxena KK, Ma Q. Effect of graphene reinforcement on the tensile and flexural properties of thermoplastic polyurethane nanocomposite using experimental and simulation approach. Adv Mater Process Technol. 2024;26(4):1–17. doi:10.1080/2374068X.2024.2341986. [Google Scholar] [CrossRef]
10. Nugroho WT, Dong Y, Pramanik A. Mechanical and shape memory properties of additively manufactured polyurethane (PU)/Halloysite nanotube (HNT) nanocomposites. Nanomaterials. 2024;14(16):1373. doi:10.3390/nano14161373. [Google Scholar] [PubMed] [CrossRef]
11. Nugroho WT, Dong Y, Pramanik A, Zhang Z, Ramakrishna S. Co-influence of nanofiller content and 3D printing parameters on mechanical properties of thermoplastic polyurethane (TPU)/halloysite nanotube (HNT) nanocomposites. Nanomaterials. 2023;13(13):1975. doi:10.3390/nano13131975. [Google Scholar] [PubMed] [CrossRef]
12. Chen Q, Li X, Yang Z, Meng X, Zhao Y, Kang M, et al. The reinforcement of polyurethane by mini-sized graphene with superior performances. Chem Eng J. 2024;482:148668. doi:10.1016/j.cej.2024.148668. [Google Scholar] [CrossRef]
13. Gupta TK, Singh BP, Tripathi RK, Dhakate SR, Singh VN, Panwar OS, et al. Superior nano-mechanical properties of reduced graphene oxide reinforced polyurethane composites. RSC Adv. 2015;5(22):16921–30. doi:10.1039/c4ra14223c. [Google Scholar] [CrossRef]
14. Zhang N. Largely improved mechanical properties of polyurethane nanocomposites via in situ polymerization with low loading of graphene oxide. J Macromol Sci B. 2022;61(4–5):571–83. doi:10.1080/00222348.2022.2071043. [Google Scholar] [CrossRef]
15. Sethi J, Sarlin E, Meysami SS, Suihkonen R, Kumar ARSS, Honkanen M, et al. The effect of multi-wall carbon nanotube morphology on electrical and mechanical properties of polyurethane nanocomposites. Compos Part A Appl Sci Manuf. 2017;102:305–13. doi:10.1016/j.compositesa.2017.08.014. [Google Scholar] [CrossRef]
16. Kumar D, Jindal P. Tensile, torsional and bending behavior of multi-walled carbon nanotube reinforced polyurethane composites. Int J Plast Technol. 2019;23(2):177–87. doi:10.1007/s12588-019-09246-3. [Google Scholar] [CrossRef]
17. Dong F, Yang X, Guo L, Qian Y, Sun P, Huang Z, et al. A tough, healable, and recyclable conductive polyurethane/carbon nanotube composite. J Colloid Interface Sci. 2023;631(29):239–48. doi:10.1016/j.jcis.2022.11.045. [Google Scholar] [PubMed] [CrossRef]
18. Shokry SA, El Morsi AK, Sabaa MS, Mohamed RR, El Sorogy HE. Synthesis and characterization of polyurethane based on hydroxyl terminated polybutadiene and reinforced by carbon nanotubes. Egypt J Pet. 2015;24(2):145–54. doi:10.1016/j.ejpe.2015.05.008. [Google Scholar] [CrossRef]
19. Moghim MH, Zebarjad SM. Tensile properties and deformation mechanisms of PU/MWCNTs nanocomposites. Polym Bull. 2017;74:4267–77. doi:10.1007/s00289-017-1955-9. [Google Scholar] [CrossRef]
20. Yang Y, Li X, Jiang H, Ge M, Su X, Zou M, et al. Carbon nanotubes grafted by polyurethane chains with dopamine-mediation to enhance the mechanical and damping properties of polyurethane elastomer. Polymer. 2023;280:126041. doi:10.1016/j.polymer.2023.126041. [Google Scholar] [CrossRef]
21. Murali A, Jaisankar SN. Viscoelastic behavior of carbon nanotubes impregnated polyurethane: a detailed study of structural, mechanical, thermal and hydrophobic properties. Mater Lett. 2022;312:131722. doi:10.1016/j.matlet.2022.131722. [Google Scholar] [CrossRef]
22. Xiang D, Zhang X, Li Y, Harkin-Jones E, Zheng Y, Wang L, et al. Enhanced performance of 3D printed highly elastic strain sensors of carbon nanotube/thermoplastic polyurethane nanocomposites via non-covalent interactions. Compos Part B Eng. 2019;176:107250. doi:10.1016/j.compositesb.2019.107250. [Google Scholar] [CrossRef]
23. Kumar D, Bansal SA, Kumar N, Jindal P. Two-step synthesis of polyurethane/multi-walled carbon nanotubes polymer composite to achieve high percentage particle reinforcement for mechanical applications. J Compos Mater. 2021;55(21):2877–85. doi:10.1177/0021998321999451. [Google Scholar] [CrossRef]
24. Fan B, Li X, Xu S, Zhong Y, Zhang B, Liu X. Experimental study on the mechanical properties of nano-silicon-modified polyurethane crack repair materials. Processes. 2024;12(8):1735. doi:10.3390/pr12081735. [Google Scholar] [CrossRef]
25. Zhang J, Li Y, Sheng G. Nanodiamond-reinforced polyurethane micro/nanofiber membrane for UV protection in multifunctional textiles. ACS Appl Nano Mater. 2024;7(11):12323–33. doi:10.1021/acsanm.4c00078. [Google Scholar] [CrossRef]
26. Jing X, Duan Y, Xie F, Zhang C, Chen S. Polyurethane with nano-SiO2 based surface sizing method for 3D printed carbon fiber reinforced nylon 6 composites. Polym Compos. 2023;44(3):1546–61. doi:10.1002/pc.27187. [Google Scholar] [CrossRef]
27. Neeraja Rani G, Panthagani R, Kanaka Durga M. Influence of SWCNT on shielding and tensile properties of polyurethane nanocomposites. Mater Res Innov. 2025;29(3):129–34. doi:10.1080/14328917.2024.2389352. [Google Scholar] [CrossRef]
28. Alhanish A, Chai K, Adam NI, Dzulkurnain NA, Badri KH, Syafiq U, et al. Halloysite nanoclay reinforced biobased polyurethane nanocomposite polymer electrolyte. ACS Appl Polym Mater. 2025;7(10):5884–97. doi:10.1021/acsapm.4c04204. [Google Scholar] [CrossRef]
29. Kausar A. Shape memory effects in polyurethane nanocomposites—a holistic panorama on features and technicalities. Polym-Plast Technol Mater. 2025;64(3):279–308. doi:10.1080/25740881.2024.2400665. [Google Scholar] [CrossRef]
30. Kausar A. Nanodiamond reinforced shape memory nanocomposites—versatile features and promises. Polym-Plast Technol Mater. 2025;64(1):88–104. doi:10.1080/25740881.2024.2387217. [Google Scholar] [CrossRef]
31. Nematollahi H, Mohammadi M, Munir MT, Zare Y, Rhee KY. Bridging the gap: a novel approach for predicting the Young’s modulus of nanodiamond polymer composites. Polym Compos. 2025;46(2):1904–15. [Google Scholar]
32. Zhang Y, Rhee KY, Hui D, Park SJ. A critical review of nanodiamond-based nanocomposites: synthesis, properties and applications. Compos Part B Eng. 2018;143:19–27. [Google Scholar]
33. Jee AY, Lee M. Surface functionalization and physicochemical characterization of diamond nanoparticles. Curr Appl Phys. 2009;9(2):e144–7. doi:10.1016/j.cap.2008.12.045. [Google Scholar] [CrossRef]
34. Boggarapu V, Namathoti S, Avvari VD, Peddakondigalla VB, Shanmugam R, Ponnamma D, et al. Influence of shelf-life duration on mechanical, thermal and shape recovery motion derivatives of shape memory polyurethane. Results Eng. 2024;21:101819. doi:10.1016/j.rineng.2024.101819. [Google Scholar] [CrossRef]
35. Kumar N, Sharma A, Manoj MK, Ahn B. Taguchi optimized wear and self-lubricating properties of al-alloy composite reinforced with hybrid B4C-MoS2 particulates. J Mater Res Technol. 2024;28:4142–51. doi:10.1016/j.jmrt.2024.01.006. [Google Scholar] [CrossRef]
36. Sakuri S, Surojo E, Ariawan D. Optimization of mechanical properties of unsaturated polyester composites reinforced by microcrystalline cellulose various treatments using the taguchi method. In: Proceedings of the 6th International Conference and Exhibition on Sustainable Energy and Advanced Materials (ICE-SEAM 2019). Singapore: Springer; 2020. p. 225–31. [Google Scholar]
37. Prasad MB, Sahu SK. Taguchi and machine learning integration for tribological analysis of polyurethane/nanodiamond nanocomposites. Proc Inst Mech Eng Part J J Eng Tribol. 2025:13506501251362067. doi:10.1177/13506501251362067. [Google Scholar] [CrossRef]
38. Rashid K. Optimize the Taguchi method, the signal-to-noise ratio, and the sensitivity. Int J Stat Appl Math. 2023;6:64–70. [Google Scholar]
39. Jones GP, Stambaugh C, Stambaugh N, Huber KE. Analysis of variance. Transl Radiat Oncol. 2023;118(1):171–7. doi:10.1016/b978-0-323-88423-5.00041-8. [Google Scholar] [CrossRef]
40. Yang X, Gao W, Wang X, Zeng X. Predicting the mechanical behavior of a bioinspired nanocomposite through machine learning. Comput Model Eng Sci. 2024;140(2):1299–313. doi:10.32604/cmes.2024.049371. [Google Scholar] [CrossRef]
41. Batta V. Machine learning. Int J Adv Res Sci Commun Technol. 2024;4:583–91. [Google Scholar]
42. Noviandy TR, Maulana A, Idroes GM, Emran TB, Tallei TE, Helwani Z, et al. Ensemble machine learning approach for quantitative structure activity relationship based drug discovery: a review. Infolitika J Data Sci. 2023;1(1):32–41. doi:10.60084/ijds.v1i1.91. [Google Scholar] [CrossRef]
43. Pal R. Predictive modeling based on random forests. In: Predictive modeling of drug sensitivity; 2017. p. 149–88. doi:10.1016/b978-0-12-805274-7.00007-5. [Google Scholar] [CrossRef]
44. Knieper L, Hothorn T, Bergherr E, Griesbach C. Gradient boosting for generalised additive mixed models. Stat Comput. 2025;35(4):1–20. doi:10.1007/s11222-025-10612-y. [Google Scholar] [CrossRef]
45. Bort Escabias C. Tree boosting data competitions with XGBoost [master’s thesis]. Barcelona, Spain: Universitat Politècnica de Catalunya; 2017. [Google Scholar]
46. Norouzi A, Lay EN, Hosseinkhani A, Chapalaghi M. Functionalized nanodiamonds in polyurethane mixed matrix membranes for carbon dioxide separation. Results Mater. 2022;13(1):100243. doi:10.1016/j.rinma.2021.100243. [Google Scholar] [CrossRef]
47. Khane Y, Albukhaty S, Sulaiman GM, Fennich F, Bensalah B, Hafsi Z, et al. Fabrication, characterization and application of biocompatible nanocomposites: a review. Eur Polym J. 2024;214:113187. doi:10.1016/j.eurpolymj.2024.113187. [Google Scholar] [CrossRef]
48. Gaaz TS, Sulong AB, Kadhum AAH, Nassir MH, Al-Amiery AA. Optimizing injection molding parameters of different halloysite type-reinforced thermoplastic polyurethane nanocomposites via Taguchi complemented with ANOVA. Materials. 2016;9(11):947. doi:10.3390/ma9110947. [Google Scholar] [PubMed] [CrossRef]
49. Tunggal D. Multiobjective optimization of injection moulding process parameters on mechanical properties using Taguchi method and grey relational analysis. Int J Eng Technol. 2018;7(3.7):14–6. doi:10.14419/ijet.v7i3.7.16196. [Google Scholar] [CrossRef]
50. Haghighi S, Jasemi M, Hessabi S, Zolanvari A. PyCM: multiclass confusion matrix library in Python. J Open Source Softw. 2018;3(25):729. doi:10.21105/joss.00729. [Google Scholar] [CrossRef]
51. Durso AM. Confusion matrices for test datasets 2 and 3. figshare. 2020. doi:10.6084/m9.figshare.12635846. [Google Scholar] [CrossRef]
52. Atsauri C, Chow J-H, Dom B, Lin D-I. Confusion matrix for classification systems. U.S. Patent 8,611,675 B2. 2006. [Google Scholar]
53. Pristyanto Y, Mukarabiman Z, Nugraha AF. Extreme gradient boosting algorithm to improve machine learning model performance on multiclass imbalanced dataset. JOIV Int J Inform Vis. 2023;7(3):710–5. doi:10.30630/joiv.7.3.1102. [Google Scholar] [CrossRef]
54. Diaz-Escobar J, Díaz-Montiel P, Venkataraman S, Díaz-Ramírez A. Classification and characterization of damage in composite laminates using electrical resistance tomography and supervised machine learning. Struct Control Health Monit. 2023;2023(1):1–19. doi:10.1155/2023/1675867. [Google Scholar] [CrossRef]
55. Saleh MA, Taha I, Ebeid SJ. Correlation of injection moulding parameters with mechanical and morphological aspects of natural fibre reinforced thermoplastics. Mater Werkst. 2018;49(2):193–205. doi:10.1002/mawe.201700200. [Google Scholar] [CrossRef]
56. Li L. Mechanics of materials at high temperature. Amsterdam, The Netherlands: Elsevier BV; 2024. p. 221–49. doi:10.1016/b978-0-323-90646-3.00008-3. [Google Scholar] [CrossRef]
57. Pradhan S, Sahu SK, Pramanik J, Badgayan ND. An insight into mechanical & thermal properties of shape memory polymer reinforced with nanofillers; a critical review. Mater Today Proc. 2022;50:1107–12. [Google Scholar]
58. Arun Kumar M, Selvaraj SK, Kanniyappan S, Karthikeyan B, Chadha U. Effects of adding nanodiamonds in mechanical properties of jute and ramie fiber reinforced epoxy composites. Polym Compos. 2024;45(13):11872–82. [Google Scholar]
59. Nayak A, Sreekanth PSR, Sahu SK, Sahu D. Structural tuning of low band gap intermolecular push/pull side-chain polymers for organic photovoltaic applications. Chin J Polym Sci. 2017;35(9):1073–85. doi:10.1007/s10118-017-1967-9. [Google Scholar] [CrossRef]
60. Sahu SK, Sreekanth PSR. Evaluation of tensile properties of spherical shaped SiC inclusions inside recycled HDPE matrix using FEM based representative volume element approach. Heliyon. 2023;9(3):e14034. doi:10.1016/j.heliyon.2023.e14034. [Google Scholar] [PubMed] [CrossRef]
61. Badgayan ND, Sahu SK, Samanta S, Sreekanth PSR. Assessment of bulk mechanical properties of HDPE hybrid composite filled with 1D/2D nanofiller system. Mater Sci Forum. 2018;917:12–6. doi:10.4028/www.scientific.net/msf.917.12. [Google Scholar] [CrossRef]
Cite This Article
 Copyright © 2025 The Author(s). Published by Tech Science Press.
This work is licensed under a Creative Commons Attribution 4.0 International License , which permits unrestricted use, distribution, and reproduction in any medium, provided the original work is properly cited.
 Downloads
 Citation Tools