
 Submit a Paper
 Propose a Special lssue
 Open Access
ARTICLE

Harnessing TLBO-Enhanced Cheetah Optimizer for Optimal Feature Selection in Cancer Data
1 Symbiosis Institute of Technology, Hyderabad Campus, Symbiosis International University, Pune, 509217, India
2 Department of Computer Science & Engineering, Siksha ‘O’ Anusandhan (Deemed to be University), Bhubaneswar, 751030, India
3 Center for Data Science, Siksha ‘O’ Anusandhan (Deemed to be University), Bhubaneswar, 751030, India
4 Department of Information Assurance and Cybersecurity, Capella University, Minneapolis, MN 55402, USA
5 College of Computer Science, King Khalid University, Abha, 61421, Saudi Arabia
6 Electrical Engineering Department, Computer Engineering Section, College of Engineering, King Khalid University, Abha, 61421, Saudi Arabia
7 Department of Environmental Health, Harvard T H Chan School of Public Health, Boston, MA 02115, USA
8 Department of Pharmacology & Toxicology, College of Pharmacy, University of Arizona, Tucson, AZ 85721, USA
* Corresponding Authors: Naim Ahmad. Email: ; Saurav Mallik. Email:
,
Computer Modeling in Engineering & Sciences 2025, 145(1), 1029-1054. https://doi.org/10.32604/cmes.2025.069618
Received 27 June 2025; Accepted 11 September 2025; Issue published 30 October 2025
 View Full Text
 Download PDF
Abstract
Metaheuristic optimization methods are iterative search processes that aim to efficiently solve complex optimization problems. These basically find the solution space very efficiently, often without utilizing the gradient information, and are inspired by the bio-inspired and socially motivated heuristics. Metaheuristic optimization algorithms are increasingly applied to complex feature selection problems in high-dimensional medical datasets. Among these, Teaching-Learning-Based optimization (TLBO) has proven effective for continuous design tasks by balancing exploration and exploitation phases. However, its binary version (BTLBO) suffers from limited exploitation ability, often converging prematurely or getting trapped in local optima, particularly when applied to discrete feature selection tasks. Previous studies reported that BTLBO yields lower classification accuracy and higher feature subset variance compared to other hybrid methods in benchmark tests, motivating the development of hybrid approaches. This study proposes a novel hybrid algorithm, BTLBO-Cheetah Optimizer (BTLBO-CO), which integrates the global exploration strength of BTLBO with the local exploitation efficiency of the Cheetah Optimization (CO) algorithm. The objective is to enhance the feature selection process for cancer classification tasks involving high-dimensional data. The proposed BTLBO-CO algorithm was evaluated on six benchmark cancer datasets: 11 tumors (T), Lung Cancer (LUC), Leukemia (LEU), Small Round Blue Cell Tumor or SRBCT (SR), Diffuse Large B-cell Lymphoma or DLBCL (DL), and Prostate Tumor (PT). The results demonstrate superior classification accuracy across all six datasets, achieving 93.71%, 96.12%, 98.13%, 97.11%, 98.44%, and 98.84%, respectively. These results validate the effectiveness of the hybrid approach in addressing diverse feature selection challenges using a Support Vector Machine (SVM) classifier.Keywords
Data mining is the fastest-expanding domain of information technology, owing to the vast amounts of data gathered every day and the need to translate this data into meaningful information [1]. The pre-processing steps for data mining include knowledge presentation, pattern assessment, and other pre-processing steps (integration, filtering, transformation, reduction, etc.). The selection of features is one of the primary pre-processing stages that seeks to remove irrelevant and redundant features from a particular dataset [2]. In general, there are two categories into which feature selection (FS) algorithms may be divided: filters and wrapper methods [3]. The filter class contains techniques that operate directly on the dataset without using classifiers [4]. Classifiers are used in wrapper feature selection techniques to look for variable interactions [5]. Wrapper-based approaches are superior to filter-based approaches for the classification algorithm [6]. In the wrapper-based method, three essential components are often required to be specified: classifiers such as Support Vector Machines (SVM), K nearest neighbor (KNN), etc., feature subset assessment criteria, and the search algorithm to find a subset containing the best features. Finding the optimal collection of features is difficult and costly. Recently, it seems that metaheuristics are trustworthy and efficient techniques to address various optimization issues, such as feature selection [7]. Metaheuristics perform better than precise search mechanisms because they do not need to explore the entire search space, as opposed to exact search methods. In reality, they are not an exhaustive search algorithm. Exploration of the search space and the exploration of finding optimum solutions are two opposing aspects to consider when using or modeling a metaheuristic (MA). Performing a good balance of exploration and exploitation (E&E) will increase the performance of the search algorithm [8]. To achieve a healthy balance, one alternative is to use a hybrid technique in which two or more algorithms are integrated to increase the performance of each algorithm; this hybrid approach is known as a memetic method.
This work presents a binary variant of the hybrid TLBO-CO and uses CO as a wrapper feature selection technique. The growing complexity and high dimensionality of medical datasets necessitate effective feature selection methods to enhance classification performance while reducing computational costs. Traditional feature selection approaches, particularly wrapper-based methods, provide superior results but are often computationally intensive due to their exhaustive nature. To address this, metaheuristic algorithms have emerged as powerful alternatives for identifying optimal feature subsets efficiently. However, achieving a balance between exploration and exploitation remains a critical challenge in metaheuristic design. The motivation behind this study is to enhance the capability of existing approaches by developing a robust and efficient hybrid approach. The objective is to propose a Binary variant of the Teaching-Learning-Based Optimization-Cheetah Optimization (BTLBO-CO) that leverages the global search strength of TLBO and the local refinement capability of the CO within a wrapper-based framework for optimal feature selection in high-dimensional cancer datasets.
The rest of the sections of the paper are organized as follows. Modern techniques are introduced in Section 2. Section 3 introduces the materials and methods. Section 4 provides a detailed explanation of the suggested model and result analysis. Conclusion and future scope of the study are detailed in Section 5.
When trying to find the optimal value in a high-dimensional space, the single metaheuristic method always has disadvantages, including low accuracy, poor generalization performance, and poor local optima avoidance ability. Using the differences between the two optimization approaches, the hybrid method combines their advantages and balances their shortcomings to improve general performance in addressing challenging optimization tasks. Pashaei and Pashaei [9] presented an ML model to choose biomarkers. For the selection of stable informative genes, the Binary COOT algorithm is combined with simulated annealing (SA) to improve the local exploitation capacities of the algorithm. Furthermore, used as a pre-filtering technique to minimize duplicated genes, known as minimum redundancy maximum relevance (mRMR). A wrapper-based FS method is built using an enhanced hybrid metaheuristic methodology derived from Grey Wolf Optimization (GWO) and Whale Optimization Algorithm (WOA). The main goal of the proposed approach is to reduce the shortcomings of both approaches, including early convergence and stagnation of local optima. Enhanced mechanisms for both algorithms [10] help them hybridize. In this study, a two-stage model called Mine Blast Algorithm (MBA)-Simulated Annealing (SA) is suggested to improve the feature selection process. Here, SA is a local search to improve the solutions discovered by MBA [11] in the exploitation phase. Based on the Mayfly Algorithm and the Harmony Search metaheuristics put forth by [12], Mayfly Harmony Search (MA-HS) is a new feature selection tool. By better use of the search space, combining harmony search with the Mayfly Algorithm increases the performance of the Mayfly Harmony Search (MA-HS) method. This work offers a novel wrapper-based feature selection method intended to address feature selection problems based on biogeography-based optimization (BBO) hybridization and the sine-cosine algorithm (SCA). The BBO algorithm integrates the location update mechanism of the SCA algorithm to enhance habitat variety [13]. In this work, a hybrid Sine Cosine Ant Lion Optimizer (SCALO) is developed that combines the Sine Cosine Algorithm (SCA) with the Ant Lion Optimizer (ALO). The proposed method is carried out on the basis of transfer functions. In this work, a hybrid Sine Cosine Ant Lion Optimizer (SCALO) is presented and assigned to its binary counterparts using the concept of transfer functions [14]. In [15], a hybrid algorithm with integration of Sine Cosine and Cuckoo Search Algorithm was proposed to handle the high-dimensional cancer datasets. Similarly, SCHO-GO [16] is a novel hybrid model with a combination of a genetic operator with Sinh Cosh Optimizer to prevent the limitation of falling into local optima. The performance of the proposed model is tested with eight gene expression microarray datasets. To balance the gap between exploration and exploitation, a hybrid model, based on Grey Wolf Optimizer(GWO) and Harris Hawks Optimizer (HHO), is proposed to handle cancer datasets [17]. For an accurate prediction of diabetes cases, the authors in [18] presented a unique machine learning model with the integration of the Al-Biruni earth radius and the dipper-throated optimization. To enhance the effectiveness of performance, the authors presented a PSO-based multi-objective feature selection method to deal with a high-dimensional dataset [19]. To deal with the curse of dimensionality issue, the authors presented a multiobjective cuckoo search feature selection model. In this approach, an S-shaped transfer function is used to convert from continuous to binary search space [20]. In [21], the authors proposed a problem-specific non-dominated sorting GA algorithm to select the best optimal feature subset. A mutation-retry operator and a combination operator were adopted in this study to enhance the efficiency of the model. In [22], a novel hybrid model named iBABC-CGO is proposed with a combination of the island model of the artificial bee colony algorithm and the chaos game optimization algorithm with an SVM classifier to enhance the classification accuracy.
Many of the widely used optimization techniques in machine learning applications involve several tuning values that have to be optimized for the best efficiency. One challenging aspect of the feature selection process is the tuning of these parameter values. TLBO is a simple metaheuristic algorithm that needs two parameters, such as population size and termination criteria. TLBO is implemented in various areas such as FS, text classification, machine design, robotics, etc. Using a fuzzy adaptive mutant PSO coupled with the TLBO algorithm, Shahbeig et al. [23] identified a subset of related genes from the breast cancer microarray data set and evaluated performance using SVM classification. A novel hybrid TLBO method that solves classification problems with University of California, Irvine (UCI) data using extreme learning machines (ELM) [24]. To avoid early convergence of TLBO and also improve the performance of the proposed model, Rezaei & Fard proposed a hybrid model combining a marine predator algorithm with a teaching-learning-based optimization algorithm [25]. To improve the classification performance of bioinformatics data [26], a two-stage hybrid TLBO method (TS-TLBO) is proposed. In this study, the concept of opposition-based learning is used to improve the quality of solutions. Pan et al. [27] proposed a modified version of TLBO using the hierarchical learning scheme. In this study, 25 different UCI datasets are used to evaluate the performance of the proposed model. A hybrid TLBO with the Salp swarm algorithm (SSA) is combined to select the optimal features of the digital mammography data set. In this model, an artificial neural network (ANN) is implemented as a fitness evaluator [28]. To avoid limitations such as the slow convergence speed of the salp swarm algorithm(SSA), a hybrid model with a combination of TLBO and SSA was designed, and the efficacy of the model was tested with various benchmark datasets. In [29], the authors presented a survey about the application of various machine learning models for the accurate detection of Alzheimer’s disease. Similarly, in [30], the authors presented a deep study about how explainable AI (XAI) plays an important role in easy and accurate prediction of neurodegenerative disorders. A lung cancer predictive model is proposed by integrating the K-means algorithm with different metaheuristic algorithms [31]. Similarly, Das et al. in [32] developed a deep learning enriched marine predictor algorithm for leukemia cancer prediction using cancer image datasets. To solve complex engineering problems, a novel model is presented by hybridizing the artificial rabbit algorithm with a chaotic local search model [33]. Similarly, a novel TLBO-Elephant Herding Optimization (EHO) hybrid model is proposed by [34] to identify the malignant features from breast cancer datasets. Authors in [35] proposed a Probabilistic Bi-Level TLBO model to select the significant features from cancer image datasets. In [36], a deep learning model with various pretrained models is implemented for the accurate selection of biomarkers from a cancer dataset. A hybrid model called TLBO + MPA ([37]) and TLBO + Jaya ([38]) was proposed to deal with various complex problems and NSL-KDD datasets. The importance of TLBO encouraged the development of a new hybrid model to deal with microarray cancer datasets.
There has been a remarkable improvement in feature selection algorithms; however, as stated by the No Free Lunch (NFL) theorem in optimization, no single algorithm can address every problem optimally. Even with the progress of wrapper-based methods, there is still room for innovation. The next section will explore a new hybrid wrapper-based feature selection technique.
All microarray data sets used in this study consist solely of continuous gene expression features; therefore, categorical variable encoding was not applicable. The preprocessing steps included handling missing values and normalizing the expression levels to ensure comparability across samples. The current research proposed a feature selection technique integrated with the TLBO and CO feature selection algorithms. Prior to these algorithms, the proposed work also employs three filter-based approaches, including mRMR, ReliefF, and IG, to select the relevant features from the original feature set. To present the most relevant features, the proposed model concatenates the generated features of each filter-based approach with the objective of removing redundant features and maximizing the feature space. Then, TLBO is applied to select the optimal feature set. To initialize the initial population of TLBO-CO, the following is used. For the final classification process, the support vector machine (SVM) is used as the classifier.
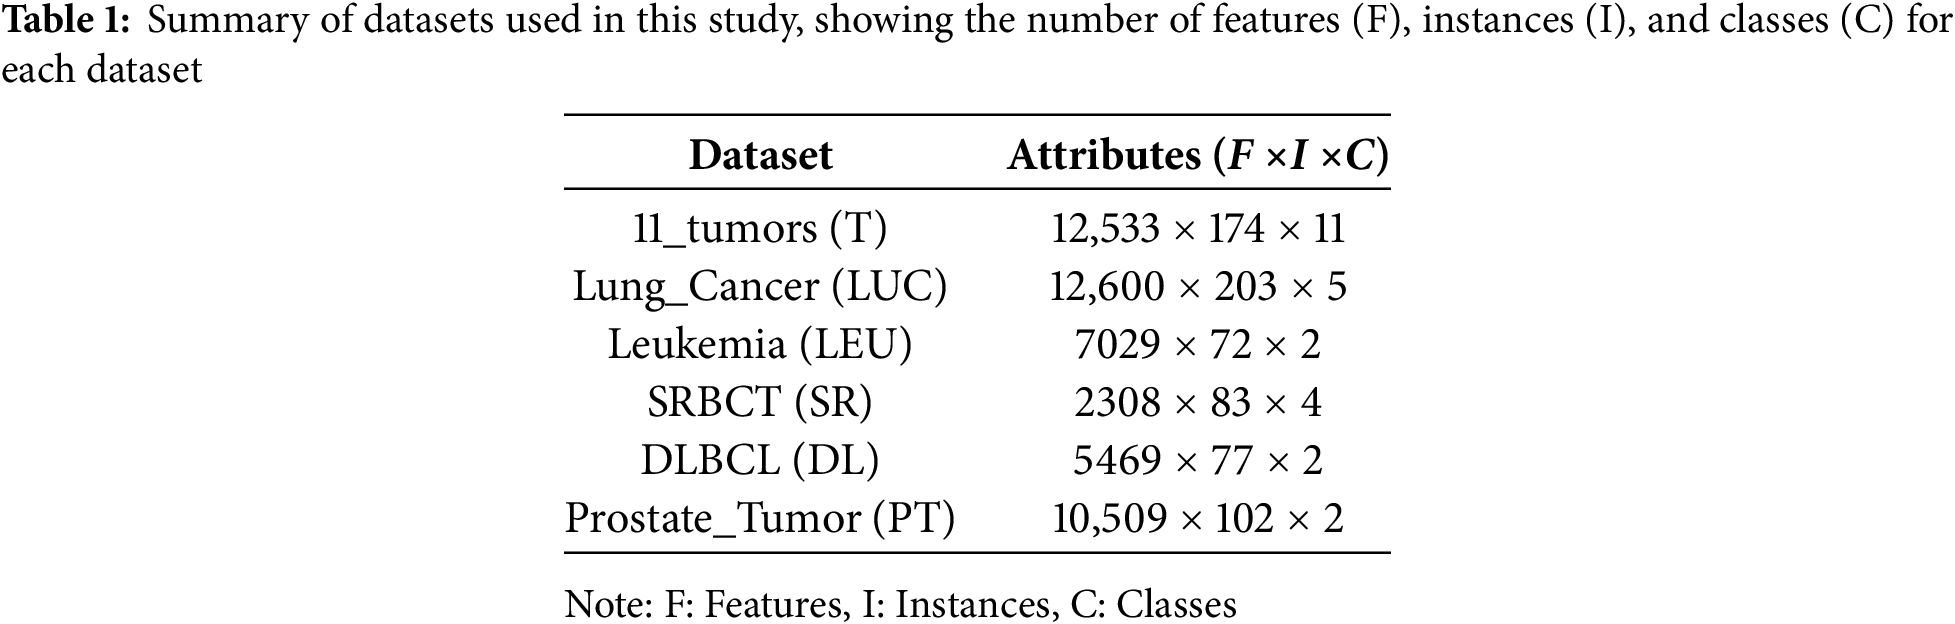
In this investigation, the efficacy of the proposed cancer FS model is evaluated against six different microarray cancer datasets. Table 1 shows the specific datasets used in the experimental study, specifying the number of features (F), Instances (I), and classes (C). The table summarizes six gene expression datasets that are frequently used in bioinformatics and medical research, particularly for cancer classification tasks. Each dataset is characterized by its number of features (F), samples (I), and classes (C). The 11_tumors (T) dataset contains 12,533 features, 174 samples, and eleven classes, while Lung_Cancer (LUC) has 12,600 features, 203 samples, and five classes. Leukemia (LEU) consists of 7029 features, 72 samples, and two classes, and SRBCT (SR) includes 2308 features, 83 samples, and four classes. Furthermore, DLBCL (DL) features 5469 features, 77 samples, and two classes, and Prostate_Tumor (PT) has 10,509 features, 102 samples, and two classes. These datasets vary in dimensionality and class diversity, providing a robust benchmark for evaluating machine learning models in high-dimensional biomedical data analysis. As shown in Table 1, we have several features describing each dataset. We also added a pre-processing step to filter the data to make it more consistent and help the model be more robust. The additional step involved imputation or removal of missing values, normalization of the data (min-max scaling), and encoding of the categorical variables, all performed to increase the quality of the selected features and the classifier.
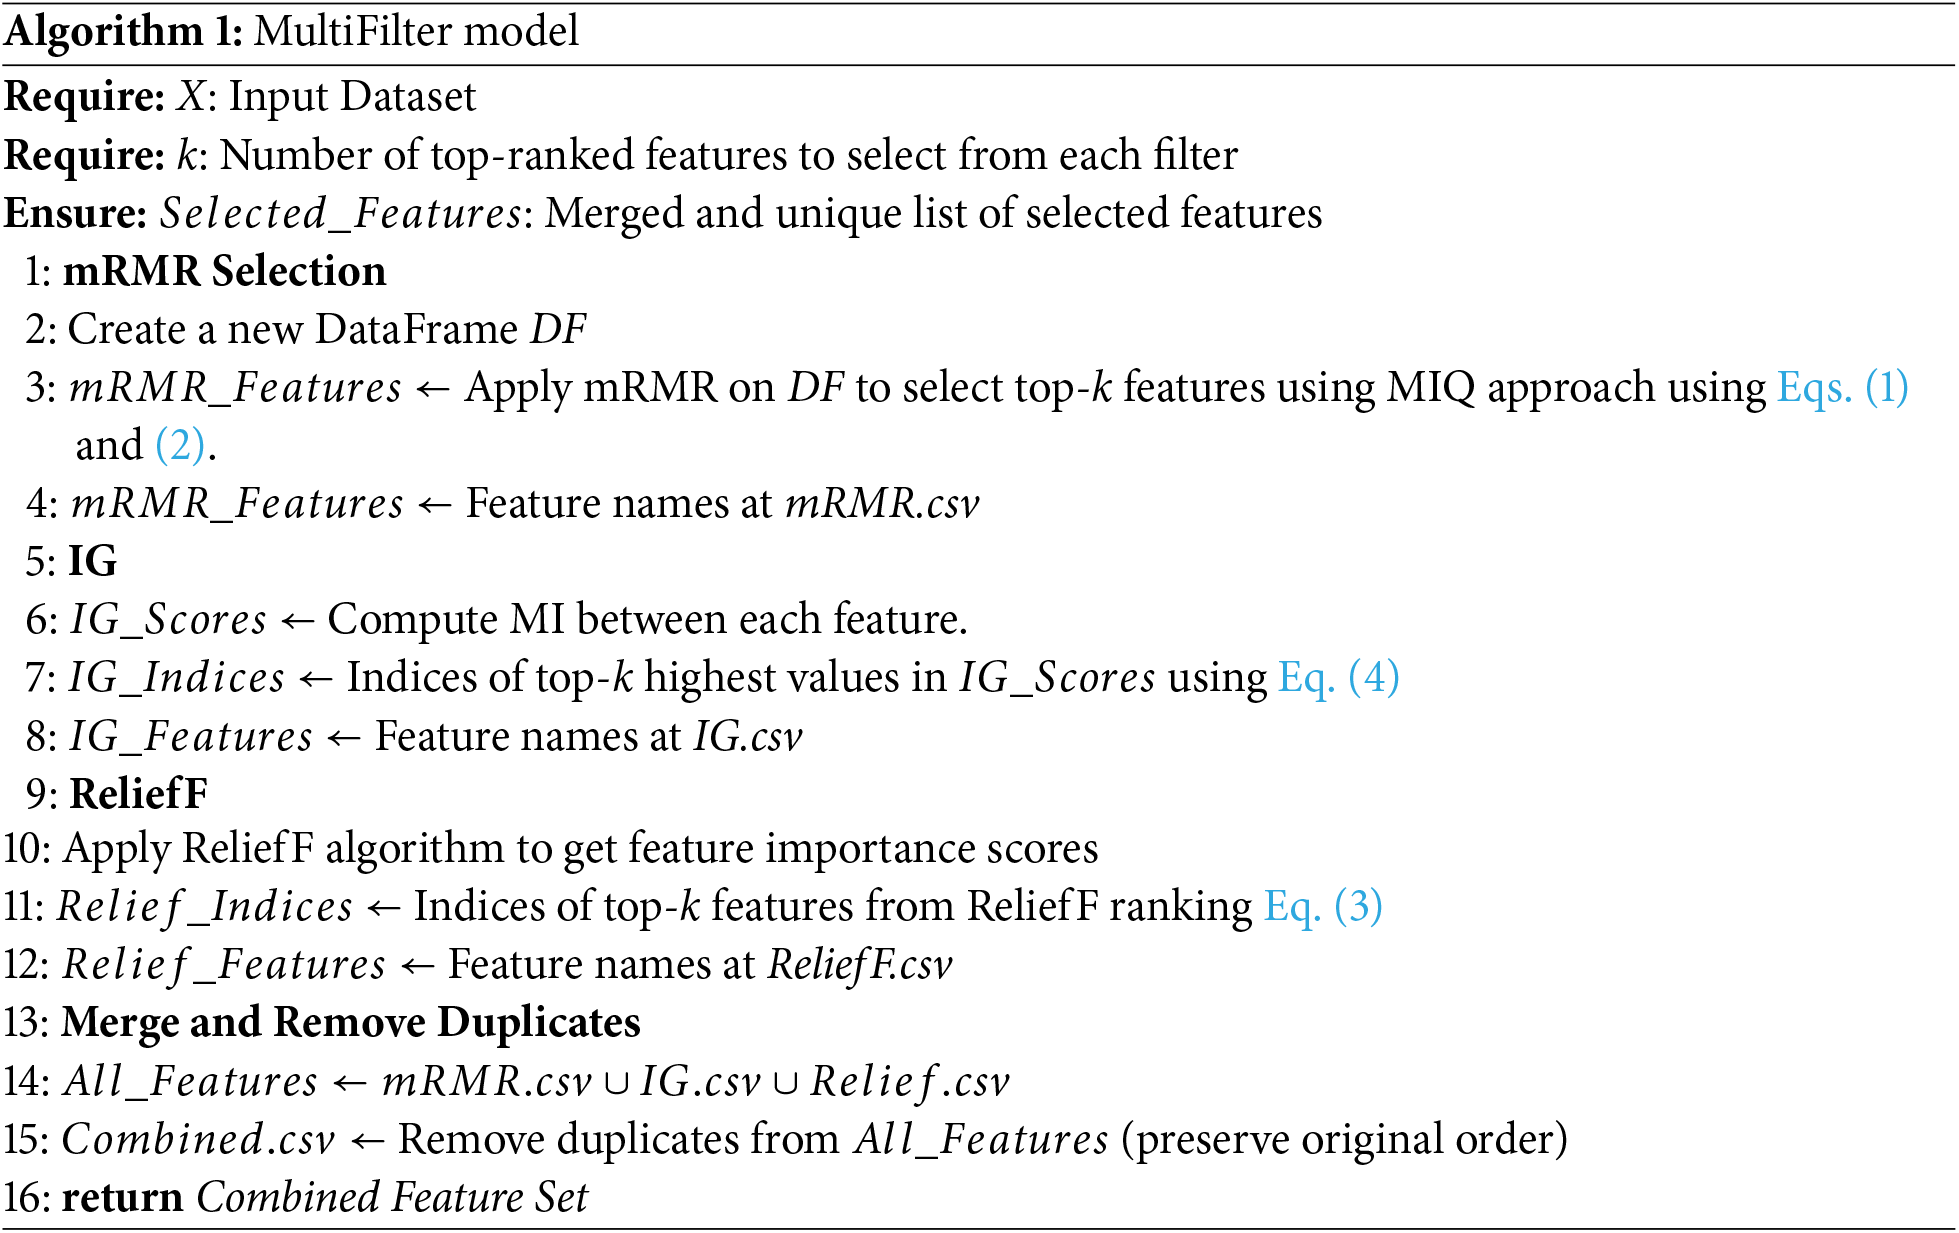
ReliefF, mRMR, and Information Gain (IG) are popular filter-based feature selection methods used in machine learning to identify and retain the most informative features from a dataset, independently of any specific learning algorithm. The features selected by each individual filter-based approach undergo a multi-filter approach to merge the features and remove duplicate features from the final feature space. Algorithm 1 shows the working of the multi-filter approach.
3.2.1 mRMR (Minimum Redundancy Maximum Relevance)
The mRMR is a preferred feature selection tool to recognize the most important features from cancer datasets, which are high-dimensional in nature. The core concept is to recognize the features that are highly relevant to the target variable with minimal redundancy among them. This provides a clear idea to eliminate the overlapping features that may be a cause of hindering model performance. Out of thousands of features, mRMR selects the high-ranked features according to their mutual information with the class label and removes the highly correlated features. The mutual information between a feature
Here,
ReliefF identifies significant features based on how well it can distinguish between instances that are close to each other. A comparison of the feature values between the chosen instance and its closest neighbors of the same and different classes is performed using a random sample of examples. The weight of the feature
Here,
A comparison of the feature values between the chosen instance and its closest neighbors from the same and different classes
where
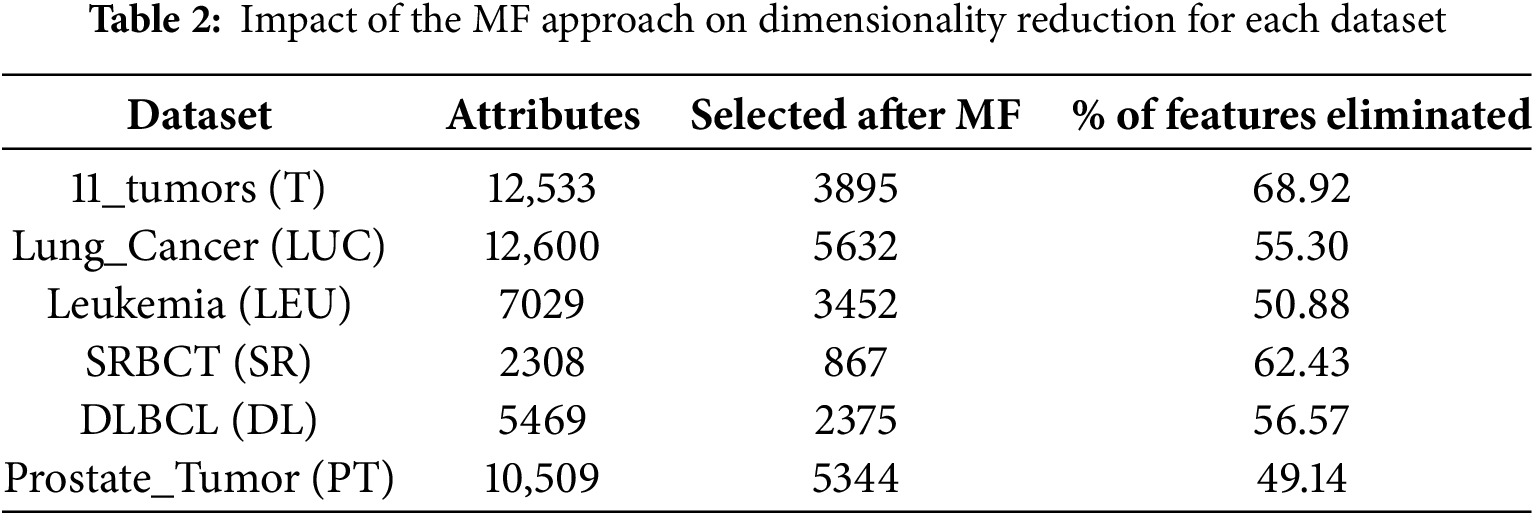
Table 2 presents the impact of adopting the Multifilter (MF) feature selection to select the best feature subset of the original dataset. We found that the MF approach selects 3895, 5632, 3452, 867, 2375, and 5344 features from the T, LUC, LEU, SR, DL, and PT datasets, respectively. Adopting the MF filter will not only increase the performance of the proposed model but also reduce the time complexity of the model without using the MF model.
In the current era, TLBO [39] and Cheetah Optimizer [40] are two well-known MA’s used to solve complex computational problems. From the different surveys, we found that TLBO provides a more accurate solution. To avoid the nature of TLBO stuck in local optima, we used the new Cheetah optimizer as a local search to enhance the efficacy of the proposed model. We highlight the importance of TLBO and CO. In [41] and [42], the authors presented binary TLBO for feature selection. Even if different researchers used binary TLBO, the limitation of BTLBO (stagnation) can be solved using our proposed model, BTLBO-CO.
Rao presented the TLBO swarm intelligent optimization method, which is motivated by the teaching-learning approach of a classroom. The original TLBO is proposed to solve complex global problems. TLBO is a population-based optimization in which students are the learners and are called search agents. Where the student search agents are led by the teacher search agents. The fitness value of each agent indicates the degree of student learning achieved during the learning or optimization period. The subjects taught by the teachers are called decision variables for the optimization process. There are two phases, the exploration and exploitation phases, also known as the teacher and learner phases, respectively. Agents learn from the teacher’s expertise in this phase; the next phase emphasizes interactions among the students.
The teacher’s expertise plays a key role in improving the average grade of the student, which is the key concept of this phase. A play-role scenario is adopted in which the best learner is treated as a teacher and allowed to teach poor students with low fitness value. The average position of all students is updated, and the location of each agent (student and teacher) is updated using Eqs. (5) and (6).
Here, i, j, k present the iteration and dimensions of the subject (j = 1, …, n) and the learner (search agent)(k = 1, …, n), and r is a random value that varies within (0, 1).
The value of
The key assumption behind the learning phase is how the learner communicates with other learners to gain the concept. The main fact is that a poor learner can gain knowledge from the superior learners present in the class. Suppose that there are two different learners, p and q, depicted as
In BTLBO, for each iteration
The binary vector
Eq. (12) demonstrates the equation to update the
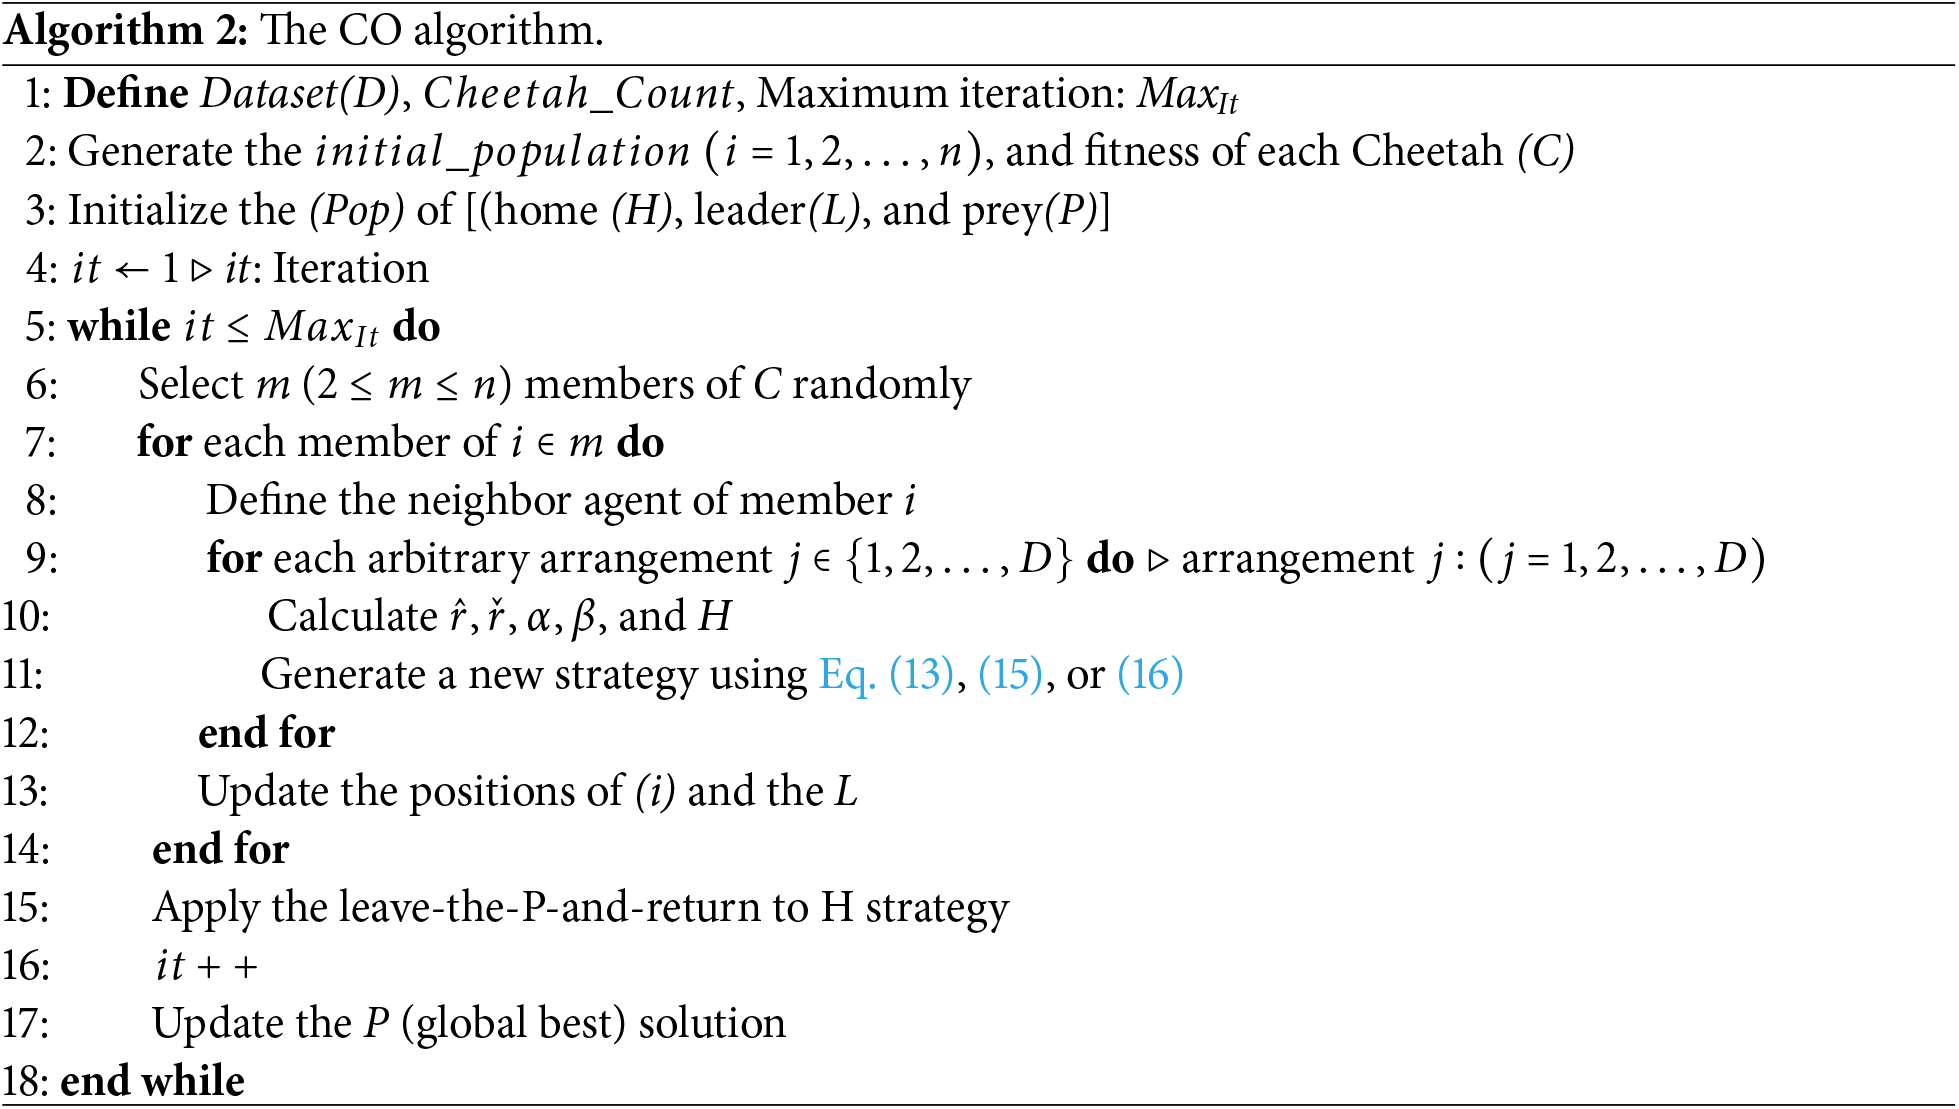
CO is one of the nature-inspired algorithms motivated by the hunting nature of the Cheetah. The hunting principle of the Cheetah is categorized into three critical phases: searching, sitting, waiting, and attacking. If Cheetah and the team fail to catch the prey, then they should all return home. This concept is also co-opted into the hunting process to improve population diversion and convergence issues [40]. Algorithm 2 shows the working of the CO algorithm.
In the search mechanism, the Cheetah scans the entire environment to find suitable prey for food. The mathematical presentation of the search mechanism is presented using Eq. (13).
Here,
Here,
3.4.2 Sitting-and-Waiting Mechanism
Cheetahs depend on speed and agility as quick hunters, both of which need a lot of energy. Their chases, hence, cannot be very long. They wait patiently for the victim to approach within striking distance before unleashing their attack, therefore optimizing success. Eq. (15) captures this behavior that increases hunting efficiency. Here,
Striking at the right moment, Cheetahs make use of their speed and agility. They assault with full speed to quickly get near their prey. This drives the victim to respond right away, usually opting to flee by suddenly veering away from capture. Using its remarkable flexibility, the Cheetah thus keeps the victim off balance and boosts its chances of a successful hunt. Attacks might be carried out in groups or by individuals. While in group hunting, coordination is dynamically changed depending on the positions of both the prey and other Cheetahs; in solo hunting, the Cheetah’s motions are directly influenced by the location of the prey. Overall mechanism involved in this phase is mathematically expressed using Eqs. (16)–(18).
Here,
3.4.4 Strategy Selection Approach
Strategy selection, decided by the Cheetah, is done randomly. This decision is made using three independent random variables called
In this study, we used CO to improve the accuracy of the population instead of considering basic population generation using TLBO. The output of the CO is considered as input for the TLBO execution.
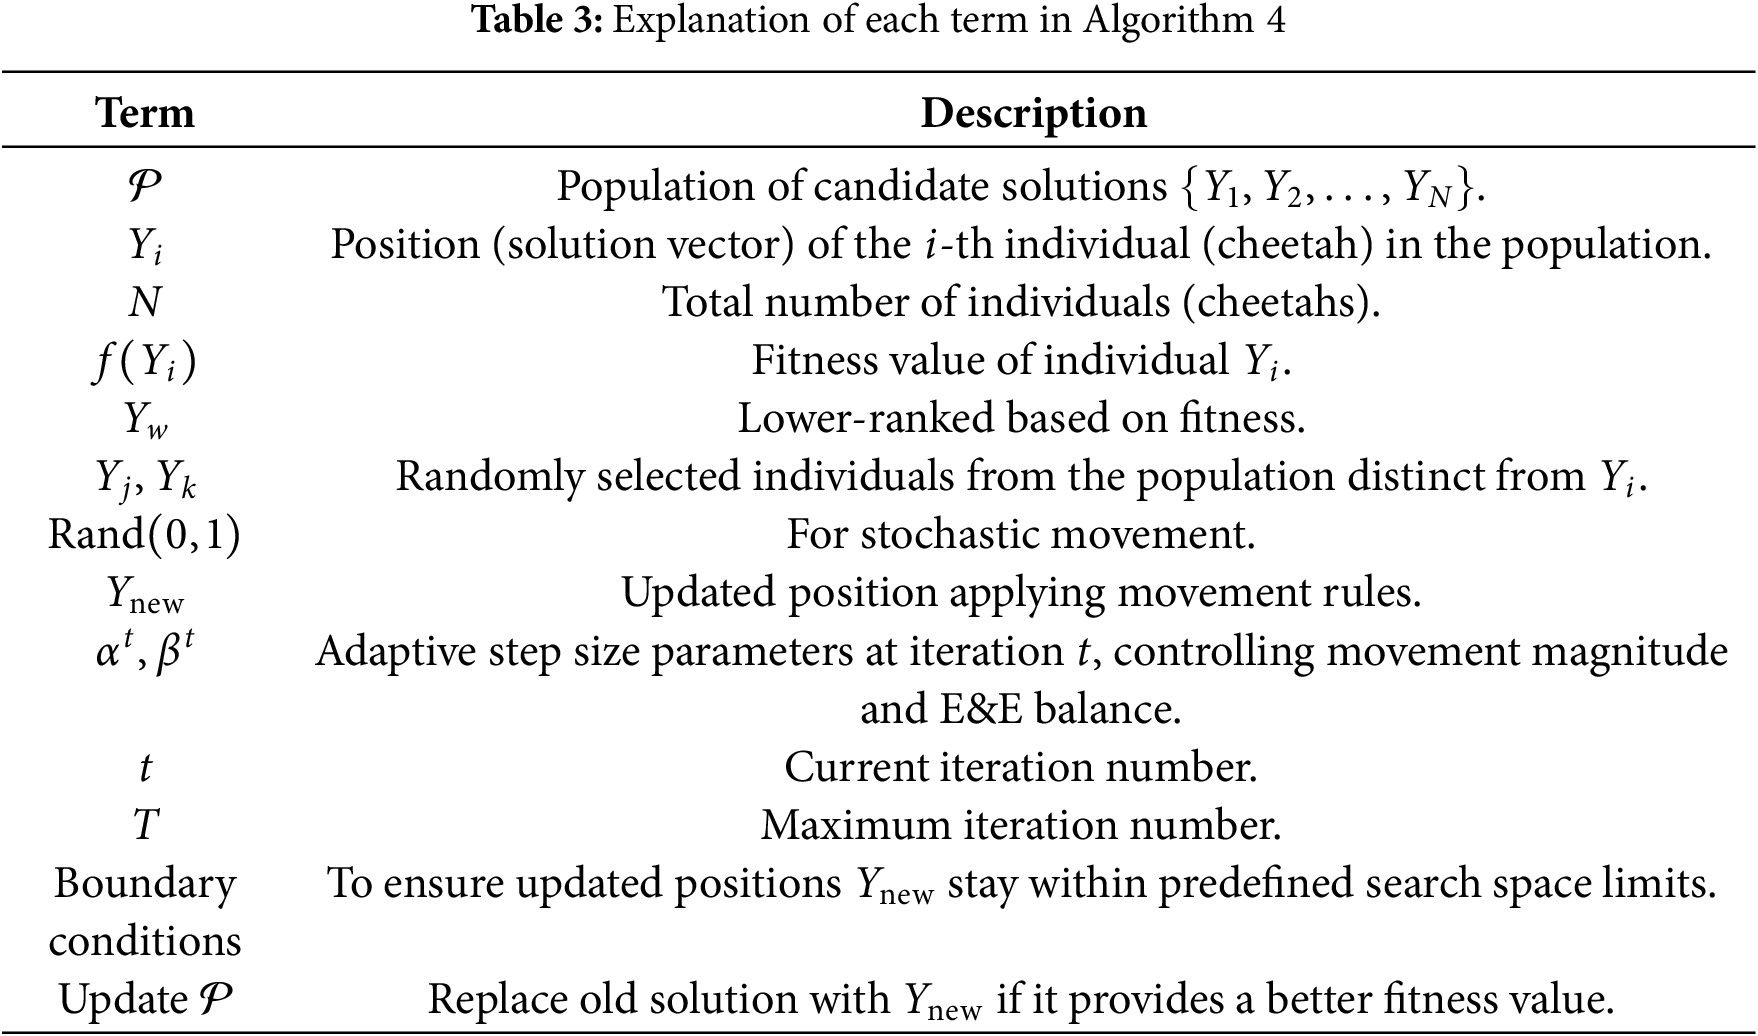
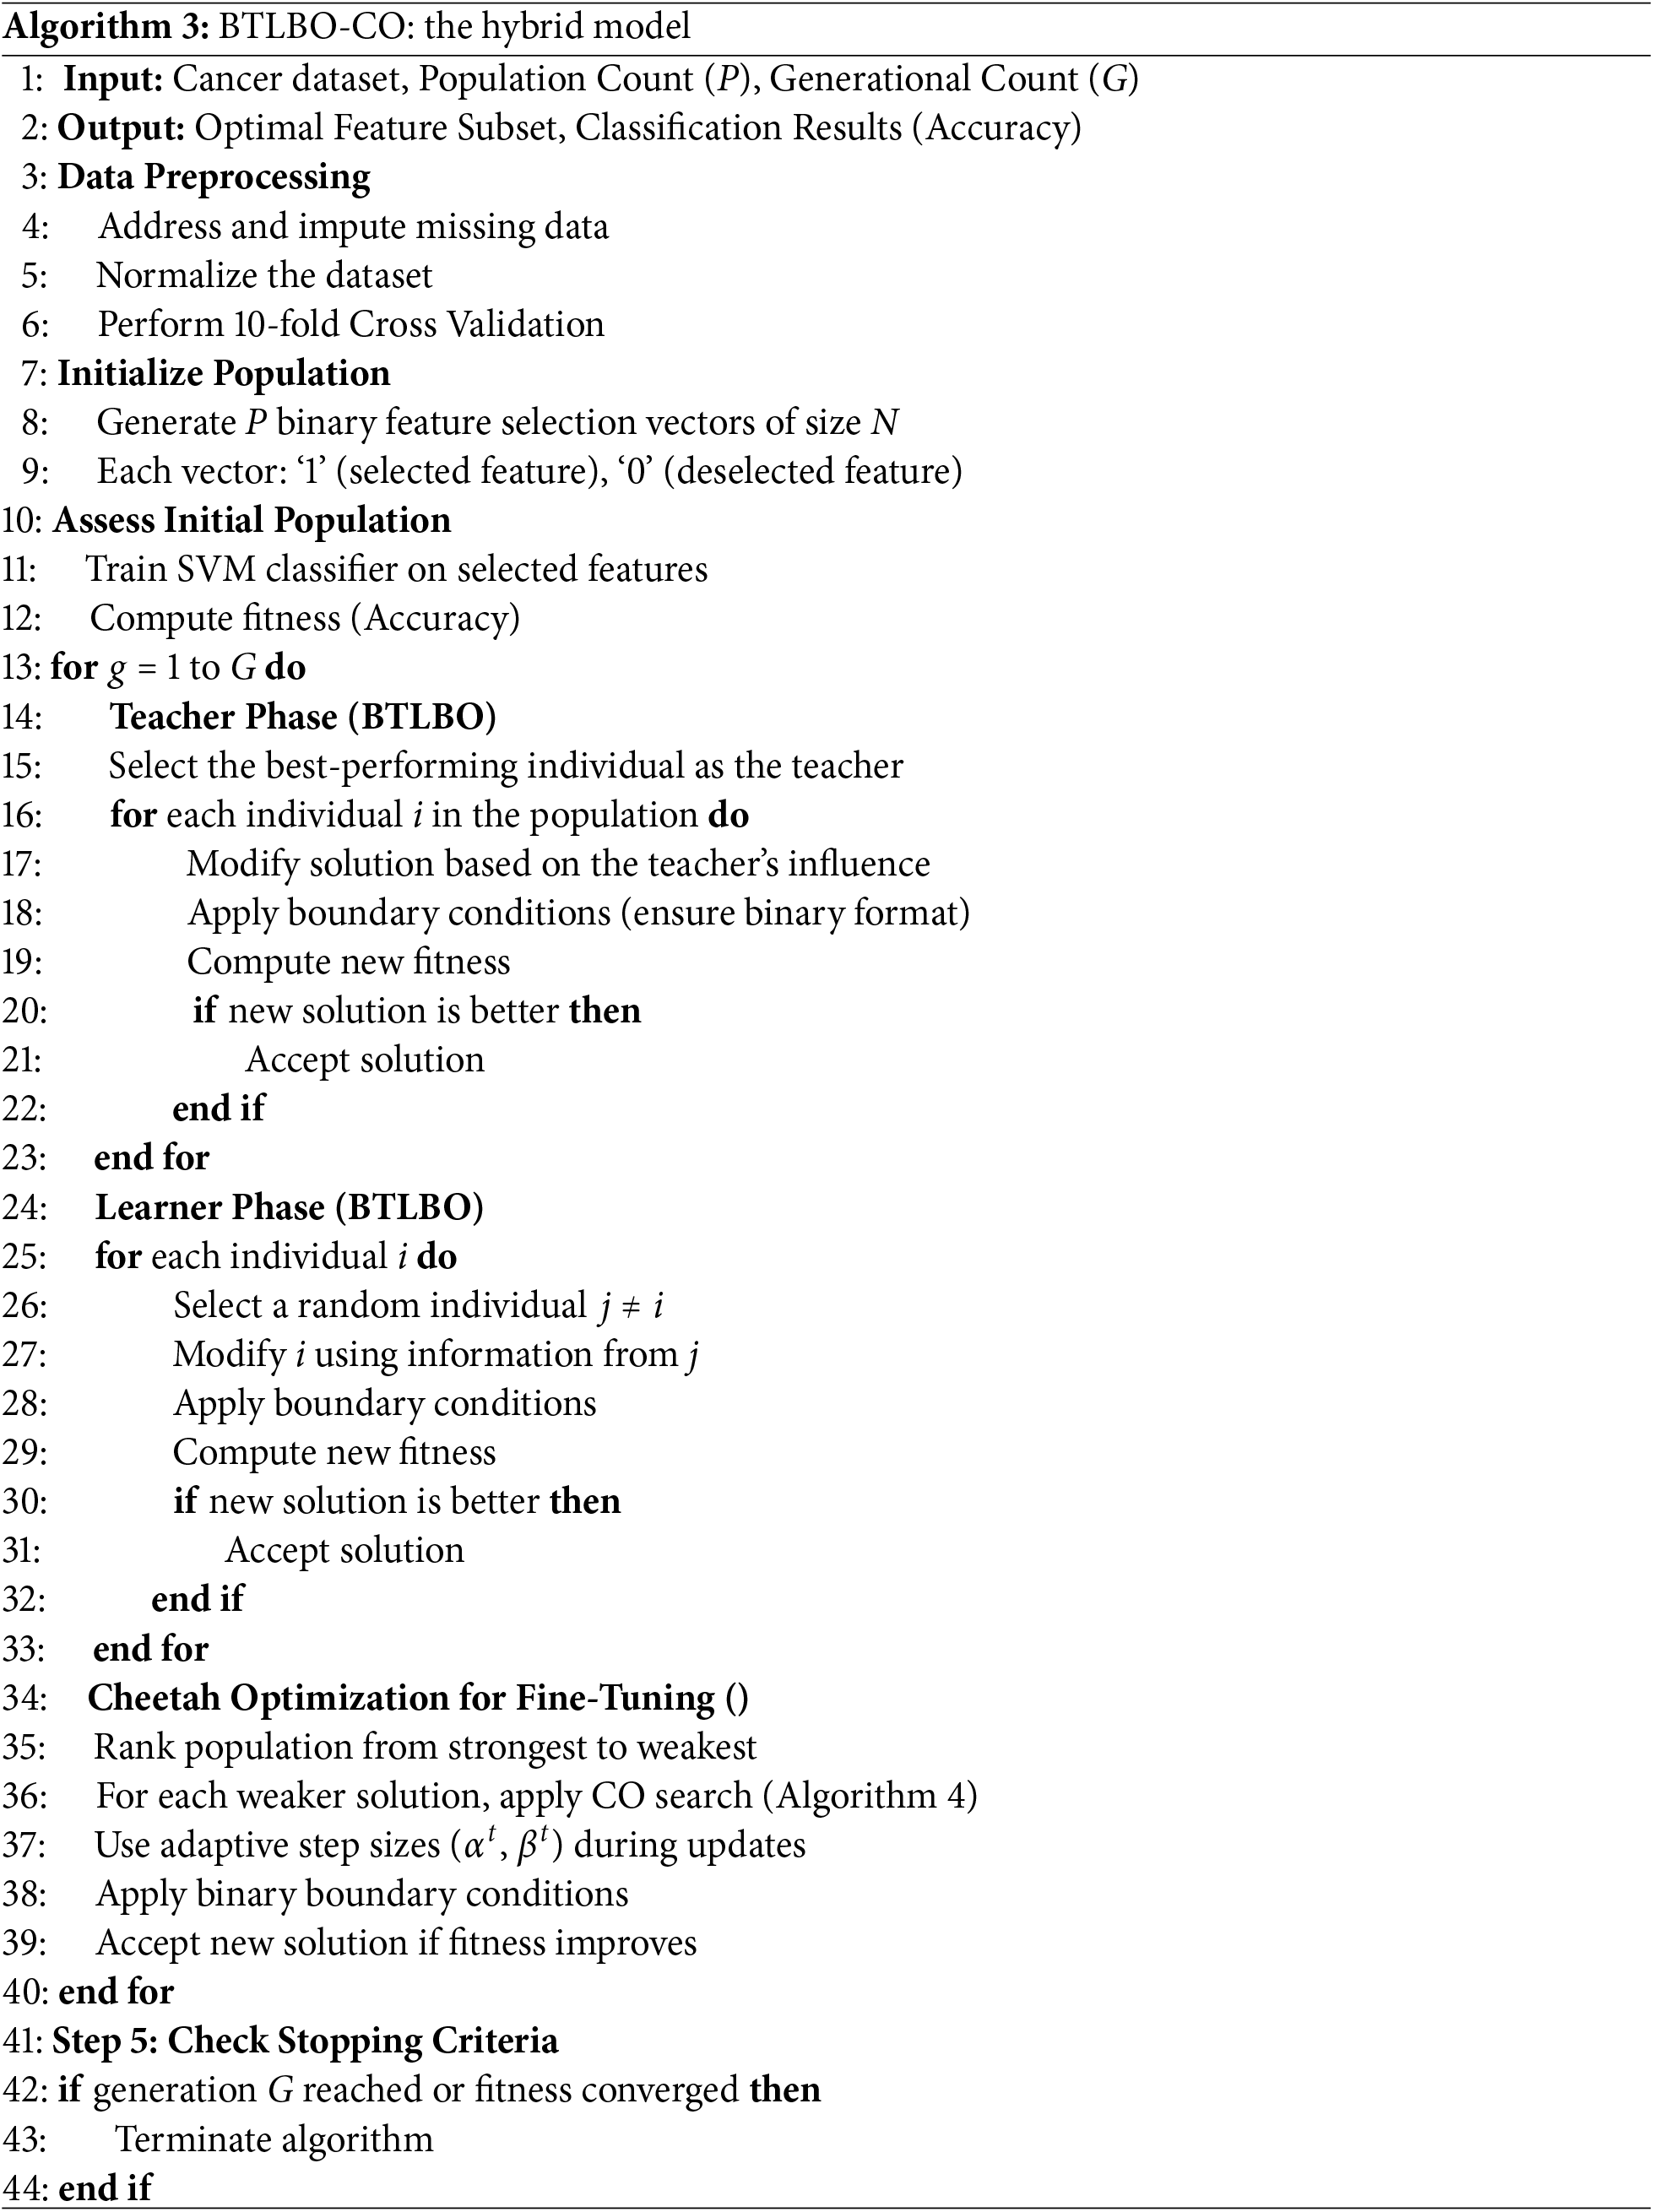
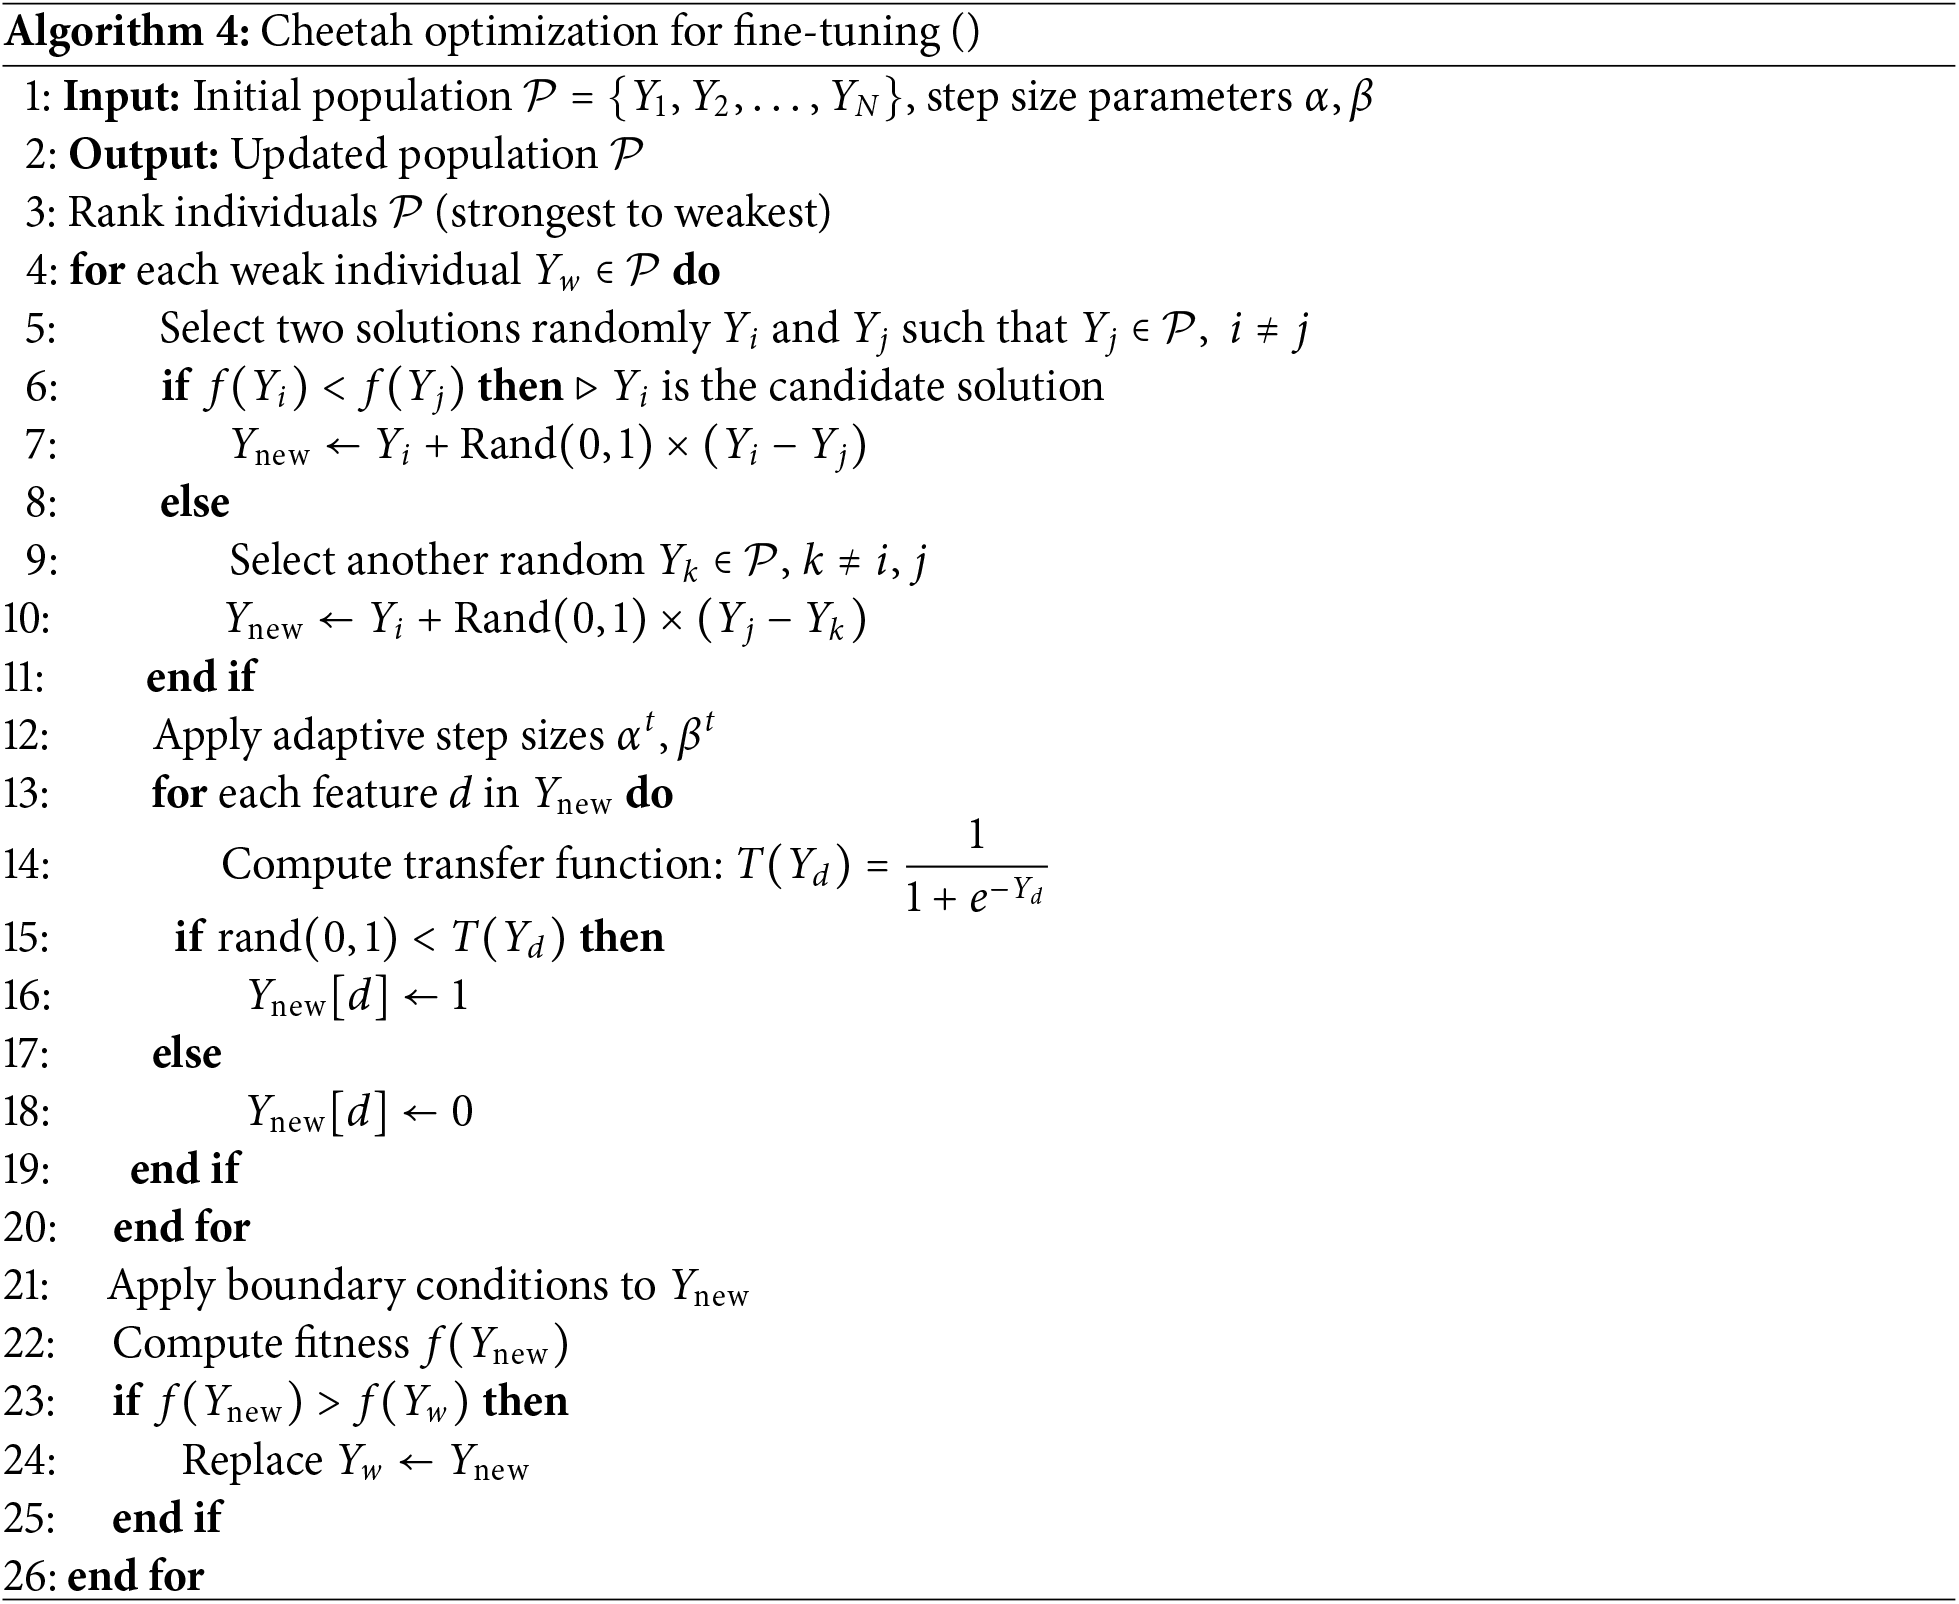
In this study, the proposed model is evaluated on several microarray datasets. Noise and absent data in microarray datasets may affect performance. We impute and normalize absent data to mitigate this deficiency. The dataset was evaluated using stratified 10-fold cross-validation, where in each fold 90% of the data was used for training and 10% for testing, and the final metrics were averaged over all folds to ensure a fair and representative evaluation. Disregarding the impact of the chosen feature subset, various filter techniques may produce an imbalanced feature set. This may impact model precision and optimal feature subset selection. The detailed BTLBO-CO workflow diagram is presented in Fig. 1. Algorithm 3 shows the working of the proposed work, whereas Algorithm 4 shows the working of the CO to fine-tune the TLBO.
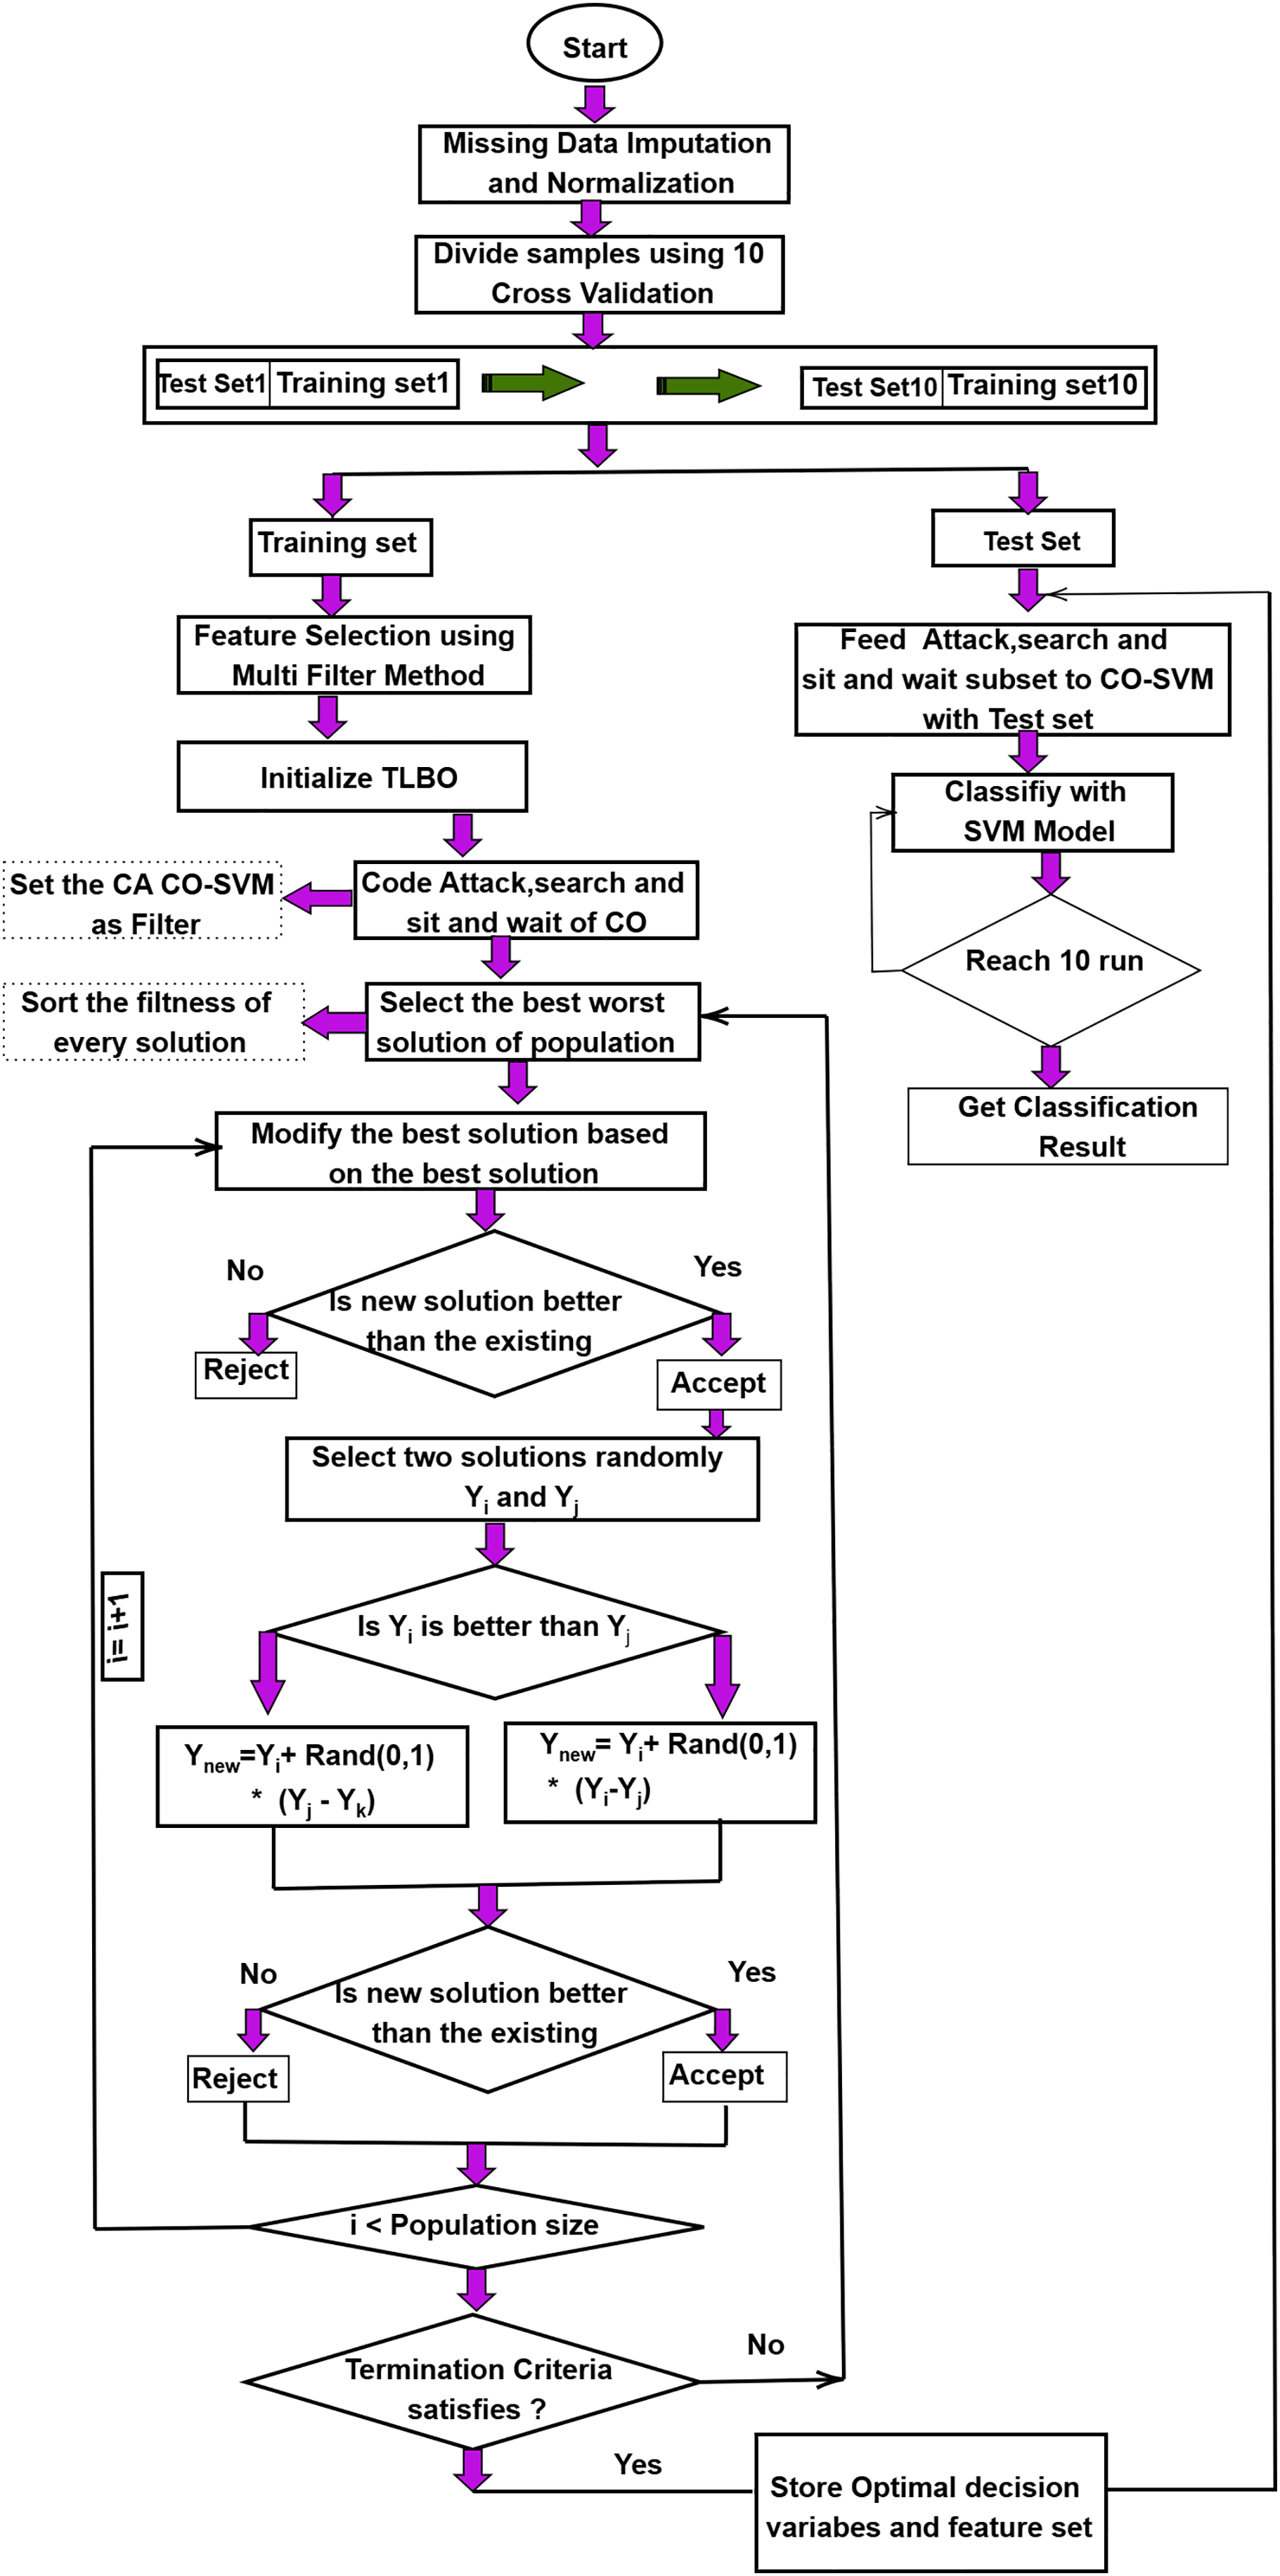
Figure 1: Workflow of the proposed BTLBO-CO model integrating Binary Teaching–Learning-Based Optimization (BTLBO) with Cheetah Optimization (CO) for feature selection and classification
According to the literature, the efficacy of the classifier depends on the choice of optimal features, which influences both the complexity and the classification accuracy (CA). This work finds the ideal subset of features using CO as a wrapper technique in concert with SVM. The Support Vector Machine (SVM) classifier was implemented using the scikit-learn library (version 1.3.0). Hyperparameters were optimized via a grid search with 5-fold cross-validation on the training set. The search space included kernel type {linear, radial basis function (RBF)}, regularization parameter (C) {0.1}, kernel coefficient (
4 Experimental Result Analysis
The PyCharm Integrated Development Environment (IDE) was used to carry out the experiments. The PC running the algorithms has a 2.67 GHz Intel i5 CPU and 16 GB of RAM. Each algorithm is run ten times in this scenario, and the mean value that is produced is used as the accuracy for evaluation. An SVM classifier is employed to assess the efficacy of the developed model. 10 CV validations are applied to each algorithm. Several performance metrics were used to evaluate the effectiveness of the model, and precision was found to be one of the most important features. Performance is evaluated on several parameters, including accuracy (ACC), precision (PRE), recall (REC), specificity (SPE), F-1 score (
• BTLBO-CO obtained an ACC of 93.71% on the 11_tumor dataset, with a REC of 97.97% and F1-S of 96.03%, the model clearly found real positive examples and kept a strong balance between accuracy and recall. On the other hand, a high FPR of 18.00% and a much lower SPE of 82.00% reveal that the model was very prone to misclassifying negative data as positive. The MCC of 83.57% shows a significant connection between predicted and actual class labels, thereby supporting the dependability of the model.
• The Lung Dataset findings show great model behavior with an ACC of 96.12% and a high PRE of 99.32%. Strong performance over both sensitivity and overall balance is confirmed by the REC of 96.69% and F1-S of 97.99%. Especially the SPE of 97.92%, a very low FNR of 3.31%, and an FPR of 2.08% show how well the model can identify positive and negative classes. The strong MCC of 92.12 further confirms the accuracy of this dataset’s classification results.
• On the Leukemia dataset, BTLBO-CO shows REC as 100.00%, the model attained an ACC of 98.13%. With a PRE of 97.67% and an F1-S of 98.82%, it shows exceptional classification balance. The MCC of 92.01 nevertheless validates a good link between expected and actual categories, even if the SPE (86.67%) was somewhat lower and resulted in an FPR of 13.33%. This performance implies that in high-dimensional binary classification situations like Leukemia, BTLBO-CO shows high efficacy.
• For the SRBCT dataset, the model generates excellent results overall assessment criteria. With an ACC of 97.11% and a high PRE of 98.16%, it proved most of the favorable forecasts right. Together with an F1-S of 98.77%, the REC of 99.38% guaranteed that practically all genuine positives were found, therefore providing an outstanding trade-off between sensitivity and accuracy. Reliable performance on negative samples is shown by the SPE of 91.89% and low FPR of 8.11%. On this multi-class dataset, the MCC of 93.26 offers a further guarantee of the model’s general stability and discriminative capacity.
• With an ACC of 98.44%, one of the best in the assessment, the model showed great generalizing capacity on the DLBCL dataset. Reflecting the model’s capacity to concurrently minimize both false positives and false negatives, the PRE of 98.74% and REC of 99.37% produced an F1-S of 99.05%. Further verifying the accurate categorization of unfavorable events is the SPE of 95.00%. Both FNR (0.63%) and FPR (5.00%) were rather low; the high MCC of 95.27% highlights the great predictive consistency of the model.
• For the prostate dataset, with the ACC being 98.84% and MCC of 96.81%, the model shows its efficacy for the dataset. The PRE and REC of 99.37% showed perfect accuracy and sensitivity balance. The F1-S of the model is 99.37%. With the SPE of 97.44% and very low FNR (0.63%) and FPR (2.56%), the model can appropriately identify positive and negative situations with minimum error. These measures confirm the resilience of BTLBO-CO, reflecting the almost flawless classification performance.
• Fig. 3 shows the ROC analysis of the proposed model across various datasets.
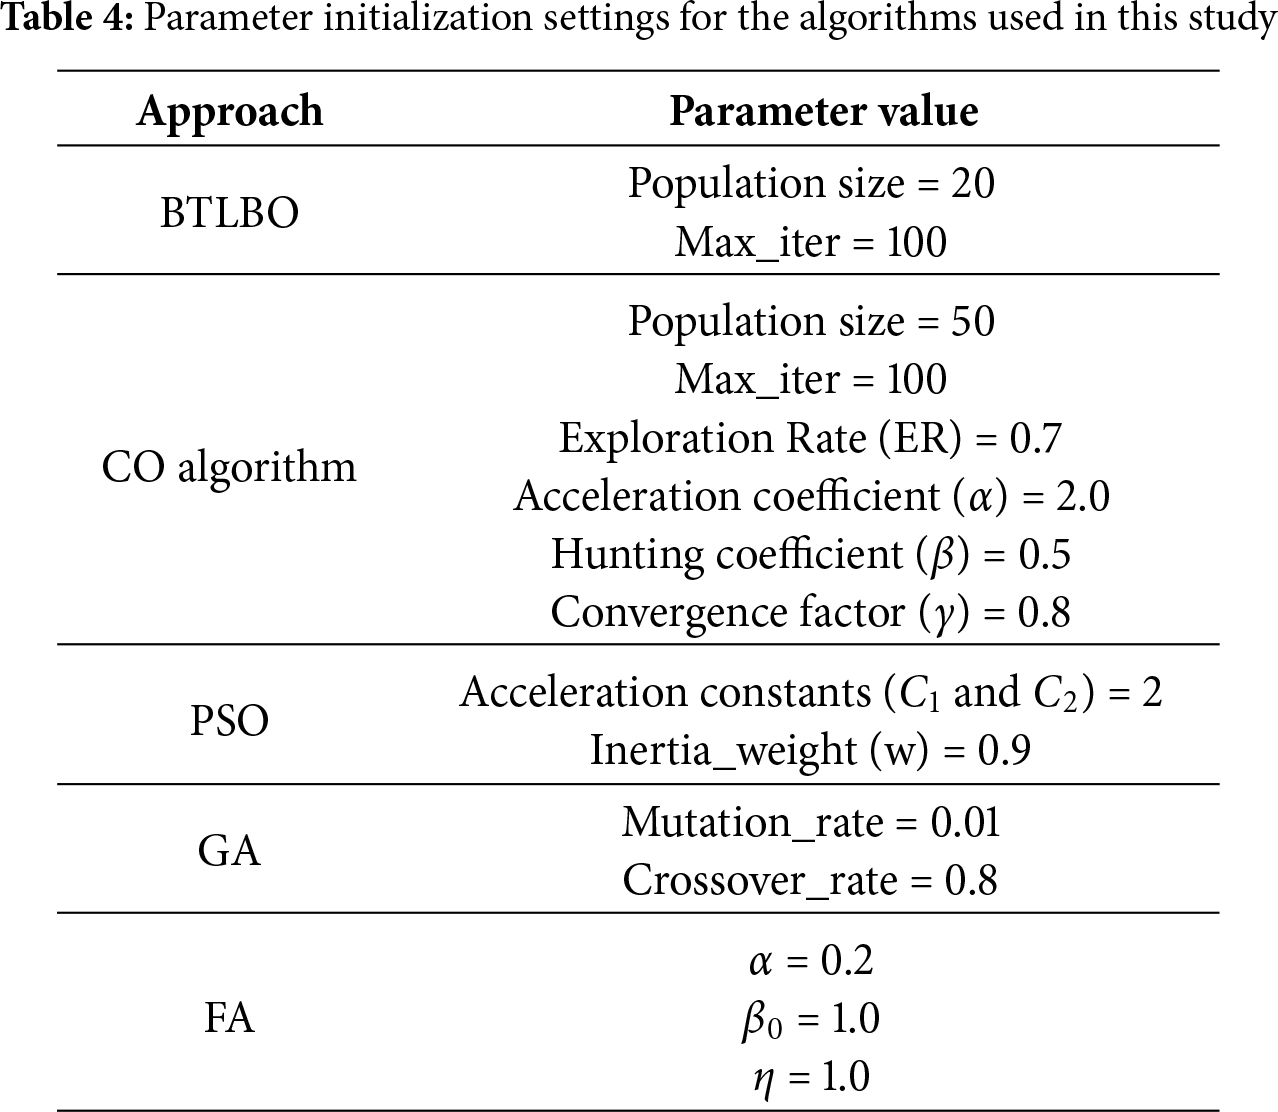
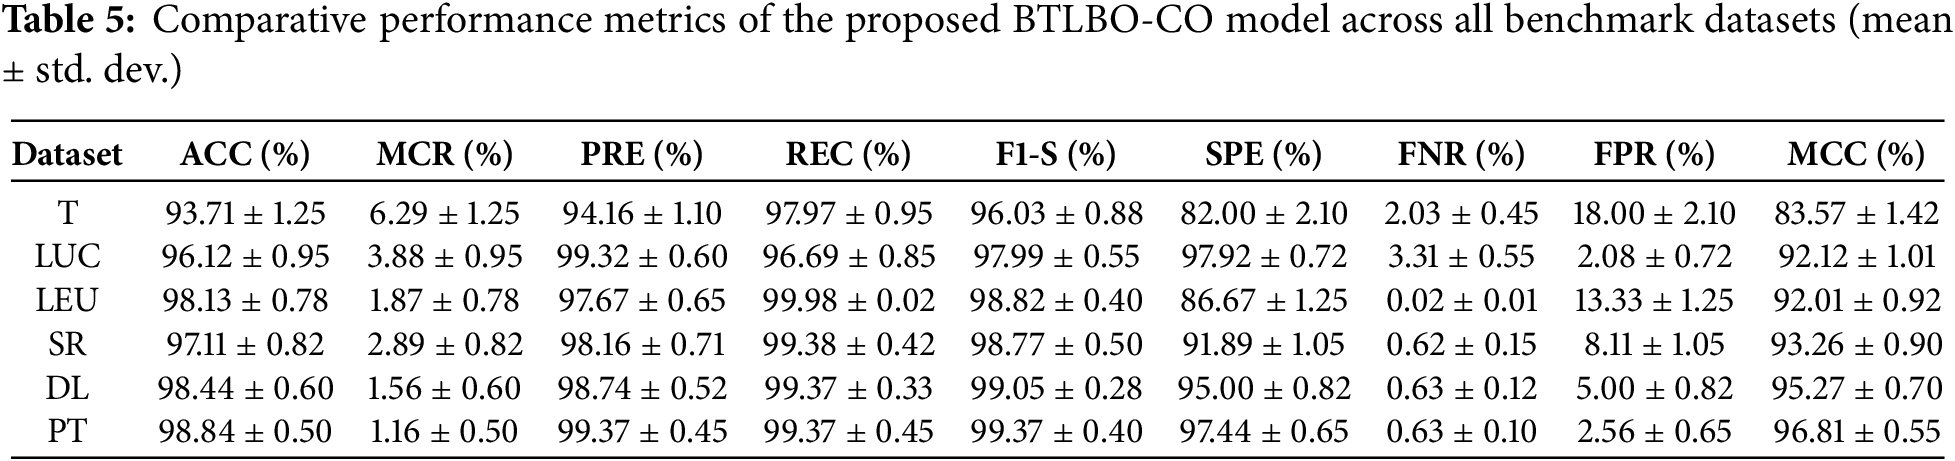
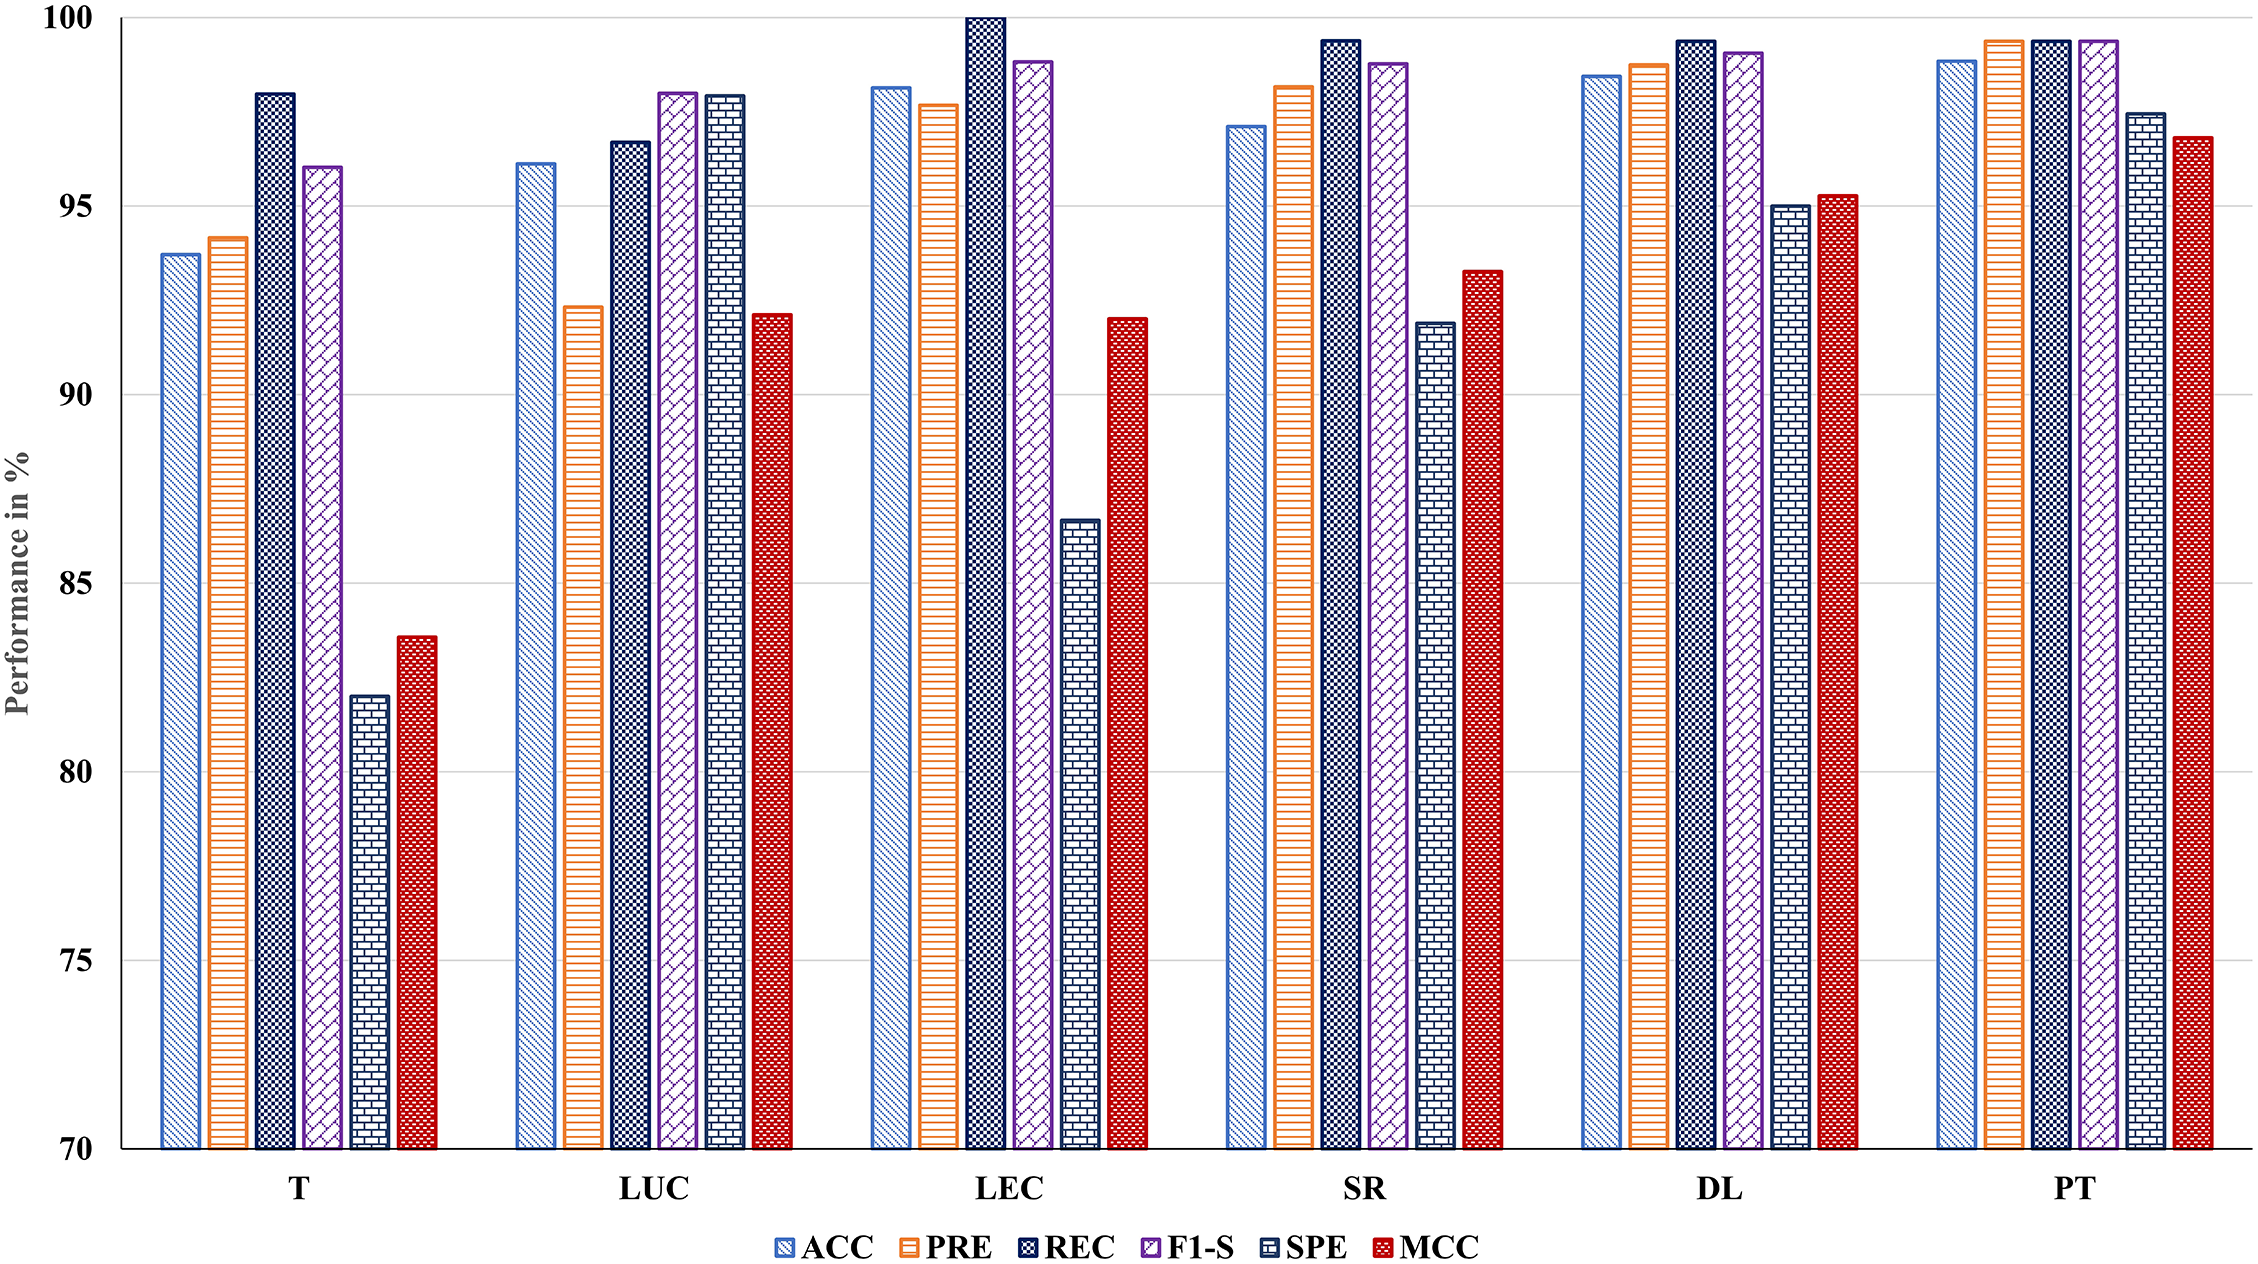
Figure 2: Performance evaluation of the proposed BTLBO-CO model using standard performance metrics across all benchmark datasets
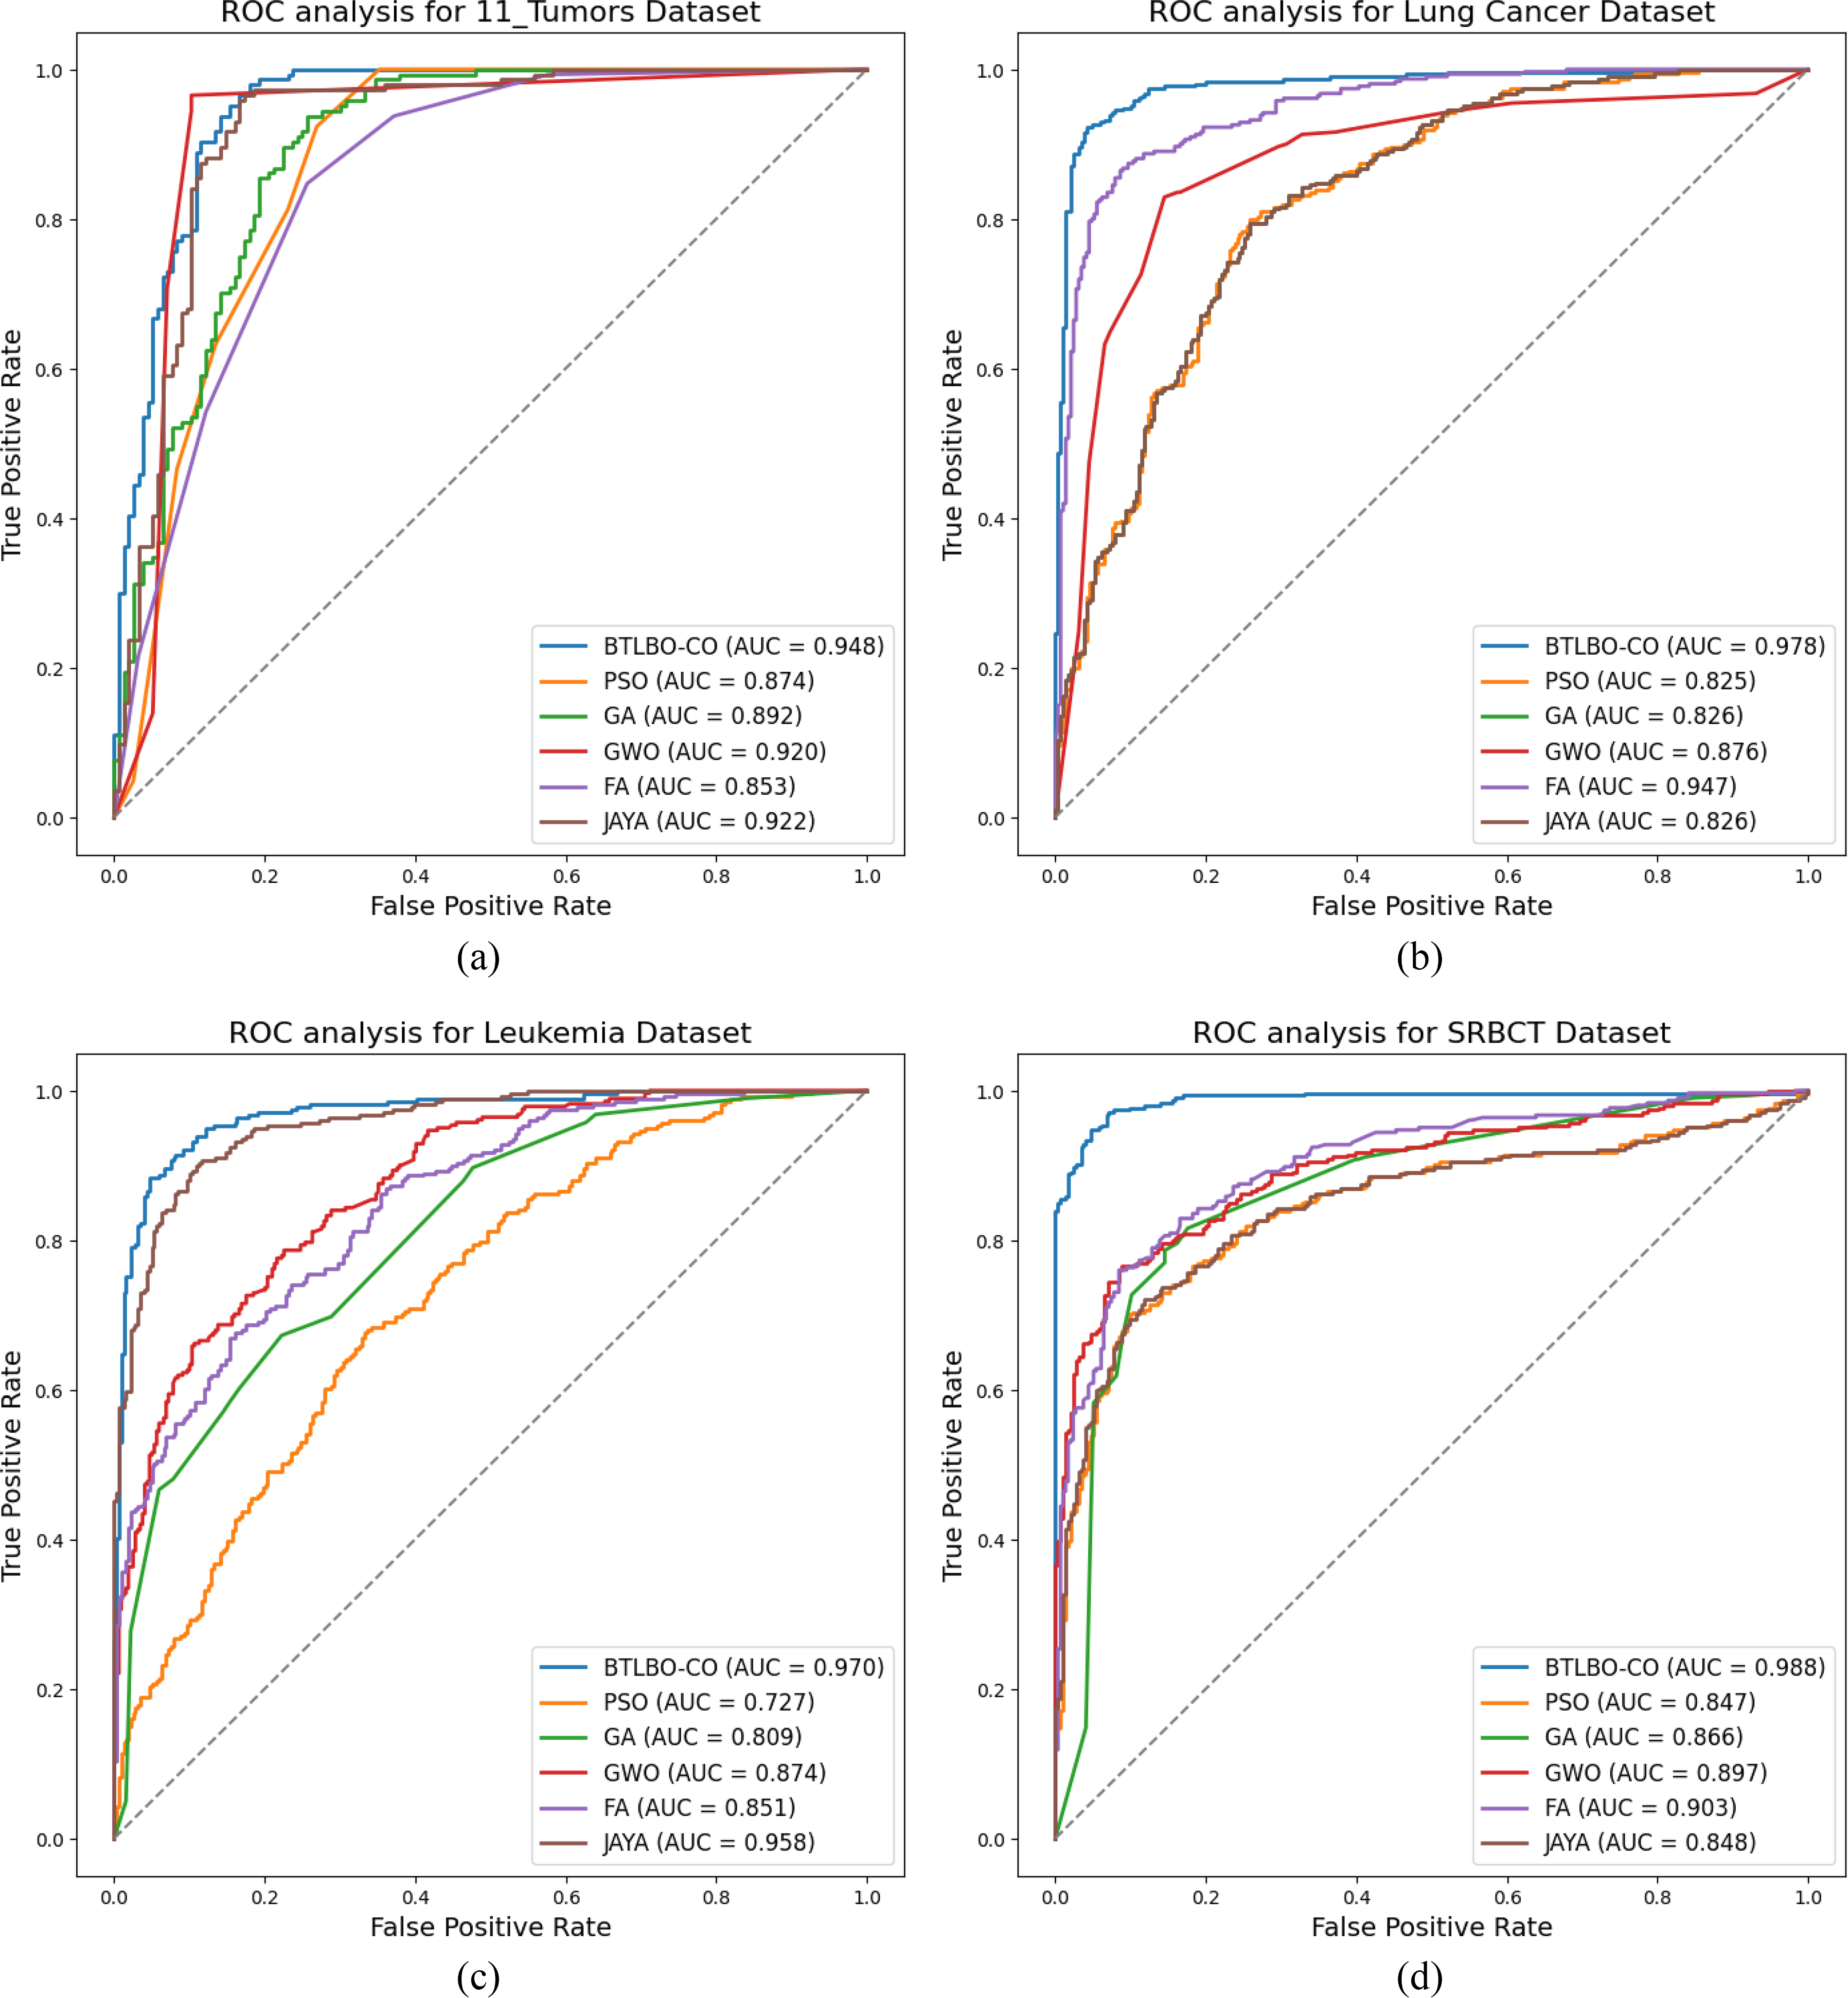
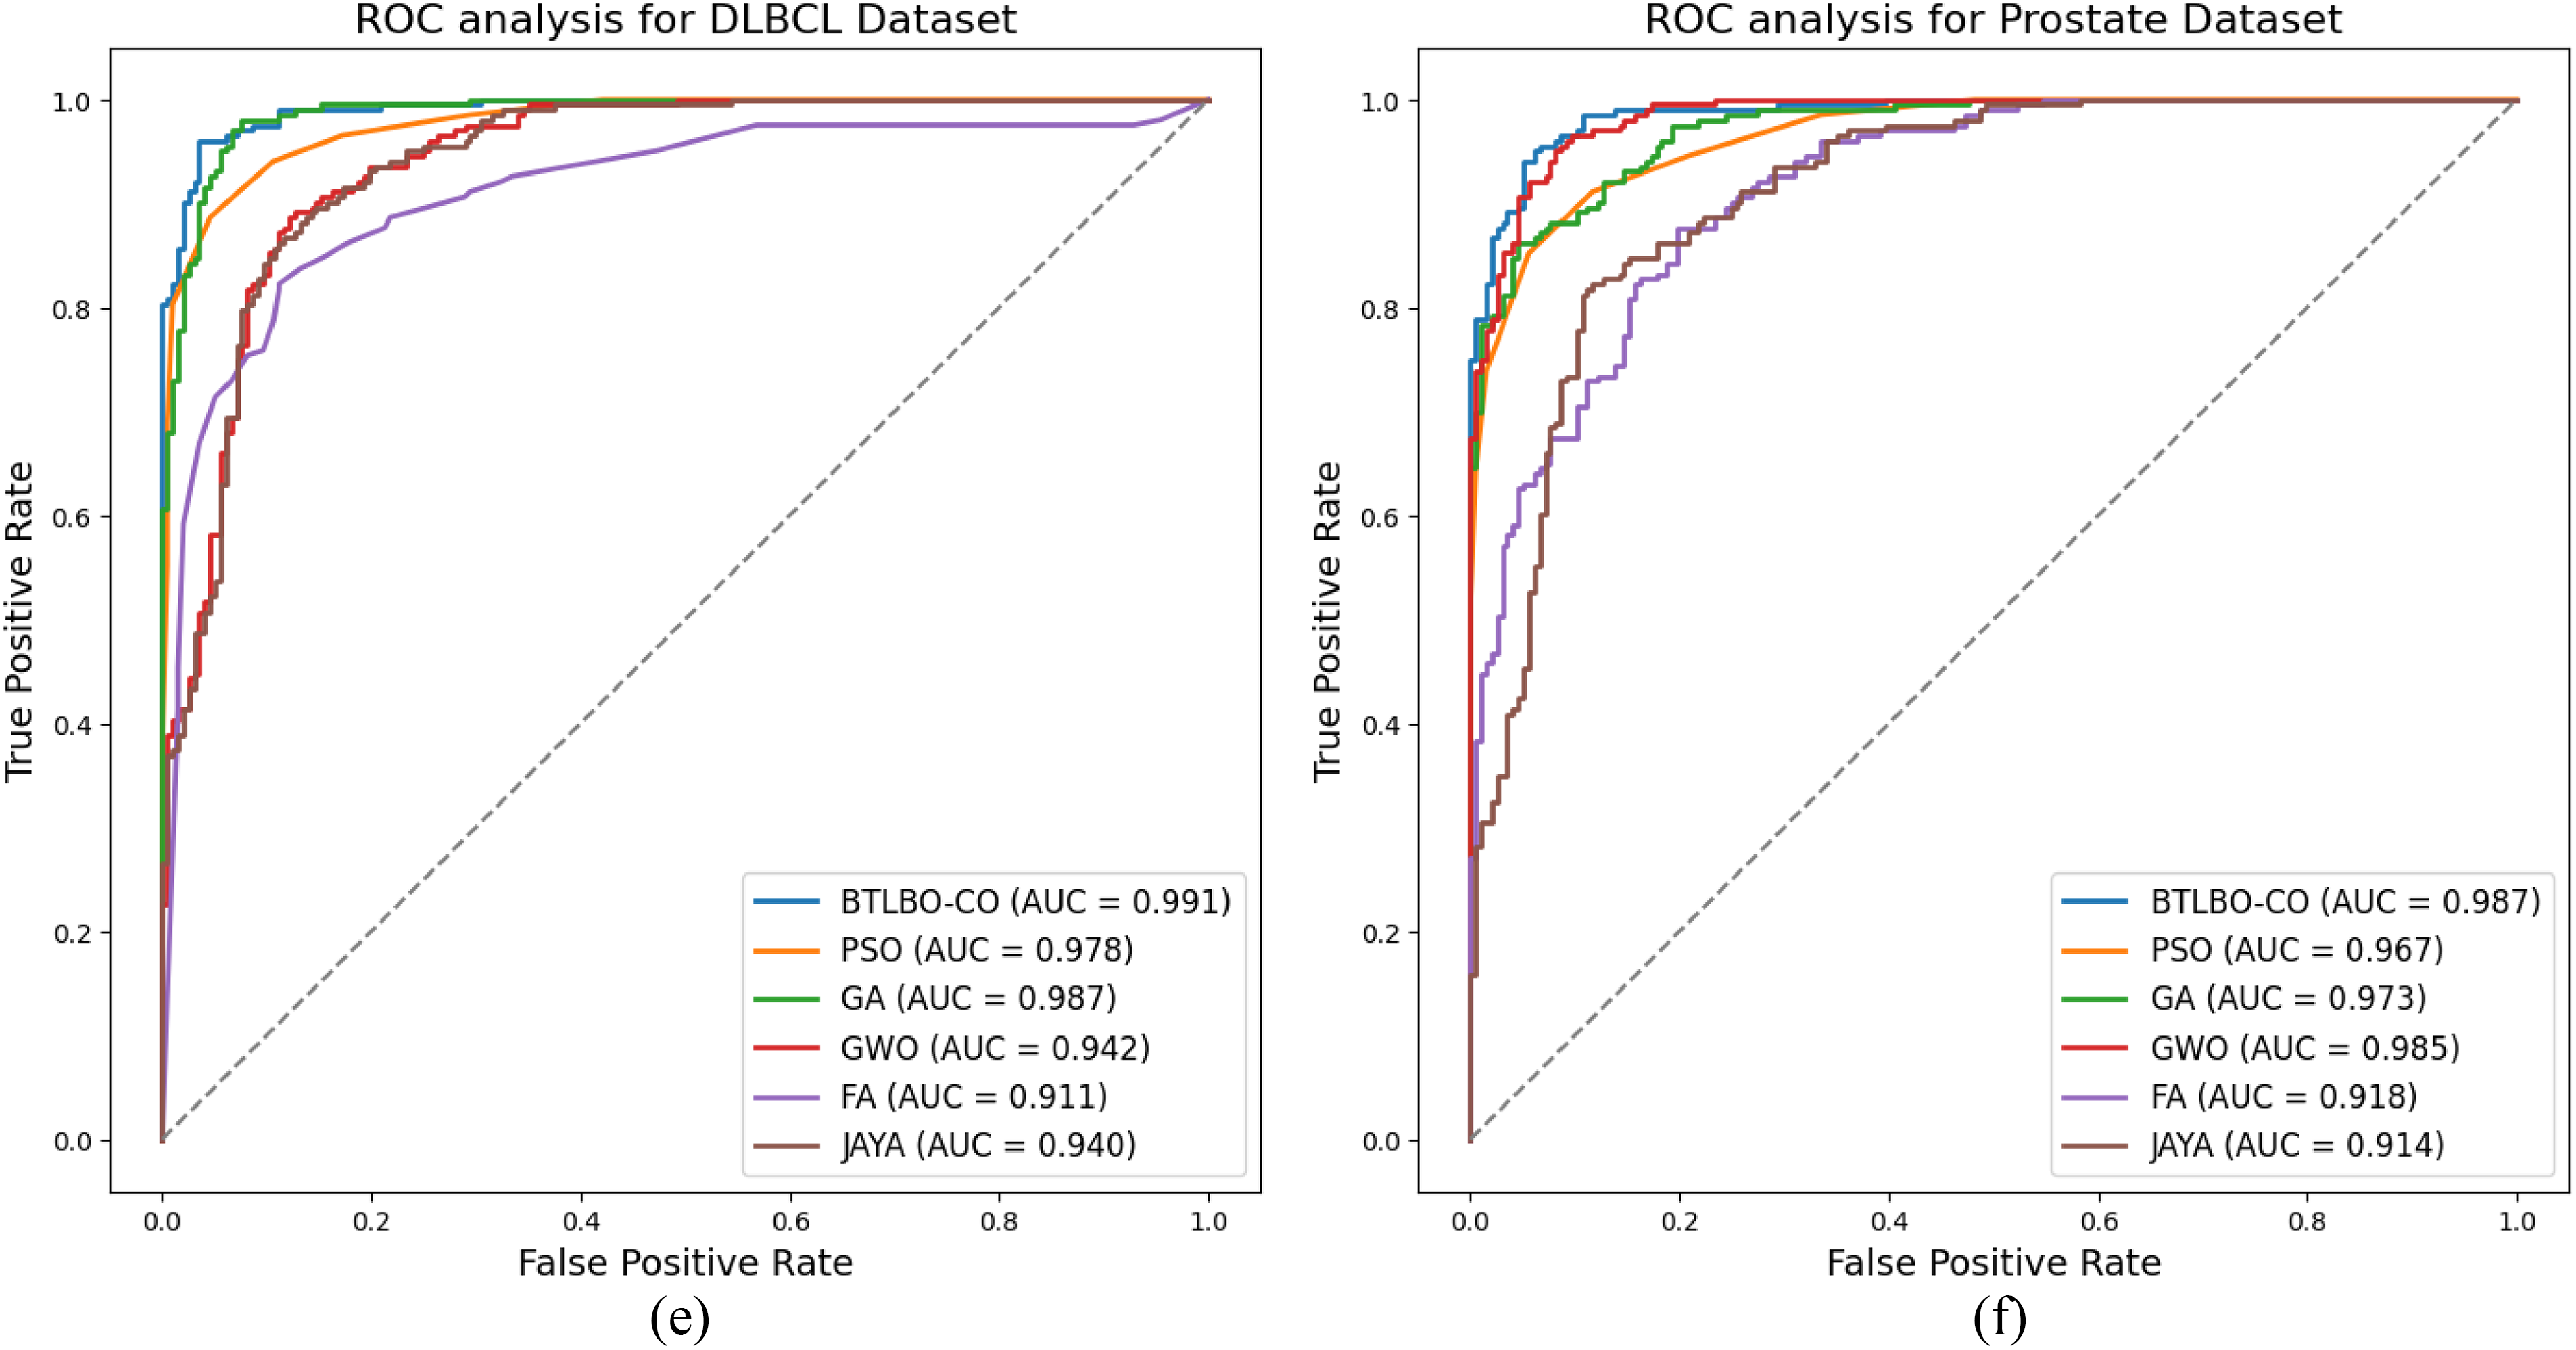
Figure 3: ROC Analysis for (a) 11_Tumors (b) Lung (c) Leukemia (d) SRBCT (e) DLBCL (f) Prostate cancer datasets
Table 6 shows a comparative analysis of the proposed approach with the mentioned traditional feature selection methods. For 11_tumors (T), the proposed BTLBO-CO outperforms the performance of PSO by
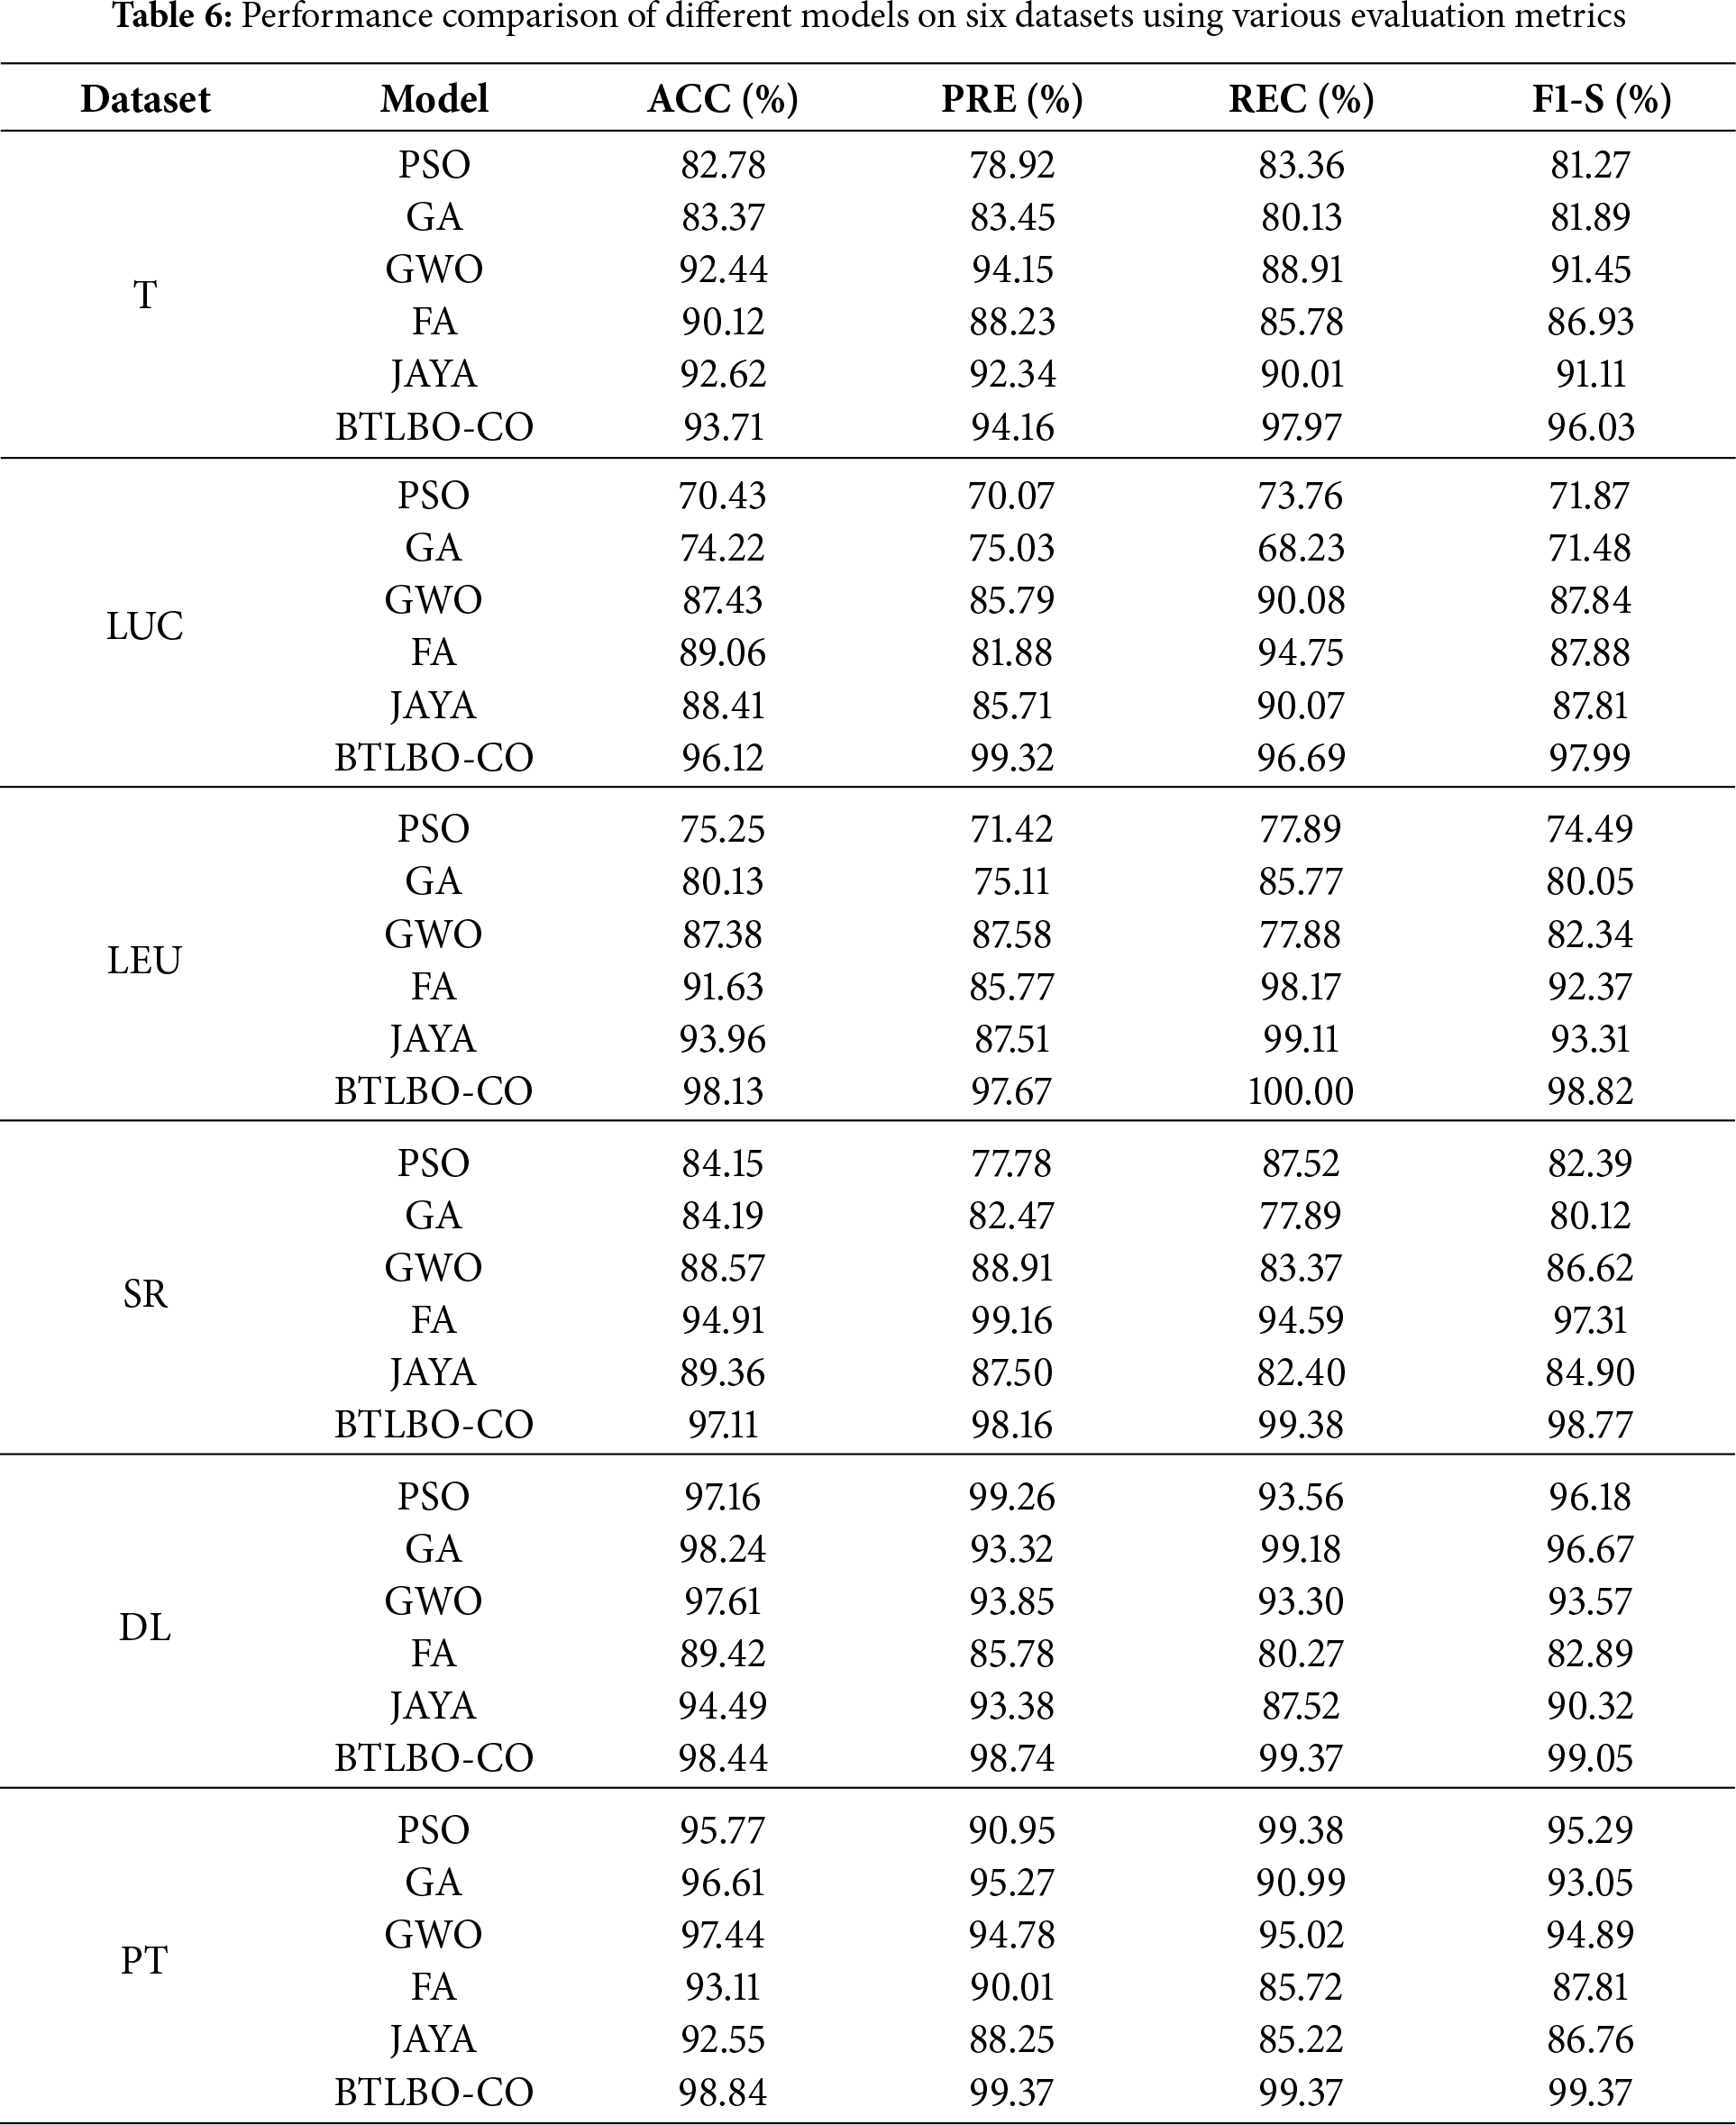
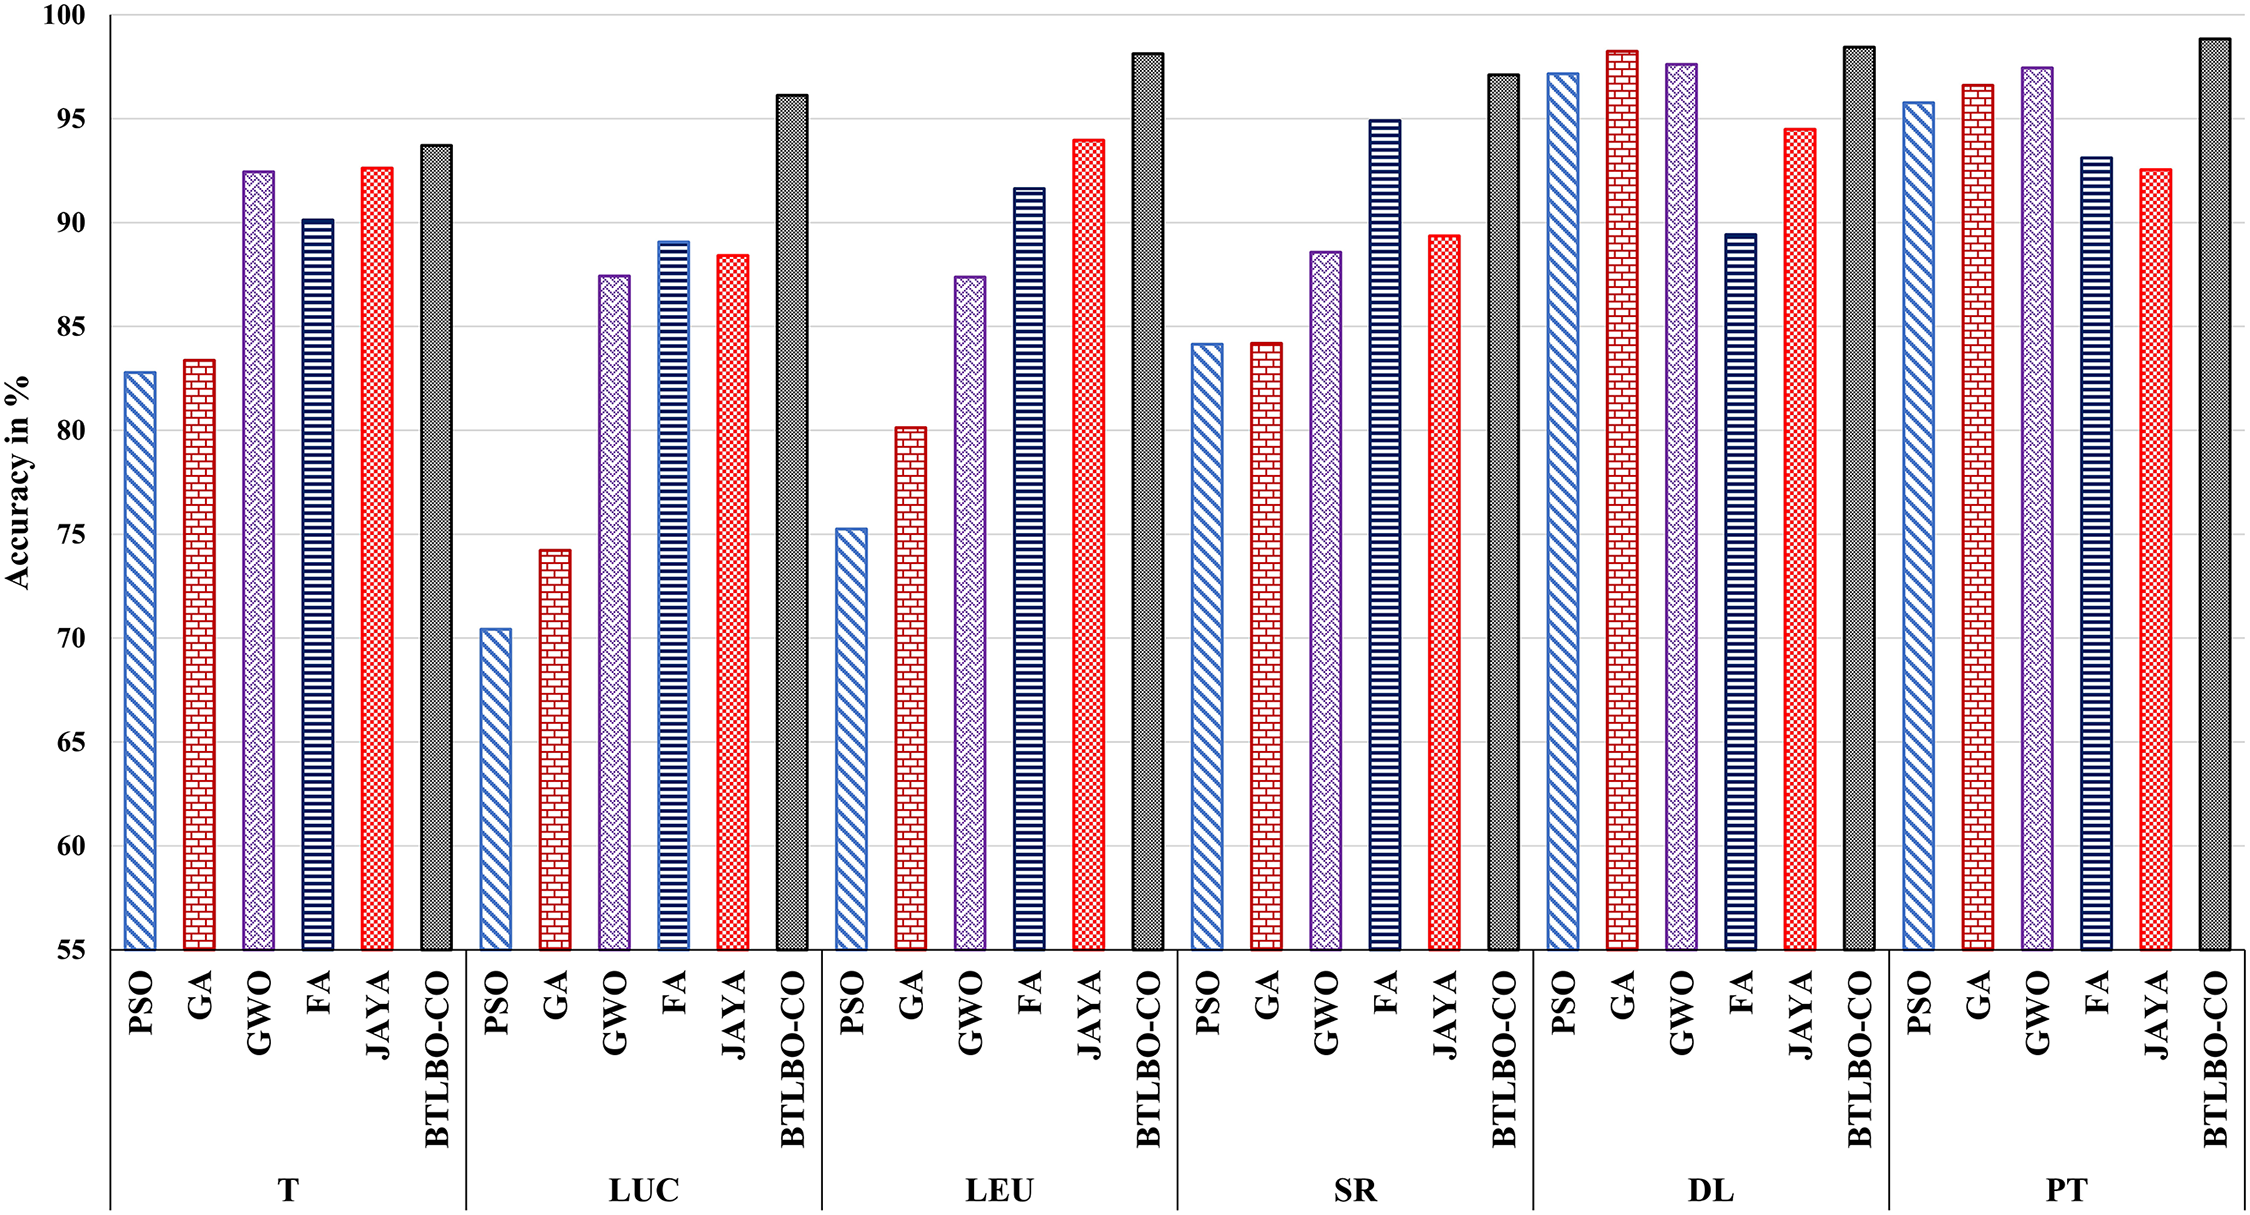
Figure 4: Performance comparison of the proposed BTLBO-CO model against traditional optimization-based classifiers (PSO, GA, GWO, JAYA, and FA) across six benchmark datasets
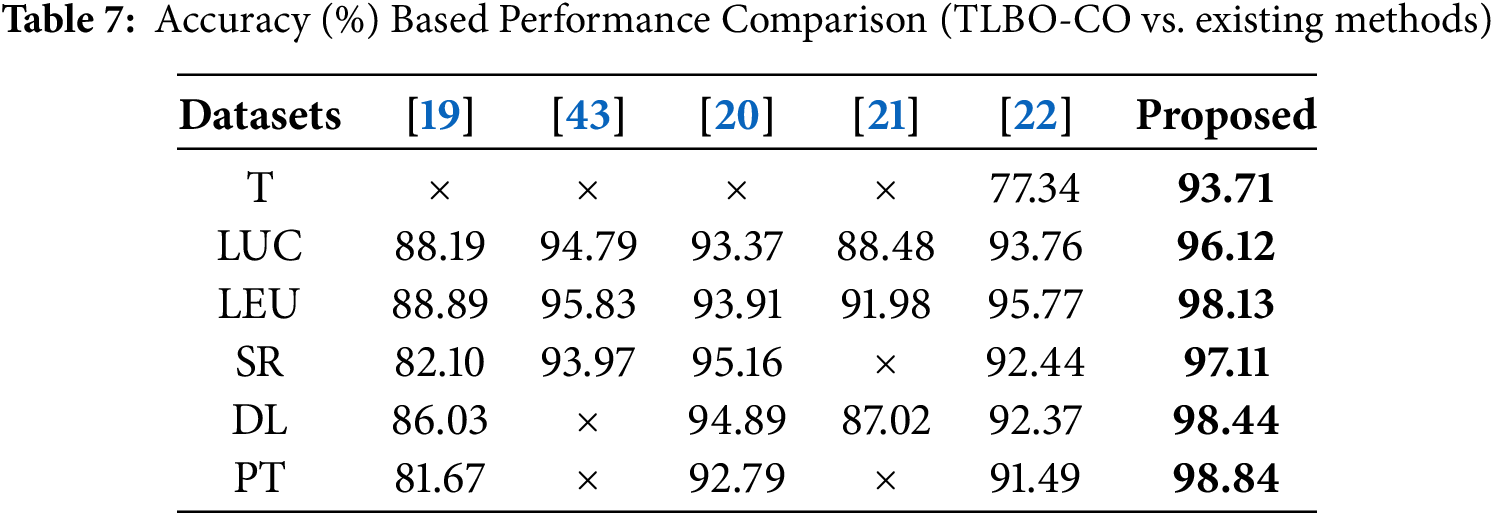
The proposed BTLBO-CO is compared with some existing works to show the efficacy of the proposed model over a diverse set of datasets considered for the current work. Table 7 shows the comparative analysis of the proposed model. The proposed model outperforms [22] by
4.2 Significance of Time Complexity Analysis
The time complexity of a suggested solution is also essential to ascertain its computational efficiency and scalability. It is a theoretical upper bound on how the algorithm’s running time scales with the size of the input, and is essential to compare the performance to existing algorithms. Time complexity is functional for practical implementation, allowing developers to evaluate whether it is feasible for large-scale or even real-world deployment. It also provides proof of concept for the algorithmic construction and a better insight into the algorithm’s inner workings.
The overall time complexity of the proposed BTLBO-CO algorithm is governed by the population size P, the number of generations G, the number of features N, and the cost of fitness evaluation using an SVM classifier with
where
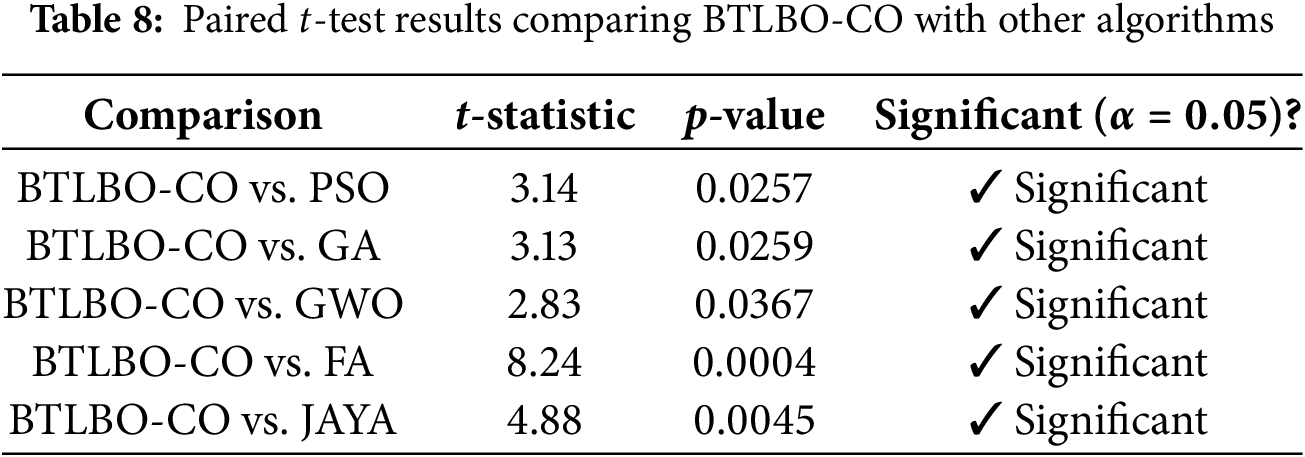
To enhance the credibility of the research, this section provides a statistical analysis of the proposed model with various state-of-the-art models. Paired t-tests and the Friedman test are conducted in this section.
In this test, a comparison is carried out between BTLBO-CO and other traditional models, PSO, GA, GWO, FA, and JAYA. The mean average accuracy of each method is calculated. BTLBO-CO (97.06%) has the highest average accuracy, which already suggests that it outperforms the other algorithms (GWO (91.81%), GA (86.21%), PSO (84.26%), FA(91.37%), JAYA (91.89%)). Table 8 presents the result table for the Paired t-test method. As the p-value achieved is less than 0.05, the performance differences are not random and are statistically significant.
Friedman’s test is used to compare more than two related models. To do this, the ranking of different algorithms is carried out, where the best model (highest accuracy) is evaluated (rank 1) and the worst (rank 6). Tables 9 and 10 show the ranking of different models. Using Friedman’s test formula (presented in Eq. (30)), we found that the
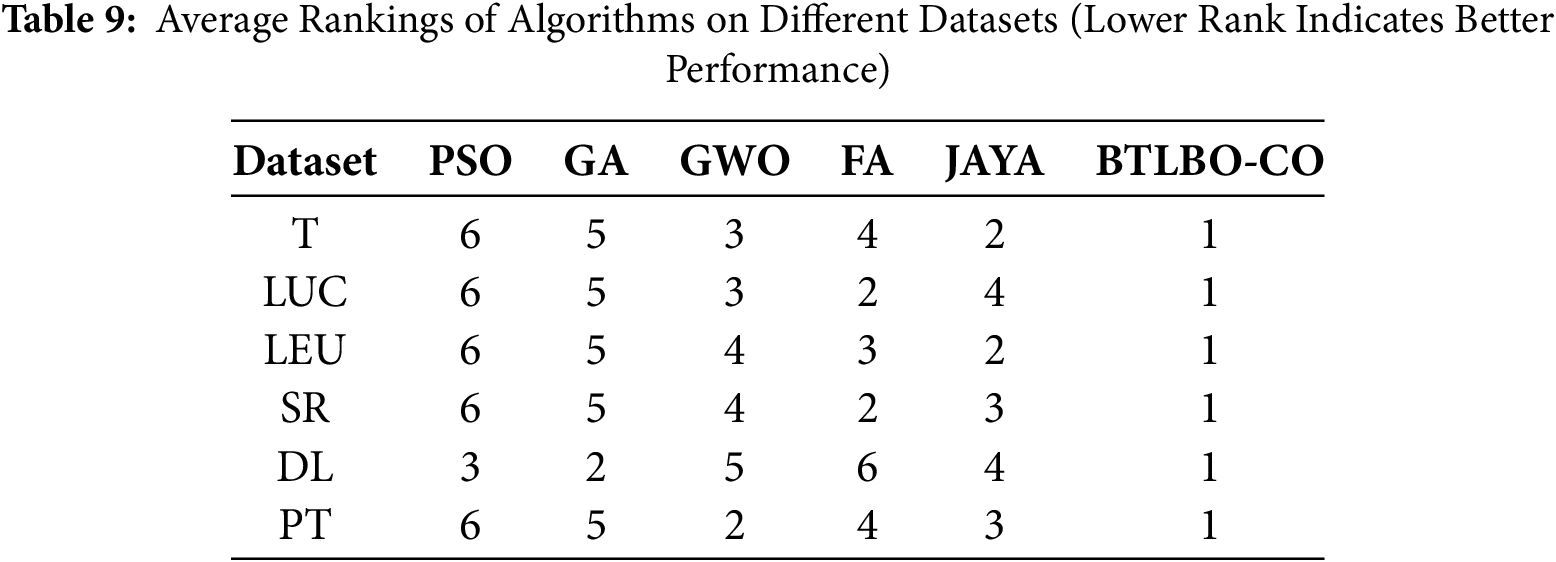
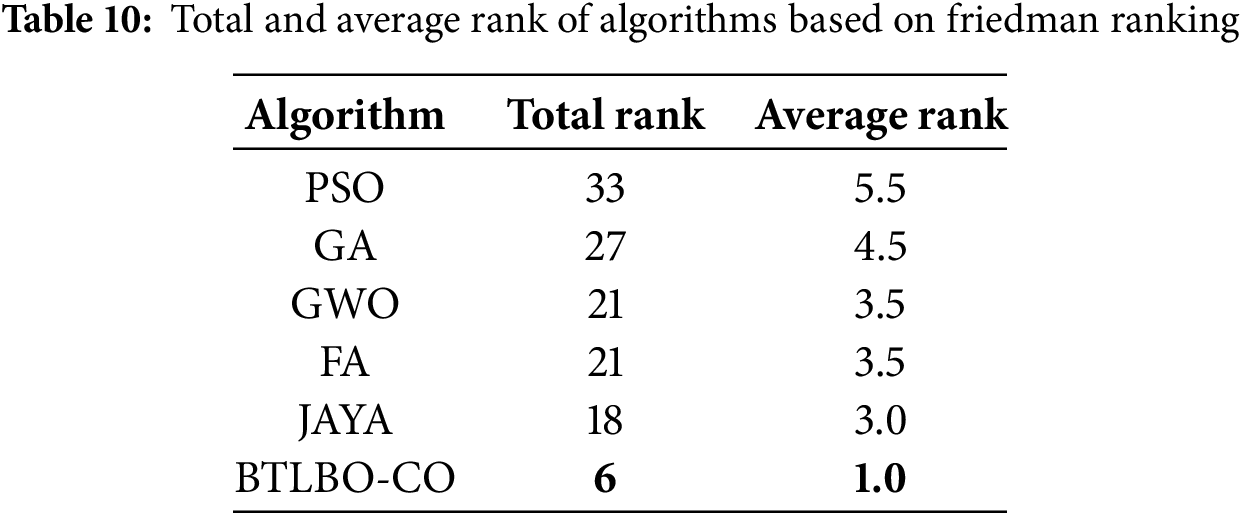
This shows that BTLBO-CO is better than each competitor individually. Here,
This paper proposes a hybrid feature selection model named BTLBO-CO. The multifilter method serves as a filtering technique to choose the most significant characteristics from the dataset. The hybrid BTLBO-CO is subsequently employed to identify the most appropriate feature subset from those previously established using the filter approach. This model has been evaluated on six distinct cancer datasets, including 11_tumors (T), Lung Cancer (LUC), Leukemia (LEU), SRBCT (SR), DLBCL (DL), and Prostate Tumor (PT), to demonstrate its efficacy with cancer datasets. The results demonstrate superior classification accuracy across all six datasets, achieving 93.71%, 96.12%, 98.13%, 97.11%, 98.44%, and 98.84%, respectively. The results analysis validates the model’s effectiveness compared to the benchmark model.
The BTLBO-CO algorithm demonstrated notable efficacy despite the several restrictions included in this investigation. The study is confined to a particular group of six high-dimensional cancer datasets, which may not adequately reflect the diversity of real-world medical data. Secondly, computing performance may still be impeded by exceedingly huge datasets. Moreover, reliance on wrapper-based assessment utilising a classifier may elevate computational cost. The work may be expanded to include multi-objective optimization parameters. Although the current study aims at combining the BTLBO with CO to realize functional feature selection in correlation to the traditional classifiers, the proposed methodology is adaptable to encompass the deep learning techniques. Within the frame of such a hybrid environment, the deep learning techniques, including Convolutional Neural Networks (CNNs), Deep Belief Networks (DBNs), or Autoencoders, may be initially used in order to learn higher-order non-linear representations of raw medical data. These deep feature representations could then be used with BTLBOCO to pick a good subset, which might increase the classification accuracy and generalization property that may be degraded by removing the redundant features or noisy features. Such a coupling can be used to complement the power of cancer typologies that are otherwise more powerful, especially in conditions where the raw data are real, not only heterogeneous but also high-dimensional. Nevertheless, deeper learning would necessitate the need for bigger annotated datasets and more computing resources, which cannot always be available in any clinical setting. Investigation into such deep learning hybrid frameworks can therefore form a potential line of future research.
Acknowledgement: The authors extend their appreciation to the Deanship of Research and Graduate Studies at King Khalid University for funding this work.
Funding Statement: The work was funded by the Deanship of Research and Graduate Studies at King Khalid University through the Large Research Project under grant number RGP2/417/46.
Author Contributions: Bibhuprasad Sahu, Amrutanshu Panigrahi, Abhilash Pati, Ashis Kumar Pati, and Janmejaya Mishra worked on conceptualization, methodology, software, validation, formal analysis, data collection & analysis, and manuscript writing. Naim Ahmad, Salman Arafath Mohammed, and Saurav Mallik worked on manuscript editing, validation, supervision, and methodology design. All authors reviewed the results and approved the final version of the manuscript.
Availability of Data and Materials: The dataset used for this study is available online in the “Mendeley Data” repository (entitled as “Data for: Gene Selection and Classification of Microarray Data Method Based on Mutual Information and Moth Flame Algorithm”), https://data.mendeley.com/datasets/fhx5zgx2zj/1 (accessed on 25 January 2025).
Ethics Approval: Not applicable.
Conflicts of Interest: The authors declare no conflicts of interest to report regarding the present study.
References
1. Kumar M, Rath SK. Classification of microarray using MapReduce based proximal support vector machine classifier. Knowl-Based Syst. 2015;89(5439):584–602. doi:10.1016/j.knosys.2015.09.005. [Google Scholar] [CrossRef]
2. Dash M, Liu H. Feature selection for classification. Intell Data Anal. 1997;1(1–4):131–56. doi:10.1016/s1088-467x(97)00008-5. [Google Scholar] [CrossRef]
3. Li J, Cheng K, Wang S, Morstatter F, Trevino RP, Tang J, et al. Feature selection: a data perspective. ACM Comput Surv (CSUR). 2017;50(6):1–45. doi:10.1145/3136625. [Google Scholar] [CrossRef]
4. Che J, Yang Y, Li L, Bai X, Zhang S, Deng C. Maximum relevance minimum common redundancy feature selection for nonlinear data. Inform Sci. 2017;409(4):68–86. doi:10.1016/j.ins.2017.05.013. [Google Scholar] [CrossRef]
5. Ekbal A, Saha S. Joint model for feature selection and parameter optimization coupled with classifier ensemble in chemical mention recognition. Knowl-Based Syst. 2015;85(2):37–51. doi:10.1016/j.knosys.2015.04.015. [Google Scholar] [CrossRef]
6. Lozano M, García-Martínez C. Hybrid metaheuristics with evolutionary algorithms specializing in intensification and diversification: overview and progress report. Comput Operat Res. 2010;37(3):481–97. doi:10.1016/j.cor.2009.02.010. [Google Scholar] [CrossRef]
7. Panigrahi A, Pati A, Sahu B, Das MN, Nayak DSK, Sahoo G, et al. En-MinWhale: an ensemble approach based on MRMR and whale optimization for cancer diagnosis. IEEE Access. 2023;11:113526–42. doi:10.1109/access.2023.3318261. [Google Scholar] [CrossRef]
8. Senawi A, Wei HL, Billings SA. A new maximum relevance-minimum multicollinearity (MRmMC) method for feature selection and ranking. Pattern Recogn. 2017;67(1):47–61. doi:10.1016/j.patcog.2017.01.026. [Google Scholar] [CrossRef]
9. Pashaei E, Pashaei E. Hybrid binary COOT algorithm with simulated annealing for feature selection in high-dimensional microarray data. Neural Comput Appl. 2023;35(1):353–74. doi:10.1007/s00521-022-07780-7. [Google Scholar] [CrossRef]
10. Karlupia N, Abrol P. Wrapper-based optimized feature selection using nature-inspired algorithms. Neural Comput Appl. 2023;35(17):12675–89. doi:10.1007/s00521-023-08383-6. [Google Scholar] [CrossRef]
11. Alweshah M, Alkhalaileh S, Albashish D, Mafarja M, Bsoul Q, Dorgham O. A hybrid mine blast algorithm for feature selection problems. Soft Comput. 2021;25(1):517–34. doi:10.1007/s00500-020-05164-4. [Google Scholar] [CrossRef]
12. Bhattacharyya T, Chatterjee B, Singh PK, Yoon JH, Geem ZW, Sarkar R. Mayfly in harmony: a new hybrid meta-heuristic feature selection algorithm. IEEE Access. 2020;8:195929–45. doi:10.1109/access.2020.3031718. [Google Scholar] [CrossRef]
13. Rizk-Allah RM, Hassanien AE. A comprehensive survey on the sine-cosine optimization algorithm. Artif Intell Rev. 2023;56(6):4801–58. doi:10.1007/s10462-022-10277-3. [Google Scholar] [CrossRef]
14. Hans R, Kaur H. Hybrid binary Sine Cosine Algorithm and Ant Lion Optimization (SCALO) approaches for feature selection problem. Int J Comput Mater Sci Eng. 2020;9(1):1950021. doi:10.1142/s2047684119500210. [Google Scholar] [CrossRef]
15. Yaqoob A, Verma NK, Aziz RM. Optimizing gene selection and cancer classification with hybrid sine cosine and cuckoo search algorithm. J Med Syst. 2024;48(1):10. doi:10.21203/rs.3.rs-3357558/v1. [Google Scholar] [CrossRef]
16. Emam MM, Houssein EH, Samee NA, Alkhalifa AK, Hosney ME. Optimizing cancer diagnosis: a hybrid approach of genetic operators and Sinh Cosh Optimizer for tumor identification and feature gene selection. Comput Biol Med. 2024;180(1):108984. doi:10.1016/j.compbiomed.2024.108984. [Google Scholar] [PubMed] [CrossRef]
17. Al-Wajih R, Abdulkadir SJ, Aziz N, Al-Tashi Q, Talpur N. Hybrid binary grey wolf with Harris hawks optimizer for feature selection. IEEE Access. 2021;9:31662–77. doi:10.1109/access.2021.3060096. [Google Scholar] [CrossRef]
18. Alhussan AA, Abdelhamid AA, Towfek S, Ibrahim A, Eid MM, Khafaga DS, et al. Classification of diabetes using feature selection and hybrid Al-Biruni earth radius and dipper throated optimization. Diagnostics. 2023;13(12):2038. doi:10.3390/diagnostics13122038. [Google Scholar] [PubMed] [CrossRef]
19. Rostami M, Forouzandeh S, Berahmand K, Soltani M. Integration of multi-objective PSO based feature selection and node centrality for medical datasets. Genomics. 2020;112(6):4370–84. doi:10.1016/j.ygeno.2020.07.027. [Google Scholar] [PubMed] [CrossRef]
20. Abdulwahab HM, Ajitha S, Saif MAN, Murshed BAH, Ghanem FA. MOBCSA: multi-objective binary cuckoo search algorithm for features selection in Bioinformatics. IEEE Access. 2024;12:21840–67. doi:10.1109/access.2024.3362228. [Google Scholar] [CrossRef]
21. Zhou Y, Zhang W, Kang J, Zhang X, Wang X. A problem-specific non-dominated sorting genetic algorithm for supervised feature selection. Inform Sci. 2021;547(2):841–59. doi:10.1016/j.ins.2020.08.083. [Google Scholar] [CrossRef]
22. Nssibi M, Manita G, Chhabra A, Mirjalili S, Korbaa O. Gene selection for high dimensional biological datasets using hybrid island binary artificial bee colony with chaos game optimization. Artif Intell Rev. 2024;57(3):51. doi:10.1007/s10462-023-10675-1. [Google Scholar] [CrossRef]
23. Shahbeig S, Helfroush MS, Rahideh A. A fuzzy multi-objective hybrid TLBO-PSO approach to select the associated genes with breast cancer. Signal Process. 2017;131:58–65. doi:10.1016/j.sigpro.2016.07.035. [Google Scholar] [CrossRef]
24. Preethi I, Dharmarajan K. A hybrid wrapper approach for optimal feature selection based on a novel multiobjective technique. Int J Syst Syst Eng. 2023;13(3):284–305. doi:10.1504/ijsse.2023.133014. [Google Scholar] [CrossRef]
25. Rezaei K, Fard OS. Multi-strategy enhanced Marine Predators Algorithm with applications in engineering optimization and feature selection problems. Appl Soft Comput. 2024;159(1):111650. doi:10.1016/j.asoc.2024.111650. [Google Scholar] [CrossRef]
26. Kang Y, Wang H, Pu B, Tao L, Chen J, Yu PS. A hybrid two-stage teaching-learning-based optimization algorithm for feature selection in bioinformatics. IEEE/ACM Transa Comput Biology Bioinform. 2022;20(3):1746–60. doi:10.1109/tcbb.2022.3215129. [Google Scholar] [PubMed] [CrossRef]
27. Pan L, Cheng WL, Lim WH, Sharma A, Jately V, Tiang SS, et al. A robust wrapper-based feature selection technique based on modified teaching learning based optimization with hierarchical learning scheme. Eng Sci Technol Int J. 2025;61(1):101935. doi:10.1016/j.jestch.2024.101935. [Google Scholar] [CrossRef]
28. Thawkar S. A hybrid model using teaching-learning-based optimization and Salp swarm algorithm for feature selection and classification in digital mammography. J Ambient Intell Human Comput. 2021;12(9):8793–808. doi:10.1007/s12652-020-02662-z. [Google Scholar] [CrossRef]
29. Toumaj S, Heidari A, Shahhosseini R, Jafari Navimipour N. Applications of deep learning in Alzheimer’s disease: a systematic literature review of current trends, methodologies, challenges, innovations, and future directions. Artif Intell Rev. 2024;58(2):44. doi:10.1007/s10462-024-11041-5. [Google Scholar] [CrossRef]
30. Wang H, Toumaj S, Heidari A, Souri A, Jafari N, Jiang Y. Neurodegenerative disorders: a Holistic study of the explainable artificial intelligence applications. Eng Appl Artif Intell. 2025;153(3):110752. doi:10.1016/j.engappai.2025.110752. [Google Scholar] [CrossRef]
31. Shamas S, Panda SN, Sharma I, Guleria K, Singh A, AlZubi AA, et al. An improved lung cancer segmentation based on nature-inspired optimization approaches. Comput Model Eng Sci. 2024;138(2):1051–75. doi:10.32604/cmes.2023.030712. [Google Scholar] [CrossRef]
32. Das S, Rout SK, Panda SK, Mohapatra PK, Almazyad AS, Jasser MB, et al. Marine predators algorithm with deep learning-based leukemia cancer classification on medical images. Comput Model Eng Sci. 2024;141(1):893–916. doi:10.32604/cmes.2024.051856. [Google Scholar] [CrossRef]
33. Özbay FA, Özbay E, Gharehchopogh FS. An improved artificial rabbits optimization algorithm with chaotic local search and opposition-based learning for engineering problems and its applications in breast cancer problem. Comput Model Engi Sci. 2024;141(2):1067–110. doi:10.32604/cmes.2024.054334. [Google Scholar] [CrossRef]
34. Khanna M, Singh LK, Shrivastava K, Singh R. An enhanced and efficient approach for feature selection for chronic human disease prediction: a breast cancer study. Heliyon. 2024;10(5):e26799. doi:10.1016/j.heliyon.2024.e26799. [Google Scholar] [PubMed] [CrossRef]
35. Malkauthekar M, Gulve A, Deshmukh R. A novel Probabilistic Bi-Level Teaching-Learning-Based Optimization (P-BTLBO) algorithm for hybrid feature extraction and multi-class brain tumor classification using ResNet-50 and GLCM. J Eng Appl Sci. 2025;72(1):103. doi:10.1186/s44147-025-00671-3. [Google Scholar] [CrossRef]
36. Bandaru SB, Natarajasivan D, Rama Mohan Babu G. An optimized deep learning techniques for analyzing mammograms. Int J Comput Sci Netw Secur. 2023;23(7):39–48. [Google Scholar]
37. Zhong K, Luo Q, Zhou Y, Jiang M. TLMPA: teaching-learning-based Marine Predators algorithm. Aims Math. 2021;6(2):1395–442. doi:10.3934/math.2021087. [Google Scholar] [CrossRef]
38. Aljanabi M, Ismail MA, Mezhuyev V. Improved TLBO-JAYA algorithm for subset feature selection and parameter optimisation in intrusion detection system. Complexity. 2020;2020(1):5287684. doi:10.1155/2020/5287684. [Google Scholar] [CrossRef]
39. Rao RV, Patel V. An elitist teaching-learning-based optimization algorithm for solving complex constrained optimization problems. Int J Ind Eng Comput. 2012;3(4):535–60. doi:10.1080/0305215x.2016.1164855. [Google Scholar] [CrossRef]
40. Akbari MA, Zare M, Azizipanah-Abarghooee R, Mirjalili S, Deriche M. The cheetah optimizer: a nature-inspired metaheuristic algorithm for large-scale optimization problems. Sci Rep. 2022;12(1):10953. doi:10.1038/s41598-022-14338-z. [Google Scholar] [PubMed] [CrossRef]
41. Azarshab M, Fathian M, Amiri B. An enhanced Teaching-Learning-Based Optimization (TLBO) with Grey Wolf Optimizer (GWO) for text feature selection and clustering. arXiv:2402.11839. 2024. [Google Scholar]
42. Allam M, Nandhini M. Optimal feature selection using binary teaching learning based optimization algorithm. J King Saud Univ-Comput Inform Sci. 2022;34(2):329–41. doi:10.1016/j.jksuci.2018.12.001. [Google Scholar] [CrossRef]
43. Sahu B, Dash S. Hybrid binary grey wolf with jaya optimizer for biomarker selection from cancer datasets. In: 2023 International Conference on Emerging Smart Computing and Informatics (ESCI); 2023 Mar 1–3; Pune, India. p. 1–6. [Google Scholar]
Cite This Article
 Copyright © 2025 The Author(s). Published by Tech Science Press.
This work is licensed under a Creative Commons Attribution 4.0 International License , which permits unrestricted use, distribution, and reproduction in any medium, provided the original work is properly cited.
 Downloads
 Citation Tools