
 Submit a Paper
 Propose a Special lssue
 Open Access
ARTICLE

A Hybrid Machine Learning and Fractional-Order Dynamical Framework for Multi-Scale Prediction of Breast Cancer Progression
1 Mathematics Research Center, Near East University TRNC, Mersin 10, Nicosia, 99138, Turkey
2 Research Center of Applied Mathematics, Khazar University, Baku, AZ1096, Azerbaijan
3 Department of Civil Engineering, Faculty of Engineering, FEQS INTI-IU, University, Nilai, 71800, Malaysia
4 Faculty of Management, Shinawatra University, Pathum, 12160, Thani, Thailand
* Corresponding Author: David Amilo. Email:
(This article belongs to the Special Issue: Innovative Applications of Fractional Modeling and AI for Real-World Problems)
Computer Modeling in Engineering & Sciences 2025, 145(2), 2189-2222. https://doi.org/10.32604/cmes.2025.070298
Received 12 July 2025; Accepted 04 September 2025; Issue published 26 November 2025
 View Full Text
 Download PDF
Abstract
Breast cancer’s heterogeneous progression demands innovative tools for accurate prediction. We present a hybrid framework that integrates machine learning (ML) and fractional-order dynamics to predict tumor growth across diagnostic and temporal scales. On the Wisconsin Diagnostic Breast Cancer dataset, seven ML algorithms were evaluated, with deep neural networks (DNNs) achieving the highest accuracy (97.72%). Key morphological features (area, radius, texture, and concavity) were identified as top malignancy predictors, aligning with clinical intuition. Beyond static classification, we developed a fractional-order dynamical model using Caputo derivatives to capture memory-driven tumor progression. The model revealed clinically interpretable patterns: lower fractional orders correlated with prolonged aggressive growth, while higher orders indicated rapid stabilization, mimicking indolent subtypes. Theoretical analyses were rigorously proven, and numerical simulations closely fit clinical data. The framework’s clinical utility is demonstrated through an interactive graphics user interface (GUI) that integrates real-time risk assessment with growth trajectory simulations.Keywords
Breast cancer continues to be a major global health challenge, with complex biological behaviors that make accurate prediction of disease progression particularly difficult [1–5]. The disease’s heterogeneity manifests not only in its molecular subtypes but also in its highly variable growth patterns and treatment responses [6,7]. Current diagnostic methods, while effective for detection, often struggle to provide comprehensive insights into the dynamic nature of tumor evolution [8,9]. This limitation has spurred significant interest in developing more sophisticated analytical approaches that can bridge the gap between immediate diagnostic needs and long-term prognostic predictions, particularly through the integration of computational methods with biological insights. The emergence of machine learning in medical diagnostics has revolutionized the approach to cancer classification [10–12]. These data-driven methods excel at identifying complex patterns in high-dimensional datasets, enabling highly accurate differentiation between malignant and benign lesions. Various algorithms, from traditional logistic regression to advanced deep neural networks, have demonstrated impressive performance in breast cancer diagnosis [13,14]. For instance, the study in [15] presented an AI-assisted deep learning model for early melanoma detection that achieved high accuracy while demonstrating potential for clinical implementation. However, while these models provide excellent snapshots of disease state at a given moment, they typically cannot model the temporal dynamics of tumor progression. This represents a significant limitation, as understanding how a tumor evolves is crucial for predicting its future behavior and selecting optimal treatment strategies. The static nature of conventional machine learning approaches contrasts with the dynamic reality of cancer biology, where past states continuously influence future progression. Mathematical modeling has been instrumental in analyzing a wide range of phenomena and practical applications [16–19]. They also offer complementary strengths to machine learning by providing frameworks to simulate biological processes over time [20–22]. Traditional differential equation models have been widely used to describe tumor growth dynamics [23]; however, they often rely on simplifying assumptions that may not fully capture the complexity of real-world cancer progression. This is where fractional calculus presents an intriguing alternative. Unlike classical calculus, fractional-order models incorporate memory effects and long-range dependencies, which align well with the observed behavior of biological systems [24–26], and have shown value across multiple disciplines [27–29]. The ability to account for historical influences on current growth patterns makes fractional calculus particularly suitable for modeling cancer progression, where a tumor’s past states significantly impact its future development. Recent applications of fractional-order models in biology and medicine have shown promising results, though their integration with data-driven approaches remains underexplored [30,31]. Recent advances have demonstrated the potential of combining these approaches. The authors in [32] developed a novel approach using a fractional recurrent neural network (RNN) to achieve observer-based synchronization in a fractional-order chaotic cancer cell model, while research [33] proposed a mathematical model integrated with machine learning techniques that achieved 97.65% accuracy in breast cancer prediction. Despite these advances, a critical gap remains in developing a unified framework that combines machine learning’s diagnostic precision with fractional calculus’s ability to model progression dynamics while maintaining clinical interpretability and utility.
Our work addresses this gap through a novel hybrid framework that begins with comprehensive machine learning analysis to identify the most predictive diagnostic features, then constructs a fractional-order dynamical system that captures the essential interactions governing tumor progression. This approach allows us to not only classify tumors with high accuracy but also to simulate their likely future behavior under different conditions. A key innovation is our use of the fractional order parameter as a potential biomarker for tumor aggressiveness, where different values correspond to distinct growth patterns observed clinically. The theoretical underpinnings of our model are rigorously developed, with careful attention to ensuring biological plausibility and clinical relevance, including proofs of existence and uniqueness of solutions. Practical implementation is achieved through a user-friendly graphical interface that integrates both classification capabilities and predictive modeling, representing a crucial step in translating complex computational methods into clinically actionable information. The broader implications of this work extend beyond breast cancer, offering a new paradigm for disease modeling that combines data-driven pattern recognition with mechanistic understanding. While advanced computational frameworks like ours aim to improve diagnostic precision, patient attitudes toward cancer management, including complementary and alternative medicine (CAM), remain critical to holistic care. Studies in low-resource settings, such as in [34], exploration of CAM perspectives among Pakistani cancer patients, reveal a gap between technological innovations and patient-centric adoption. Their findings underscore the need for culturally adaptable tools that bridge predictive analytics (like our hybrid ML-fractional model) with patient education, particularly in regions where breast cancer stigma or reliance on CAM may delay evidence-based treatment. By bridging these approaches, we move closer to truly personalized medicine, where treatment strategies can be tailored not just to a patient’s current disease state but to their predicted future progression. The rest of the paper is structured as follows: Section 2 introduces the methodology used in the study, providing the technical foundation for these advances. Section 3 details the various machine learning algorithms employed. In Section 4, the fractional-order modeling is formulated and extensively analyzed with analytic and numerical simulations. The results and implications are discussed in Section 5, while the conclusion, novelty, limitations, and future directions are given in Section 6, demonstrating the potential to transform our approach to breast cancer management.
To investigate the dynamics of breast cancer progression, we developed an integrated analytical framework that combines machine learning classification with fractional-order dynamical modeling, implemented in MATLAB R2021a. This dual approach aims to leverage machine learning’s strength in data-driven pattern recognition alongside fractional calculus’s ability to capture memory-dependent biological processes, ensuring both predictive accuracy and biological interpretability. The methodology links machine learning outputs, such as feature importance, to the parameterization of mechanistic tumor growth models, creating a cohesive pipeline that bridges data science and mathematical biology. The dataset characteristics are summarized in Table 1, with its feature categories described in Table 2. The entire schematic flow is depicted in Fig. 1, with ultrasound image analysis illustrated in Fig. 2, showing a malignant breast tumor via diagnostic and breast ultrasound imaging, adapted from [35], highlighting irregular mass morphology, spiculated margins, and segmentation. The ML research design is illustrated in Fig. 3, with feature importance ranking and cross-validated performance metrics summarized in Tables 3 and 4, respectively. First, a comprehensive feature analysis using machine learning algorithms with the best performing algorithm, then the development of a fractional-order dynamical system informed by machine learning outputs, and finally, clinical implementation and prediction. The process begins with preprocessing the Wisconsin Diagnostic Breast Cancer dataset to ensure data quality and consistency. Subsequently, parallel workflows develop machine learning models for feature identification and fractional-order systems for tumor growth modeling. Machine learning algorithms identify key diagnostic features, which directly inform the parameterization of the fractional-order tumor growth model. This reciprocal relationship ensures that data-driven insights enhance the mechanistic understanding of cancer progression, while the fractional-order model provides interpretable dynamics grounded in biological principles. The resulting framework synthesizes empirical analysis and theoretical modeling, offering a novel paradigm for multi-scale cancer progression analysis with improved predictive performance and clinical applicability.


Figure 1: Schematic of the hybrid framework integrating machine learning (classification) with fractional-order dynamics (tumor progression modeling), showing bidirectional data flow between diagnostic features and growth trajectory predictions

Figure 2: Plot detection of a malignant breast tumor in diagnostic imaging, using an ultrasound image of a malignant tumor from the real dataset [35]. Parameters for segmentation: threshold = 0.7, Sobel edge detection

Figure 3: Machine learning breast cancer diagnostic pipeline


• All features are continuous, real-valued numbers
• Features were computed from digitized images at 8-bit resolution
• Data was collected at the University of Wisconsin Hospitals
• Features represent characteristics of cell nuclei present in the images
• The diagnosis (target) was confirmed by biopsy
The MATLAB code performs the following preprocessing steps:
• Conversion of diagnosis labels to binary (M = 1, B = 0)
• Removal of patient ID column
• Z-score normalization of all features
• SMOTE resampling to address class imbalance
• 5-fold stratified cross-validation
3 Mathematical Formulations of the Machine Learning Models
The machine learning pipeline employs seven distinct algorithms to classify breast tumors, each with rigorous mathematical foundations. Logistic regression establishes a probabilistic framework via sigmoid transformations, while decision trees partition the feature space through recursive impurity minimization. Support vector machines construct optimal hyperplanes using kernel-based transformations, and ensemble methods (random forests, XGBoost) combine weak learners through bagging and gradient boosting. Neural networks implement hierarchical feature learning via layered nonlinear transformations. These formulations collectively enable robust prediction while maintaining interpretability through their mathematical structures.
Here are the enhanced subsections with detailed explanations for all components:
The logistic regression model estimates malignancy probability through the following formulation:
where
•
– 10 core features (radius, texture, perimeter, etc.)
– 3 statistical measures per feature (mean, standard error, worst)
•
–
– Absolute magnitude indicates feature importance
– Sign determines positive/negative correlation with malignancy
•
•
– Bounds output between (0,1) for probability interpretation
– Derivative
The model is trained via maximum likelihood estimation with:
• L2 regularization (ridge penalty) to prevent overfitting:
• Optimized using limited-memory BFGS (L-BFGS) with:
– Line search for step size determination
– History size of 50 past updates for Hessian approximation
• Convergence criteria:
The L-BFGS optimization ensures convergence by approximating the Hessian matrix with a limited-memory update, guaranteeing descent directions [38,39].
The decision tree implements recursive partitioning through:
where
•
– Maximum depth of 30 (early stopped via validation)
– Minimum 5 samples per leaf node
•
•
Splits are determined by Gini impurity minimization:
where
• Q is the data subset at each node
•
• Splits are chosen to maximize impurity reduction:
Advanced features include:
• Cost-complexity pruning with complexity parameter
• Class-weighted splitting for imbalanced data:
The tree provides interpretable decision paths:
where
3.3 Support Vector Machine (SVM)
The Radial Basis Function (RBF) kernel SVM solves the dual optimization problem:
where
•
•
•
•
•
with the RBF kernel:
where
•
•
The decision function is:
where
• SV denotes the set of support vectors (
•
•
An ensemble of
where
• B is the number of trees in the ensemble (set to 100 via cross-validation)
•
Each tree
• Random feature selection at each split (typically
• Gini impurity minimization for split criterion:
where Q is the data subset at each node and
• Maximum tree depth determined by early stopping (typically 10–15 levels)
Key properties:
• Out-of-bag (OOB) samples used for unbiased error estimation
• Feature importance computed via mean decrease in Gini index
• Inherent parallelization during training (trees independent)
Here’s the enhanced XGBoost subsection with detailed explanations of all terms and mechanisms:
3.5 XGBoost (Extreme Gradient Boosting)
The gradient boosted trees model minimizes the following regularized objective function:
where
with
where
–
–
–
–
–
• Each tree
where
• The prediction after K trees is:
Key optimization features:
• Tree Construction: Uses weighted quantile sketch for approximate greedy algorithm
• Split Finding: Evaluates gain score for potential splits:
–
–
–
• Shrinkage: Learning rate
• Column Subsampling: Randomly selects feature subsets to prevent overfitting
Implementation details for breast cancer prediction:
• Early stopping with 50-round patience on validation AUC
• Maximum tree depth of 6 (optimized via cross-validation)
• Learning rate
• Minimum child weight (sum of instance weight Hessian) = 5
• Column subsampling rate = 0.8 per tree
The shallow (2 hidden layers) and deep (4 hidden layers) networks implement:
where
•
•
•
•
•
•
•
•
with layer dimensions:
• Shallow Network (2 hidden layers):
– Layer 1: 128 neurons with dropout (p = 0.2)
– Layer 2: 64 neurons
– Output: 2 neurons (softmax classification)
• Deep Network (4 hidden layers):
– Layers 1–4: 256, 128, 64, 32 neurons
– Dropout (p = 0.3) after first three layers, p = 0.2 after fourth
– Output: 2 neurons (softmax classification)
All models use the categorical cross-entropy loss with L2 regularization:
where
•
•
• Training uses Adam optimizer with default parameters
Key implementation details:
• Batch normalization after each hidden layer
• Dropout rates: 20% for shallow, 30% (first three layers) and 20% (last layer) for deep
• Training for 50 (shallow) and 80 (deep) epochs
• Mini-batch size of 256 samples
• Class-weighted sampling to address imbalance
4 Fractional-Order Tumor Dynamics Model
This section introduces a fractional-order differential system to model breast tumor progression. Unlike classical integer-order models, fractional calculus captures memory effects and long-range dependencies in biological systems, making it particularly suitable for cancer growth dynamics. Fractional derivatives capture memory effects via non-local operators, ideal for tumor growth, where past states influence future progression. Caputo’s definition ensures the physical interpretability of initial conditions [40,41].
4.1 Model Equations (Caputo Fractional Derivative)
The fractional-order model in (26) is constructed and informed by the machine learning algorithm and results in Section 3. The optimized parameters are obtained from fitting the model to the dataset. The system describes interactions between three key tumor features identified in the feature importance analysis (Table 3):
where
where
The Riemann-Liouville integral and Caputo derivative satisfy the following fundamental relation [44,45]:
where
The Caputo operator is chosen because it accommodates classical initial conditions and aligns with biological systems where memory effects depend on past states.
4.1.1 Biological Interpretation
The tumor radius
Table 5 summarizes the model components and their relationships to measurable biological quantities. The fractional derivative

4.2 Functional Analytic Framework
Definition 1. The solution space is
where
This weighted norm construction ensures biological feasibility by enforcing non-negativity of tumor characteristics (radius, texture, concavity), a critical constraint since negative values would lack physical meaning in cancer progression. The exponential weighting accounts for clinical observation that recent tumor states disproportionately influence current growth rates.
Lemma 1. For
1. Semi-group property:
2. Fundamental theorem:
3. Comparison principle: If
These operator properties mirror fundamental cancer behaviors: the semi-group property reflects self-consistent tumor evolution, the fundamental theorem ensures measurable changes from baseline pathology, and the comparison principle permits ranking of tumor aggression levels, analogous to histological grading systems.
Theorem 1 (Existence, Uniqueness, and Positivity). For the fractional tumor system in (26), with initial data
•
•
•
there exists a unique, non-negative solution
Proof. Define the nonlinearities
where
where
where
Define the operator
where L is the Lipschitz constant such that
For non-negative initial data, the right-hand sides satisfy:
•
•
•
By the fractional comparison principle (Lemma 1), solutions remain non-negative.
Using the barrier method with:
and similar bounds for
The contraction mapping guarantees clinically observed tumor trajectory stability, where small measurement errors don’t drastically alter predictions. The non-negativity preservation aligns with radiologically measurable tumor features, while the barrier method’s carrying capacity bound (K) models physiological space constraints in breast tissue
Theorem 2 (Global Asymptotic Stability of Tumor Progression Model). For the fractional-order system (26) with parameters satisfying:
1.
2.
3. Initial conditions
there exists a unique positive equilibrium
Proof. The equilibrium points satisfy the nonlinear algebraic system:
Eq. (30) can be rewritten as:
The nontrivial solution satisfies:
This implicitly defines a function
The Jacobian determinant of
where
After extensive algebraic manipulation and application of Young’s inequalities, we obtain:
where:
Here
Applying the fractional comparison principle and the properties of Mittag-Leffler functions:
where
The equilibrium conditions (28)–(30) encode balanced tumor microenvironments. The exponential convergence rate (
The numerical implementation of our fractional-order tumor model employs a predictor-corrector scheme adapted for Caputo fractional derivatives, implemented in MATLAB R2021a. The complete computational framework consists of the following components: Discretization Scheme:
Predictor Step:
Corrector Step:
4.4.1 Numerical Implementation of the Fractional Tumor Model
The discretized numerical scheme for the Caputo fractional-order system is given by:
Weights Calculation:
Stability Control:
If
Memory Management:
For
The numerical scheme maintains the following properties:
• Conservation of non-negativity:
• Consistency error of order
• Adaptive memory management for computational efficiency
• Built-in stability verification through predictor-corrector difference
The implementation requires the following computational resources per time step:
Fractional Derivative Approximation:
where
Stability Control:
with
Adaptive Step Refinement:
The algorithm implements the following computational workflow:
Initialization:
• Set model parameters
• Define initial conditions
• Initialize time grid
Main Loop:
1. For each fractional order
• Compute predictor
• Solve corrector equation via Newton-Raphson iteration:
• Apply stability correction if
Visualization:
• Generate 2D temporal plots for each state variable
• Construct 3D surface plots showing
• Compute phase portraits for variable pairs
The numerical implementation provides the following key features:
•
• A-stability for
• Memory optimization through variable step-size adaptation
• Parallel computation across
The method preserves the non-negativity of solutions through the modified corrector step:
ensuring biologically realistic simulations.
The schematic diagram in Fig. 1 illustrates the directional flow of information in the hybrid framework, showing how the best-performing machine learning model informs the fractional-order model; from diagnostics, prognostics, to growth trajectory predictions. The comprehensive diagnostic pipeline shown in Fig. 3 demonstrates a systematic approach for breast cancer classification, beginning with data preprocessing and feature engineering before evaluating multiple machine learning models. The feature importance analysis in Fig. 4, and Table 3 reveals that worst-area characteristics dominate predictive power, with Area_worst (0.8659) and Radius_worst (0.8561) emerging as the most significant features, consistent with clinical understanding of tumor morphology. Fig. 5 further visualizes the distribution of these top-ranked features across diagnostic classes, showing a clear separation between malignant and benign cases for the most important predictors. Model performance evaluation, as shown in Table 4, yields important insights, with the deep neural network achieving superior accuracy (0.97716) and F1 score (0.96923) as shown in the cross-validated metrics, while maintaining reasonable computation time (5.3755 s). The confusion matrices in Fig. 6 provide granular detail on classification errors, revealing that most models achieve >95% accuracy with minimal false negatives. The bootstrap error analysis in Fig. 7 provides confidence in model stability, with tight confidence intervals around performance metrics. Correlation analysis of top features in Fig. 8 reveals expected relationships between morphological characteristics while maintaining sufficient independence for effective modeling. The SVM model demonstrates exceptional AUC (0.99572) despite longer training times, suggesting particular strength in probabilistic classification. These results are corroborated by the ROC analysis in Fig. 9a and precision-recall curves in Fig. 9b, which show consistently strong performance across all models, with the neural network and SVM maintaining high true positive rates across various thresholds.

Figure 4: Feature rank analysis
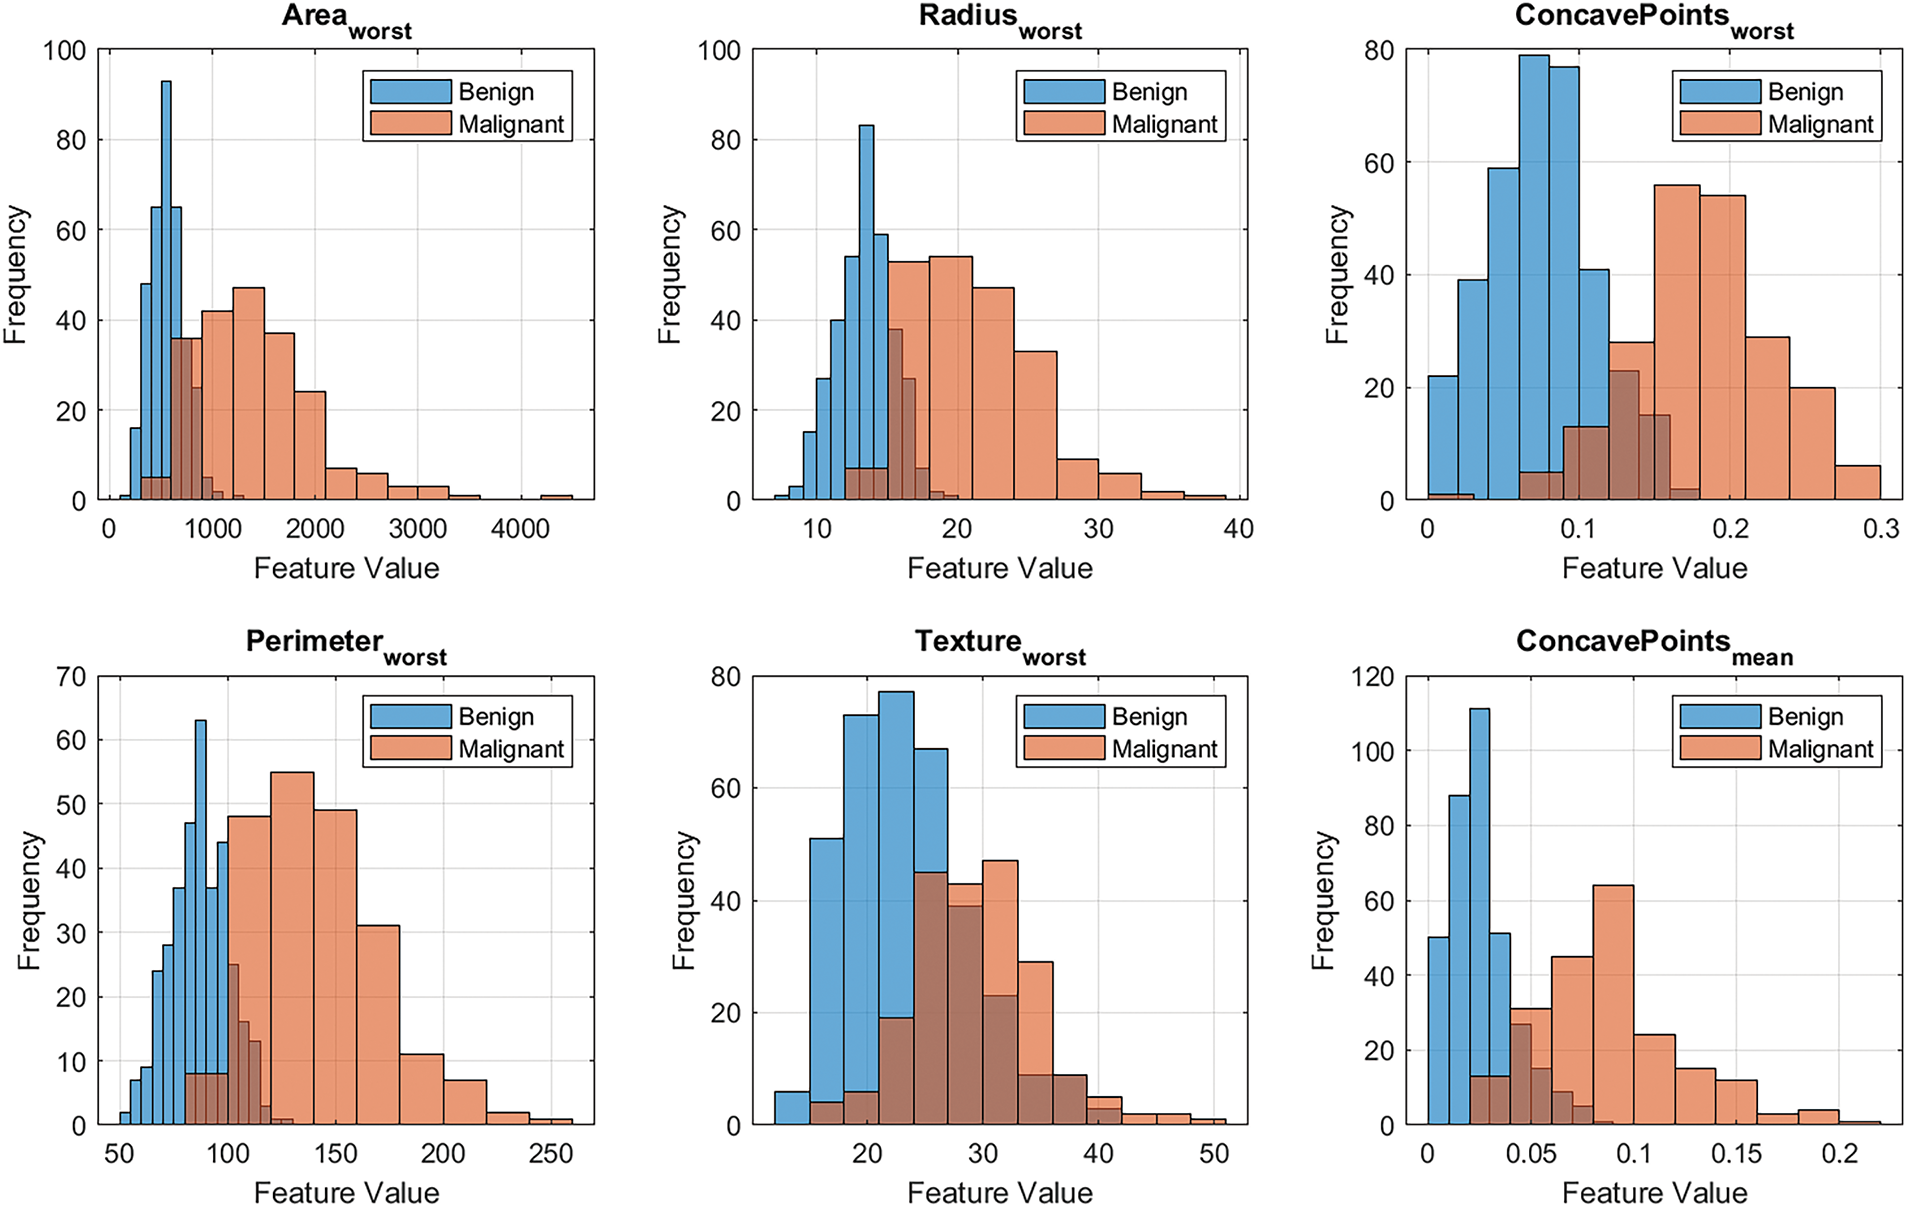
Figure 5: Top 6 ranked feature distribution

Figure 6: Confusion matrix for each model

Figure 7: Bootstrap error analysis (100 iterations)
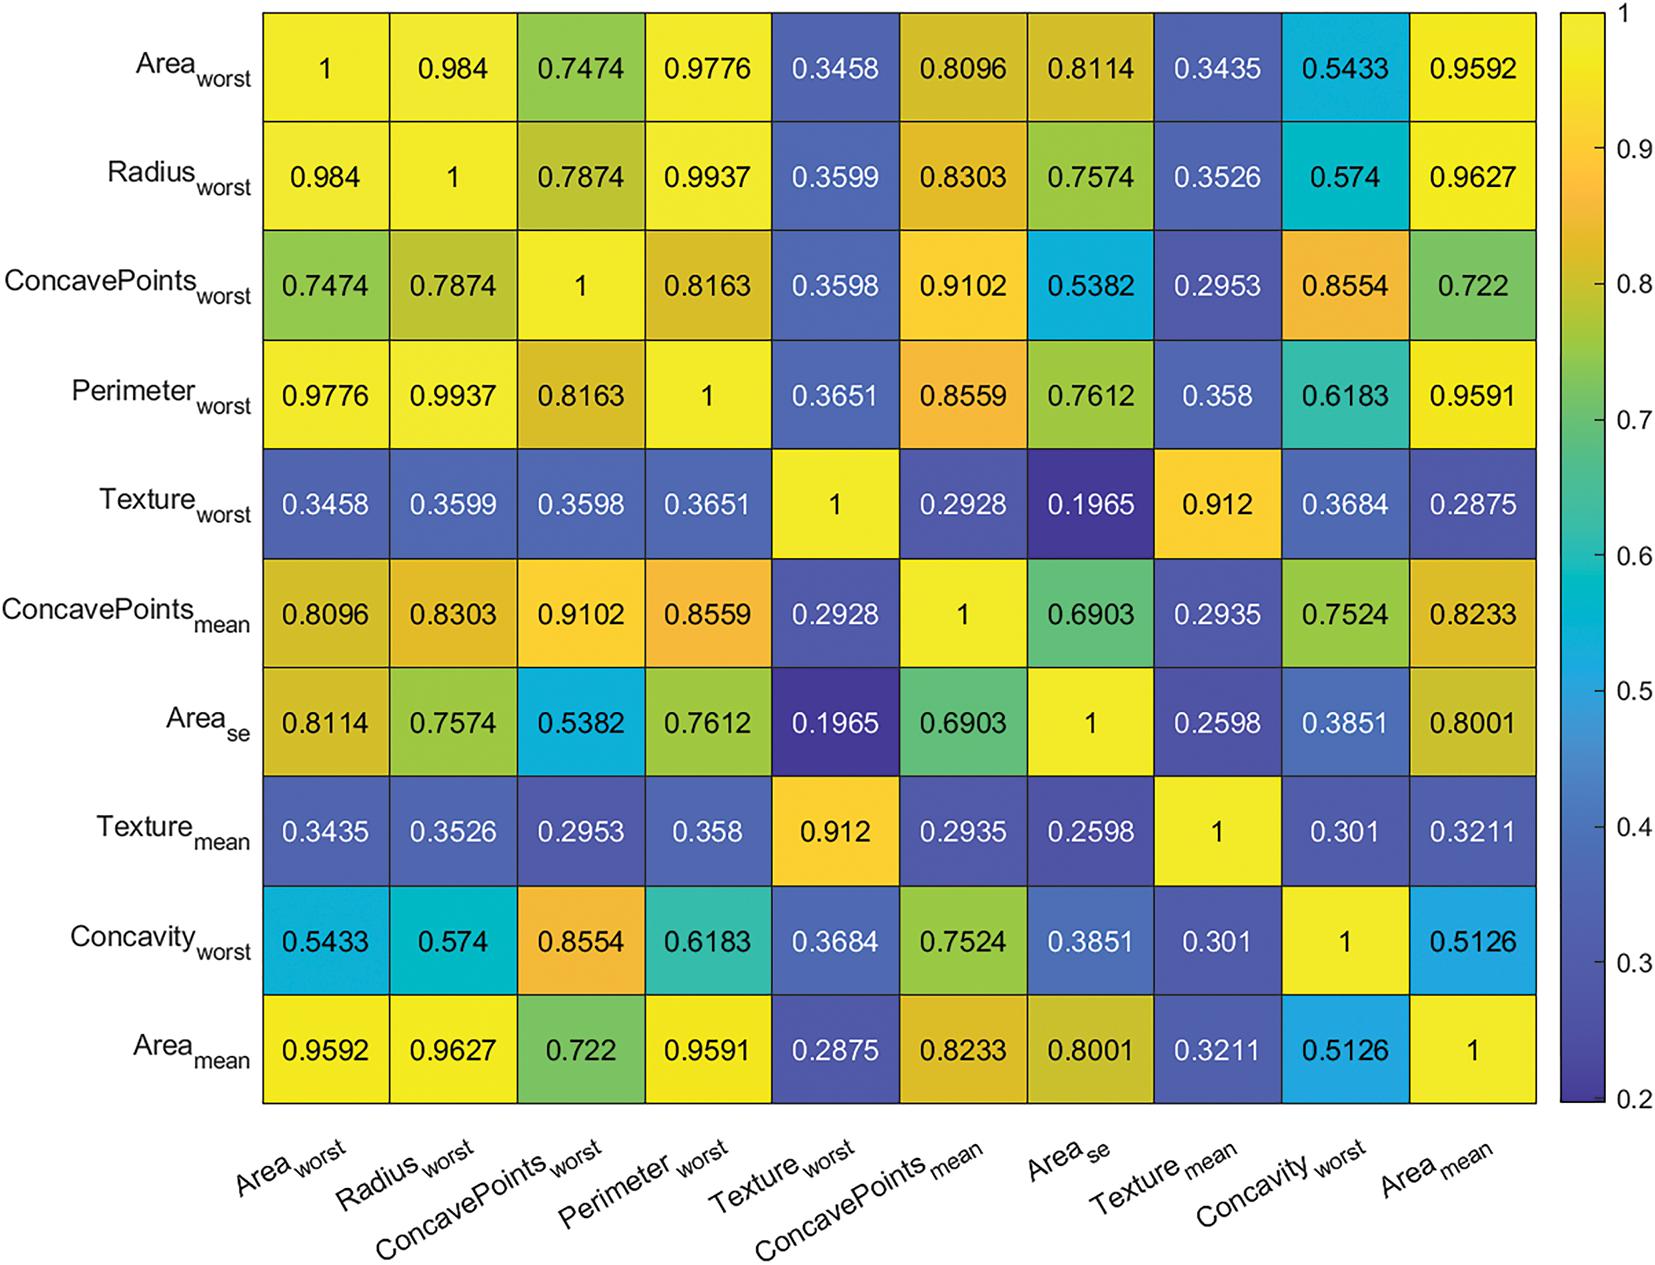
Figure 8: Top ten feature correlation

Figure 9: Metric analysis: (a) ROC Comparison for each model, and (b) Precision-Recall Comparison for each model
The neural network architecture comparison in Fig. 10 illustrates the fundamental differences between shallow and deep approaches, with the deep network’s hierarchical structure enabling more sophisticated feature learning. Fig. 11 compares the decision boundaries of our best-performing shallow and deep neural networks, visualized in the feature space of Area_worst and ConcavePoints_worst. The shallow network (Fig. 11a) demonstrates a relatively larger boundary with moderate curvature, suggesting effective but simpler separation of benign (blue) and malignant (red) cases. In contrast, the deep network (Fig. 11b) exhibits a more strict, non-linear boundary that adapts precisely to local data distributions, particularly in regions where malignant cases exhibit extreme values of both features. The deep network generates a more articulated boundary with localized inflection points that better capture transitional cases. Both models demonstrate strong consensus in high-risk regions. This architectural advantage manifests in the decision boundary plots (Fig. 12), where the deep network captures more complex separations between classes. Feature sensitivity analysis in Fig. 12 confirms that both network types focus primarily on the same key features identified in the importance ranking, though the deep network shows more nuanced interactions between predictors. The implemented graphical user interface, shown in Fig. 13, demonstrates practical clinical applicability, allowing for the integration of these analytical insights into diagnostic workflows with real-time prediction capabilities. The GUI (Fig. 13) integrates real-time risk assessment with growth simulations, enabling clinicians to compare static ML predictions with dynamic trajectories for treatment planning. The feature values are being input, and a diagnosis prediction is being made. These results establish a robust framework for breast cancer diagnosis that strikes a balance between computational efficiency and clinical accuracy. The model fitting results demonstrate robust performance in capturing breast cancer growth dynamics, as evidenced by several quantitative metrics.

Figure 10: Neural network architectures for breast cancer classification: (a) Shallow network with 2 hidden layers (128 and 64 neurons) and 20% dropout; (b) Deep network with 4 hidden layers (256, 128, 64, and 32 neurons) featuring 30% dropout in first three layers and 20% in the last. Node colors indicate layer types: input (blue), hidden (green), and output (red). The visualization shows representative subsets of neurons for clarity, with actual layer sizes noted in parentheses.

Figure 11: Decision boundary comparison plot of Area_worst and ConcavePoints_worst for the best performing models: (a) Shallow Neural Network, and (b) Deep Neural Network

Figure 12: Feature sensitivity comparison plot of best performing models: (a) Shallow Neural Network, and (b) Deep Neural Network
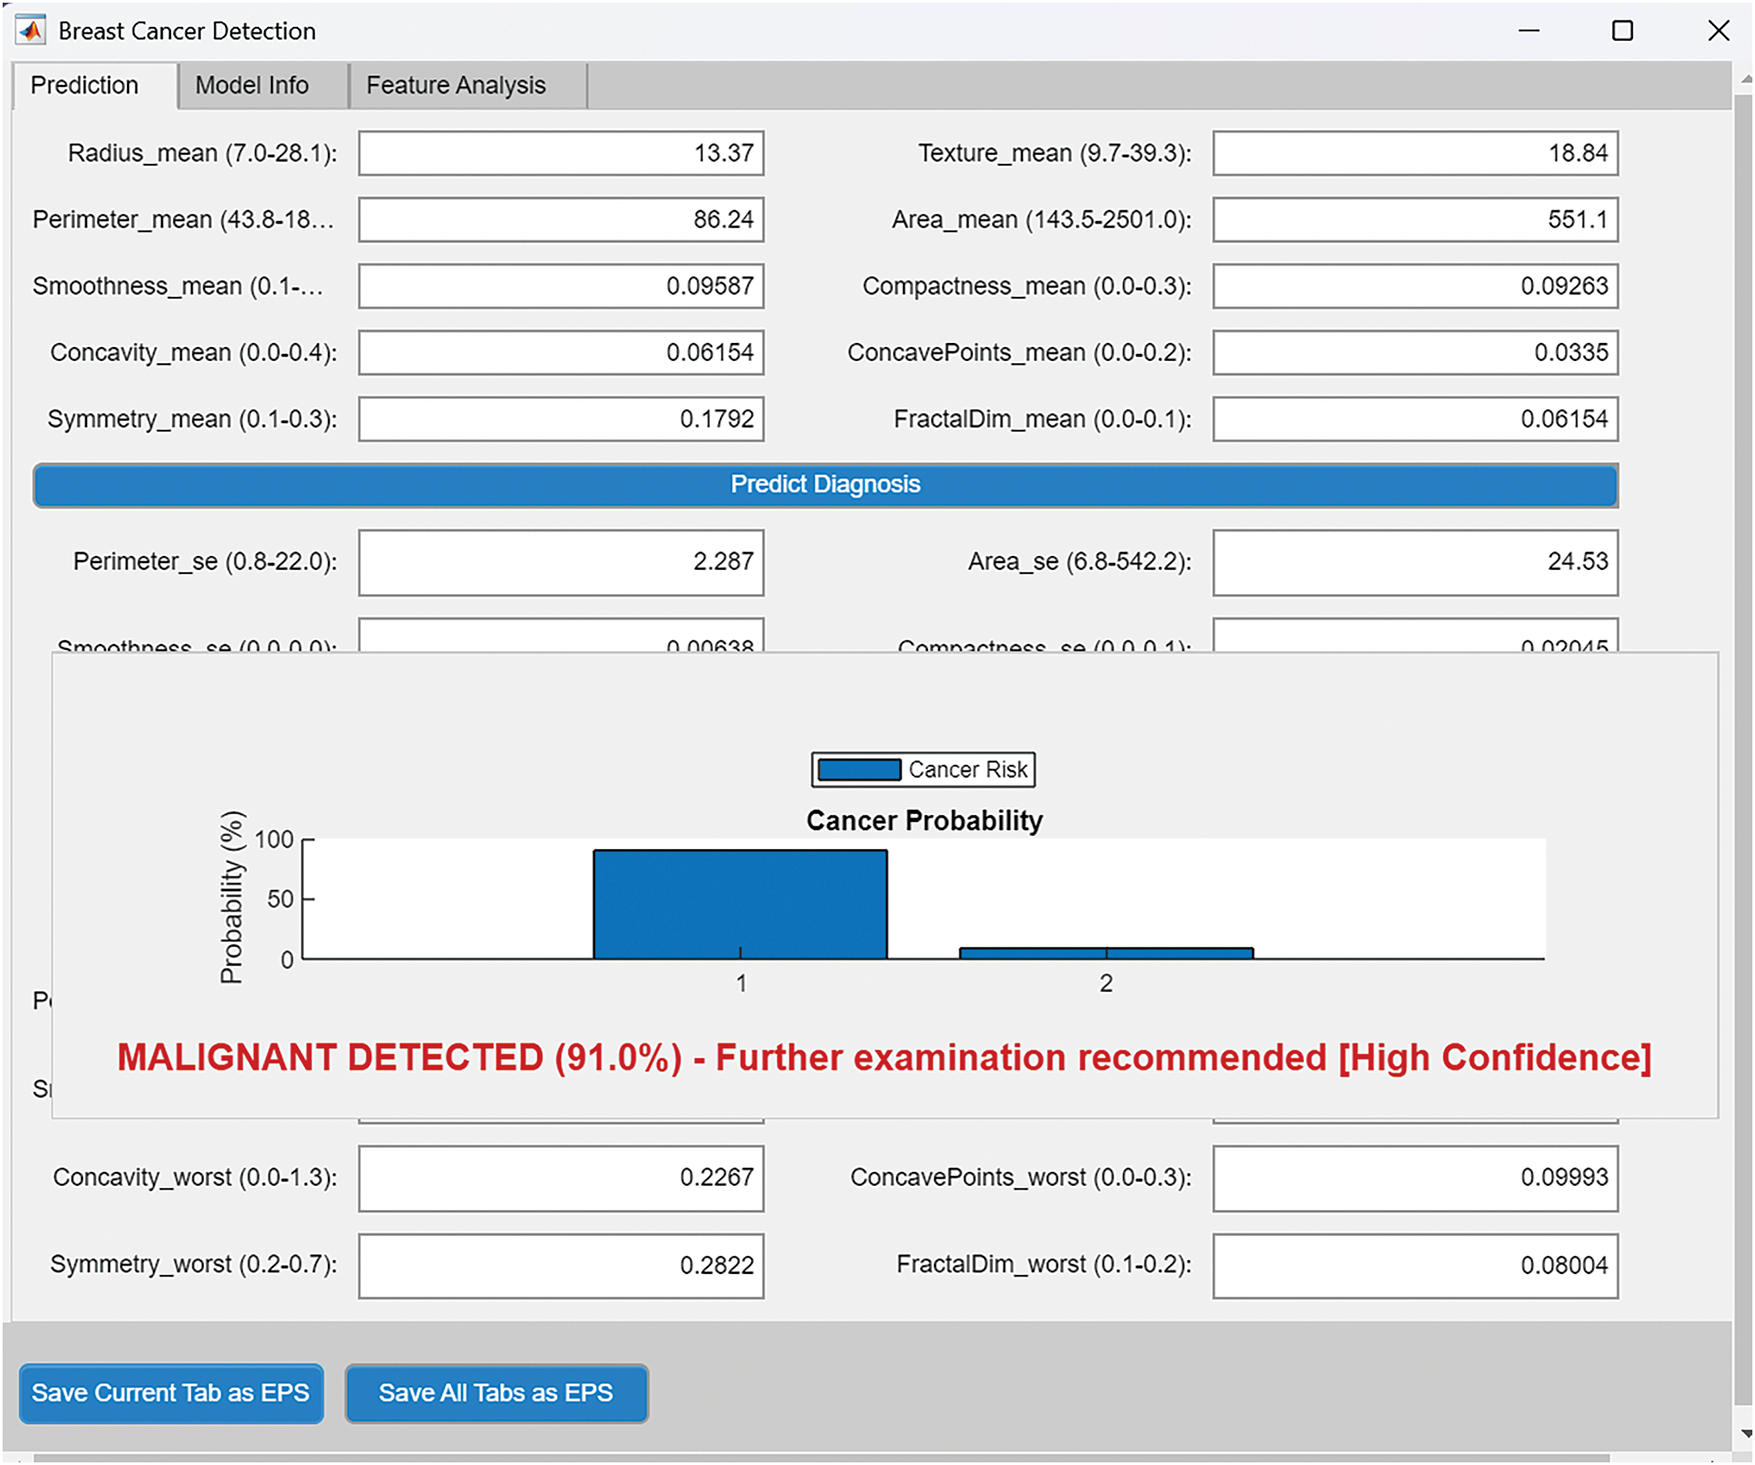
Figure 13: Breast cancer predictor graphics user interface, using the best performing model
The result in Table 6 shows that the optimization process successfully converged with a final error of 0.2877, achieving first-order optimality of


Figure 14: Model fitting to clinical data


Figure 15: Two dimensional plots of the equation dynamics in model (26): (a) Plot of
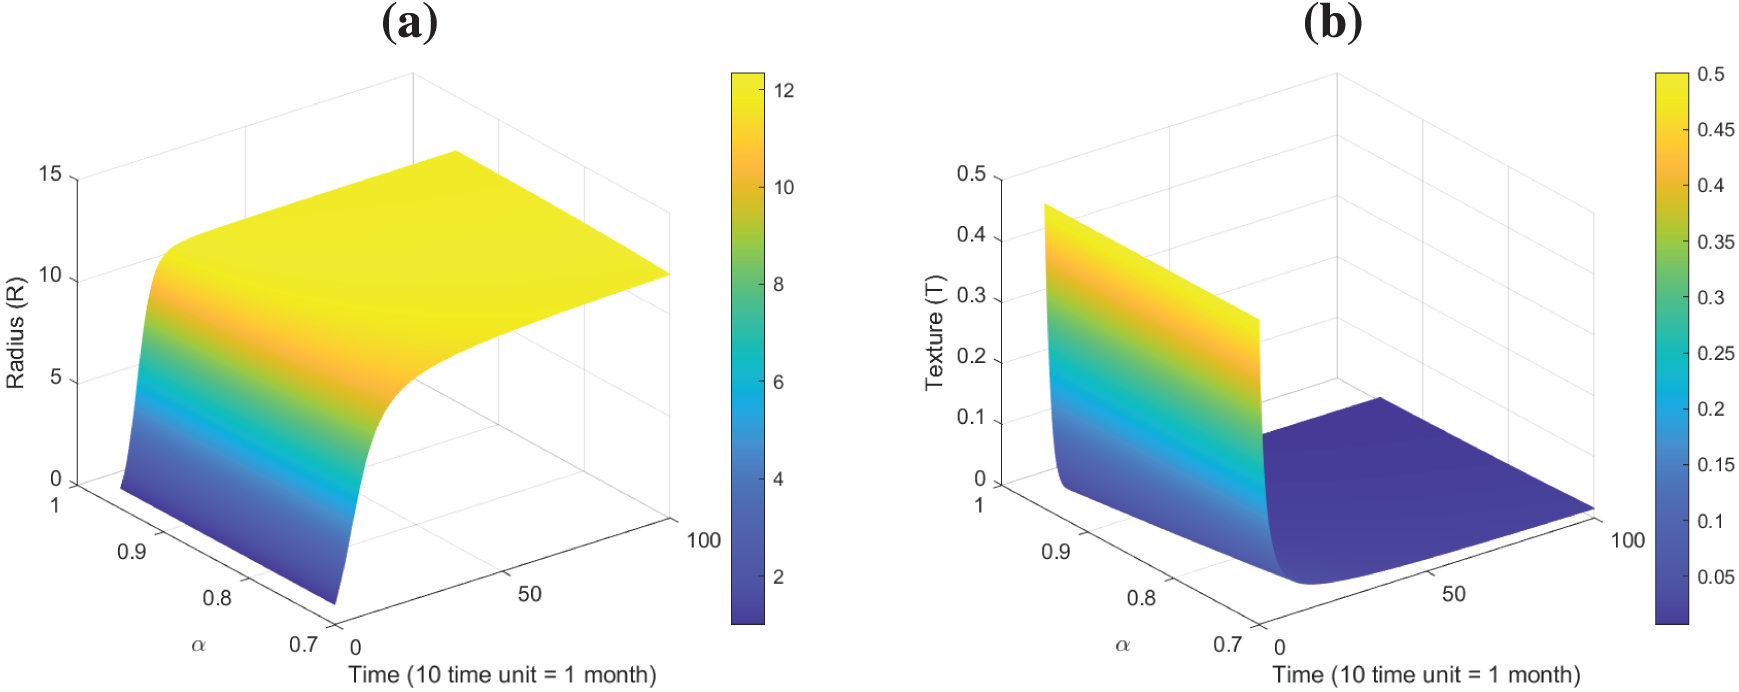
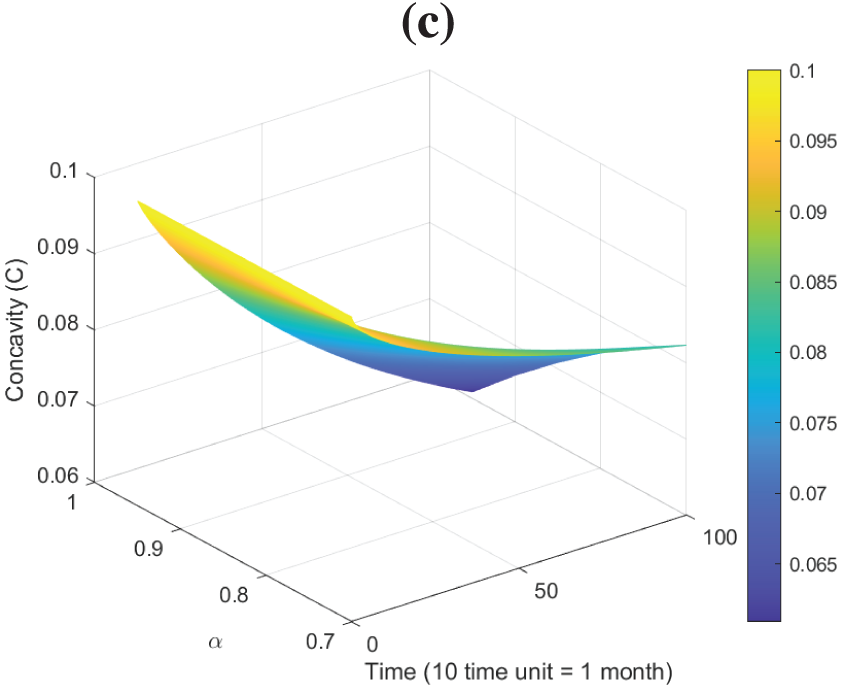
Figure 16: Surface plots dynamics of model (26): (a) Plot of
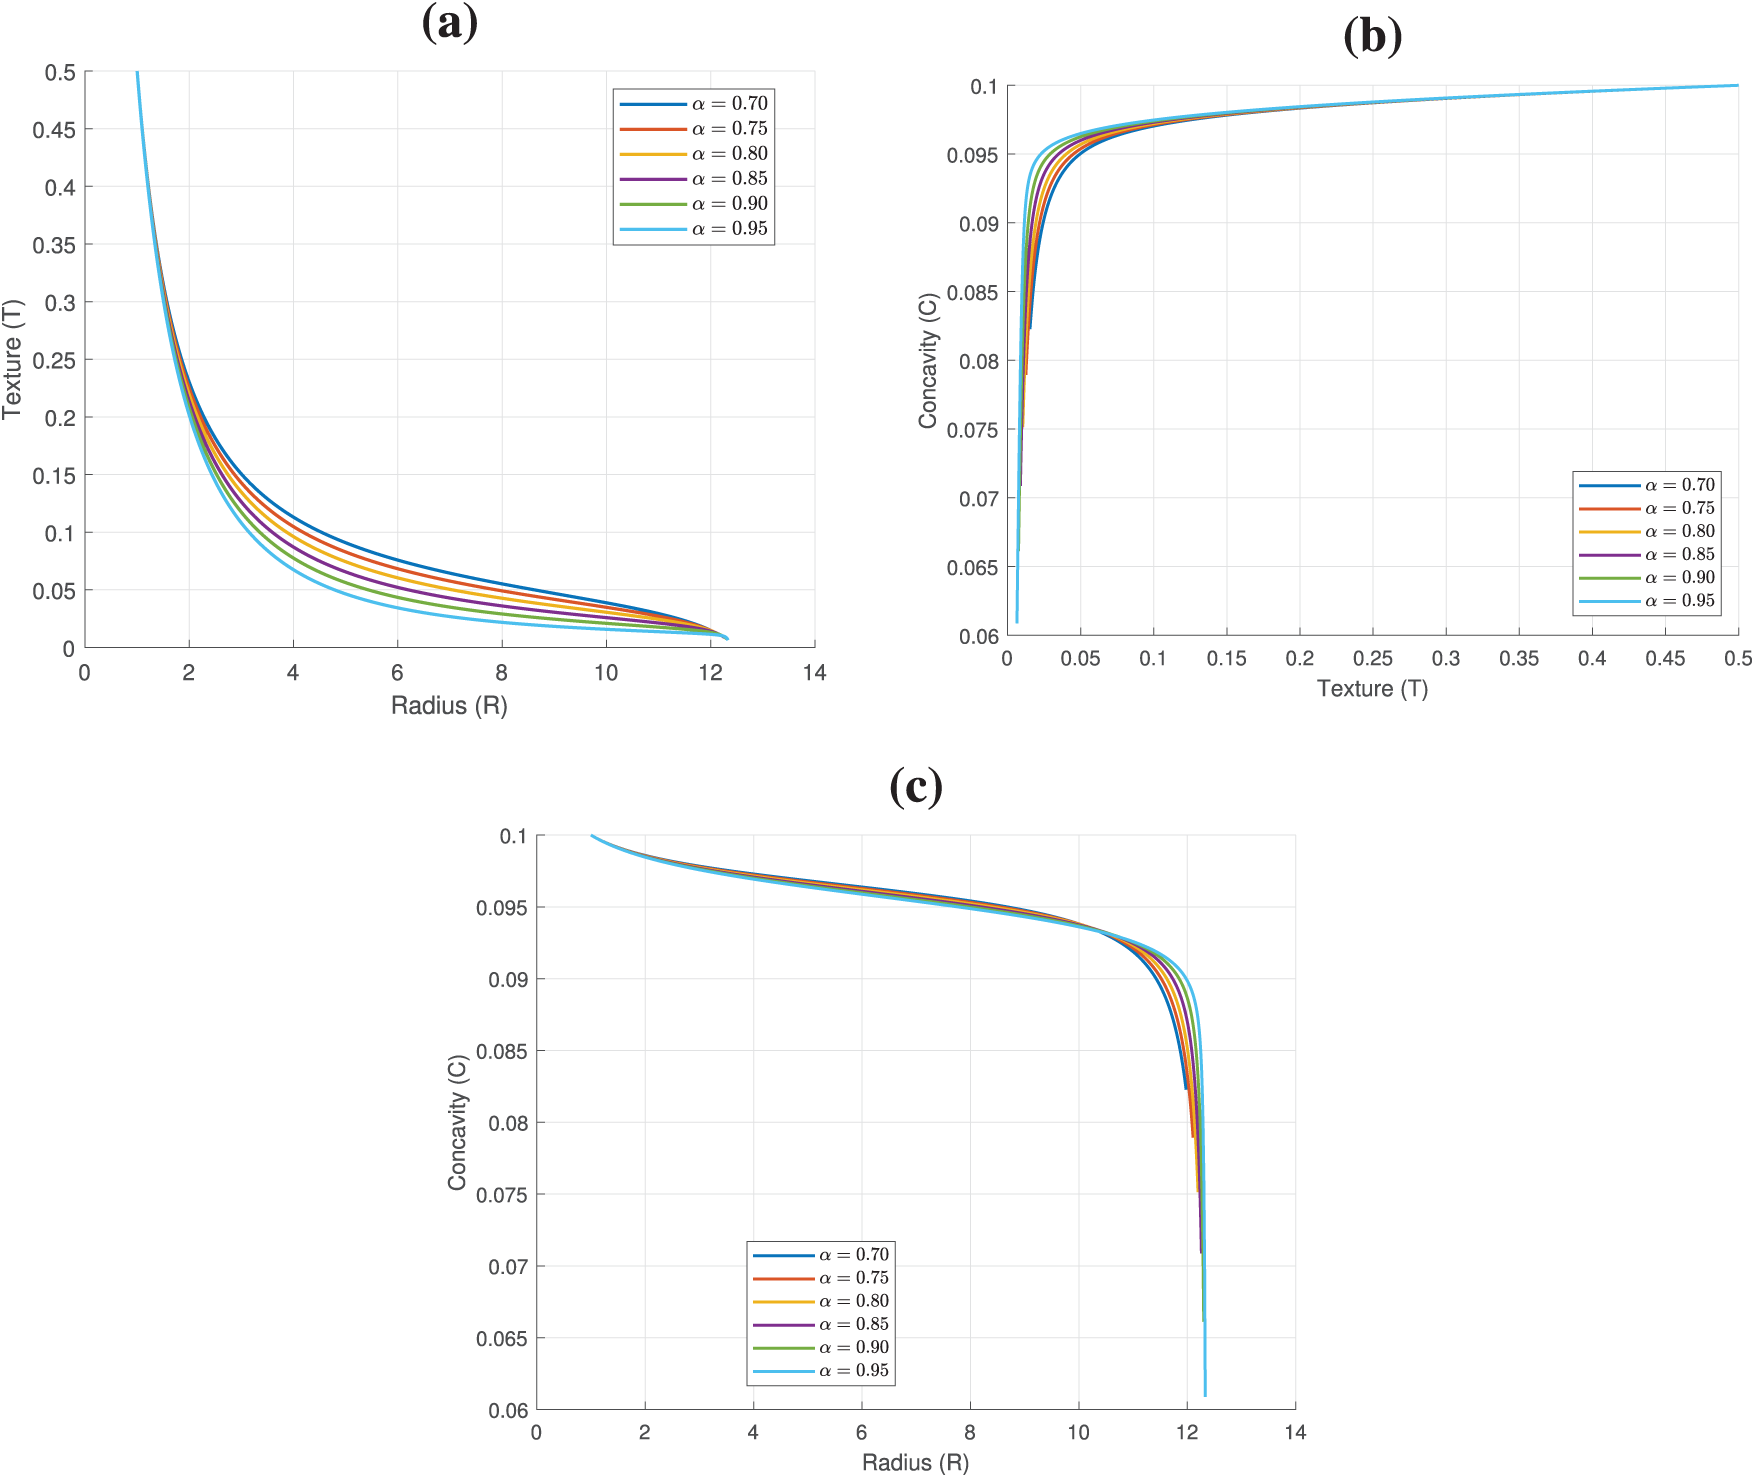
Figure 17: Phase plots of model (26): (a) Plot of
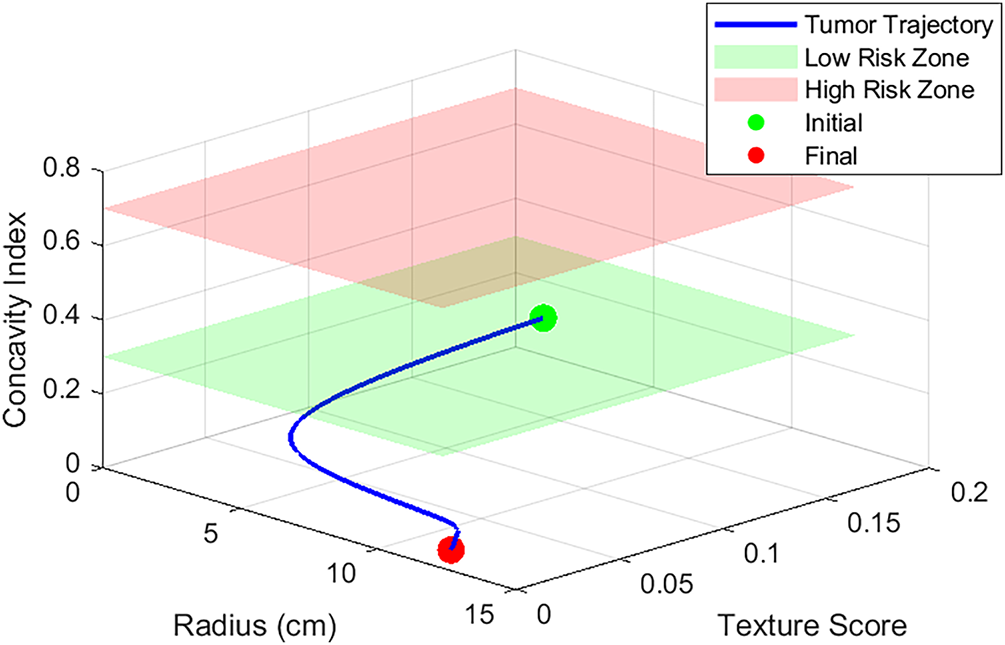
Figure 18: Malignant-benign region prediction using model (26), with
This study presents a novel hybrid framework integrating machine learning and fractional-order calculus to model breast cancer progression across multiple scales. The machine learning component, evaluated on the Wisconsin Diagnostic Breast Cancer dataset, achieved exceptional diagnostic accuracy, with deep neural networks reaching 97.72% by leveraging key morphological features such as Area_worst and Radius_worst. The fractional-order dynamical model uniquely captures memory effects in tumor growth, revealing distinct temporal patterns where lower fractional orders correlate with prolonged tumor growth phases, mimicking aggressive subtypes, while higher orders reflect rapid stabilization akin to indolent tumors. The novelty of this work lies in its first-of-its-kind hybrid framework, which combines machine learning classification with fractional-order dynamics to provide both diagnostic and prognostic insights. The model enhances biological interpretability by linking parameters to clinical tumor behavior. Additionally, fractional calculus introduces memory effects, capturing long-term tumor history and offering a paradigm shift from classical integer-order models. The developed graphical user interface further enhances clinical utility by enabling real-time risk assessment, bridging the gap between theoretical modeling and practical application. Despite these advancements, certain limitations must be acknowledged. The study’s data scope is currently restricted to imaging-derived features, excluding genomic and microenvironmental factors that could further refine predictions. The computational cost of deep learning models, such as the 5.3755 s per cross-validation fold required for our Deep Neural Network (DNN), could be optimized through hardware acceleration or model compression techniques. Future research directions should focus on integrating multi-omics data to enhance the fractional model’s predictive power, particularly by incorporating genomic markers. Extending the framework to model therapeutic responses, such as chemotherapy effects on fractional-order values, could provide deeper clinical insights. Optimizing the graphical interface for low-resource settings through lightweight machine learning models would improve accessibility. Longitudinal studies are also needed to validate the role of memory effects, represented by
Acknowledgement: Not applicable.
Funding Statement: The authors received no specific funding for this study.
Author Contributions: David Amilo: Conceptualization, Methodology, Data Curation, Software, Formal Analysis, and Writing, Original Draft. Khadijeh Sadri: Formal analysis, Validation, Visualization, Writing, Review, and Editing. Evren Hincal: Supervision and Project Administration, Review, and Editing. Mohamed Hafez: Supervision, Review, and Editing. All authors reviewed the results and approved the final version of the manuscript.
Availability of Data and Materials: Data used in this study are referenced within the article.
Ethics Approval: Not applicable.
Conflicts of Interest: The authors declare no conflicts of interest to report regarding the present study.
References
1. Barrios CH. Global challenges in breast cancer detection and treatment. The Breast. 2022;62(1):S3–6. doi:10.1016/j.breast.2022.02.003. [Google Scholar] [PubMed] [CrossRef]
2. Trapani D, Ginsburg O, Fadelu T, Lin NU, Hassett M, Ilbawi AM, et al. Global challenges and policy solutions in breast cancer control. Cancer Treat Rev. 2022;104(3):102339. doi:10.1016/j.ctrv.2022.102339. [Google Scholar] [PubMed] [CrossRef]
3. Wilkinson L, Gathani T. Understanding breast cancer as a global health concern. Br J Radio. 2022;95(1130):20211033. doi:10.1259/bjr.20211033. [Google Scholar] [PubMed] [CrossRef]
4. Kim J, Harper A, McCormack V, Sung H, Houssami N, Morgan E, et al. Global patterns and trends in breast cancer incidence and mortality across 185 countries. Nat Med. 2025;31(4):1154–62. doi:10.1038/s41591-025-03502-3. [Google Scholar] [PubMed] [CrossRef]
5. Xu H, Xu B. Breast cancer: epidemiology, risk factors and screening. Chin J Cancer Res. 2023;35(6):565. doi:10.21147/j.issn.1000-9604.2023.06.02. [Google Scholar] [PubMed] [CrossRef]
6. Popa M-T, Noditi A, Peleaşa T-M, Stoleru S, Blidaru A. Breast cancer: a heterogeneous pathology. Prognostic and predictive factors–a narrative review. Chirurgia. 2025;120(1):32–47. doi:10.21614/chirurgia.3100. [Google Scholar] [PubMed] [CrossRef]
7. Gu TQ, Xiao YL, Shao ZM. Intratumor heterogeneity in breast cancer: tracing its origins and translating findings into clinical practice. Precis Med Eng. 2024;1(1):100006. doi:10.1016/j.preme.2024.100006. [Google Scholar] [CrossRef]
8. Shahid MS, Imran A. Breast cancer detection using deep learning techniques: challenges and future directions. Multimed Tools Appl. 2025;84(6):3257–304. doi:10.1007/s11042-025-20606-7. [Google Scholar] [CrossRef]
9. Sharafaddini AM, Esfahani KK, Mansouri N. Deep learning approaches to detect breast cancer: a comprehensive review. Multimed Tools Appl. 2024;84(21):24079–190. doi:10.1007/s11042-024-20011-6. [Google Scholar] [CrossRef]
10. Asif S, Yi WH, ur-Rehman S-, ul-ain Q-, Amjad K, Yi YY, et al. Advancements and prospects of machine learning in medical diagnostics: unveiling the future of diagnostic precision. Arch Comput Methods Eng. 2024;32(2):853–83. doi:10.1007/s11831-024-10148-w. [Google Scholar] [CrossRef]
11. Rai HM, Yoo J, Razaque A. Comparative analysis of machine learning and deep learning models for improved cancer detection: a comprehensive review of recent advancements in diagnostic techniques. Expert Syst Appl. 2024;255(Part D):124838. doi:10.1016/j.eswa.2024.124838. [Google Scholar] [CrossRef]
12. Amilo D, Sadri K, Hincal E, Farman M, Nisar KS, Hafez M. An integrated machine learning and fractional calculus approach to predicting diabetes risk in women. Healthcare Anal. 2025;8(2):100402. doi:10.1016/j.health.2025.100402. [Google Scholar] [CrossRef]
13. Luo L, Wang X, Lin Y, Ma X, Tan A, Chan R, et al. Deep learning in breast cancer imaging: a decade of progress and future directions. IEEE Rev Biomed Eng. 2025;18:130–51. doi:10.1109/RBME.2024.3357877. [Google Scholar] [PubMed] [CrossRef]
14. Darbandi MRN, Darbandi M, Darbandi S, Bado I, Hadizadeh M, Khorshid HRK. Artificial intelligence breakthroughs in pioneering early diagnosis and precision treatment of breast cancer: a multimethod study. Eur J Cancer. 2024;209:114227. doi:10.1016/j.ejca.2024.114227. [Google Scholar] [PubMed] [CrossRef]
15. Orhan H, Yavşan E. Artificial intelligence-assisted detection model for melanoma diagnosis using deep learning techniques. Math Model Numer Simul Appl. 2023;3(2):159–69. doi:10.53391/mmnsa.1311943. [Google Scholar] [CrossRef]
16. Sugiman S, Salman S, Catur AD, Asmara YP. Modelling the flexural properties of filled epoxy: effects of volume fraction. E3S Web of Conferences. 2023;465(16):01028). doi:10.1051/e3sconf/202346501028. [Google Scholar] [CrossRef]
17. Dewi DA, Thinakan R, Batumalay M, Kurniawan TB. A model for pervasive computing and wearable devices for sustainable healthcare applications. Int J Adv Comput Sci Appl. 2023;14(10). doi:10.14569/IJACSA.2023.0141056. [Google Scholar] [CrossRef]
18. Acay B, Inc M, Khan A, Yusuf A. Fractional methicillin-resistant Staphylococcus aureus infection model under Caputo operator. J Appl Math Comput. 2021;67(1):755–83. doi:10.1007/s12190-021-01502-3. [Google Scholar] [PubMed] [CrossRef]
19. Saadeh R, Abdoon MA, Qazza A, Berir M, Guma FE, Al-Kuleab N, et al. Mathematical modeling and stability analysis of the novel fractional model in the Caputo derivative operator: a case study. Heliyon. 2024;10(5):e26611. doi:10.1016/j.heliyon.2024.e26611. [Google Scholar] [PubMed] [CrossRef]
20. Bundela B, Sharma S, Singh BR. A review article on relation between mathematical modelling and machine learning. Zhongguo Kuangye Daxue Xuebao. 2024;29(2):123–9. [Google Scholar]
21. Amilo D, Izuchukwu C, Sadri K, Yao HR, Hincal E, Shehu Y. A fractional-order model for optimizing combination therapy in heterogeneous lung cancer: integrating immunotherapy and targeted therapy to minimize side effects. Sci Rep. 2024;14(1):18484. doi:10.1038/s41598-024-66531-x. [Google Scholar] [PubMed] [CrossRef]
22. Xu C, Farman M, Pang Y, Liu Z, Liao M, Yao L, et al. Mathematical analysis and dynamical transmission of (SEIrIsR) model with different infection stages by using fractional operator. Int J Biomath. 2024. doi:10.1142/S1793524524501511. [Google Scholar] [CrossRef]
23. Ucar S, Koca I, Özdemir N, Inci T. A stochastic approach to tumor modeling incorporating macrophages. Bull Biomath. 2024;2(2):162–81. doi:10.59292/bulletinbiomath.2024007. [Google Scholar] [CrossRef]
24. Amilo D, Sadri K, Kaymakamzade B, Hincal E. A mathematical model with fractional-order dynamics for the combined treatment of metastatic colorectal cancer. Commun Nonlinear Sci Numer Simul. 2024;130(7):107756. doi:10.1016/j.cnsns.2023.107756. [Google Scholar] [CrossRef]
25. Amilo D, Sadri K, Farman M, Hincal E, Nisar KS. New insights into disease dynamics and treatment interventions with PID controller-based therapeutic strategies for pancreatic cancer. Comput Math Appl. 2025;181(1):133–62. doi:10.1016/j.camwa.2025.01.006. [Google Scholar] [CrossRef]
26. Amilo D, Kaymakamzade B, Hincal E. A fractional-order mathematical model for lung cancer incorporating integrated therapeutic approaches. Sci Rep. 2023;13(1):12426. doi:10.1038/s41598-023-38814-2. [Google Scholar] [PubMed] [CrossRef]
27. El-Sayed AA, Baleanu D, Agarwal P. A novel Jacobi operational matrix for numerical solution of multi-term variable-order fractional differential equations. J Taibah Univ Sci. 2020;14(1):963–74. doi:10.1080/16583655.2020.1792681. [Google Scholar] [CrossRef]
28. Agarwal P, El-Sayed AA, Tariboon J. Vieta-Fibonacci operational matrices for spectral solutions of variable-order fractional integro-differential equations. J Comput Appl Math. 2021;382(2):113063. doi:10.1016/j.cam.2020.113063. [Google Scholar] [CrossRef]
29. Swain S, Swain S, Panda B, Tripathy MC. Modeling and optimal analysis of lung cancer cell growth and apoptosis with fractional-order dynamics. Comput Biol Med. 2025;188(11):109837. doi:10.1016/j.compbiomed.2025.109837. [Google Scholar] [PubMed] [CrossRef]
30. Karaca Y. Computational complexity-based fractional-order neural network models for the diagnostic treatments and predictive transdifferentiability of heterogeneous cancer cell propensity. Chaos Theory Appl. 2023;5(1):34–51. doi:10.51537/chaos.1249532. [Google Scholar] [CrossRef]
31. Vieira LC, Costa RS, Valério D. An overview of mathematical modelling in cancer research: fractional calculus as modelling tool. Frac Fraction. 2023;7(8):595. doi:10.3390/fractalfract7080595. [Google Scholar] [CrossRef]
32. Behinfaraz R, Ghavifekr AA, De Fazio R, Visconti P. Utilizing fractional artificial neural networks for modeling cancer cell behavior. Electronics. 2023;12(20):4245. doi:10.3390/electronics12204245. [Google Scholar] [CrossRef]
33. Nagdeote S, Prabhu S. A model to perform prediction based on feature extraction of histopathological images of the breast. Multimed Tools Appl. 2024;83(6):18119–46. doi:10.1007/s11042-023-16245-5. [Google Scholar] [CrossRef]
34. Imam S, Aijaz M, Iffat W, Jamshed SQ, Ismail NE, Paneerselvam GS, et al. Attitudes and understanding of complementary and alternative medicine in cancer care: an exploratory study of patients’ perspectives in Karachi. Pakistan Asian Pac J Trop Med. 2023;16(9):400–8. doi:10.4103/1995-7645.386075. [Google Scholar] [CrossRef]
35. Al-Dhabyani W, Gomaa M, Khaled H, Fahmy A. Dataset of breast ultrasound images. Data Brief. 2020;28(5):104863. doi:10.1016/j.dib.2019.104863. [Google Scholar] [PubMed] [CrossRef]
36. Wolberg W, Mangasarian O, Street N, Street W. Breast cancer wisconsin (Diagnostic) [Dataset]. UCI Machine Learning Repository. 1993. doi:10.24432/C5DW2B. [Google Scholar] [CrossRef]
37. Singh LK, Khanna M, Singh R. An enhanced soft-computing based strategy for efficient feature selection for timely breast cancer prediction: Wisconsin Diagnostic Breast Cancer dataset case. Multimed Tools Appl. 2024;83(31):76607–72. doi:10.1007/s11042-024-18473-9. [Google Scholar] [CrossRef]
38. Sadeghi-Lotfabadi A, Ghiasi-Shirazi K. Speeding up L-BFGS by direct approximation of the inverse Hessian matrix. Comput Optim Appl. 2025;91(1):283–310. doi:10.1007/s10589-025-00665-0. [Google Scholar] [CrossRef]
39. So AMC, Zhou Z. Non-asymptotic convergence analysis of inexact gradient methods for machine learning without strong convexity. Optim Methods Softw. 2017;32(4):963–92. doi:10.1080/10556788.2017.1296439. [Google Scholar] [CrossRef]
40. Valentim Junior CA. Fractional mathematical oncology: cancer-related dynamics under an interdisciplinary viewpoint [doctoral dissertation]. Brazil: São Paulo; 2023. doi:10.11606/T.74.2023.tde-07112023-093919. [Google Scholar] [CrossRef]
41. Jiang G, Gao X, Huang R, Wu C. Fractional-Order RNNs: a universal approximation framework for non-local dynamic system modeling. IEEE Trans Signal Process. 2025. doi:10.1109/TSP.2025.3585881. [Google Scholar] [CrossRef]
42. Abu-Shady M, Kaabar MK. A generalized definition of the fractional derivative with applications. Math Probl Eng. 2021;2021(1):9444803. doi:10.1155/2021/9444803. [Google Scholar] [CrossRef]
43. Amilo D, Sadri K, Hincal E. Comparative analysis of caputo and variable-order fractional derivative algorithms across various applications. Int J Appl Comput Math. 2025;11(3):80. doi:10.1007/s40819-025-01887-w. [Google Scholar] [CrossRef]
44. Sadri K, Amilo D, Hinçal E. A combination of classical and shifted Jacobi polynomials for two-dimensional time-fractional diffusion-wave equations. Chaos Solitons Fractals. 2025;198:116569. doi:10.1016/j.chaos.2025.116569. [Google Scholar] [CrossRef]
45. Lin SY. New results for generalized Gronwall Inequalities and their applications. Abstr Appl Anal. 2014;2014:168594. doi:10.1155/2014/168594. [Google Scholar] [CrossRef]
Cite This Article
 Copyright © 2025 The Author(s). Published by Tech Science Press.
This work is licensed under a Creative Commons Attribution 4.0 International License , which permits unrestricted use, distribution, and reproduction in any medium, provided the original work is properly cited.
 Downloads
 Citation Tools