
 Submit a Paper
 Propose a Special lssue
 Open Access
ARTICLE

A Lightweight Explainable Deep Learning for Blood Cell Classification
1 Faculty of Information Technology, Vinh Long University of Technology Education, Vinh Long, 85000, Vietnam
2 Center for Technology Application and Transfer, Vinh Long University of Technology Education, Vinh Long, 85000, Vietnam
3 Faculty of Information Technology, Vinh Long University of Technology Education, Vinh Long, 85000, Vietnam
* Corresponding Author: Anh-Cang Phan. Email:
(This article belongs to the Special Issue: Intelligent Medical Decision Support Systems: Methods and Applications)
Computer Modeling in Engineering & Sciences 2025, 145(2), 2435-2456. https://doi.org/10.32604/cmes.2025.070419
Received 15 July 2025; Accepted 09 October 2025; Issue published 26 November 2025
 View Full Text
 Download PDF
Abstract
Blood cell disorders are among the leading causes of serious diseases such as leukemia, anemia, blood clotting disorders, and immune-related conditions. The global incidence of hematological diseases is increasing, affecting both children and adults. In clinical practice, blood smear analysis is still largely performed manually, relying heavily on the experience and expertise of laboratory technicians or hematologists. This manual process introduces risks of diagnostic errors, especially in cases with rare or morphologically ambiguous cells. The situation is more critical in developing countries, where there is a shortage of specialized medical personnel and limited access to modern diagnostic tools. High testing costs and delays in diagnosis hinder access to quality healthcare services. In this context, the integration of Artificial Intelligence (AI), particularly Explainable AI (XAI) based on deep learning, offers a promising solution for improving the accuracy, efficiency, and transparency of hematological diagnostics. In this study, we propose a Ghost Residual Network (GRsNet) integrated with XAI techniques such as Gradient-weighted Class Activation Mapping (Grad-CAM), Local Interpretable Model-Agnostic Explanations (LIME), and SHapley Additive exPlanations (SHAP) for automatic blood cell classification. These techniques provide visual explanations by highlighting important regions in the input images, thereby supporting clinical decision-making. The proposed model is evaluated on two public datasets: Naturalize 2K-PBC and Microscopic Blood Cell, achieving a classification accuracy of up to 95%. The results demonstrate the model’s strong potential for automated hematological diagnosis, particularly in resource-constrained settings. It not only enhances diagnostic reliability but also contributes to advancing digital transformation and equitable access to AI-driven healthcare in developing regions.Graphic Abstract
Keywords
Blood cell detection and classification play a critical role in clinical medicine, particularly in the diagnosis and treatment of hematologic disorders as well as systemic diseases with hematological implications. According to the American Cancer Society, an estimated 186,400 new cases of blood cancer are expected to be diagnosed in 2024, accounting for approximately 9.3% of the projected 2,001,140 new cancer cases in the United States [1]. Furthermore, around 22,010 individuals are expected to be diagnosed with acute myeloid leukemia (AML), and approximately 11,090 deaths are projected in 2025 [2]. On a global scale, the World Health Organization (WHO) reports that iron deficiency anemia is the most common form of anemia, affecting approximately 1.62 billion people or 24.8% of the world’s population [3]. These statistics highlight the urgent need for early detection of blood cell abnormalities. In clinical practice, the complete blood count (CBC) test remains the standard method for assessing the number and proportion of red blood cells, white blood cells, and platelets. However, traditional manual methods such as microscopic examination are time-consuming and heavily reliant on the expertise and experience of laboratory technicians, increasing the likelihood of misdiagnosis or overlooking early signs of disease, especially in cases involving rare or morphologically atypical cells [4]. Therefore, there is an urgent need for an intelligent system capable of supporting the classification of blood cells to enhance diagnostic accuracy and efficiency. The main contributions of this study are as follows:
• We propose GRsNet, a compact model based on Ghost Bottleneck blocks, achieving only 4.82 million parameters and 1.80 Giga Floating-point Operations Per Second (GFLOPs), making it efficient for use in resource-limited clinical settings.
• The proposed model is trained and tested on a combined dataset covering 12 blood cell types, including both common and less frequent categories.
• We integrate three complementary Explainable AI (XAI) techniques—Grad-CAM, LIME, and SHAP—to generate visual explanations that associate highlighted regions with clinically relevant morphological features of the cells, enabling medical professionals to better understand their decision-making process.
Recent research on blood cell analysis spans multiple tasks, including segmentation, detection, classification, and explainable AI (XAI)-based approaches. In segmentation, Heni et al. [5] proposed the EK-Means method for white blood cell (WBC) segmentation, reaching an accuracy of 96% using the VGG-19 architecture. In classification, Wang et al. [6] developed a two-stage approach that combines YOLOv7 and EfficientNetV2 with an Atrous Spatial Pyramid Pooling (ASPP) module and a Binary Cross Entropy (BCE) loss function for WBC classification, achieving an mAP of 97.17% and an accuracy of 94.7% on the BCCD dataset. Similarly, Khan et al. [7] designed a neural network based on the Region Based Convolutional Neural Networks (RCNN) architecture combined with biosensors, employing a Radial Gradient Index filter to enhance image quality and reduce noise, which achieved 91.21% accuracy during testing. Mondal et al. [8] introduced BloodCell-Net, a framework incorporating a custom Lightweight Convolutional Neural Network (LWCNN) for classifying individual blood cells into nine types, achieving an average accuracy of 97.10%, precision of 97.19%, recall of 97.01%, and F1-score of 97.10%. Zhu et al. [9] proposed DLBCNet, a deep learning framework tailored for multi-class classification of blood cells, which achieved strong performance, with average accuracy, sensitivity, precision, specificity, and F1-score reaching 95.05%, 93.25%, 97.75%, 93.72%, and 95.38%, respectively.
For detection, Swaminathan et al. [10] applied the Detection Transformer (DETR) model to detect blood cells in microscopic images, assisting in diagnosing conditions such as anemia, infections, and blood cancers. Their experimental results showed that DETR achieved an mAP of 0.89, outperforming YOLOv5 (mAP of 0.88).
Hybrid and feature-based methods have also been explored. Meenakshi et al. [11] developed a Deep Features-based Convolutional Neural Network (DFCNN) framework for WBC counting and classification, consisting of three stages: feature extraction using a combined Convolutional Neural Network (CNN) architecture (AlexNet+GoogLeNet+ResNet-50), feature selection with a Hybrid Mayfly Algorithm (MA)—Particle Swarm Optimization (HMA-PSO), and classification via Recurrent Neural Network (RNN)-Long Short-Term Memory (LSTM). This method classified four WBC types (neutrophils, eosinophils, monocytes, and lymphocytes) and achieved high performance (recall = 0.98, precision = 0.90, accuracy = 0.97) in MATLAB, outperforming MA-RNN and PSO-RNN baselines. Elhassan et al. [12] proposed a hybrid approach for morphological classification of atypical WBCs in acute myeloid leukemia (AML) from peripheral blood smear images, achieving an average accuracy of 97%, sensitivity of 97%, precision of 98%, and an overall AUC of 99.7%.
Explainable AI has been integrated into some recent works to improve interpretability. Basaran [13] presented a CNN-based diagnostic framework that integrates SqueezeNet, local interpretable model-agnostic explanations (LIME), and minimum redundancy maximum relevance (mRMR) for classifying four types of WBCs, achieving an accuracy of 95.88%. This highlights the potential of XAI in making blood cell classification more interpretable and clinically reliable.
Overall, although these approaches demonstrate strong performance, most studies focus predominantly on white blood cell classification. Other important blood cell types, such as platelets, normoblasts, and myeloid cells, remain underexplored, despite their critical role in the diagnosis of hematological disorders. Moreover, only a limited number of works explicitly apply XAI techniques to cell classification, particularly those analyzing morphological features or internal structures. Addressing these gaps, the present study contributes by advancing twelve classifications while emphasizing explainability to enhance clinical applicability.
Peripheral Blood Smear (PBS) analysis is a hematological technique that involves examining blood cells under a microscope after they have been thinly spread and stained on a glass slide. This method is used to investigate abnormal findings from a Complete Blood Count (CBC) and plays a crucial role in diagnosing and monitoring various hematologic disorders and infections. It allows for the evaluation of the quantity, morphology, and distribution of the three main blood cell types: red blood cells (RBCs), white blood cells (WBCs), and platelets (PLTs) [14]. Clinically, PBS is essential for assessing red blood cell morphology to determine causes of anemia, such as iron deficiency anemia, hemolytic anemia, or pernicious anemia. In addition, white blood cell analysis enables the detection of malignant hematological disorders such as acute or chronic leukemia. The blood smear is also highly effective in identifying blood-borne parasites such as Plasmodium or Babesia [15].
However, the process of reading and analyzing blood smears is currently performed manually and heavily relies on the expertise and experience of laboratory technicians or clinicians. This dependency can lead to diagnostic errors, particularly in cases involving rare or morphologically ambiguous abnormal cells. The main types of blood cells typically observed in microscopic blood smears are illustrated in Fig. 1.

Figure 1: The main types of blood cells typically observed in microscopic blood smears
3.2 Explainable Artificial Intelligence (XAI)
Explainable Artificial Intelligence (XAI) [16] refers to a set of methods and techniques developed to enhance the transparency and interpretability of machine learning models. It plays a critical role in enhancing the transparency and reliability of AI models for medical image classification [13]. While traditional deep learning models often operate as “black boxes”—producing outputs without revealing the reasoning behind them—XAI aims to provide insight into the decision-making process of these models. XAI methods enable the interpretation of model predictions by providing detailed and visual insights into the morphological features that influence the classification process. This not only supports the validation of AI-based results but also contributes to building trust among clinical experts in diagnostic support systems [13]. The prominent XAI techniques are Grad-CAM [17], LIME [18], and SHAP [19].
Grad-CAM is widely used in image recognition and classification tasks. It utilizes the gradients of the output with respect to the feature maps in the final convolutional layer to generate heatmaps that highlight image regions most relevant to the model’s predictions. The core idea is to compute the importance weights
where
•
•
•
•
The Grad-CAM localization map is then calculated using Eq. (2).
The Rectified Linear Unit (ReLU) is applied to focus only on features that positively influence the class of interest. The resulting heatmap highlights the most influential regions of the input image in the model’s decision.
LIME is a model-agnostic method that explains individual predictions of any machine learning model by approximating the local decision boundary of the complex model
where
•
•
•
•
•
LIME perturbs the input
SHAP is a unified framework based on cooperative game theory to interpret predictions by assigning each feature an importance value for a particular prediction. It is grounded in the concept of Shapley values, which fairly distribute the total gain (prediction output) among input features based on their marginal contributions. The Shapley value for feature
where
•
•
•
•
In this study, we employ LIME, Grad-CAM, and SHAP to interpret and visualize the decision-making process of our model in the task of detecting and classifying 12 types of blood cells. These techniques allow us to identify key features that influence the model’s predictions, as illustrated in Fig. 2.

Figure 2: Blood cell images after applying explainable AI techniques: (a) LIME, (b) Grad-CAM, and (c) SHAP
In this study, we employ several evaluation metrics for the classification task, including the confusion matrix, Precision, Recall, F1-score, Accuracy, Loss function, and the AUC-ROC curve to assess model performance during the training phase. These metrics are defined by the following equations (see Eqs. (5)–(9)).
where
• K: the number of classes.
•
•
• True Positive (TP): refers to cases correctly predicted as belonging to a class.
• True Negative (TN): refers to cases correctly predicted as not belonging to a class.
• False Positive (FP): refers to cases incorrectly predicted as belonging to a class.
• False Negative (FN): refers to cases incorrectly predicted as not belonging to a class.
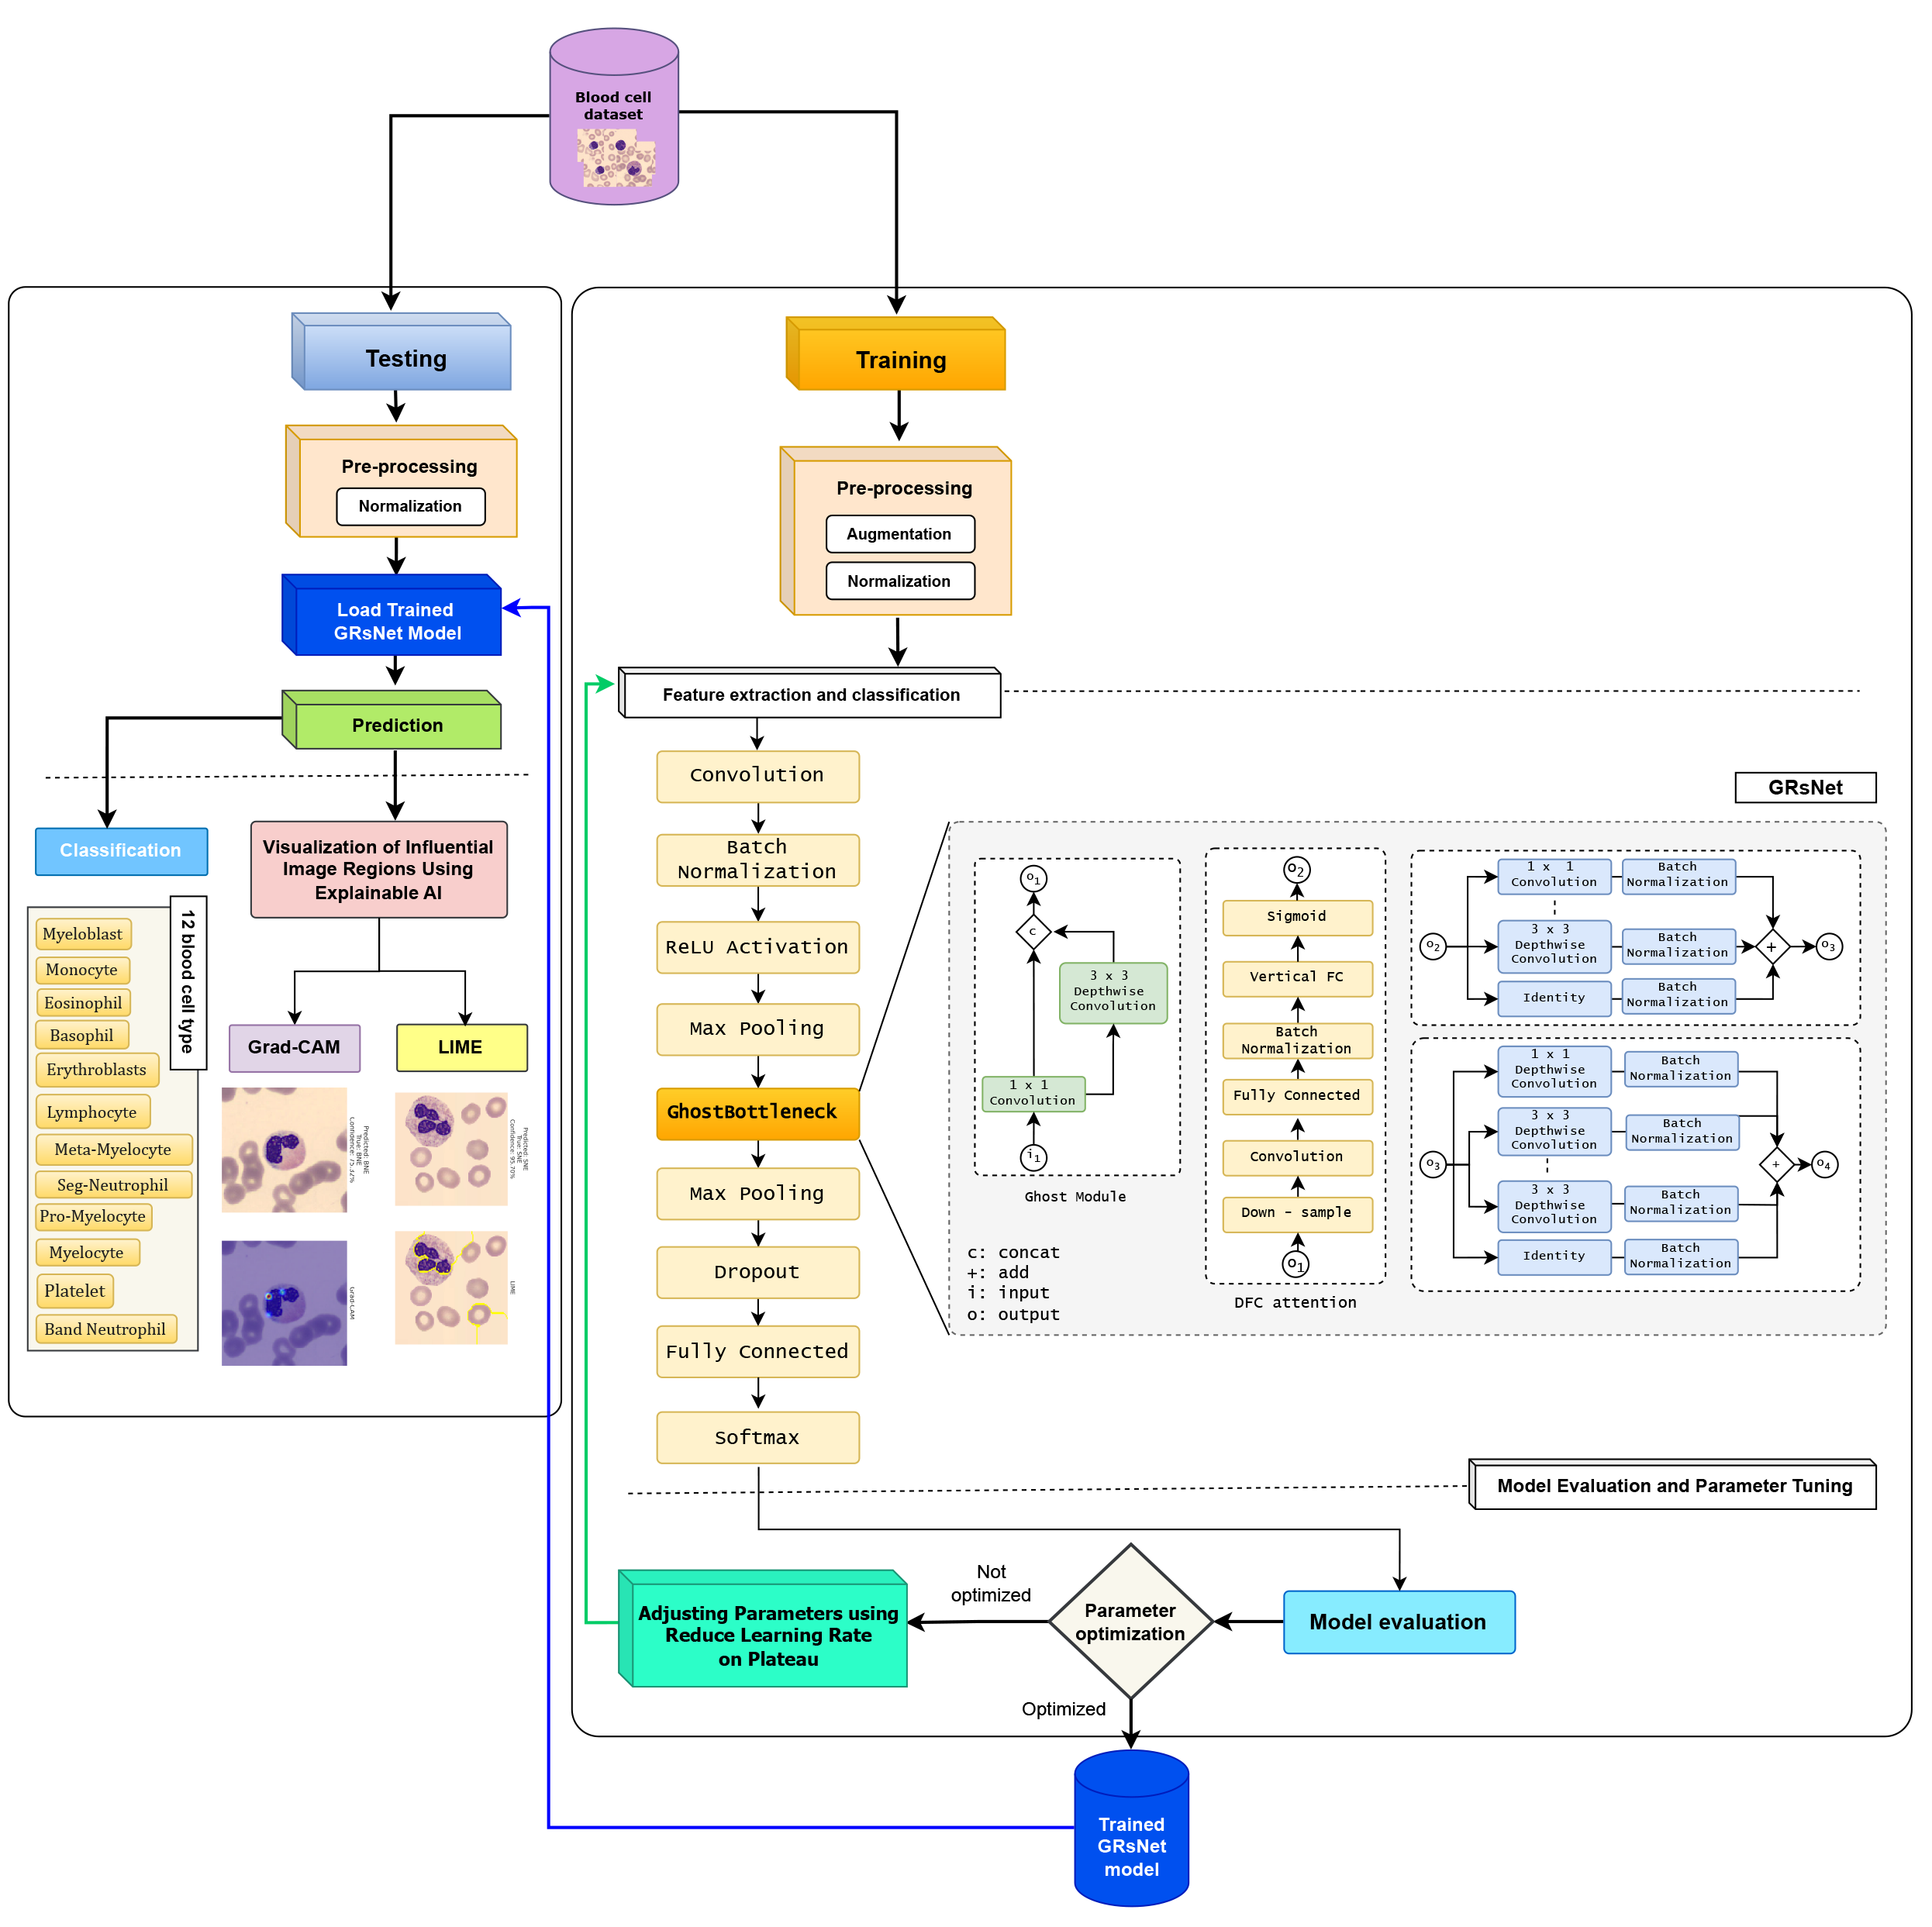
To detect and classify blood cells on microscope slides, we employ a transfer learning approach based on advanced deep learning techniques integrated with Explainable Artificial Intelligence (XAI) to visualize the image regions that significantly influence the model’s decision-making process. The proposed model consists of two main stages: training and testing, with the details of each stage illustrated in Fig. 3.

Figure 3: A proposed approach to detect and classify blood cells
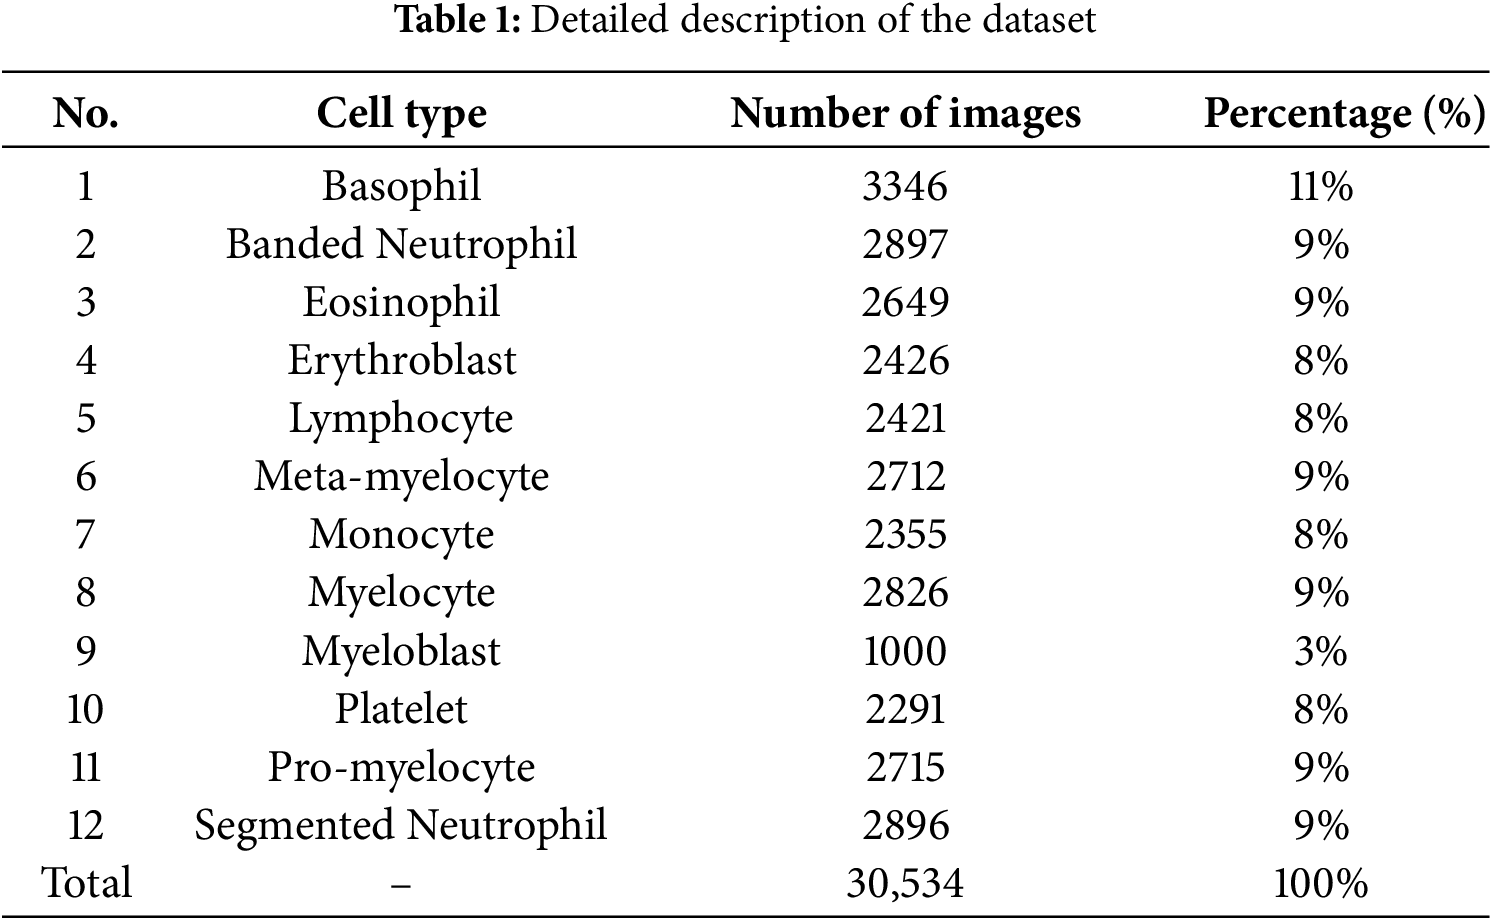
During the preprocessing stage, a series of normalization and data augmentation techniques were applied to enhance the quality of input images and improve the model’s generalization capability. Based on the class distribution reported in Table 1, we selected 2897 images as the reference class size and balanced the remaining classes accordingly. To balance the dataset, minority classes were increased to this size using targeted augmentation, while majority classes were controlledly downsampled to 2897 images by randomly selecting samples while maintaining diversity across patients and imaging conditions. This strategy ensured class balance without excessive information loss. First, pixel values were standardized to zero mean and unit variance, with normalization parameters adapted from the training set to ensure consistent data scaling and stable convergence. Subsequently, all images were resized to
These transformations not only help mitigate overfitting but also enhance the model’s robustness in recognizing diverse patterns. The augmentation process was performed repeatedly and stochastically to ensure that the training dataset was expanded both in quantity and morphological diversity. The proposed dataset was split into 70% training, 10% validation, and 20% testing.
4.1.2 Feature Extraction and Training
Among various deep CNN architectures, ResNet (Residual Network) [20] is selected in this study due to its ability to train very deep networks without suffering from the degradation problem commonly encountered in traditional CNNs when depth increases. The core strength of ResNet lies in its skip connection mechanism, which enables the model to learn residual mappings instead of directly mapping inputs to outputs. This approach not only stabilizes backpropagation but also improves convergence efficiency during training. In this study, we propose a novel architecture called GRsNet—an enhanced version of ResNet34 specifically designed for the task of blood cell image classification. The key innovation of GRsNet is the replacement of traditional convolutional blocks in ResNet34 with Ghost Bottlenecks, which utilize the Ghost Module—a feature extraction mechanism that allows the model to be both lightweight and efficient. Rather than generating the full set of output features via standard convolutions, the Ghost Module produces only a small portion of the features through real convolutions, while the remainder is generated using inexpensive operations (cheap operations). This strategy significantly reduces the number of parameters and computational cost while preserving the model’s strong representation capability. The core idea is to employ the Ghost Module, which generates a substantial portion of feature maps using inexpensive linear operations instead of relying solely on costly standard convolutions. Given an input feature map
where
Next, each intrinsic feature map
The final output feature map
By generating a portion of the feature maps through inexpensive operations, the Ghost Module significantly reduces the number of parameters and floating-point operations (FLOPs) while preserving discriminative capacity. Architecturally, GRsNet follows the overall design of ResNet34, consisting of four main stages built using Ghost Bottleneck blocks. The input layer begins with a convolutional layer, followed by batch normalization and a ReLU activation function to stabilize training. The feature maps are then downsampled through max pooling and passed through the successive Ghost Bottleneck layers to capture multi-level features, from local to global. To enhance generalization and mitigate overfitting, a dropout layer is introduced before the final fully connected classification layer. The training process employs the CrossEntropyLoss function, optimized using the Adam algorithm with an initial learning rate of 1 × 10⁻⁴. Also, the Reduce Learning Rate on Plateau scheduler is used to automatically change the learning rate when the validation loss stops improving, helping the model to reach the best solution more smoothly and effectively.
The testing dataset, after undergoing preprocessing, is input into the trained GRsNet model for feature extraction and classification of blood cell types. The model is also integrated with explainable artificial intelligence (XAI) techniques, including Grad-CAM and LIME, to visualize and interpret the regions or features that significantly influence classification decisions. Grad-CAM provides intuitive heatmaps that highlight critical image regions, while LIME clarifies the contribution of each input feature to the prediction outcome. As a result, the classification predictions are not only accurate but also transparent, offering insights into the rationale behind each decision made by the model. The final outcome is the accurate classification of various blood cell types, such as basophil (BA), banded neutrophil (BNE), eosinophil (EO), erythroblast (ERB), lymphocyte (LY), meta-myelocyte (MMY), monocyte (MO), myelocyte (MY), myeloblast (MYE), platelet (PLT), pro-myelocyte (PMY), and segmented neutrophil (SNE). This significantly supports the diagnostic and decision-making processes in the field of hematology.
5 Experimental Setup and Results
5.1 Data Description and Installation
The proposed method was implemented using the Python programming language with the TensorFlow 2.10.0 framework on the Windows 11 operating system. The experiments were conducted on a hardware configuration consisting of 16 GB RAM. The training dataset was compiled from two sources: Naturalize 2K-PBC [21] and Microscopic Blood Cell [22], comprising a total of 30,534 blood cell images categorized into 12 different types: basophil, banded neutrophil, eosinophil, erythroblast, lymphocyte, meta-myelocyte, monocyte, myelocyte, myeloblast, platelet, pro-myelocyte, and segmented neutrophil (See Table 1).
5.2.1 Accuracy and Loss Values
Fig. 4a,c,e,g illustrates the training and validation accuracy curves across the four experimental models. GRsNet demonstrates the most stable convergence, with training accuracy reaching 95% and validation accuracy stabilizing at 89%, indicating strong generalization and robustness. In contrast, the Vision Transformer exhibits significant fluctuations, plateauing at approximately 65% for both training and validation, suggesting limited feature learning capacity under the current configuration. EfficientNetV2M achieves moderate performance, with 84% training and 76% validation accuracy, showing improvement over Vision Transformer but still lagging behind GRsNet. Meanwhile, ResNet50 records the highest training accuracy (99.34%) but a considerably lower validation accuracy (85.98%), reflecting substantial overfitting despite strong training performance.
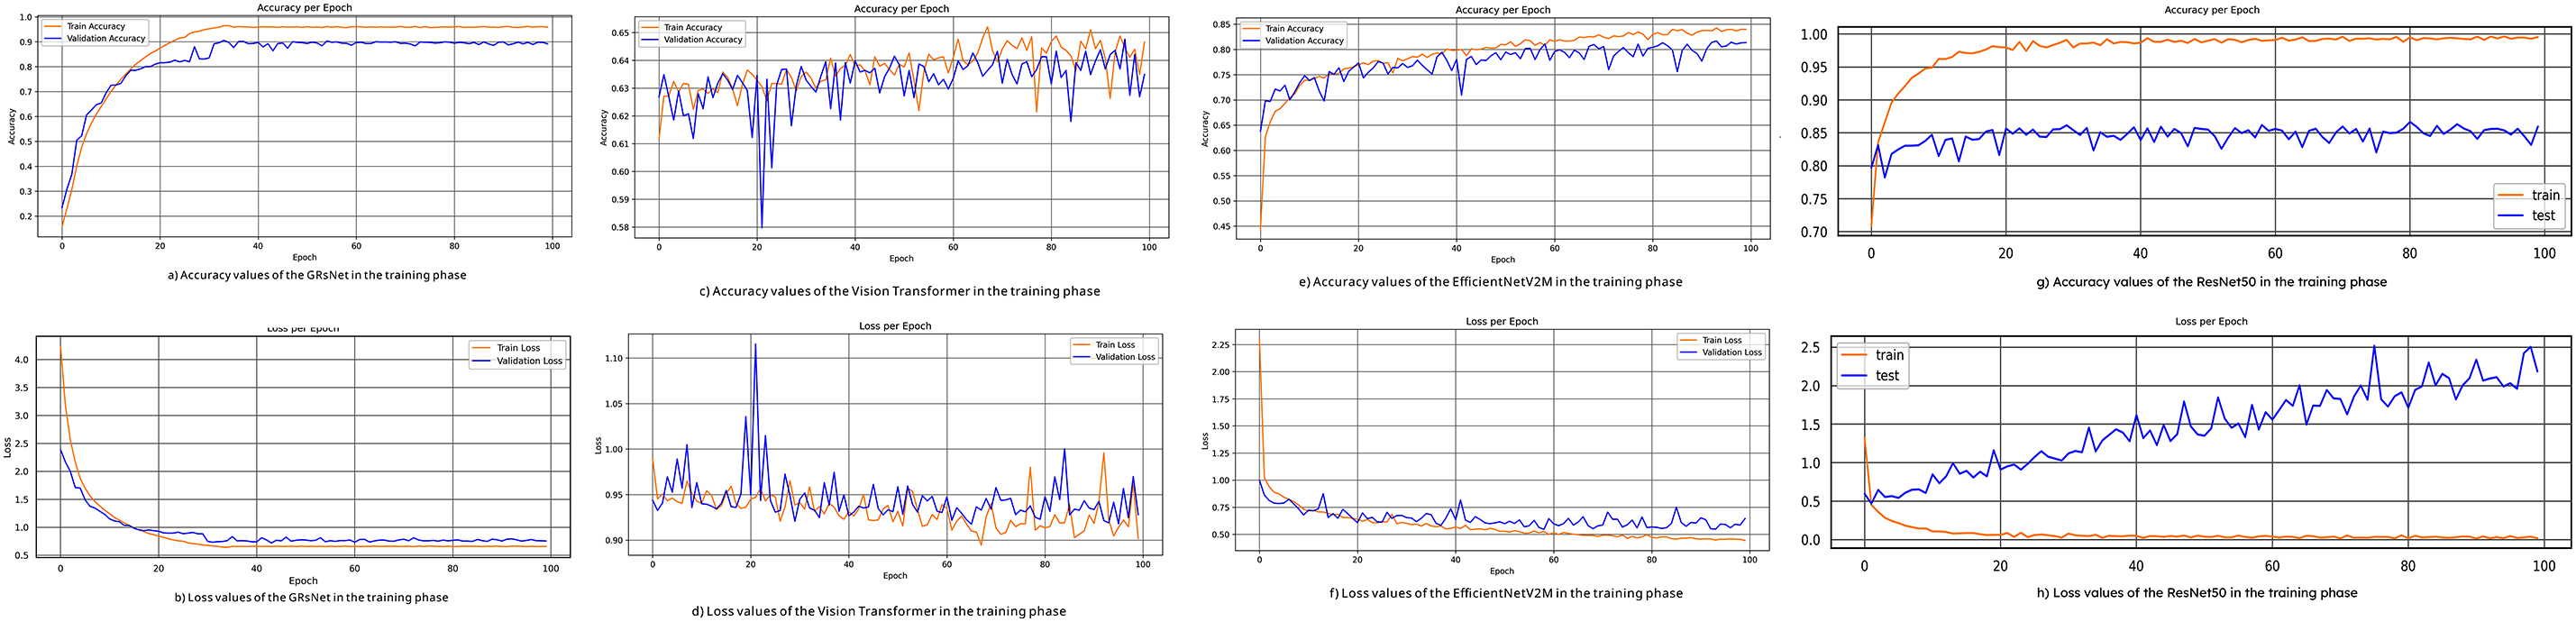
Figure 4: The accuracy and loss curves of the experimental models: (a) accuracy values of GRsNet, (b) loss values of GRsNet, (c) accuracy values of vision transformer, (d) loss values of vision transformer, (e) accuracy values of EfficientNetV2M, (f) loss values of EfficientNetV2M, (g) accuracy values of ResNet50, and (h) loss values of ResNet50
Fig. 4b,d,f,h presents the corresponding loss curves. GRsNet achieves a smooth convergence with training and validation losses of 0.62 and 0.68, respectively, confirming balanced model fitting. Vision Transformer, however, maintains relatively high and unstable losses (~0.90–0.92), consistent with its poor accuracy and unstable learning dynamics. EfficientNetV2M shows better convergence, with training and validation losses at 0.44 and 0.64, reflecting moderate generalization. ResNet50 highlights a severe overfitting pattern: while the training loss rapidly decreases to 0.0300, the validation loss remains high at 2.1845. This wide divergence indicates that the model memorizes training data effectively but generalizes poorly to unseen samples, undermining its reliability for clinical deployment.
In this study, the proposed method was evaluated using both validation and testing sets, with random sampling carefully performed to avoid any data overlap during model assessment. GRsNet demonstrates stronger generalization compared to the other models, so it has an approximation of 6% between training and validation accuracy. However, in further work, we plan to incorporate stronger regularization strategies and evaluate the proposed method on diverse datasets, complemented by expert validation, to further reduce this gap.
5.2.2 Confusion Matrix and AUC-ROC Curve
Fig. 5 shows the confusion matrices for GRsNet, Vision Transformer, EfficientNetV2M, and ResNet50, and Table 2 shows the Precision, F1-score, and Recall values for all classes of the experimental models on the test set. For GRsNet, most classes achieve high true positive rates (>0.90), except for certain morphologically similar cell types. For instance, myeloblasts (MY) are occasionally misclassified as promyelocytes (PMY) with a rate of 9%, reflecting the visual similarity between early myeloid precursors. Similarly, segmented neutrophils (SNE) are sometimes misclassified as band neutrophils (BNE) due to overlapping morphological features in nuclear segmentation. These misclassifications are clinically relevant because differentiating between early and late myeloid cells plays a critical role in diagnosing hematological malignancies such as acute myeloid leukemia. For Vision Transformer, confusion is more pronounced, with LY often misclassified as MYE and PLT, and lower overall diagonal dominance. This suggests difficulty in capturing fine-grained cytoplasmic and nuclear patterns, consistent with Vision Transformer’s (ViT’s) patch-based limitation in small-scale feature representation. The EfficientNetV2M model performs comparably to GRsNet, achieving high recognition accuracy in several categories (e.g., PLT, MYE), but still exhibits moderate confusion between morphologically adjacent cells. For instance, band neutrophils (BNE) and segmented neutrophils (SNE) are sometimes interchanged, while misclassifications between myeloblasts (MY) and promyelocytes (PMY) also persist. For ResNet50, the confusion matrix demonstrates a reasonably high performance across several classes, yet notable misclassifications remain. While most categories, such as MYE and PLT achieve strong true positive rates (~0.97–0.98), errors occur predominantly in morphologically adjacent cell types. Specifically, BNE and SNE are frequently confused, reflecting challenges in distinguishing segmented nuclear lobes from band-like structures. Additionally, MO and MY classes show overlap, indicating ResNet50’s limited ability to capture subtle cytoplasmic and nuclear variations in early myeloid cells. Compared with GRsNet, which maintains stronger diagonal dominance, ResNet50 exhibits slightly lower robustness in fine-grained morphological distinctions. This suggests that while ResNet50 remains competitive as a backbone model, it is less effective than GRsNet in resolving clinically critical borderline categories.
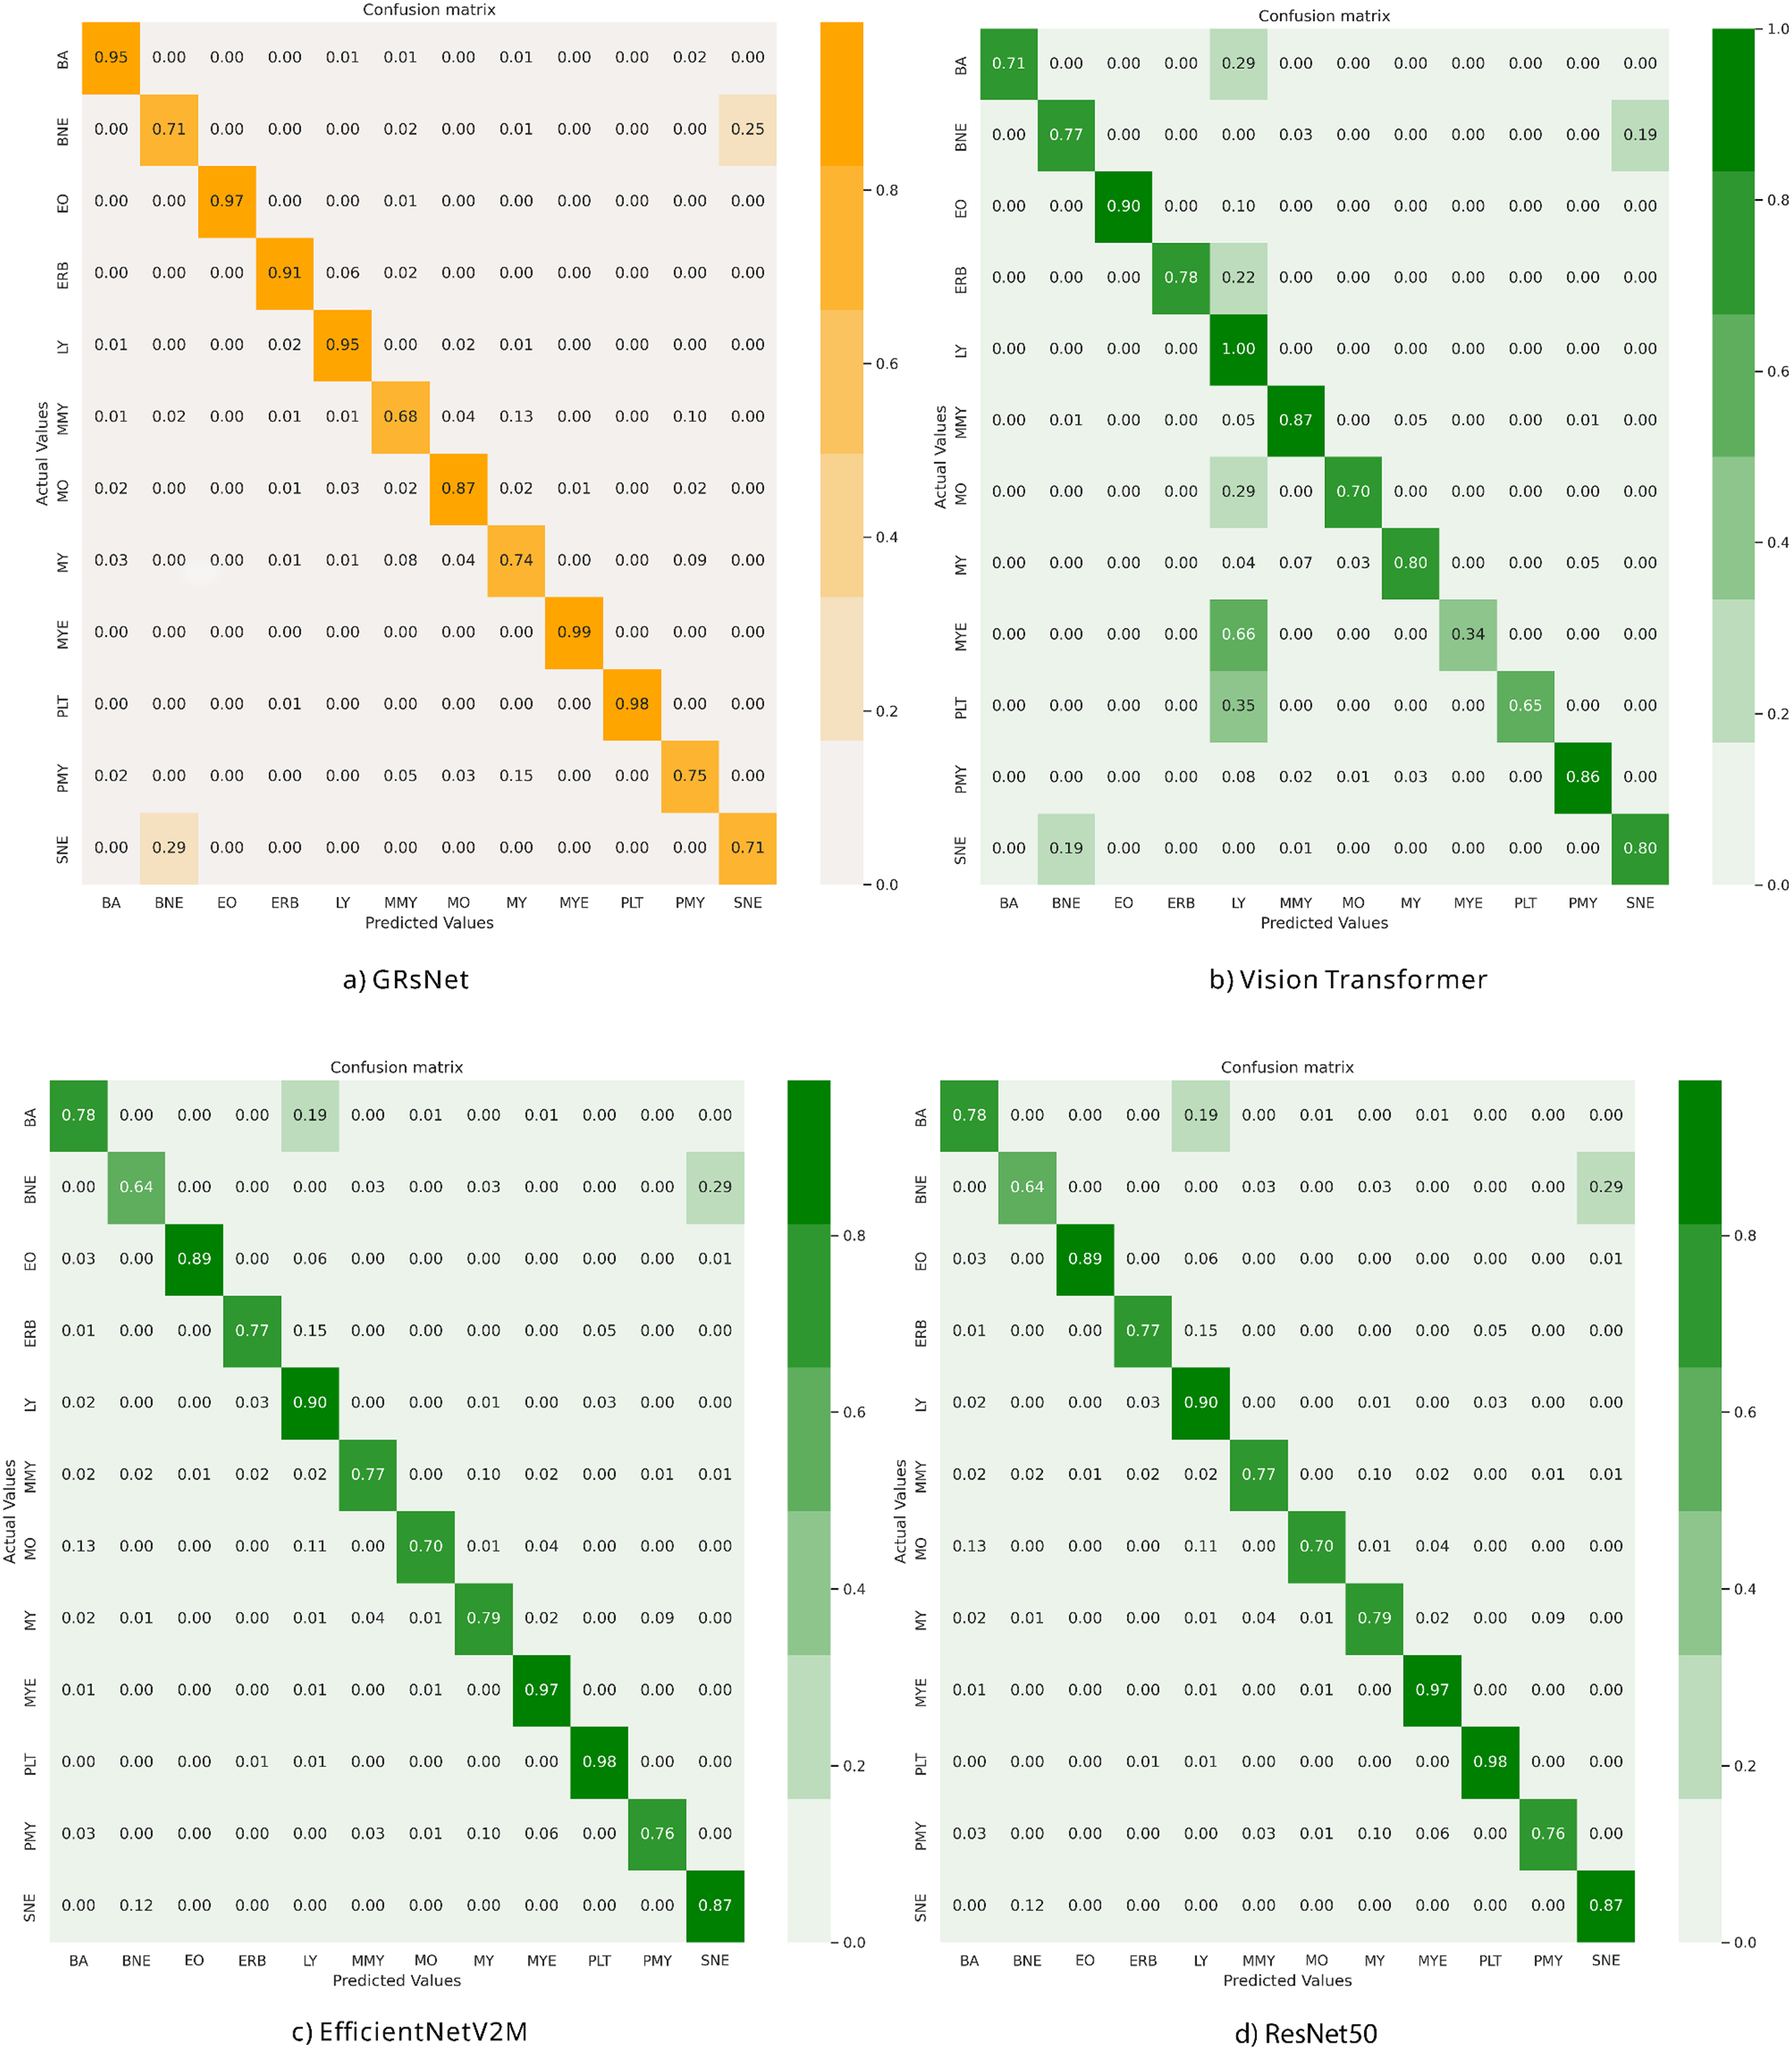
Figure 5: Confusion matrix of the experimental models on the test set: (a) GRsNet, (b) vision transformer, (c) EfficientNetV2M, and (d) ResNet50
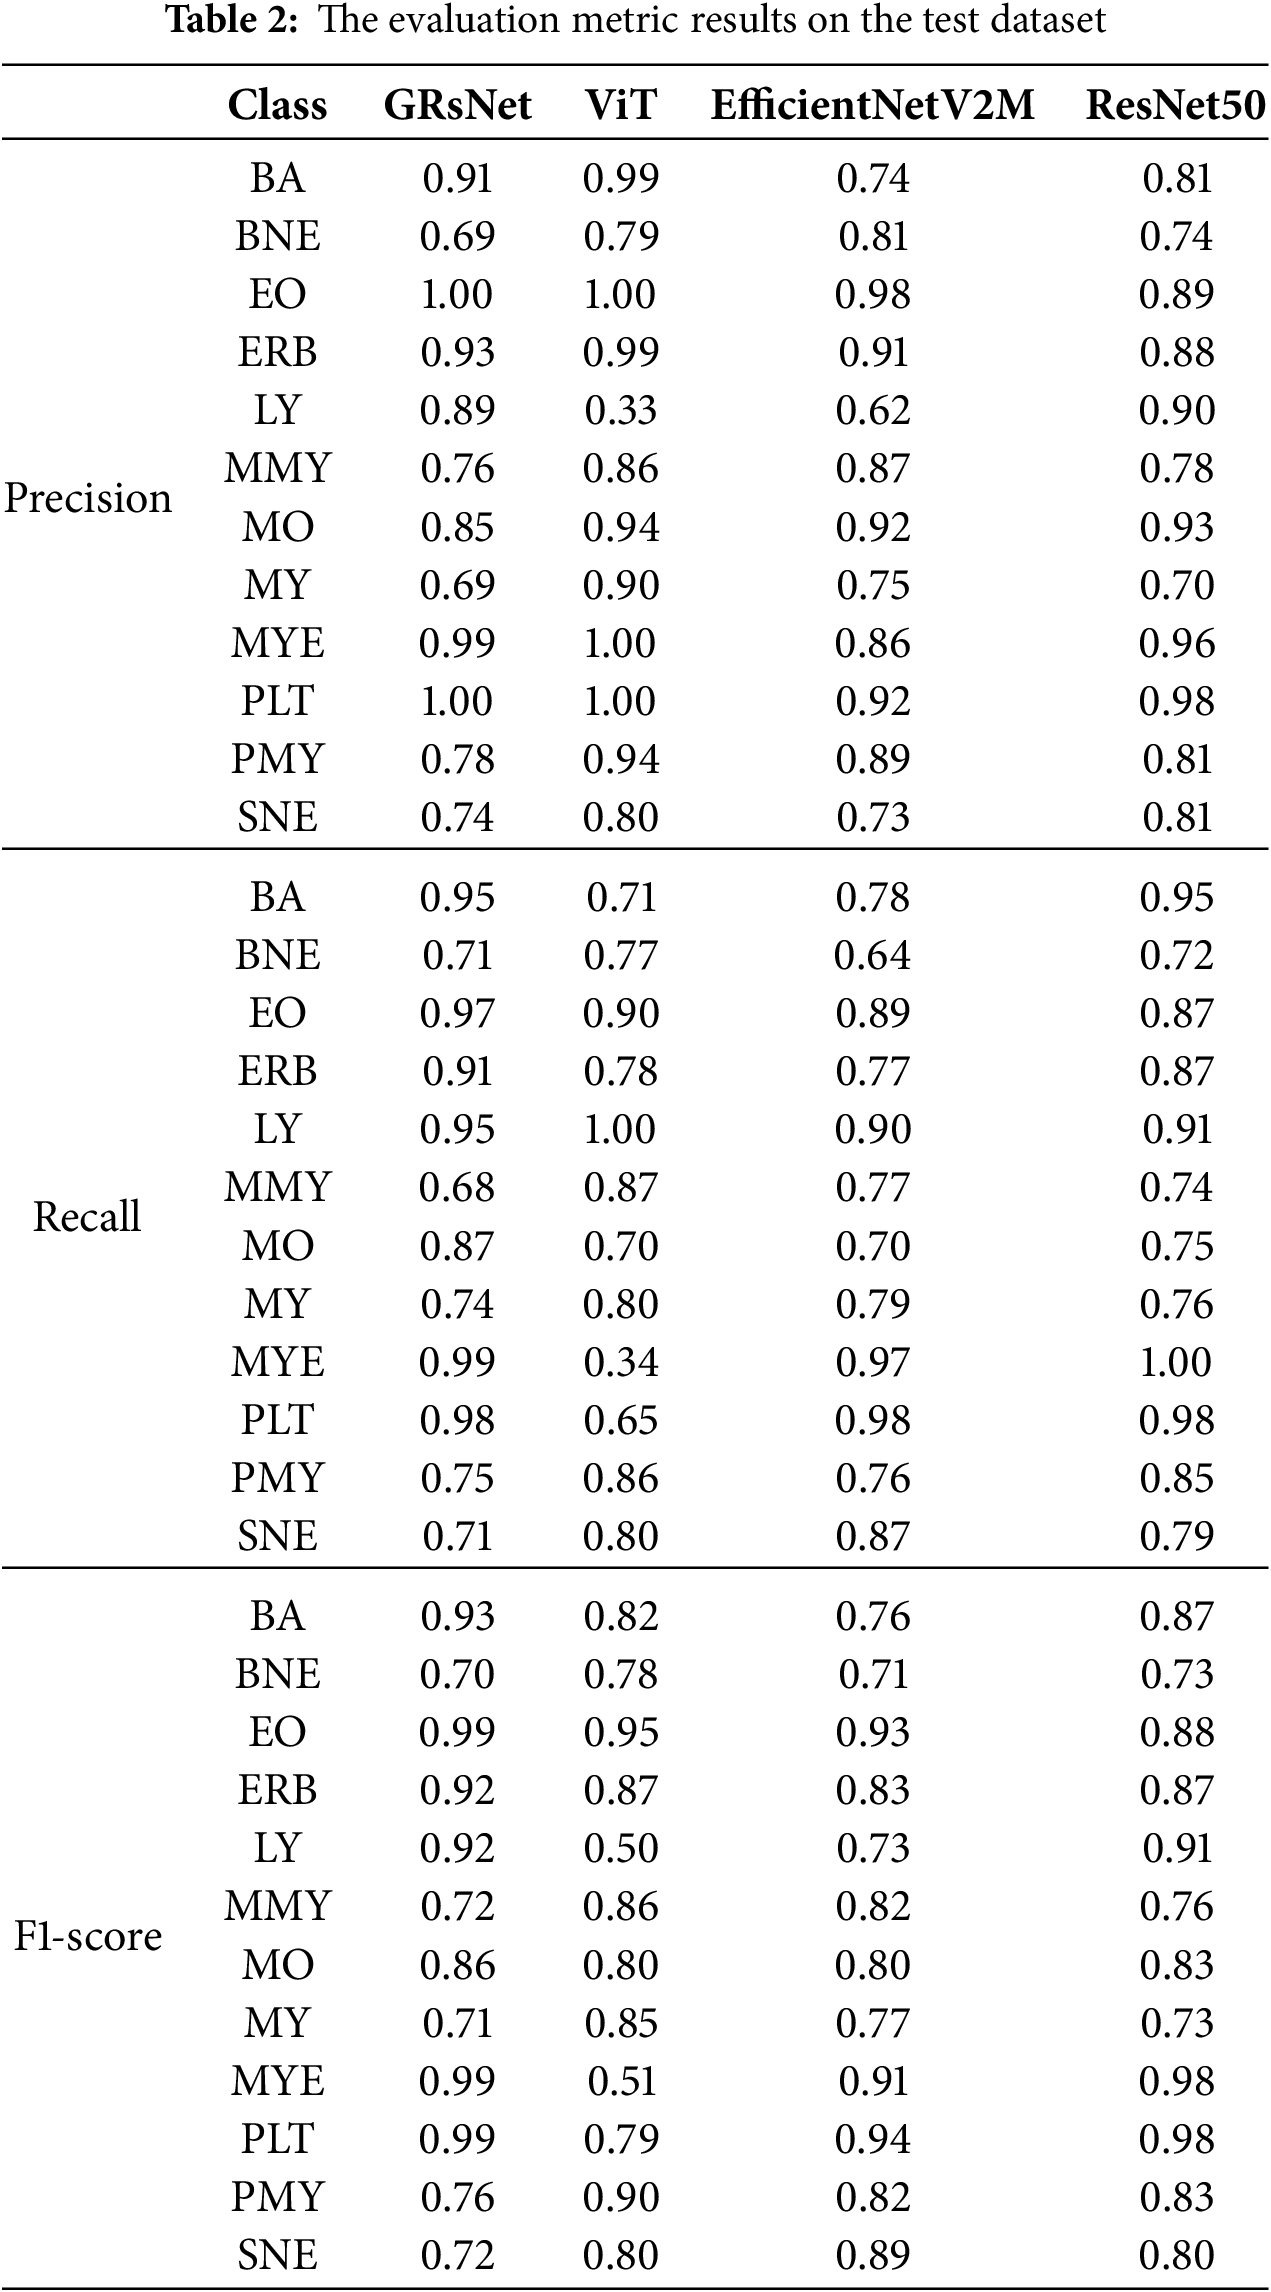
Fig. 6 illustrates the ROC-AUC curves of three different models applied to the blood cell classification task: (a) GRsNet, (b) vision transformer, (c) EfficientNetV2M, and (d) ResNet50 on the test set. For clarity, the color codes are as follows: BA (red), BNE (dark green), EO (blue), ERB (magenta), LY (cyan), MMY (orange), MO (pink), MY (purple), MYE (brown), PLT (dark blue), PMY (green), and SNE (olive). GRsNet achieves nearly perfect classification, with BA, EO, ERB, LY, MYE, and PLT all reaching AUC = 1.00. Other categories, including BNE (0.95), MMY (0.97), MO (0.99), MY (0.97), PMY (0.98), and SNE (0.96), also exhibit strong results, yielding a macro-average AUC of 0.98. EfficientNetV2M shows similarly robust performance, with ERB, EO, PLT, and SNE attaining AUC ≈ 0.98, while BNE (0.97), PMY (0.96), MO (0.96), MMY (0.96), MY (0.95), MYE (0.94), BA (0.94) and LY (0.93) remain consistently high, producing a macro-average AUC of 0.96. ResNet50 achieves scores for MYE (1.00), PLT (0.99), and BA (0.97), but slightly weaker outcomes for BNE (0.85), MO (0.87), MY (0.87), and SNE (0.89), resulting in a macro-average AUC of 0.92. By contrast, the Vision Transformer performs poorly across most categories, with BA, LY, MMY, MO, MY, and SNE all around AUC = 0.50, while only EO (0.87), PLT (0.78), and MYE (0.66) achieve moderate results. Its macro-average AUC of 0.57 confirms its inability to capture discriminative class-specific features. This can be explained by the intrinsic design of the Vision Transformer, which processes images by dividing them into fixed-size patches (e.g., 16 × 16 pixels), transforming each patch into a vector embedding, and applying self-attention. While effective for natural images with large-scale structures, this approach is not optimal for microscopic blood cell images, where crucial discriminative features—such as chromatin texture, membrane irregularities, and cytoplasmic granules—are often highly localized within only a few pixels. The coarse patching process causes these microstructural details to be averaged out or blended with background regions, resulting in the loss of fine-grained morphological cues essential for accurate classification. Consequently, ViT struggles to capture the subtle variations between different blood cell types, leading to degraded performance compared to architectures like GRsNet and EfficientNetV2M.
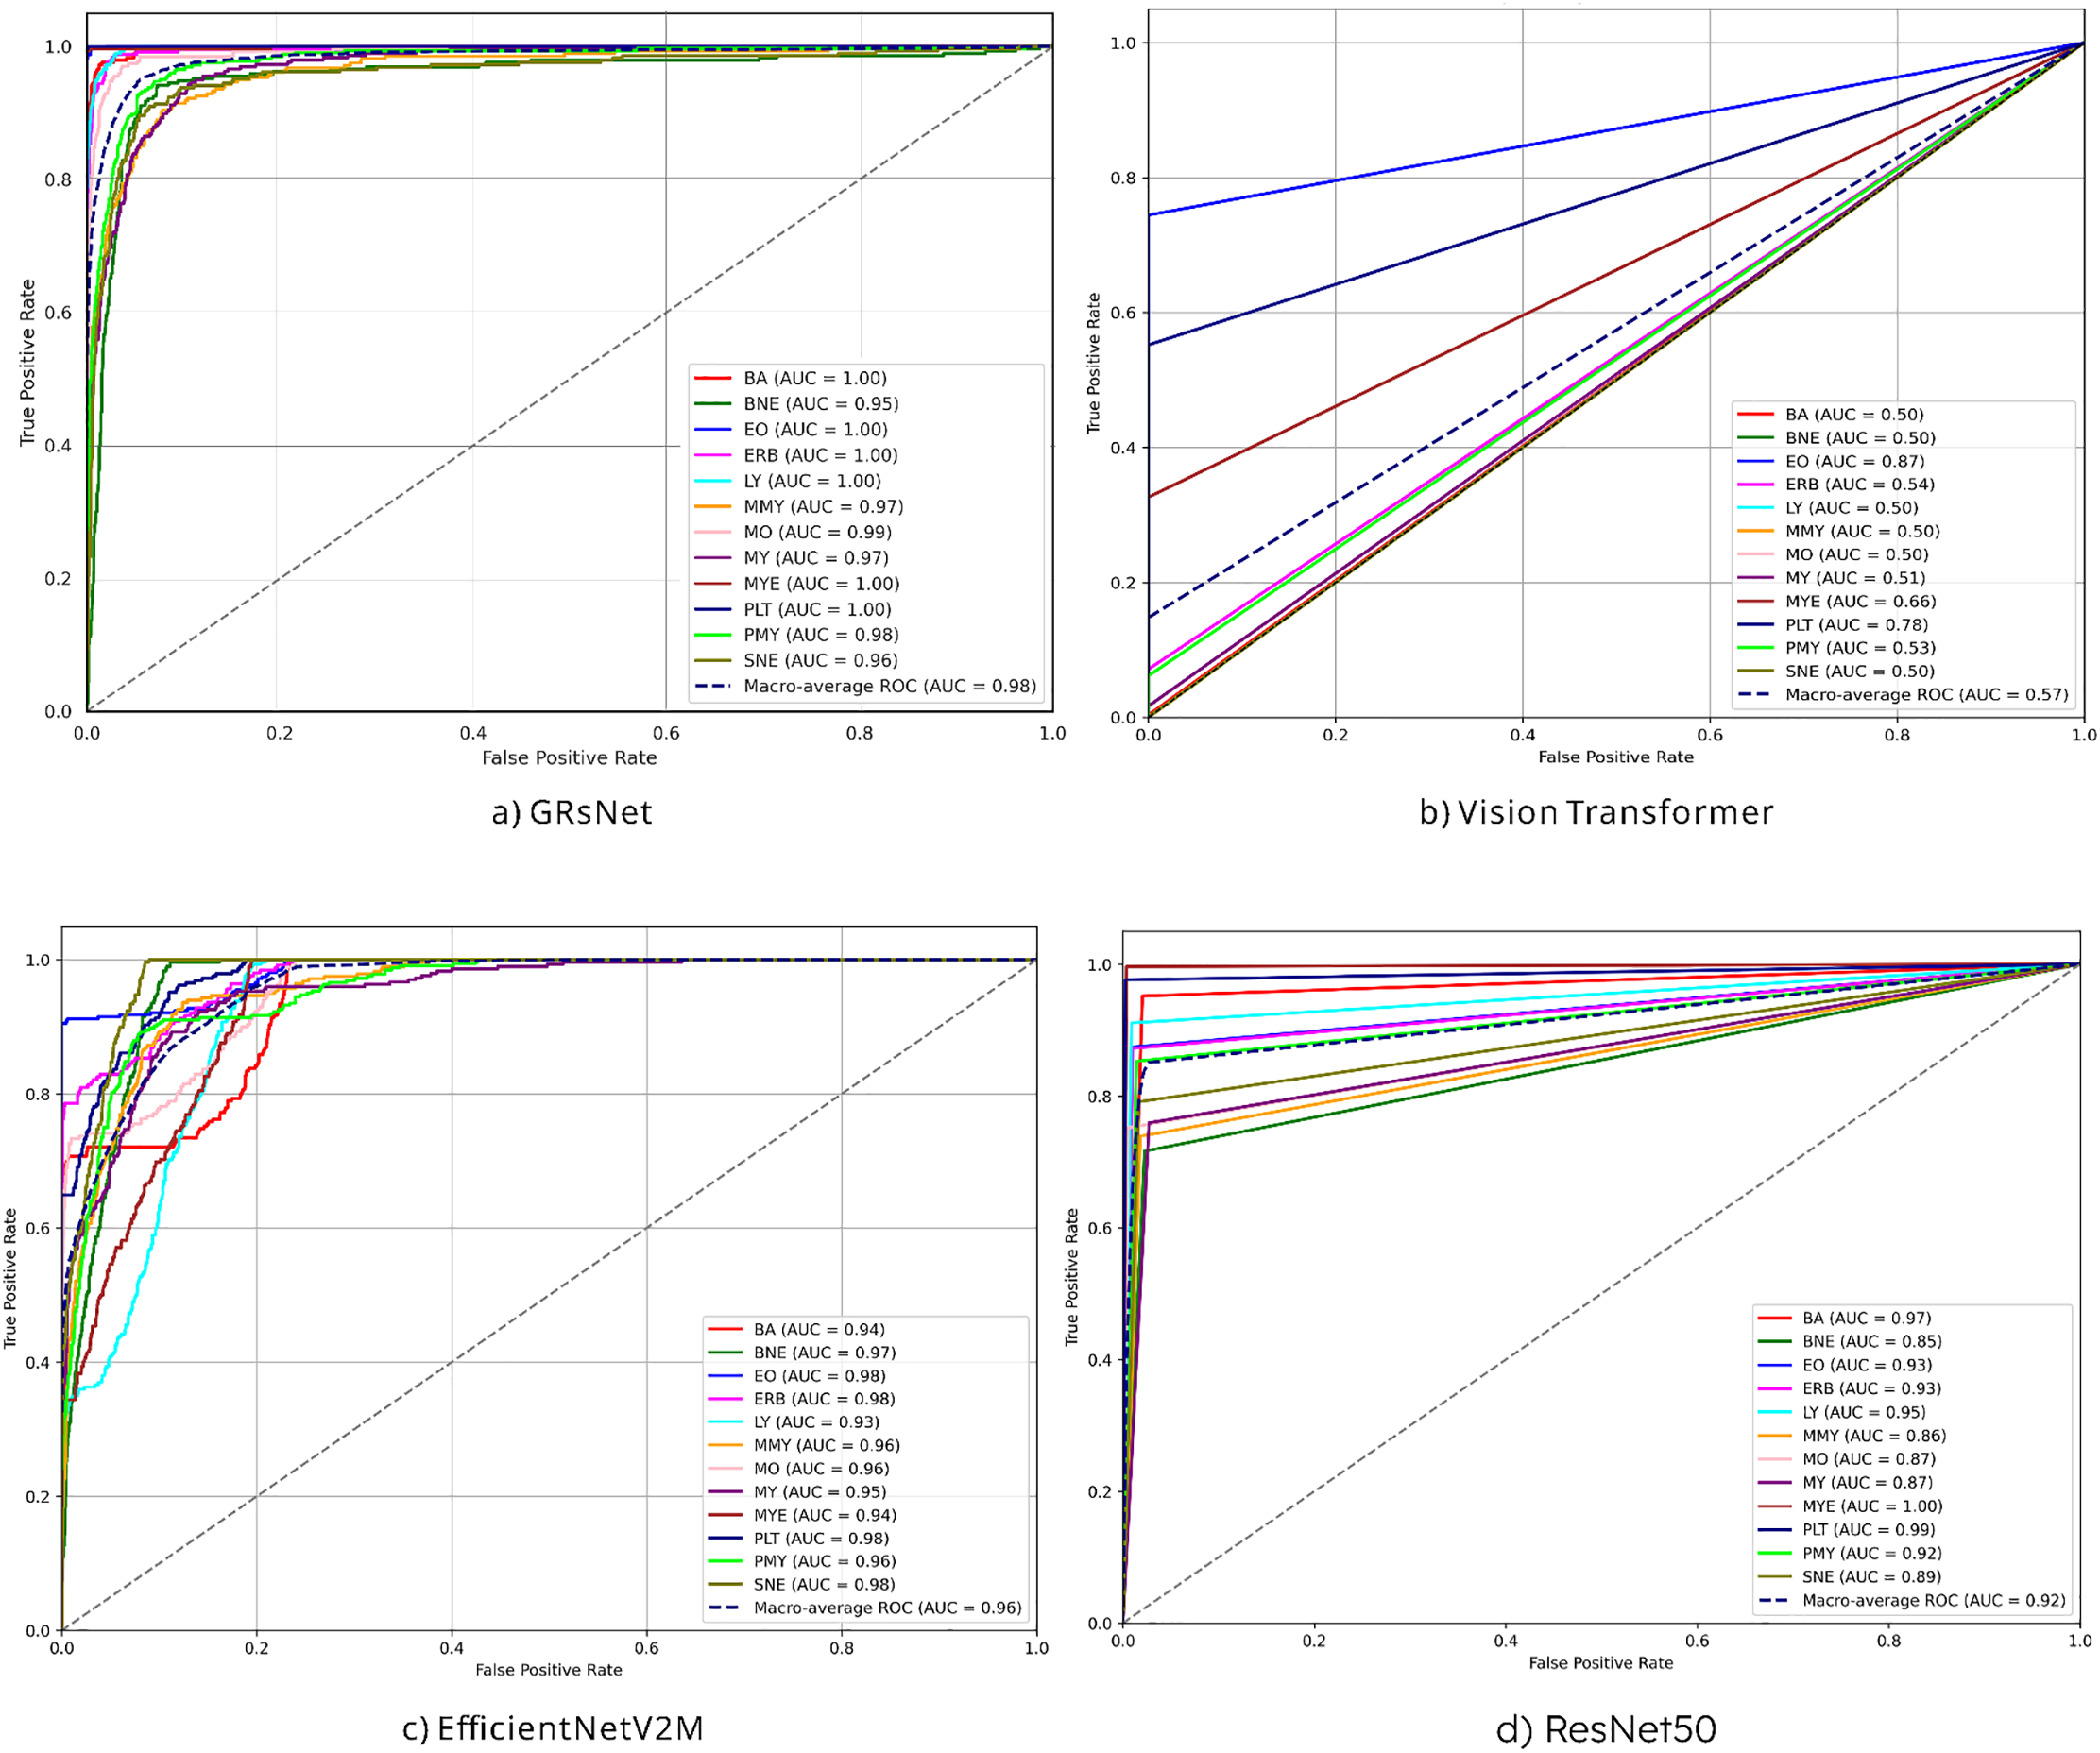
Figure 6: AUC-ROC of experimental models on the test set: (a) GRSNet, (b) vision transformer, (c) EfficientNetV2M, and (d) ResNet50
5.2.3 Training and Testing Time
Table 3 presents a comparative evaluation of GRsNet against three state-of-the-art deep learning models, including Vision Transformer, EfficientNetV2M, and ResNet50, based on training/testing time and accuracy. In terms of training and testing time, Vision Transformer is the fastest to train (402 min) and test (3.8 min). GRsNet exhibits a moderate training time of 510 min and a relatively fast testing time of 4.7 min, while EfficientNetV2M and ResNet50 are the most time-consuming, requiring 876 and 1014 min for training and 18.7 and 15.6 min for testing, respectively. Regarding accuracy, ResNet50 attains the highest training accuracy (99.3%) but drops considerably in testing accuracy (85.3%), suggesting potential overfitting. GRsNet demonstrates a well-balanced performance with 95.4% training accuracy and the highest testing accuracy of 89.5%, outperforming all competing models in generalization. EfficientNetV2M achieves moderate results (83.9% training and 81.7% testing), while Vision Transformer records the lowest accuracy (65.1% training and 69.7% testing). Overall, GRsNet strikes the best balance between accuracy and computational efficiency among the evaluated models.
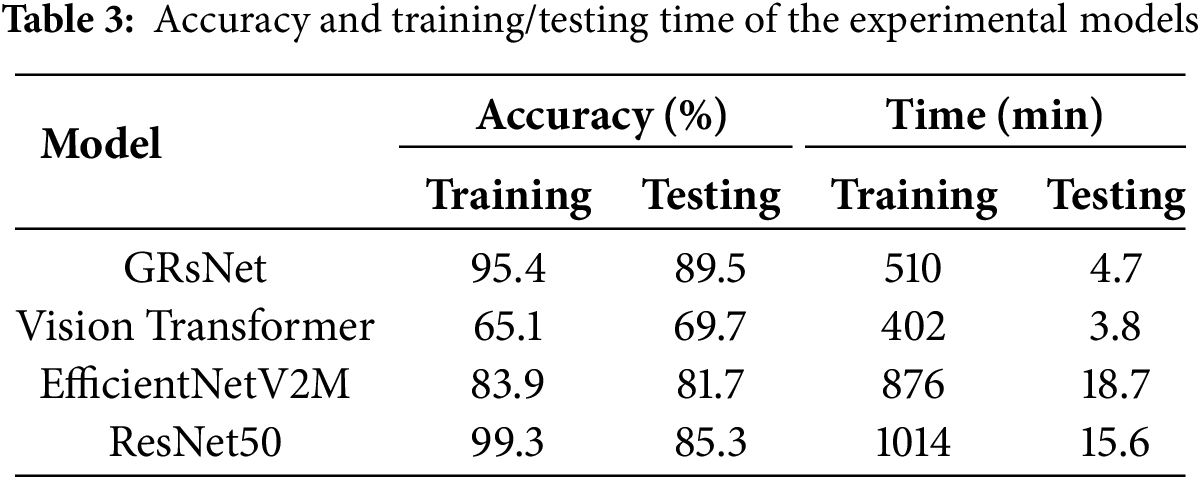
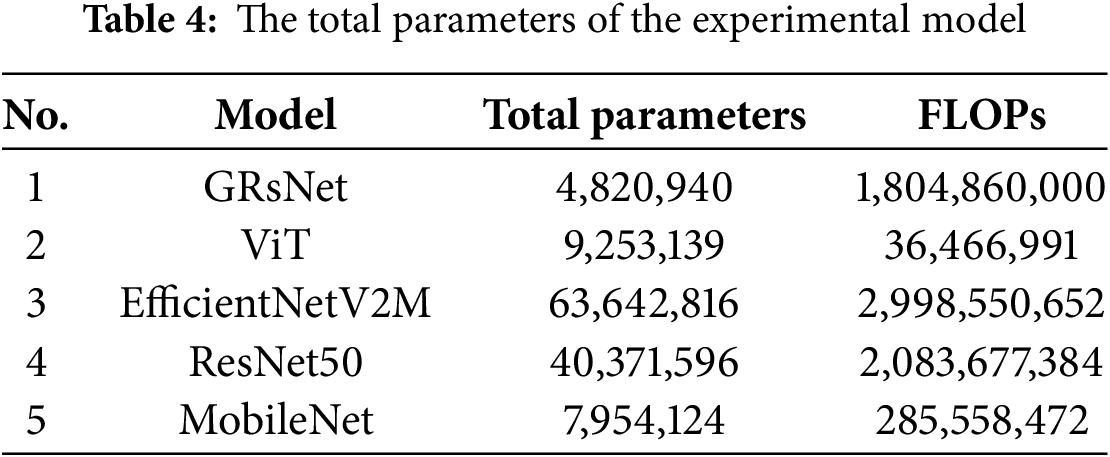
Table 4 summarizes the total parameters and FLOPs for GRsNet and several well-established architectures, including ViT, EfficientNetV2M, ResNet50, and MobileNet. GRsNet contains 4.82 million parameters, which is significantly lower than EfficientNetV2M (63.64M, ↓ ~13.2×) and ResNet50 (40.37M, ↓ ~8.4×), while also requiring fewer FLOPs (1.80B vs. 2.99B and 2.08B, respectively). Compared to MobileNet, although GRsNet has a moderately higher number of parameters (+0.87×) and FLOPs (+6.3×), its architecture is designed to achieve higher accuracy through Ghost Bottlenecks while maintaining computational efficiency. In contrast to the Vision Transformer, GRsNet achieves a much better balance between accuracy and complexity, as the Vision Transformer’s FLOPs (36.47M) are lower, but its parameter count (9.25M) is almost double, potentially leading to suboptimal feature extraction for the given task. These comparisons demonstrate that GRsNet provides a favorable trade-off between model size, computational cost, and accuracy, making it a suitable choice for scenarios where both efficiency and classification performance are critical.
Tables 5–7 present the evaluation results of the GRsNet model applied to the classification of blood cells in microscopic slide images, with the integration of Explainable Artificial Intelligence (XAI) techniques. The numerical values reported in this section (e.g., “Eosinophils (EO, 95.66%)”) represent the prediction confidence of the model on the test dataset, indicating how certain the model is about its classification decision for each blood cell type. These values are used alongside the explainable AI (XAI) visualizations to provide a quantitative reference for interpreting the model’s decision-making process. The experimental findings indicate that GRsNet achieves classification accuracy ranging from 80% to 95%, depending on the blood cell type. These results demonstrate the model’s strong capability in extracting visual features and delivering accurate classifications across diverse cell types. To enhance interpretability, Grad-CAM, LIME, and SHAP techniques were employed to highlight the image regions that most significantly influenced the model’s predictions.


As illustrated in Table 5, Grad-CAM visualizations display heatmaps in red, yellow, and cyan, corresponding to the areas with the highest impact on the classification outcome—indicating where the model concentrated during its decision-making. Conversely, other color regions reflect lower or minimal influence. For Eosinophils (EO, 95.66%), GRsNet sharply focuses on the bilobed nucleus and coarse, reddish cytoplasmic granules, which are key diagnostic features. In contrast, EfficientNetV2M exhibits a misclassification case, predicting an EO as a Myeloblast (MYE, 97.45% confidence), with Grad-CAM activations distributed more broadly across surrounding regions rather than being localized to the nuclear structures. In Erythroblasts (ERB, 93.53%), GRsNet emphasizes the large, round nucleus with fine chromatin and the thin rim of cytoplasm, while EfficientNetV2M produces more diffuse activation that partially extends into background regions. For Monocytes (MO, 95.04%), GRsNet demonstrates higher precision by also highlighting the lightly basophilic cytoplasm, thereby aligning more closely with morphological criteria, while EfficientNetV2M misclassifies MO as a Myeloblast (MYE, 93.87% confidence), with Grad-CAM activations dispersed across cytoplasmic regions and failing to capture the distinctive nuclear shape. In Myeloblasts (MYE, 92.17%), EfficientNetV2M highlights nucleolar regions similar to GRsNet, yet its attention is less stable, whereas GRsNet consistently activates over the large central nucleus with prominent nucleoli, a hallmark of immature granulocytes. For Pro-myelocytes (PMY, 80.24%), GRsNet effectively captures both nuclear and azurophilic granules, whereas EfficientNetV2M achieves a correct prediction but with relatively low confidence. The Grad-CAM visualization reveals dispersed activations, with attention spreading into surrounding background regions rather than being concentrated on nuclear and cytoplasmic granule features. This indicates weaker localization of diagnostically relevant cues and limited robustness in distinguishing PMY cells compared to GRsNet. Finally, for Segmented neutrophils (SNE, 90.92%), GRsNet produces well-localized activations over the multi-lobed nucleus, a critical discriminative feature, while EfficientNetV2M displays broader and less specific activations. Overall, these findings highlight that although EfficientNetV2M achieves competitive classification accuracy, GRsNet provides more precise and morphologically consistent explanations, reinforcing its interpretability and reliability in blood cell classification.
In Table 6, the LIME technique offers additional insights by constructing local surrogate models around each prediction to assess regional importance. For MYE cells, LIME visualization reveals that the classifier emphasizes not only the central nucleus with granular chromatin but also the periphery of the cytoplasm. For Eosinophils (EO, 92.50%), GRsNet produces yellow-outlined superpixels that tightly cover the bilobed nucleus and the dense reddish cytoplasmic granules—features that are biologically characteristic of eosinophils. By contrast, EfficientNetV2M, despite achieving a relatively high confidence of 93.01%, partially misclassifies the same cell as MYE, with its LIME segmentation spreading into non-discriminative cytoplasmic areas, indicating weaker morphological focus. For Segmented neutrophils (SNE, 82.76%), GRsNet accurately highlights the multi-lobed nucleus and adjacent cytoplasmic regions, which are essential for differentiating mature neutrophils from immature forms. In contrast, EfficientNetV2M misclassifies SNE as a Myeloblast (MYE, 78.89%), with LIME outlines dispersed and less concentrated on the nuclear lobes, suggesting limited reliability in capturing the defining morphological traits.
Table 7 illustrates the effectiveness of the SHAP technique in interpreting the predictions made by the blood cell classification model. Each row presents a different cell type (EO, PMY, MYE, SNE), accompanied by the original image, the prediction result, and the corresponding SHAP explanation map. For Eosinophil (EO), the model achieves a highly confident prediction with 95.66%. The SHAP heatmap highlights yellow-blue regions concentrated around the nucleus, emphasizing that the nuclear region contains key morphological features driving the model’s decision. EfficientNetV2M, despite showing a relatively high confidence, misclassifies EO as MYE due to broader and less discriminative activations beyond the nuclear boundary. Similarly, in the case of Pro-myelocyte (PMY), although the confidence is lower at 80.24%, the bright regions on the SHAP map are still focused around the nucleus, suggesting that the model is able to identify important discriminative features even in cases of moderate confidence. EfficientNetV2M produces a correct prediction, the confidence is relatively low at 48.15%. The SHAP map reveals dispersed and partially misaligned activations that extend beyond the nuclear and cytoplasmic regions, suggesting weaker localization of discriminative morphological features and limited robustness compared to GRsNet. For Myeloblasts (MYE, 96.16%), both GRsNet and EfficientNetV2M correctly classify the samples. However, GRsNet’s SHAP maps focus more sharply on the large central nucleus and prominent nucleoli—key indicators of MYE—while the explanations from EfficientNetV2M, although correct, are more diffuse and extend into less relevant cytoplasmic regions. Finally, for segmented neutrophils (SNE, 95.85%), GRsNet accurately identifies the cell, with SHAP explanations emphasizing the multi-lobed nucleus, the defining characteristic of SNE, while EfficientNetV2M shows more scattered activations and misclassifies SNE as MYE. Overall, the SHAP technique demonstrates strong capability in visually identifying the regions most influential to the model’s predictions, enhancing the interpretability and transparency of deep learning models in medical imaging tasks.
Unlike prior research, which has primarily emphasized white blood cell classification, this study introduces a broader coverage within the evaluated dataset approach that targets a broader spectrum of blood cell types associated with various hematological disorders, including anemia and leukemia. By leveraging state-of-the-art deep learning architectures and integrating XAI techniques, the proposed method not only achieves high performance in classification but also provides transparency in its decision-making process. This interpretability fosters greater confidence in clinical applications, making the system more reliable and trustworthy for practical deployment in healthcare settings. Additionally, to preliminarily assess the clinical validity of the XAI results, a board-certified hematologist has reviewed a subset of the predicted outputs and corresponding XAI visualizations (Tables 5–7). The expert confirmed that the highlighted regions largely correspond to key morphological features used in clinical diagnosis, such as bilobed nuclei in eosinophils and multi-lobed nuclei in segmented neutrophils. While this preliminary validation provides encouraging evidence that the model’s explanations align with clinical reasoning, extensive evaluation across a larger panel of experts and diverse clinical datasets will be necessary in future work to fully establish clinical robustness.
Table 8 presents a comparative analysis of classification accuracy among various state-of-the-art models for blood cell classification. Most of the studies focused on classifying 3 to 4 types of blood cells and achieved accuracy ranging from 89% to 96%. Swaminathan et al. [10] used the DETR model with an accuracy of 89% when detecting three blood cell types. On the other hand, Heni et al. [5] attained high accuracy (96%) using the VGG19 architecture for classifying four types of blood cells. However, these studies primarily targeted a limited number of cell categories. In the proposed model, GRsNet successfully classifies 12 different types of blood cells, achieving an impressive training accuracy of up to 95%. This result contributes to the development of intelligent systems, particularly in the field of hematology, where accurate multi-class classification is essential.

Nevertheless, the model still has several limitations, including a relatively high training loss, the need for expert medical validation, and the lack of evaluation across diverse datasets to ensure generalizability and reliability. In future work, we aim to optimize the algorithm to reduce loss, expand experiments on more diverse datasets, and collaborate with clinical experts to fine-tune and validate the model. These efforts will be essential steps toward developing an intelligent, adaptive, and highly automated healthcare system.
In developing countries, blood cell disorders such as anemia, leukemia, and other hematological abnormalities are increasingly prevalent, posing significant threats to public health and quality of life. Accurate and timely diagnosis of abnormal blood cells is crucial for early detection and effective treatment of blood-related diseases. However, the manual examination of blood smears under a microscope remains heavily reliant on medical expertise, which can lead to diagnostic errors and delays. Moreover, most existing studies have primarily focused on classifying blood cells for leukemia diagnosis, while other blood disorders, such as anemia, coagulation disorders, parasitic infections, or morphological abnormalities, have received limited attention. This results in a lack of comprehensive classification systems capable of addressing the diverse spectrum of blood cell abnormalities, thereby limiting the practical application of such models in clinical settings. Another challenge is that several previous works have not integrated Explainable Artificial Intelligence (XAI) techniques, making classification outcomes less transparent and harder to accept in medical environments, where explainability and trustworthiness are essential. To address these gaps, our study proposes an automated blood cell classification system from peripheral blood smear images, utilizing advanced deep learning models integrated with Explainable AI (XAI) techniques such as Grad-CAM, LIME, and SHAP. These techniques help visualize the specific image regions the model focuses on during classification, thereby enhancing interpretability and aiding healthcare professionals in understanding the rationale behind each decision. Experimental results demonstrate that our model achieves 95% prediction accuracy during training and 89% accuracy on the test dataset while providing transparent explanations for its predictions. This significantly supports clinicians in making faster and more reliable diagnoses. Additionally, we recognize that expert validation is not merely an optional step but a critical requirement for ensuring the clinical reliability and acceptance of AI-based diagnostic tools. Our approach contributes to the digital transformation of healthcare in developing regions, enhances medical decision-making, reduces reliance on limited expert resources, and improves treatment efficiency in clinical environments. Future work will focus on expanding the dataset to include rare and diagnostically critical abnormalities while also incorporating data from different hospitals to ensure comprehensive validation of the model’s robustness across diverse and clinically representative blood cell disorders.
Acknowledgement: We wish to extend sincere thanks to the Vinh Long University of Technology Education and the Dong Thap Medical College, as well as to the colleagues for their valuable support of this research. We would like to sincerely thank Assoc. Prof. Dr. Nguyen Thanh Tung, rector of Vinh Long University of Technical Education, for his support in the supervision, review process and for providing financial support for the article processing charge (APC).
Funding Statement: This research received no specific grant from any funding agency in the public, commercial, or not-for-profit sectors.
Author Contributions: The authors confirm contribution to the paper as follows: Methodology, Ngoc-Hoang-Quyen Nguyen and Anh-Cang Phan; Formal analysis, Anh-Cang Phan; Data curation, Ngoc-Hoang-Quyen Nguyen; Writing—original draft preparation, Ngoc-Hoang-Quyen Nguyen; Writing—review and editing, Anh-Cang Phan and Thanh-Tung Nguyen; Visualization, Ngoc-Hoang-Quyen Nguyen; Supervision, Anh-Cang Phan and Thanh-Tung Nguyen; Financial support: Thanh-Tung Nguyen. All authors reviewed the results and approved the final version of the manuscript.
Availability of Data and Materials: The datasets used in this study are publicly available: Naturalize 2K-PBC (https://www.kaggle.com/datasets/mohamadabouali1/blood-cells-dataset-11-classes-26,534-images, accessed on 08 October 2025) and Microscopic Blood Cell (https://doi.org/10.34740/KAGGLE/DSV/10500753).
Ethics Approval: Not applicable.
Conflicts of Interest: The authors declare no conflicts of interest to report regarding the present study.
References
1. LeukLeukemia & Lymphoma Societyemia. Facts and Statistics Overview [Internet]. [cited 2025 Jun 4]. Available from: https://www.lls.org/facts-and-statistics-overview. [Google Scholar]
2. American Cancer Society. Key statistics for acute myeloid leukemia (AML) [Internet]. [cited 2025 Jun 4]. Available from: https://www.cancer.org/cancer/acute-myeloid-leukemia/about/key-statistics.html. [Google Scholar]
3. Shah SA, Soomro U, Ali O, Tariq Y, Waleed MS, Guntipalli P, et al. The prevalence of anemia in working women. Cureus. 2023;15(8):e44104. doi:10.7759/cureus.44104. [Google Scholar] [PubMed] [CrossRef]
4. Cheng W, Liu J, Wang C, Jiang R, Jiang M, Kong F. Application of image recognition technology in pathological diagnosis of blood smears. Clin Exp Med. 2024;24(1):181. doi:10.1007/s10238-024-01379-z. [Google Scholar] [PubMed] [CrossRef]
5. Heni A, Jdey I, Ltifi H. Blood cells classification using deep learning with customized data augmentation and EK-means segmentation. J Theor Appl Inf Technol. 2023;101(3):1162–73. [Google Scholar]
6. Wang X, Pan G, Hu Z, Ge A. A two stage blood cell detection and classification algorithm based on improved YOLOv7 and EfficientNetv2. Sci Rep. 2025;15(1):8427. doi:10.1038/s41598-025-91720-7. [Google Scholar] [PubMed] [CrossRef]
7. Khan RU, Almakdi S, Alshehri M, Haq AU, Ullah A, Kumar R. An intelligent neural network model to detect red blood cells for various blood structure classification in microscopic medical images. Heliyon. 2024;10(4):e26149. doi:10.1016/j.heliyon.2024.e26149. [Google Scholar] [PubMed] [CrossRef]
8. Mondal SK, Md Talukder SH, Aljaidi M, Sulaiman RB, Md Tushar MS, Alsuwaylimi AA. BloodCell-Net: a lightweight convolutional neural network for the classification of all microscopic blood cell images of the human body. arXiv:2405.14875. 2024. [Google Scholar]
9. Zhu Z, Ren Z, Lu S, Wang S, Zhang Y. DLBCNet: a deep learning network for classifying blood cells. Big Data Cogn Comput. 2023;7(2):75. [Google Scholar] [PubMed]
10. Swaminathan LG, Giridharan J, Kulkarni J, Visvanathan R, Reka SS. Efficient blood cell detection with Detr: a novel approach for automated hematological image analysis. SN Comput Sci. 2025;6(3):202. doi:10.1007/s42979-025-03769-w. [Google Scholar] [CrossRef]
11. Meenakshi A, Ruth JA, Kanagavalli VR, Uma R. Automatic classification of white blood cells using deep features based convolutional neural network. Multimed Tools Appl. 2022;81(21):30121–42. doi:10.1007/s11042-022-12539-2. [Google Scholar] [CrossRef]
12. Elhassan TA, Mohd Rahim MS, Siti Zaiton MH, Swee TT, Alhaj TA, Ali A, et al. Classification of atypical white blood cells in acute myeloid leukemia using a two-stage hybrid model based on deep convolutional autoencoder and deep convolutional neural network. Diagnostics. 2023;13(2):196. doi:10.3390/diagnostics13020196. [Google Scholar] [PubMed] [CrossRef]
13. Başaran E. Classification of white blood cells with SVM by selecting SqueezeNet and LIME properties by mRMR method. Signal Image Video Process. 2022;16(7):1821–9. doi:10.1007/s11760-022-02141-2. [Google Scholar] [CrossRef]
14. Hegde RB, Prasad K, Hebbar H, Sandhya I. Peripheral blood smear analysis using image processing approach for diagnostic purposes: a review. Biocybern Biomed Eng. 2018;38(3):467–80. doi:10.1016/j.bbe.2018.03.002. [Google Scholar] [CrossRef]
15. Kundrapu S, Noguez J. Chapter six—laboratory assessment of anemia. Adv Clin Chem. 2018;83:197–225. [Google Scholar]
16. Arrieta AB, Diaz-Rodriguez N, Del Ser J, Bennetot A, Tabik S, Barbado A, et al. Explainable artificial intelligence (XAIconcepts, taxonomies, opportunities and challenges toward responsible AI. Inf Fusion. 2020;58(3):82–115. doi:10.1016/j.inffus.2019.12.012. [Google Scholar] [CrossRef]
17. Selvaraju RR, Cogswell M, Das A, Vedantam R, Parikh D, Batra D. Grad-CAM: visual explanations from deep networks via gradient-based localization. Int J Comput Vis. 2020;128(2):336–59. doi:10.1109/iccv.2017.74. [Google Scholar] [CrossRef]
18. Ribeiro MT, Singh S, Guestrin C. Why should I trust you?: explaining the predictions of any classifier. In: Proceedings of NAACL-HLT 2016—Demonstrations; 2016 Jun 12–17; San Diego, CA, USA. p. 113–7. [Google Scholar]
19. Lundberg SM, Lee SI. A unified approach to interpreting model predictions. Adv Neural Inf Process Syst. 2017;30:1–10. [Google Scholar]
20. He K, Zhang X, Ren S, Sun J. Deep residual learning for image recognition. In: Proceedings of the IEEE Conference on Computer Vision and Pattern Recognition; 2016 Jun 27–30; Las Vegas, NV, USA. p. 770–8. [Google Scholar]
21. Ali AM, Dornaika F, Arganda-Carreras I. Blood cell revolution: unveiling 11 distinct types with ‘naturalize’ augmentation. Algorithms. 2023;16(12):562. doi:10.3390/a16120562. [Google Scholar] [CrossRef]
22. Kothwal SS. Blood cell images for cancer detection [Datasets]. [cited 2025 Jun 4]. Available from: https://www.kaggle.com/datasets/sumithsingh/blood-cell-images-for-cancer-detection. [Google Scholar]
Cite This Article
 Copyright © 2025 The Author(s). Published by Tech Science Press.
This work is licensed under a Creative Commons Attribution 4.0 International License , which permits unrestricted use, distribution, and reproduction in any medium, provided the original work is properly cited.
 Downloads
 Citation Tools