
 Submit a Paper
 Propose a Special lssue
 Open Access
ARTICLE

MITRE ATT&CK-Driven Threat Analysis for Edge-IoT Environment and a Quantitative Risk Scoring Model
1 Department of Computer Education, Sungkyunkwan University, Seoul, 03063, Republic of Korea
2 Department of Computer Education/Social Innovation Convergence Program, Sungkyunkwan University, Seoul, 03063, Republic of Korea
* Corresponding Author: Moohong Min. Email:
(This article belongs to the Special Issue: Cutting-Edge Security and Privacy Solutions for Next-Generation Intelligent Mobile Internet Technologies and Applications)
Computer Modeling in Engineering & Sciences 2025, 145(2), 2707-2731. https://doi.org/10.32604/cmes.2025.072357
Received 25 August 2025; Accepted 27 October 2025; Issue published 26 November 2025
 View Full Text
 Download PDF
Abstract
The dynamic, heterogeneous nature of Edge computing in the Internet of Things (Edge-IoT) and Industrial IoT (IIoT) networks brings unique and evolving cybersecurity challenges. This study maps cyber threats in Edge-IoT/IIoT environments to the Adversarial Tactics, Techniques, and Common Knowledge (ATT&CK) framework by MITRE and introduces a lightweight, data-driven scoring model that enables rapid identification and prioritization of attacks. Inspired by the Factor Analysis of Information Risk model, our proposed scoring model integrates four key metrics: Common Vulnerability Scoring System (CVSS)-based severity scoring, Cyber Kill Chain–based difficulty estimation, Deep Neural Networks-driven detection scoring, and frequency analysis based on dataset prevalence. By aggregating these indicators, the model generates comprehensive risk profiles, facilitating actionable prioritization of threats. Robustness and stability of the scoring model are validated through non-parametric correlation analysis using Spearman’s and Kendall’s rank correlation coefficients, demonstrating consistent performance across diverse scenarios. The approach culminates in a prioritized attack ranking that provides actionable guidance for risk mitigation and resource allocation in Edge-IoT/IIoT security operations. By leveraging real-world data to align MITRE ATT&CK techniques with CVSS metrics, the framework offers a standardized and practically applicable solution for consistent threat assessment in operational settings. The proposed lightweight scoring model delivers rapid and reliable results under dynamic cyber conditions, facilitating timely identification of attack scenarios and prioritization of response strategies. Our systematic integration of established taxonomies with data-driven indicators strengthens practical risk management and supports strategic planning in next-generation IoT deployments. Ultimately, this work advances adaptive threat modeling for Edge/IIoT ecosystems and establishes a robust foundation for evidence-based prioritization in emerging cyber-physical infrastructures.Keywords
1.1 Cyber Threat in Edge-Computing Environment
Edge environment relocates processing and storage resources to distributed, resource-constrained nodes at the network periphery, dramatically expanding the attack surface and introducing new security challenges [1]. Unlike centralized cloud data centers with consolidated security controls, edge nodes often operate with minimal oversight and heterogeneous hardware/software stacks, increasing misconfiguration risk and credential exposure. Modern adversaries exploit these weaknesses to mount data poisoning attacks during model training—manipulating Internet of Things (IoT) sensor streams to degrade inference accuracy—and adversarial-example assaults at inference time, where imperceptible perturbations in input signals induce model misclassifications that compromise both confidentiality and integrity of on-device intelligence [1]. Moreover, model-extraction techniques enable attackers to reconstruct proprietary Machine Learning (ML) models by systematically querying edge interfaces, leading to intellectual property theft and downstream privacy breaches [2].
Simultaneously, edge-enabled industrial and cyber-physical systems face volumetric distributed denial-of-service (DDoS) campaigns that overwhelm constrained network links and micro—data centers, effectively severing communication between edge devices and control services [3]. Ransomware has also expanded beyond enterprise servers into the edge domain, encrypting crucial control logic and data repositories to disrupt real-time processes and demand high remediation payments [4]. The physical accessibility of many edge deployments—ranging from roadside units in intelligent transportation systems to on-site gateways in smart factories—further increases exposure to tampering, hardware injection, and side-channel attacks. To realistically assess these multifaceted threats, this work conducts threat analysis on real-world Edge-IIoTset Cyber Security Dataset of IoT & IIoT datasets collected from operational testbeds, ensuring that our evaluations reflect genuine attack patterns rather than synthetic benchmarks [5].
1.2 Quantitative Indicators for Threat Response
Effective defense in edge environments requires systematic prioritization of limited security resources to address the most consequential threats [6]. From the perspective of cyber resilience, the use of experimental methods and tools for quantitative measurement is indispensable; such an approach enables the systematic enhancement of an organization’s resilience posture [7]. To this end, we develop a scoring framework comprising four quantitative indicators—impact, detection, difficulty, and frequency—that collectively inform risk-driven decision making under operational constraints. First, we map observed attack instances to Adversarial Tactics, Techniques, and Common Knowledge (ATT&CK) techniques and tactics by MITRE, standardizing threat descriptions to enable consistent comparison across diverse scenarios. This normalization is critical for edge contexts, where disjointed logs and telemetry often obscure attack lineage.
Impact is quantified using the Common Vulnerability Scoring System (CVSS) v3.1, which synthesizes metrics for exploitability, impact, and environmental factors into a single severity score. By applying CVSS to mapped ATT&CK techniques, we obtain a unified metric for technical and operational risk regardless of device type or deployment context. Detection performance is measured by training deep neural networks(DNN) classifiers on the same real-world datasets, producing empirical detection scores; training employs focal loss to handle class imbalance and hard examples, and task-appropriate data augmentation to improve generalization. This DNN model captures complex feature relationships in network and sensor data, yielding robust detection of both volumetric and subtle stealth attacks.
In this study, execution difficulties are computed across the seven phases of Lockheed Martin’s Cyber Kill Chain by reflecting the characteristic behaviors of each attack type. Attack types that require a larger number of techniques expand both the offensive and defensive surfaces—raising operational complexity and potential exposure—and are therefore classified as higher risk [8,9]. Frequency is derived from the observed prevalence of each attack type in our datasets, the relative proportions of attack types are incorporated through normalization. By integrating these four indicators into a composite scoring model inspired by quantitative risk analysis principles, the practical ranking of attack types is derived as an explainable quantitative measure.
To ensure robustness, we validate the scoring model via non-parametric Spearman and Kendall rank-correlation analyses, demonstrating stability of rankings under perturbations in indicator weights and data sampling. The resulting evidence-based prioritization provides actionable guidance for practitioners to allocate detection, mitigation, and response efforts where they yield the greatest security impact.
2.1 Linking MITRE ATT&CK with Edge Environment
The MITRE ATT&CK framework has emerged as a cornerstone of modern cybersecurity practice, serving as a globally recognized knowledge base that systematically categorizes adversary tactics, techniques, and procedures based on real-world observations [10]. Academic analysis demonstrates that ATT&CK’s structured approach to threat intelligence has fundamentally enhanced the systematic detection and analysis of cyber threats, particularly advanced persistent threats, across industries including healthcare, finance, and critical infrastructure [10]. Research shows that over 80% of large enterprises utilize the framework for threat protection, with 57% employing it to identify security gaps and 55% leveraging it for security policy implementation [11]. The framework’s comprehensive documentation of attack behaviors enables security professionals to develop more effective defense strategies and improve incident response capabilities through standardized threat representation.
Edge environments introduce distinctive security challenges characterized by distributed architectures, resource constraints, and dynamic device topologies that significantly expand traditional attack surfaces. These environments face multifaceted threats including data tampering attacks where adversaries alter transmitted or stored data, denial-of-service campaigns targeting resource-constrained edge nodes, and service manipulation attacks where attackers gain control over edge data centers to misrepresent services [12]. Privacy leakage emerges as a critical concern due to the proximity of edge nodes to users and the substantial volumes of sensitive data they process [12]. Physical attacks represent another unique vulnerability, as distributed edge server deployments often operate with weaker physical protection compared to centralized data centers [12]. Research indicates that edge computing networks possess limited computational resources compared to cloud environments, preventing implementation of complex encryption algorithms and creating additional security vulnerabilities [12]. The dynamic nature of edge environments, where devices continuously join and leave networks, further complicates the establishment of consistent security policies and access controls [13].
The integration of MITRE ATT&CK with edge environment security analysis enables systematic mapping of attack behaviors specific to distributed computing environments to standardized threat taxonomies. Academic research demonstrates that ATT&CK’s enterprise and mobile matrices can be effectively extended to address edge-specific attack patterns, including those targeting 5G networks and cellular communications [10]. Studies have successfully mapped cellular attack techniques and procedures to ATT&CK tactics, creating structured frameworks for analyzing threats in mobile edge environments [14]. This integration proves particularly valuable for edge deployments where initial access may occur through compromised IoT devices or physical tampering, enabling defenders to track lateral movement and persistence techniques across distributed infrastructures. Research shows that attack graph methodologies combined with ATT&CK mapping provide dynamic threat modeling capabilities essential for edge environments characterized by continuous topology changes, allowing security practitioners to assess evolving attack paths as devices join or leave networks [14]. The framework’s emphasis on post-compromise behavior analysis addresses the unique characteristics of edge deployments, where traditional enterprise security models inadequately account for physical accessibility vulnerabilities and resource constraints.
2.2 DNN for Cyber Threat Detection
ML techniques, particularly DNN, are increasingly adopted for cyber threat detection due to their capacity to model complex, non-linear patterns in high-dimensional data and to generalize to novel attack variants [15–17]. DNN automatically learn hierarchical feature representations from raw network traffic and system logs, enabling superior detection accuracy and lower false positive rates compared to signature-based methods [18]. Furthermore, DNN architectures support real-time inference on streaming data, facilitating rapid identification of volumetric and stealth attacks even in resource-constrained environments such as edge and IoT deployments [18].
The quantitative assessment of cyber threats demands a standardized method to compare vulnerabilities and adversary behaviors across diverse environments. CVSS provides a structured vector of base, temporal, and environmental metrics, translating technical details—such as exploitability, impact, and required privileges—into a unified severity score [19]. Fig. 1 presents the flow from individual evaluation metrics to the final severity rating bands. This allows organizations to prioritize remediation and allocate defensive resources based on objective, comparable risk ratings. Without such an approach, prioritization becomes subjective, and critical threats may be overlooked amidst a flood of alerts and vulnerabilities [19].
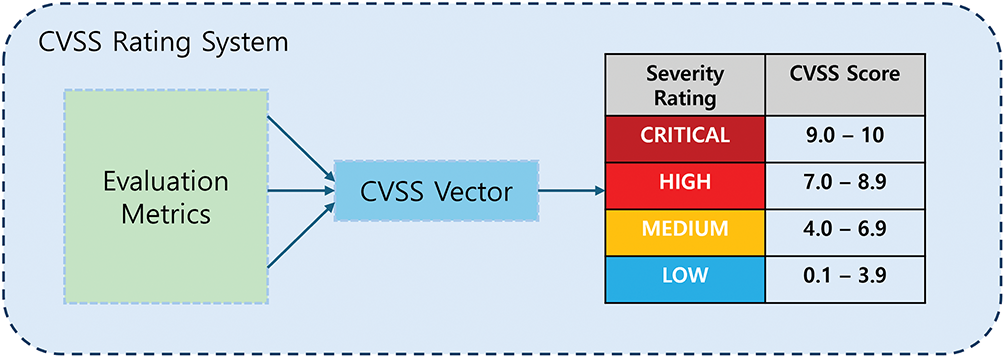
Figure 1: Common Vulnerability Scoring System (CVSS) score calculation process
Building on the mapping between MITRE ATT&CK techniques and Common Vulnerabilities and Exposures (CVE) identifiers, and leveraging the established correlation between CVEs and their corresponding CVSS vectors, we can quantitatively assess the risk posed by attack paths by synthesizing adversary techniques with documented vulnerability characteristics [20]. This integration enables security teams not only to catalogue threat behaviors but also to rank them by severity, sharpening risk assessments and focusing response on the most impactful attacks [19].
The Cyber Kill Chain is a framework developed by Lockheed Martin that systematizes the cyber-attack lifecycle into seven distinct phases to support analysis and defense planning. The Cyber Kill Chain comprises seven stages—reconnaissance, weaponization, delivery, exploitation, installation, command and control, and actions on objectives—commonly used to structure analysis and response [21]. The attack execution difficulty increases nonlinearly with the number of Cyber Kill Chain stages traversed and this leads to the defensive surface expands, thereby raising defender-side difficulty [22,23].
2.5 FAIR-Based Evaluation Metrics
As IoT technologies continue to evolve, they have become increasingly intelligent and are delivering value to society in ever more diverse ways [24]. However, alongside these advances in network technology, new security challenges have emerged which must be addressed; accordingly, research into robust methodologies for assessing and prioritizing these risks is actively ongoing [24].
Among the various risk assessment models, we selected the Factor Analysis of Information Risk (FAIR) framework to establish the foundational structure for evaluating cyber threats. A close examination of the FAIR model reveals that it quantifies risk primarily through two core indicators: Loss Event Frequency and Loss Magnitude, treating these as equally significant determinants of overall risk exposure, as illustrated in Fig. 2 [25]. In this study, we extend the FAIR framework by introducing additional dimensions—namely, attack difficulty and detection rate—thereby developing a scalable yet robust risk scoring model that enhances the granularity and applicability of cyber threat assessments.
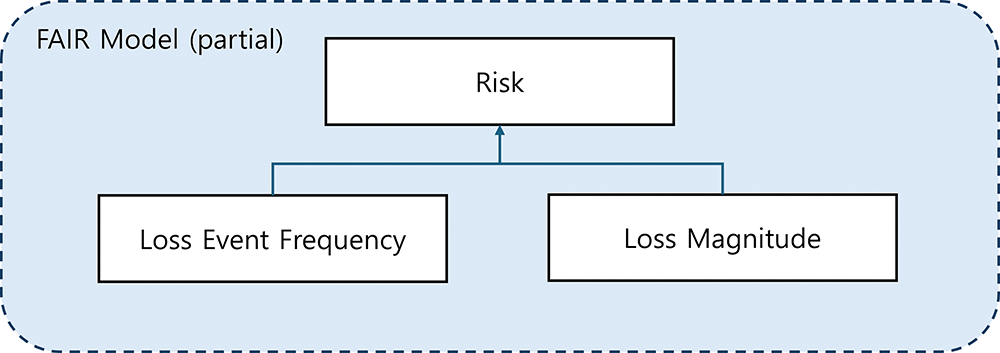
Figure 2: Risk determinants of Factor Analysis of Information Risk (FAIR) framework
3 Cyber Threat Analysis with MITRE ATT&CK
The Edge-IIoTset Cyber Security Dataset of IoT & IIoT comprises normal logs as well as attack-specific logs stratified by threat category, and provides separate CSV files tailored for ML and DNN workflows. As the raw data are not precurated, it is necessary to perform preprocessing to remove non-informative columns and extraneous records prior to analysis. The resulting curated dataset serves as the foundational corpus for all subsequent risk quantification procedures [26]. The distribution of log counts by attack category in the cleaned dataset is summarized in Table 1.
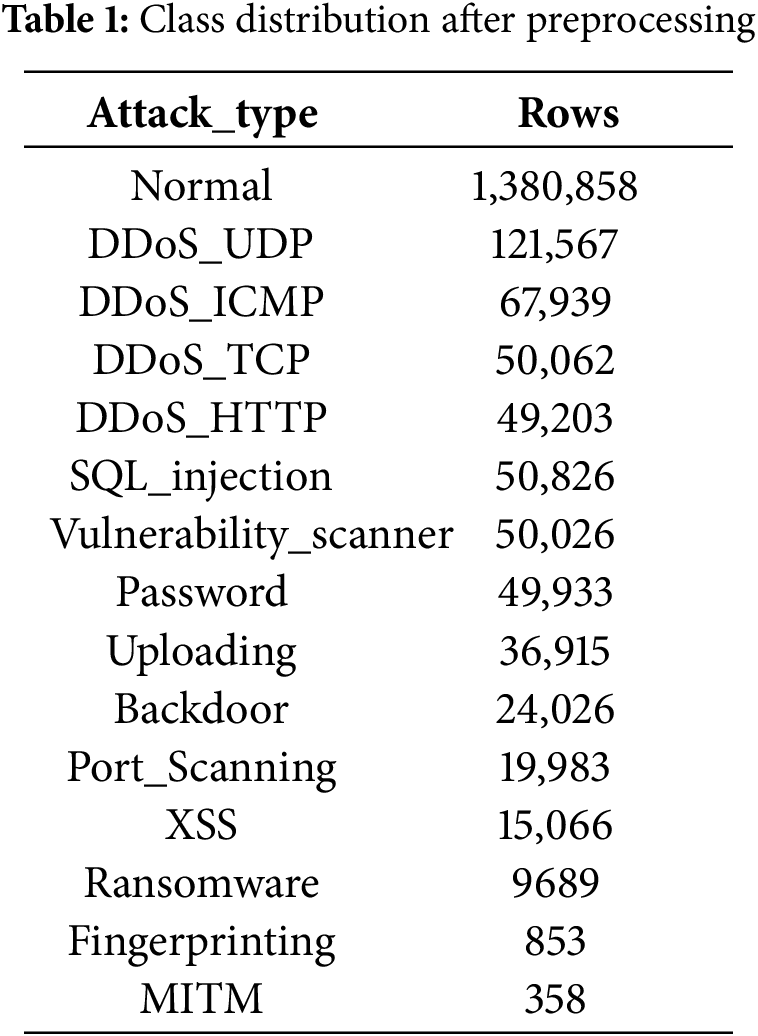
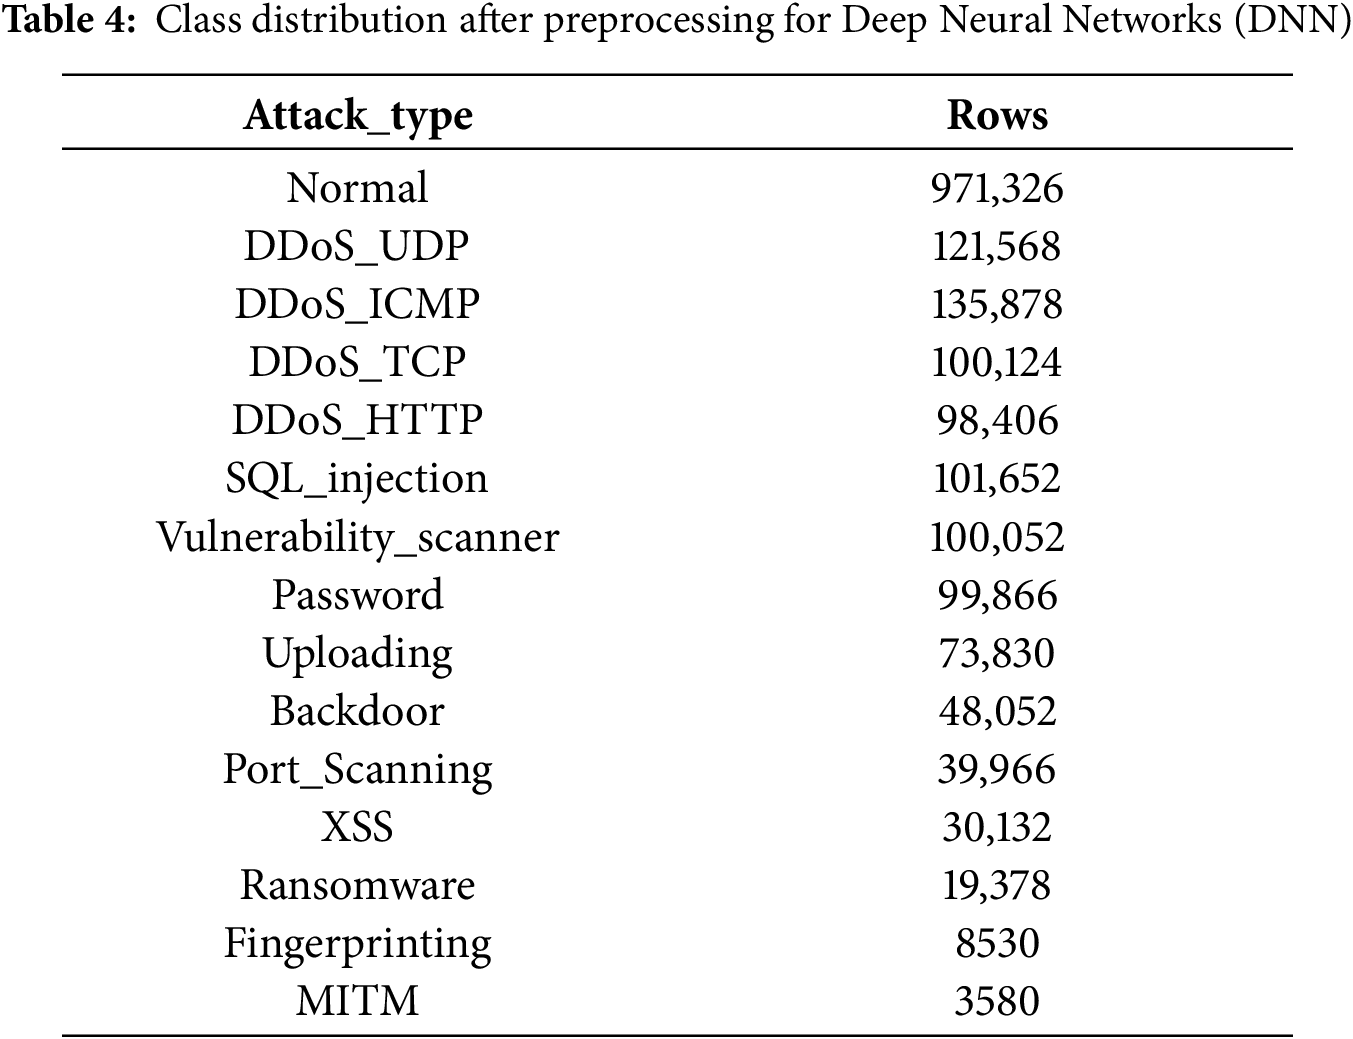
An examination of the preprocessed data reveals pronounced inter-class imbalance. In particular, the Man-in-the-Middle (MITM) category contains a substantial number of degenerate records that exhibit zero values across all features, further diminishing the already limited effective sample size for this class. Overall, Fingerprinting and MITM possess markedly fewer instances than the other attack types, indicating a need for targeted rebalancing where appropriate. In the section Detection in Noise Environment Using DNN, we detail our strategy to mitigate this imbalance via data augmentation and loss-function design tailored to skewed class distributions [27].
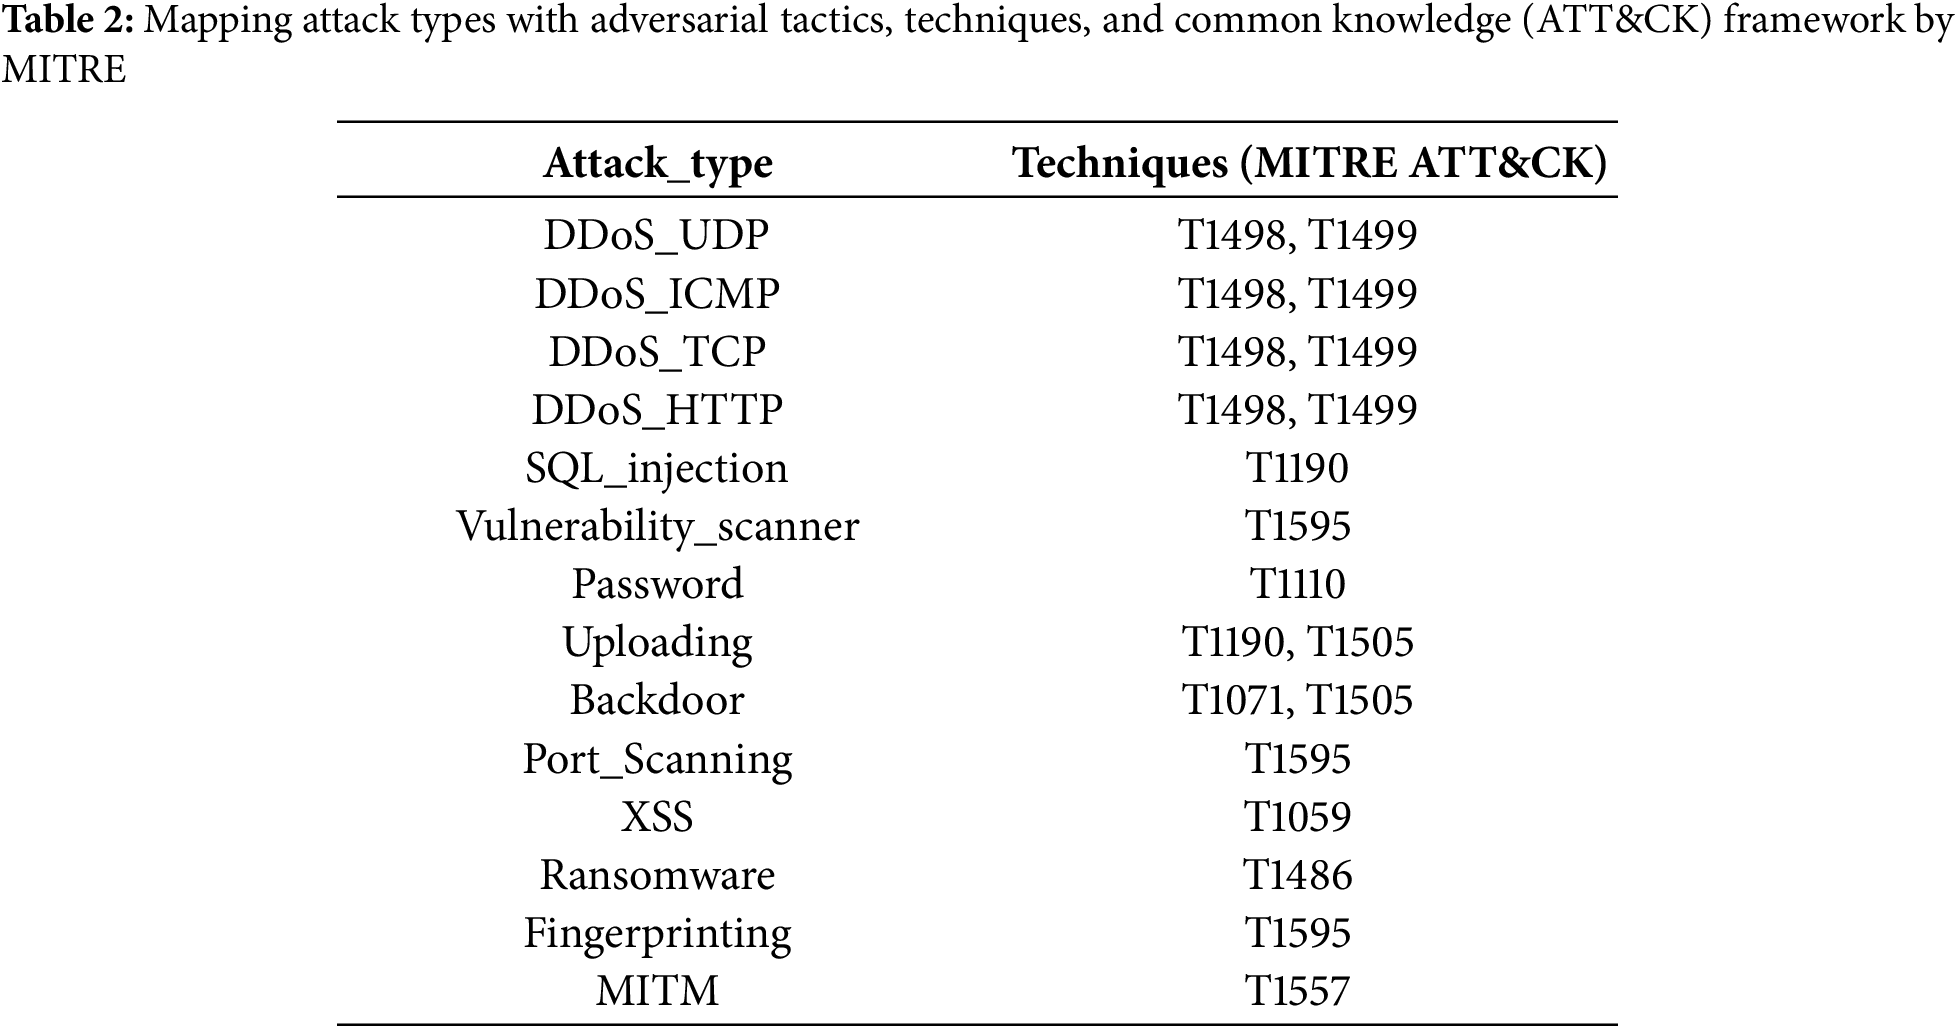
Following data preprocessing, enumeration of attack categories within the curated dataset yields a total of 15 distinct attack types, including a separate class for normal traffic. Excluding the normal class, 14 unique attack signatures are identified. Notably, the security threats observed in actual Edge-IoT & Industrial IoT (IIoT) environments are sufficiently heterogeneous to map across multiple MITRE ATT&CK matrix categories, including Industrial Control System (ICS), Enterprise, and Mobile [28,29]. Accordingly, the mapping process primarily emphasizes techniques rather than general tactics, with each attack signature analyzed for correspondence to specific ATT&CK techniques. In the case of techniques, MITRE ATT&CK assigns distinct identifiers depending on the operational context—for example, Enterprise, Mobile, or ICS. In Table 2, the mapping of techniques is performed by selectively referencing a subset of techniques from multiple operational matrices, prioritizing those most representative of the relevant environments. Notably, many techniques share nomenclature but have different unique identifiers across matrices, reflecting the inherent heterogeneity of edge environments discussed previously [28,29]. Certain attack types, such as DDoS, admit direct mapping to ATT&CK technique identifiers, while others require careful examination of operational characteristics to assign the closest matching technique. This mapping framework further serves as the foundation for quantitative risk assessment when integrated with external vulnerability indices such as CVE and CVSS.
3.3 CVSS-Based Attack Severity Assessment
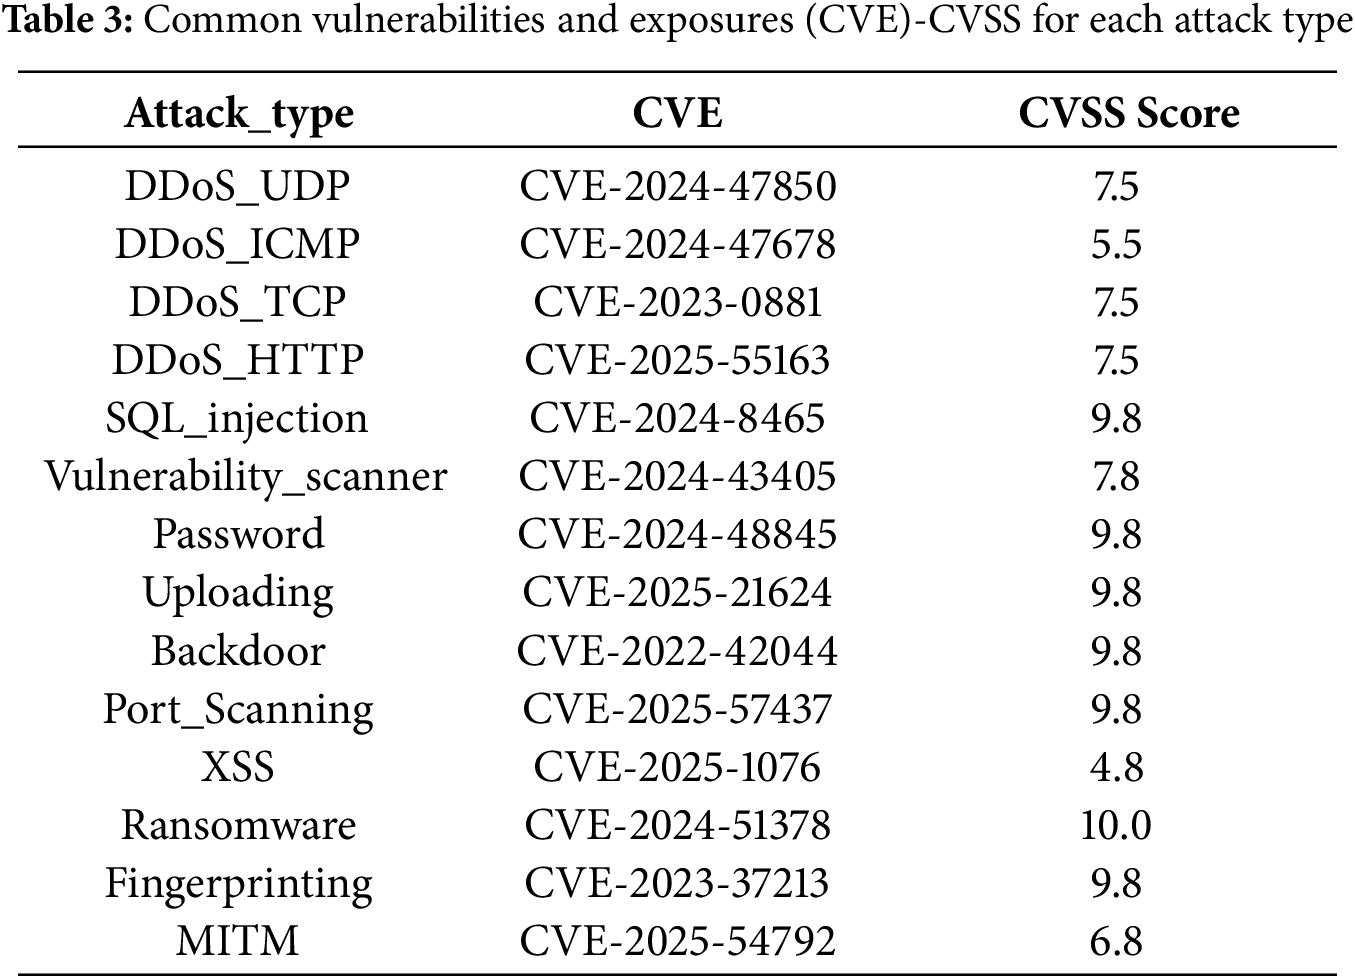
CVSS enables quantitative assessment of risk severity by assigning a computed score for each vulnerability based on its unique vector string. To generate the CVSS vector for each identified threat, the mitigation techniques were systematically mapped to corresponding CVE entries. This mapping was accomplished utilizing CVE data and attack pattern taxonomies provided by the MITRE group [30,31]. Moreover, leveraging dataset-provider descriptions of each attack type and their mapped ATT&CK techniques, CVEs from the past four years were heuristically queried to derive practitioner-aligned associations [26]. Following mapping, each CVSS vector was validated, the associated score was determined, and the results were recorded. The integration of CVE identifiers with CVSS metrics constitutes the foundation of the National Vulnerability Database (NVD), which has emerged as a globally recognized standard for comprehensive vulnerability assessment [32]. The mapped CVEs and their corresponding CVSS values are summarized in Table 3. CVSS v3.1 Base Scores are adopted, and the table records, among CVEs with an available CVSS score, the single CVE with the highest score as the representative entry. For candidate CVEs mapped to each attack type and the CVSS vectors underlying the tabulated scores, as detailed in Appendix A.
4 Detection in Noise Environment by Using DNN
4.1 Noise Environment and Loss Function Settings
DNN have demonstrated state-of-the-art performance in modern security domains and have established themselves as essential tools for intrusion and anomaly detection [18]. Building upon the demonstrated efficacy of DNN in these contexts, the present study systematically evaluates detection rates across various experimental configurations, including the deliberate introduction of synthetic noise and data augmentation techniques to emulate real-world conditions, as well as the selection of appropriate loss functions [33]. These procedures represent a foundational methodology for establishing reliable detection baselines, distinct from the optimized architectures typically employed for achieving maximal detection performance. Specifically, this study employs a Gaussian + Spike (Mixed) distribution as the noise profile.
• Gaussian Noise: Following a Gaussian (normal) distribution, characterized by a bell-shaped curve centered at the mean. Gaussian noise is considered a fundamental model in signal processing and communication channel analysis, owing to its prevalence in both theoretical and empirical studies [34].
• Spike Noise: Characterized by sharp, high-amplitude transients that occur sporadically at specific locations within the signal. It is commonly employed to model sudden disturbances or sporadic errors that may introduce intermittent interference in communication systems or signal processing pipelines [35].
• Mixed (Gaussian + Spike): Combining both Gaussian and spike noise components, thereby emulating practical scenarios in Edge-IoT environments where persistent interference and sporadic outliers may occur simultaneously. Such a model provides a closer approximation to the complex and heterogeneous noise conditions encountered in real-world deployments [36].
For the loss function, we employ the standard loss for multi-class classification tasks, sparse categorical focal loss(Focal), which is specifically designed to address class imbalance [37]. This selection is made to reflect the inherent characteristics of the dataset and, together with the chosen noise profile, supports a reliable evaluation of detection performance using Focal.
• Sparse Categorical Focal Loss(Focal): Derived by introducing a weighting mechanism into cross-entropy. It dynamically adjusts the weights assigned to easy and difficult samples, thereby improving model performance in scenarios characterized by significant inter-class imbalance [37].
4.2 Detection Performance Using DNN
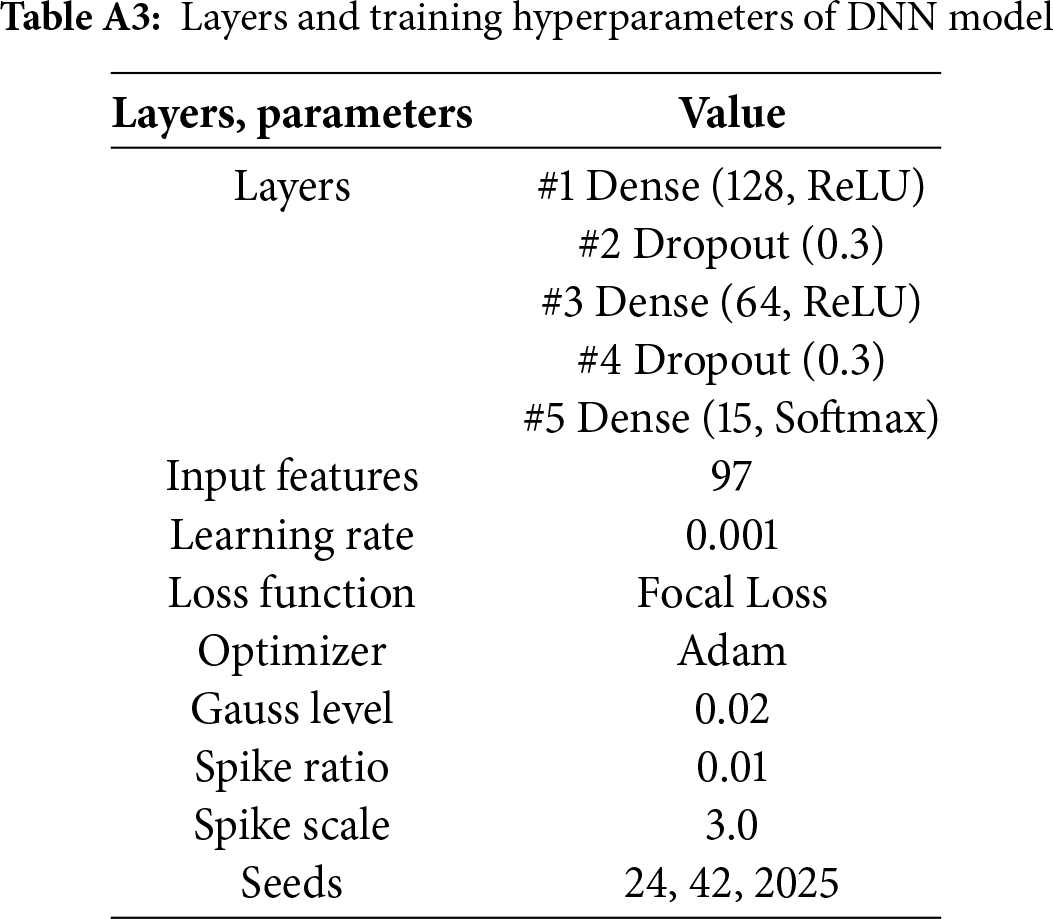
To train the DNN, data proportions were adjusted and noise was introduced during preprocessing. DDoS_UDP was disproportionately large among the attack types; for each training run, it was randomly downsampled by half, after which the Normal-to-Attack ratio was equalized, and Mixed noise was applied to double the sample count of each type. The severely imbalanced minority classes, Fingerprinting and MITM, were augmented tenfold to mitigate class imbalance as far as practicable. Dataset statistics after preprocessing and augmentation are reported in Table 4. Please refer to Appendix B for the DNN layer configuration, optimizer specifications, and other implementation details.
In the context of security threat detection, undetected threats pose far more severe consequences—including significant security breaches, data compromise, and system disruption—than false positives or over-detection [38]. Consequently, quantitative evaluation of detection results is centered on Recall. Training was conducted with three random seeds in total. The noise-free setting is denoted as Clean, and the noise-added setting is denoted as Mixed.
Training was conducted with three random seeds in total. The noise-free setting is denoted as Clean, and the noise-added setting is denoted as Mixed. Figs. 3 and 4 illustrate epoch-wise learning curve for the Clean and Mixed environments, with lines indicating the mean over random seeds and shading corresponding to the standard deviation across seeds.
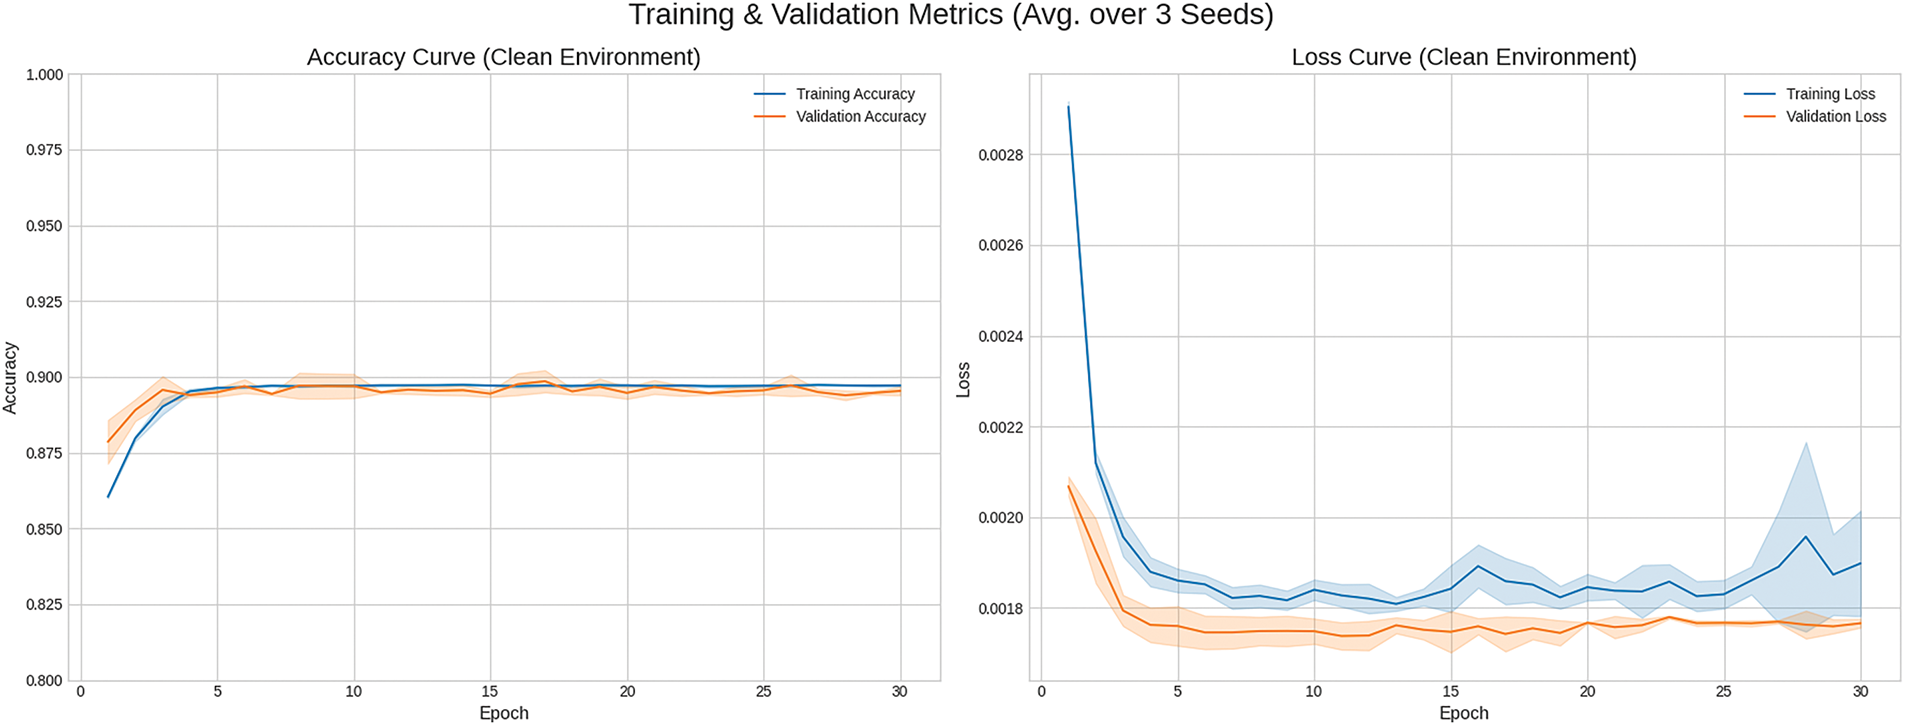
Figure 3: Learning curve (Clean environment)
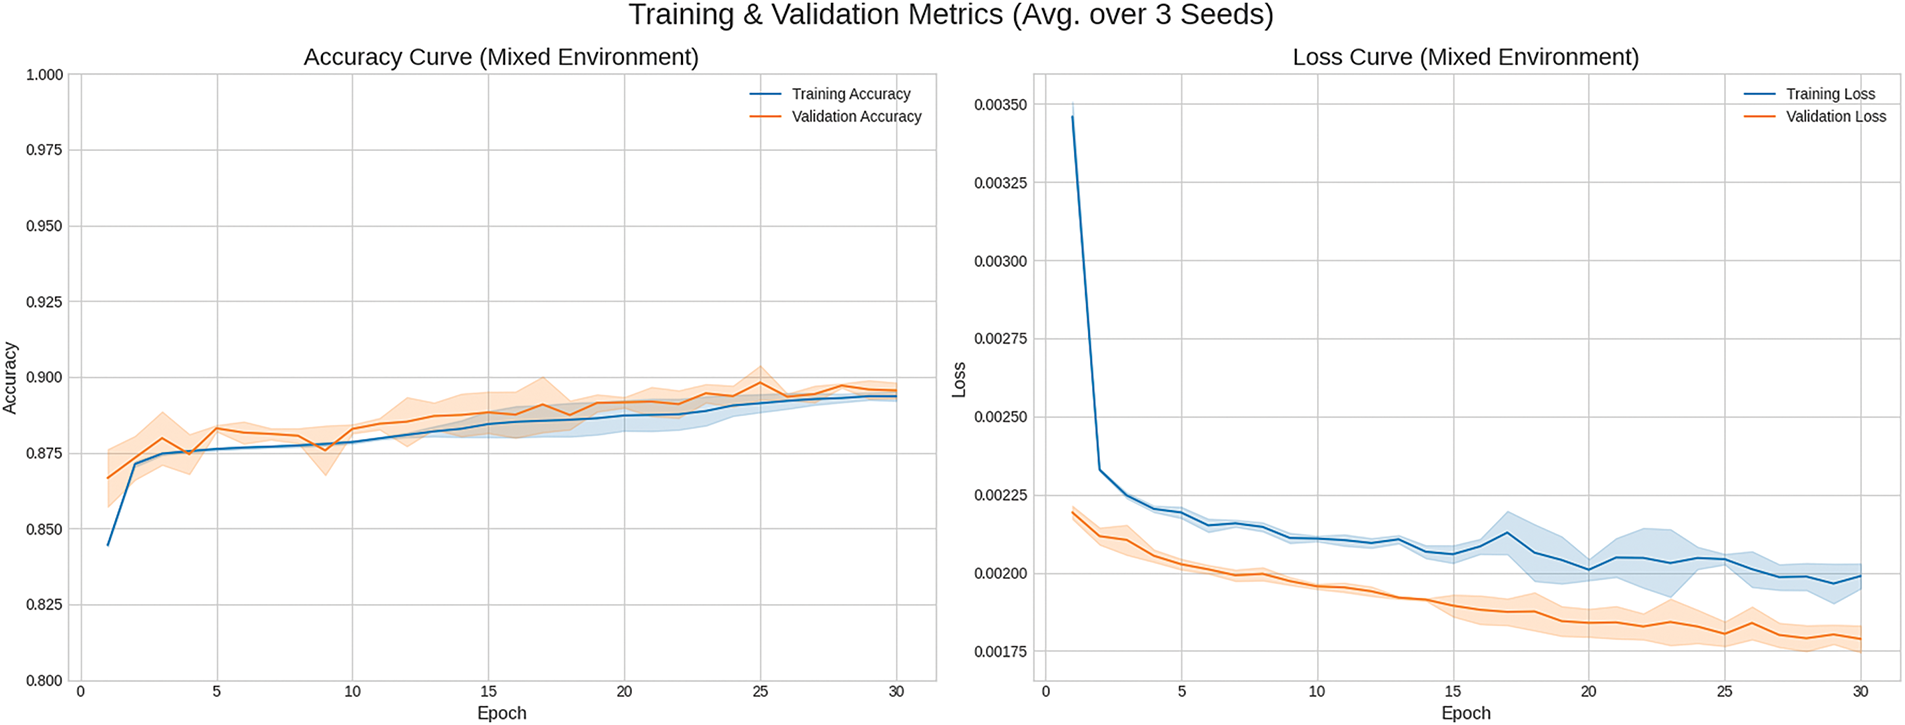
Figure 4: Learning curve (Mixed environment)
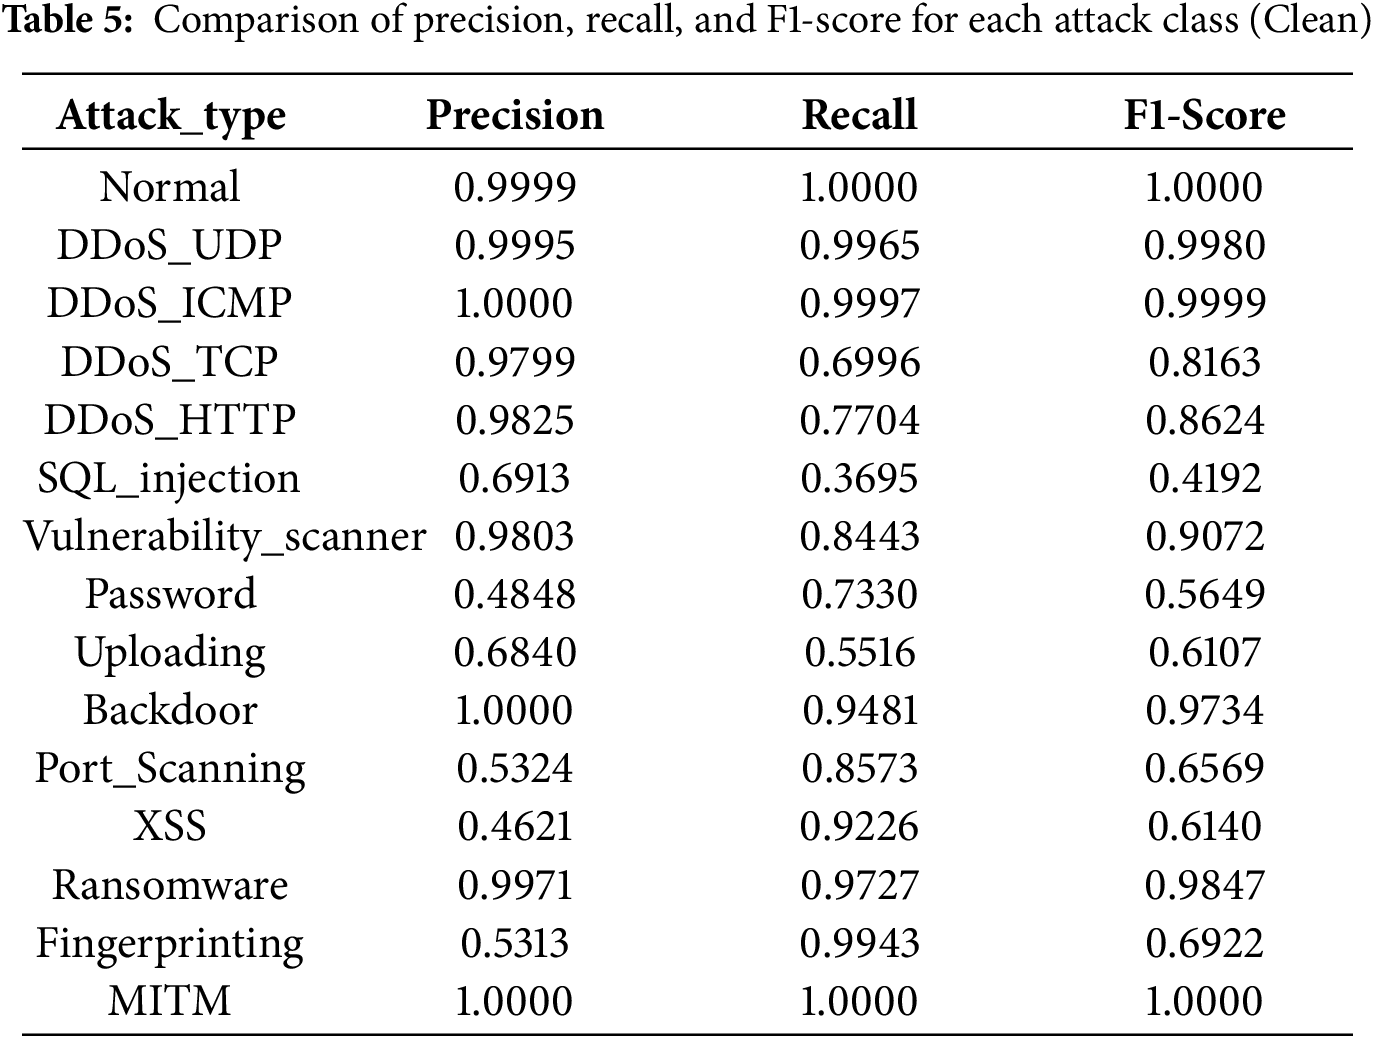
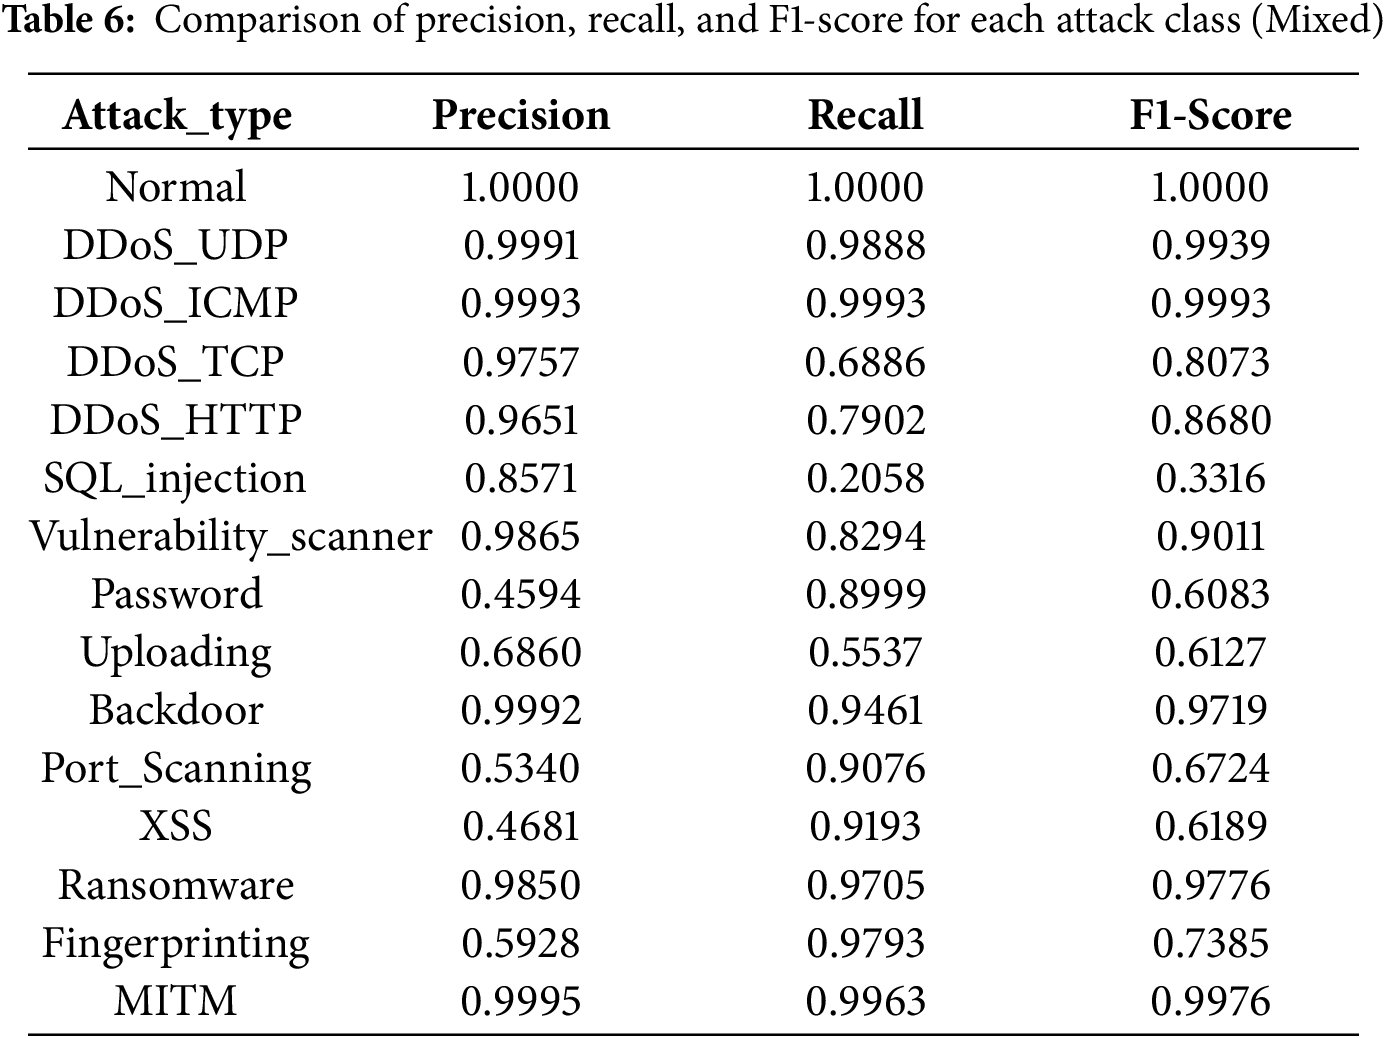
For the Clean and Mixed environments, the per–attack-type training metrics are reported in Tables 5 and 6. Overall, results in the Clean environment are marginally superior, although certain attack types occasionally exhibit better performance in the Mixed environment.
Figs. 5 and 6 visualize recall across environments. Values are reported to two decimal places, and this visualization serves as input to the scoring model. Because operational settings typically contain mixed noise, the final metric selection adopts the Mixed environment.
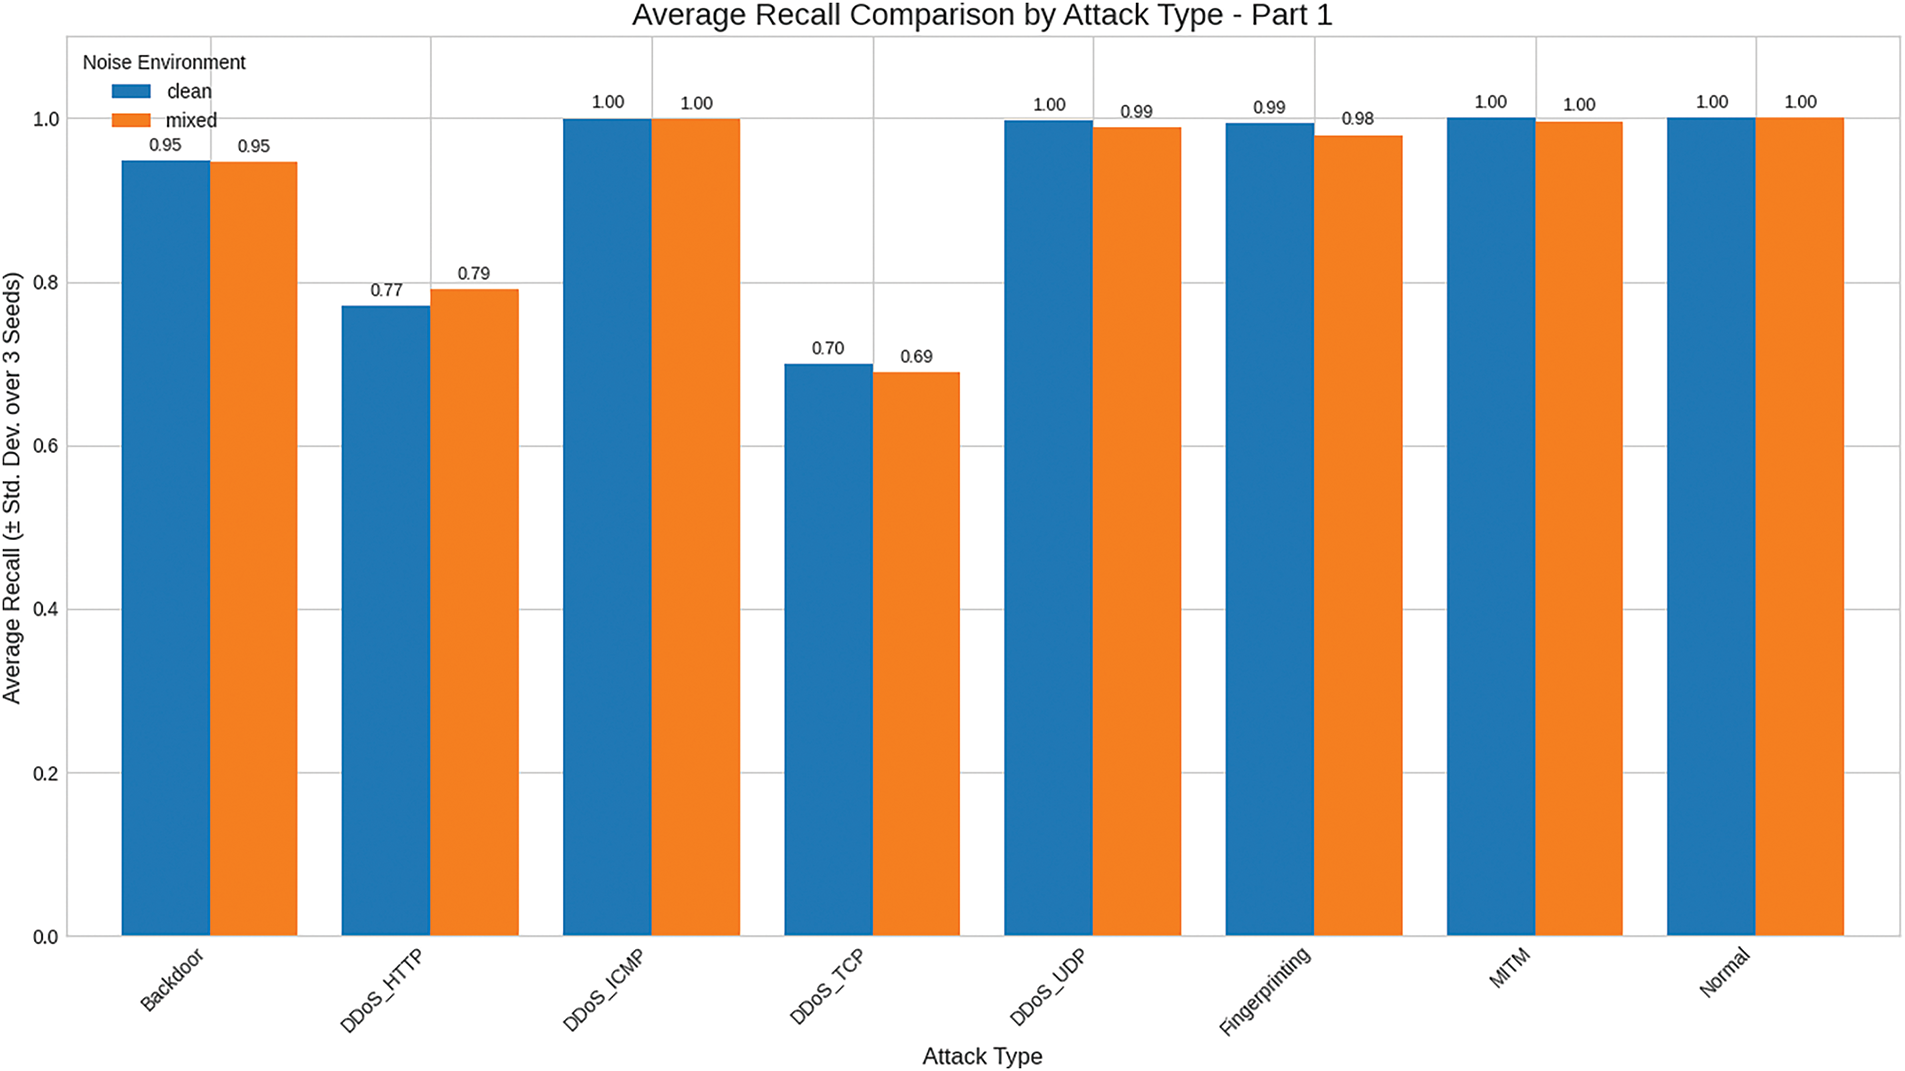
Figure 5: Comparison of recall across environment (part 1)
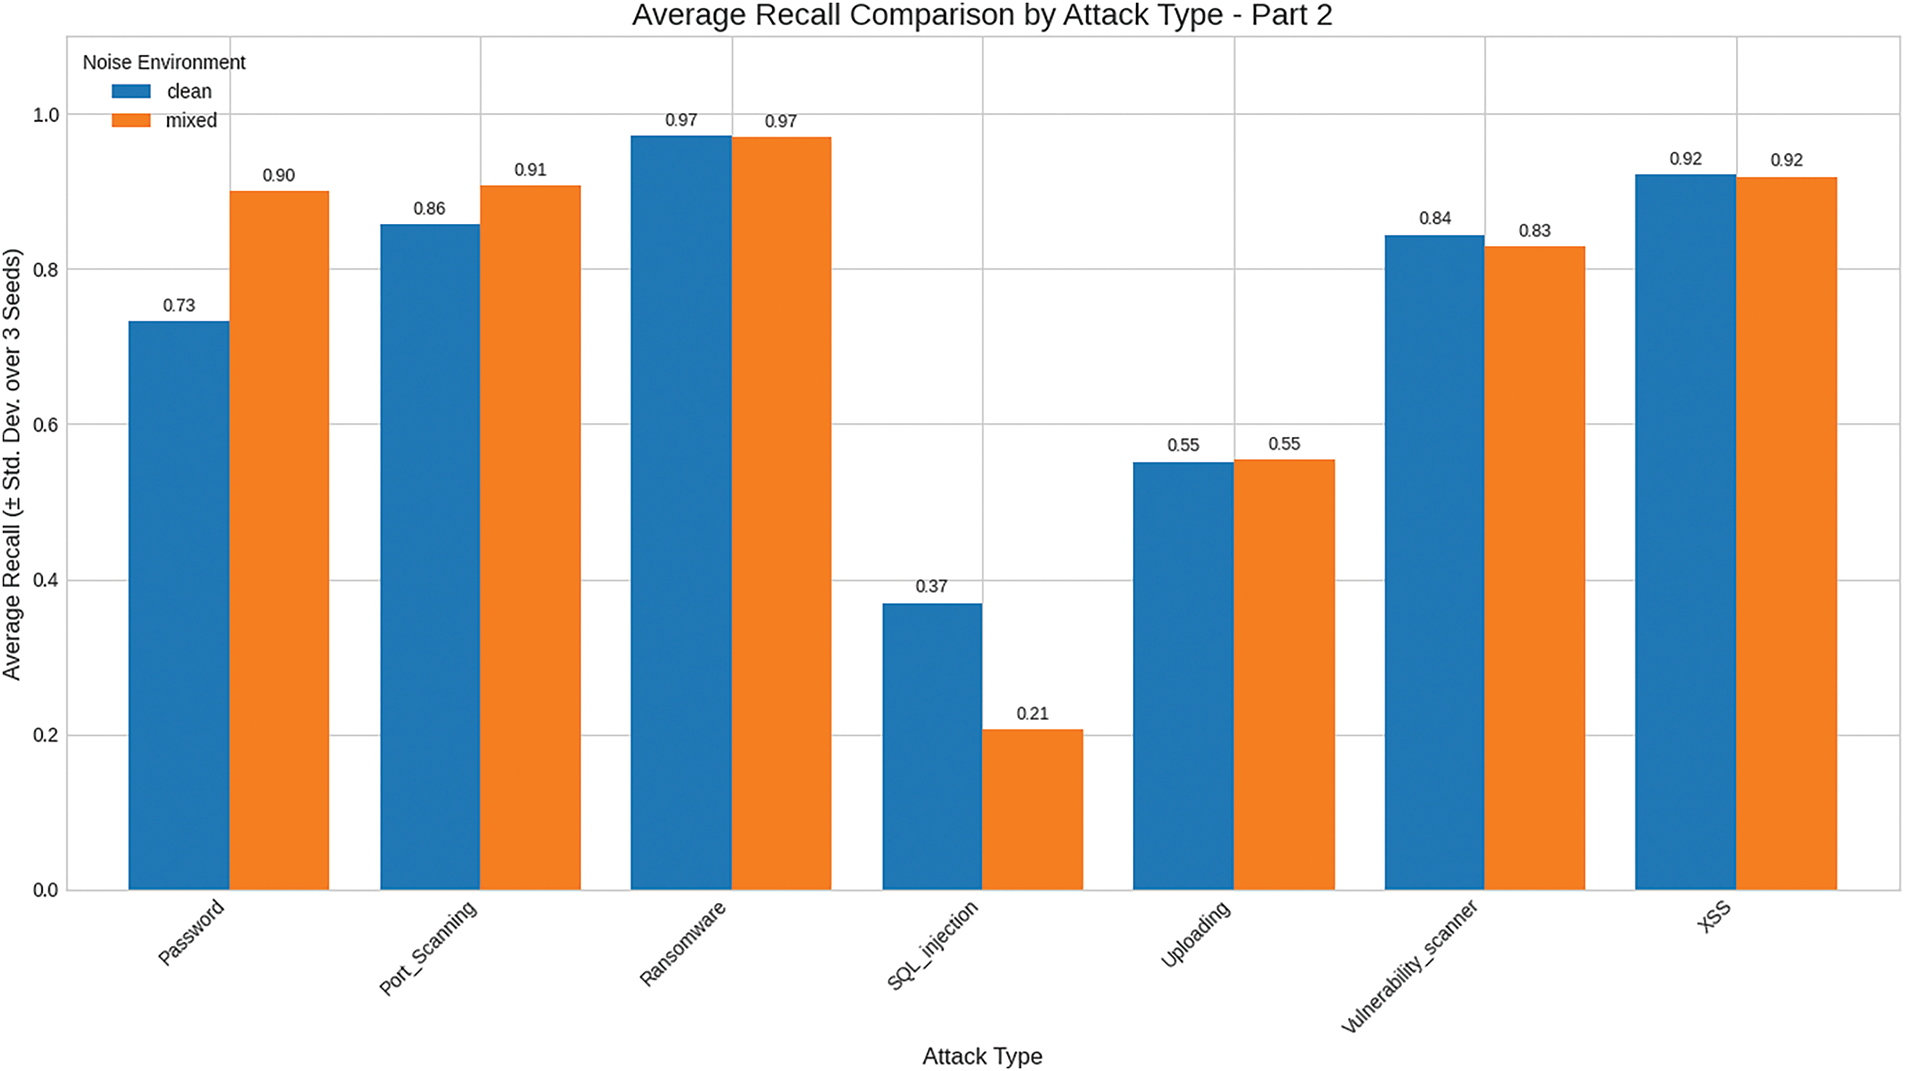
Figure 6: Comparison of recall across environment (part 2)
To enable the quantitative assessment of risk, our evaluation model adopts key concepts from the FAIR framework. While FAIR employs a multiplicative approach centered on the product of impact and frequency, the present study introduces a lightweight, additive model based on weighted linear combinations of four independently measured factors: the MITRE Impact Score (MIS), Frequency Score (FS), Detection Score (DS), and Difficulty Score (DifS) [25,39]. This revised structure facilitates independent evaluation and targeted feedback for each risk component [39].
• MIS: The previously mapped CVSS risk scores, which range from 0.0 to 10.0, are normalized to a 0–1 interval via division by 10 for incorporation into the risk scoring framework.
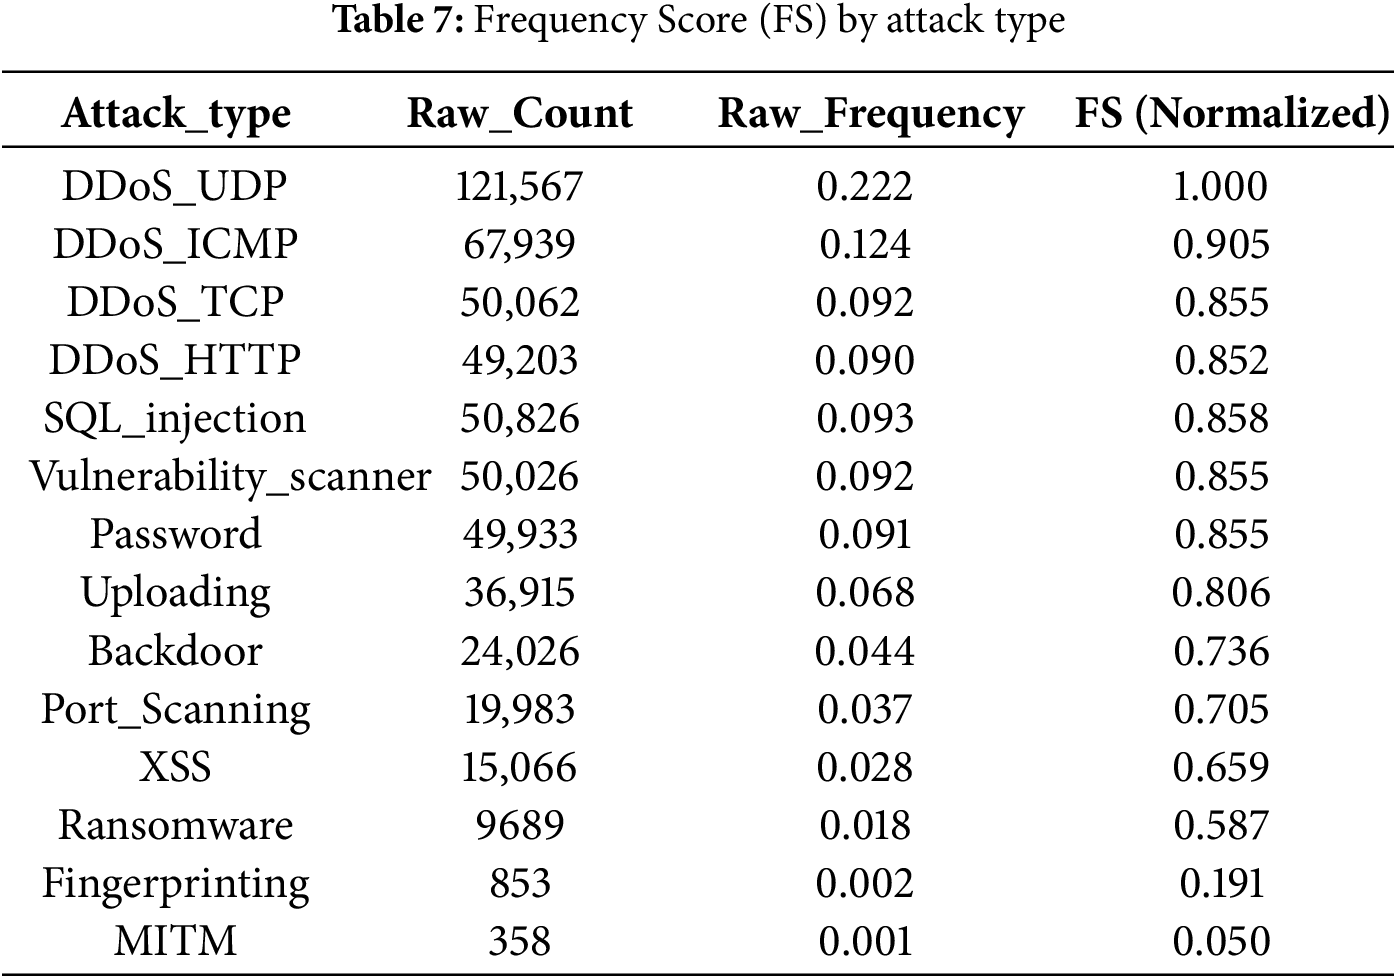
• FS: Due to relative frequency shifts induced by differing class distributions, the raw metrics are not directly comparable and are therefore adjusted via normalization. Laplace smoothing assigns a minimal probability mass to extremely rare attack types, after which a log transform and 0–1 rescaling are applied to obtain corrected values that are not unduly skewed [40,41].
• DS: Grounded in the DNN-derived recall performance for each class, this metric is computed as 1–recall, where values approaching 1 reflect greater risk due to undetected threats.
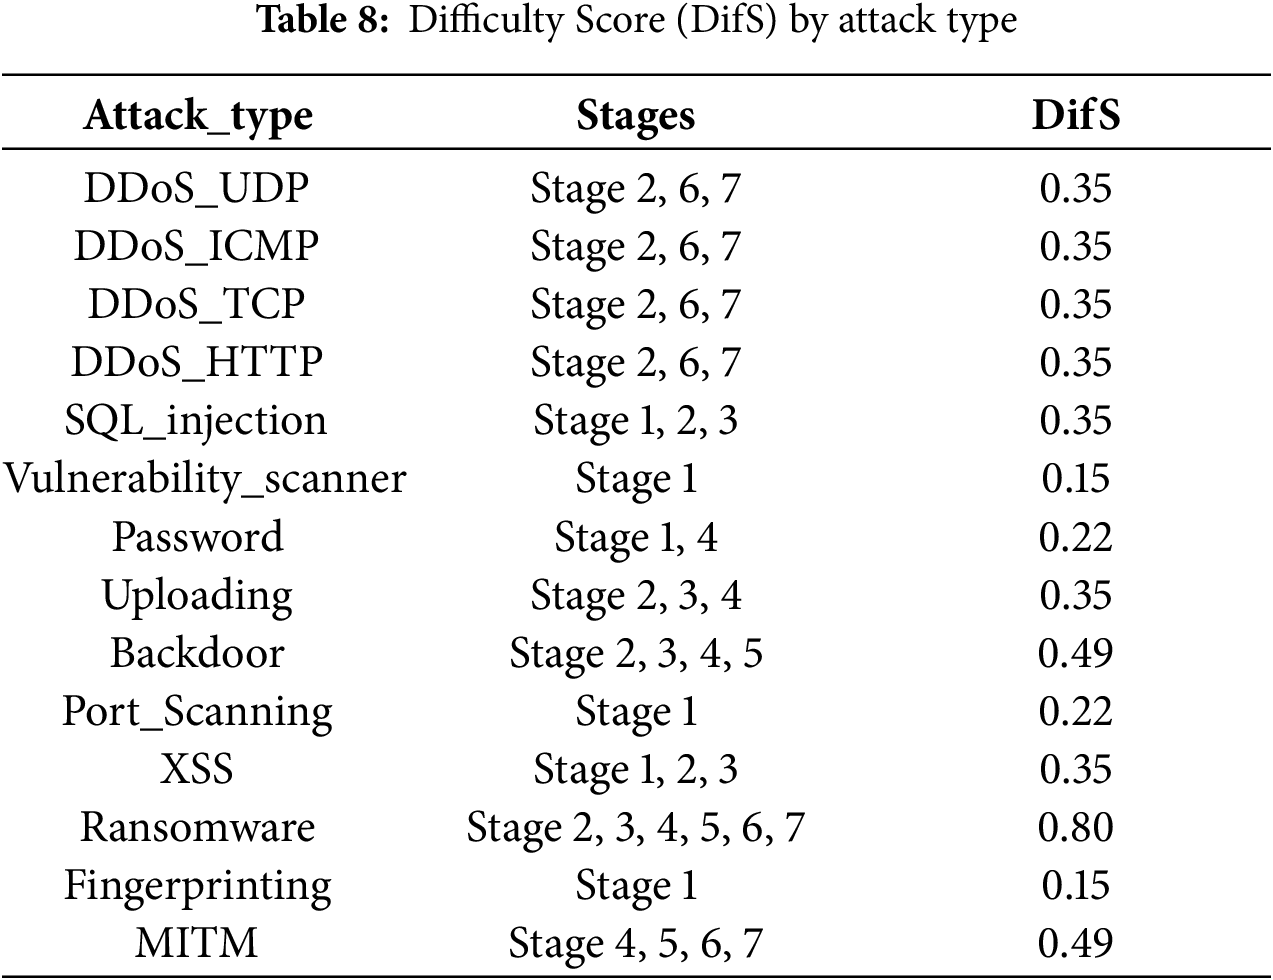
• DifS: Modern cyberattacks are typically executed through multiple, sequential stages, each of which represents a critical axis for risk evaluation. As the number of attack phases increases, so does the associated risk score [42]. Based on the Cyber Kill Chain, the computation incorporates the distinctive characteristics of each attack type in a non-linear manner.
Based on the aforementioned factors, the risk scoring model is formulated as follows:
The weights assigned to each factor are as follows: MIS (35%,
An additive scoring model enables meaningful evaluation of low-frequency yet high-impact attacks, while preserving the independent interpretability of each indicator and preventing the severe distortions that multiplicative aggregation can induce [43,44]. By managing multiple threat dimensions for cyber attack types as independent components and combining them additively via weights, the model maintains priority across indicators and captures multidimensional risk characteristics in a realistic and effective manner.
5.1.1 FS via Laplace-Based Normalization
The Laplace smoothing formula is as follows.
The parameters of the equation are as follows; N = Total number of attack samples, K = Number of attack types,
The parameters of the equation are as follows;
The parameters of the equation are as follows;
5.1.2 DifS via Cyber Kill Chain
DifS is mapped using the Cyber Kill Chain by leveraging the characteristics of each attack type, with risk increasing at later stages and scores designed to grow nonlinearly [22,23]. The equation for computing DifS based on the number of mapped stages is given as follows.
The parameters of the equation are as follows;
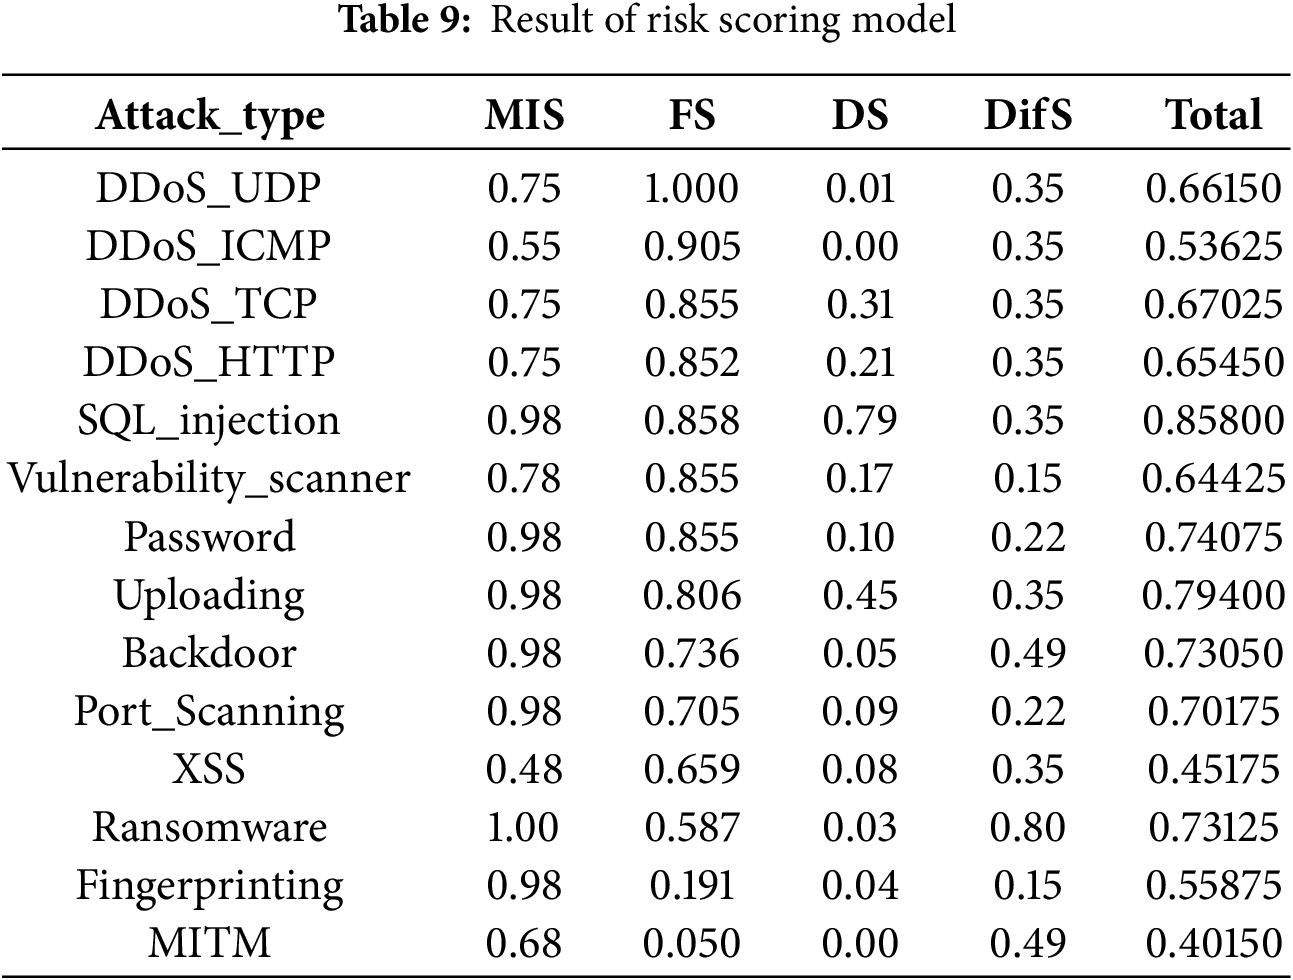
The outcomes of the risk scoring model, incorporating all specified factors and their corresponding ground truth values, are summarized in Table 9.
5.3 Sensitivity Analysis of the Risk Model
Based on the proposed model, quantitative risk scores were generated for each attack type. The weights assigned to individual model components are subject to variation, and changes to these weights may significantly impact the resultant risk scores—a phenomenon referred to as sensitivity [45]. A model exhibiting low sensitivity to such variations is considered robust, as its output remains stable despite perturbations in parameter weighting [45].
For model validation, statistical measures widely employed across diverse disciplines—specifically, Spearman’s and Kendall’s rank correlation coefficients—are utilized to assess agreement between model outputs and empirical observations [46].
• Spearman’s correlation coefficients: Spearman’s correlation coefficients quantifies the linear association between ranked variables; a value
• Kendall’s correlation coefficients: Kendall’s correlation coefficients measures the directional concordance between paired rankings; a value
Each of the four model parameters was systematically perturbed by varying proportions (−10%, −5%, +5%, +10%), while the remaining components were adjusted proportionally to ensure the aggregate weighting remained normalized to 100%. This set of perturbations was applied to both correlation-based validation frameworks, and the resulting robustness profiles are presented in Figs. 7 and 8.
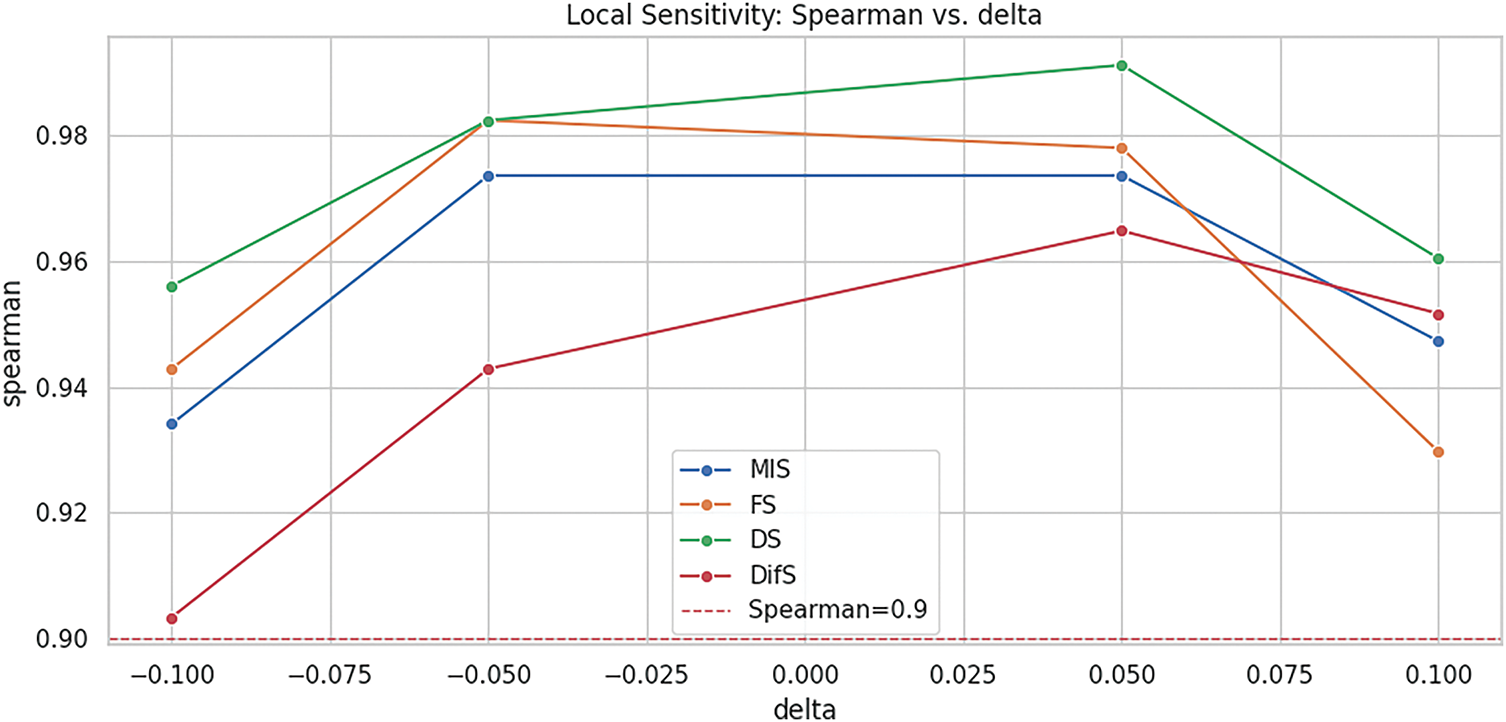
Figure 7: Sensitivity analysis (Spearman)
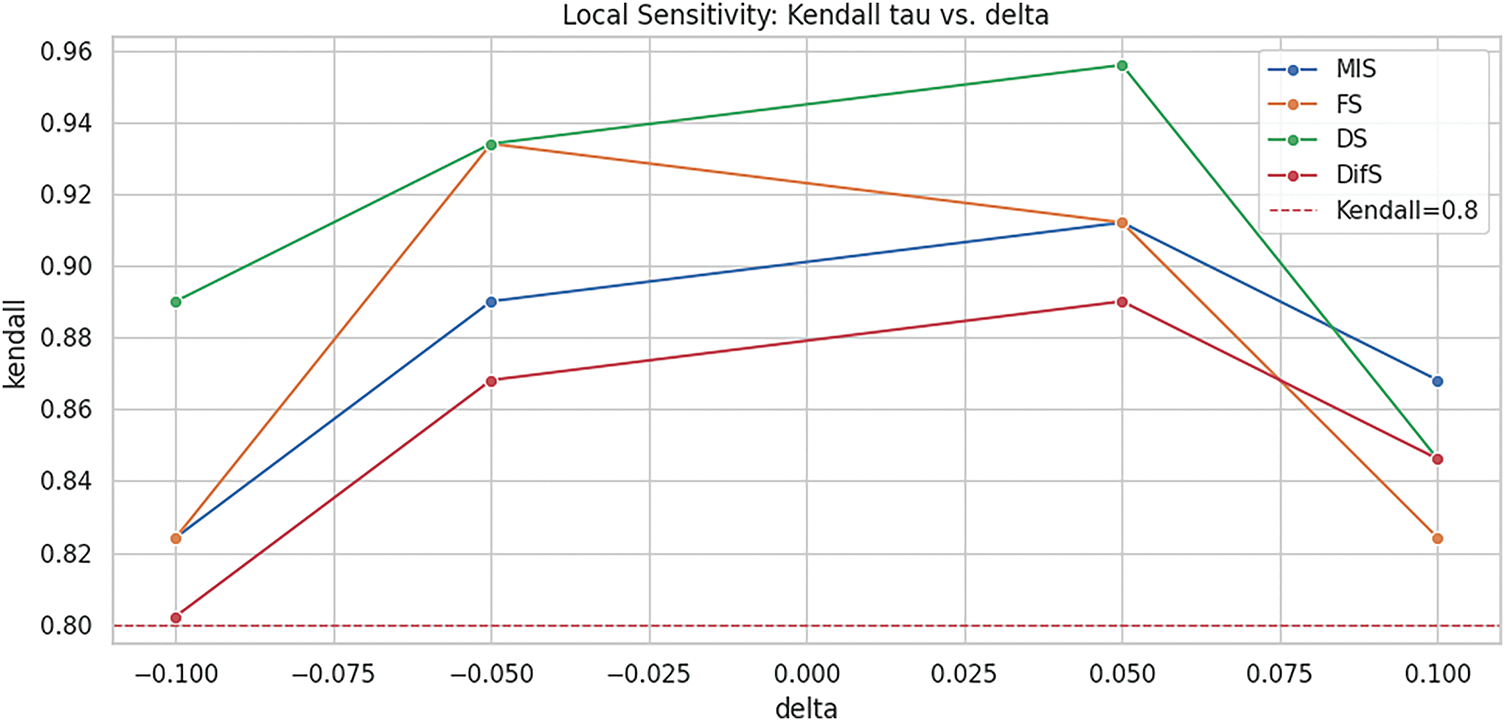
Figure 8: Sensitivity analysis (Kendall)
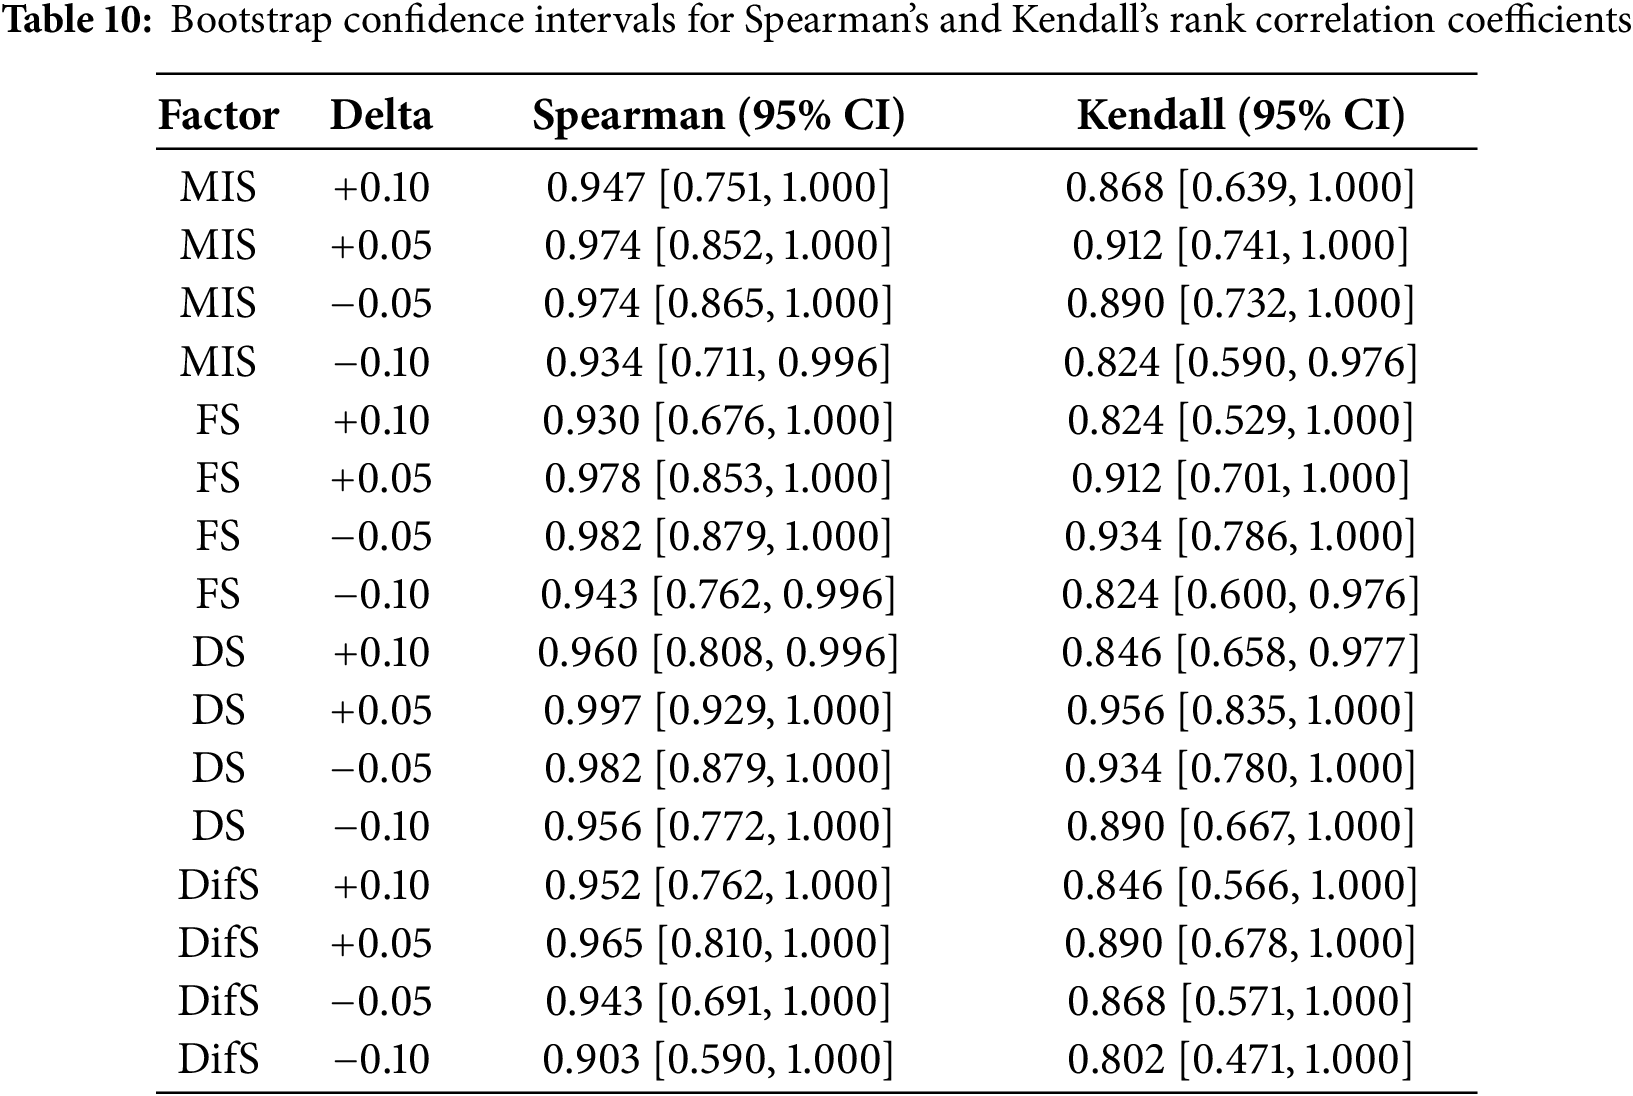
Spearman’s and Kendall’s rank correlation coefficients are nonparametric; accordingly, bootstrap resampling with replacement is used to obtain standard errors and confidence intervals, thereby strengthening the robustness of the scoring model [49]. After generating 2000 bootstrap samples for the results across 14 attack types, scores and ranks are computed by applying the respective indicator weights to each resample. Based on these, 95% confidence intervals are obtained as shown in Table 10, demonstrating the stability of the ranks and the robustness of the model. When the DifS indicator is decreased by 10%, its weight effectively drops to 0%, causing substantial sensitivity shifts; excluding this condition, the results remain highly stable under nearly all perturbations [49].
6.1 Ranked Prioritization of Attack Types
Based on our risk scoring model, we have quantified each component of the attack types to compute an aggregate risk score. Furthermore, we conducted a sensitivity analysis of the risk scoring model using Spearman’s and Kendall’s rank correlation coefficients. The results confirmed the model’s robustness. Table 11 presents the risk scores in descending order, thereby establishing a ranked prioritization of the attack types.
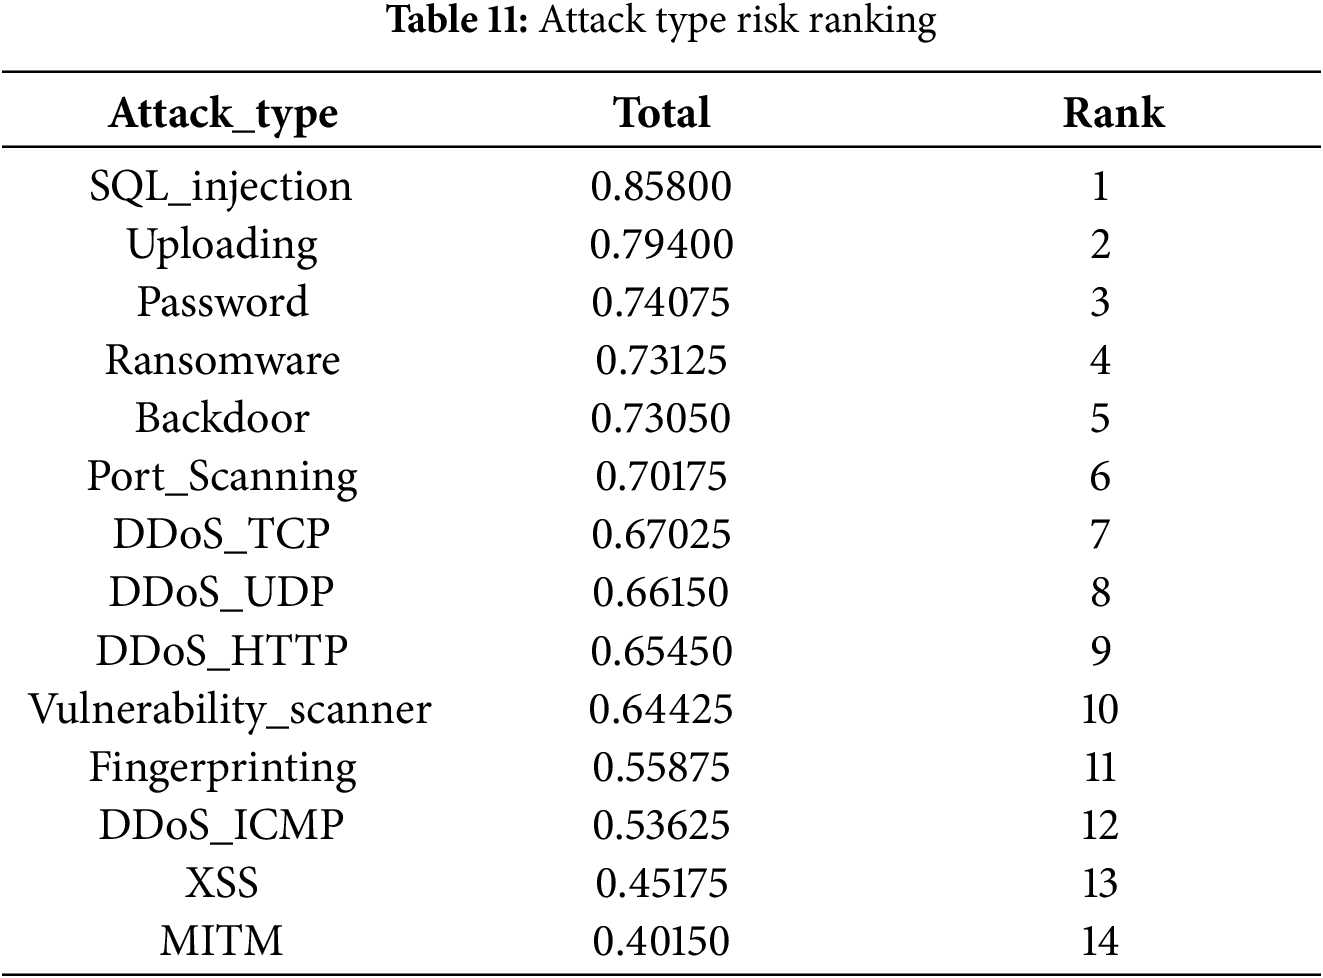
Fig. 9 illustrates the influence of each evaluation factor on the risk scores and their resultant rankings. A histogram analysis reveals that for the majority of attack types, a higher MIS tends to correlate with a higher overall rank. Among the top-ranked categories, SQL_injection and Uploading stood out due to their relative difficulty of detection, distinguishing them from other high-ranking attack types. DDoS variants achieved high FS values; however, their inherently lower MIS led to mid-to-lower tier rankings overall.
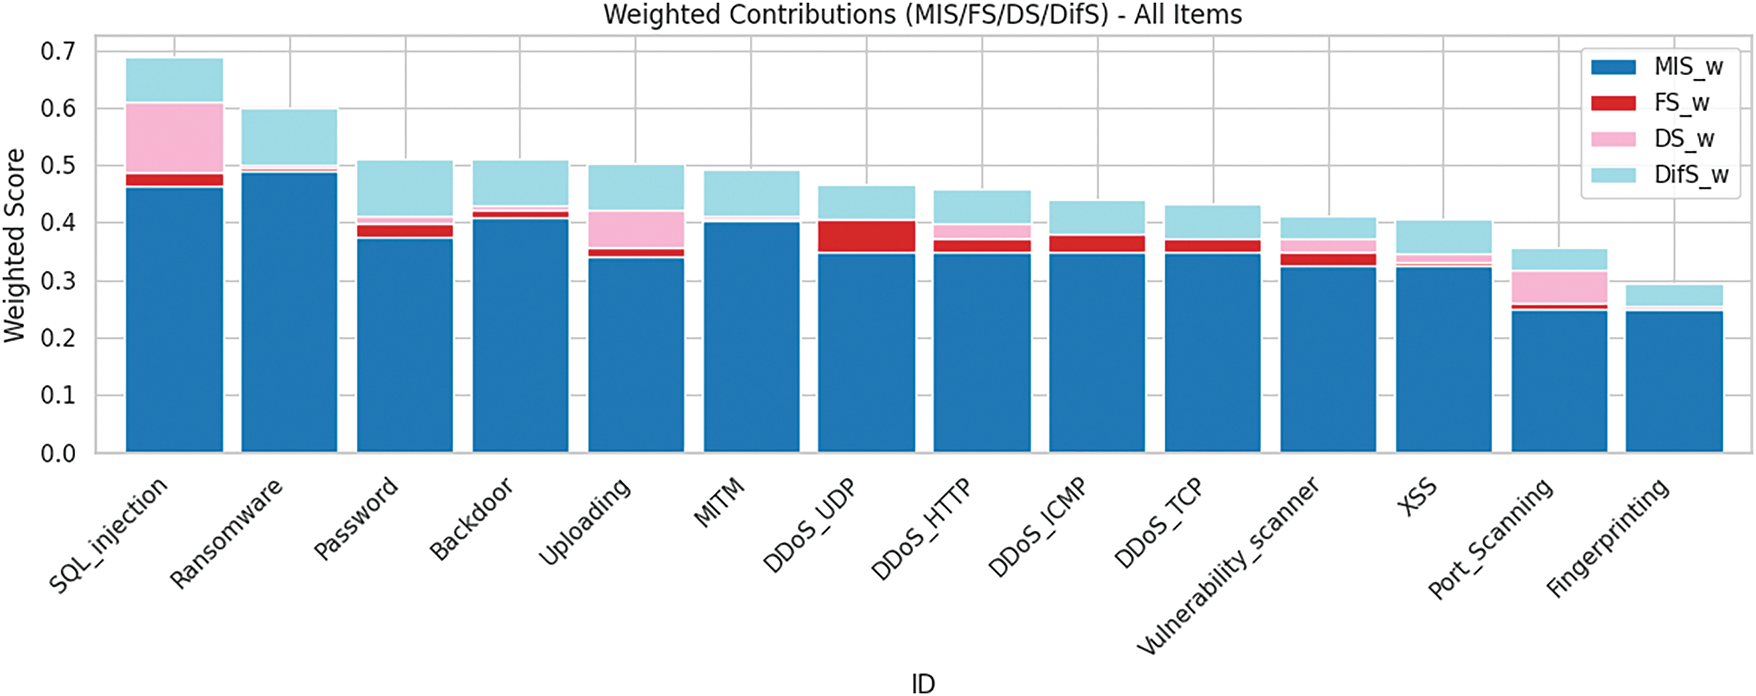
Figure 9: Weighted contributions of result
SQL_injection was ranked overwhelmingly first, achieving exceptionally high scores across all evaluation metrics. This finding aligns with the real-world industrial assessment where SQL injection is consistently classified as one of the top-tier security risks [50]. The most conspicuous metric was its DS, which was the highest among all 14 attack types. The DNN model recorded a detection rate of less than 20%, which is consistent with research findings indicating that advanced and polymorphic SQL injection attacks are difficult to detect and thus pose a significant vulnerability [51].
Ransomware, while assigned very high MIS and DifS scores given its well-known destructive impact, ranked fourth because detection proved comparatively easier in our evaluation. Nevertheless, given its sustained destructive potential, it remains a key attack category that warrants constant vigilance. This inference is supported by other research, which warns that although the core behaviors of ransomware can be relatively straightforward to detect, a successful attack can lead to catastrophic financial and societal damage [52,53].
6.2 The Significance of Time-Series Datasets in Cybersecurity Research
While the Edge-IoT dataset utilized for our risk model contained a ‘frame.time’ column, it was ultimately excluded during preprocessing due to significant data quality issues. The logged timestamps lacked a consistent format, and many entries were ambiguous, rendering the data unsuitable for rigorous time-series analysis. This is a notable limitation, as time-series data can serve as a critical indicator, enabling the modeling of various distributions and mass functions beyond simple frequency counts [54]. Consequently, the absence of reliable temporal data restricted our ability to model more sophisticated functions for the FS calculation in this study.
There is a notable scarcity of publicly available cybersecurity datasets, and even when such datasets exist, they often present significant analytical challenges. A fundamental problem is that many available datasets do not reflect the contemporary technological landscape, thus providing an inadequate basis for evaluating modern threats and validating new models [55]. This scarcity of relevant, high-quality data ultimately impedes the development of robust and timely security metrics [55].
While assessing aggregate, ecosystem-wide cyber risk is important, it is equally necessary to evaluate threats using site-specific datasets tailored to particular operational contexts. Although proprietary datasets are more constrained than aggregated benchmarks, they enable risk assessments that align with the realities of a given industry environment. Achieving this requires high-quality time-series telemetry and consistent log collection across heterogeneous edge devices, ensuring comparability and longitudinal reliability.
6.3 Lightweight Risk Assessment Model
Cyber-attacks are growing in sophistication and intelligence, leading to a commensurate surge in financial and societal damages [56]. The recent advent of generative AI has magnified this risk, yet new technologies are often adopted without adequate security assessment procedures, creating a reality where defensive capabilities lag behind the non-linear growth of threats [57].
In this context, our research introduces a lightweight model designed to provide quantitative risk metrics. While the threat landscape is evolving rapidly, the development of indicators and frameworks to accurately measure and evaluate these changes has not kept pace [55]. We contend that in such a dynamic environment, a lightweight model enabling at least a baseline security evaluation is a valuable and pragmatic approach, allowing organizations to maintain alignment with and respond to the rapidly changing threat environment.
While greater rigor in designing quantitative evaluation metrics generally improves reliability, it also increases complexity and slows updates. In this study, limitations arising from reliance on a single dataset, the constraints of DNN models, and skepticism toward alternative metrics are all acknowledged as valid concerns. Nevertheless, to deliver a highly portable, field-ready lightweight scoring model, deliberate trade-offs were made, enabling a challenging yet effective approach that culminated in actionable conclusions. The community should continue to debate which values to prioritize and at what point to reach consensus so that defensible, practically acceptable evaluation models can be developed.
Cyber threats are increasing at an exponential rate, yet defensive innovations have not kept pace with the rapid evolution of threats. This discrepancy compels critical re-evaluation of strategies for confronting such rapid change. This study addresses this challenge by presenting a lightweight yet robust quantitative risk scoring model that integrates MITRE ATT&CK, CVE, CVSS, and the Cyber Kill Chain into a unified assessment methodology. The key contribution lies in systematically mapping attack types observed in Edge-IoT/IIoT environments to standardized frameworks, enabling immediate reference to attack methods, severity through CVSS vectors, and manualized response procedures. By consolidating multiple cybersecurity frameworks into a single scoring model, we create an organically adaptable system where each component can be independently updated as new attack vectors emerge, ensuring sustained relevance in rapidly evolving threat landscapes.
A significant advancement of this work is the additive scoring structure that balances computational efficiency with analytical rigor. Unlike traditional risk assessment frameworks that demand extensive computational resources and hierarchical complexity—thereby limiting portability to resource-constrained environments and hindering widespread adoption in real-world industrial settings—this lightweight model facilitates rapid threat prioritization across diverse operational contexts, including mobile and edge deployments. The additive formulation, comprising Impact (MIS), Frequency (FS), Detection (DS), and Difficulty (DifS) components, preserves independent interpretability of each risk dimension while preventing the severe distortions that multiplicative aggregation can induce when prioritizing low-frequency yet high-impact attacks. This design choice ensures that critical threats are not obscured by conventional frequency-based approaches, enabling more nuanced and actionable risk assessments.
Robustness validation through non-parametric correlation analysis confirms the model’s stability under operational variability. Spearman’s and Kendall’s rank correlation coefficients, combined with bootstrap confidence interval analysis, demonstrate that the model maintains consistent ranking performance across weight perturbations, establishing sufficient robustness for deployment in dynamic threat environments despite its lightweight design. This statistical validation underscores that analytical validity is not compromised by computational efficiency, a critical characteristic for adaptive deployment across heterogeneous edge infrastructures.
A key strength of this approach lies in its grounding in well-established, industry-validated frameworks such as MITRE ATT&CK. By systematically incorporating such rigorously vetted knowledge bases into our risk model, we enable not only rapid threat identification and response but also establish standardized assessment criteria that extend naturally into complementary domains such as digital forensics and cyber resilience. This framework-driven methodology provides coherent strategic guidance across the entire threat management lifecycle—from prevention through incident response to post-breach recovery. The standardized risk profiles generated through this methodology support evidence-based resource allocation, facilitate systematic incident investigation, and strengthen digital forensics capabilities by providing traceable threat attribution through CVE-CVSS linkages and MITRE ATT&CK mappings. Such structured threat intelligence becomes indispensable as edge deployments proliferate and diversify, where maintaining defensive agility commensurate with environmental change demands systematic data collection paired with portable evaluation frameworks.
This study bridges the gap between defensive capabilities and offensive innovation by delivering a highly portable, field-deployable methodology that maintains analytical validity while ensuring practical applicability in real-world cybersecurity environments. Establishing such a foundation for adaptive threat modeling in next-generation cyber-physical infrastructures represents a critical step toward operational resilience in increasingly complex threat landscapes. Nevertheless, challenges remain regarding improvements in detection rates and inherent limitations in model rigor. Addressing these will require continued research focused on balancing methodological precision with computational efficiency. The development of practical, field-deployable guidelines and evaluation methodologies is essential to enable effective utilization of quantitative risk models across diverse industrial environments, ultimately advancing the state of operational cybersecurity practice.
Acknowledgement: We extend our appreciation to the Sungkyunkwan University Software Laboratory (swlab) for providing the computational infrastructure for our experiments.
Funding Statement: This research was supported by the “Regional Innovation System & Education (RISE)” through the Seoul RISE Center, funded by the Ministry of Education (MOE) and the Seoul Metropolitan Government (2025-RISE-01-018-05). And this research was supported by Quad Miners Corp.
Author Contributions: The authors confirm contribution to the paper as follows: Conceptualization, Tae-hyeon Yun; methodology, Tae-hyeon Yun; software, Tae-hyeon Yun; validation, Tae-hyeon Yun; formal analysis, Tae-hyeon Yun; investigation, Tae-hyeon Yun; resources, Moohong Min; data curation, Tae-hyeon Yun; writing—original draft preparation, Tae-hyeon Yun; writing—review and editing, Moohong Min; visualization, Tae-hyeon Yun; supervision, Moohong Min; project administration, Moohong Min. All authors reviewed the results and approved the final version of the manuscript.
Availability of Data and Materials: The Edge-IoT/IIoT dataset that support the findings of this study is openly available in Kaggle at https://www.kaggle.com/datasets/mohamedamineferrag/edgeiiotset-cyber-security-dataset-of-iot-iiot (accessed on 06 August 2025). CVE dataset from NVD is openly available in NVD data feeds page at https://nvd.nist.gov/vuln/data-feeds (accessed on 14 August 2025).
Ethics Approval: Not applicable.
Conflicts of Interest: The authors declare no conflicts of interest to report regarding the present study.
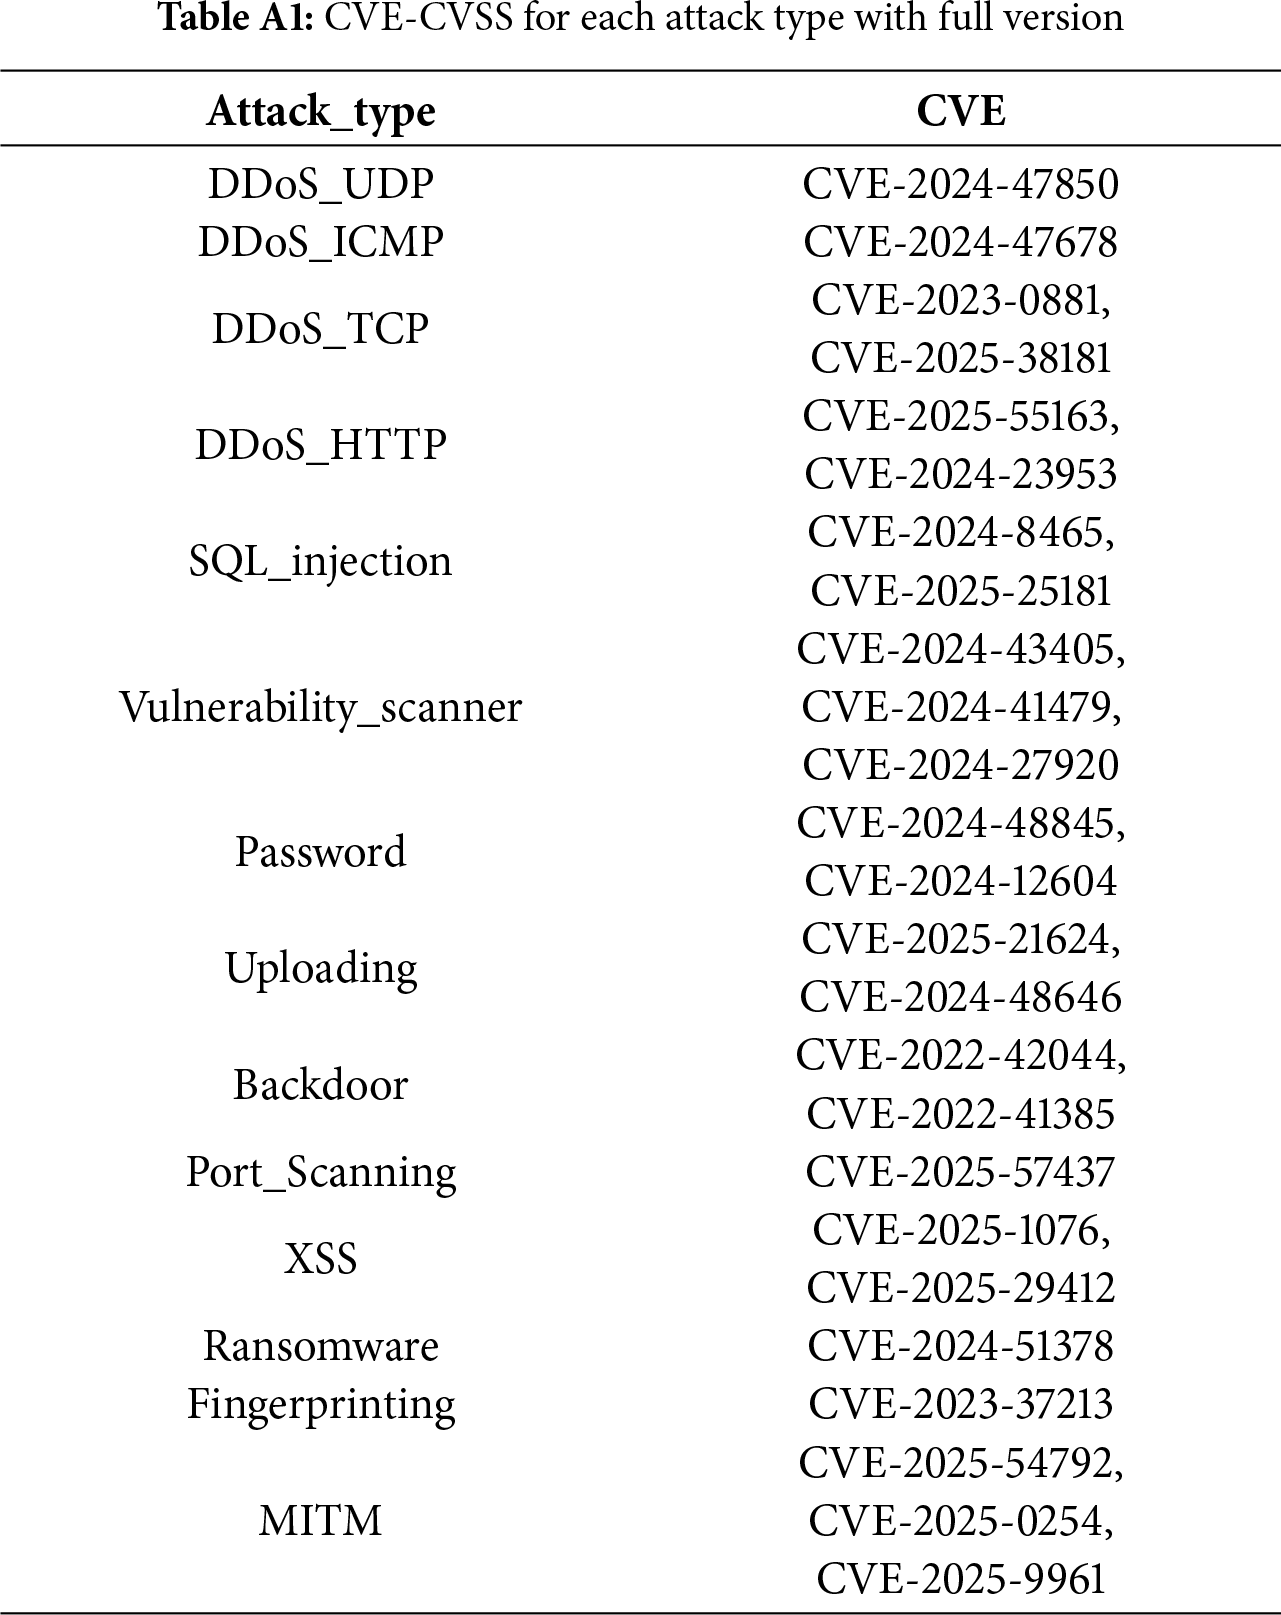
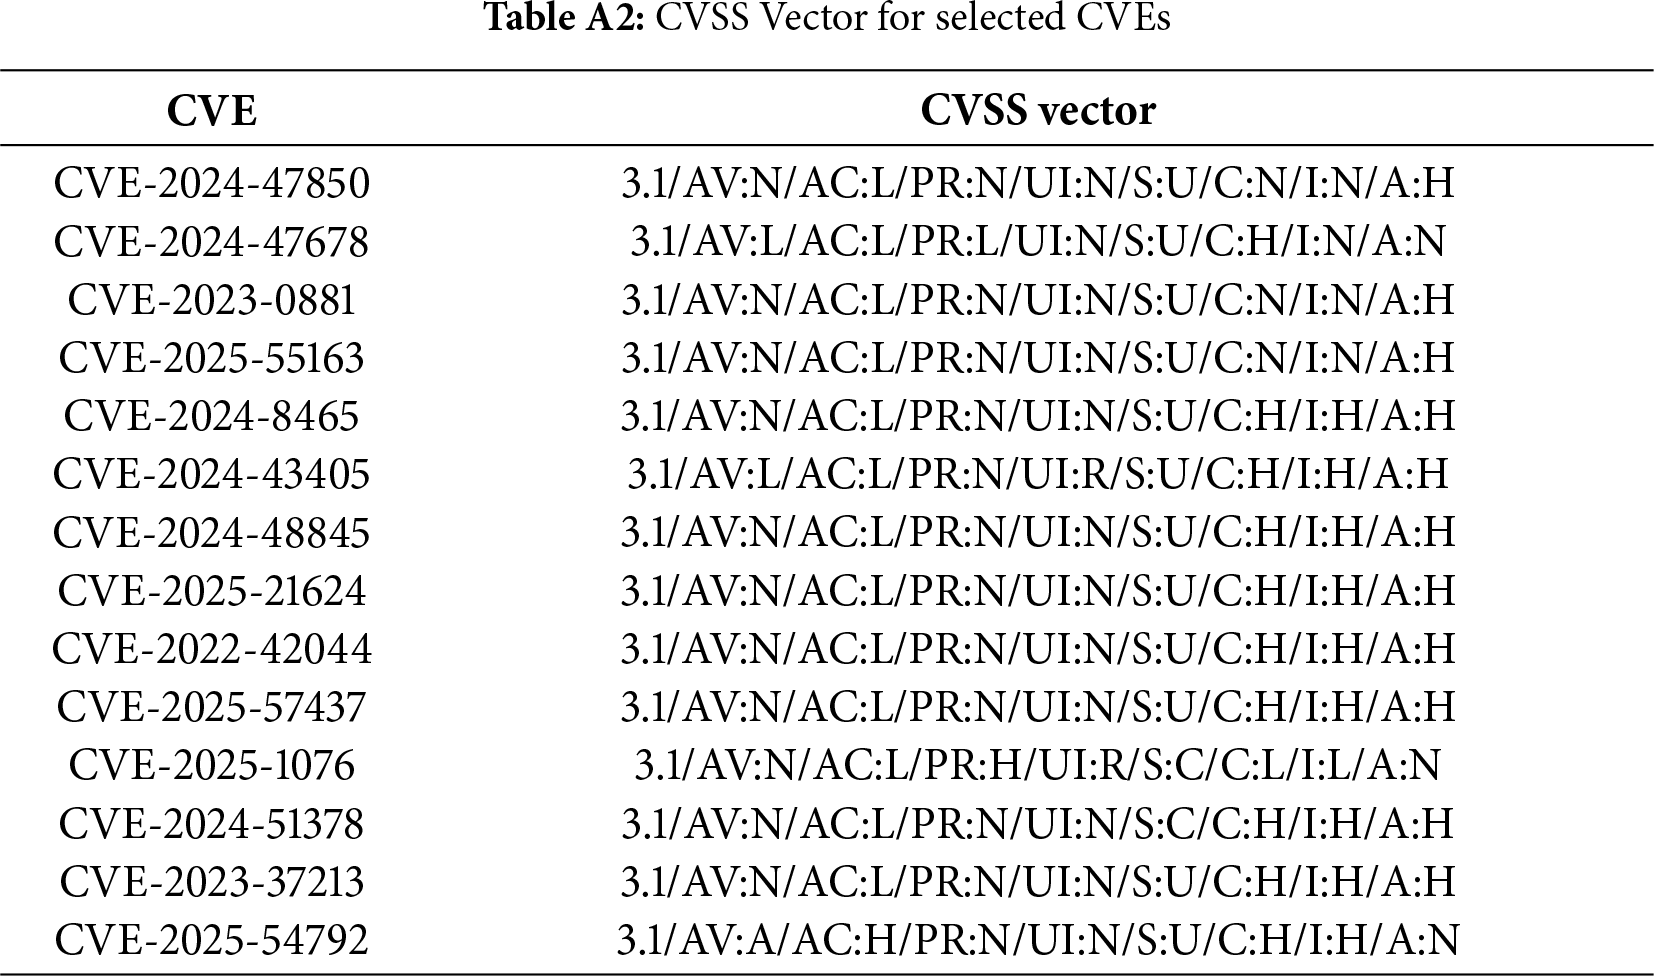
Appendix A CVE and CVSS Vector
This appendix provides the complete mapping between attack types and CVEs, along with the corresponding CVSS vector values. CVSS vector prefixes encode the version; in this study, all vectors were compiled under CVSS v3.1.
Appendix B Structure of DNN Model
This appendix provides a detailed specification of the DNN architecture and hyperparameter settings, including layer configurations and optimizer parameters, to facilitate transparency and reproducibility.
References
1. Shafee A, Hasan S, Awaad TA. Privacy and security vulnerabilities in edge intelligence: an analysis and countermeasures. Comput Elect Eng. 2025;123(4):110146. doi:10.1016/j.compeleceng.2025.110146. [Google Scholar] [CrossRef]
2. Zhao K, Li L, Ding K, Gong NZ, Zhao Y, Dong Y. A survey of model extraction attacks and defenses in distributed computing environments. arXiv:2502.16065. 2025. [Google Scholar]
3. Kolias C, Kambourakis G, Stavrou A, Voas J. DDoS in the IoT: mirai and other botnets. Computer. 2017;50(7):80–4. doi:10.1109/mc.2017.201. [Google Scholar] [CrossRef]
4. Benmalek M. Ransomware on cyber-physical systems: taxonomies, case studies, security gaps, and open challenges. Inter Things Cyber-Phys Syst. 2024;4(1):186–202. doi:10.1016/j.iotcps.2023.12.001. [Google Scholar] [CrossRef]
5. Shi W, Cao J, Zhang Q, Li Y, Xu L. Edge computing: vision and challenges. IEEE Inter Things J. 2016;3(5):637–46. doi:10.1109/jiot.2016.2579198. [Google Scholar] [CrossRef]
6. Quinn S, Ivy N, Barrett M, Witte G, Gardner R. NISTIR 8286B: prioritizing cybersecurity risk for enterprise risk management. Technical report; Gaithersburg, MD, USA: NIST; 2022. doi:10.6028/NIST.IR.8286B. [Google Scholar] [CrossRef]
7. Weisman MJ, Kott A, Ellis JE, Murphy BJ, Parker TW, Smith S, et al. Quantitative measurement of cyber resilience: modeling and experimentation. ACM Transact Cyber-Phys Syst. 2025;9(1):1–25. doi:10.1145/3703159. [Google Scholar] [CrossRef]
8. Theisen C, Munaiah N, Al-Zyoud M, Carver JC, Meneely A, Williams L. Attack surface definitions: a systematic literature review. Inform Softw Technol. 2018;104(6):94–103. doi:10.1016/j.infsof.2018.07.008. [Google Scholar] [CrossRef]
9. Xiong W, Legrand E, Åberg O, Lagerström R. Cyber security threat modeling based on the MITRE Enterprise ATT&CK Matrix. Softw Syst Model. 2022;21(1):157–77. [Google Scholar]
10. Jiang Y, Meng Q, Shang F, Oo N, Minh LTH, Lim HW, et al. MITRE ATT&CK applications in cybersecurity and the way forward. arXiv:2502.10825. 2025. [Google Scholar]
11. Georgiadou A, Mouzakitis S, Askounis D. Assessing mitre att&ck risk using a cyber-security culture framework. Sensors. 2021;21(9):3267. [Google Scholar] [PubMed]
12. Alwakeel AM. An overview of fog computing and edge computing security and privacy issues. Sensors. 2021;21(24):8226. doi:10.3390/s21248226. [Google Scholar] [PubMed] [CrossRef]
13. Mazhar T, Talpur DB, Shloul TA, Ghadi YY, Haq I, Ullah I, et al. Analysis of IoT security challenges and its solutions using artificial intelligence. Brain Sci. 2023;13(4):683. doi:10.3390/brainsci13040683. [Google Scholar] [PubMed] [CrossRef]
14. Salayma M. Threat modelling in Internet of Things (IoT) environments using dynamic attack graphs. Front Inter Things. 2024;3:1306465. doi:10.3389/friot.2024.1306465. [Google Scholar] [CrossRef]
15. Abraham JA, Bindu V. Intrusion detection and prevention in networks using machine learning and deep learning approaches: a review. In: 2021 International Conference on Advancements in Electrical, Electronics, Communication, Computing and Automation (ICAECA); 2021 Oct 8–9; Coimbatore, India. [Google Scholar]
16. Alsoufi MA, Siraj MM, Ghaleb FA, Al-Razgan M, Al-Asaly MS, Alfakih T, et al. Anomaly-based intrusion detection model using deep learning for IoT networks. Comput Model Eng Sci. 2024;141(1):823–45. [Google Scholar]
17. Liu Y, Li S, Wang X, Xu L. A review of hybrid cyber threats modelling and detection using artificial intelligence in IIoT. Comput Model Eng Sci. 2024;140(2):1233–61. [Google Scholar]
18. Zhang X, Zheng X, Wu DD. Attacking DNN-based Intrusion Detection Models. IFAC-PapersOnLine. 2020;53(5):415–9. doi:10.1016/j.ifacol.2021.04.118. [Google Scholar] [CrossRef]
19. FIRST Org, Inc. Common Vulnerability Scoring System version 3.1: specification Document; 2021 [Internet]. [cited 2025 Aug 6]. Available from: https://www.first.org/cvss/v4-0/specification-document. [Google Scholar]
20. Kuppa A, Aouad L, Le-Khac NA. Linking cve’s to mitre att&ck techniques. In: Proceedings of the 16th International Conference on Availability, Reliability and Security; 2021 Aug 17–20; Vienna, Austria. p. 1–12. [Google Scholar]
21. LOCKHEED MARTIN, Corp. Cyber Kill Chain [Internet]. [cited 2025 Sep 23]. Available from: https://www.lockheedmartin.com/en-us/capabilities/cyber/cyber-kill-chain.html. [Google Scholar]
22. Nisioti A, Loukas G, Mylonas A, Panaousis E. Forensics for multi-stage cyber incidents: survey and future directions. Forensic Sci Int: Digit Investigat. 2023;44(2):301480. doi:10.1016/j.fsidi.2022.301480. [Google Scholar] [CrossRef]
23. Salim DT, Singh MM, Keikhosrokiani P. A systematic literature review for APT detection and Effective Cyber Situational Awareness (ECSA) conceptual model. Heliyon. 2023;9(7):e17156. doi:10.1016/j.heliyon.2023.e17156. [Google Scholar] [PubMed] [CrossRef]
24. Jayakumar V, Kannan J, Kausar N, Deveci M, Wen X. Multicriteria group decision making for prioritizing IoT risk factors with linear diophantine fuzzy sets and MARCOS method. Granul Comput. 2024;9(3):56. doi:10.1007/s41066-024-00480-8. [Google Scholar] [CrossRef]
25. Goyal P, Sanna N, Tucker T. A FAIR framework for effective cyber risk management: leveraging the FAIR Model, FAIR-CAM, and FAIR-MAM to align cybersecurity efforts with business priorities and regulatory compliance; 2025 [Internet]. [cited 2025 Aug 12]. Available from: https://www.fairinstitute.org/state-of-crm-2025. [Google Scholar]
26. Ferrag MA, Friha O, Hamouda D, Maglaras L, Janicke H. Edge-IIoTset: a new comprehensive realistic cyber security dataset of IoT and IIoT applications for centralized and federated learning. IEEE Access. 2022;10:40281–306. doi:10.1109/access.2022.3165809. [Google Scholar] [CrossRef]
27. Dablain DA, Bellinger C, Krawczyk B, Chawla NV. Efficient augmentation for imbalanced deep learning. In: 2023 IEEE 39th International Conference on Data Engineering (ICDE); 2023 Apr 3–7; Anaheim, CA, USA. p. 1433–46. [Google Scholar]
28. Sha K, Yang TA, Wei W, Davari S. A survey of edge computing-based designs for IoT security. Digital Communicat Netw. 2020;6(2):195–202. doi:10.1016/j.dcan.2019.08.006. [Google Scholar] [CrossRef]
29. Xu H, Yu W, Griffith D, Golmie N. A survey on industrial Internet of Things: a cyber-physical systems perspective. IEEE Access. 2018;6:78238–59. doi:10.1109/access.2018.2884906. [Google Scholar] [PubMed] [CrossRef]
30. ReliaQuest. Mapping MITRE ATT&CK to the microsoft exchange zero-day exploits; 2021 [Internet]. [cited 2025 Aug 13]. Available from: https://reliaquest.com/blog/mapping-mitre-attack-to-microsoft-exchange-zero-day-exploits/. [Google Scholar]
31. The MITRE Corporation. CVE 25 YEARS; 2021 [Internet]. [cited 2025 Aug 13]. Available from: https://www.cve.org/. [Google Scholar]
32. Li X, Moreschini S, Zhang Z, Palomba F, Taibi D. The anatomy of a vulnerability database: a systematic mapping study. J Syst Softw. 2023;201(1):111679. doi:10.1016/j.jss.2023.111679. [Google Scholar] [CrossRef]
33. Gordienko Y, Gordienko N, Taran V, Rojbi A, Telenyk S, Stirenko S. Effect of natural and synthetic noise data augmentation on physical action classification by brain-computer interface and deep learning. Front Neuroinformatics. 2025;19:1521805. doi:10.3389/fninf.2025.1521805. [Google Scholar] [PubMed] [CrossRef]
34. GeeksforGeeks. Gaussian Noise; 2025 [Internet]. [cited 2025 Aug 7]. Available from: https://www.geeksforgeeks.org/electronics-engineering/gaussian-noise/. [Google Scholar]
35. Adegoke OM, Gbadamosi SL, Adejumobi BS, Owolabi IE, Oke WA, Nwulu NI. Noise modelling and mitigation for broadband in-door power line communication systems. IET Communications. 2024;18(15):869–81. doi:10.1049/cmu2.12797. [Google Scholar] [CrossRef]
36. Mafi M, Izquierdo W, Martin H, Cabrerizo M, Adjouadi M. Deep convolutional neural network for mixed random impulse and Gaussian noise reduction in digital images. IET Image Processing. 2020;14(15):3791–801. doi:10.1049/iet-ipr.2019.0931. [Google Scholar] [CrossRef]
37. Lin TY, Goyal P, Girshick R, He K, Dollár P. Focal loss for dense object detection. In: Proceedings of the 2017 IEEE International Conference on Computer Vision; 2017 Oct 22–29; Venice, Italy. p. 2980–8. [Google Scholar]
38. Donchev D, Vassilev V, Tonchev D. Impact of false positives and false negatives on security risks in transactions under threat. In: International Conference on Trust and Privacy in Digital Business. Cham, Switzerland: Springer; 2021. p. 50–66. [Google Scholar]
39. MacKenzie CA. Summarizing risk using risk measures and risk indices. Risk Analysis. 2014;34(12):2143–62. doi:10.1111/risa.12220. [Google Scholar] [PubMed] [CrossRef]
40. Le VH, Zhang H. Log-based anomaly detection with deep learning: how far are we? In: Proceedings of the 44th International Conference on Software Engineering; 2022 May 25–27; Pittsburgh, PA, USA. p. 1356–67. [Google Scholar]
41. Ullah I, Mahmoud QH. A scheme for generating a dataset for anomalous activity detection in IoT networks. In: Canadian Conference On Artificial Intelligence. Cham, Switzerland: Springer; 2020. p. 508–20. [Google Scholar]
42. Sen Ö, Ivanov B, Kloos C, Zöll C, Lutat P, Henze M, et al. Simulation of multi-stage attack and defense mechanisms in smart grids. Int J Crit Infrastruct Prot. 2025;48:100727. doi:10.1016/j.ijcip.2024.100727. [Google Scholar] [CrossRef]
43. Diaz-Gallo LM, Brynedal B, Westerlind H, Sandberg R, Ramsköld D. Understanding interactions between risk factors, and assessing the utility of the additive and multiplicative models through simulations. PLoS One. 2021;16(4):e0250282. doi:10.1101/706234. [Google Scholar] [CrossRef]
44. Manning L, Birchmore I, Morris W. Swans and elephants: a typology to capture the challenges of food supply chain risk assessment. Trends Food Sci Technoly. 2020;106(1–2):288–97. doi:10.1016/j.tifs.2020.10.007. [Google Scholar] [PubMed] [CrossRef]
45. Tsanakas A, Millossovich P. Sensitivity analysis using risk measures. Risk Analysis. 2016;36(1):30–48. doi:10.1111/risa.12434. [Google Scholar] [PubMed] [CrossRef]
46. Puth MT, Neuhäuser M, Ruxton GD. Effective use of Spearman’s and Kendall’s correlation coefficients for association between two measured traits. Animal Behaviour. 2015;102:77–84. doi:10.1016/j.anbehav.2015.01.010. [Google Scholar] [CrossRef]
47. Miot HA. Correlation analysis in clinical and experimental studies. Jornal Vascular Brasileiro. 2018;17:275–9. [Google Scholar] [PubMed]
48. Croux C, Dehon C. Influence functions of the Spearman and Kendall correlation measures. Statist Meth Applicat. 2010;19(4):497–515. [Google Scholar]
49. Bishara AJ, Hittner JB. Confidence intervals for correlations when data are not normal. Behav Res Meth. 2017;49(1):294–309. doi:10.3758/s13428-016-0702-8. [Google Scholar] [PubMed] [CrossRef]
50. Paul A, Sharma V, Olukoya O. SQL injection attack: detection, prioritization & prevention. J Inf Secur Appl. 2024;85:103871. doi:10.1016/j.jisa.2024.103871. [Google Scholar] [CrossRef]
51. Floris G, Scano C, Montaruli B, Demetrio L, Valenza A, Compagna L, et al. ModSec-AdvLearn: countering adversarial SQL injections with robust machine learning. IEEE Trans Inf Forensics Secur. 2025;20:6693–705. doi:10.1109/tifs.2025.3583234. [Google Scholar] [CrossRef]
52. Ispahany J, Islam M, Khan MA, Islam M. A sysmon incremental learning system for ransomware analysis and detection. arXiv:2501.01089. 2025. [Google Scholar]
53. Dameff C, Tully J, Chan TC, Castillo EM, Savage S, Maysent P, et al. Ransomware attack associated with disruptions at adjacent emergency departments in the US. JAMA Network Open. 2023;6(5):e2312270–0. doi:10.1001/jamanetworkopen.2023.12270. [Google Scholar] [PubMed] [CrossRef]
54. Shapovalova Y, Baştürk N, Eichler M. Multivariate count data models for time series forecasting. Entropy. 2021;23(6):718. doi:10.3390/e23060718. [Google Scholar] [PubMed] [CrossRef]
55. Cremer F, Sheehan B, Fortmann M, Kia AN, Mullins M, Murphy F, et al. Cyber risk and cybersecurity: a systematic review of data availability. Geneva Pap Risk Insur Issues Pract. 2022;47(3):698. doi:10.1057/s41288-022-00266-6. [Google Scholar] [PubMed] [CrossRef]
56. Eisenbach TM, Kovner A, Lee M. When it rains, it pours: Cyber risk and financial conditions. New York, NY, USA: FRB of New York. Staff Report. 2022. No. 1022. [Google Scholar]
57. World Economic Forum. Global Cybersecurity Outlook 2025; 2025 [Internet]. [cited 2025 Aug 16]. Available from: https://reports.weforum.org/docs/WEF_Global_Cybersecurity_Outlook_2025.pdf. [Google Scholar]
Cite This Article
 Copyright © 2025 The Author(s). Published by Tech Science Press.
This work is licensed under a Creative Commons Attribution 4.0 International License , which permits unrestricted use, distribution, and reproduction in any medium, provided the original work is properly cited.
 Downloads
 Citation Tools