
 Submit a Paper
 Propose a Special lssue
 Open Access
REVIEW
A Systematic Review of Multimodal Fusion and Explainable AI Applications in Breast Cancer Diagnosis
1 Department of Information Systems, College of Computer and Information Technology, Majmaah University, Majmaah, 11952, Saudi Arabia
2 Department of Information Systems, College of Computer and Information Sciences, King Saud University, Riyadh, 11451, Saudi Arabia
3 Research Chair of Pervasive and Mobile Computing and Department of Information Systems, College of Computer and Information Sciences, King Saud University, Riyadh, 11543, Saudi Arabia
* Corresponding Author: Deema Alzamil. Email:
(This article belongs to the Special Issue: Exploring the Impact of Artificial Intelligence on Healthcare: Insights into Data Management, Integration, and Ethical Considerations)
Computer Modeling in Engineering & Sciences 2025, 145(3), 2971-3027. https://doi.org/10.32604/cmes.2025.070867
Received 25 July 2025; Accepted 11 November 2025; Issue published 23 December 2025
 View Full Text
 Download PDF
Abstract
Breast cancer diagnosis relies heavily on many kinds of information from diverse sources—like mammogram images, ultrasound scans, patient records, and genetic tests—but most AI tools look at only one of these at a time, which limits their ability to produce accurate and comprehensive decisions. In recent years, multimodal learning has emerged, enabling the integration of heterogeneous data to improve performance and diagnostic accuracy. However, doctors cannot always see how or why these AI tools make their choices, which is a significant bottleneck in their reliability, along with adoption in clinical settings. Hence, people are adding explainable AI techniques that show the steps the model takes. This review investigates previous work that has employed multimodal learning and XAI for the diagnosis of breast cancer. It discusses the types of data, fusion techniques, and XAI models employed. It was done following the PRISMA guidelines and included studies from 2021 to April 2025. The literature search was performed systematically and resulted in 61 studies. The review highlights a gradual increase in current studies focusing on multimodal fusion and XAI, particularly in the years 2023–2024. It found that studies using multi-modal data fusion achieved the highest accuracy by 5%–10% on average compared to other studies that used single-modality data, an intermediate fusion strategy, and modern fusion techniques, such as cross attention, achieved the highest accuracy and best performance. The review also showed that SHAP, Grad-CAM, and LIME techniques are the most used in explaining breast cancer diagnostic models. There is a clear research shift toward integrating multimodal learning and XAI techniques into the breast cancer diagnostics field. However, several gaps were identified, including the scarcity of public multimodal datasets. Lack of a unified explainable framework in multimodal fusion systems, and lack of standardization in evaluating explanations. These limitations call for future research focused on building more shared datasets and integrating multimodal data and explainable AI techniques to improve decision-making and enhance transparency.Keywords
Breast cancer persists as one of the most prevalent and life-threatening diseases affecting women across the globe. Based on the World Health Organization (WHO) [1], breast cancer is the top cancer killer of women worldwide, accounting for a significant percentage of global cancer fatalities. Early detection and accurate diagnosis are critical factors in improving survival chances and the effectiveness of treatment strategies [2]. The need for timely and reliable diagnostic methods is thus more urgent than ever. However, despite the advancements in medical technology, the field still faces various challenges. These traditional methods are often prone to errors, including false positives (indicate cancer when there is not any) and false negatives (miss real cancer) results. These errors can lead to unnecessary biopsies, missed diagnoses, delayed treatments, and, ultimately, poorer outcomes [3].
In recent years, remarkable developments in artificial intelligence (AI) and machine learning (ML) have demonstrated great promise in addressing these limitations [4]. These technologies can improve diagnostic accuracy and efficiency, enabling healthcare professionals to make more informed and quicker decisions by leveraging the computational power of modern algorithms. Among the most powerful AI techniques for medical imaging is deep learning (DL), particularly convolutional neural networks (CNNs), which have proven extremely efficient in analyzing complex medical images such as mammograms [5]. Using deep learning for advancements in breast cancer diagnosis opens new horizons for upgrading early discovery and progressing treatment results for patients in clinical settings. However, there is still an urgent need for a comprehensive, accurate diagnosis method that integrates multimodal data.
Multimodal learning has great potential to enhance diagnostic accuracy, as it enables the integration of several types of data, such as mammography, ultrasound, genomic profiles, and clinical records, which has made them crucial in the field of breast cancer diagnosis [6]. Integrating different data types from various sources improves diagnostic accuracy because each type of data provides different information: Imaging modalities show the morphological characteristics of the tumor; clinical records provide basic medical information and background on the patient [7], and genetic profiles reveal mutations that can drive cancer. The integration process also helps speed diagnosis and reduces the analysis time required for each type of data separately. Relying on a single source of data affects diagnosis and can lead to errors, emphasizing the importance of integrating different data types [8]. Various data types can be integrated in different stages: early fusion: mix the raw data before it goes into the AI model, intermediate fusion: let each data type learn its own features first, then combine those features, and late fusion: run separate models on each data type, then merge their final decisions [9]. The most widely used fusion strategy in the field of breast cancer diagnosis is intermediate fusion, because it balances modality-specific learning with cross-modal interaction. Despite its advantages, multimodal learning faces challenges, such as a lack of multimodal datasets, dimensional variation, distinct complexity of each data pattern [10], and challenges of explainability [11,12].
This lack of transparency can limit the acceptance and realistic execution of AI models in clinical settings, where healthcare professionals must understand the rationale behind each diagnosis to make informed decisions [13]. Explainable AI (XAI), which aims to make DL models more transparent and interpretable, becomes crucial in this context. In practical terms, without dependable explanations that accurately reflect how the current AI system operates, human users can perceive AI as untrustworthy because of the dynamic and unstable nature of real-world AI applications. Applying XAI techniques in multimodal settings will demonstrate how the combination of multimodal inputs contributes to the model’s output [14].
Although several review papers have discussed the use of AI in general medical imaging or breast cancer prediction using multimodal data, they have approached the topic from a specific perspective, by focused on fusion strategies, deep learning/machine learning techniques, or the performance of these models without addressing how explainability techniques can be applied in the context of multimodal fusion for breast cancer neglecting the importance of transparency and reliability in clinical applications. One study theoretically discussed multimodal data fusion with XAI in the field of breast cancer, focusing on histopathology images, without analyzing any studies that implemented XAI with multimodal data fusion. Table 1 provides a comparative summary of these reviews.
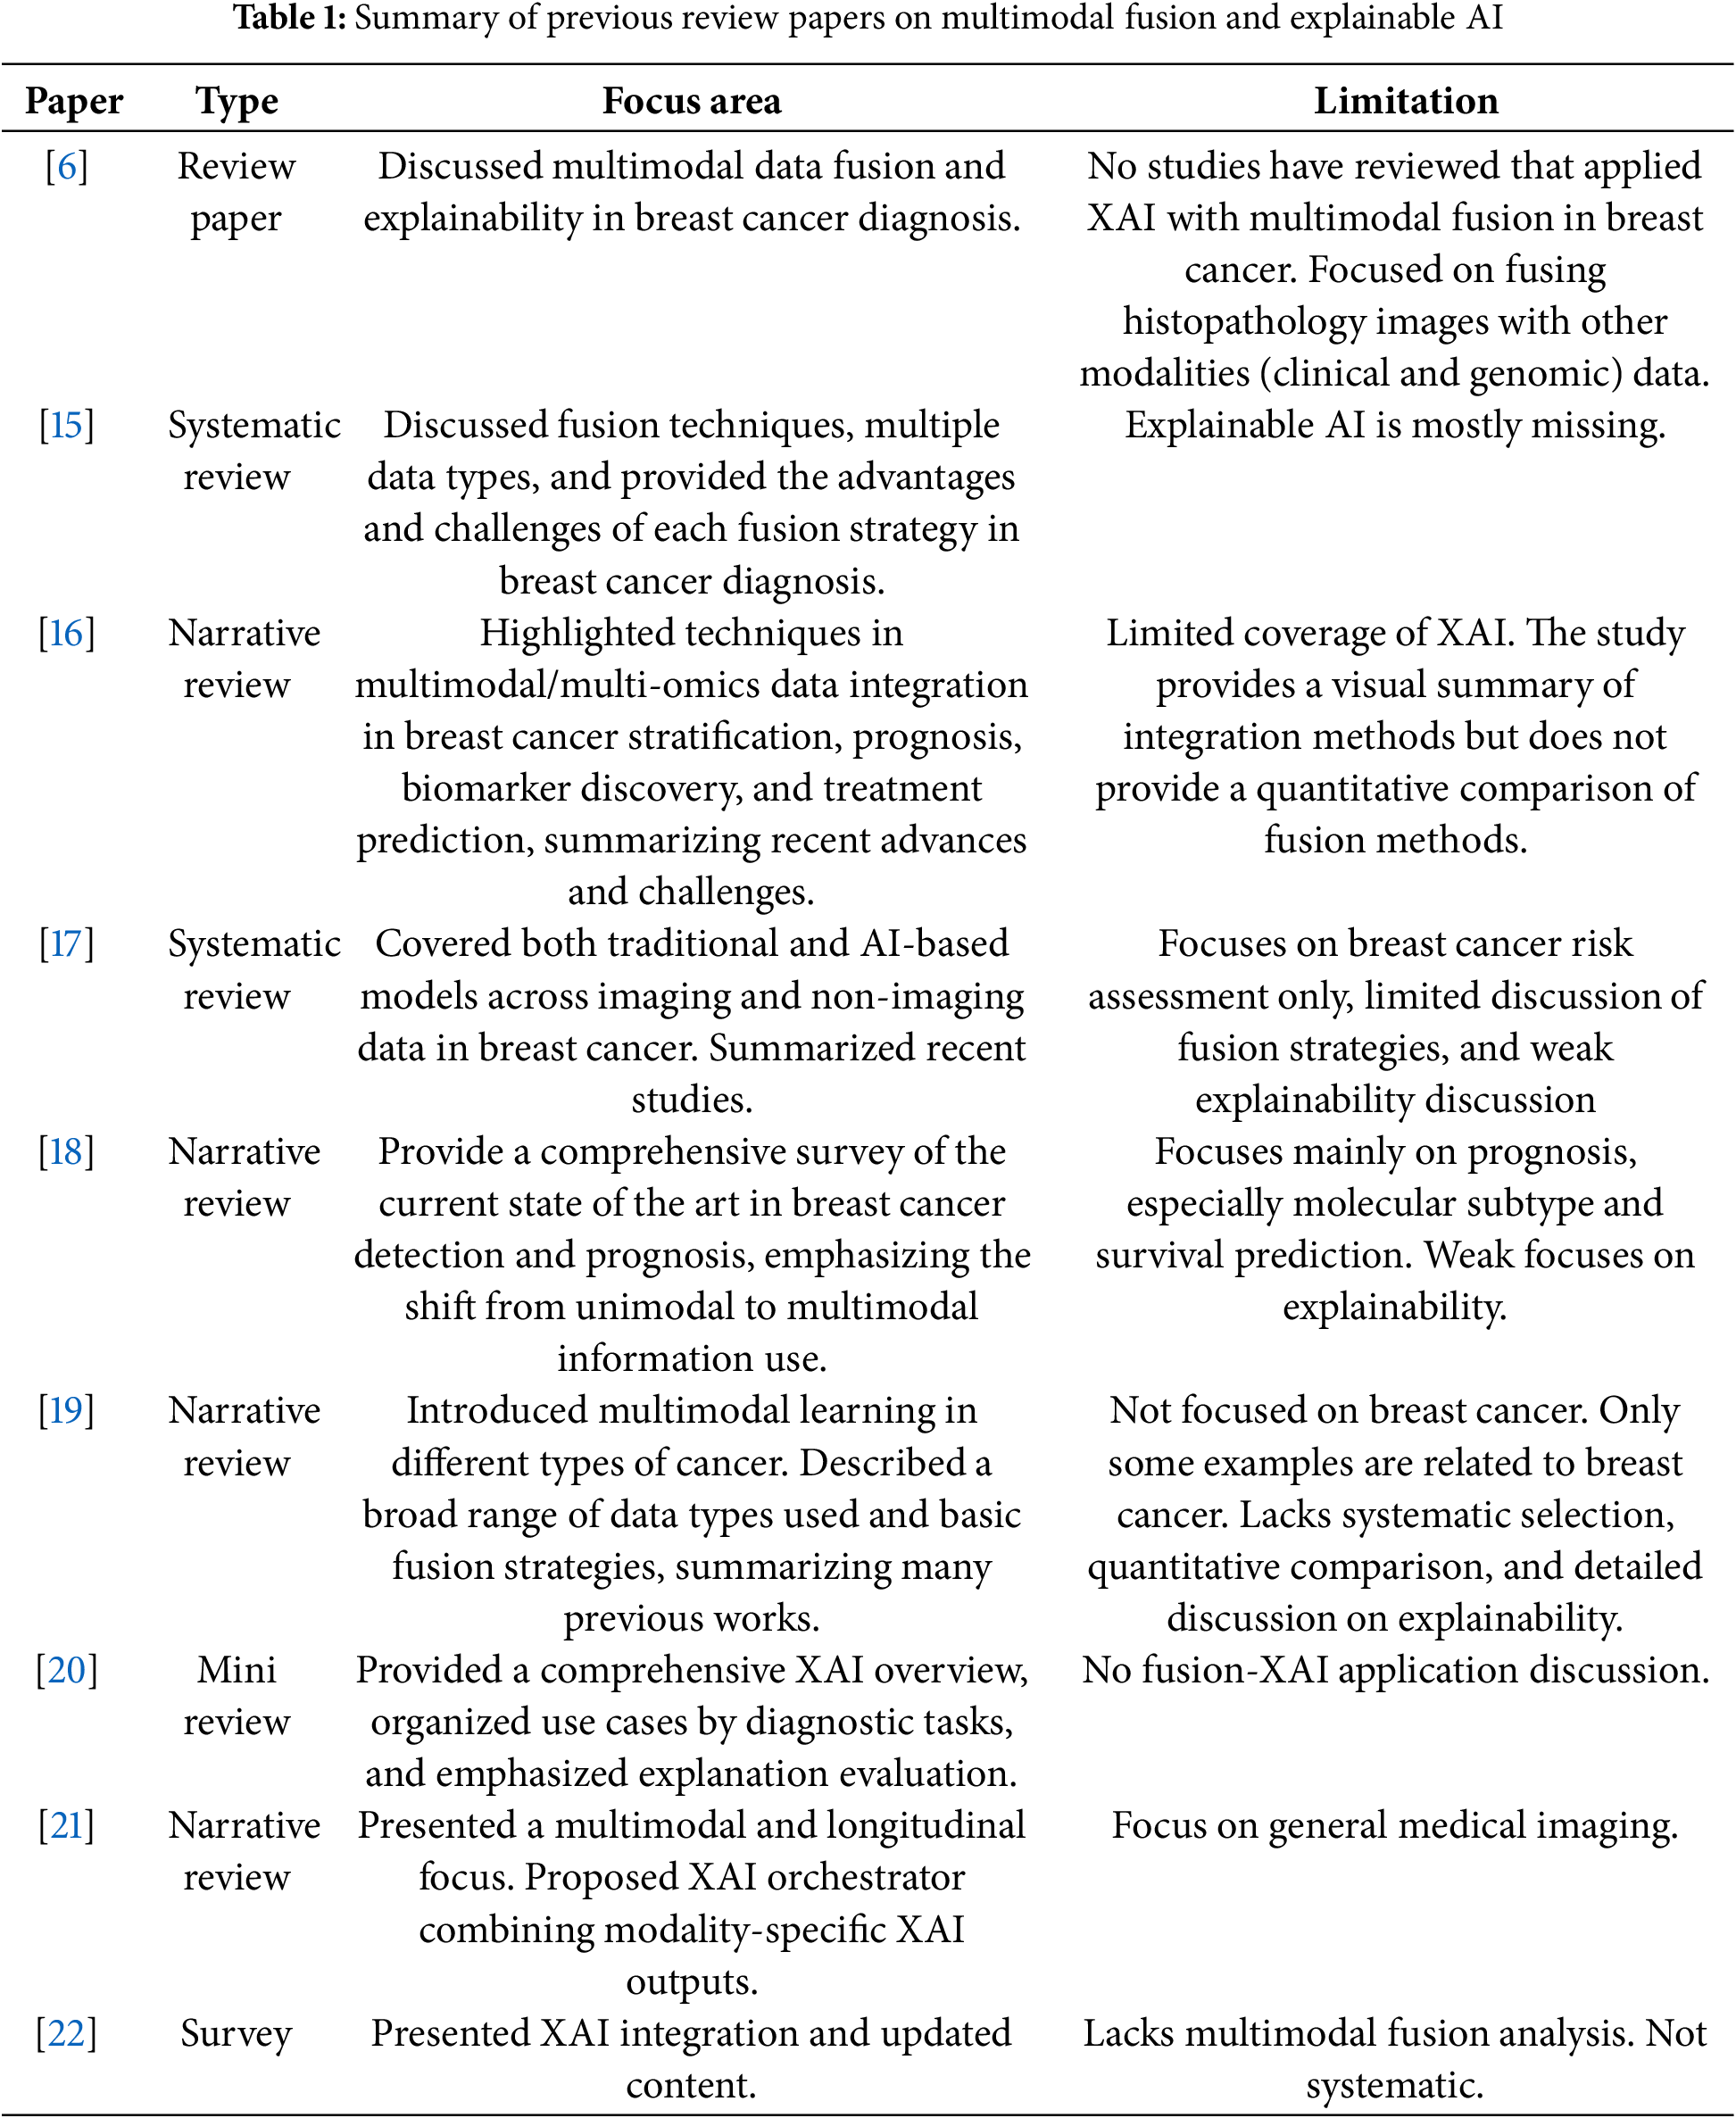
This review highlights the gap in the literature, which is the need for a comprehensive framework that combines the application of multimodal fusion and explainable AI in breast cancer diagnosis and how their interaction impacts decision quality. Unlike primary research articles, this review does not propose a new model. Instead, it aims to provide a systematic, technically grounded synthesis of the current state of multimodal and XAI methods in breast cancer diagnosis, with an emphasis on trends and methodological rigor. It explores the types of data used in diagnosis, fusion strategies, machine learning, deep learning models used, explainability techniques applied in single and multimodal learning, and explanation evaluation tools. The review highlights current limitations and indicates directions for future research.
Most current studies in breast cancer diagnosis have focused on single modal data (such as mammograms or clinical records alone), and explainability is treated as a secondary issue. In breast cancer diagnosis, physicians need imaging, clinical, and other information to make decisions. In addition, explainability is critical for AI systems in healthcare, where trust, transparency, and accountability are essential.
However, no reviews have systematically discussed studies that have applied multimodal fusion with explainable AI to breast cancer diagnosis, nor do they discuss explainability evaluation in previous studies. This review fills this gap by comprehensively exploring the intersection of multimodal data fusion and XAI in breast cancer diagnosis.
This review contributes to the following:
1. Following a systematic framework organized based on PRISMA standards in collecting and analyzing studies to ensure transparency and accuracy, and applying QUADAS-2 to evaluate the quality of studies and reduce the possibility of bias.
2. Providing a systematic and organized vision of the basic technical components in the field of breast cancer diagnosis, including data types, AL models, fusion strategies and techniques, and XAI methods.
3. Analyzing how models, fusion strategies, and explanation techniques are operationalized in recent studies to enhance diagnostic accuracy and support clinical decision-making.
4. Comprehensive comparative analysis of performance in previous studies through summary tables and trend analysis based on data type, fusion type, and explanation techniques.
5. Highlighting the relationship between multimodal fusion strategies and explanation techniques, explaining how this relationship can be employed to improve the accuracy of models and enhance their clinical reliability.
6. An analysis of evaluation methodologies, linking explanation evaluation gaps with recognized standards, and emphasizing the lack of unified frameworks to ensure clinical reliability and reproducibility.
7. Presenting a future vision for breast cancer diagnosis research on the application of multimodal fusion and explainable AI, especially considering the progress in generative artificial intelligence technologies.
The remaining sections of this review are structured in this manner: Section 2 presents the methodology of this review, including research questions, research strategy, and eligibility criteria, study selection, data extraction, quality assessment, and data synthesis and analysis. Section 3 provides background on multimodal data, modeling strategies, fusion techniques, and XAI. Section 4 reviews previous studies systematically. Section 5 provides a comprehensive analysis of methods and performance. Section 6 discusses limitations and future directions, and Section 7 concludes the review. The following diagram, Fig. 1, illustrates the general structure of a review paper.
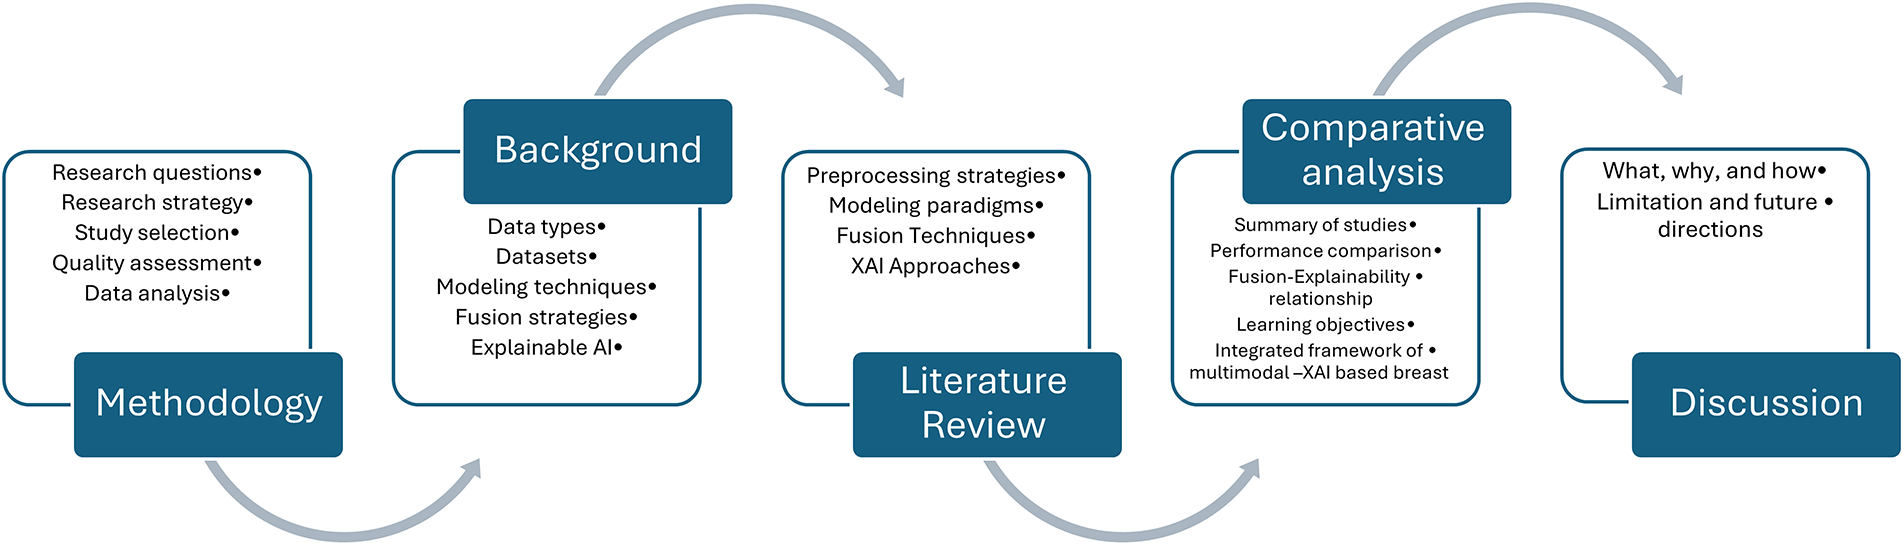
Figure 1: Study structure overview
This methodological structure was intentionally designed to reflect current shifts in multimodal AI research driven by generative and foundation models. This review captures how modern techniques reshapes technical design and evaluation in breast cancer diagnosis by systematically mapping techniques such as Transformer, hybrid XAI approaches.
In accordance with the Preferred Reporting Items for Systematic Reviews and Meta-Analyses guidelines [23], this systematic review was conducted. The (PRISMA) framework provides a structured approach for study identification, screening, eligibility assessment, and inclusion that ensures transparency and reproducibility in the review process. A PRISMA flow diagram is utilized to clarify the selection process, number of studies retrieved from databases, duplicated articles removed, and studies excluded.
A set of research questions is formulated to guide the scope and focus of this review, which explores how multi-modal data fusion and explainable AI are applied in breast cancer diagnosis and identifies trends and gaps in current studies:
1. What types of multimodal data have been used in breast cancer diagnosis, and what fusion strategies have been applied?
2. What machine learning and deep learning models are commonly employed in the multimodal breast cancer diagnosis system?
3. What explainable AI methods have been applied in breast cancer diagnosis research, and to what extent are XAI methods evaluated for their interpretability?
2.2 Research Strategy and Eligibility Criteria
A comprehensive search strategy was developed to capture recent advances in multimodal fusion and explainable AI, such as Transformer architecture, cross-attention fusion, foundation models, and integrated XAI frameworks. Three main databases were selected for search based on their comprehensiveness of medical, scientific, and technical literature: PubMed, Scopus, and IEEE Xplore. Search terms were created and utilized with Boolean operators to maximize relevant articles to capture concepts related to breast cancer, multi modal data fusion, and explainable artificial intelligence. The keywords used included “Breast Cancer,” “Cancer,” “Deep learning,” “Machine learning,” “Artificial intelligence,” “Explainable Artificial intelligence,” “Xai,” “Multimodal,” “Fusion,” “explainable,” and “Interpretable.” This review includes studies from 2021 to April 2025, where the search is started by title, keywords, and abstract. The full electronic search strategy, is available in Appendix A.
Eligibility Criteria
Studies analyzed in this review were based on the following eligibility criteria: 1. The article must be published in English; 2. The article must fall within the field of breast cancer diagnosis; 3. It must include either multimodal data fusion or the use of XAI techniques or both; 4. Reported quantitative performance metrics (AUC, sensitivity, specificity). 5. It must be a peer-reviewed journal article or conference paper; and 5. It must have been published between January 2021 and April 2025. Exclusion criteria were gray literature, reviews, abstracts without evaluation, and works not entered on diagnostic applications.
The study selection process for this review followed the PRISMA guidelines. Initially, 333 articles were obtained from three major databases (PubMed, Scopus, and IEEE Explore); 171 articles were retained after screening the titles and keywords. When removing duplicate articles, 127 unique articles were obtained. After abstract review, the selection was narrowed to 87 studies; 73 articles met the eligibility criteria after a full-text review. Sixty-one eligible studies were ultimately selected based on their relevance to the review objectives with strong inter-rater agreement (κ > 0.85). Fig. 2 illustrates the selection process based on the PRISMA flow diagram.
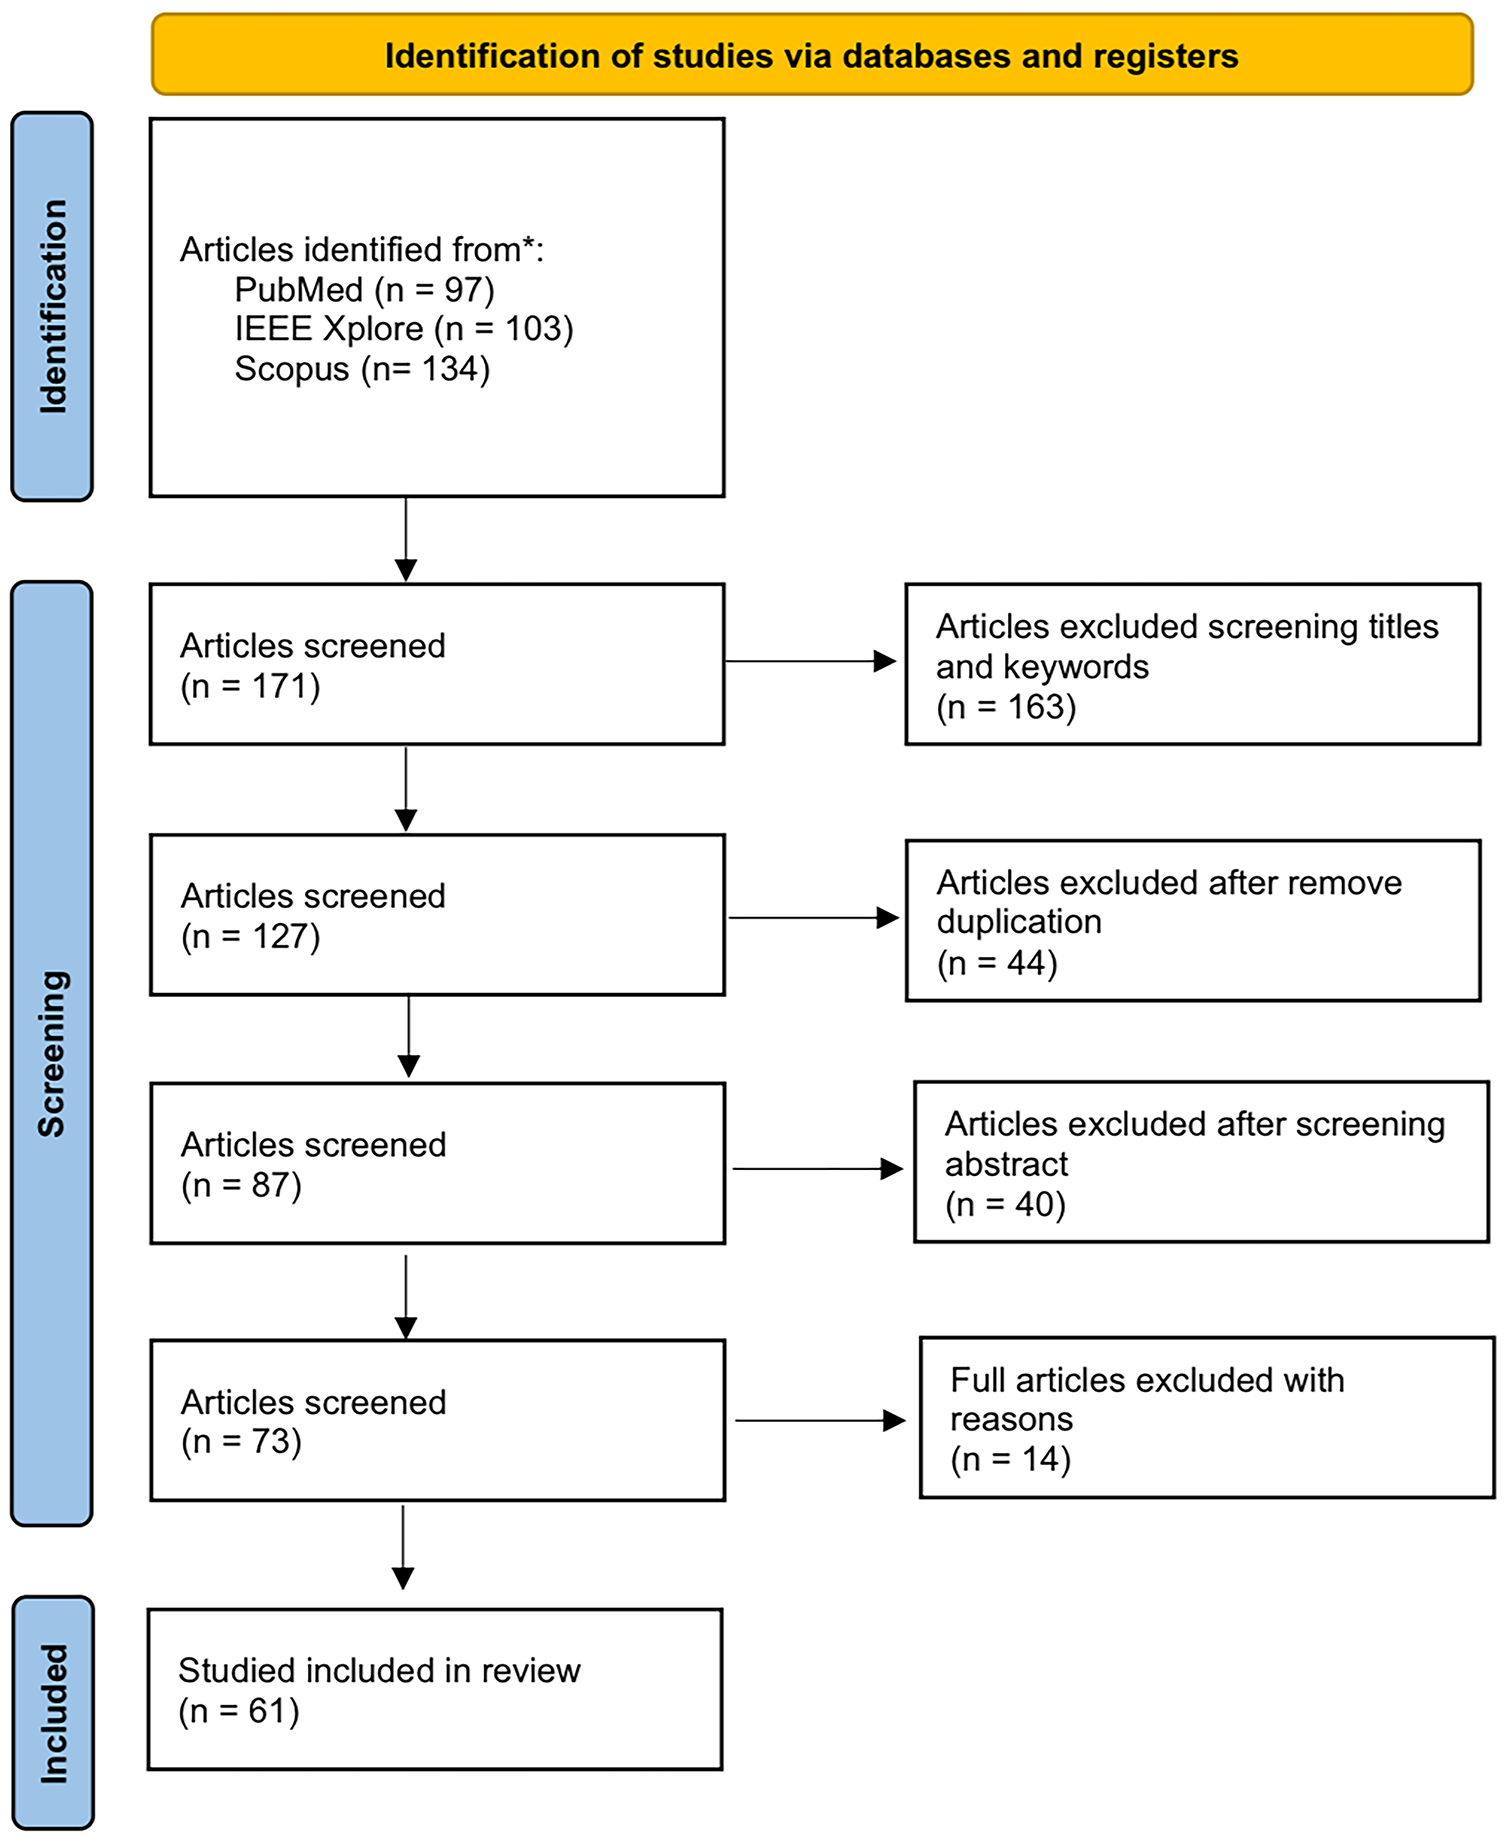
Figure 2: The PRISMA structure for the study selection process
A structured data extraction form was developed to ensure consistency and reproducibility and to enable consistent comparison across heterogeneous research settings. For each study, two reviewers independently extracted essential information, including:
Study characteristics (publication year, country).
Data modalities (mammography, MRI, histopathology, clinical or genomic data).
Fusion strategies (early, intermediate, late, or attention-based).
Machine learning/deep learning models (CNN-based frameworks, Transformer-based fusion, Hybrid CNN-Transformer, cross-attention, or MLP).
Explainable AI methods (SHAP, Grad-CAM, attention visualization).
Reported performance metrics (diagnostic accuracy, sensitivity, specificity, AUC, interpretability evaluation).
The extracted information was then utilized to construct comparative tables summarizing the following:
1. Reported performance of different fusion strategies and data modality combinations.
2. Conceptual and methodological comparison between single-modality XAI and multimodal XAI with fusion in terms of objectives, evaluation methods, strengths, limitations, and clinical relevance.
These tables were analyzed descriptively to identify performance trends across studies and highlight frequently adopted approaches. This approach allowed us to provide a transparent overview of how different multimodal fusion strategies and data combinations impact diagnostic performance in breast cancer applications. Rather than focusing on numerical performance alone, the resulting comparison of single and multimodal XAI emphasized how XAI contributes to model interpretability, clinical trust, and diagnostic decision support when integrated with multimodal fusion strategies. The results of these analyses are presented in the performance comparison section.
A structured risk of bias assessment was performed using the QUADAS-2 tool. Two independent reviewers (Reviewer A and Reviewer B) evaluated all 61 included studies across five domains:
1. Patient selection—representativeness and avoidance selection bias.
2. Index test—transparency of modeling, blinding, and reproducibility.
3. Reference standard—clarity and consistency of diagnostic ground truth.
4. Flow and timing—completeness of data and avoidance of verification bias.
Although QUADAS-2 traditionally consists of four domains, the AI analysis domain was introduced to capture risks unique to machine learning studies.
5. Artificial intelligence analysis—dataset diversity, external validation, and whether interpretability was systematically evaluated.
Ratings were assigned as low, moderate, high, or unclear risk. Discrepancies were resolved through consensus discussion. Inter-rater reliability was calculated using Cohen’s Kappa prior to consensus.
Risk of Bias Findings
The distribution of risk of bias ratings is listed in Fig. 3. Patient selection and reference standard were rated as low risk in most studies, indicating that selection datasets were generally appropriate, and reference standards were clearly defined. In contrast, greater variability was observed in the flow/timing and AI analysis. This variability often arose from reliance on retrospective datasets without prospective validation, limited use of external validation, and insufficient transparency in explainability methods. Such gaps reduce confidence in the reproducibility and generalizability of results. Most disagreements between reviewers were minor, often between low and moderate ratings. Overall, these results highlight the need for more consistent standards for evaluation in multimodal AI breast cancer research.
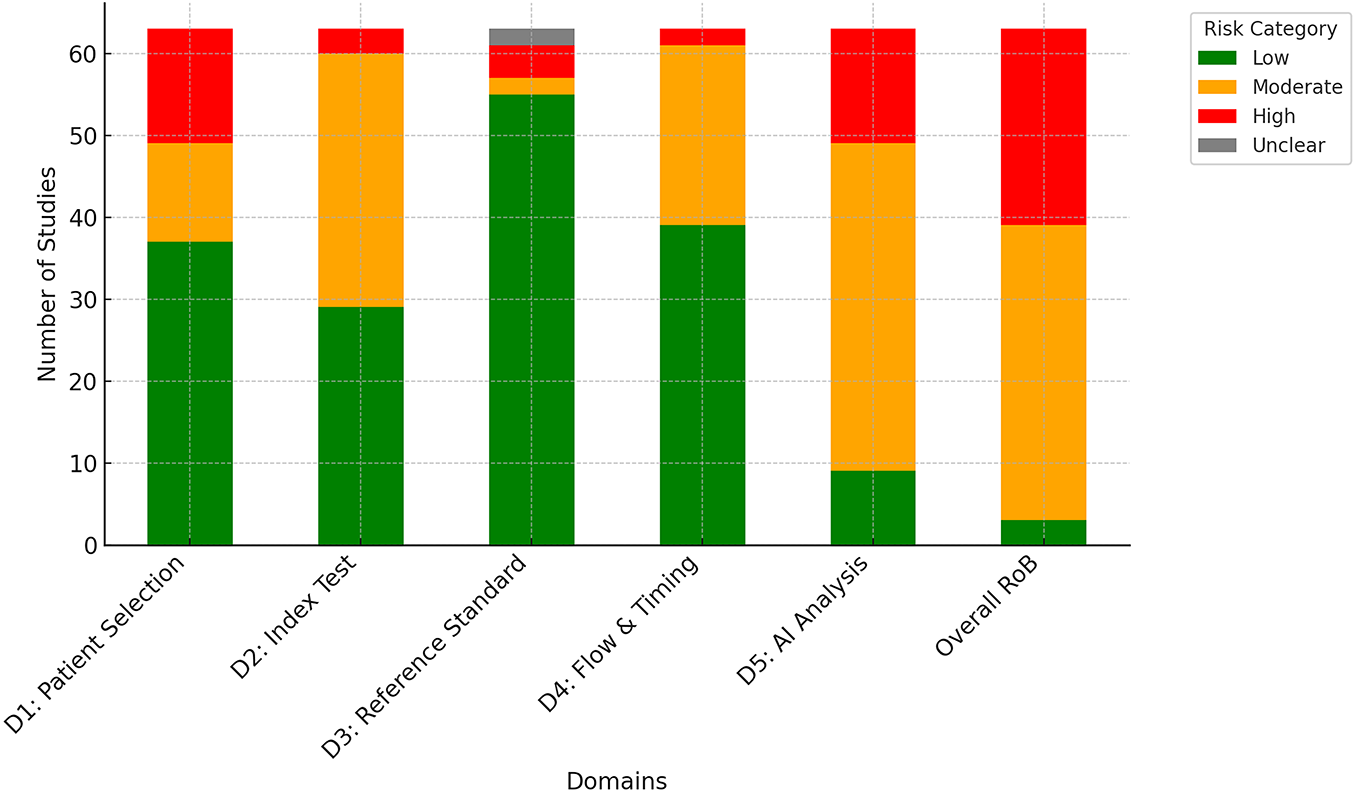
Figure 3: Distribution of risk of bias ratings
2.6 Data Synthesis and Analysis
A formal meta-analysis was not conducted due to the substantial heterogeneity across the included studies. The differences were evident in study design, patient cohorts, imaging and clinical modalities, model architecture, outcomes measures, and evaluation metrics. Because of this variability, pooling the results quantitatively will not yield meaningful conclusions and can risk misrepresentation. Instead, a structured narrative synthesis was employed, supported by comparative tables and descriptive statistics, which allowed us to capture and discuss the diversity of findings while maintaining methodological transparency.
Studies were categorized and analyzed by:
• Temporal trends (publications per year, 2021–2025).
• Geographic distribution (country of origin, highlighting concentration in high-resource regions).
• Publication venues (distribution across biomedical, engineering, and AI-focused outlets).
• Methodological features (multimodal data types, fusion strategies, model architectures, XAI techniques).
Descriptive statistics (frequency counts, heatmaps, trend plots) revealed fluctuating activity in the number of studies using data fusion techniques, peaking in 2024 with 11 publications—indicating interest in using these data sources in breast cancer research. This rise can relate to the improvement of modern fusion techniques such as attention, transformers, and graph fusion, which enabled more flexible multimodal integration compared to static early fusion. At the same time, there is a steady increase in studies focusing on explainable AI but using single-modality data, demonstrating the importance of transparency and trust in clinical AI applications. The combination of data fusion techniques and explainable AI is still limited, with few studies compared to previous trends. This highlights that the integration between XAI and fusion is still an emerging field of research and needs a comprehensive review to study how explainable techniques can be integrated into multimodal diagnostic systems. Fig. 4 presents the categorization of the selected articles, and Fig. 5 presents the publication trends from 2021 to 2025 across these categories.
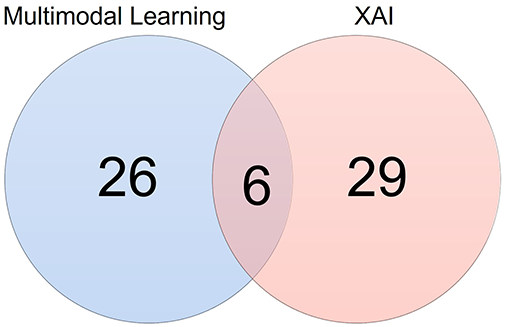
Figure 4: Categorization of reviewed articles in breast cancer diagnosis
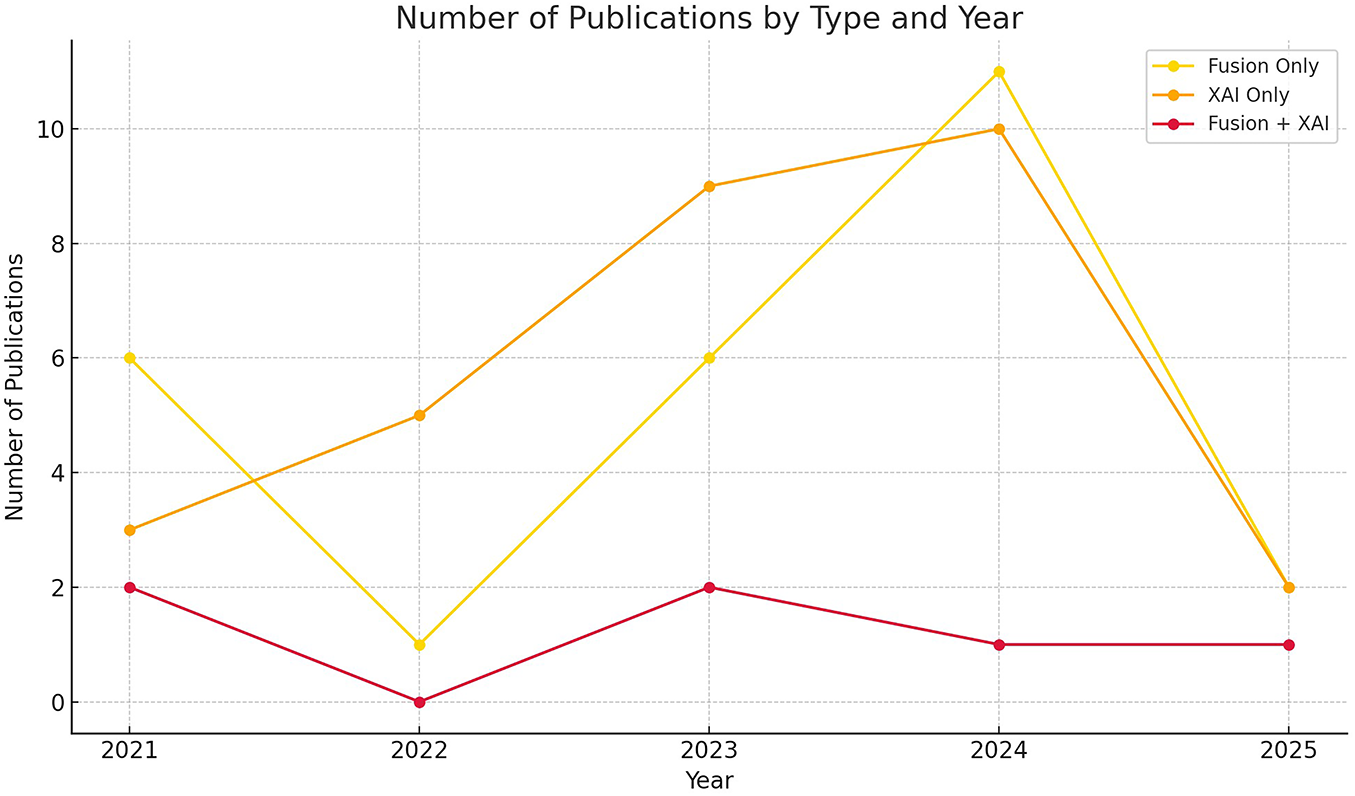
Figure 5: Publication trends in breast cancer AI research from Jan 2021 to April 2025, showing the number of studies in 1) multimodal fusion without XAI, 2) XAI with unimodal models, and 3) XAI with multimodal modal
Analyzing the publication sources indicates that the selected studies were published in reputable journals. 13 papers were published by MDPI, followed by Springer and Nature Publishing Group with 11 and 10 papers, respectively. Elsevier and IEEE Xplore published seven papers for each. The remaining publications outside these main venues had fewer than two papers. Therefore, this distribution that multidisciplinary studies are interested in explains explainable artificial intelligence and multimodal integration, as medical and technical fields were covered. Fig. 6 presents a pie chart showing the distribution of reviewed papers by the publisher.
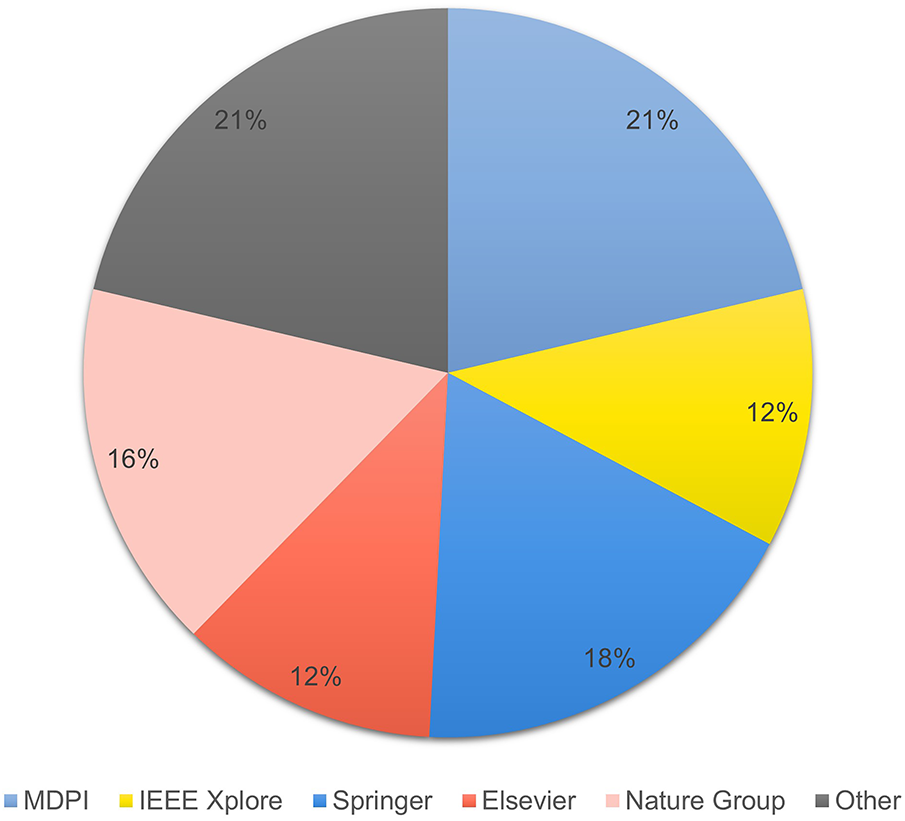
Figure 6: Distribution of reviewed papers by publisher
The heatmap in Fig. 7 shows the geographical distribution of the studies included in this review, which dealt with the diagnosis of breast cancer using multimodal data and XAI techniques. India ranked first in terms of the number of studies (11 studies), followed by China (8) and the United States of America (7). Moderate contributions were also recorded from Saudi Arabia, Bangladesh, The Netherlands, and Italy, while the contributions of countries such as Turkey, Norway, and Switzerland were limited to only one study. This distribution indicates the concentration of research efforts in certain regions, especially Asia and North America, which reflect their strong investment in AI healthcare infrastructure, with research gaps in low-resource countries, which opens the way for expanded international cooperation in this area.
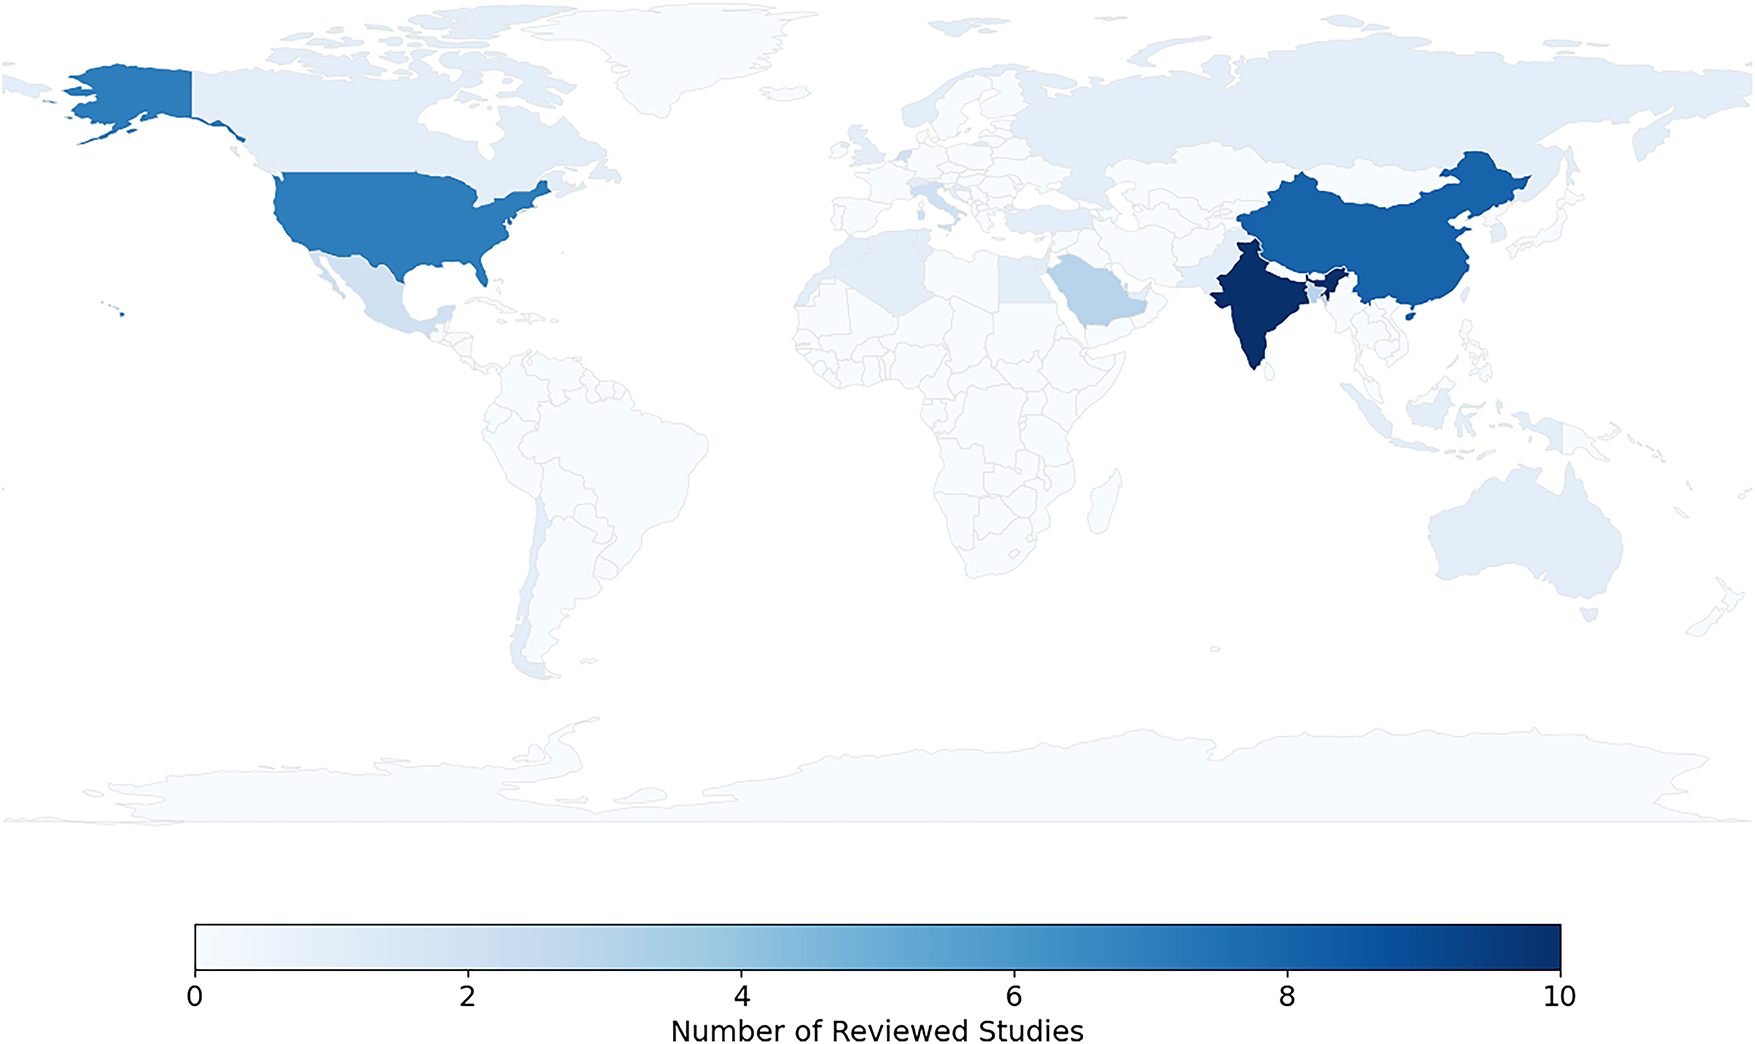
Figure 7: Geographic distribution of reviewed studies
Beyond descriptive statistics, a thematic synthesis identified four higher-level trends:
1. Fusion approaches—progressing toward adaptive, explainability-aware strategies. Transition from early fusion toward intermediate fusion, particularly attention-based strategies.
2. Model architectures—movement from traditional ML toward hybrid DL frameworks, including CNNs, transformers, and GNNs.
3. XAI practices—SHAP and Grad-CAM dominate, though quantitative evaluation remains rare.
4. Clinical integration—limited attention to deployment feasibility, robustness to missing modalities, and clinician trust.
Breast cancer is one of the most common types of cancer among women, representing a significant health and economic burden on healthcare systems. It is often not detected early, which increases its severity and reduces the chances of treatment. Early detection plays a crucial role in increasing survival rates. Breast cancer is diagnosed using traditional methods such as clinical examination and Mammography. Although these methods are effective, they rely heavily on human experience, which can lead to varying diagnostic errors. Artificial intelligence has brought about a qualitative shift in the field of diagnosis, improving accuracy and speed of detection and reducing errors. Artificial intelligence supports clinical decision-making, unifies analysis methods, and helps build greater confidence in diagnostic results. This development paves the way for the use of deep learning models and multi-modal fusion techniques, which will be reviewed in subsequent sections.
This section provides a brief technical framework for understanding breast cancer diagnosis using multimodal learning and explanation (XAI) methods. First, the nature and characteristics of common data in this field (mammograms, structured clinical data, report texts, and molecular/genomic data) are defined. The model families utilized to extract representations (CNN, Transformer, MLP, and for text, LSTM/Transformer) are then reviewed. A systematic overview of fusion strategies (early, intermediate, and late) and explanation mechanisms is then provided. Finally, common metrics for evaluating performance and explanation quality are outlined, setting the stage for the subsequent comparative analysis in the following sections.
Multimodal data are datasets containing diverse information from various sources. Each type of data provides a different perspective on the information it captures about a particular entity. Examples of data include visual data, textual data, tabular or structured data, graphs, audio, or gestural data. Data in oncology are classified into three categories: clinical, molecular, and imaging [24].
• Molecular data
Molecular data contains data on genetic changes in cancer cells. These include genomics, proteomics, pathology, and radio-genomics. This type of data has a significant role in biomedicine, providing important information for diagnosing various types of cancer at early stages [25].
• Imaging data
This is one of the most important types of data, significant in diagnosing diseases, especially breast cancer. This type includes radiological imaging such as X-rays, mammograms, and magnetic resonance imaging (MRI), which help determine the shape and size of a tumor. Digital histopathology slides are imaging data where tissue samples are taken during surgery or biopsy, and help identify changes in cancer cells and cancer subtypes [24].
• Clinical data
These data are often readily available, including medical history, laboratory test results, medical examinations, treatments, and other information that facilitates understanding and diagnosis of diseases [25]. The data are stored in electronic records (EHRs) in a hospital database [24].
Clinical data is the second most used data type in breast cancer data fusion [26–28]. Each modality type encodes different, but ultimately complementary, information. For example, in disease diagnosis, a tumor can be detected through a mammogram, while patient records can contain vital contextual details such as family history or hormone receptor status. Combining these types of data can get comprehensive predictions [29]. Artificial intelligence models must be developed that require various types of data to accurately diagnose diseases. Fig. 8 presents different types of data, both image and non-image.
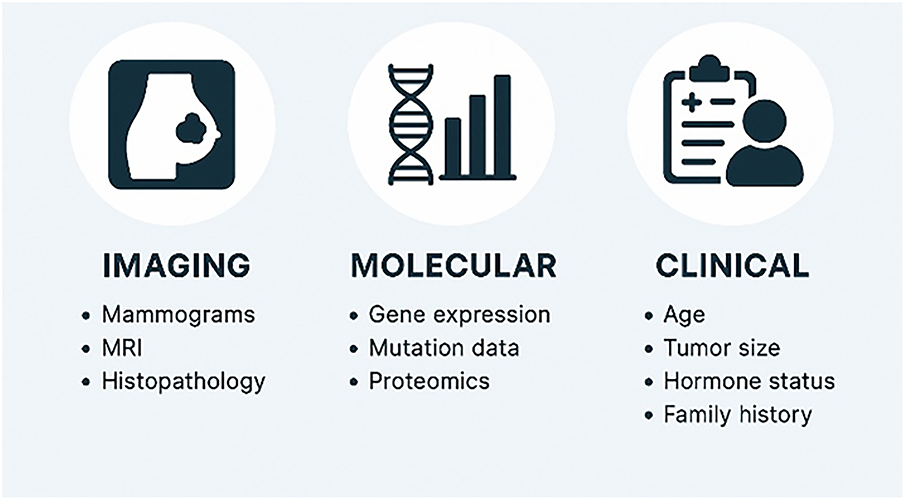
Figure 8: Breast cancer data types
Breast cancer datasets vary widely in the quality of the data they provide, the number of samples available, and their accompanying technical specifications. Some datasets are limited to radiographic images only, while others combine imaging with clinical or molecular information, making them more suitable for multimodal studies. These datasets also vary in their accuracy, organization, and level of documentation. This diversity helps researchers choose the dataset that best suits their research objectives, whether in classification, tumor detection, or predictive molecular profiling. These datasets are typically used in training deep learning models on mammography or histopathology images to detect tumor patterns, analyzing structured clinical records to capture patient risk factors. They also serve as standard benchmarks to evaluate model performance using metrics such as accuracy, AUC, sensitivity, and specificity.
This section presents an overview of recent publicly accessible datasets focused on breast cancer research. These datasets are invaluable resources for researchers and healthcare professionals, providing insights and data critical for understanding breast cancer trends, developing new treatments, and improving patient care. Searches in data repositories such as Kaggle, Cancer Imaging Archive, TCIA, and UCI Machine Learning Repository were conducted using keywords such as “breast cancer dataset,” “multimodal,” “open access,” and “imaging and clinical.” Accessing these datasets supports advancements in the field of breast cancer studies and aids in the ongoing battle against this disease.
• TCGA-BRCA (The Cancer Genome Atlas-Breast Invasive Carcinoma):
A large dataset containing diverse data for thousands of patients, including genomic (RNA-seq, DNA methylation, mutation data), histopathology whole slide images, and clinical metadata. Ideal for interpretability research [30].
• METABRIC (Molecular Taxonomy of Breast Cancer International Consortium):
This dataset [31] provides various data for many patients; it includes gene expression, copy number variations (CNVs), and clinical outcomes. The METABRIC dataset is ideal for prognosis modeling because of its longitudinal survival data.
• CBIS-DDSM (Curated Breast Imaging Subset of the digital Database for Screening Mammography):
The CBIS-DDSM [32] established in 2017, is a refined and standardized subset of the DDSM dataset. This dataset includes 1644 cases (each with a spatial resolution of 16 bits per pixel), providing mammogram images with annotated lesion masks, BI-RADS descriptors, and pathology labels (benign and malignant). It is one of the public datasets that provides mammogram images with lesions annotated.
• Wisconsin Breast Cancer Dataset (WBCD):
WBCD is a well-known tabular dataset containing 30 computed features extracted from digitized images of fine-needle aspiration biopsies and based on cellular characteristics (texture, perimeter). It has 569 samples, each classified as benign or malignant [33].
• Mammogram Mastery:
This dataset was published on Mendeley Data in v1 in April 2024. It contains 745 original mammograms of breast cancer patients and healthy controls. Nine thousand six hundred eighty-five processed images were augmented using cropping and rotation techniques to enhance visual diversity. The images were collected from hospitals and clinics in Sulaymaniyah, Iraq, adding distinct demographic and regional dimensions. This dataset is an important resource in medical curricula, providing a robust database for training and testing deep learning models for breast cancer diagnosis [34].
• The Chinese Mammography Database (CMMD):
The CMMD dataset serves as a valuable resource for supporting multimodal breast cancer research and evaluating the performance of deep learning models in diagnostic tasks. It comprises 3728 high-resolution mammogram images collected from 1775 patients who underwent breast cancer screening. Each image is accompanied by essential clinical metadata, including patient age, lesion type, and molecular subtype annotations. As one of the few publicly available multidimensional datasets, CMMD significantly contributes to advancing breast cancer classification and interpretability studies [35].
Table 2 classifies breast cancer datasets in terms of the type of data they contain and the key research tasks that can be applied to each dataset.
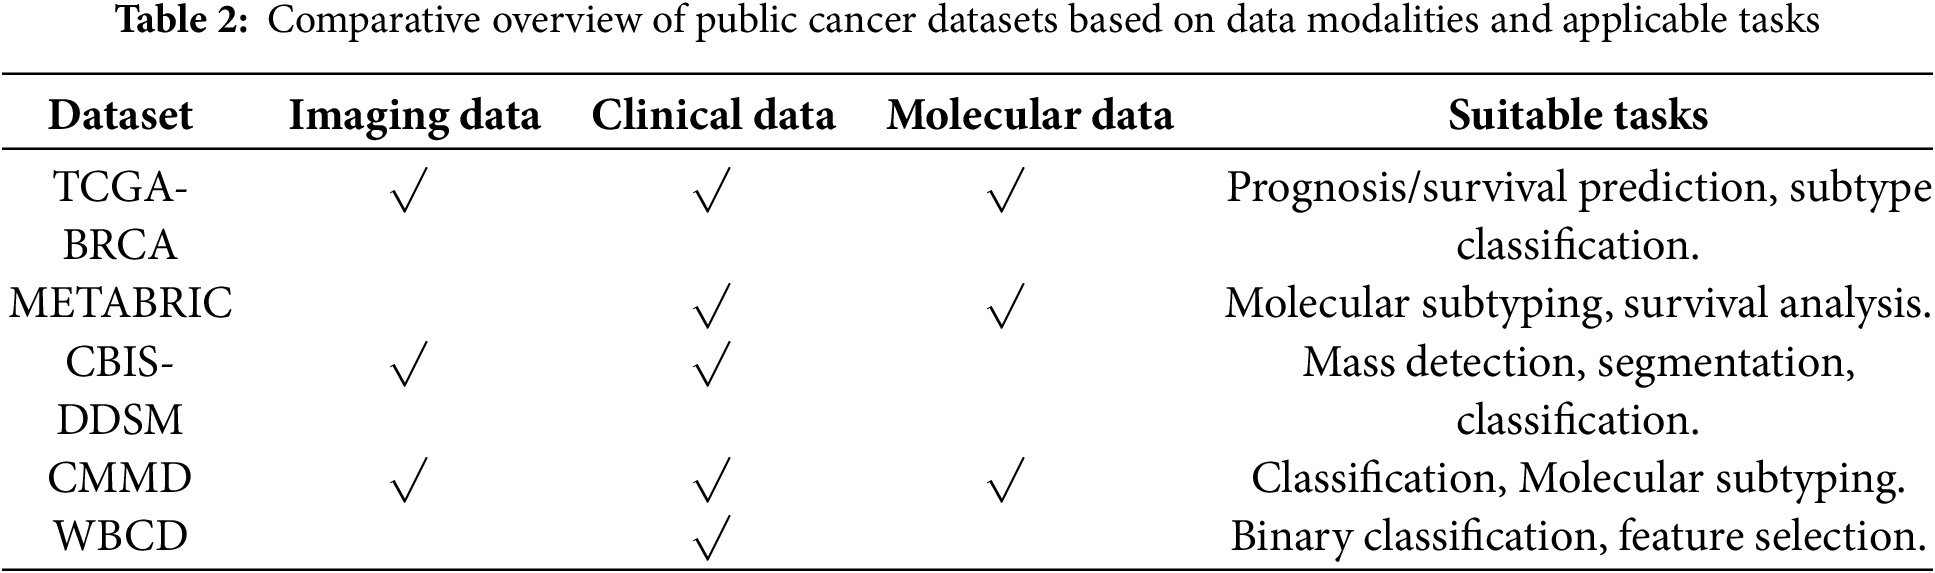
These datasets are widely used because of their open accessibility, enabling trials to be conducted without institutional restrictions. Some datasets provide multimodal information for the same patient, facilitating integration approaches that mimic clinical decision-making. They are generalizable, supporting large sample sizes. They provide a reliable basis for trials, as they are derived from real-world sources.
Deep learning and machine learning are branches of artificial intelligence that have gained significant importance in recent years [36]. These models have evolved significantly, making them essential tools for analyzing complex medical data. They are characterized by their ability to extract accurate patterns from a large amount of data. Deep learning techniques are effective with large datasets compared to traditional machine learning techniques, which are often used with small data sets [37]. These models are effective in multiple stages of the breast cancer diagnosis process, as they can detect lesions on mammograms, analyze clinical indicators, and combine multiple models to improve prediction accuracy. Deep learning techniques have the potential to extract complex representations from images [38], which in turn helps reduce the burden on human expertise. They can also build explanatory models and analyze relationships between clinical variables. Currently, these models have become the basis for developing reliable diagnostic systems for breast cancer [39].
Data fusion has been associated with deep learning for several years in many fields, and deep learning-based multimodal data fusion approaches have achieved significant success in various applications [29]. This section outlines the most widely used deep learning and machine learning techniques with multi-modal data in the field of breast cancer diagnosis.
• Convolutional neural network—Image modality
CNN is one of the most popular and used DL networks, which has proven highly effective in medical image analysis. CNNs are designed to automatically detect and learn features from raw image data, making CNNs ideal for tasks such as breast cancer diagnosis from mammograms. Fig. 9 presents the architecture of the CNN. CNNs have multiple layers of convolutions with ReLU activation, followed by pooling, and fully connected layers. CNN uses filters, where a set of linear activations is generated and is followed by non-linear functions to reduce the complexity of input data [40]. A convolutional layer scans the image with small filters to detect patterns such as edges and textures. Then, the pooling layer simplifies the data by down-sampling its size, transferring the activation map into a smaller matrix. The pooling layer solves the overfitting problem by reducing complexity [41].
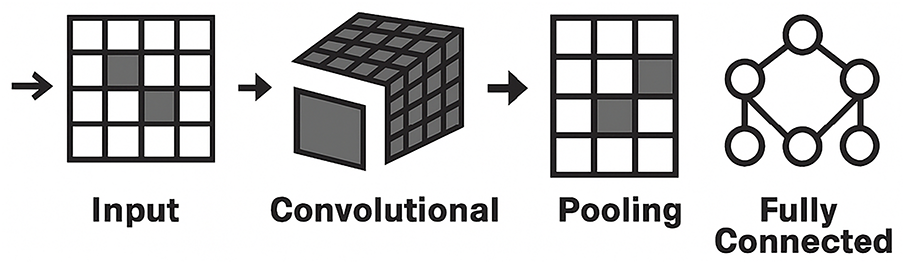
Figure 9: CNN architecture
Finally, the fully connected layer takes all the extracted features to make a prediction. Alexnet, VGGNet, and ResNet are examples of CNN variants that improve accuracy and efficiency by modifying the standard CNN architecture [42].
CNNs are widely utilized to extract features from mammogram images [43], producing deep representations that capture subtle spatial patterns such as masses and calcifications, which are then combined with clinical or molecular features, improving classification accuracy.
• Multi-layer perception—Clinical modality
Multilayer perception (MLP) is used for tabular data or any task based on numerical or categorical data [42]. MLP is a fundamental building block in deep learning because of its flexibility in architecture, and is often applied to medical record classification and fraud detection applications [42]. The model’s ability to learn data patterns is affected by the number of neurons and the number of network layers. MLP comprises an input layer that has several nodes. This layer receives input features; each neuron represents one feature. Features will pass to the next layer; one or more hidden fully connected layers lie between the input and output layers. The hidden layer receives input from the previous layer and applies an activation function to allow models to learn patterns. The output layer produces the output of the network using the activation function.
MLP is characterized by its ability to capture non-linear relationships between clinical variables. In breast cancer diagnosis, MLP is often utilized to extract feature representations from tabular data such as age, medical history, and vital signs. In multimodal studies, MLP outputs are combined with image representations to form a common vector. MLP can also be used as a classifier in a multimodal breast cancer classification system [44].
• Autoencoders—Fusion enhancement
An autoencoder learns to reconstruct images, text, and other unlabeled data from compressed versions. Three layers make up an autoencoder [45]:
The encoder compresses the input image, encodes it into a compressed representation, and sends it to the decoder layer. The decoder reconstructs the original inputs by decoding the encoded image to its original dimension before encoding. When combining different types of data, the autoencoder reduces the dimensionality of the features of each pattern before or after fusion, making the fusion process more efficient. It can also be used as a preprocessor layer to preserve the underlying information and unify the size of the representations.
• Vision Transformer (ViT)—Image modality
It is employed as an alternative to CNN, especially when the image is of high resolution. The ViT model relies on dividing the image into non-overlapping patches, which are then converted into representative vectors. Position encoding is added to each patch, and these vectors are then passed through an encoding layer that includes self-attention, layer normalization, and MLP mechanisms.
In the field of multi-modality fusion, ViT can be used as an image feature extractor, producing deep representations that can be combined with other types of data, enhancing the model’s predictive accuracy and improving performance in diagnostic tasks [46].
• RNN/Long Short-Term Memory (LSTM)
LSTM networks are commonly utilized to process sequential or temporal data, such as medical records or vital signs. These networks can remember important information and discard unnecessary information across time steps, making them highly effective at capturing complex temporal patterns. LSTM extracts a temporal representation from sequential medical data and combines it with image features, enhancing the model’s predictive ability in the field of multi-modal fusion [47].
3.4 Fusion Strategies and Techniques
Multimodal data fusion produces a unified, information-rich representation by combining information from multiple modalities or several sources for use in various tasks, such as classification and interpretation. Each type of modality possesses a variety of information, fusing those modalities by combining the strengths of each type and compensating for its weaknesses [29]. Individual modality, such as images, provides specific and non-comprehensive information, and can therefore affect the accuracy of the decision [48]. Different data modalities can focus on the same object in different ways and some tasks require a comprehensive understanding that requires multiple data sources. Information from varied sources can be complementary. Data fusion helps discover relationships and properties that cannot be detected using a single modality; in addition, it improves accuracy and interpretability [29]. Fusion is a modern pillar that plays an important role in the medical field, especially in breast cancer diagnosis. Integrating radiological, clinical, and laboratory information improves classification and prediction accuracy, increases the reliability of results, and enhances interpretability. Some of the complex relationships between multiple factors cannot be clear when analyzing each pattern separately, but with multimodal fusion, these relationships and interactions can be understood, and then clinical decisions can be made based on them. In addition, multimodal fusion contributes to improving the ability to generalize across different populations, which enhances the quality of healthcare.
• Early fusion: Raw or pre-processed features are directly concatenated [49]. Mathematically, this can be expressed as Eq. (1):
where
This type of fusion is fast, simple in implementation, and useful when all modalities are correlated [25] On the other hand, it has a high sensitivity to the different nature of the data, and it is difficult for it to deal with heterogeneous data.
In the field of breast cancer detection, early fusion can be used when all patterns are close and can be unified, such as merging mammogram images with clinical features into a single representation, which helps reveal early relationships between data types.
• Intermediate fusion: This approach fuses features for each modality after independent processing [25]. Each modality m is first transformed by an encoder gm( ) Eq. (2):
Intermediate fusion is characterized by its ability to maintain the representation of each data modality. This approach allows for the processing and training of each type of data before fusion, achieving a balance between integration and flexibility, and is suitable for diverse medical data. Although effective, it requires careful alignment between the extracted representations and consumes greater computational resources. The most used techniques in this strategy are concatenation, attention-based fusion, cross-modal transformer, and tensor fusion. This strategy is commonly used in breast cancer diagnosis [50], because it allows each type of data to be best represented before fusion, which in turn improves prediction performance.
• Late fusion: Each modality yields its own prediction
where
The strategy is easier to implement than the previous types as it allows combining different models for each pattern, but cannot capture interaction between modalities [51], the final decision depends on the collection of outputs only [52]. Average pooling, majority voting, and stacking classifiers are the common techniques used in the late fusion strategy. Fig. 10 illustrates the difference between these strategies in terms of the location of the fusion in the data processing pipeline. In early fusion, raw or preprocessed data is fused at the input stage prior to learning, while in intermediate fusion, features are extracted from each pattern and then fused at a subsequent stage after training. In late fusion, the outputs of the sub-models are fused at the final stage before the final decision is made.
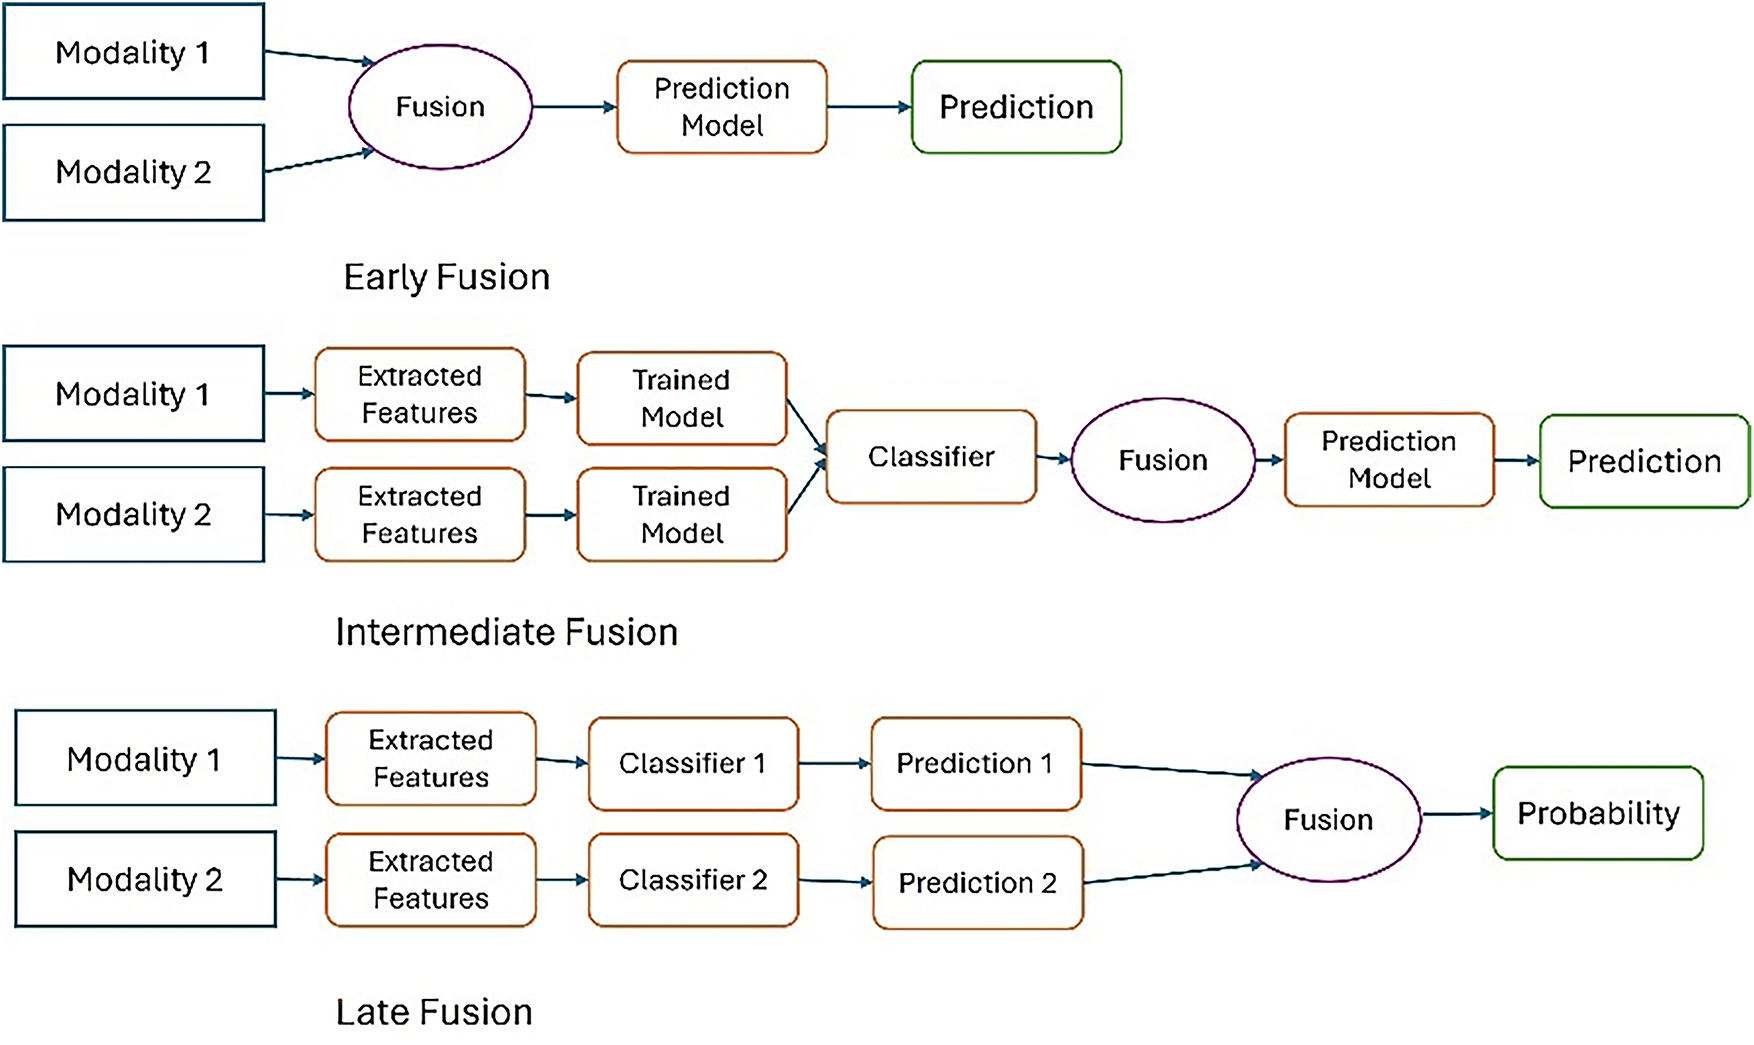
Figure 10: Fusion strategies in multimodal learning
This taxonomy is widely used in medical applications, especially in the field of breast cancer diagnosis, where the selection of the appropriate fusion strategy is based on the type of data and its degree of variance, which in turn plays a major role in enhancing the accuracy of medical models.
3.4.2 Advanced Fusion Techniques
Fusion techniques define how different modalities are integrated at a representational level. Multimodal data fusion techniques are becoming increasingly significant in breast cancer detection because of their capability to enhance diagnostic accuracy and provide comprehensive insights. These techniques integrate various types of data and analytical methods, providing a more robust framework for detecting and characterizing breast cancer. These techniques rely on advanced learning mechanisms such as attention and generative models, which allow focusing on important information and achieving the highest performance.
• Operation-based fusion
Operation-based fusion methods cannot capture the complex interaction between modalities, but they are flexible and simple [53]. These methods combine feature vectors by using simple mathematical operations such as the following:
1. Concatenation, which combines features from multiple modalities into a single representation Eq. (4), it is a simple technique [54].
This mechanism is suitable as a starting point for multimodal systems in the field of breast cancer because it does not require a complex design.
2. Element-wise addition, which requires the same dimension to add feature vector element by element, as shown in Eq. (5).
This method is easy and fast to compute; it does not add any learning weight but rather integrates raw data. It is useful if the features are equally important. Despite the simplicity of this technique, it suffers from some limitations. It assumes that all vectors representing patterns fall into the same representation space and does not consider the relative importance of each pattern, treating all values equally. These challenges make it unsuitable for dealing with complex multimodal breast cancer data.
3. Element-wise multiplication multiplies feature vectors element by element, as expressed in Eq. (6), and focuses on interaction.
This technique is used when patterns contain complementary information. For example, high-density areas on a mammogram can interact with specific clinical factors, such as age, to enhance prediction accuracy. In contrast, this technique is not useful when some values are small or zero, and it is not suitable for heterogeneous data.
• Attention-based fusion
Attention-based is a mechanism that focuses on important regions and hides less important features in the input data [55]. The mechanism assigns learnable weights to specific inputs based on their relevance to the task and prioritizes them, as shown in Eq. (7).
where ω is a trainable parameter vector, and
In this technique, features from various modalities are selectively combined. This approach learns the weights of features and combines them based on their importance to the prediction task, unlike concatenation, which processes all features equally. In attention-based fusion, common methods are utilized to integrate features; for example, intra-modality self-attention weighs the importance of features of the fused representation to better understand the relationship between features. Another method of attention-based fusion is inter-modality cross-attention, which relies on the features of one modality to direct attention in the other. Attention-based fusion method. In the field of breast cancer, this technology is one of the most advanced and effective fusion techniques. For example, radiographic images contain fine visual details that complement clinical information. When attention mechanisms are used, they allow the model to focus on the areas most closely associated with disease in the images, while considering supporting clinical factors, thus improving integration and increasing classification accuracy.
• Tensor-based fusion
Rather than directly merging two feature vectors linearly, tensor fusion forms an outer product between them, generating a multi-dimensional feature space where every possible combination of features across modalities is explicitly modeled [53]. Eq. (8) expressed this fusion method.
where:
•
• r is the index of the rank component.
• R is the rank of the vector decomposition.
• T denotes the transpose operator (the inner product between the weight vector and the modality feature vector) [57].
This process allows the network to capture richer and more complex relationships between modalities compared to simple fusion methods (such as concatenation).
This type of technique is usually used with CNN or Transformer networks. It is very suitable when the data is from multiple sources, as in the field of breast cancer (mammogram images, genomic data, and clinical data), as it is one of the techniques capable of dealing with multidimensional data [58].
• Graph-based fusion
In this approach, every characteristic is represented as a graph node. Nodes relate to edges based on feature similarity, and each node’s weights are updated based on its significance using a model similar to a graph neural network [53]. It is very useful in breast cancer to represent the relationships between clinical factors and radiographic patterns in a flexible way, and opens the way for in-depth explanations at the relationship level [59].
Fusion techniques are the foundation for building highly accurate and reliable multi-model diagnostic systems. Some fusion methods provide simple and easy-to-implement solutions, such as concatenation, while advanced techniques, such as attention and graph, are better able to represent complex interactions between different data sets. In the context of breast cancer, these techniques contribute to improving the quality of predictions and supporting clinical decisions due to their ability to enhance the integration of different data sources. Choosing the appropriate fusion technique is a critical factor in improving performance in medical applications.
The role of fusion techniques goes beyond improving model performance to enhancing explainability, as the fusion method largely determines the type and form of possible explanations. For example, attention techniques allow for highlighting the contribution of each type of data to the final prediction, which helps to understand decisions and increase confidence.
3.5 Explainable Artificial Intelligence
Deep learning achieved remarkable success between 2012 and 2015 in various fields. However, these models are characterized by ambiguity, which raises concerns in sensitive fields such as healthcare and defense systems. In 2015, the Defense Advanced Research Projects Agency (DARPA) emphasized the importance of having understandable and reliable AI systems. Therefore, in 2017, the agency launched the XAI program [60]. XAI is a branch of artificial intelligence designed to make machine learning models and their decisions understandable to humans [61]. The goal of this program is to assist end users, such as operators and physicians, by bridging the gap between high accuracy and understandable interpretation.
Although deep learning models have demonstrated impressive performance in tasks such as breast cancer classification, one major drawback is their lack of interpretability. Users must perceive the reasoning behind a model’s decision to trust it in critical settings. XAI techniques are designed to address this issue by providing insights into how a model makes predictions. Fig. 11 illustrates the general framework of XAI. XAI techniques enable end users to understand these systems, which in turn enhances trust and supports decision-making. The XAI pipeline consists of three core components: input data, predictive model, and explanation engine.
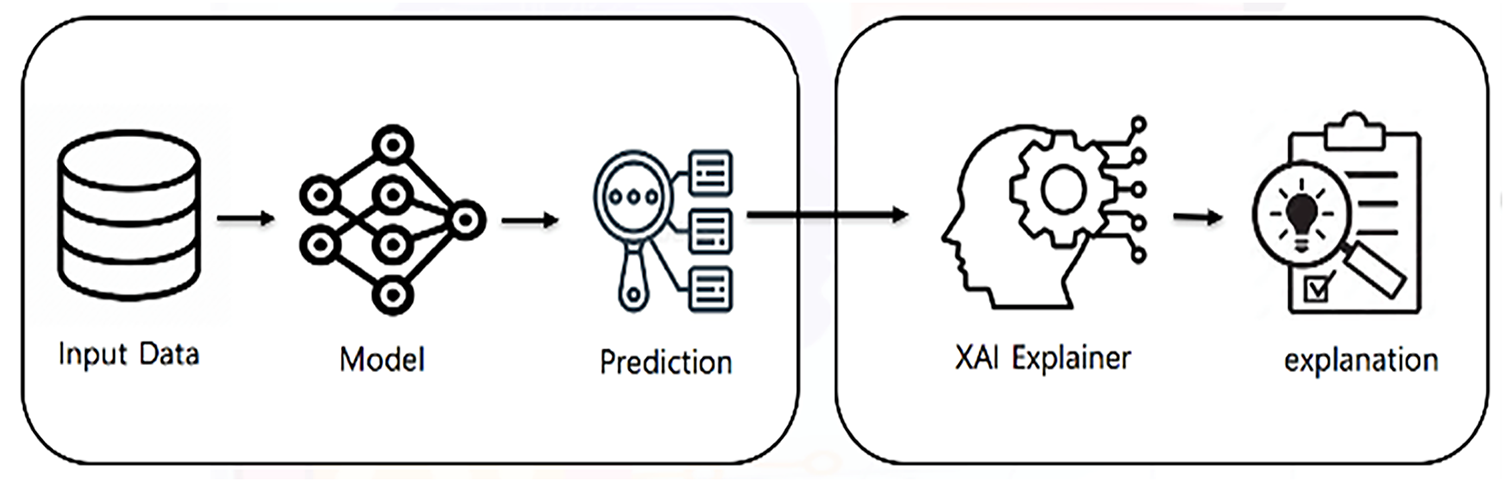
Figure 11: General framework of XAI
Explanations are essentially additional metadata provided by the AI model, illuminating a particular AI decision or the overall internal workings of the AI model [62]. In the field of XAI, the primary aim is to clarify the inner processes of the model. This elucidation entails providing explanations about the methods, procedures, and results of these processes in a way that is comprehensible to users. XAI is often referred to as the “White box” approach because of its emphasis on clarifying the inner workings of the model [63]. In the medical field, particularly in breast cancer diagnosis, XAI plays a crucial role in establishing trust between AI systems and healthcare practitioners by ensuring that AI algorithms are trustworthy and their decisions are reliable [62]. It also enhanced transparency by making the inner workings of AI models more transparent and understandable to radiologists. XAI can address issues related to bias and fairness within AI algorithms to prevent discriminatory outcomes, which is especially critical in breast cancer diagnosis. Achieving high predictive accuracy is not enough for medical diagnosis; it must understand “why” and “how” the decision was made [64]. XAI explanation allows healthcare practitioners to assess the reliability of models used in diagnosis [65]. As for patients, explaining the model’s decisions enhances confidence and increases their satisfaction with the treatment plan.
In sensitive medical applications such as breast cancer diagnosis, clinicians need to understand why a model makes a particular decision to assess its clinical reliability. Interpretation techniques support clinical decision-making and enhance transparency. Explanation methods in AI research are generally divided based on the scope of explanation, stages of application, and model applicability [66]. Each dimension focuses on various ways explanations are produced and how well they understand the behavior of the model.
Scope-based methods focus on the extent of the explanation, based either on individual predictions or the entire model, and are divided into local and global explanation methods. Global methods provide a complete overview of the model’s behavior and focus on general rules that are learned by a model. These methods explain how the most important features affect the model in general. However, local methods work at the individual level, explaining how the model arrived at a specific prediction [67].
Stage-based explanation methods show when the explanation occurs in relation to the model’s training process. This type of explanation is divided into ante-hoc, where the model is inherently interpretable, and post-hoc, where explanations are generated after the model makes a prediction [66].
Model-applicability includes model-agnostic and model-specific methods. Model-agnostic methods are designed to be usable with any ML model and provide explanations that are not related to the internal working mechanism of the model, whereas model-specific methods rely on understanding the internal structure of the model and are specific to a particular type of model [68]. Fig. 12 presents a visual taxonomy summarizing this classification.
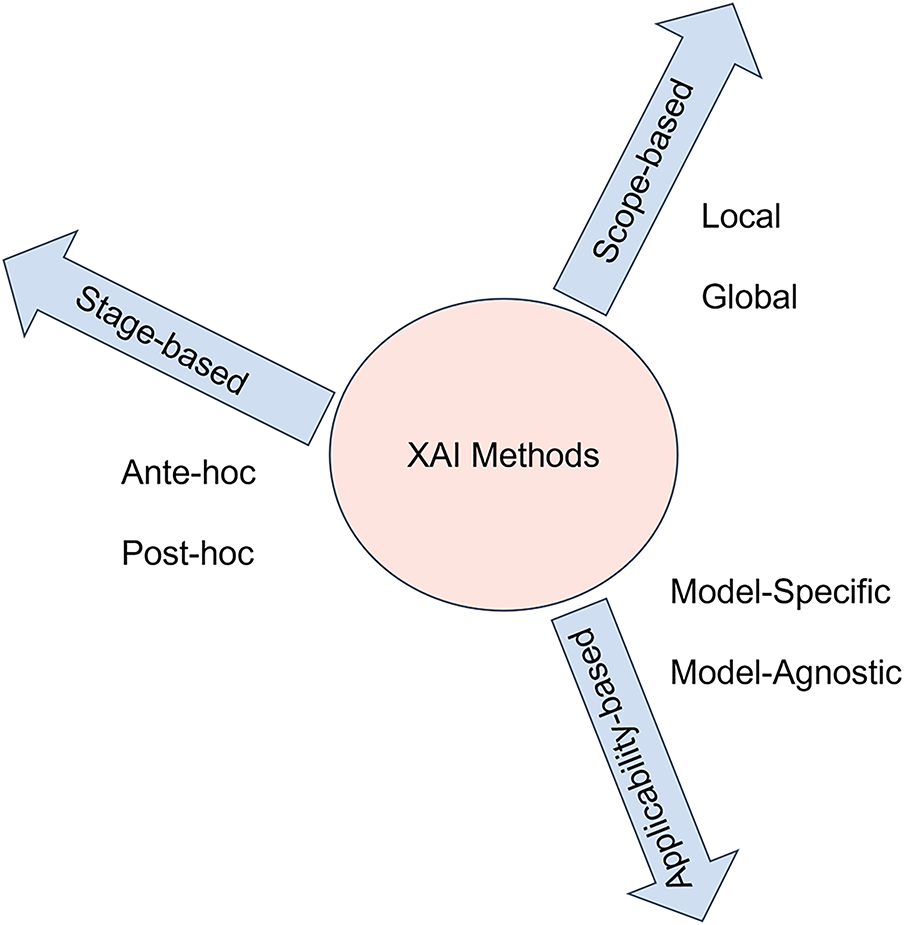
Figure 12: Taxonomical classification of explainable AI methods
3.5.3 Popular XAI Techniques in Breast Cancer Diagnosis
The most common XAI methods in breast cancer research are SHAP, LIME, and GRAD-CAM [69].
SHAP (Shapley Additive Explanations): SHAP is a post-hoc, model-agnostic, and local/global technique used in several domains, especially in the medical field. SHAP provides explanations for the impact of each feature on the final prediction of the model, based on the concept of cooperative game theory [68].
SHAP relies on a concept known as the Shapley value [70]. Using Shapely values ensures that the contribution of each feature to the prediction or decision of a particular instance is accounted for fairly [71]. In the medical field, SHAP is utilized to analyze the contributions of medical features to specific disease outcomes or predictions. The technique allows for both local and global explanations, enabling clinicians and researchers to examine the impact of individual features as well as the overall influence of feature combinations on disease outcomes. Fig. 13 shows a SHAP explanation of breast cancer classification.
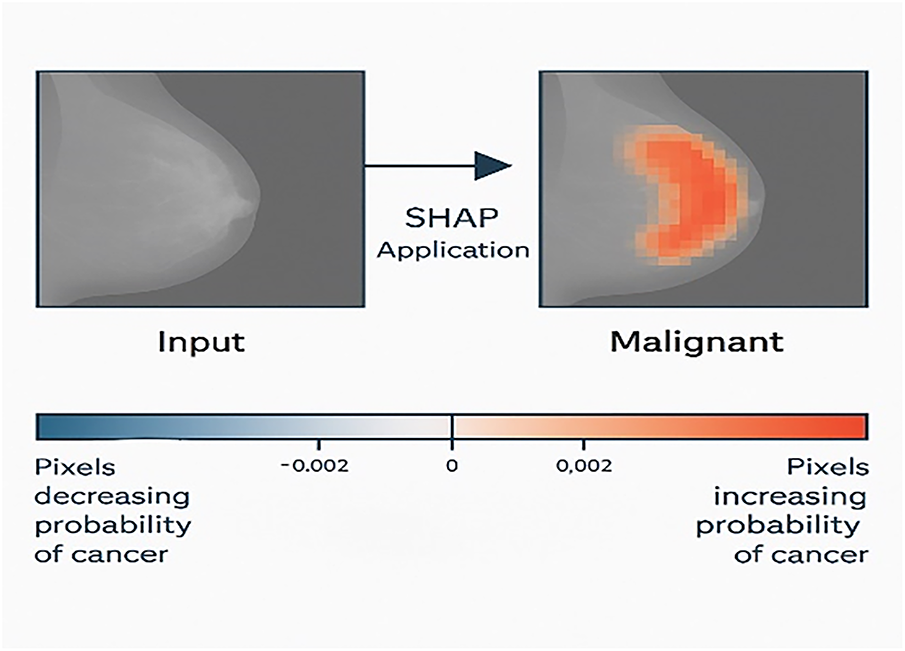
Figure 13: SHAP explanation of breast cancer classification
LIME (Local Interpretable Model-Agnostic Explanations) is another popular technique in healthcare. LIME, developed by Ribeiro and colleagues in 2016 [72], creates a simpler, easier-to-understand model to explain individual predictions. Its primary goal is to provide a local and interpretable model to explain individual predictions made by black-box machine learning models [73]. Unlike SHAP, LIME is applied to a single instance rather than the entire dataset [70]. LIME is widely used in medical images to produce visual explanations by identifying regions that influence a decision. LIME’s strength lies in its ability to interpret the prediction of any classifier.
Grad-CAM (Gradient-Weighted Class Activation Mapping): This advanced variant of Class Activation Mapping (CAM) has gained popularity in deep learning models, particularly CNNs [70].Grad-CAM is a model-specific technique that highlights the region that influences the specific prediction in the input image. It generates a visual heat map for the CNN-based network by using a gradient of the target class in relation to the feature maps of the convolutional layer [74]. Grad-CAM is widely used in mammography and histopathology images by generating heat maps, Grad-CAM can highlight the specific regions that contribute most to the model’s decision, such as calcification or suspicious masses. This visual interpretation allows clinicians to verify that the model is focusing on clinically relevant areas.
LRP (Layer-Wise Relevance Propagation): LRP enables the interpretation of deep neural network decisions by tracking the contribution of each feature to the final model. It starts with the final prediction of the model and tracks the values back layer by layer until the importance is distributed to each input. LRP then produces a map showing the contribution of each input to the decision [75].
Due to the variety of data types used in breast cancer diagnosis, it has become necessary to align XAI techniques with the nature of each type of data. For example, visual explanation techniques such as Grad-CAM are very suitable for medical imaging data, providing heatmaps that highlight the resolution areas within the images. As for structured clinical data, methods based on the analysis of feature importance, such as SHAP and LIME, are more effective in explaining the effect of each variable on prediction. In contrast, molecular data, such as gene expression and mutations, require more complex gradation-based techniques such as DeepLIFT.
3.5.4 XAI and Multimodal Fusion
In the field of breast cancer, data from various sources are combined to provide a comprehensive view of the disease. However, the complexity of these combination models makes decision-making unclear. Explanation techniques address this problem by clarifying how each pattern contributes to the final decision. This, in turn, reassures physicians that the model focuses on medically relevant information.
XAI method can apply to the output of the fusion model to obtain an explanation of the prediction, which is called post-fusion explanation, or the XAI method is applied to each data modality before the fusion to explain it separately, called pre-fusion explanation. This interaction between fusion and XAI bridges the gap between technical model development and clinical decision support.
This review presents a unified conceptual model that makes clear the workflow of how to integrate multimodal data and apply explainable algorithms to breast cancer diagnosis. It observes the interaction between preprocessing, feature extraction, and fusion strategies. This is followed by prediction, explanation, and evaluation of the explanation. Fig. 14 illustrates a visual conceptual framework for multimodal breast cancer diagnosis with XAI.
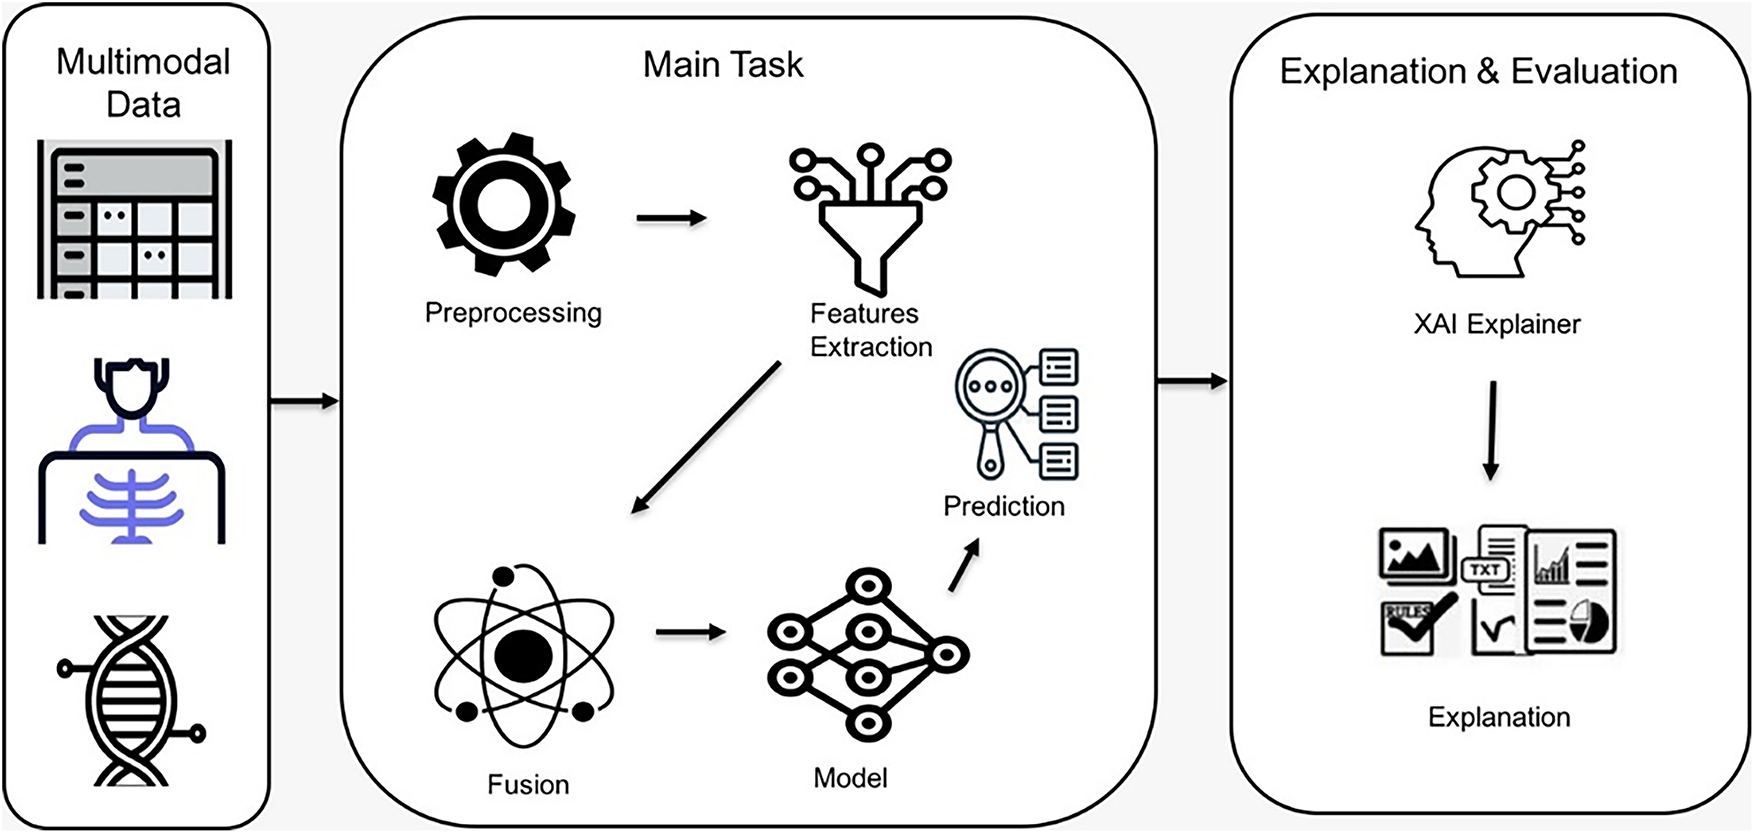
Figure 14: Visual conceptual framework of multimodal breast cancer diagnosis with XAI
3.5.5 XAI Evaluation Techniques
Evaluation of AI explanations is a process of assessing the accuracy, reliability, and usefulness of the explanation in reflecting a model’s decision-making process [22,76]. Evaluation methods ensure that the explanation is actionable and interpretable. Evaluating explanations focuses on the following: (1) building trust, which enables users to understand and trust decisions, increasing their reliance on AI systems; (2) clinical and ethical compliance, because explanations are essential for ethical decision-making in sensitive areas; (3) model debugging, because evaluating can detect errors and biases in AI models; and (4) facilitating human–AI collaboration, enabling humans to make decisions easily through clear evaluation [76,77].
Based on the level of human involvement, evaluation methods can be categorized into evaluation with and without a user [78]. Evaluation with a user is divided into two groups—human-grounded metrics, involving real humans performing simplified tasks under the core target application, and application-grounded metrics, involving real humans in real tasks in a practical environment to determine whether these explanations can achieve the desired goal [76,79]. Evaluation without user includes functionally grounded metrics that assess the quality of the explanation without human involvement by using a computational proxy [76]. Based on the focus of the evaluation process, evaluation methods can also be classified as human-centric, which involves the user’s trust and understanding of explanation; model-centric, which determines alignment of the explanation with model behavior; and task-centric, which focuses on the effectiveness of the explanation in improving task performance [20].
Overlap-based metrics such as intersection over Union (IoU) are employed Eq. (9) [80] to quantitatively evaluate the alignment between the explanation maps and expert-annotated ground truth:
A higher IoU indicates stronger overlap between predicted and actual relevant areas.
Similarly, the dice coefficient Eq. (10) is widely utilized to measure the similarity between explanation-based regions and ground-truth annotations:
Unlike IoU, Dice emphasize the harmonic mean of precision and recall, providing a more balanced evaluation when regions differ in size.
In addition to overlap-based metrics, the pointing Game metric, Eq. (11), [81], is applied to evaluate whether the most activated point in the explanation heatmap falls within the ground-truth region:
Beyond overlap and localization metrics, Eqs. (9)–(11), additional measures are employed. Entropy-based measures quantify the sharpness of heatmaps, while cross-method agreement is often measured using Jensen-Shannon divergence between attribution distributions. Finally, Clinician validation typically involves inter-rater reliability measured by Cohen’s κ.
Evaluating the explanation is an important step to ensure the accuracy of XAI techniques, especially in sensitive fields such as healthcare.
The field of breast cancer diagnosis has witnessed rapid developments in recent years, thanks to the presence of artificial intelligence technologies, particularly multimodal fusion and explanation techniques.
This section synthesizes findings from the 61 studies in this field in terms of preprocessing techniques, learning models, fusion strategies, explanation techniques, and evaluation methods. This allows us to map not only where and when multimodal breast cancer AI research has advanced, but also how technical methods have evolved—particularly the shift from early concatenation-based fusion toward cross-attention and hybris Transformer-based frameworks with integrated explainability.
4.1 Preprocessing Strategies in Multimodal Breast Cancer Studies
Unifying data from diverse and heterogeneous sources is a major challenge in data fusion because it requires maintaining the integrity of information without losing any important details [6]. The data preprocessing stage is essential to building integrated multimodal systems for breast cancer diagnosis. This stage helps standardize data characteristics and improve input quality before fusion. Common preprocessing techniques include denoising, normalization, encoding, data alignment, and contrast enhancement.
A study conducted in 2021 [27] attempted to address these challenges by integrating pathological images and structured EMR (electronic Medical Record) data in a richer fusion network. Researchers have been able to convert low-dimensional EMR data to high-dimensional data, effectively combining images and structured data and minimizing information loss during the fusion process by using a denoising autoencoder. Dimensionality management is a pivotal challenge in multimodal data fusion. High-dimensional data often leads to computational inefficiencies and overfitting, requiring the use of reduction techniques to balance model complexity and predictive performance. The findings in [26] revealed that methods such as those using neural networks and auto-encoders not only reduced dimensionality but also retained essential diagnostic features. The authors highlighted that effective dimensionality adjustment fosters robustness in diagnostic systems, ensuring that they perform well across varied datasets [26] applied principal component analysis (PCA) and auto-encoders to reduce high-dimensional image features and textual data. This study highlights the importance of dimensional considerations in advancing multimodal approaches, providing a pathway to more reliable and precise breast cancer detection frameworks.
Dimensionality reduction can help in improving model generalization while preserving essential information, as in the study [47]. They applied Minimum Redundancy Maximum Relevance (mRMR) across all data modalities by selecting the most relevant and non-redundant features, which reduced noise in the data and improved performance of the model. Preprocessing is a critical step in multimodal data fusion, especially when working with whole slide images that can contain billions of pixels. Dividing WSLs into smaller patches is a common preprocessing step in multimodal fusion. This study [82] selects the most informative patches based on energy values after dividing Whole slide Images (WSIs) into 256 × 256 patches. Similarly, a study by [46] split 224 × 224 patches from manually annotated tumor regions and applied Vision-Transformer to combine images with genetic and clinical features.
Data are often constrained and limited by cost or privacy. Therefore, there is a need to synthetically increase the diversity and quantity of input samples through data augmentation [83]. This process supports the generalization of multimodal learning models and addresses the limitations imposed by small datasets. In the field of multimodal breast cancer classification, data augmentation plays a major role in enhancing the performance of a model. For example, researchers in [84] increased the dataset from 86 original images to 1032 augmented samples by applying rotation, translation, shifting, and other augmentation techniques on mammograms and ultrasound images. This step helped enhance classification by achieving 98.84% accuracy. Similarly, ref. [27] applied transformations such as random flips, rotations, and brightness to pathological images produced more than 3 million samples, which improved classification accuracy to 92.9%.
These preprocessing strategies play a pivotal role in harmonizing heterogeneous modalities, ensuring that the subsequent learning and fusion steps are built upon clean, consistent, and representative data—a prerequisite for achieving robust and explainable diagnostic models.
4.2 Modeling Paradigms in Multimodal Learning
Modeling techniques are at the heart of the multimodal system, where the choice of model structure and data representation method directly affects the accuracy of prediction. In the field of multimodal breast cancer diagnosis, deep learning and machine learning techniques are used for feature extraction and training. After reviewing the theoretical foundations of the types of models in the background section, this section focuses on studies that have practically employed these models in breast cancer diagnosis, highlighting the relationship between the model used and the accompanying fusion strategies.
CNN-based modeling approaches
Ben Rabah et al. [85] employed a CNN-based architecture, specifically a pre-trained Xception, to extract features from images, comparing the multimodal approach with a unimodal model based solely on imaging data. The multimodal CNN model achieved an AUC of 88.87% and an accuracy of 63.79%, compared to an AUC of 61.3% and an accuracy of 31.78% for the unimodal model, demonstrating the significant superiority of the multimodal approach over the unimodal model using CNN networks. This comparison highlights the importance of integrating clinical features with imaging data in enhancing diagnostic accuracy and facilitating personalized treatment planning for breast cancer.
Combining multiple CNN structures can improve performance, as demonstrated in this study [43]. VGG, GoogLeNet, and DenseNet were combined to extract diverse features from mammogram images in the CBIS-DDSM dataset, using the strengths of various structures. These features were then combined with clinical data from the Wisconsin Breast Cancer Database, achieving higher diagnostic performance than many previous studies that relied on a single model.
Despite the remarkable success of CNNs in several fields, particularly in image analysis in the medical field, traditional CNNs cannot capture important and distinctive features in heterogeneous medical data. Attention mechanisms and gating functions can be utilized to optimize the feature extraction process and improve model interpretability and performance to improve the ability of these structures to focus on important information and features. In this context, ref. [86] proposed Sigmoid Gated Attention Convolutional Neural Network (SiGaAtCNN), a novel enhanced CNN architecture for breast cancer survival prediction. Using SiGaAtCNN to extract features and combine them as inputs for classification improved classification accuracy compared to using traditional CNN architectures. The authors in [87] designed a 17-layer CNN to balance model complexity, overfitting risk, and computational efficiency. This custom CNN outperforms other proposed models (transfer learning and pre-trained CNN) by achieving an accuracy of 0.96.
MLP-based modeling approaches
MLP can be used as a classifier in a multimodal breast cancer classification system, as used in this study [44] to classify fused features into benign and malignant tumors with a number of classifiers such as XGBoost and AdaBoost. Likewise, a study by [28] used MLP as one of the basic models to process and classify clinical data related to breast cancer risk factors. It played a pivotal role in the proposed multimodal system, achieving high performance in classifying clinical data, as well as when combined with CNN results using custom weights to improve accuracy. MLP contributed to raising the system’s final classification accuracy to 93% in the concatenation fusion method. Another study that used MLP as a primary classifier is [44], where it was applied after extracting and combining the most important features. This model proved effective in distinguishing between benign and malignant tumors, enhancing the reliance on neural networks in clinical decision support systems.
Emerging architecture
In addition to common models such as CNN and MLP, some studies have used advanced models to improve integration between different sources. Some studies have used an Autoencoder to compress representations, for example, the study by [88] highlights the effectiveness of deep autoencoder-based integration in handling multimodal data by applying variational autoencoders (VAEs) to extract informative features from high-dimensional data modalities—clinical records, genomic profiles, and histopathological images. These features form a unified representation of breast cancer classification after integration. Some studies have used LSTM networks to analyze and extract temporal information from gene expression data [47], due to their ability to remember long-term patterns. This model, after combining its features with other models and passing them to a final classifier, achieved an AUC of 0.97. Another study [89] used LSTM as a final classifier on fused data and achieved an AUC of 95%.
Some studies have relied on an ensemble model to combine the advantages of more than one model [90]. This study [26] used various classifiers such as SVM (Support Vector Machine), RF (Random forest), LR (Logistic Regression), KNN (K-Nearest Neighbors), XGBoost (Extreme Gradient Boosting), and ANN (artificial Neural Network). ANN achieved the highest accuracy in multi-modal settings and is thus the best classifier—the accuracy of ViT, BERT, and tabular combination with the auto-denoising encoder reached 94.18% with ANN. Although this type of model is less common with multimodal fusion, it shows a research trend towards taking advantage of the structural depth of advanced models to support the performance of diagnostic systems.
Accordingly, for multimodal breast cancer diagnosis, a wide variety of models are used depending on the data type. CNN is the most common choice for image data, while MLP, SVM, RF, and XGBoost are commonly used for clinical and structured data. For high-dimensional or sequential data, studies have relied on LSTM, GRU, and transformer-based architectures. Hybrid CNN-Transformer models have emerged for joint imaging and tabular clinical data, achieving state-of-the-art results. This reflects a broader trend in healthcare AI, where hybridization improves both predictive performance and explainability.
4.3 Fusion Strategies for Integrating Heterogeneous Data
Fusion strategies have become an essential element in the design of diagnostic systems, as the quality of the final representation and the accuracy of the model depend largely on how different types of data are combined. Many studies have employed different fusion strategies, such as early, intermediate, and late, using simple or advanced fusion techniques. Although operation-based techniques (concatenation, addition, multiplication) dominated earlier works, recent breast cancer research has shifted toward attention-tensor and graph-based methods that enable richer interaction modeling and align closely with modern AI architectures. This section highlights the fusion techniques adopted by studies in diagnostic systems and their impact on system performance.
This study [41] demonstrated the superiority of early fusion over late and unimodal models in predicting breast cancer molecular subtypes by integrating gene expression, copy number variation, clinical data features, and histopathological images using different fusion techniques such as concatenation and aggregation methods, achieving an accuracy of 88.07% when used with a random subspace SVM ensemble (MRSVM) model. Most of the studies described in this systematic review used concatenations as a simple fusion technique to integrate multimodal data in breast cancer diagnosis [27,28,87].
Intermediate fusion improved the model’s ability to classify breast cancer subtypes in a study conducted by [85] in which they combined features extracted from mammograms and clinical data. This method was able to use the information of each type comprehensively. The intermediate fusion strategy outperformed single-modality methods with an area under the curve (AUC) of 88.87%. Also, among the studies that applied intermediate integration is this study [91] which applied operation-based fusion methods to integrate MRI images with clinical data to classify breast cancer. This research compared concatenation, addition, and multiplication with a trainable architecture. Although all operations helped improve the model’s performance, concatenation slightly outperformed the other operations with an AUC of 0.898. This study demonstrated the effectiveness of simple arithmetic operations in improving the model’s accuracy by integrating various data.
In a study [28], they applied intermediate fusion and decision-level fusion strategies to improve breast cancer diagnosis. The authors used a CNN to extract features from mammogram images and a Multi-Layer Perception (MLP) to extract clinical features; the various features were then concatenated. This process allowed the model to learn from the combined representations. For late fusion, the authors used hard and soft voting techniques to combine predictions from the classifiers to arrive at the final decision.
However, while concatenation is the most commonly used method and contributes to the aggregation method in enhancing model performance, it cannot capture the complex interactions between modalities. Therefore, advanced techniques such as cross-attention, gated fusion, co-attention, and tensor fusion can be more effective in capturing inter-relationships between different modalities.
Attention-based fusion is used in [46,92,93] in multimodal learning (such as image and clinical data fusion). This study [93] proposed an iterative multi-attention mechanism to combine textual BI-RADS descriptors with mammogram features. This study applied cross-attention between BI-RADS and image features, self-attention within image features, and view-attention between mammogram views. This integration enables the model to iteratively refine the fused multimodal representation at multiple resolution levels. After combining text descriptions with images, accuracy improved by about 10% and specificity from 0.65 to 0.77. The fusion technique was not just a fusion of features, but rather a deep fusion that contributed to raising accuracy, improving sensitivity, and simulating the thinking of a doctor. Another type of fusion method based on self-attention and cross-attention is transformer-based attention; these models are mostly used in vision-language tasks. The GPDBN framework proposed by [58] fully exploits complementary information between pathologic image features and genomic data to enhance breast cancer prognosis prediction by applying a tensor-based bilinear fusion method and using inter-modality and intra-modality bilinear feature-encoding modules.
Graph-based fusion techniques have shown promising results in enhancing diagnostic performance in breast cancer. For example, in a study conducted by Jabeen et al. (2024) [59], two models were designed (Residual Blocks CNN-3 and Residual Blocks CNN-2), the features were extracted from each model, then optimized using a Simulated Annealing-based algorithm, and then fused before being classified using a serial-controlled Rényi entropy technique. This method helped increase the accuracy of the model on data of approximately 97% on CBIS-DDSM and INbreast datasets. Similarly, another study relied on fused features that were extracted from different CNN models (VGG16, VGG19, DenseNet, MobileNet), then selected the optimal features using a genetic algorithm, which improved classification accuracy [94]. In another work [95], histopathology images were utilized to improve BU-NET performance by integrating encoder-decoder pathways with attention and skip connections, enhancing segmentation results but still remaining limited to image-only data.
All previous studies emphasize the importance of feature fusion techniques to enhance classification or segmentation performance. However, it reveals a clear gap represented by the absence of interpretation in a multimodal fusion system. This gap emphasizes the need for research that integrates multimodal data fusion and explainability techniques simultaneously, which is the primary focus of the present review.
4.4 Explainable AI Approaches in Multimodal Breast Cancer Research
There is growing demand and expectation from users that AI systems provide explanations to validate their decisions [96]. As AI continues to evolve, recent advancements have introduced novel technologies to enhance usability and comprehensibility [97]. Ref. [22] provided a comprehensive review of AI and XAI techniques used in breast cancer diagnosis, with a focus on various imaging modalities. The study critically evaluates the application of XAI techniques in breast cancer diagnosis. In addition, the review explores the advantages of XAI in providing model explanations while addressing its limitations.
There are many studies that have employed explanation techniques. Some have used local explanation tools such as Grad-CAM and LIME, and others have used global explanation methods such as SHAP in addition to multiple hybrid approaches that combine several XAI methods. Islam et al., in 2024, [98] used five ML algorithms to predict breast cancer. The researchers applied the SHAP method to the highest performing ML model to understand the role of each feature on the model’s output.
Several studies have emerged on SHAP to generate both local and global explanations for model predictions. In the context of breast cancer prediction, refs. [99,100] have applied SHAP to explain individual patient prediction, which influential features and provide a global explanation to identify the most important features across all patients that influence breast cancer prediction.
Several studies integrate SHAP with other XAI techniques to enhance the robustness and completeness of model interpretability [101–105]. This study [102] employed a combination of SHAP and LIME to enhance trust and transparency in AI-assisted diagnosis. They used SHAP to identify top-ranking features that contribute globally, while using LIME to explain each prediction individually.
A group of researchers in 2023 [106] sought to improve the reliability and transparency of computer-aided diagnostic systems for breast cancer detection. They introduced MT-BI-RADS, a novel explainable DL framework for breast cancer detection in ultrasound images. The researchers used SHAP and LIME to measure the impact of each BI-descriptor on the model’s prediction, but they adopted SHAP because they found it to be more consistent. Study [107] employs LIME to predict breast cancer metastasis. This approach focuses on providing explanations and quantifying the influence of patient characteristics and treatment methods on breast cancer metastasis.
In addition to SHAP and LIME, Grad-CAM has also been adopted to interpret breast cancer diagnosis and classification models [108,109]. This study [110] proposed a multi-class shape-based classification framework that can be interpreted mathematically and visually for breast lesion images generated by tomosynthesis. The study interpreted predictions of deep learning models using two XAI algorithms: Grad-CAM and LIME. The explainability study verifies the applicability of all the methods used; focusing on the advantages and disadvantages of both Grad-CAM and LIME methods can provide useful insights into interpretable CAD systems. The study [111] employed three XAI techniques, permutation importance, Partial Dependence Plots (PDP), and SHapley Additive exPlanations (SHAP), on machine learning model for breast cancer classification to provide an explanation of the model results to improve the understanding of breast cancer diagnosis and treatment and to identify the most important features of breast cancer tumors and how they affect classification. The research provided broad insight into the specific characteristics of breast cancer diagnoses.
In a recent study [112], the researcher combined three explanation techniques, Attention mechanism, Grad-CAM, and SHAP into a hybrid framework called Hybrid Explainable Attention Mechanism (HEAM), which was applied to the Breast Cancer Wisconsin diagnostic dataset. This framework aims to improve model accuracy and clarity of explanation. The data was processed using a 1D-CNN model that calculates attention weights and is then utilized to guide Grad-CAM to produce heatmaps that illustrate the most influential features. At the same time, the SHAP technique was applied directly to input features to calculate the contribution of each feature. These values were then feedback to the attention layer to improve explanation accuracy. This method achieved an accuracy of 99.6% with high values in precision, recall, and AUC. This method is a prime example of the effectiveness of integrating more than one explanation technique into a single framework to enhance transparency and reliability in breast cancer diagnosis.
LRP technology has proven its effectiveness in breast cancer diagnostic applications as it is suitable for analyzing complex and deep networks and is widely used in medical applications [73,105].
In recent years, interest has focused on integrating explanation techniques with multimodal learning systems. This approach aims to enhance the accuracy of models and provide an integrated explanation, making the model more transparent and understandable. Few studies have been conducted in this area, highlighting a gap in the literature. Most of these studies used an intermediate fusion strategy [113,114], because it allows explanations to be traced to their specific features and is therefore suitable for application with all types of explanations. A study by [114] proposed DL-based fusion to improve breast cancer classification. After extracting features of ultrasound images using a modified VGG-11 network and reconstructing diffuse US tomography using an autoencoder-based model, the images were combined. This fusion model achieved an AUC of 0.931, outperforming single-modality models such as US-only, which achieved 0.860. The researchers applied Grad-CAM to the US model to highlight regions that affect classification prediction.
Some studies that relied on multimodal fusion systems did not apply the XAI tools to all data patterns, but rather focused on a specific pattern only, as in this study [115], which applied hybrid XAI methods, SHAP and LIME to analyze and explain the contributions of genomic data to the prediction process, ignoring clinical data, which limits the understanding of interactive relationships between patterns.
Some studies did not simply provide an explanation but also evaluated the explanations resulting from XAI techniques [101,116–118]. Several studies have discussed the development of evaluation metrics for explanation techniques [77]. The basic goal is to ensure that the explanations are both consistent with the predictions of the models and easy for users to understand [119,120]. These studies used quantitative criteria such as entropy-based quality explanation, metric pointing game, and criteria based on expert opinion. A study by [104] revealed that explanations generated by SHAP and LIME for the same instance were inconsistent. Each algorithm interprets and weighs features differently, thus providing different explanations and impacting physicians’ decision-making ability. The reviewed studies employed heterogeneous approaches to explanation evaluation, ranging from visual comparison to clinician assessments to expert feedback. This heterogeneity further highlights the absence of standardized criteria, making cross-study benchmarking difficult.
5 Comparative Analysis and Evaluation
This section presents a systematic comparative analysis that interprets the results of previous studies that applied fusion and explanation techniques to breast cancer diagnosis. The previous section reviewed the work of the studies separately, while this section focuses on how models, fusion, and explanation strategies are employed and compared across studies, in addition to determining the relationship between learning objectives and model performance.
This analysis is divided into four main axes: The first axis covers a summary of the studies previously reviewed, identifying data patterns, learning models, fusion strategies, and explanation techniques used. The second axis focuses on comparing performance in terms of the impact of the type of data used and the fusion strategy on prediction accuracy. The third axis explains the relationship between fusion and explanation and how fusion mechanisms affect explanation techniques and their quality. However, the fourth axis focuses on studying how the objectives and orientations of the models contribute to improving the quality of performance. Finally, a synthetic vision is presented in the fifth axis, combining the results of the previous axes into a single structure that clarifies the relationships between fusion, explanation, evaluation, and performance.
5.1 Summary of Reviewed Studies
This section aims to conduct a comparative analysis of the methodologies and performance of previous studies related to breast cancer diagnosis using artificial intelligence. The results are summarized in tables relating to the fusion strategies, types of data used, models employed, and explanation techniques applied.
Table 3 summarizes key studies that have employed data fusion approaches for breast cancer diagnosis. The table illustrates that most studies have relied on feature-level fusion to integrate data.
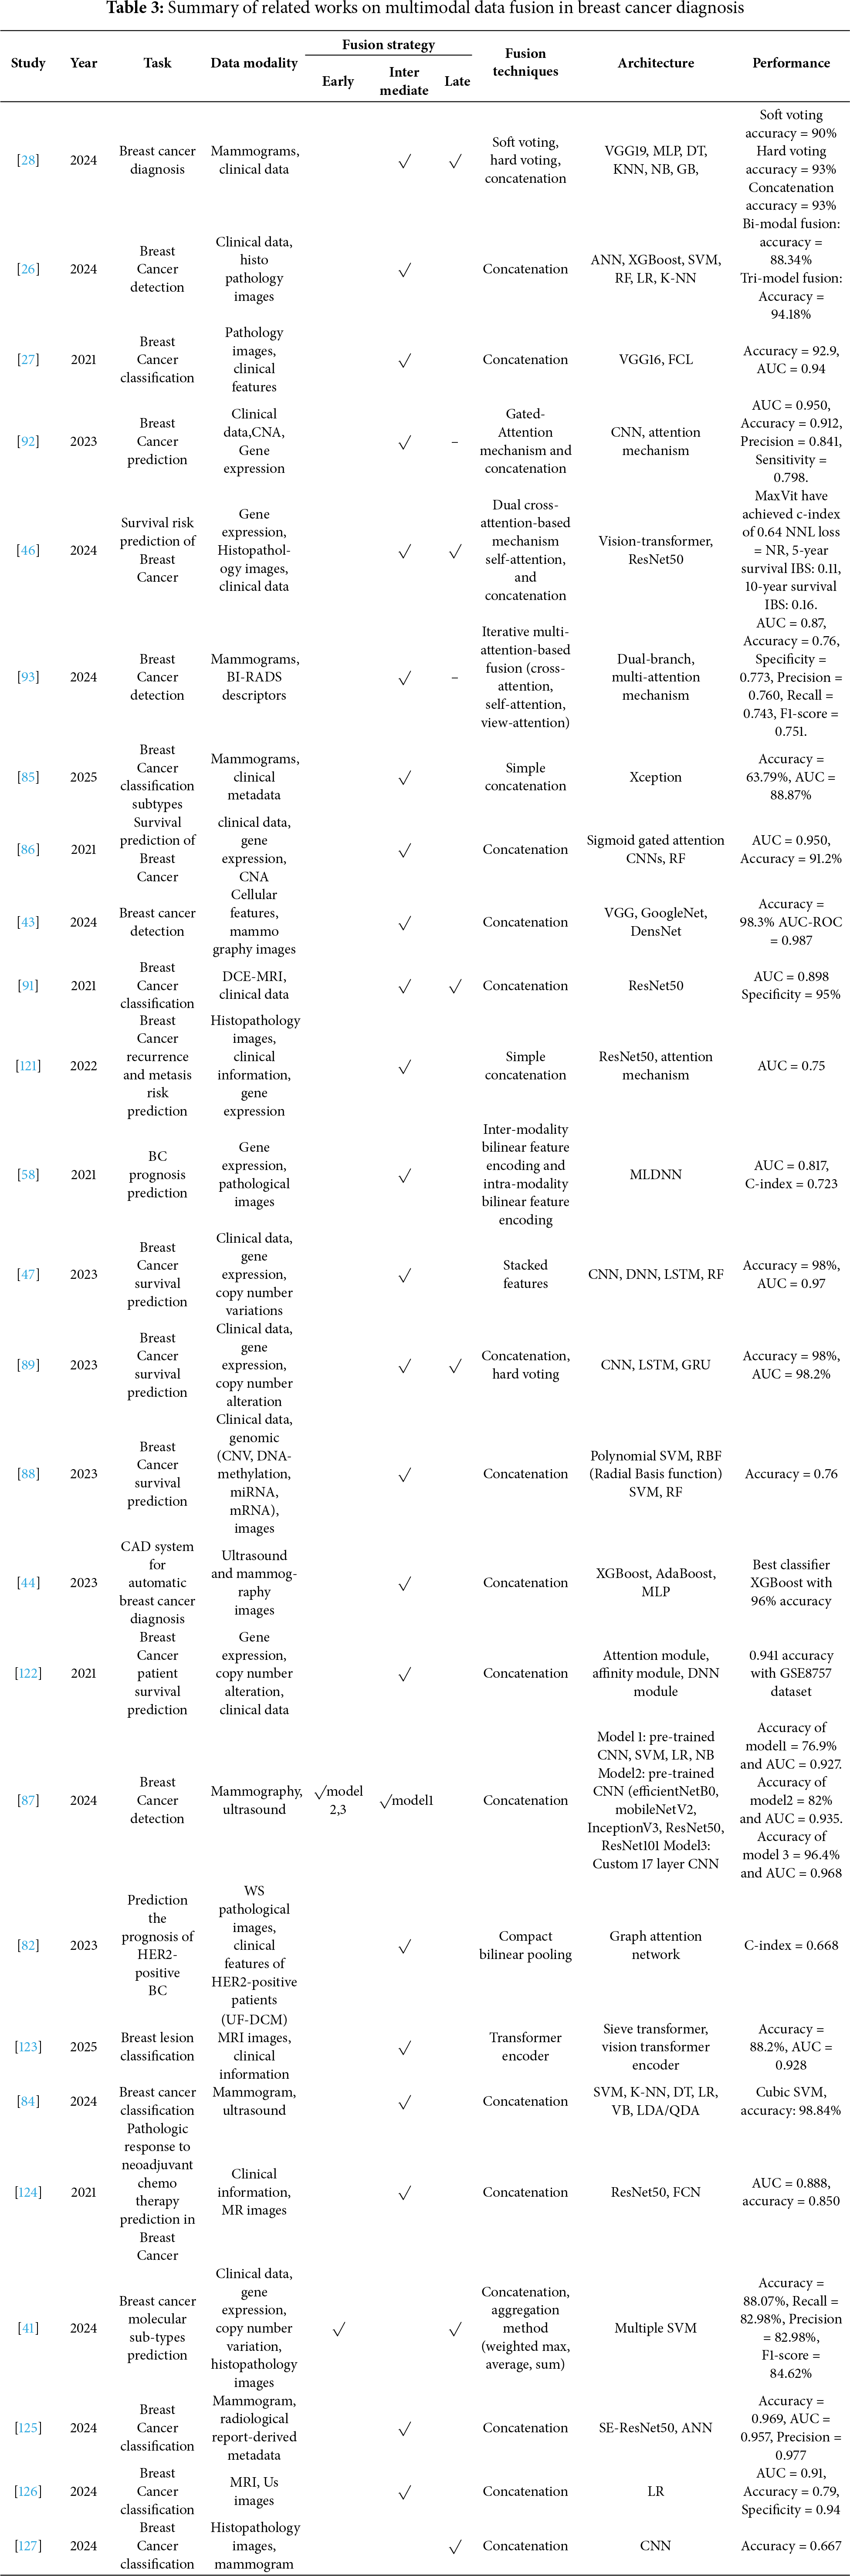
After reviewing previous studies in the field of breast cancer diagnosis, it was noticed that researchers have used a variety of public datasets to train and test deep learning and machine learning models [46,47,85,92]. Because of the accessibility of these datasets, they are widely used in the medical field; they are available in various modalities, such as mammograms, clinical features, and histopathological images. However, other studies use private datasets from specific hospitals, clinics, or cancer research centers [123,124,126]. These types of datasets provide diverse real-world data, but they are difficult to obtain directly because of privacy regulations and laws.
Some studies combined private and public datasets or used one dataset for training and the other for testing. The selection of datasets depends on several factors, such as the required task, model design, and interpretability in breast cancer research. Table 3 indicates that most studies combined clinical data with images, especially mammograms, to achieve high performance. This frequent integration can be attributed to their complementary diagnostic value. Images provide rich spatial information, and clinical data provide crucial contextual information.
Although early fusion remains simple and computationally efficient, intermediate fusion has become the preferred strategy in recent multimodal breast cancer studies because it better preserves modality-specific information and facilitates deeper interactions. Most models achieved high accuracy, exceeding 90% when using the intermediate fusion. Late fusion remains useful when modalities are processed separately, but often provides lower performance compared to intermediate strategies.
The literature shows a clear methodological evolution. Early fusion has traditionally relied on simple concatenation and basic element-wise operations. More recent trends increasingly emphasize intermediate fusion strategies that integrate attention mechanisms and tensor-based representations to achieve greater flexibility and improved performance. In parallel, graph-based fusion and cross-model transformers emerge as state-of-the-art methods, providing enhanced capabilities for capturing modality interactions and improving model interpretability within explainable multimodal learning frameworks. Attention-based and tensor-based are modern techniques that enable richer cross-medal interactions, unlike simple methods such as concatenation or voting. The relationship between model selection and fusion strategies highlights the technical depth and methodological diversity observed in the reviewed studies.
After analyzing fusion strategies and techniques, it is important to focus on XAI techniques and their role in this field. Many of the previous studies reviewed in the field of breast diagnosis focused on the application of XAI to enhance the reliability of results and clarify the accuracy of single-modality or multimodality systems. Table 4 lists key studies that use XAI with clarification of data types used, Architectural model, and XAI technique to better understand the landscape of XAI applications in breast cancer research.
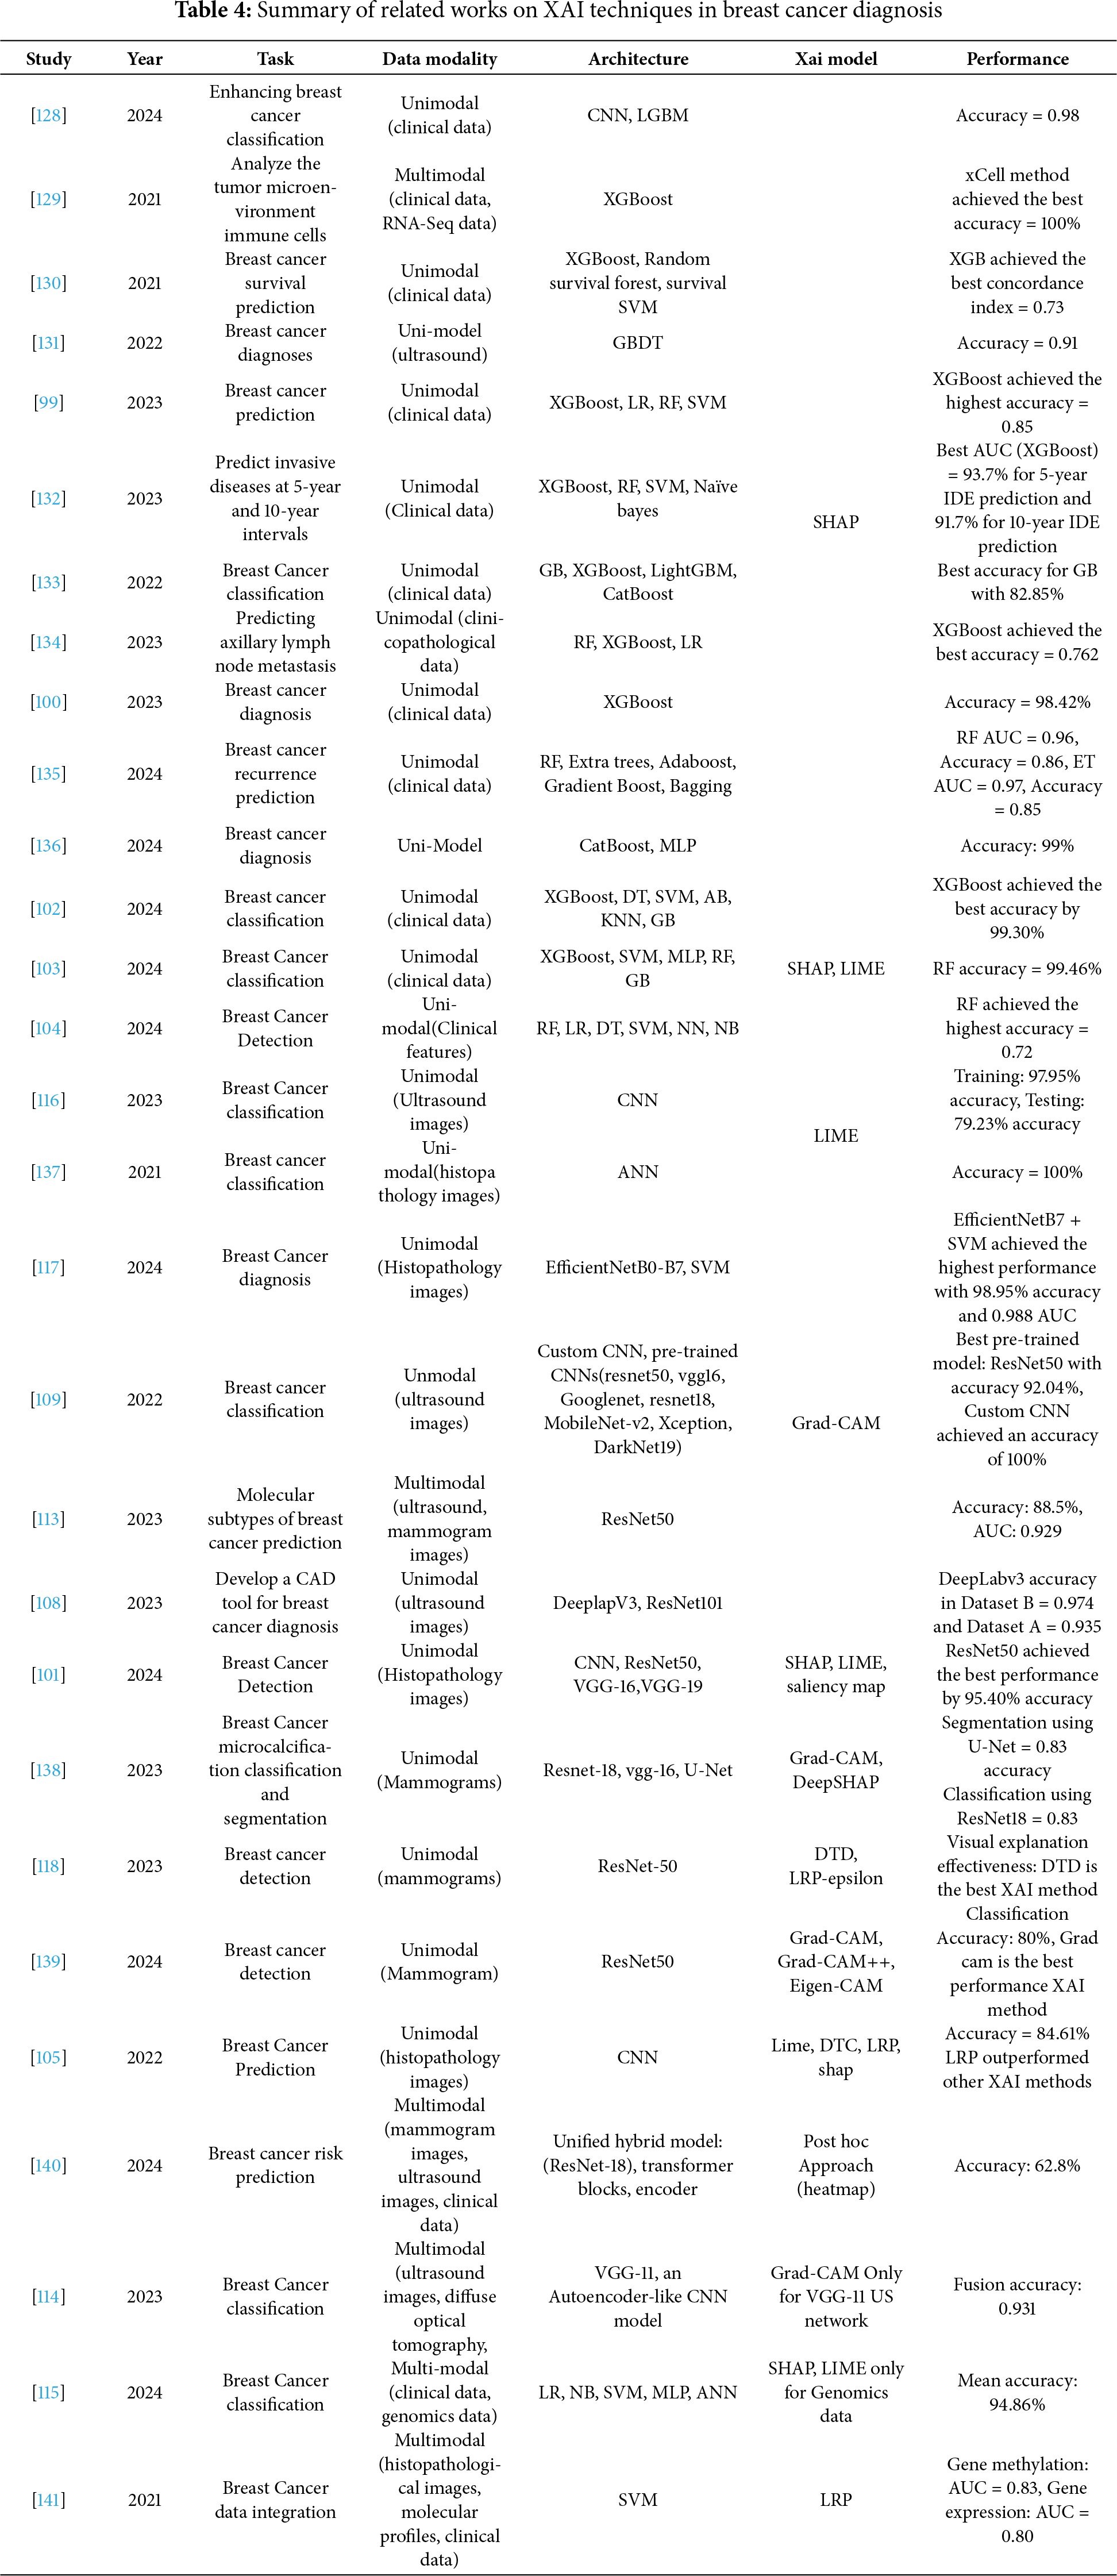
Table exhibits that most studies used SHAP and LIME techniques when dealing with clinical data, while they relied heavily on Grad-CAM when dealing with medical images. Multimodal studies remain fewer but are showing higher generalization and richer explanation capabilities. This highlights the need for hybrid explanation strategies that support clinically viable multimodal integration. SHAP and Grad-CAM remain the most dominant XAI techniques, often combined for hybrid explanation.
The relative distribution in Fig. 15 of the use of explanation techniques in previous studies shows that SHAP is the most widely used XAI technique. Its popularity stems from its model-agnostic nature, which allows it to be applied across various ML models, especially tree-based ensemble models, which are commonly used for breast cancer diagnosis and risk prediction [142]. Followed by Grad-CAM to identify the most impactful areas in the predictive decision. Few studies have used LIME to provide local explanations. Despite the importance of combining more than one XAI technique in improving the understanding and comprehensiveness of explanation, it is still limited in the field of breast cancer. Hence, researchers tend to rely on a single technique instead of building a hybrid framework, which is considered a future research opportunity to improve the quality of interpretations.
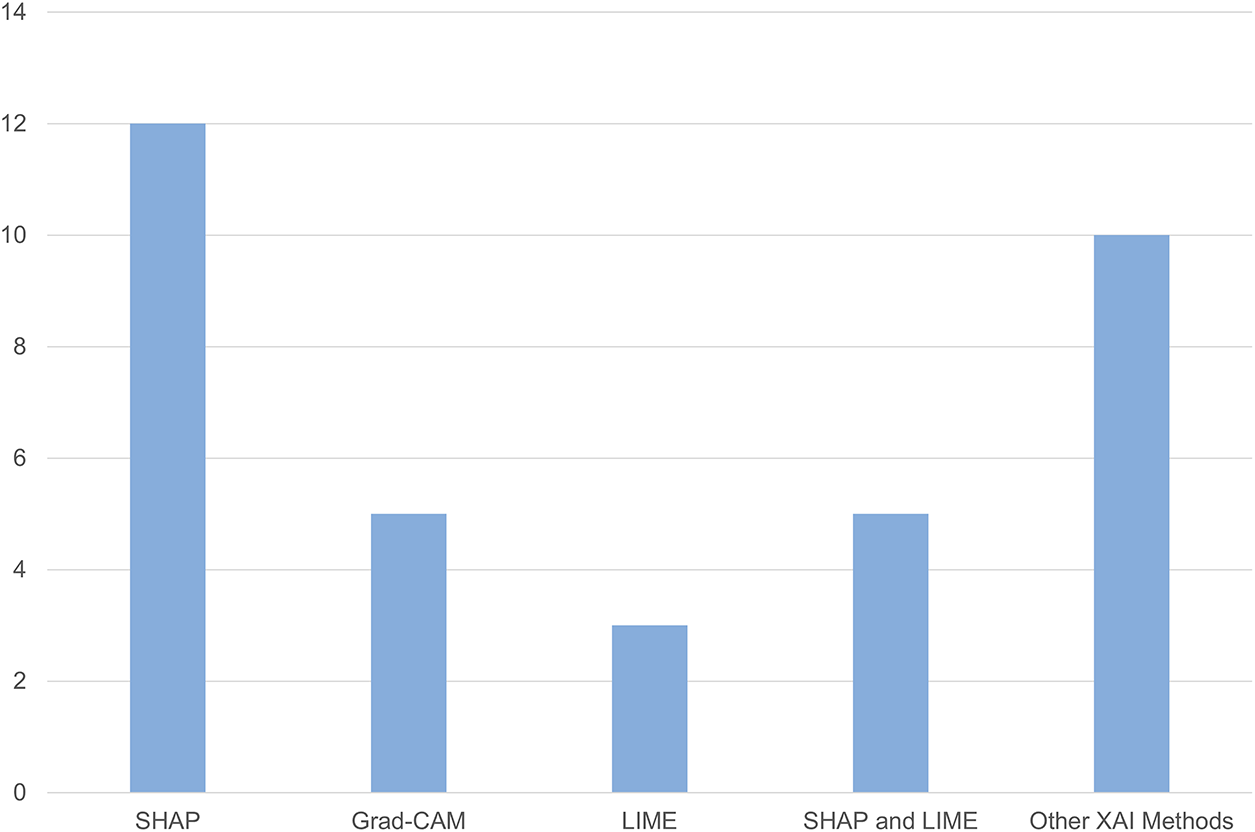
Figure 15: Number of studies using each XAI methods
Although many studies have applied explanation techniques to understand models, only a few have systematically assessed the quality of explanation. The importance of this aspect lies in determining the extent to which the explanation is consistent with the clinical facts. Table 5 shows the most prominent studies that evaluated explanation techniques, with an illustration of the evaluation metrics used to illustrate the extent to which explanation evaluation is employed in current breast cancer research.
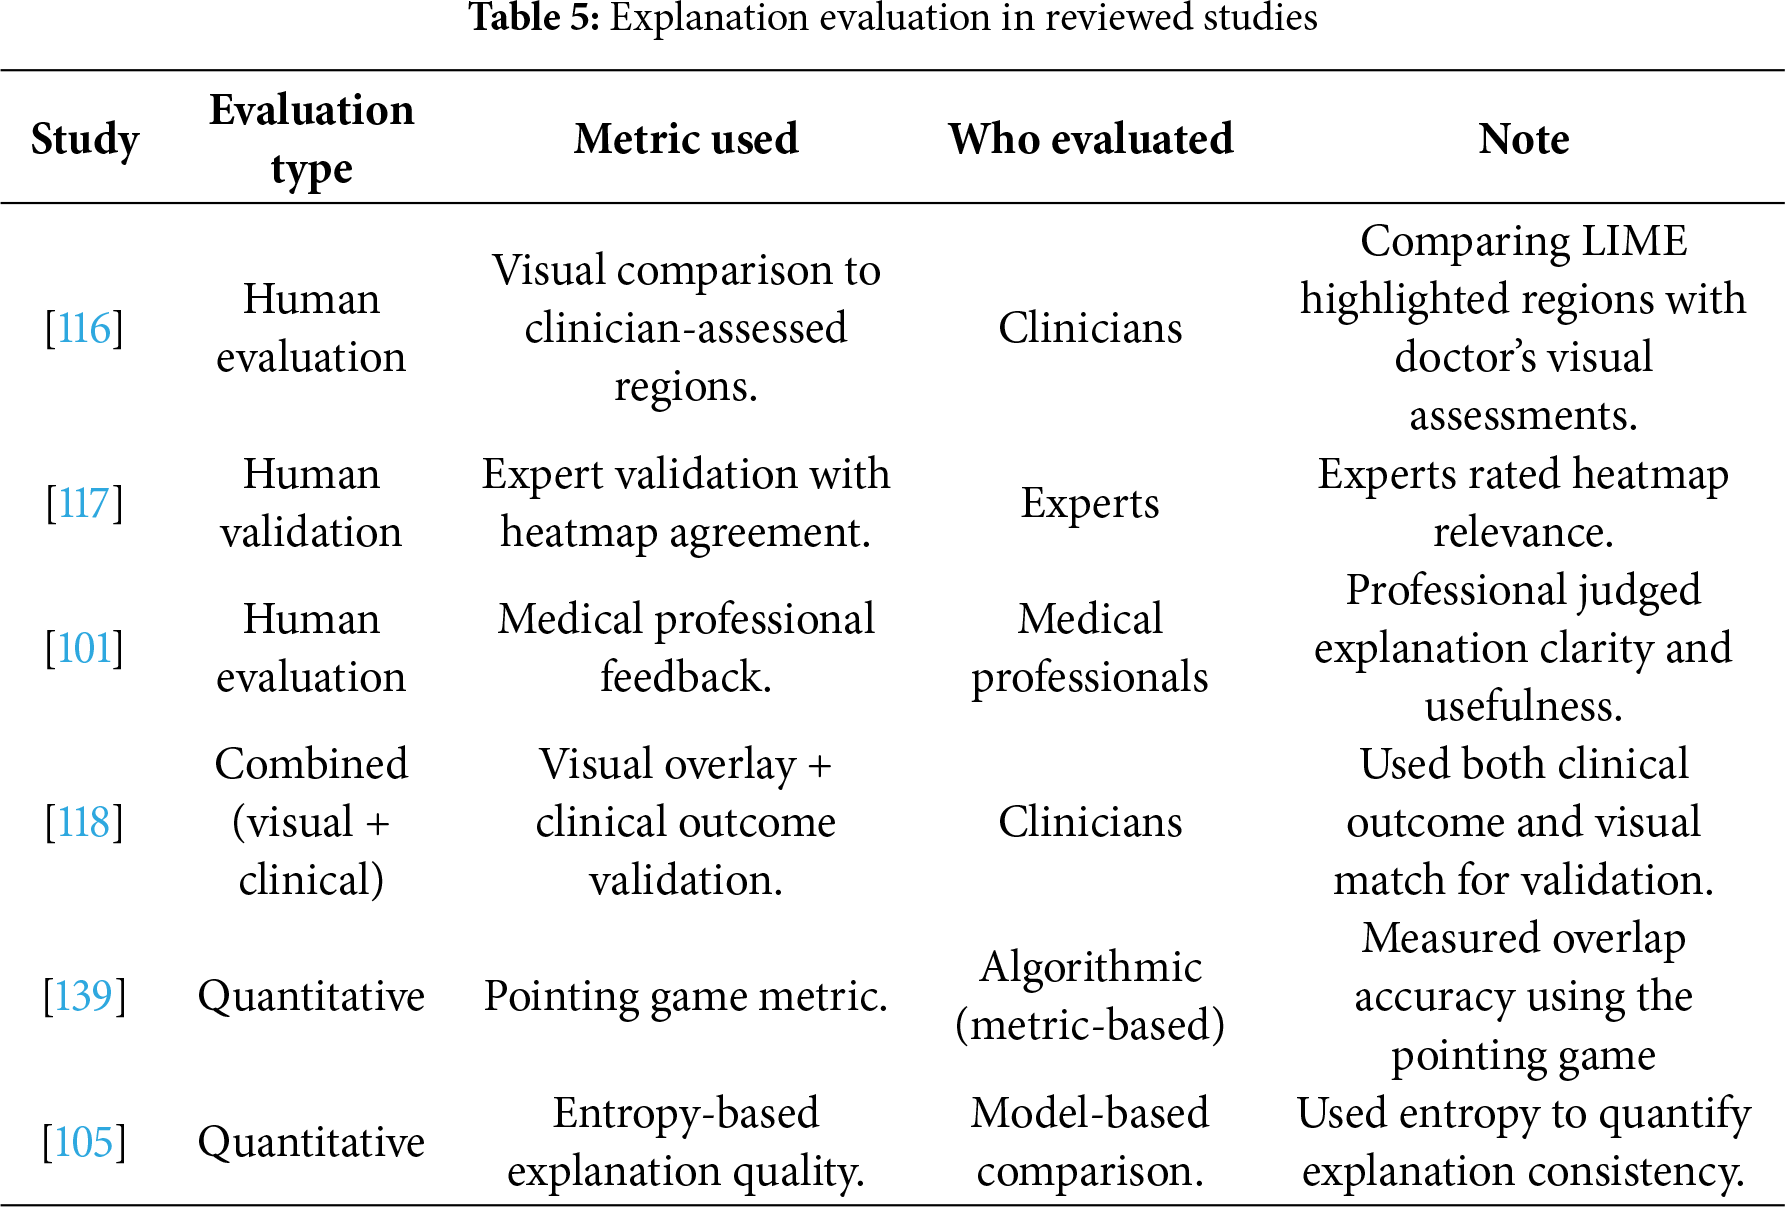
It demonstrates that previous studies relied heavily on qualitative evaluation, such as human evaluation or comparison to clinical decisions. This, in turn, reveals a clear gap in the field, as there is no unified framework for evaluation, and thus it is difficult to directly compare the results.
Previous studies have demonstrated the success of combining various modalities to improve the performance of several tasks, including screening, diagnosis, and predicting treatment response in the breast cancer field. Table 6 compares unimodal and multimodal models across selected studies to illustrate the impact of fusion on performance. The results show that multimodal fusion enhances diagnostic performance, with improvements ranging from 5% to 30% depending on the data type and evaluation metric. For example, fusing mammography with clinical or molecular features led to up to double the accuracy compared to image-only baselines. This improvement highlights the complementarity of clinical and imaging features and the importance of fusion strategy.
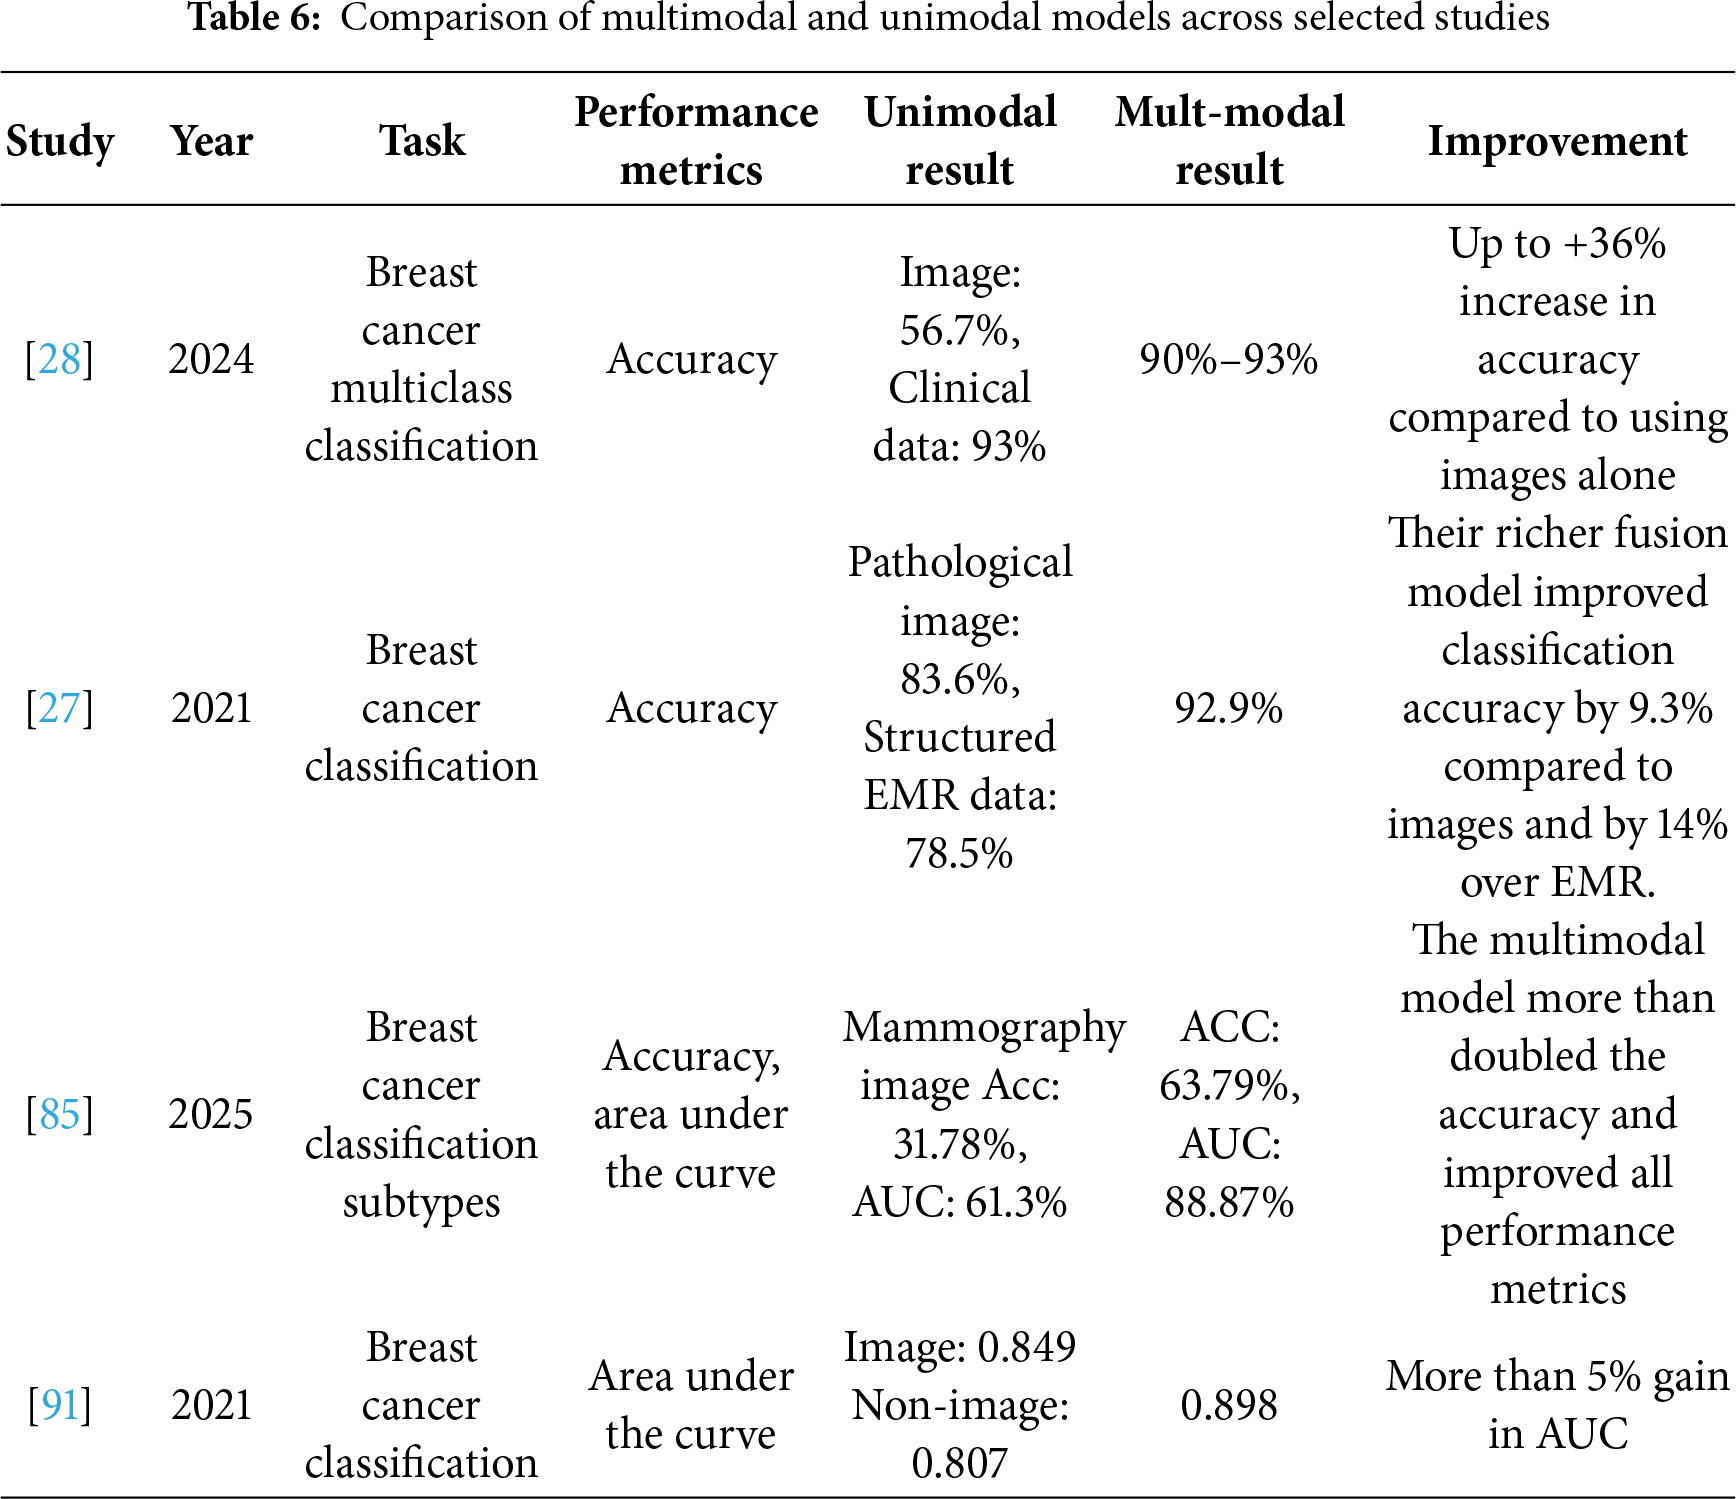
Although a wide range of models and fusion strategies have been reviewed in previous studies, it remains necessary to compare the effectiveness of these strategies quantitatively to determine which approach achieves superior diagnostic performance. Tables 7 and 8 detail the average performance across the fusion strategies and data modalities to allow for a clearer view of the appropriate approach that achieves the highest robustness and effectiveness in breast cancer diagnosis. The average performance was calculated based on accuracy, as it was the most reported performance metric across included studies.
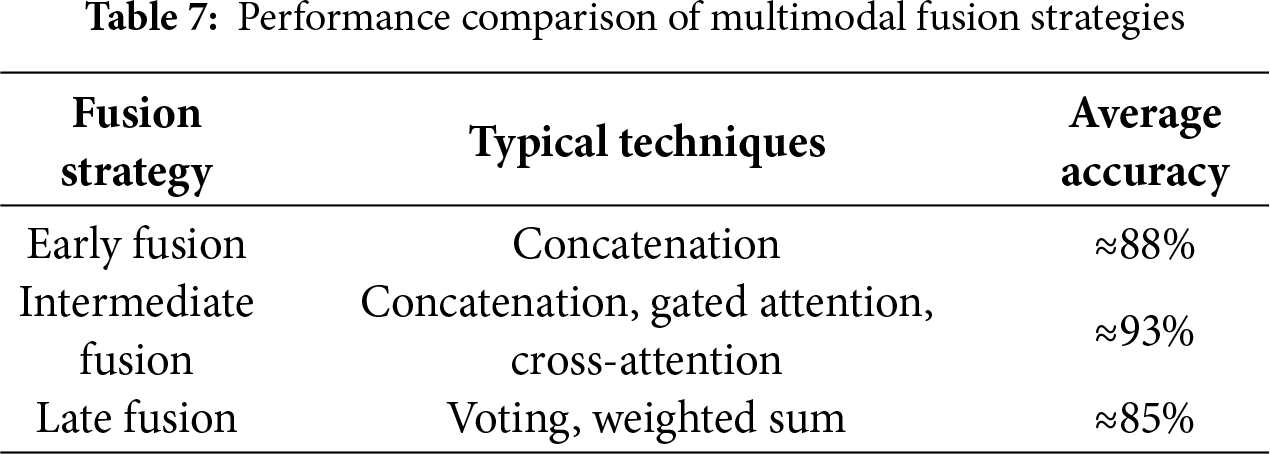
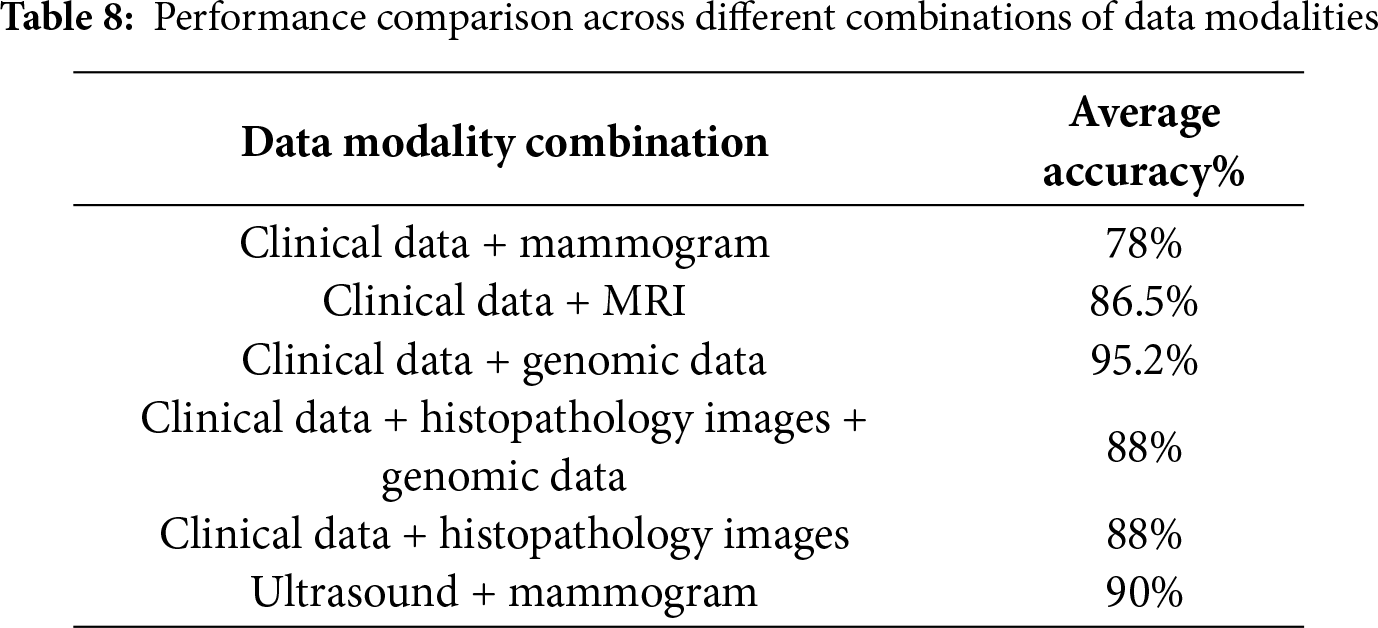
A quantitative analysis of the reviewed studies reveals clear performance trends across different fusion strategies. Table 7 indicates that the intermediate fusion strategy achieved the highest average accuracy compared to early and late fusion by 93%. This is due to the ability of this strategy to preserve the internal representations of each data type individually, which allows for deep interactions between different patterns. As for early fusion, it achieved an average accuracy of 88%, because it suffers from oversimplification and loss of certain information. Late fusion is considered the least effective, with an average accuracy of 85%, because it only combines the final predictions without considering internal representations. These results emphasize that fusion strategy selection is not merely an implementation choice but a decisive factor in diagnostic performance. In the AI era, where models can adaptively align cross-model representations, intermediate and hybrid strategies provided fertile ground for more interpretable and high-performing frameworks.
Regarding the types of combined data that play a critical role in determining performance, the results in Table 8 show that fusing clinical data with genomic data is the most effective, with an average accuracy of 95.2% due to the value of molecular features in enhancing prediction. For integrating different types of images, combining mammography with ultrasound achieved an average accuracy of 90%, and combining mammography with histopathology achieved an average accuracy of 88%, indicating that combining different imaging techniques also contributes to improved performance. As for the integration of clinical data with mammograms, it was less accurate at about 78%. This can be due to either the use of a specific fusion technique, as most studies relied on the concatenation technique, which cannot sufficiently exploit the complex interactions between data modalities, or due to the limited clinical data, which thus reduces the real value when integrated with images.
Despite rapid progress in the use of artificial intelligence and multimodal fusion technologies in breast cancer diagnosis, many of the studies covered by this review focused mainly on common performance indicators such as accuracy or area under the curve (AUC) [143]. However, limiting these measures is a shortcoming because they do not adequately reflect the clinical feasibility of the models. Indicators such as False Positive Rate, False Negative Rate, Sensitivity, and Specificity are necessary to assess the adoptability of these models in practice. The absence of these dimensions can lead to an overestimation of the readiness of models for clinical use, highlighting the need for a more comprehensive set of clinical measures in future research.
5.3 Fusion-Explainability Relationship Analysis
Fusion strategies have a significant impact on model performance and even how their results are interpreted. Table 9 illustrates the relationship between the type of fusion strategy and the level of explainability that can be achieved, as well as the challenges associated with each type.
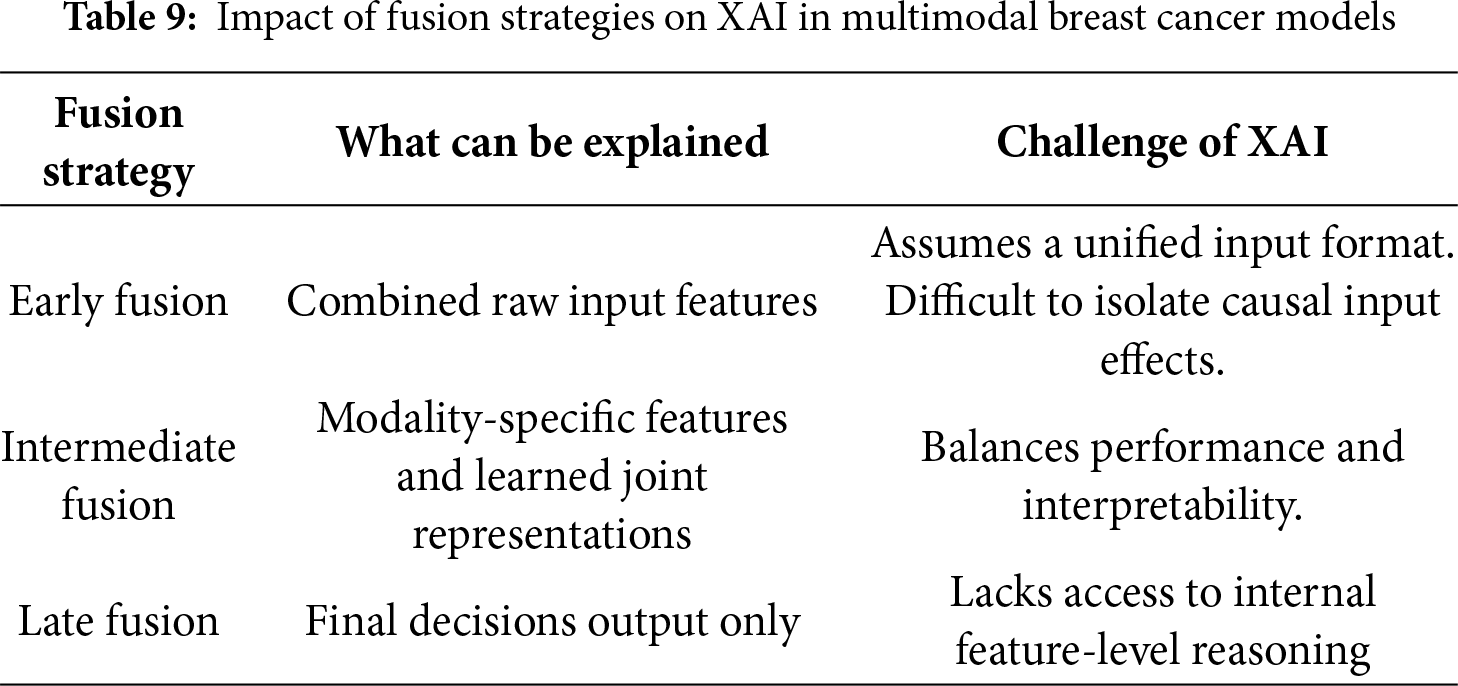
It is clear from the table that the explanations generated by explainable AI models are affected by the type of fusion strategy [144], for example, early fusion, which initially fuses the modalities, making it difficult to discern the impact of each source separately. However, Intermediate fusion allows a clearer explanation because each input type is processed separately. Late fusion can lose the details of the contributions of some features; however, it is still simple.
After clarifying the impact of fusion strategies on explanation mechanisms and the importance of evaluating explanation, it is important to highlight the key differences between implementing XAI with and without multimodal fusion. Table 10 provides a comparison summarizing the objectives, explanation type, assessment practices, strengths, and clinical significance.
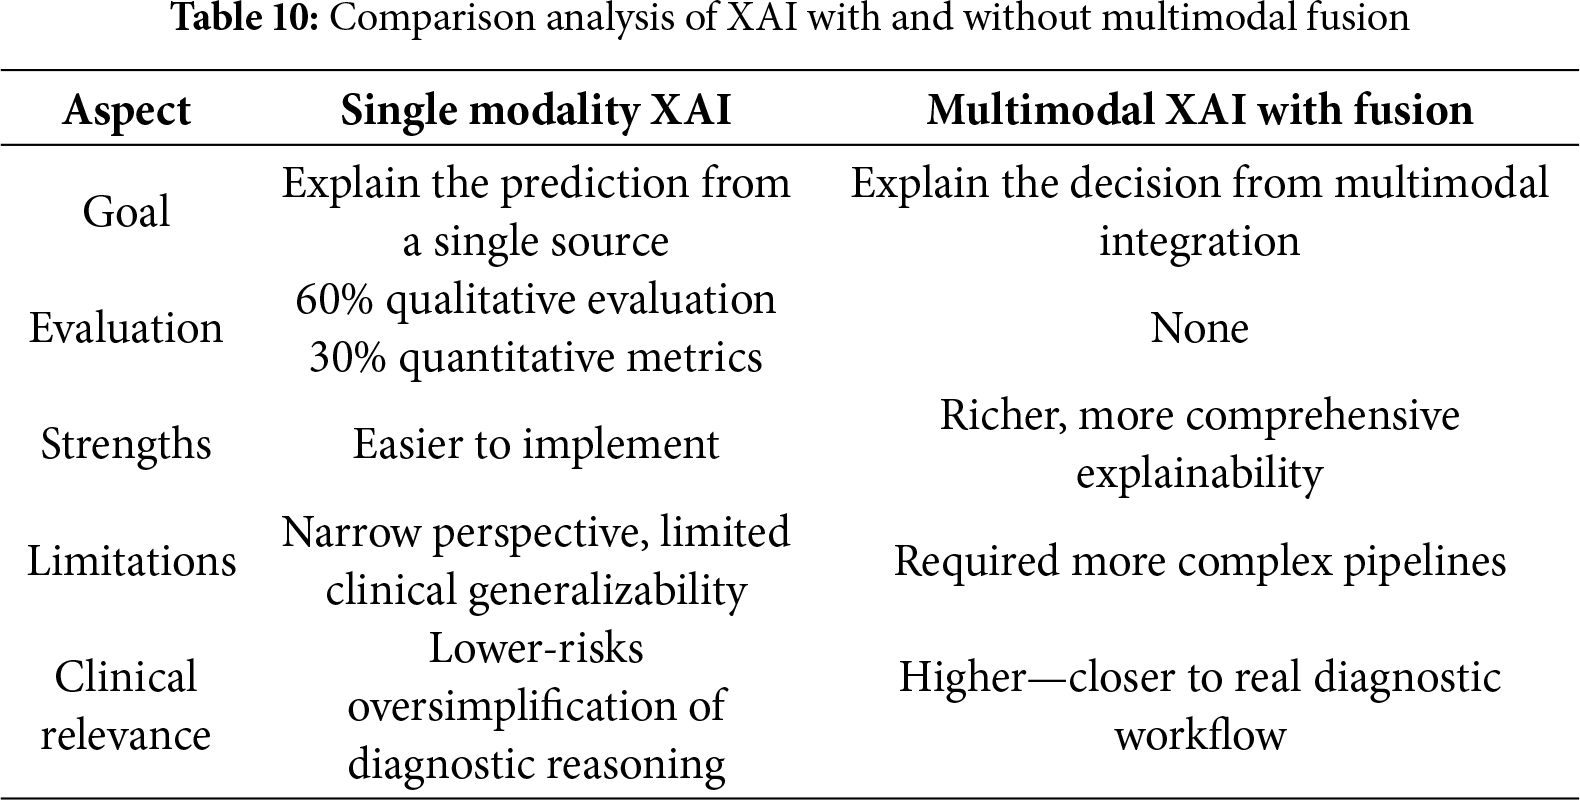
Table 10 shows that single-modality XAI techniques are easy to apply, but their results sometimes do not correspond to clinical reality, and they are limited in terms of the general diagnostic perspective. Although explanation in the field of multimodal fusion provides rich and comprehensive information that enhances the reliability of medical decisions, as it reflects the integration of different types of data, it requires complex models and more accurate explanation processes.
5.4 Learning Objectives and Evaluation Considerations
The next step after fusing multimodal features into a joint representation is to define suitable learning objectives that guide the optimization process. The choice dictates how the model balances predictive accuracy, calibration, and interpretability. Multiple loss components are often combined in multimedia learning frameworks to balance prediction performance and explanation quality.
Let N is the number of training samples. For each sample I ∈ {1,…, N}:
•
•
Task loss (classification). The binary cross-entropy is employed as the task loss function to optimize classification performance [145], defined as follows, Eq. (12):
This equation measures the discrepancy between the ground-truth labels and predicted probabilities. Minimizing loss encourages the model to make accurate predictions.
Calibration loss. In addition to accuracy, calibration is considered to ensure predicted probabilities reflect true outcome frequencies. The calibration loss is formulated using the Brier score Eq. (13), [146]:
Explanation alignment loss. Encourages explanations to align with expert annotations [147], it introduces an explanation alignment loss Eq. (14):
This loss measures the alignment between the model-generated explanation heatmap
Where
Joint objective. Overall optimization function Eq. (15) combines all three objectives-task, calibration, and explanation alignment:
where
This allows the model to balance predictive performance, reliability, and interpretability. These formulation shifts the learning paradigm from accuracy-only toward trustworthy, interpretable predictions, aligning with modern AI-driven clinical frameworks.
5.5 Integrated Framework of Multimodal XAI-Based Breast Cancer Diagnosis
Analyzing previous studies in terms of fusion strategies, explanation techniques, and evaluation methods used indicates that most of the research deals with these components separately or partially, which affects the model’s ability to achieve integration between prediction accuracy, explainability, and evaluation. The general explainable multimodal diagnosis model can be expressed as Eq. (16) to achieve a clearer understanding of this relationship:
This equation formalizes the general multimodal diagnostic framework, where modality-specific representations are first extracted, fused into a joint embedding through a chosen fusion strategy, and finally mapped to the predictive output. Once the joint representation is mapped to the predictive output, the explanation
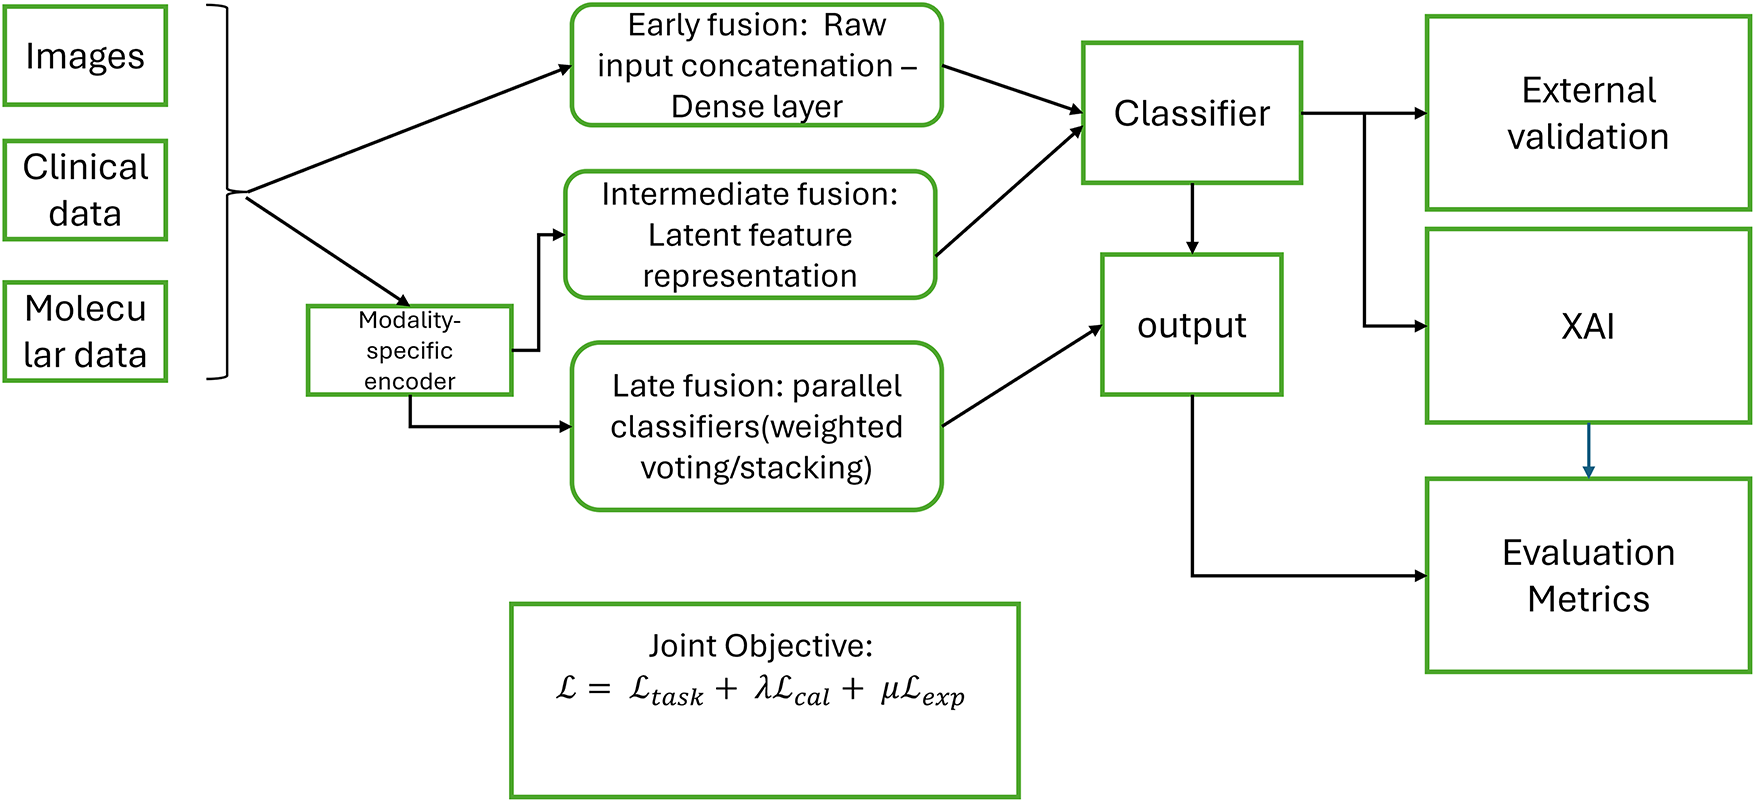
Figure 16: Integrated multimodal breast cancer diagnosis Pipeline
In this review, most previous studies lack some of these components, such as explanation and evaluation. The novelty of this review lies in the creation of a single pipeline that combines multimodal fusion, explanation, and explanation evaluation, and can be a reference for future studies.
This review describes multimodal data fusion and XAI methods for breast cancer diagnosis. It examines breast cancer data types, discusses the state of multimodal data fusion and explainable AI techniques, explores how current research can use machine learning and deep learning models to integrate various types of data, and explores how explainable multimodal data fusion is.
RQ1 is intended to examine the most frequently used types of data in breast cancer diagnostic multimodal learning paradigms. Multimodal methods attempt to mirror real-world clinical decision-making by combining heterogeneous data sources. In the research that has been reviewed, the most frequent data modality combination employed is imaging data (mammograms, ultrasound, MRI, and histopathology slides) and clinical features [107,123,124,140]. Integration of these two types of data can enhance the accuracy of predictive modelling, as images provide accurate visual information about the presence of masses or changes in tissues, while clinical data, such as age and tumor type, give an important context for understanding the image [87]. Also, these two types of data are more available in hospital records than other types of data. Images and clinical data have proven their ability to improve the accuracy of the model when combined, and they closely reflect real-world clinical practice [148].
The combination of multiple modalities has been found to be extremely effective in improving breast cancer diagnosis. The literature consistently indicates that multimodal models perform better than single-modality models because more informative and complementary feature representations are present. For instance, ref. [28] illustrated that a combination of mammography images and clinical features improved accuracy from 0.56.7 (image-only) to 0.93 in the multimodal scenario. Another study [46] fused histopathological images with genetic data and clinical features; this multimodal fusion led to the highest mean C-index of 0.64, outperforming single modality, which has 0.53 (image only), 0.57 (genetic only), and 0.47 (clinical only). This review concludes that using visual and clinical sources achieves a significant improvement in performance compared to a single source by 5%–10%. Although the success of multimodal learning does not depend on types of data modalities alone, the fusion strategy is crucial. Fusion can be early, intermediate, or late. In early fusion, raw data or preprocessed data can be combined before model training. Early fusion is suitable when different modalities share the same feature spaces; for example, study [41], applied early fusion strategy by concatenating gene expression with copy number variation; this improved accuracy by +1.36% over the best single modality (gene expression alone).
It is noted from previous studies that the most widely adopted strategy for integrating multimodal data is the intermediate fusion strategy [125,126]. This strategy is suitable when data types are heterogeneous. Models with intermediate fusion achieve higher performance than early fusion, because intermediate fusion provides deeper interactions between patterns and better integration of heterogeneous data, resulting in a richer and more informative representation. Early fusion can result in the loss of pattern-specific information. This study [88] used complementary information from clinical data, genomic data, and whole slide histopathology images by applying intermediate fusion. Performance improved as modalities were added.
For late fusion, the decisions generated by models trained independently on each type of data are combined. This study [89] combined clinical data, gene expression, and copy number alteration data from the METABRIC dataset to improve prediction performance over that achieved using a single modality. The researchers used hard voting to fuse the output of two classifiers at the decision level. The proposed voting model outperformed individual models with 98% accuracy. Late fusion gives high performance if the fused patterns are different, each has a strong representation, and the system does not need to capture the complex interactions between the patterns. However, if there is a strong interaction between the patterns, late fusion cannot capture it and therefore provides weak performance compared to intermediate fusion.
In conclusion, these results confirm that:
1. Choosing the appropriate fusion strategy and technique plays a significant role in achieving optimal performance.
2. The type of fused data is equally important, as it represents a crucial factor in improving diagnostic accuracy.
This question explores the most widely used deep learning and machine learning models in multimodal breast cancer diagnosis systems. Multimodal data fusion requires flexible models, such as DL and/ML, that can handle heterogeneous data and extract complementary features. CNNs are the most widely used for image feature extraction. Their spatial feature hierarchies are naturally well-adapted to tumor localization and classification. For instance, studies integrating images and clinical features often apply CNNs to extract features before fusion with non-image encoding [82,124], used a ResNet-50 to extract image features before fusion with clinical features; this allows each branch to learn the most relevant patterns independently.
In some studies, especially those involving textual data, Transformer-based models have shown strong performance in capturing cross-modal interaction; for example, the sieve transformer was utilized to extract features across data types [123]. Ref. [41], applied the Random Subspace Method to extract subsets of features; each subset was utilized to train a separate SVM. This method helped capture diverse patterns across modalities and achieved high accuracy (88.07%) for breast cancer subtype prediction. Although deep learning models dominate medical image processing, machine learning models are still valuable for structured data such as clinical and genomic data. For example, this study [84], used statistical grayscale features extracted from mammograms and ultrasound images, passing these features to SVM classifiers, achieving 98.84% accuracy. It is noted from previous studies that using hybrid architectures of DL and ML achieved high performance; for example, [47] applied CNN, LSTM, and DNN for feature extraction and then combined features using a Random Forest classifier. Combining the representational power of deep learning with the robustness of ML classifiers leads to improved performance and interpretability. It concludes from recent research that the choice of model depends on the type of data and the fusion strategy. CNN is the ideal model for image data, while MLP is often applied to clinical or genetic data. Transformers are suitable for heterogeneous data. This diversity reflects the evolution of multimodal breast cancer diagnosis systems.
This question discusses the most applied explainable AI techniques in breast cancer diagnosis and their applicability in multimodal learning. Several XAI techniques have been used in breast cancer diagnosis, including (SHAP), (Grad-CAM), (LIME), Guided Grad-CAM, DeepSHAP, Layer-wise Relevance Propagation (LRP), and Grad-CAM++. In previous studies, SHAP, LIME, and Grad-CAM were used extensively [116,117,137]. SHAP has been used in clinical data-based studies more than image-based studies because of the intensity of computational resources. Most studies have applied SHAP on ML models, especially XGBoost. LIME was used most with images, although it can be used with tabular data; Grad-CAM was used for images only, allowing clinicians to visually identify suspicious areas in images.
Among the various XAI techniques reviewed, SHAP emerged as the most widely used technique [99,129–132]. A smaller but growing number of studies have applied several explainable AI techniques to understand model behavior from different perspectives [101,118]. For example, this study [138] used two XAI methods, Grad-CAM to visualize class-specific regions, and Deep SHAP to highlight pixel contributions to the prediction, which helps explain why a lesion was classified as malignant or benign.
Despite the importance of multimodal learning in improving diagnostic performance, a few studies have applied explainable AI techniques. Performance typically improves when fusion is involved, with an accuracy gain from +5% to +10% in multimodal vs. unimodal. Several studies have used XAI methods in breast cancer diagnosis; however, they relied on a single modality. The selection of an appropriate XAI technique depends on the type of data and the stage of integration into diagnostic systems. For example, image-based data relies on visual explanation methods such as heat maps, while clinical data relies on feature attribution methods. Most studies applied explanation techniques separately to each type of data, indicating a research gap regarding the development of standardized explanation techniques that apply to the fused representation, thus providing a comprehensive explanation that clarifies how patterns interact and increases confidence in clinical settings.
Despite the importance of XAI evaluation, it is not widely used in most studies [149]. However, these evaluations have not been comprehensive. In addition, previous studies evaluating XAI methods have relied on medical images only. The results of analyzing previous studies indicate that the failure to apply explanation evaluation in multimodal systems is due to several reasons:
1. The absence of unified standards; there is no unified definition of “good explanation.”
2. The difficulty of experimental implementation; this requires significant time and resources.
3. The complexity of multi-modality data; when data is diverse, it can be challenging to evaluate.
These limitations highlight the need to standardize explanation evaluation methods to achieve greater integration.
6.4 Practical Implications for Healthcare Adoption
The reviewed multimodal fusion and XAI models have significant potential in real-world healthcare workflows. For example, in radiology, these models serve as a decision support system, identifying suspicious areas in mammograms and correlating them with clinical features to assist radiologists. These models also help identify molecular subtypes of tumors by integrating imaging with genomic data. In addition, multimodal AI systems can analyze clinical history, biomarkers, and imaging patterns to assist in automated treatment recommendations, helping oncologists choose the most effective treatment course. Combining XAI technologies with multimodal data helps these systems remain transparent, interpretable, and aligned with clinician trust and regulatory expectations.
6.5 Limitations and Future Works
Multiple investigations have examined the use of multimodal learning and XAI in breast cancer diagnosis; however, these studies have several limitations:
• Lack of public multimodal datasets:
One major limitation identified across the reviewed studies is the development of standardized, well-annotated multimodal breast cancer datasets. Most studies rely on a single type of data, which narrows the focus to a specific data modality, limiting the generalizability. Integrating multimodal data from various sources will enrich the explanation and make it more accurate and robust. Future work must focus on building collaborative data consortia that enable the sharing of de-identified multimodal datasets under standardized protocols. This will enhance reproducibility and generalizability. In addition, generating synthetic data and applying federated learning approaches appear to be promising strategies to reduce the problem of data scarcity while at the same time preserving patient privacy.
• Limited analysis and challenges of fusion strategy:
Analysis of how different fusion strategies and their timing affect performance and interpretability remains limited. One reason is that many do not explicitly justify their choice of fusion technique or compare different types. The review shows that most works rely on simple concatenation as the main fusion method. This preference is likely due to its ease of use, simple implementation, and flexibility across diverse data modalities. However, depending heavily on concatenation brings important drawbacks. Concatenation simply combines features without modeling cross-modal interactions, and thus often ignores the meaningful connection between imaging, clinical, and molecular data. Such oversimplification can result in weaker performance, especially when inter-modality correlations are crucial for diagnosis. Although a few studies have tested more advanced fusion mechanisms, such as cross-attention, gated fusion, or tensor-based methods, these remain less common. This imbalance highlights a methodological gap, indicating that future work should extend beyond concatenation toward richer fusion strategies that can better capture dependencies across modalities. Therefore, it is important not only to compare different fusion strategies for specific tasks and data types, but also to focus on designing, testing, and validating more sophisticated approaches capable of representing complex multimodal interactions.
• Limitations in performance evaluation metrics
Most of the reviewed studies relied on accuracy or AUC as the main evaluation criteria. Although these measures are widely recognized in the machine learning community, they do not fully capture the clinical value of diagnostic models. For instance, a model with high AUC can still produce an unacceptably high false positive rate, leading to unnecessary biopsies, greater patient anxiety, and increased healthcare costs in real-world practice. Although sensitivity and specificity were sometimes reported, the trade-offs between them and their impact on clinical decision-making were rarely analyzed. This narrow reliance on conventional metrics highlights a critical gap between algorithmic validation and clinical applicability, underlining the need for standardized, comprehensive, and clinically meaningful evaluation frameworks in future research.
• Lack of a unified explanation framework for multimodal data
One of the major challenges identified in this review is the limited adaptation of explanation techniques (XAI) in multi-modal models. In most cases, explanation methods were applied separately to each modality, for example, using Grad-CAM to produce heatmaps of medical images or SHAP to assess the importance of clinical features, without integrating these explanations into a unified framework. This separation makes it difficult for clinicians to understand how different types of data contribute to the final decision and can reduce their confidence in the system. For example, if mammogram images are combined with clinical records, a doctor needs to know whether the decision was based primarily on visual features from the image or on clinical indicators such as age and family history. The absence of such integrated explanations limits the effectiveness of XAI and reduces its acceptance in clinical settings. Future research should therefore focus on the development of multimodal interpretability frameworks that combine visual, clinical, and molecular evidence in a standardized way, clearly showing the weight of each modality in the prediction. This will help improve physician confidence and support clinical decision-making.
Although there is growing interest in combining multimodal learning with explanation techniques, this integration still faces practical difficulties. Some fusion approaches, such as attention-based fusion mechanisms, allow the model to assign appropriate weight across different modalities, while XAI methods such as SHAP or LIME highlight the role of clinical features, and Grad-CAM explain visual patterns in images. Together, these methods can improve transparency but also increase computational complexity and sometimes produce conflicting signals across modalities, which complicates interpretations. Future research should therefore prioritize methodological frameworks that can balance these contributions, resolve conflicting evidence, and present explanations in a clinically meaningful manner.
• Limitations in XAI evaluation standards
Another important limitation is the lack of comprehensive and standardized evaluation metrics for XAI. Many existing assessments rely on subjective or fragmented measures, such as a physician’s comparison to heatmaps or qualitative judgments, which are variable and difficult to reproduce. In addition, most evaluation frameworks are restricted to image-based datasets and do not adequately capture the completeness, fidelity, or clinical usefulness of explanations across modalities. This absence of unified standards makes it difficult to compare results between studies, introduces potential bias in reported outcomes, and limits generalizability. This variability aligns with the risk of bias domains identified in QUADAS-2. In addition, the lack of standardized evaluation metrics undermines the clinical reliability of XAI methods. Hence, future work should develop integrated evaluation frameworks that combine quantitative measures (reliability, stability, and fidelity) with qualitative clinical assessments (clarity and decision support), ensuring both methodological rigor and practical relevance.
• Limited generalizability of multimodal models across diverse healthcare settings and populations.
Many studies were developed and validated using data from a single institution or a limited cohort, raising concerns about how well they generalize to broader clinical environments. Differences in imaging protocols, data completeness, or access to genetic data and clinical records across hospitals and countries can significantly affect model performance. Future work should therefore emphasize strategies to improve generalizability, such as multi-center validation, federated learning frameworks, or the generation of synthetic datasets to overcome data scarcity in underrepresented regions.
This review provides a comprehensive examination of current studies in multimodal learning and an analysis of the explainable AI techniques used. Existing studies have demonstrated the role of multimodal learning in improving performance and diagnostic accuracy. The results showed that choosing the appropriate explanation technique depends on the type of data used. In addition, the choice of data fusion strategy significantly affects interpretability. Despite advancements, there are still gaps related to explainability, a fundamental need in the medical field. Multimodal learning faces several challenges, such as limited multimodal medical datasets and interpretability. In addition, there is no unified method for evaluating explanations. Given the importance of this integrated system in clinical settings, this gap should be addressed in future studies. Therefore, this paper recommends more studies that integrate multimodal learning and XAI techniques in an integrated manner, ensuring that technological advancement aligns with clinical needs.
Acknowledgement: The authors would like to thank King Saud University, and Majmaah University for their valuable support.
Funding Statement: This work was supported by the Deanship of Scientific Research, King Saud University through the Vice Deanship of Scientific Research Chairs, Chair of Pervasive and Mobile Computing.
Author Contributions: The authors confirm contribution to the paper as follows: Conceptualization, Deema Alzamil, Bader Alkhamees and Mohammad Mehedi Hassan; methodology, Deema Alzamil; software, Deema Alzamil; validation, Deema Alzamil, Bader Alkhamees and Mohammad Mehedi Hassan; formal analysis, Deema Alzamil; investigation, Deema Alzamil; resources, Deema Alzamil; data curation, Deema Alzamil; writing—original draft preparation, Deema Alzamil; writing—review and editing, Deema Alzamil, Bader Alkhamees and Mohammad Mehedi Hassan; visualization, Deema Alzamil, Bader Alkhamees and Mohammad Mehedi Hassan; supervision, Bader Alkhamees and Mohammad Mehedi Hassan; project administration, Deema Alzamil, Bader Alkhamees and Mohammad Mehedi Hassan; funding acquisition, Mohammad Mehedi Hassan. All authors reviewed the results and approved the final version of the manuscript.
Availability of Data and Materials: All data generated or analyzed during this study are included in this published article.
Ethics Approval: Not applicable.
Conflicts of Interest: The authors declare no conflicts of interest to report regarding the present study.
Abbreviations
| AUC | Area Under the Curve |
| DensNet | Dense Convolutional Network |
| DL | Deep Learning |
| DNA | Deoxyribo Nucleic Acids |
| LR | Logistic Regression |
| LRP | Layer-wise Relevance Propagation |
| ML | Machine Learning |
| RNA | Ribonucleic Acid |
| SVM | Support Vector Machine |
| VGG | Visual Geometry Group |
| WHO | World Health Organization |
| XAI | Explainable Artificial Intelligence |
Appendix A Electronic Search Strategies: Data last searched: 10 May 2025
Databases: PubMed, Scopus, IEEE Xplore
Filters:
• Language: English
• Publication data: 01 January 2021–30 April 2025
• Article type: Journal Articles, Conference Paper
Appendix A.1 PubMed: Query used:
(“breast cancer”[Title/Abstract] OR “Cancer”[Title/Abstract])
AND
(“multimodal”[Title/Abstract] OR “multi-modal”[Title/Abstract] OR “data fusion”[Title/Abstract])
AND
(“explainable AI”[Title/Abstract] OR “XAI”[Title/Abstract] OR “interpretability”[Title/Abstract] OR “explainability”[Title/Abstract] OR “explainable Artificial Intelligence”)
AND
(“Machine Learning”[Title/Abstract] OR “Deep Learning”[Title/Abstract])
Filters applied:
- Publication date: 01 January 2021–30 April 2025
- Language: English
- Article type: Journal Article, Conference Paper
Results retrieved: 97 records
Appendix A.2 IEEE Xplore: Query used:
(“breast cancer” OR cancer*)
AND
(multimodal OR “multi-modal” OR “data fusion”)
AND
(“explainable AI” OR XAI OR interpretability* OR explainability* OR explainable Artificial Intelligence*)
AND
(“Machine Learning” OR “Deep Learning”)
Filters applied:
- Publication years: 2021–2025
- Language: English
- Content type: Journals, Conferences
Results retrieved: 103 records
Appendix A.3 Scopus: Query used:
TITLE-ABS-KEY (“breast cancer” OR cancer*)
AND
TITLE-ABS-KEY (multimodal OR “multi-modal” OR “data fusion”)
AND
TITLE-ABS-KEY (“explainable AI” OR XAI OR interpretability* OR explainable artificial intelligence*)
AND
TITLE-ABS = KEY (“machine learning” OR “deep learning”)
Filters applied:
- Years: 2021–2025
- Language: English
- Document type: Article, Conference Paper
Results retrieved: 134
Deduplication:
Records from three databases were exported and merged using Mendeley. Duplicate entries were identified based on (title, and year) and removed before the screening process.
References
1. Breast cancer [Internet]. [cited 2025 Nov 1]. Available from: https://www.who.int/news-room/fact-sheets/detail/breast-cancer. [Google Scholar]
2. Loizidou K, Elia R, Pitris C. Computer-aided breast cancer detection and classification in mammography: a comprehensive review. Comput Biol Med. 2023;153(1):106554. doi:10.1016/j.compbiomed.2023.106554. [Google Scholar] [PubMed] [CrossRef]
3. Hussain S, Haider S, Maqsood S, Damaševičius R, Maskeliūnas R, Khan M. ETISTP: an enhanced model for brain tumor identification and survival time prediction. Diagnostics. 2023;13(8):1456. doi:10.3390/diagnostics13081456. [Google Scholar] [PubMed] [CrossRef]
4. Uzun Ozsahin D, Ikechukwu Emegano D, Uzun B, Ozsahin I. The systematic review of artificial intelligence applications in breast cancer diagnosis. Diagnostics. 2023;13(1):45. doi:10.3390/diagnostics13010045. [Google Scholar] [PubMed] [CrossRef]
5. Zhu Z, Wang SH, Zhang YD. A survey of convolutional neural network in breast cancer. Comput Model Eng Sci. 2023;136(3):2127–72. doi:10.32604/cmes.2023.025484. [Google Scholar] [PubMed] [CrossRef]
6. Abdullakutty F, Akbari Y, Al-Maadeed S, Bouridane A, Talaat IM, Hamoudi R. Histopathology in focus: a review on explainable multi-modal approaches for breast cancer diagnosis. Front Med. 2024;11:1450103. doi:10.3389/fmed.2024.1450103. [Google Scholar] [PubMed] [CrossRef]
7. Yuan Y, Savage RS, Markowetz F. Patient-specific data fusion defines prognostic cancer subtypes. PLoS Comput Biol. 2011;7(10):e1002227. doi:10.1371/journal.pcbi.1002227. [Google Scholar] [PubMed] [CrossRef]
8. Chen J, Pan T, Zhu Z, Liu L, Zhao N, Feng X, et al. A deep learning-based multimodal medical imaging model for breast cancer screening. Sci Rep. 2025;15(1):14696. doi:10.1038/s41598-025-99535-2. [Google Scholar] [PubMed] [CrossRef]
9. Yang H, Yang M, Chen J, Yao G, Zou Q, Jia L. Multimodal deep learning approaches for precision oncology: a comprehensive review. Brief Bioinform. 2024;26(1):bbae699. doi:10.1093/bib/bbae699. [Google Scholar] [PubMed] [CrossRef]
10. Li Y, El Habib Daho M, Conze P-H, Zeghlache R, Le Boité H, Tadayoni R, et al. A review of deep learning-based information fusion techniques for multimodal medical image classification. Comput Biol Med. 2024;177(6):108635. doi:10.1016/j.compbiomed.2024.108635. [Google Scholar] [PubMed] [CrossRef]
11. Joshi G, Walambe R, Kotecha K. A review on explainability in multimodal deep neural nets. IEEE Access. 2021;9:59800–21. doi:10.1109/access.2021.3070212. [Google Scholar] [CrossRef]
12. Balve AK, Hendrix P. Interpretable breast cancer classification using CNNs on mammographic images [Internet]. [cited 2025 Nov 1]. Available from: http://arxiv.org/abs/2408.13154. [Google Scholar]
13. Sadeghi Z, Alizadehsani R, Cifci MA, Kausar S, Rehman R, Mahanta P, et al. A review of explainable artificial intelligence in healthcare. Comput Electr Eng. 2024;118(5):109370. doi:10.1016/j.compeleceng.2024.109370. [Google Scholar] [CrossRef]
14. Sharma S, Singh M, McDaid L, Bhattacharyya S. XAI-based data visualization in multimodal medical data. Biorxiv: 664302. 2015. doi: 10.1101/2025.07.11.664302. [Google Scholar] [CrossRef]
15. Nakach FZ, Idri A, Goceri E. A comprehensive investigation of multimodal deep learning fusion strategies for breast cancer classification. Artif Intell Rev. 2024;57(12):327. doi:10.1007/s10462-024-10984-z. [Google Scholar] [CrossRef]
16. Llinas-Bertran A, Butjosa-Espín M, Barberi V, Seoane JA. Multimodal data integration in early-stage breast cancer. Breast. 2025;80(8):103892. doi:10.1016/j.breast.2025.103892. [Google Scholar] [PubMed] [CrossRef]
17. Hussain S, Ali M, Naseem U, Nezhadmoghadam F, Ali Jatoi M, Gulliver TA, et al. Breast cancer risk prediction using machine learning: a systematic review. Front Oncol. 2024;14:1343627. doi:10.3389/fonc.2024.1343627. [Google Scholar] [PubMed] [CrossRef]
18. Mathur A, Arya N, Pasupa K, Saha S, Roy Dey S, Saha S. Breast cancer prognosis through the use of multi-modal classifiers: current state of the art and the way forward. Brief Funct Genomics. 2024;23(5):561–9. doi:10.1093/bfgp/elae015. [Google Scholar] [PubMed] [CrossRef]
19. Lobato-Delgado B, Priego-Torres B, Sanchez-Morillo D. Combining molecular, imaging, and clinical data analysis for predicting cancer prognosis. Cancers. 2022;14(13):3215. doi:10.3390/cancers14133215. [Google Scholar] [PubMed] [CrossRef]
20. Damaševičius R. Explainable artificial intelligence methods for breast cancer recognition. Innov Discov. 2024;1(3):25. doi:10.53964/id.2024025. [Google Scholar] [CrossRef]
21. Pahud de Mortanges A, Luo H, Shu SZ, Kamath A, Suter Y, Shelan M, et al. Orchestrating explainable artificial intelligence for multimodal and longitudinal data in medical imaging. npj Digit Med. 2024;7(1):195. doi:10.1038/s41746-024-01190-w. [Google Scholar] [PubMed] [CrossRef]
22. Karthiga R, Narasimhan K, Thanikaiselvan V, Hemalatha M, Amirtharajan R. Review of AI & XAI-based breast cancer diagnosis methods using various imaging modalities. Multimed Tools Appl. 2025;84(5):2209–60. doi:10.1007/s11042-024-20271-2. [Google Scholar] [CrossRef]
23. Page MJ, McKenzie JE, Bossuyt PM, Boutron I, Hoffmann TC, Mulrow CD, et al. The PRISMA 2020 statement: an updated guideline for reporting systematic reviews. BMJ. 2021;372:n71. doi:10.1136/bmj.n71. [Google Scholar] [PubMed] [CrossRef]
24. Waqas A, Tripathi A, Ramachandran RP, Stewart PA, Rasool G. Multimodal data integration for oncology in the era of deep neural networks: a review. Front Artif Intell. 2024;7:1408843. doi:10.3389/frai.2024.1408843. [Google Scholar] [CrossRef]
25. Kumar S, Rani S, Sharma S, Min H. Multimodality fusion aspects of medical diagnosis: a comprehensive review. Bioengineering. 2024;11(12):1233. doi:10.3390/bioengineering11121233. [Google Scholar] [PubMed] [CrossRef]
26. Abdullakutty F, Akbari Y, Al-Maadeed S, Bouridane A, Talaat IM, Hamoudi R. Towards improved breast cancer detection via multi-modal fusion and dimensionality adjustment. Comput Struct Biotechnol Rep. 2024;1(3):100019. doi:10.1016/j.csbr.2024.100019. [Google Scholar] [CrossRef]
27. Yan R, Zhang F, Rao X, Lv Z, Li J, Zhang L, et al. Richer fusion network for breast cancer classification based on multimodal data. BMC Med Inform Decis Mak. 2021;21(suppl 1):134. doi:10.1186/s12911-020-01340-6. [Google Scholar] [PubMed] [CrossRef]
28. Sunba A, AlShammari M, Almuhanna A, Alkhnbashi OS. An integrated multimodal-based CAD system for breast cancer diagnosis. Cancers. 2024;16(22):3740. doi:10.3390/cancers16223740. [Google Scholar] [PubMed] [CrossRef]
29. Zhao F, Zhang C, Geng B. Deep multimodal data fusion. ACM Comput Surv. 2024;56(9):1–36. doi:10.1145/3649447. [Google Scholar] [CrossRef]
30. Project·TCGA-BRCA [Internet]. [cited 2025 Nov 1]. Available from: https://portal.gdc.cancer.gov/projects/TCGA-BRCA. [Google Scholar]
31. METABRIC [Internet]. [cited 2025 Nov 1]. Available from: https://ega-archive.org/studies/EGAS00000000083. [Google Scholar]
32. Lee RS, Gimenez F, Hoogi A, Miyake KK, Gorovoy M, Rubin DL. A curated mammography data set for use in computer-aided detection and diagnosis research. Sci Data. 2017;4(1):170177. doi:10.1038/sdata.2017.177. [Google Scholar] [PubMed] [CrossRef]
33. Breast Cancer Wisconsin (Diagnostic) [Internet]. [cited 2025 Nov 1]. Available from: https://archive.ics.uci.edu/dataset/17/breast+cancer+wisconsin+diagnostic. [Google Scholar]
34. Aqdar KB, Mustafa RK, Abdulqadir ZH, Abdalla PA, Qadir AM, Shali AA, et al. Mammogram mastery: a robust dataset for breast cancer detection and medical education. Data Brief. 2024;55(1):110633. doi:10.1016/j.dib.2024.110633. [Google Scholar] [PubMed] [CrossRef]
35. Cui C, Li L, Cai H, Fan Z, Zhang L, Dan T, et al. The Chinese mammography database (CMMDan online mammography database with biopsy confirmed types for machine diagnosis of breast. The Cancer Imaging Archive. 2021:1. doi:10.1038/s41597-023-02025-1. [Google Scholar] [PubMed] [CrossRef]
36. Jiao Z, Hu P, Xu H, Wang Q. Machine learning and deep learning in chemical health and safety: a systematic review of techniques and applications. ACS Chem Health Saf. 2020;27(6):316–34. doi:10.1021/acs.chas.0c00075. [Google Scholar] [CrossRef]
37. Sharifani K, Amini M. Machine learning and deep learning: a review of methods and applications [Internet]. [cited 2025 Nov 1]. Available from: https://ssrn.com/abstract=4458723. [Google Scholar]
38. Wang J, Ma Y, Zhang L, Gao RX, Wu D. Deep learning for smart manufacturing: methods and applications. J Manuf Syst. 2018;48(2):144–56. doi:10.1016/j.jmsy.2018.01.003. [Google Scholar] [CrossRef]
39. Hakkoum H, Abnane I, Idri A. Interpretability in the medical field: a systematic mapping and review study. Appl Soft Comput. 2022;117:108391. doi:10.1016/j.asoc.2021.108391. [Google Scholar] [CrossRef]
40. Wang X, Zhao Y, Pourpanah F. Recent advances in deep learning. Int J Mach Learn Cybern. 2020;11(4):747–50. doi:10.1007/s13042-020-01096-5. [Google Scholar] [CrossRef]
41. Nakach FZ, Idri A, Tchokponhoue GAD. Multimodal random subspace for breast cancer molecular subtypes prediction by integrating multi-dimensional data. Multimed Tools Appl. 2025;84(27):32671–703. doi:10.1007/s11042-024-20504-4. [Google Scholar] [CrossRef]
42. Noor MHM, Ige AO. A survey on state-of-the-art deep learning applications and challenges. arXiv:2403.17561. 2024. [Google Scholar]
43. Murty PSRC, Anuradha C, Naidu PA, Mandru D, Ashok M, Atheeswaran A, et al. Integrative hybrid deep learning for enhanced breast cancer diagnosis: leveraging the Wisconsin Breast Cancer Database and the CBIS-DDSM dataset. Sci Rep. 2024;14(1):26287. doi:10.1038/s41598-024-74305-8. [Google Scholar] [PubMed] [CrossRef]
44. Cruz-Ramos C, García-Avila O, Almaraz-Damian JA, Ponomaryov V, Reyes-Reyes R, Sadovnychiy S. Benign and malignant breast tumor classification in ultrasound and mammography images via fusion of deep learning and handcraft features. Entropy. 2023;25(7):991. doi:10.3390/e25070991. [Google Scholar] [PubMed] [CrossRef]
45. Berahmand K, Daneshfar F, Salehi ES, Li Y, Xu Y. Autoencoders and their applications in machine learning: a survey. Artif Intell Rev. 2024;57(2):28. doi:10.1007/s10462-023-10662-6. [Google Scholar] [CrossRef]
46. Mondol RK, Millar EKA, Sowmya A, Meijering E. MM-SurvNet: deep learning-based survival risk stratification in breast cancer through multimodal data fusion. In: Proceedings of the 2024 IEEE International Symposium on Biomedical Imaging (ISBI); 2024 May 27–30; Athens, Greece. doi:10.1109/ISBI56570.2024.10635810. [Google Scholar] [CrossRef]
47. Mustafa E, Jadoon EK, Khaliq-Uz-Zaman S, Ali Humayun M, Maray M. An ensembled framework for human breast cancer survivability prediction using deep learning. Diagnostics. 2023;13(10):1688. doi:10.3390/diagnostics13101688. [Google Scholar] [PubMed] [CrossRef]
48. Liu Y, Liu M, Zhang Y, Sun K, Shen D. A progressive single-modality to multi-modality classification framework for Alzheimer’s disease sub-type diagnosis. In: Machine learning in clinical neuroimaging. Cham: Springer Nature Switzerland; 2024. p. 123–33. doi:10.1007/978-3-031-78761-4_12. [Google Scholar] [CrossRef]
49. Azam KSF, Ryabchykov O, Bocklitz T. A review on data fusion of multidimensional medical and biomedical data. Molecules. 2022;27(21):7448. doi:10.3390/molecules27217448. [Google Scholar] [PubMed] [CrossRef]
50. Huang SC, Pareek A, Seyyedi S, Banerjee I, Lungren MP. Fusion of medical imaging and electronic health records using deep learning: a systematic review and implementation guidelines. npj Digit Med. 2020;3(1):136. doi:10.1038/s41746-020-00341-z. [Google Scholar] [PubMed] [CrossRef]
51. Ailyn D. Multimodal data fusion techniques [Internet]. [cited 2025 Nov 1]. Available from: https://www.researchgate.net/publication/383887675. [Google Scholar]
52. Nazari E, Biviji R, Roshandel D, Pour R, Shahriari MH, Mehrabian A, et al. Decision fusion in healthcare and medicine: a narrative review. mHealth. 2022;8:8. doi:10.21037/mhealth-21-15. [Google Scholar] [CrossRef]
53. Cui C, Yang H, Wang Y, Zhao S, Asad Z, Coburn LA, et al. Deep multimodal fusion of image and non-image data in disease diagnosis and prognosis: a review. Prog Biomed Eng. 2023;5(2):022001. doi:10.1088/2516-1091/acc2fe. [Google Scholar] [PubMed] [CrossRef]
54. Maigari A, XinYing C, Zainol Z. Multimodal deep learning breast cancer prognosis models: narrative review on multimodal architectures and concatenation approaches. J Med Artif Intell. 2025;8:61. doi:10.21037/jmai-24-146. [Google Scholar] [CrossRef]
55. Gonçalves T, Rio-Torto I, Teixeira LF, Cardoso JS. A survey on attention mechanisms for medical applications: are we moving towards better algorithms. arXiv:2204.12406. 2022. [Google Scholar]
56. Bahdanau D, Cho K, Bengio Y. Neural machine translation by jointly learning to align and translate. arXiv:1409.0473. 2014. [Google Scholar]
57. Zadeh A, Chen M, Poria S, Cambria E, Morency L-P. Tensor fusion network for multimodal sentiment analysis. arXiv:1707.07250. 2017. [Google Scholar]
58. Wang Z, Li R, Wang M, Li A. GPDBN: deep bilinear network integrating both genomic data and pathological images for breast cancer prognosis prediction. Bioinformatics. 2021;37(18):2963–70. doi:10.1093/bioinformatics/btab185. [Google Scholar] [PubMed] [CrossRef]
59. Jabeen K, Khan MA, Damaševičius R, Alsenan S, Baili J, Zhang YD, et al. An intelligent healthcare framework for breast cancer diagnosis based on the information fusi on of novel deep learning architectures and improved optimization algorithm. Eng Appl Artif Intell. 2024;137:109152. doi:10.1016/j.engappai.2024.109152. [Google Scholar] [CrossRef]
60. Gunning D, Vorm E, Wang JY, Turek M. DARPA’s explainableAI (XAI) program: a retrospective. Appl AI Lett. 2021;2(4):e61. doi:10.1002/ail2.61. [Google Scholar] [CrossRef]
61. Hugo V, Melo P, Matuzinhos De Moura W. Explainable artificial intelligence: a literature review [Internet]. [cited 2025 Nov 1]. Available from: https://lattes.cnpq.br/6112945170412207. [Google Scholar]
62. Das A, Rad P. Opportunities and challenges in explainable artificial intelligence (XAIa survey. arXiv:2006.11371. 2020. [Google Scholar]
63. Saranya A, Subhashini R. A systematic review of Explainable Artificial Intelligence models and applications: recent developments and future trends. Decis Anal J. 2023;7(5):100230. doi:10.1016/j.dajour.2023.100230. [Google Scholar] [CrossRef]
64. Amann J, Blasimme A, Vayena E, Frey D, Madai VI. Precise4Q consortium. Explainability for artificial intelligence in healthcare: a multidisciplinary perspective. BMC Med Inform Decis Mak. 2020;20(1):310. doi:10.1186/s12911-020-01332-6. [Google Scholar] [PubMed] [CrossRef]
65. Cinà G, Röber T, Goedhart R, Birbil I. Why we do need explainable AI for healthcare. arXiv:2206.15363. 2022. [Google Scholar]
66. Speith T. A review of taxonomies of explainable artificial intelligence (XAI) methods. In: 2022 ACM Conference on Fairness Accountability and Transparency; 2022 Jun 21–24; Seoul, Republic of Korea. p. 2239–50. doi:10.1145/3531146.3534639. [Google Scholar] [CrossRef]
67. Confalonieri R, Coba L, Wagner B, Besold TR. A historical perspective of explainable artificial intelligence. WIREs Data Min Knowl. 2021;11(1):e1391. doi:10.1002/widm.1391. [Google Scholar] [CrossRef]
68. Adeniran AA, Onebunne AP, William P. Explainable AI (XAI) in healthcare: enhancing trust and transparency in critical decision-making. World J Adv Res Rev. 2024;23(3):2447–658. doi:10.30574/wjarr.2024.23.3.2936. [Google Scholar] [CrossRef]
69. Abas Mohamed Y, Ee Khoo B, Shahrimie Mohd Asaari M, Ezane Aziz M, Rahiman Ghazali F. Decoding the black box: explainable AI (XAI) for cancer diagnosis, prognosis, and treatment planning-a state-of-the art systematic review. Int J Med Inform. 2025;193:105689. doi:10.1016/j.ijmedinf.2024.105689. [Google Scholar] [PubMed] [CrossRef]
70. Loh HW, Ooi CP, Seoni S, Barua PD, Molinari F, Acharya UR. Application of explainable artificial intelligence for healthcare: a systematic review of the last decade (2011–2022). Comput Meth Programs Biomed. 2022;226:107161. doi:10.1016/j.cmpb.2022.107161. [Google Scholar] [PubMed] [CrossRef]
71. Sheu RK, Pardeshi MS. A survey on medical explainable AI (XAIrecent progress, explainability approach, human interaction and scoring system. Sensors. 2022;22(20):8068. doi:10.3390/s22208068. [Google Scholar] [PubMed] [CrossRef]
72. Ribeiro MT, Singh S, Guestrin C. “Why should I trust you?”: explaining the predictions of any classifier. In: Proceedings of the 22nd ACM SIGKDD International Conference on Knowledge Discovery and Data Mining; 2016 Aug 13–17; San Francisco, CA, USA. p. 1135–44. doi:10.1145/2939672.2939778. [Google Scholar] [CrossRef]
73. Misheva BH, Osterrieder J, Hirsa A, Kulkarni O, Lin SF. Explainable AI in credit risk management. arXiv:2103.00949. 2021. [Google Scholar]
74. Selvaraju RR, Das A, Vedantam R, Cogswell M, Parikh D, Batra D. Grad-CAM: why did you say that? arXiv:1611.07450. 2016. [Google Scholar]
75. Samek W, Wiegand T, Müller K-R. Explainable artificial intelligence: understanding, visualizing and interpreting deep learning models. arXiv:1708.08296. 2017. [Google Scholar]
76. Doshi-Velez F, Kim B. Towards A rigorous science of interpretable machine learning. arXiv:1702.08608. 2017. [Google Scholar]
77. Stassin S, Englebert A, Nanfack G, Albert J, Versbraegen N, Peiffer G, et al. An experimental investigation into the evaluation of explainability methods. arXiv:2305.16361. 2023. [Google Scholar]
78. Nauta M, Trienes J, Pathak S, Nguyen E, Peters M, Schmitt Y, et al. From anecdotal evidence to quantitative evaluation methods: a systematic review on evaluating explainable AI. ACM Comput Surv. 2023;55(13s):1–42. doi:10.1145/3583558. [Google Scholar] [CrossRef]
79. Schwalbe G, Finzel B. A comprehensive taxonomy for explainable artificial intelligence: a systematic survey of surveys on methods and concepts. Data Min Knowl Disc. 2024;38(5):3043–101. doi:10.1007/s10618-022-00867-8. [Google Scholar] [CrossRef]
80. Cheng Z, Wu Y, Li Y, Cai L, Ihnaini B. A comprehensive review of explainable artificial intelligence (XAI) in computer vision. Sensors. 2025;25(13):4166. doi:10.3390/s25134166. [Google Scholar] [PubMed] [CrossRef]
81. Zhang J, Lin Z, Brandt J, Shen X, Sclaroff S. Top-down neural attention by excitation backprop. arXiv:1608.00507. 2016. [Google Scholar]
82. Wang Y, Zhang L, Li Y, Wu F, Cao S, Ye F. Predicting the prognosis of HER2-positive breast cancer patients by fusing pathological whole slide images and clinical features using multiple instance learning. Math Biosci Eng. 2023;20(6):11196–211. doi:10.3934/mbe.2023496. [Google Scholar] [PubMed] [CrossRef]
83. Tupper A, Gagné C. Analyzing data augmentation for medical images: a case study in ultrasound images. arXiv:2403.09828. 2024. [Google Scholar]
84. Atrey K, Singh BK, Bodhey NK. Multimodal classification of breast cancer using feature level fusion of mammogram and ultrasound images in machine learning paradigm. Multimed Tools Appl. 2024;83(7):21347–68. doi:10.1007/s11042-023-16414-6. [Google Scholar] [CrossRef]
85. Ben Rabah C, Sattar A, Ibrahim A, Serag A. A multimodal deep learning model for the classification of breast cancer subtypes. Diagnostics. 2025;15(8):995. doi:10.3390/diagnostics15080995. [Google Scholar] [PubMed] [CrossRef]
86. Arya N, Saha S. Multi-modal advanced deep learning architectures for breast cancer survival prediction. Knowl Based Syst. 2021;221:106965. doi:10.1016/j.knosys.2021.106965. [Google Scholar] [CrossRef]
87. Wang YM, Wang CY, Liu KY, Huang YH, Chen TB, Chiu KN, et al. CNN-based cross-modality fusion for enhanced breast cancer detection using mammography and ultrasound. Tomography. 2024;10(12):2038–57. doi:10.3390/tomography10120145. [Google Scholar] [PubMed] [CrossRef]
88. Arya N, Saha S, Mathur A, Saha S. Improving the robustness and stability of a machine learning model for breast cancer prognosis through the use of multi-modal classifiers. Sci Rep. 2023;13(1):4079. doi:10.1038/s41598-023-30143-8. [Google Scholar] [PubMed] [CrossRef]
89. Othman NA, Abdel-Fattah MA, Ali AT. A hybrid deep learning framework with decision-level fusion for breast cancer survival prediction. Big Data Cogn Comput. 2023;7(1):50. doi:10.3390/bdcc7010050. [Google Scholar] [CrossRef]
90. Awad M, Khanna R. Support vector machines for classification. In: Efficient learning machines. Berkeley, CA, USA: Apress; 2015. p. 39–66. doi:10.1007/978-1-4302-5990-9_3. [Google Scholar] [CrossRef]
91. Holste G, Partridge SC, Rahbar H, Biswas D, Lee CI, Alessio AM. End-to-end learning of fused image and non-image features for improved breast cancer classification from MRI. In: 2021 IEEE/CVF International Conference on Computer Vision Workshops (ICCVW); 2021 Oct 11–17; Montreal, BC, Canada: IEEE; 2021. p. 3287–96. doi:10.1109/ICCVW54120.2021.00368. [Google Scholar] [CrossRef]
92. Kayikci S, Khoshgoftaar TM. Breast cancer prediction using gated attentive multimodal deep learning. J Big Data. 2023;10(1):62. doi:10.1186/s40537-023-00749-w. [Google Scholar] [CrossRef]
93. Ben-Artzi G, Daragma F, Mahpod S. Deep BI-RADS network for improved cancer detection from mammograms. In: Proceedings of the 27th International Conference ICPR 2024; 2024 Dec 1–5; Kolkata, India. doi:10.1007/978-3-031-78104-9_2. [Google Scholar] [CrossRef]
94. AlSalman H, Alfakih T, Al-Rakhami M, Hassan MM, Alabrah A. A genetic algorithm-based optimized transfer learning approach for breast cancer diagnosis. Comput Model Eng Sci. 2024;141(3):2575–608. doi:10.32604/cmes.2024.055011. [Google Scholar] [CrossRef]
95. Rehman A, Mujahid M, Damasevicius R, Alamri FS, Saba T. Densely convolutional BU-NET framework for breast multi-organ cancer nuclei segmentation through histopathological slides and classification using optimized features. Comput Model Eng Sci. 2024;141(3):2375–97. doi:10.32604/cmes.2024.056937. [Google Scholar] [CrossRef]
96. Yang W, Wei Y, Wei H, Chen Y, Huang G, Li X, et al. Survey on explainable AI: from approaches, limitations and applications aspects. Hum Centric Intell Syst. 2023;3(3):161–88. doi:10.1007/s44230-023-00038-y. [Google Scholar] [CrossRef]
97. Holzinger A, Goebel R, Fong R, Moon T, Müller K-R, Samek W. xxAI-beyond explainable AI. In: Proceedings of the International Workshop, Held in Conjunction with ICML 2020; 2020 Jul 18; Vienna, Austria. doi:10.1007/978-3-031-04083-2. [Google Scholar] [CrossRef]
98. Islam T, Sheakh MA, Tahosin MS, Hena MH, Akash S, Bin Jardan YA, et al. Predictive modeling for breast cancer classification in the context of Bangladeshi patients by use of machine learning approach with explainable AI. Sci Rep. 2024;14(1):8487. doi:10.1038/s41598-024-57740-5. [Google Scholar] [PubMed] [CrossRef]
99. Silva-Aravena F, Delafuente HN, Gutiérrez-Bahamondes JH, Morales J. A hybrid algorithm of ML and XAI to prevent breast cancer: a strategy to support decision making. Cancers. 2023;15(9):2443. doi:10.3390/cancers15092443. [Google Scholar] [PubMed] [CrossRef]
100. Suresh T, Assegie TA, Ganesan S, Tulasi RL, Mothukuri R, Salau AO. Explainable extreme boosting model for breast cancer diagnosis. Int J Electr Comput Eng IJECE. 2023;13(5):5764. doi:10.11591/ijece.v13i5.pp5764-5769. [Google Scholar] [CrossRef]
101. Murugan TK, Karthikeyan P, Sekar P. Efficient breast cancer detection using neural networks and explainable artificial intelligence. Neural Comput Appl. 2025;37(5):3759–76. doi:10.1007/s00521-024-10790-2. [Google Scholar] [CrossRef]
102. Dutta M, Mehedi Hasan KM, Akter A, Rahman MH, Assaduzzaman M. An interpretable machine learning-based breast cancer classification using XGBoost, SHAP, and LIME. Bulletin EEI. 2024;13(6):4306–15. doi:10.11591/eei.v13i6.7866. [Google Scholar] [CrossRef]
103. Raha AD, Gain M, Hassan MM, Bairagi AK, Dihan FJ, Adhikary A, et al. Modeling and predictive analytics of breast cancer using ensemble learning techniques: an explainable artificial intelligence approach. Comput Mater Contin. 2024;81(3):4033–48. doi:10.32604/cmc.2024.057415. [Google Scholar] [CrossRef]
104. Alelyani T, Alshammari MM, Almuhanna A, Asan O. Explainable artificial intelligence in quantifying breast cancer factors: Saudi Arabia context. Healthcare. 2024;12(10):1025. doi:10.3390/healthcare12101025. [Google Scholar] [PubMed] [CrossRef]
105. Kontham RR, Kondoju AK, Fouda MM, Fadlullah ZM. An end-to-end explainable AI system for analyzing breast cancer prediction models. In: 2022 IEEE International Conference on Internet of Things and Intelligence Systems (IoTaIS); 2022 Nov 24–26; Bali, Indonesia. p. 402–7. doi:10.1109/IoTaIS56727.2022.9975896. [Google Scholar] [CrossRef]
106. Karimzadeh M, Vakanski A, Xian M, Zhang B. Post-hoc explainability of bi-rads descriptors in a multi-task framework for breast cancer detection and segmentation. In: Proceedings of the 2023 IEEE 33rd International Workshop on Machine Learning for Signal Processing (MLSP); 2023 Sep 17–20; Rome, Italy. doi:10.1109/mlsp55844.2023.10286006. [Google Scholar] [PubMed] [CrossRef]
107. Maouche I, Terrissa LS, Benmohammed K, Zerhouni N. An explainable AI approach for breast cancer metastasis prediction based on clinicopathological data. IEEE Trans Biomed Eng. 2023;70(12):3321–9. doi:10.1109/TBME.2023.3282840. [Google Scholar] [PubMed] [CrossRef]
108. Naas M, Mzoughi H, Njeh I, Ben Slima M. A deep learning based computer aided diagnosis (CAD) tool supported by explainable artificial intelligence for breast cancer exploration [Internet]. [cited 2025 Nov 1]. Available from: https://ssrn.com/abstract=4689420. [Google Scholar]
109. Masud M, Eldin Rashed AE, Hossain MS. Convolutional neural network-based models for diagnosis of breast cancer. Neural Comput Appl. 2022;34(14):11383–94. doi:10.1007/s00521-020-05394-5. [Google Scholar] [PubMed] [CrossRef]
110. Hussain SM, Buongiorno D, Altini N, Berloco F, Prencipe B, Moschetta M, et al. Shape-based breast lesion classification using digital tomosynthesis images: the role of explainable artificial intelligence. Appl Sci. 2022;12(12):6230. doi:10.3390/app12126230. [Google Scholar] [CrossRef]
111. Khater T, Hussain A, Bendardaf R, Talaat IM, Tawfik H, Ansari S, et al. An explainable artificial intelligence model for the classification of breast cancer. IEEE Access. 2023;13(2):5618–33. doi:10.1109/access.2023.3308446. [Google Scholar] [CrossRef]
112. Rhagini A, Thilagamani S. Integration of explainable AI with deep learning for breast cancer prediction and interpretability. Inf Technol Control. 2025;54(2):560–75. doi:10.5755/j01.itc.54.2.39443. [Google Scholar] [CrossRef]
113. Zhang T, Tan T, Han L, Appelman L, Veltman J, Wessels R, et al. Predicting breast cancer types on and beyond molecular level in a multi-modal fashion. npj Breast Cancer. 2023;9(1):16. doi:10.1038/s41523-023-00517-2. [Google Scholar] [PubMed] [CrossRef]
114. Zhang M, Xue M, Li S, Zou Y, Zhu Q. Fusion deep learning approach combining diffuse optical tomography and ultrasound for improving breast cancer classification. Biomed Opt Express. 2023;14(4):1636–46. doi:10.1364/BOE.486292. [Google Scholar] [PubMed] [CrossRef]
115. Manna S, Mistry S, De D. GeneXAI: influential gene identification for breast cancer stages using XAI-based multi-modal framework. Med Nov Technol Devices. 2025;25(1):100349. doi:10.1016/j.medntd.2024.100349. [Google Scholar] [CrossRef]
116. Prananda AR, Frannita EL. Toward better analysis of breast cancer diagnosis: interpretable AI for breast cancer classification. J Res Dev. 2022;7(2):220–7. doi:10.25299/itjrd.2023.11563. [Google Scholar] [CrossRef]
117. Kajala A, Jaiswal S, Kumar R. Breaking the black box: heatmap-driven transparency to breast cancer detection with efficientnet and grad CAM. Educ Admin Theory Pr. 2024;30(5):4999–5009. doi:10.53555/kuey.v30i5.3738. [Google Scholar] [CrossRef]
118. La Ferla M, Montebello M, Seychell D. An XAI approach to deep learning models in the detection of DCIS. In: IFIP International Conference on Artificial Intelligence Applications and Innovations. Cham, Switzerland: Springer Nature; 2023. p. 409–20. doi:10.1007/978-3-031-34171-7_33. [Google Scholar] [CrossRef]
119. Sithakoul S, Meftah S, Feutry C. BEExAI: benchmark to evaluate explainable AI [Internet]. [cited 2025 Nov 1]. Available from: http://arxiv.org/abs/2407.19897. [Google Scholar]
120. Fresz B, Lörcher L, Huber M. Classification metrics for image explanations: towards building reliable XAI-evaluations. In: The 2024 ACM Conference on Fairness Accountability and Transparency; 2024 Jun 3–6; Rio de Janeiro, Brazil. p. 1–19. doi:10.1145/3630106.3658537. [Google Scholar] [CrossRef]
121. Yao Y, Lv Y, Tong L, Liang Y, Xi S, Ji B, et al. ICSDA a multi-modal deep learning model to predict breast cancer recurrence and metastasis risk by integrating pathological, clinical and gene expression data. Brief Bioinform. 2022;23(6):bbac448. doi:10.1093/bib/bbac448. [Google Scholar] [PubMed] [CrossRef]
122. Guo W, Liang W, Deng Q, Zou X. A multimodal affinity fusion network for predicting the survival of breast cancer patients. Front Genet. 2021;12:709027. doi:10.3389/fgene.2021.709027. [Google Scholar] [PubMed] [CrossRef]
123. Lokaj B, Durand de Gevigney V, Djema DA, Zaghir J, Goldman JP, Bjelogrlic M, et al. Multimodal deep learning fusion of ultrafast-DCE MRI and clinical information for breast lesion classification. Comput Biol Med. 2025;188:109721. doi:10.1016/j.compbiomed.2025.109721. [Google Scholar] [PubMed] [CrossRef]
124. Joo S, Ko ES, Kwon S, Jeon E, Jung H, Kim JY, et al. Multimodal deep learning models for the prediction of pathologic response to neoadjuvant chemotherapy in breast cancer. Sci Rep. 2021;11(1):18800. doi:10.1038/s41598-021-98408-8. [Google Scholar] [PubMed] [CrossRef]
125. Hussain S, Ali Teevno M, Naseem U, Betzabeth Avendaño Avalos D, Cardona-Huerta S, Gerardo Tamez-Peña J. Multiview multimodal feature fusion for breast cancer classification using deep learning. IEEE Access. 2024;13:9265–75. doi:10.1109/access.2024.3524203. [Google Scholar] [CrossRef]
126. Bai D, Zhou N, Liu X, Liang Y, Lu X, Wang J, et al. The diagnostic value of multimodal imaging based on MR combined with ultrasound in benign and malignant breast diseases. Clin Exp Med. 2024;24(1):110. doi:10.1007/s10238-024-01377-1. [Google Scholar] [PubMed] [CrossRef]
127. Oyelade ON, Irunokhai EA, Wang H. A twin convolutional neural network with hybrid binary optimizer for multimodal breast cancer digital image classification. Sci Rep. 2024;14(1):692. doi:10.1038/s41598-024-51329-8. [Google Scholar] [PubMed] [CrossRef]
128. Ahmad Wani N, Kumar R, Bedi J. Harnessing fusion modeling for enhanced breast cancer classification through interpretable artificial intelligence and in-depth explanations. Eng Appl Artif Intell. 2024;136(1):108939. doi:10.1016/j.engappai.2024.108939. [Google Scholar] [CrossRef]
129. Chakraborty D. Explainable artificial intelligence reveals novel insight into tumor microenvironment conditions linked with better prognosis in patients with breast cancer [Internet]. [cited 2025 Nov 1]. Available from: https://www.mdpi.com/2072-6694/13/14/3450. [Google Scholar]
130. Moncada-Torres A, van Maaren MC, Hendriks MP, Siesling S, Geleijnse G. Explainable machine learning can outperform Cox regression predictions and provide insights in breast cancer survival. Sci Rep. 2021;11(1):6968. doi:10.1038/s41598-021-86327-7. [Google Scholar] [PubMed] [CrossRef]
131. Rezazadeh A, Jafarian Y, Kord A. Explainable ensemble machine learning for breast cancer diagnosis based on ultrasound image texture features. Forecasting. 2022;4(1):262–74. doi:10.3390/forecast4010015. [Google Scholar] [CrossRef]
132. Massafra R, Fanizzi A, Amoroso N, Bove S, Comes MC, Pomarico D, et al. Analyzing breast cancer invasive disease event classification through explainable artificial intelligence. Front Med. 2023;10:1116354. doi:10.3389/fmed.2023.1116354. [Google Scholar] [PubMed] [CrossRef]
133. Nahid AA, Raihan MJ, Bulbul AA. Breast cancer classification along with feature prioritization using machine learning algorithms. Health Technol. 2022;12(6):1061–9. doi:10.1007/s12553-022-00710-6. [Google Scholar] [CrossRef]
134. Vrdoljak J, Boban Z, Barić D, Šegvić D, Kumrić M, Avirović M, et al. Applying explainable machine learning models for detection of breast cancer lymph node metastasis in patients eligible for neoadjuvant treatment. Cancers. 2023;15(3):634. doi:10.3390/cancers15030634. [Google Scholar] [PubMed] [CrossRef]
135. Liu Y, Fu Y, Peng Y, Ming J. Clinical decision support tool for breast cancer recurrence prediction using SHAP value in cooperative game theory. Heliyon. 2024;10(2):e24876. doi:10.1016/j.heliyon.2024.e24876. [Google Scholar] [PubMed] [CrossRef]
136. Srinivasu PN, Jaya Lakshmi G, Gudipalli A, Narahari SC, Shafi J, Woźniak M, et al. XAI-driven CatBoost multi-layer perceptron neural network for analyzing breast cancer. Sci Rep. 2024;14(1):28674. doi:10.1038/s41598-024-79620-8. [Google Scholar] [PubMed] [CrossRef]
137. Kaplun D, Krasichkov A, Chetyrbok P, Oleinikov N, Garg A, Pannu HS. Cancer cell profiling using image moments and neural networks with model agnostic explainability: a case study of breast cancer histopathological (BreakHis) database. Mathematics. 2021;9(20):2616. doi:10.3390/math9202616. [Google Scholar] [CrossRef]
138. Gerbasi A, Clementi G, Corsi F, Albasini S, Malovini A, Quaglini S, et al. DeepMiCa: automatic segmentation and classification of breast MIcroCAlcifications from mammograms [Internet]. [cited 2025 Nov 1]. Available from: https://ssrn.com/abstract=4173901. [Google Scholar]
139. Cerekci E, Alis D, Denizoglu N, Camurdan O, Seker ME, Ozer C, et al. Quantitative evaluation of Saliency-Based Explainable artificial intelligence (XAI) methods in Deep Learning-Based mammogram analysis. Eur J Radiol. 2024;173:111356. doi:10.1016/j.ejrad.2024.111356. [Google Scholar] [PubMed] [CrossRef]
140. Qian X, Pei J, Han C, Liang Z, Zhang G, Chen N, et al. A multimodal machine learning model for the stratification of breast cancer risk. Nat Biomed Eng. 2025;9(3):356–70. doi:10.1038/s41551-024-01302-7. [Google Scholar] [CrossRef]
141. Binder A, Bockmayr M, Hägele M, Wienert S, Heim D, Hellweg K, et al. Morphological and molecular breast cancer profiling through explainable machine learning Short title: breast cancer profiling by explainable AI [Internet]. [cited 2025 Nov 1]. Available from: https://www.nature.com/articles/s42256-021-00303-4. [Google Scholar]
142. Ghasemi A, Hashtarkhani S, Schwartz DL, Shaban-Nejad A. Explainable artificial intelligence in breast cancer detection and risk prediction: a systematic scoping review. Cancer Innov. 2024;3(5):e136. doi:10.1002/cai2.136. [Google Scholar] [PubMed] [CrossRef]
143. Blagec K, Dorffner G, Moradi M, Samwald M. A critical analysis of metrics used for measuring progress in artificial intelligence [Internet]. [cited 2025 Nov 1]. Available from: https://paperswithcode.com/. [Google Scholar]
144. Rodis N, Sardianos C, Radoglou-Grammatikis P, Sarigiannidis P, Varlamis I, Papadopoulos GT. Multimodal explainable artificial intelligence: a comprehensive review of methodological advances and future research directions [Internet]. [cited 2025 Nov 1]. Available from: http://arxiv.org/abs/2306.05731. [Google Scholar]
145. Terven J, Cordova-Esparza DM, Romero-González JA, Ramírez-Pedraza A, Chávez-Urbiola EA. A comprehensive survey of loss functions and metrics in deep learning. Artif Intell Rev. 2025;58(7):195. doi:10.1007/s10462-025-11198-7. [Google Scholar] [CrossRef]
146. Zhu K, Zheng Y, Chan KCG. Weighted brier score—an overall summary measure for risk prediction models with clinical utility consideration [Internet]. [cited 2025 Nov 1]. Available from: http://arxiv.org/abs/2408.01626. [Google Scholar]
147. Uddin II, Wang L, Santosh K. Expert-guided explainable few-shot learning for medical image diagnosis [Internet]. [cited 2025 Nov 1]. Available from: http://arxiv.org/abs/2509.08007. [Google Scholar]
148. Pfob A, Sidey-Gibbons C, Barr RG, Duda V, Alwafai Z, Balleyguier C, et al. The importance of multi-modal imaging and clinical information for humans and AI-based algorithms to classify breast masses (INSPiRED 003an international, multicenter analysis. Eur Radiol. 2022;32(6):4101–15. doi:10.1007/s00330-021-08519-z. [Google Scholar] [PubMed] [CrossRef]
149. Lopes P, Silva E, Braga C, Oliveira T, Rosado L. XAI systems evaluation: a review of human and computer-centred methods. Appl Sci. 2022;12(19):9423. doi:10.3390/app12199423. [Google Scholar] [CrossRef]
Cite This Article
 Copyright © 2025 The Author(s). Published by Tech Science Press.
This work is licensed under a Creative Commons Attribution 4.0 International License , which permits unrestricted use, distribution, and reproduction in any medium, provided the original work is properly cited.
 Downloads
 Citation Tools