
 Submit a Paper
 Propose a Special lssue
 Open Access
ARTICLE
Numerical Exploration on Load Transfer Characteristics and Optimization of Multi-Layer Composite Pavement Structures Based on Improved Transfer Matrix Method
1 School of Civil Engineering and Mechanics, Lanzhou University, Lanzhou, 730000, China
2 Key Laboratory of Mechanics on Disaster and Environment in Western China, Ministry of Education, Lanzhou University, Lanzhou, 730000, China
3 School of Civil Engineering, Central South University, Changsha, 410075, China
4 School of Civil Engineering, City University of Hong Kong, Hong Kong, 999077, China
* Corresponding Authors: Hua-Ping Wang. Email: ; Ping Xiang. Email:
(This article belongs to the Special Issue: Advances in Numerical Modeling of Composite Structures and Repairs)
Computer Modeling in Engineering & Sciences 2025, 145(3), 3165-3195. https://doi.org/10.32604/cmes.2025.072750
Received 02 September 2025; Accepted 21 November 2025; Issue published 23 December 2025
 View Full Text
 Download PDF
Abstract
Transportation structures such as composite pavements and railway foundations typically consist of multi-layered media designed to withstand high bearing capacity. A theoretical understanding of load transfer mechanisms in these multi-layer composites is essential, as it offers intuitive insights into parametric influences and facilitates enhanced structural performance. This paper employs an improved transfer matrix method to address the limitations of existing theoretical approaches for analyzing multi-layer composite structures. By establishing a two-dimensional composite pavement model, it investigates load transfer characteristics and validates the accuracy through finite element simulation. The proposed method offers a straightforward analytical approach for examining internal interactions between structural layers. Case studies indicate that the concrete surface layer is the main load-bearing layer for most vertical normal and shear stresses. The soil base layer reduces the overall mechanical response of the substructure, while horizontal actions increase the risk of interfacial slip and cracking. Structural optimization analysis demonstrates that increasing the thickness of the concrete surface layer, enhancing the thickness and stiffness of the soil base layer, or incorporating gradient layers can significantly mitigate these risks of interfacial slip and cracking. The findings of this study can guide the optimization design, parameter analysis, and damage prevention of multi-layer composite structures.Keywords
With the continuous development of the global economy and the expansion of the transportation scale, the importance of pavements has become more and more prominent as an infrastructure that carries important functions such as the movement of people and the transportation of goods. Multi-layer pavements, i.e., asphalt and cement concrete pavements, have unique advantages of structural performance, which occupy a pivotal position in the field of highway construction today. Composite pavement structures, owing to their high strength, stability and durability, have been extensively deployed across global motorway networks. Structural design is evolving towards achieving functional diversity [1–4] and enhancing service performance [5–9], which provides a strong support to meet the growing transportation demand. However, in order to fully play the performance advantages of cement concrete pavements and ensure the long-term stable and reliable operation, it is indispensable to analyze their mechanical response deeply. It provides a solid scientific basis for reasonably determining the thickness of the pavement structural layer, selecting the appropriate material strength grade and material composition and many other key design parameters [10,11].
The load transfer problem of multi-layer media structures is of great research value in the field of road engineering. In the process of load transfer from the pavement surface to the subgrade, the interaction of each layer of the medium and the load transformation and distribution are directly related to the bearing capacity, service life and overall performance of the pavement [12]. Currently, in the study of load transfer in multi-layer structures, a variety of analytical methods exist and have different emphases. The finite element method (FEM) is one of the most common numerical simulation methods, which is widely used in the load transfer analysis of complex multi-layer structures by virtue of its strong adaptability to geometrical and material properties [13–15]. For example, Wang et al. investigated the structural mechanical response under non-uniform pavement contact stresses by using the FEM, which showed that the shear stress at the tire-pavement interface affects the peak stress response of the surface layer, proving that shear stress plays an important role in controlling the development of rutting and longitudinal cracks [16]. Zhang et al. used the FEM software ANSYS to model pavements with cracks and verified that the geometric characteristics of the existing cracks have a significant effect on the location of the boundary load and the peak stress intensity factor of the pavement surface of the retrofitted pavement [17]. Zhu et al. proposed QCQ4, a finite element model capable of simulating interface defects in multilayer media, to evaluate interface defects [18]. Giffin et al. proposed an 8-node laminated solid hexahedral finite element model, which can be discretized into any number of independent material layers to accurately simulate the laminated composite structure and effectively mitigate various types of locking phenomena [19]. In addition to the FEM mentioned above, experimental investigation is also a key method to study the load transfer of pavement structures, which directly obtains the structural response data under loading through actual testing [20,21]. Wang et al. achieved comprehensive monitoring of the internal response of multi-layer pavement structures by using quasi-distributed and distributed optical fiber sensors. The monitoring data demonstrated that the M-shaped strain profile induced by the structure under heavy vehicle loading could be recovered in about 30 min after unloading [22]. Additionally, the mechanical response of different layers of cement concrete pavement structures under temperature and vehicle loading was monitored over time by using FBG sensors [23]. Although the FEM can simulate complex structures and boundary conditions, it has high computational costs and relies on meshing quality, which may introduce errors. The experimental method can directly obtain the real data, but the cost is high, limited by the environment and difficult to comprehensively cover a variety of working conditions. In this context, the introduction of theoretical analytical methods is essential. For instance, Liu et al. demonstrated that interval analysis and uncertainty modeling can effectively handle the randomness and errors in load signals, providing a more robust foundation for fatigue life estimation under uncertain loading conditions [24].
Based on the above limitations, the introduction of the theoretical analytical method is essential. It can provide accurate theoretical results and provide a solid mathematical foundation and a reliable means of verification for the study of load transfer in pavement structures. At present, many scholars have carried out research on the mechanical response of elastic media subjected to loading. For example, Boussinesq derived the stress and displacement response of an isotropic semi-infinite elastomer under the action of a concentrated vertical force on a surface in 1885, which is known as the Boussinesq solution. In addition, Mindlin in 1936 solved the displacement and stress response of an elastic semi-infinite body at an arbitrary position inside under the action of horizontal and vertical concentrated forces [25]. However, since it is only applicable to elastomers composed of the same medium, most engineering structures are composed of multi-layer media, so the analytical solution has a certain limitation. Therefore, many scholars have studied the mechanical response of multi-layer medium structures. Nowadays, there are many methods to study the mechanical response of multi-layer elastic medium structures, and the commonly used ones are the stiffness matrix method, propagation matrix method, transfer matrix method, fine integration method, analytic layer element method, etc. For example, Pan proposed an efficient and accurate calculation method for multi-layer transverse anisotropy based on the propagation matrix method. The method can obtain highly accurate Green’s functions with fewer Gaussian integration points, while clearly showing the effects of material layering and anisotropy on the displacement and stress response [26]. Ai et al. investigated the exact solution of the response of a multi-layer transversely oriented isotropic medium under a vertical rectangular moving load using the extended fine integration method, and discussed the effects of transverse isotropic, anisotropic permeability, medium layering and moving load velocity on the dynamic response of the medium [27]. Ba et al. investigated the steady state dynamic response of transversely oriented isotropic multi-layer semi-infinite elastomers under the action of concentrated force and pore pressure moving at a constant velocity by using the dynamic stiffness matrix method. Based on this, the effects of permeability, surface drainage conditions, and moving velocity on the response results were analyzed [28]. Ai et al. used the analytic layer element method in column coordinates with the help of Hankel transform and Fourier series expansion to obtain an analytic layer element solution for the thermo-mechanical problem of multi-layer thermoelastic media in a non-axisymmetric problem and analyzed the sensitivity of the media parameters [29]. Additionally, the response of a three-dimensional transverse-view isotropic multi-layer foundation under external loading is solved by the analytical layer element method, and the effect of layering on foundation deformation is analyzed [30].
Compared with the above solution methods, the transfer matrix method has significant advantages in dealing with multi-layer structures, complex boundary conditions, frequency response analysis, etc. It is computationally efficient, physically meaningful and intuitive, and is more widely used. For example, Nam et al. used the transfer matrix method to convert the stiffness matrix into a transfer matrix, which resulted in a significant reduction in the degrees of freedom and a more accurate mechanical response solution for a non-asymmetrically loaded cylindrical storage box on an elastic foundation [31]. Ai et al. used the transfer matrix method to generalize the Sneddon and Muki solution to solve the mechanical response of a multi-layer elastic medium under a static elastic mechanics problem by using the Hankel transform, and solved to obtain the mechanical response under external and internal loads [32]. Furthermore, Chen applied the transfer matrix method to the numerical solution of thick-walled cylinders made with functional gradient materials, providing an effective and accurate way to solve multi-layer cylindrical structures [33].
Based on the load transfer law of multi-layer medium structure to deeply carry out the mechanical analysis of the pavement structure, it is essential to provide more targeted and forward-looking theoretical support for disease prevention. Wang et al. demonstrated through FEM simulations that apart from vertical stresses on the contact surface, tire braking also generates tangential shear stresses on the surface layer of the pavement, leading to increased deterioration of the pavement structure [34]. Jia et al. obtained the interlayer mechanical response under loading by establishing a local and global finite element model for pavement structures. It was demonstrated that the presence of horizontal shear in the pavement significantly exacerbated the interfacial shear damage, leading to interlayer bond failure with crescent-shaped cracks [35]. Li et al. used damage mechanics theory and FEM to show that cement concrete base layers under loading will crack and crack expansion with repeated tensile action [36]. Sawant and Patil analyzed the load-structure interaction through the FEM and validated the effect of structural layer thickness as well as material modulus on the overall mechanical response of the structure [37,38]. Wang et al. monitored multi-layer structures by using FBG sensors and verified that interface defects in multi-layer structures caused deformation transmission losses, reducing the service performance of the structures [39]. At present, the theoretical research on the mechanical response of rigid pavement structures is mostly focused on finite element solutions. In addition, the research on the disease mechanism of pavement structure is also carried out through finite element simulation with less theoretical foundation.
Therefore, this paper will theoretically investigate the mechanical response of multi-layer cement concrete pavement structure by using the transfer matrix method to explore the distribution principle of the stress fields in each layer of the structure under the combination of compression and shear actions. Accuracy and feasibility of the theoretical solution results have been validated through the FEM. The structural damage mechanism is investigated based on the changing law of mechanical response under different load combination conditions. In contrast to the experimental “operational modal” approach, which requires a long-term environmental response to invert the structural performance, the analytical-numerical approach allows the optimal design of the structure to be carried out directly at the design stage [40,41]. The multi-objective optimization ideas provide a direct reference for the optimal design of the materials in this study [42]. Therefore, three structural optimization methods are proposed through the study of the damage mechanism to satisfy with different engineering needs.
2 Theoretical Analysis on Load Transfer Characteristics of Multi-Layer Composite Structures
2.1 Analytical Model Description
As the loads on the pavement structure under the action of vehicles are mainly in the vertical and horizontal directions, the internal response of the structure is concentrated in the vertical section, and its main deformation is concentrated in the vertical and traffic direction. Therefore, to simplify the calculation process, this paper adopts the plane strain problem for research, and the simplified model of the structure is shown in Fig. 1. Assume that the number of layers of the structure is
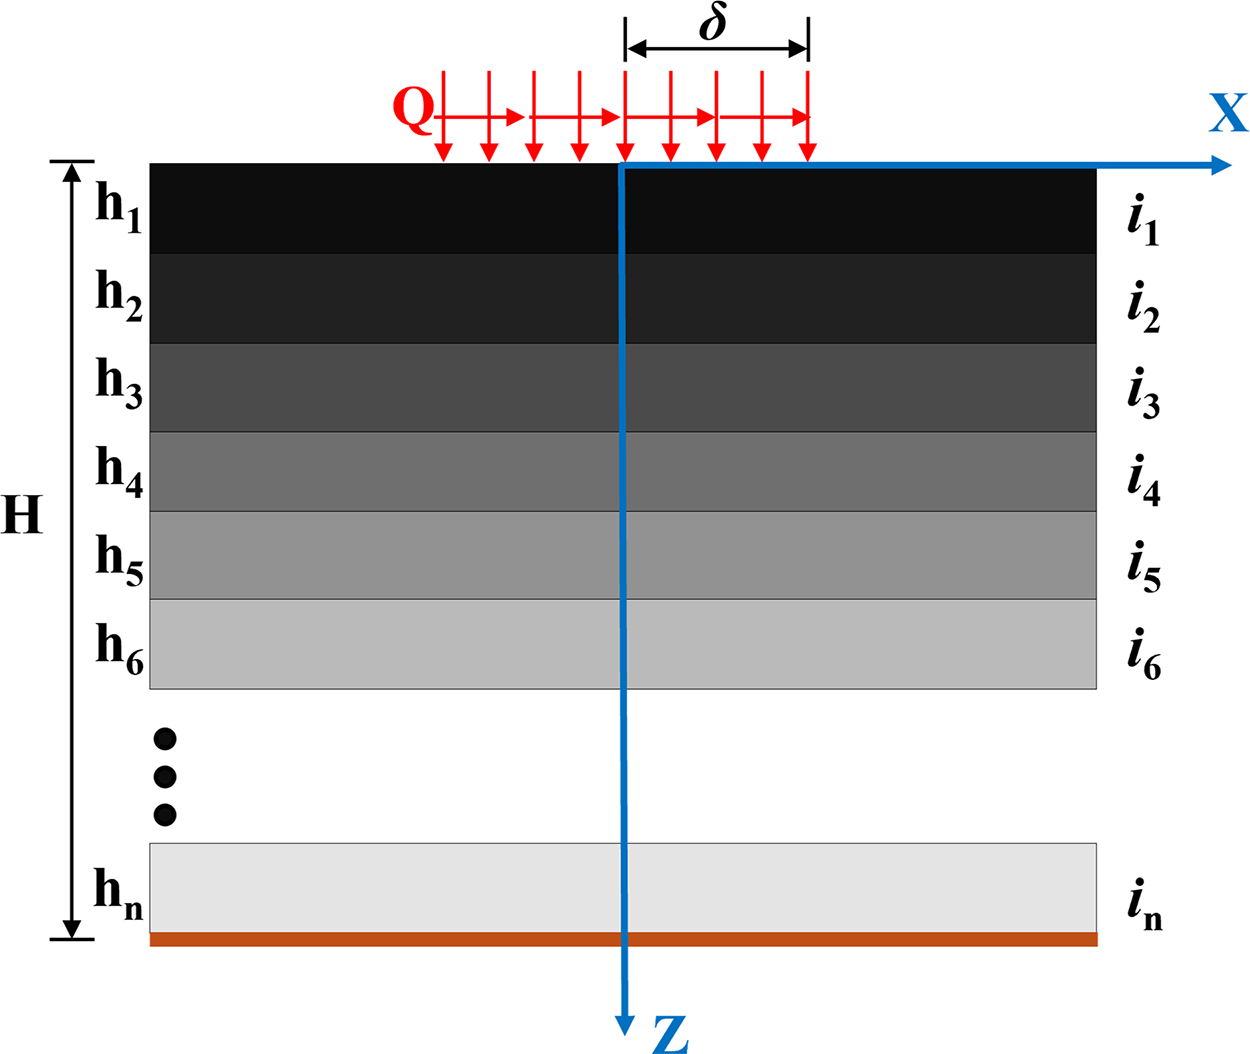
Figure 1: Theoretical model of multi-layer pavement structure
The following assumptions are made for the above simplified model: (a) all layers are isotropic; (b) only consider the elastic properties of the material; (c) the layers are continuous without any dehiscence; (d) the physical forces in the layers are not considered; (e) the model is infinite in the x-direction. Theoretical analysis of the load response of the structure is carried out under the above assumptions.
Since the theoretical part of this paper adopts the transfer matrix method for solving the internal stress field of multi-layer media under loading, a primary analysis is carried out for a single layer. The displacement-based governing equations and stress-displacement equations for the single-layer medium are established:
where,
where,
There exists a second-order differential equation about displacement for the control equation in the transform domain shown in Eq. (3), which is downgraded to simplify the computation. The following vector matrix for displacement is constructed:
The following equation can be obtained by combining Eqs. (3) and (5):
where the matrix of coefficients is shown as below:
Solving Eq. (7) yields:
To solve the matrix exponential function in the above equation, the Laplace transform is introduced:
where the matrix exponential functions
where
Substituting Eq. (12) into Eq. (9) yields
Aiming at the problem that the traditional transfer matrix method is prone to numerical pathologies with the increasing layers, the analytic matrix exponential solving strategy under the Laplace domain is introduced. By firstly reducing the order of the control equations of a single layer and constructing a 4 × 4 state vector, and then using Laplace inverse transformation to obtain the explicit matrix exponentials, the accumulation of numerical errors caused by directly powering the higher-order matrices is avoided. Compared with the classical transfer matrix method, this method ensures the computational stability of the deep pavement structure in the system of more than 10 layers.
Based on the constraints of the boundary conditions at the surface and bottom of the structure as well as the interlayer conditions of the multi-layer structure, vector matrix containing displacements and stresses is established:
Associating Eqs. (3), (5) and (14) gives the vector matrix relation expressed in terms of displacements:
where the coefficient matrices
here the transfer matrix dimension is reduced by solving
By making
Combining Eqs. (13), (15) and (17) results in the relation of
The transformation of Eq. (15) results in the relation of
At this point, stress state equation at arbitrary depth of the single-layer medium is established:
where
Based on assumptions about the overall structure, material parameters are defined for each layer of the multi-layer structure.
For the interlayer contact condition as shown in Eq. (23), the matrix of covariate vectors to be solved is mechanically transferred from
where
where
The Fourier transform of the load shown in Eq. (24) results in the following expression for the load in the transformed domain:
Based on the required uniform load expression, the following expression is developed to solve for
where
Based on the above overall state vector equations, the specific state vector matrices for the surface and bottom of the structure can be obtained, and the state vectors in the transform domain at any depth location can be solved by the following relation:
After the matrix of state vectors at any depth in the above transformation domain is solved, the state vectors at any depth can be obtained by performing the following Fourier inverse transformation.
In the process of transform domain-space domain conversion, the traditional practice usually adopts a double Fourier transform and then inverts it at one time, and the computational volume rises sharply with the mesh density. In this paper, the Fourier inverse transform is split into a two-step method combining one Fourier inverse transform and one analytic integral, as shown in Eq. (31). This treatment can reduce the solution dimension, which greatly reduces the computation time and improves the efficiency compared with the traditional full integration scheme.
As shown in Fig. 2, it is the specific process of theoretical solution in this paper. Since the above vector matrix to be solved is difficult to obtain an analytical solution due to the complexity of the internal elements after multi-layer transfer, the subsequent matrix solving code is developed by using MATLAB based on the derivation process in the paper. The elements
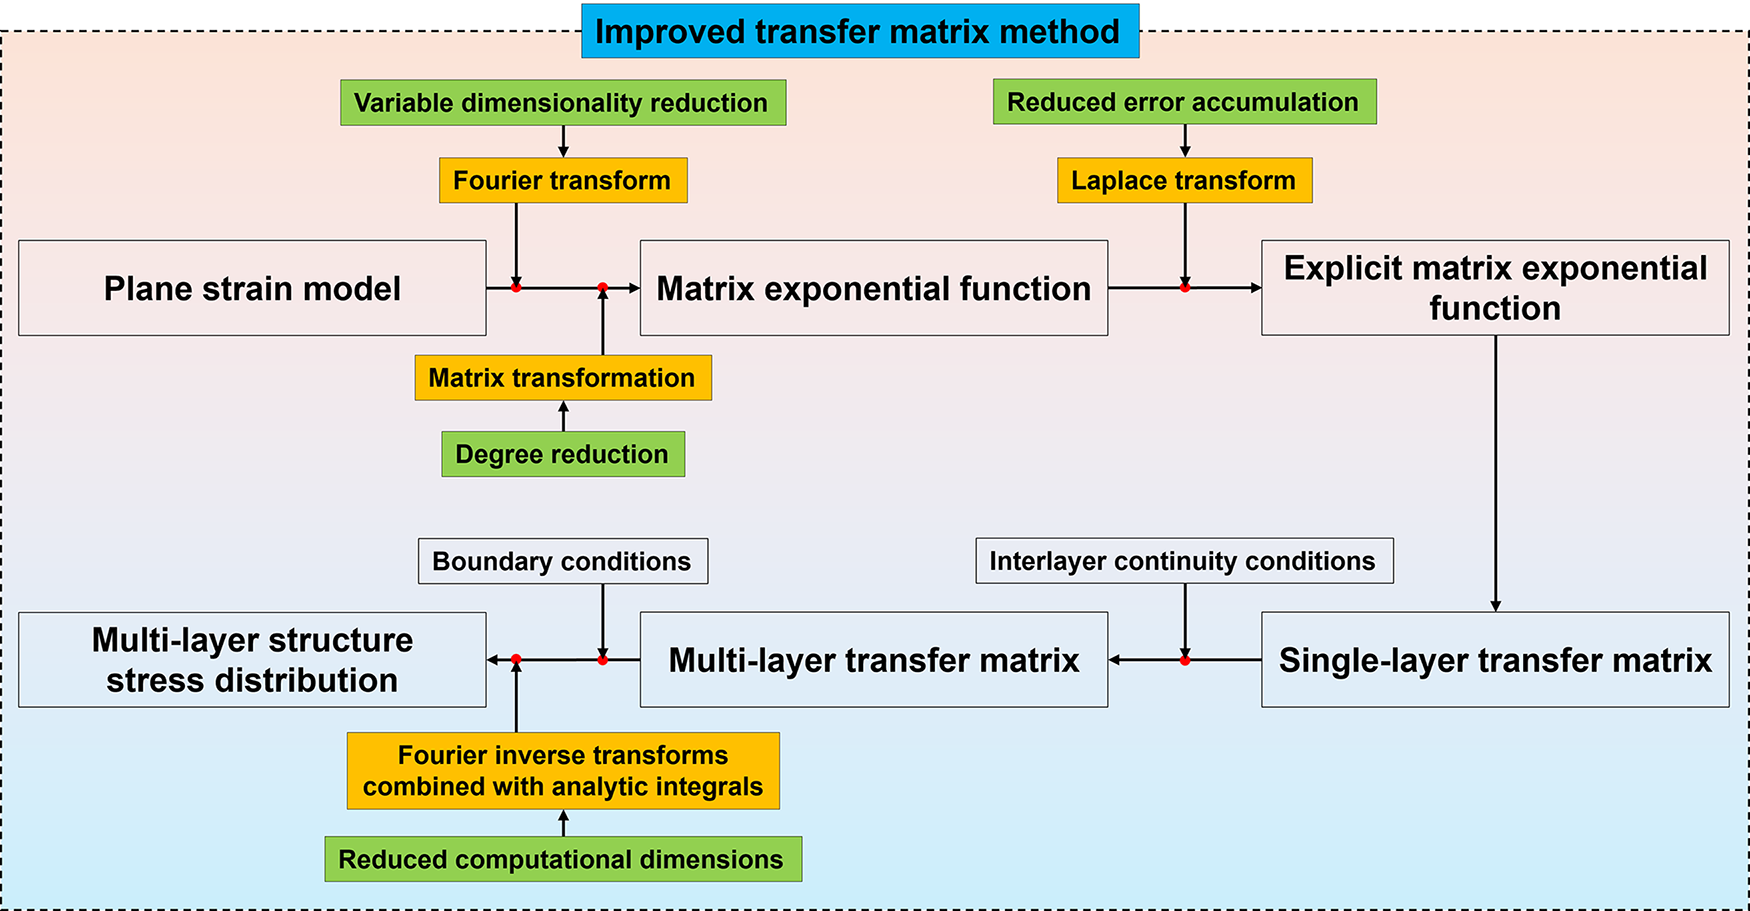
Figure 2: Transfer matrix method for solving the load transfer process of multi-layer structures
Due to the limitations of the above theoretical assumptions, a comparative analysis of the multi-layer medium load transfer solution is carried out by using the FEM to verify the correctness of the theory in solving the internal stress response of the multi-layer pavement structure under the action of surface uniform loads. Subsequently, the internal stress field of the multi-layer structure is investigated based on the theory to explore its distribution law.
3.1 Finite Element Simulation for Validation
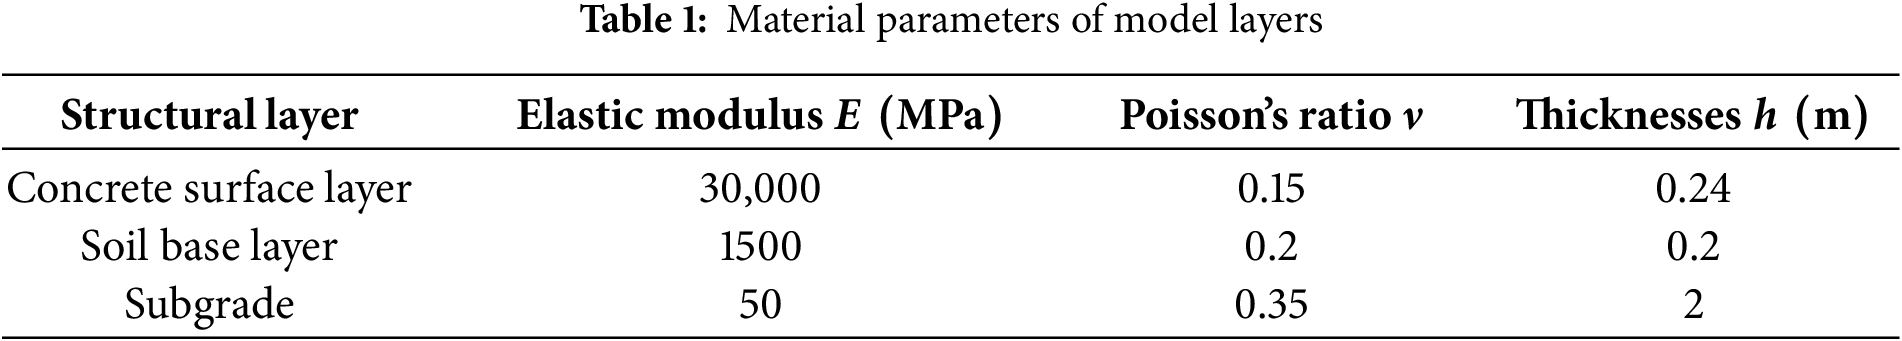
Referring to existing references, the pavement structure model is shown in Fig. 3a, which contains three structural layers with the concrete surface layer, soil base layer, and subgrade from top to bottom [44]. The materials of each structural layer are isotropic. The structural parameters selected are all derived from the actual pavement structure described in this paper. The thickness of each layer and material mechanical parameters are shown in Table 1. The lower surface of the subgrade is fully restrained, and the contact conditions between the layers are set to be completely continuous. A symmetric uniform load
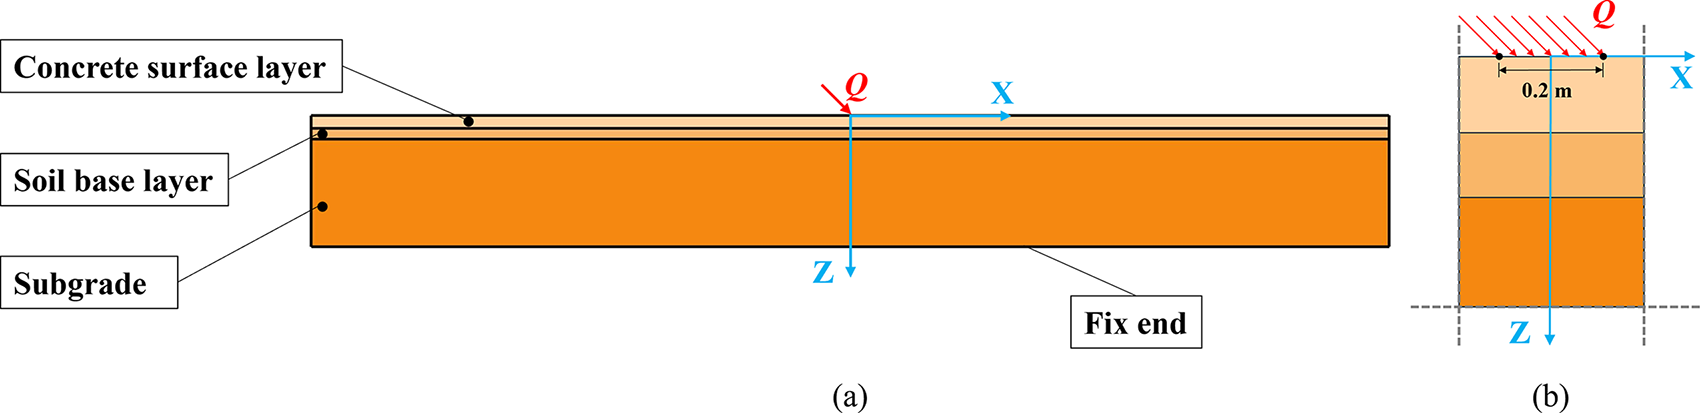
Figure 3: (a) Multi-layer pavement structural model layering; (b) load application diagrams
To comply with the assumption condition of infinity in the horizontal direction in the load transfer theory as well as the efficiency of the model calculation, the horizontal dimension of the model is chosen to be a sufficiently large rectangle in order to eliminate the influence of its dimensions on the results of the calculation of the internal stress field of the structure, which is shown in Fig. 4a. Furthermore, the selection of the model size can accommodate the influence of boundary conditions. Since the internal stress field of the pavement structure is weakened with increasing distance from the load, grid cell encryption is performed near the load application region, as shown in Fig. 4b. The grid cell size is appropriately increased for the part away from the load region to improve the efficiency of finite element calculation. Based on prior research, an analysis of the grid convergence has been conducted, with results indicating that it meets the requirements.
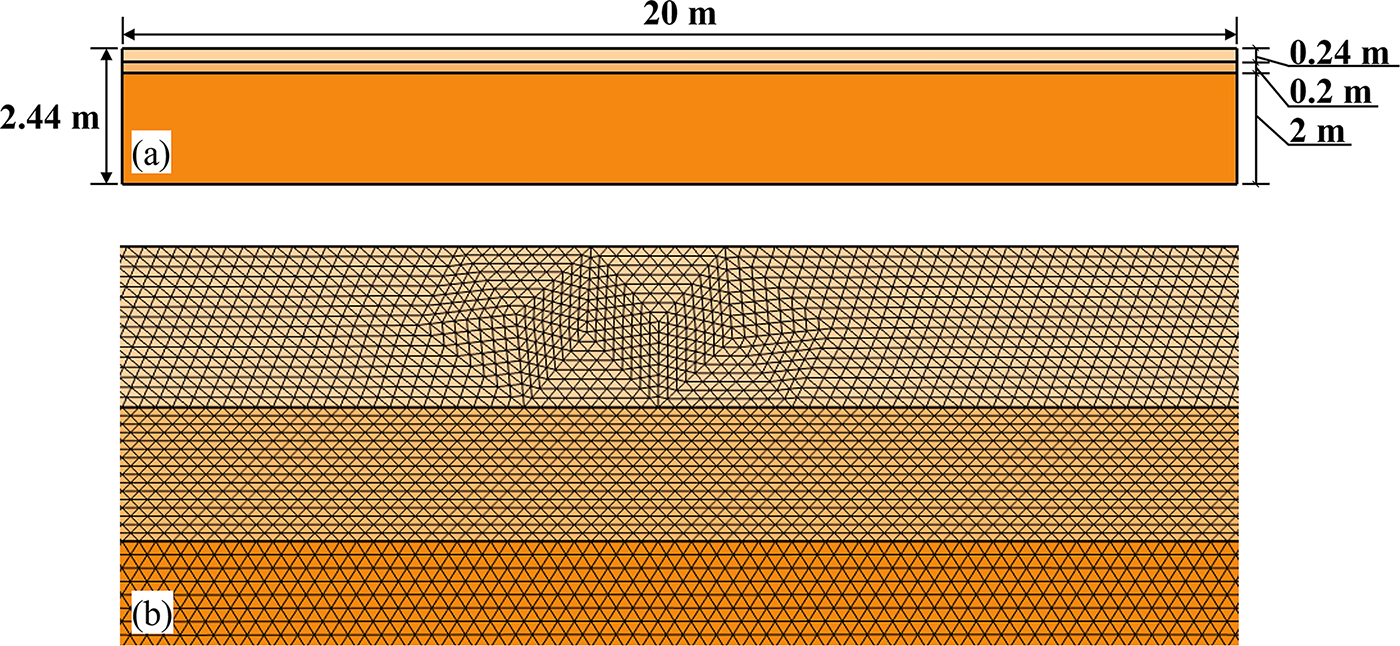
Figure 4: (a) Structural layer thickness; (b) schematic of model mesh partitioning
3.2.1 Vertical Stress Field Distribution
The internal stress response of the finite element model of the three-layer pavement structure under the above horizontal and vertical 1 MPa uniform load conditions is calculated, compared and analyzed with the multi-layer medium load transfer theory proposed in this paper.
As shown in Fig. 5, in order to validate the accuracy of the theory proposed in this paper, this section selects the z-axis below the coordinate origin within the range of the load and the load outside the range of the distance from the axis of 0.3 m at any depth of the vertical normal stresses, horizontal normal stresses and shear stresses for comparison, in order to validate the theory of load transfer and investigate the variation law of the stress field along the vertical direction.
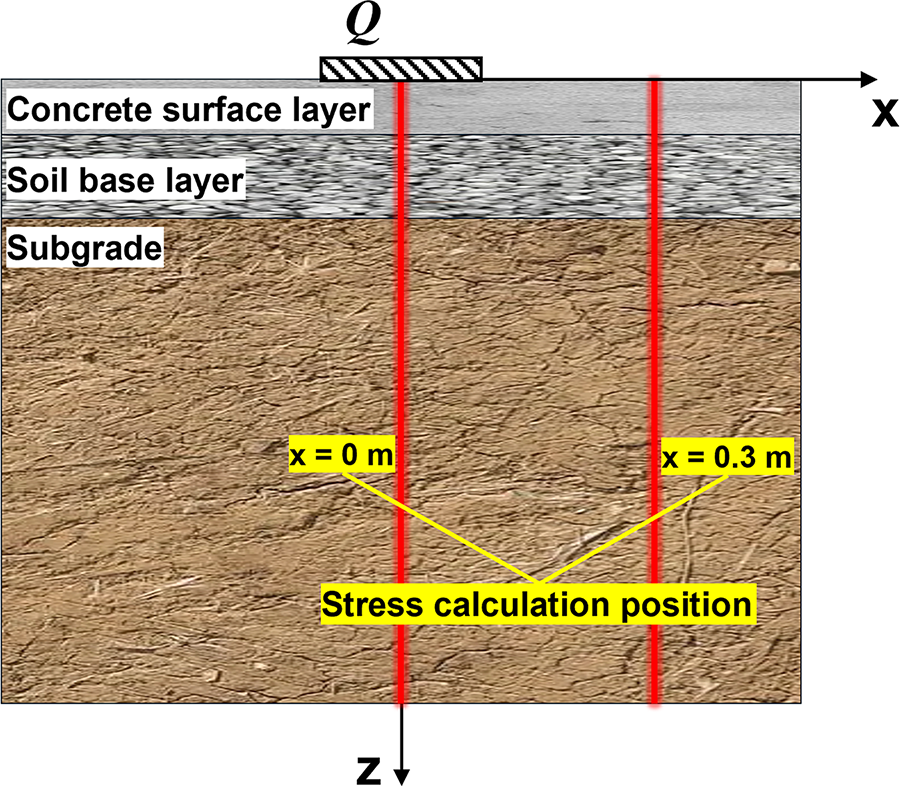
Figure 5: Structural stress calculation position diagram
The structure is subjected to a combination of compression and shear of vertical and horizontal loads, and a comparison of the internal vertical strain results is shown in Fig. 6. By comparing the analytical solution with the simulated solution, it is obvious that the theory proposed in this paper has high accuracy in calculating the internal vertical normal stresses in the multi-layer structure. The results of the vertical normal stresses at different locations and depths shown in Fig. 6 show a high degree of agreement.
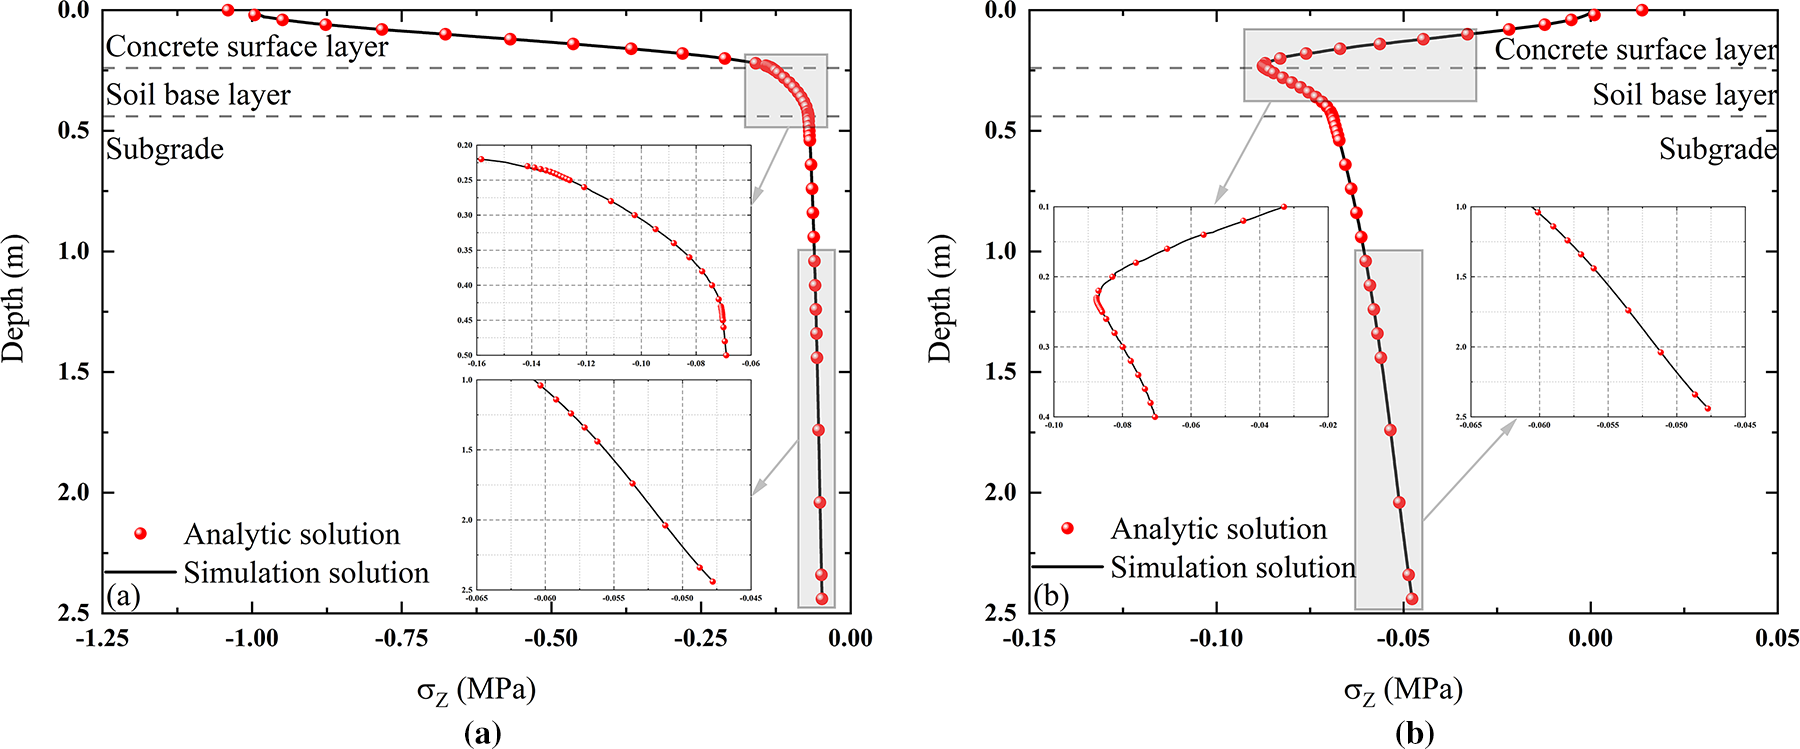
Figure 6: Vertical normal stresses at any depth: (a)
The overall trend of the resultant variation shows that the normal stresses in each layer change approximately linearly, the maximum vertical normal stresses occur in the concrete surface layer, and the overall trend of decreasing is shown below the concrete surface layer. Comparison of Fig. 6a,b shows that the subgrade is in a very low stress state at different locations in the horizontal direction. For concrete surface layer, as the main load-bearing structure, it carries most of the vertical normal stresses. The stress response below the load decreases sharply with depth in the surface layer, while the stress response of the concrete surface layer located outside the load range shows an increasing trend. The soil base layer plays the role of stress transition as an intermediate layer, which continues to weaken and transfer the residual stresses transferred from the upper part to the subgrade surface. It can be seen from the figure that the limitations of the boundary conditions of each layer, as well as the differences in the materials of each layer, lead to the inflection point of the vertical normal stress near the interface delamination. The range of influence of the inflection point on the linear variation of its stress decreases with the increase of the elastic modulus of the material.
Structural internal horizontal normal stress with depth variation as shown in Fig. 7, the concrete surface layer appears alternating law of tensile and compressive variations, the upper part of the structural layer are in compression, and the lower part is in tensile state. Within the constraints of the structure below, the position of its neutral axis is shifted downward away from the center, resulting in an asymmetric horizontal normal stress response of the concrete surface layer along the depth direction. In addition, the peak horizontal tensile stress of the concrete surface layer decreases with the increase of the horizontal distance of the location to be sought from the loaded area. The upper surface of the soil base layer is also in tension due to the stretching of the lower surface of the concrete surface layer and the interlayer continuity condition. Based on the downward transfer of the upper load, the overall horizontal tensile stress of the soil base layer increases with depth, i.e., the whole layer is in a horizontal tensile state. For the subgrade, the weakening effect of the upper structural layer makes the overall response of the layer smaller. The variation of the horizontal normal stress at the interfaces of the structural layers in the figure shows that there is a sudden variation in the response, which is due to the continuity of the displacements of the upper and lower layers and the large difference in the modulus of the materials, resulting in a sudden variation of the stress at the surface of the structural layer with the same strain.
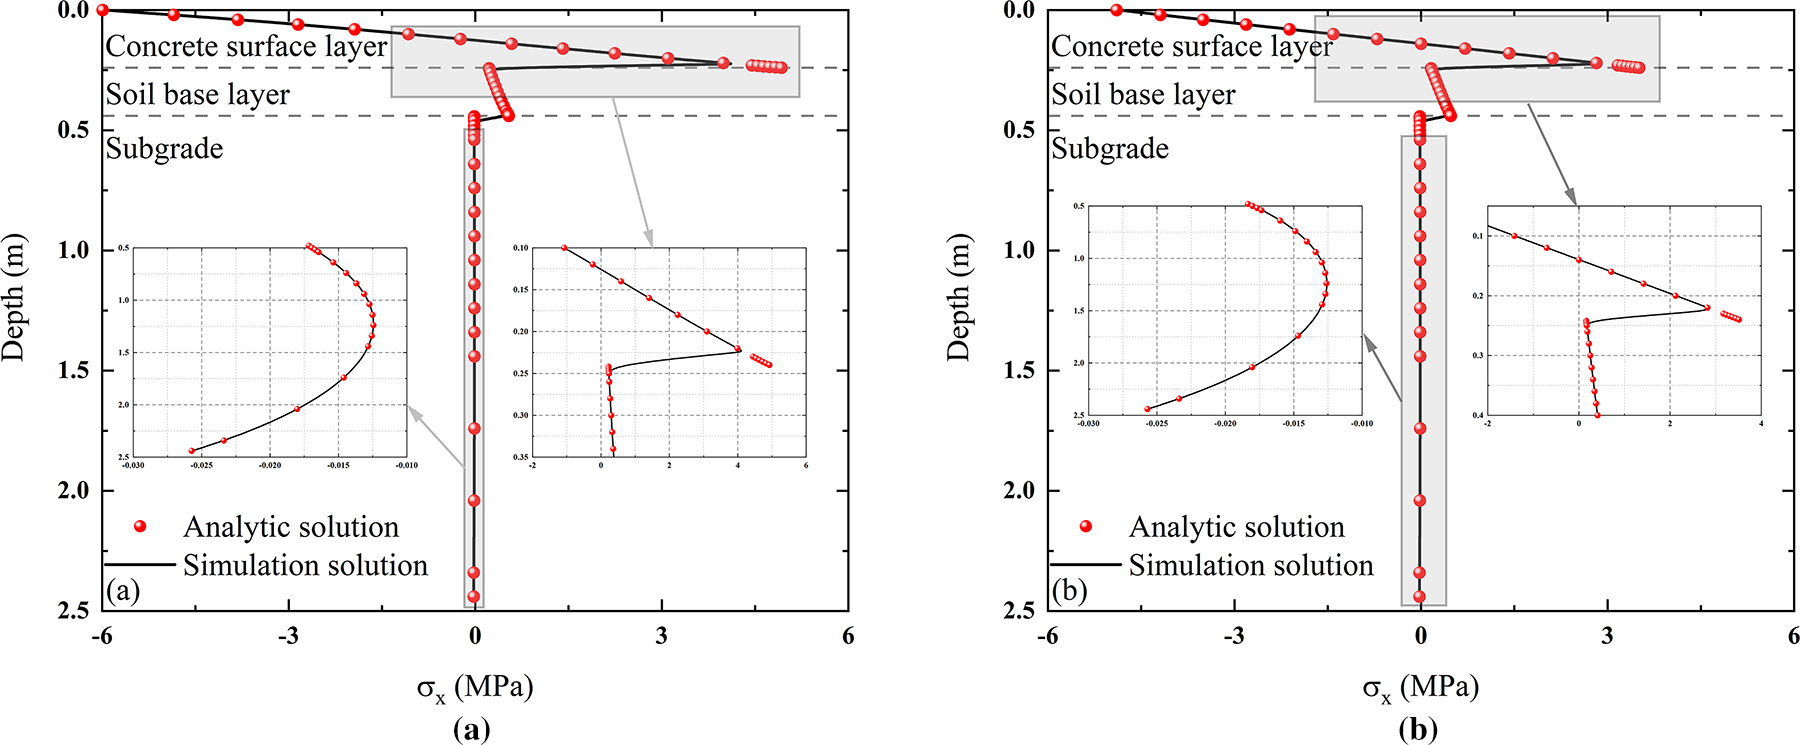
Figure 7: Horizontal normal stress at any depth: (a)
The internal shear stresses within the structure are shown in Fig. 8, and comparing the two resultant graphs it can be seen that the shear stresses in the subgrade are all in the smaller shear stress state, whereas the concrete surface layer is quite different from the soil base layer. For the concrete surface layer shear stress, its trend is more complicated, for the load range of the concrete surface layer shear stress shows a trend of first decreasing and then reverse increase and then decrease. The farther distance from the load shows a tendency of increasing and then decreasing, and there is no shift in direction. Due to the limitation of the soil base layer, the concrete surface layer shear stresses all decrease rapidly near the bottom surface and are transferred to the subgrade after weakening with the help of the soil base layer. The trend of shear stress in each layer in the figure shows that the shear stress attenuation increases with the increase of shear modulus of the structural layer material.
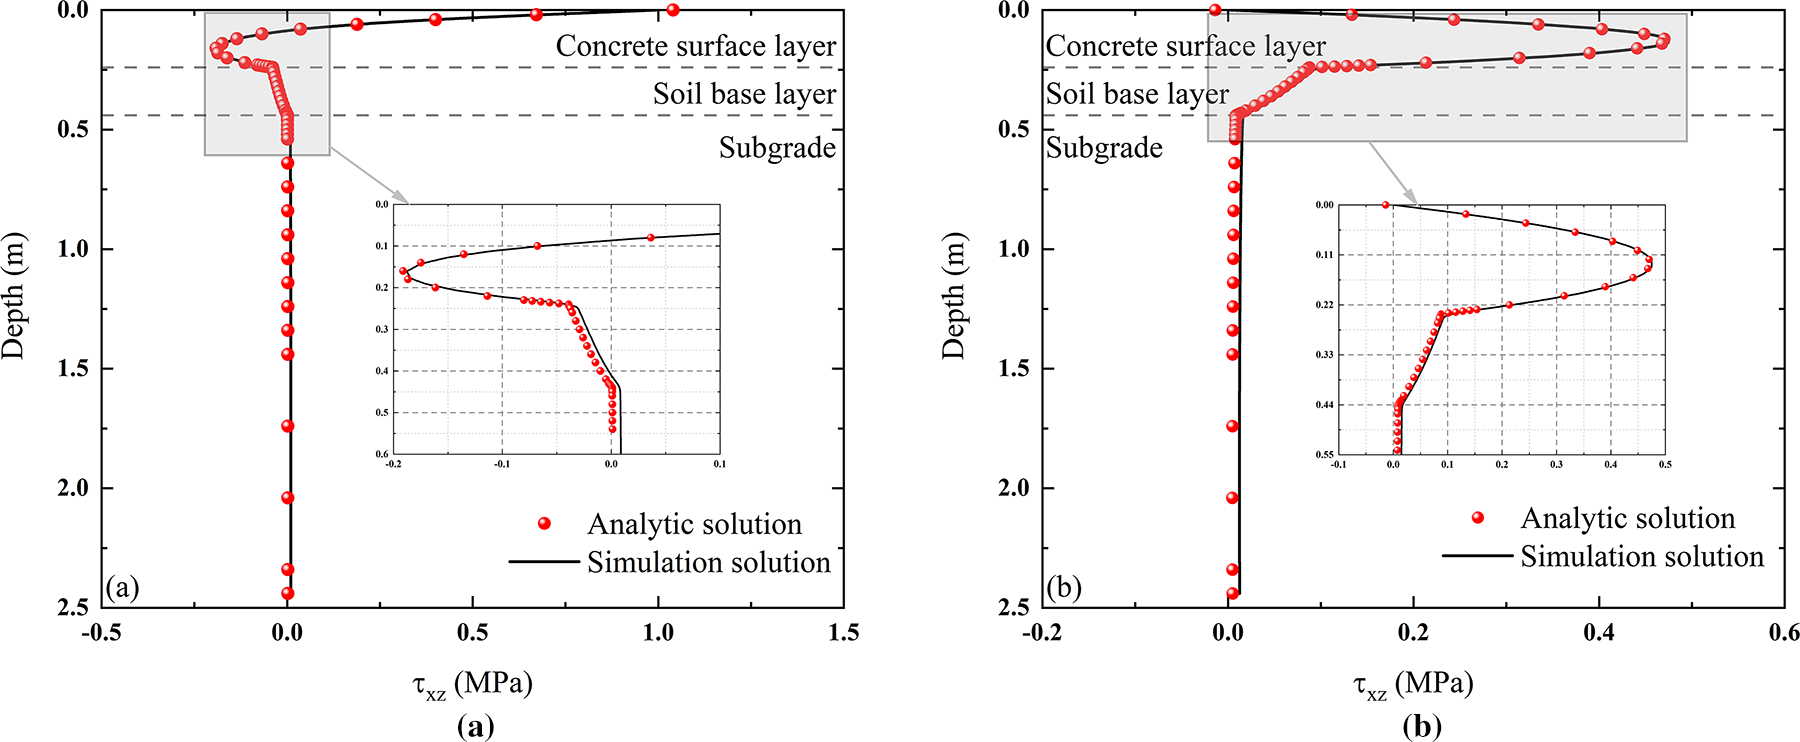
Figure 8: Shear stress at any depth: (a)
Based on the above research on the distribution of mechanical response along the depth direction inside the structure under the action of compression and shear load on the surface of multi-layer medium, it can be summarized as follows: (1) the internal stress response law of the concrete surface layer is more complex than that of the lower structure, and the layer as the main load-bearing layer is greatly weakened by the vertical normal stress and tangential stress, and for the distribution of the horizontal normal stress field along the depth direction, the distribution of the asymmetric phenomenon is presented; (2) the stresses transferred downward from the concrete surface layer decay at a smaller rate approximately linearly in the soil base layer, which acts as a transition layer, transferring a smaller degree of stress to the subgrade; (3) after the concrete surface layer and the soil base layer of weakening effect, the subgrade of three kinds of stress response are very small and the law of variation along the depth of the rule of change is relatively simple, i.e., the soil base layer to the surface of the subgrade mechanical response to the attenuation of the rate is very small.
3.2.2 Horizontal Stress Field Distribution
Since the distribution of stress field along the depth direction of soil base layer and subgrade is relatively simple, both of them show the attenuation law of the stress transmitted to the upper part. While the concrete surface layer along the depth direction of the stress field distribution is more complex, tensile and compressive stress alternation, change trend shift and other complex situations. Therefore, further research should be conducted on the distribution pattern of the internal stress field of the concrete surface layer in the horizontal direction, and compared with the case of only pressure, to investigate the distribution pattern and differences of the internal horizontal stress field under different load conditions.
The specific load conditions are shown in Fig. 9, and the load range is the same as above. The load values in Condition 1 remain unchanged from the preceding section. As the investigation focuses solely on the effect of horizontal loads on the structure, both the horizontal and vertical load components are selected as unit loads of 1 MPa. Based on the above load conditions, the horizontal stress field of the concrete surface layer was solved and plotted using the load transfer theory described in this paper. For Condition 1, horizontal distribution solutions were calculated at six depths (0, 0.05, 0.1, 0.15, 0.2, 0.24 m). For Condition 2, horizontal distribution solutions were calculated at two depths (0.05, 0.2 m) for reference.
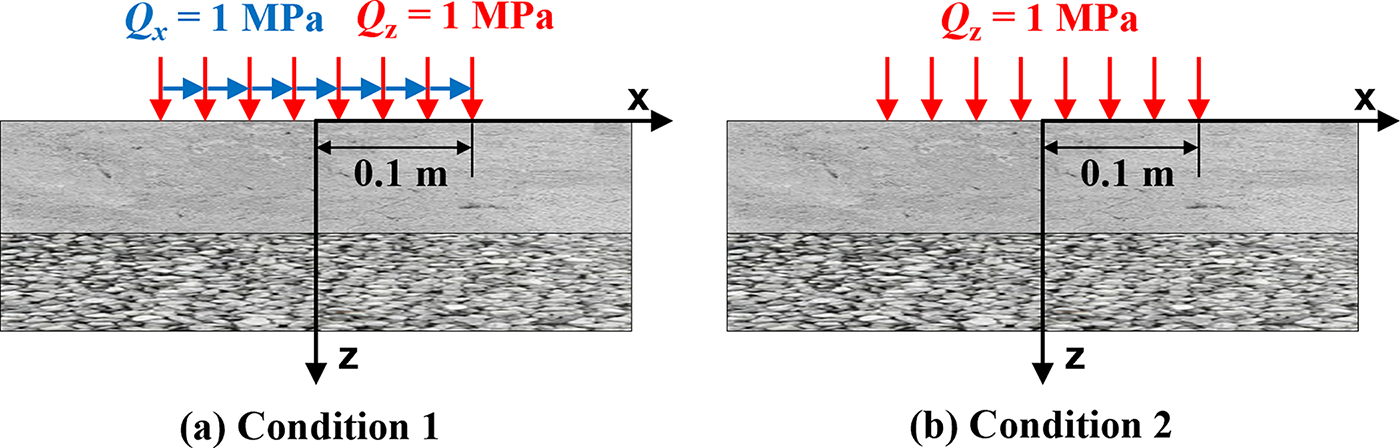
Figure 9: Loading condition diagram: (a) combined compression and shear action; (b) compression action
The vertical normal stress at different depths is distributed horizontally as shown in Fig. 10. By comparing Fig. 10a,b, it can be seen that when the structure is only subjected to pressure, the internal vertical normal stress field shows a completely axisymmetric distribution pattern. However, after the horizontal load is applied, the symmetric distribution is destroyed, and the peak normal stress at each depth shifts toward the direction of the horizontal load and tends to increase, with the degree of increase decreasing with depth. In addition, due to the application of horizontal loads, a noticeable transition between tensile and compressive stresses occurs in the vicinity of the load application area. This causes the horizontal distribution to decay at a faster rate on the side opposite to the direction of the horizontal load, and at a slower rate on the side in the same direction as the horizontal load. Combining the two figures, it can be seen that as the depth increases, the peak normal stress decreases, but the horizontal decay rate gradually slows down. Based on this reason, the phenomenon of large differences in the vertical normal stress variation patterns at different horizontal positions shown in Fig. 6 can be explained. As shown in Fig. 6b, at shallow depths, although the peak normal stress at that depth is large, the rapid decay rate results in a small residual stress transmitted to the horizontal position at 0.3 m. As the depth increases, although the peak normal stress at this depth is small, the slow decay rate causes the residual stress at this horizontal position to be large. Therefore, the phenomenon of increasing vertical normal stress along the depth direction shown in Fig. 6b occurs.
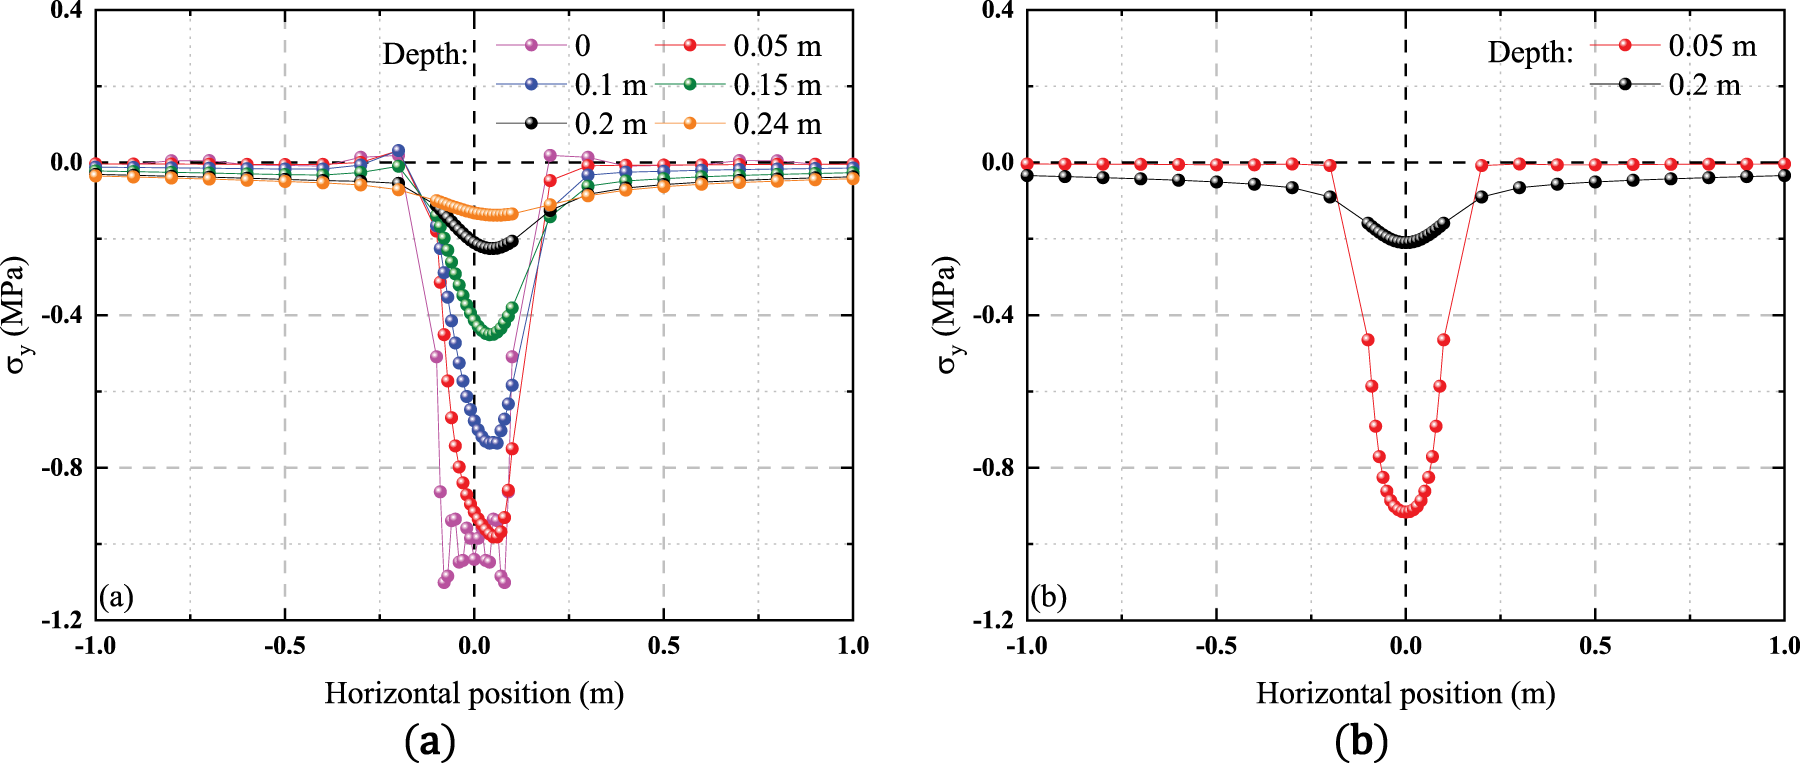
Figure 10: Vertical normal stress at different depths varies horizontally: (a) Condition 1; (b) Condition 2
The horizontal normal stress at different depths is distributed horizontally as shown in Fig. 11. After the horizontal load is applied, the symmetry of the stress distribution is also destroyed. Similar to the vertical normal stress, the peak normal stress at each depth shifts toward the direction of the horizontal load application, and the peak tends to increase, with the degree of increase decreasing with depth. As shown in Fig. 11a, at the edge of the horizontal load application area, the surface horizontal normal stress undergoes a sudden change, which gradually attenuates with increasing depth. In addition, since the horizontal load is applied in the positive direction, the horizontal normal stress on the side opposite to the direction of the applied horizontal load tends to shift toward tensile stress, which is shown in the figure as an overall upward shift. Meanwhile, the lateral compressive stress shifts, shown in the figure as an overall downward shift. By comparing the distribution of horizontal normal stress at various depths, it is clear that the neutral axis of the structural layer shifts downward, with the thickness of the upper compression zone greater than that of the lower tension zone.
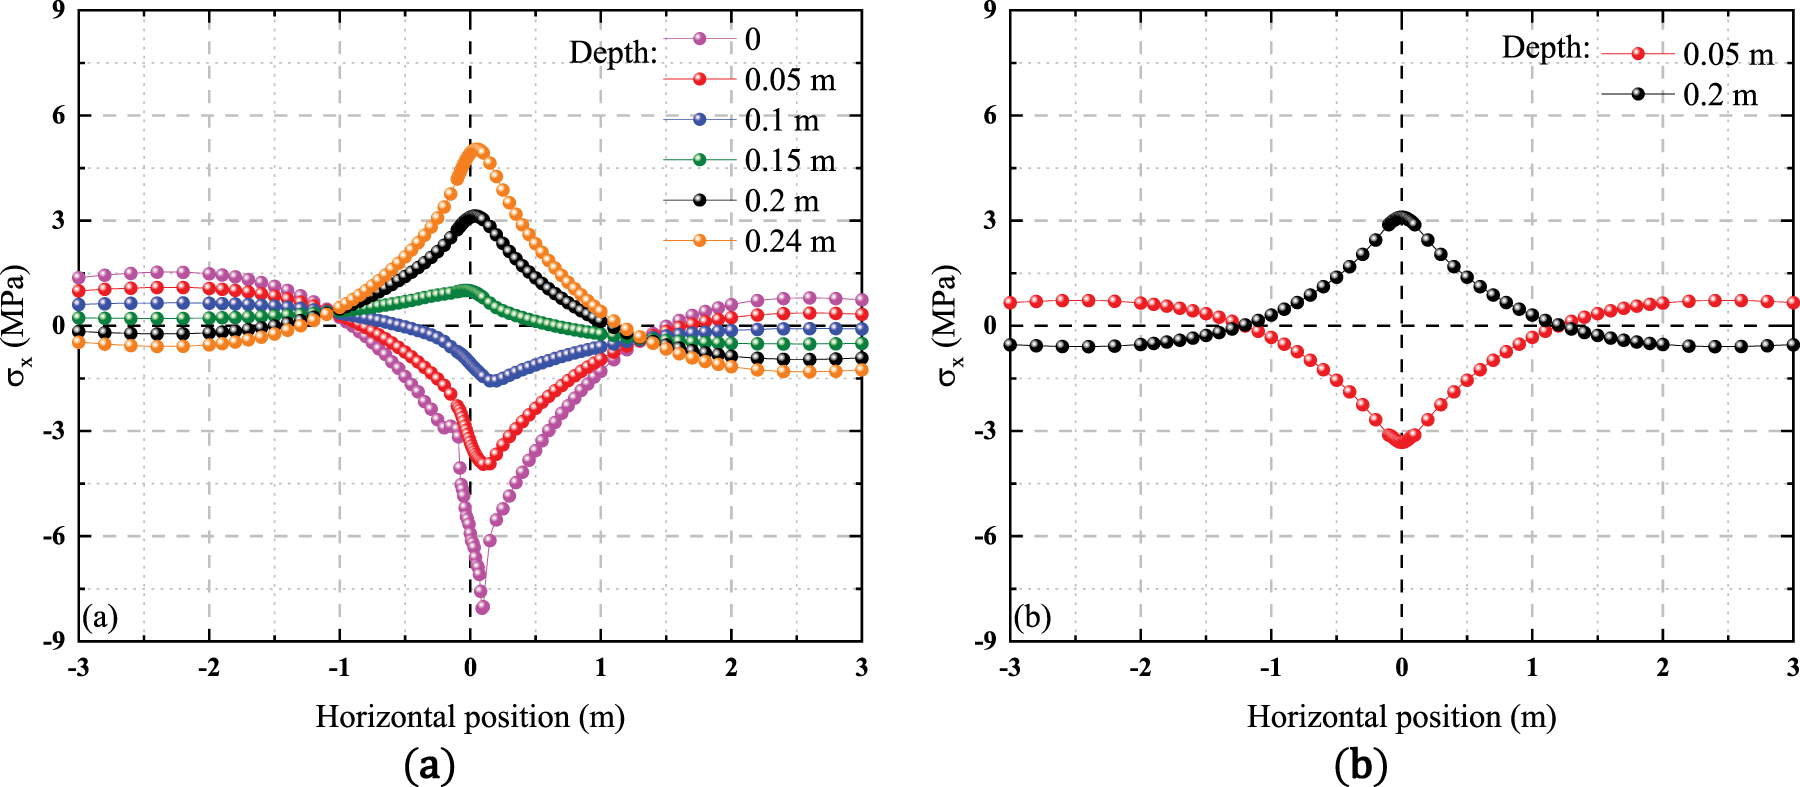
Figure 11: Horizontal normal stress at different depths varies horizontally: (a) Condition 1; (b) Condition 2
The shear stress distribution along the horizontal direction at different depths is shown in Fig. 12. Under no horizontal load conditions, the shear stress exhibits a centrally symmetric distribution relative to the horizontal center position. However, after applying a horizontal load, the centrally symmetric distribution is altered. In addition to changing the trend of shear stress variations on both sides, the position where the shear stress is zero shifts from the center position toward both sides. In addition, the rate of shear stress decay on the same side as the horizontal load application direction is slower than on the other side. Furthermore, the amplitude of shear stress on the same side significantly increases, while the amplitude on the other side significantly decreases. The shear stress undergoes a sudden change at the boundary of the horizontal load application area, and the extent of this change decreases with increasing depth. As shown in Fig. 12a, at a depth of 0, the shear stress distribution is primarily influenced by the horizontal load application range, with a sudden change occurring within the load area, while the remaining locations remain near 0. However, as depth increases, the shear stress in the region outside the load range increases rapidly within a smaller depth range and then decreases slowly as depth continues to increase. This is the same as the shear stress variation pattern of the concrete surface layer shown in Fig. 8b. The variation of shear stress along the depth at the center of the load level is shown in Fig. 12a. It decreases from the surface, then increases in the opposite direction, and finally decreases to approximately 0. However, the direction is opposite to that of the surface shear stress, which is consistent with the shear stress variation pattern of the concrete surface layer shown in Fig. 8a.
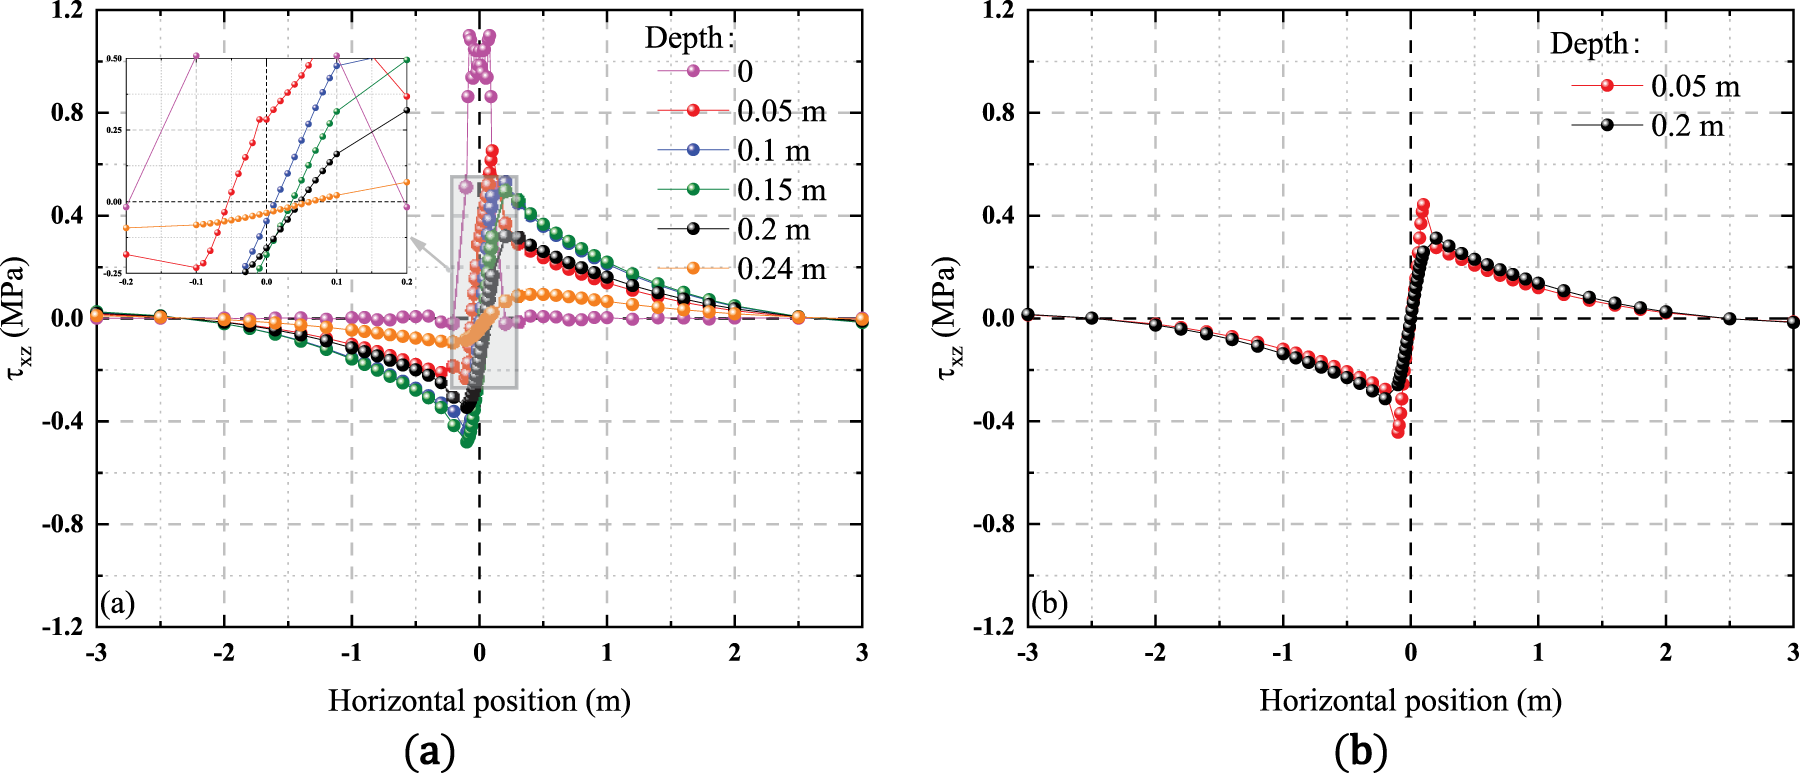
Figure 12: Horizontal variation of shear stress at different depths: (a) Condition 1; (b) Condition 2
3.2.3 Effect of Compression-Shear Combinations on Concrete Surface Layer
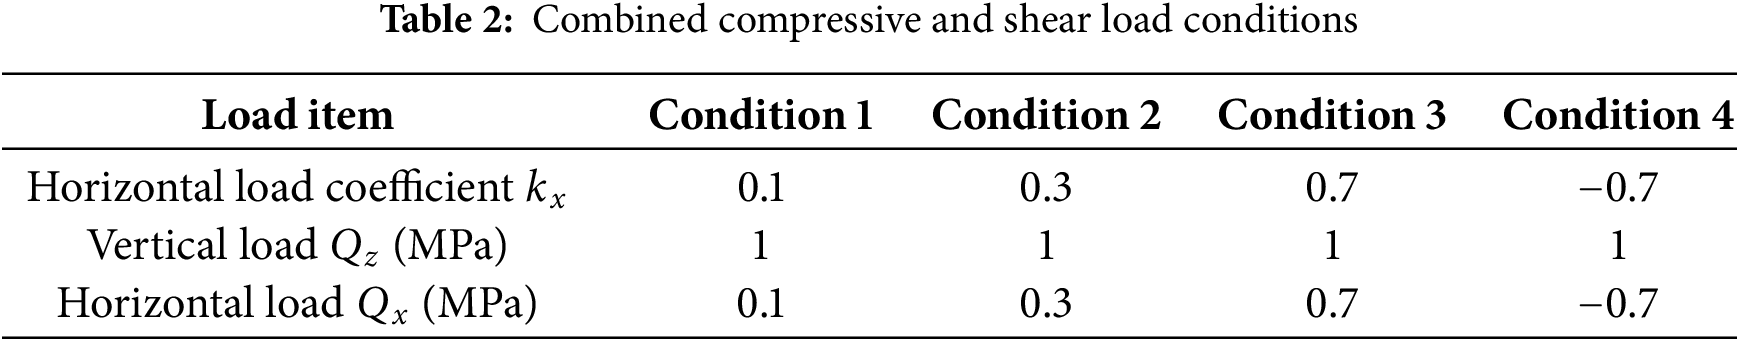
The position of the vehicle changes constantly while in motion, and braking, steering, and other maneuvers all generate horizontal forces. The changes in the above-mentioned motion state generate greater horizontal tangential forces than those generated during normal driving conditions. Therefore, it is crucial to study the impact of different levels of horizontal forces on the stress response within the structure. This section solves the stress field distribution of the concrete surface layer under different compression-shear combinations and defines different working conditions by changing the horizontal load coefficient. The coefficient is obtained using the following formula:
where
According to the above analysis, the stress field distribution reaches a peak near the center of the load application level. Therefore, a study of the stress field distribution along the depth direction at the load application center and at point
The distribution of vertical normal stress along the depth under various working conditions is shown in Fig. 13. For the horizontal center position, the distribution pattern of vertical normal stress along the depth remains unchanged regardless of whether the horizontal load coefficient increases. However, there is a significant change in the distribution of vertical normal stress below the horizontal position shown in Fig. 13b. As the horizontal load coefficient increases, the overall vertical compressive stress also increases. This change is more pronounced in the middle part of the structural layer, because vertical loads play a dominant role at the top surface, while horizontal loads gradually increase in influence with depth. Due to the weakening effect of the structural layer, the stress variation at the bottom surface is not as obvious as in the middle part, but it is still on the rise. In addition, by comparing Condition 3 and Condition 4, it can be seen that although only the direction of the horizontal load has changed, for the vertical normal stress at this position, due to the large compressive stress, the change in the direction of the horizontal load can only reduce the stress value to a certain extent.
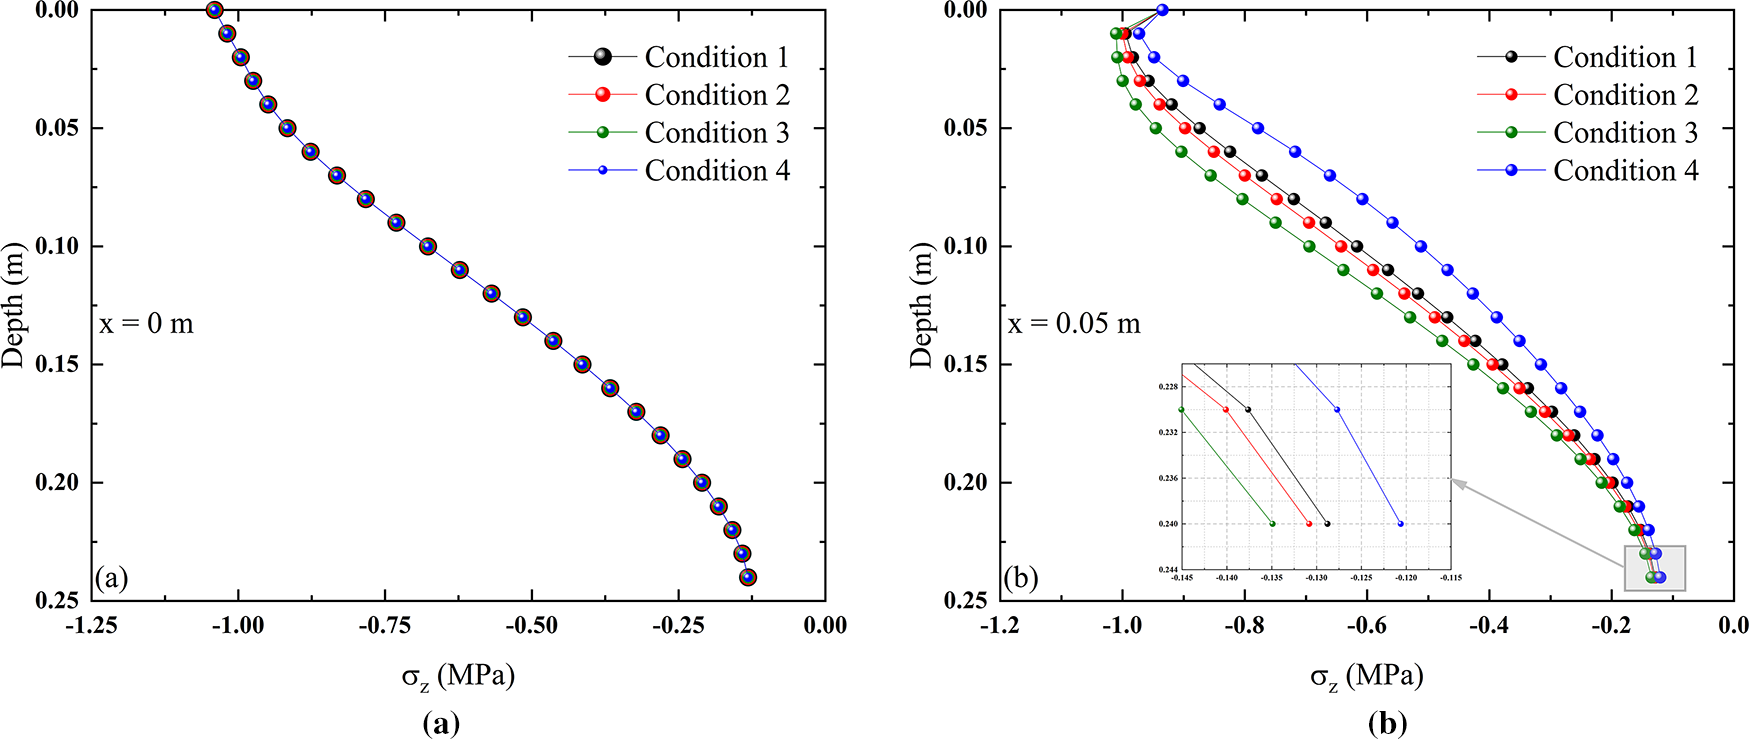
Figure 13: Vertical normal stress variation along depth under different working conditions: (a)
The variation of horizontal load also has a significant effect on the distribution of vertical normal stress along the horizontal direction, as shown in Fig. 14. With the increase of horizontal load coefficient, the peak value of vertical normal stress at the same depth increases, and the peak value shifts toward the horizontal load direction. At the same time, a more obvious alternating stress response of tension and compression appears near the edge of the load application area, and the degree of alternating variation increases with the increase in the horizontal load coefficient. By comparing Condition 3 and Condition 4, it can be seen that the vertical normal stress in the horizontal direction is symmetrical under the action of horizontal loads in the opposite direction.
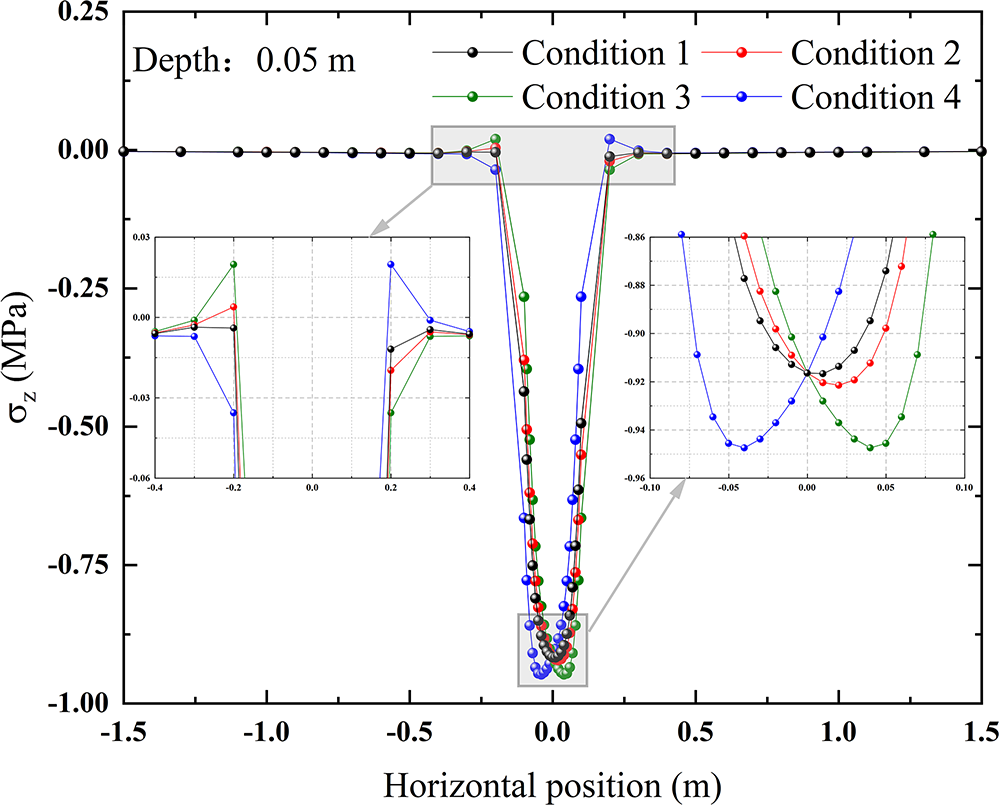
Figure 14: Vertical normal stress variation along the horizontal direction under different conditions
As shown in Fig. 15, the horizontal normal stress below the load center position remains unchanged under different horizontal load coefficient conditions. However, as shown in Fig. 14b, there is a significant variation in the distribution of horizontal normal stress below the horizontal position. Since the horizontal position of the solution is consistent with the horizontal load direction in Conditions 1 to 3 in the positive direction of the x-axis relative to the center position of the load area, the compressive stress in the compressed area and the tensile stress in the tensile area of the structural layer are both increased. In Condition 4, the direction of the horizontal load is opposite to the direction of the load center position relative to the solution position. Therefore, the application of this load weakens the stress distribution in the compressed and tensile regions of the structural layer, i.e., both the compressive stress in the compressed region and the tensile stress in the tensile region are reduced.
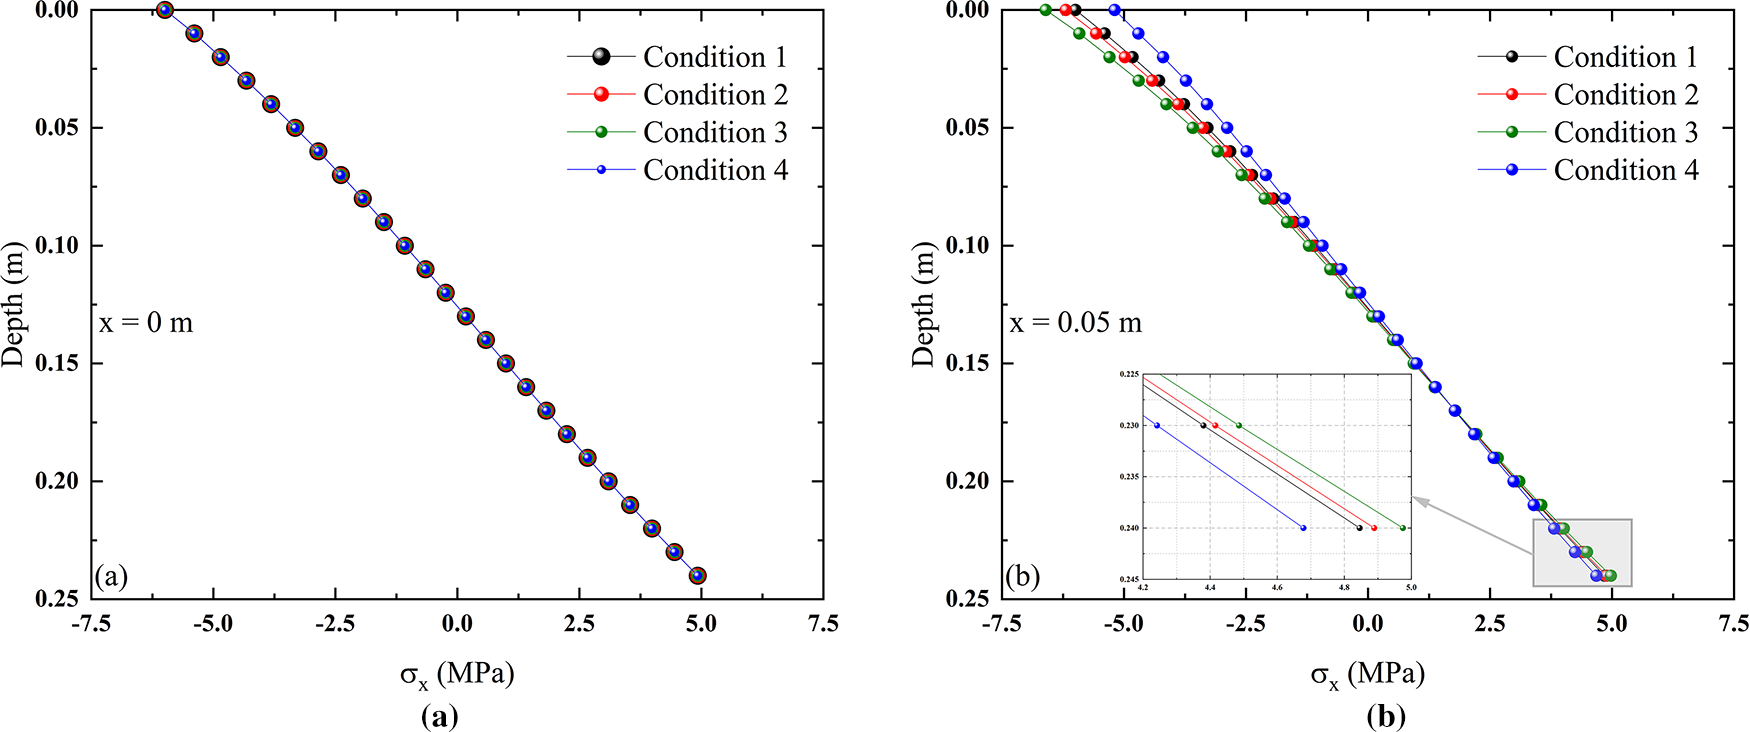
Figure 15: Vertical normal stress variation with depth under different conditions: (a)
As shown in Fig. 16, due to the conversion of compressive stress and tensile stress along the depth direction of the horizontal normal stress of the structural layer, two depth positions (0.05 and 0.2 m) were selected for the study of its horizontal distribution. As shown in the figure, regardless of whether it is in the compression zone or the tension zone, the position of the stress peak shifts toward the direction of the horizontal load. The degree of shift increases as the horizontal load coefficient increases. In addition, the stress peak also increases as the horizontal load coefficient increases.
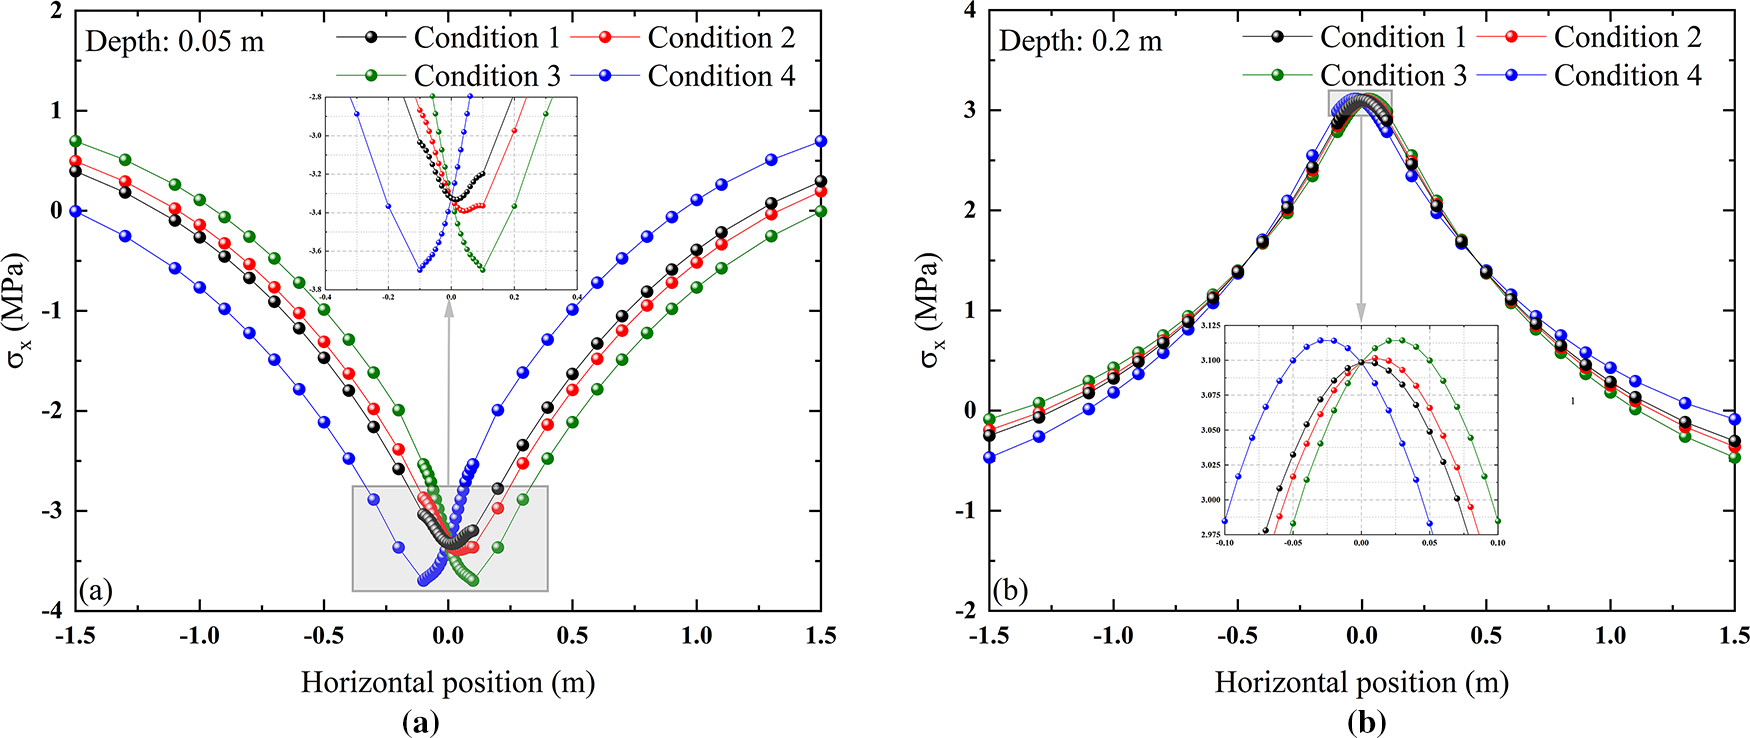
Figure 16: Horizontal normal stress variation under different conditions: (a) at depth 0.05 m; (b) at depth 0.2 m
The shear stress distribution along the depth direction under various conditions is shown in Fig. 17. Below the load center position, the shear stress distribution is shown in Fig. 17a. As the horizontal load coefficient increases, the peak values of both positive and negative shear stresses increase. Although the structural layer has a weakening effect, the above pattern is still maintained at the bottom surface position. Comparing Conditions 3 and 4 at this horizontal position, the change in the direction of the horizontal load only alters its trend, resulting in a symmetrical distribution of shear stress. However, for the shear stress distribution below the horizontal position shown in Fig. 17b, due to the relationship between the horizontal position relative to the load center and the direction of the horizontal load, the shear stress distribution exhibits different patterns. Comparing Conditions 1 to 3, the horizontal position is in the same direction as the load center position and the horizontal load direction, causing the shear stress to shift overall in the direction of the horizontal load along the depth direction. Comparing Condition 3 with Condition 4, there is a change in the symmetry characteristics compared to Fig. 17a.
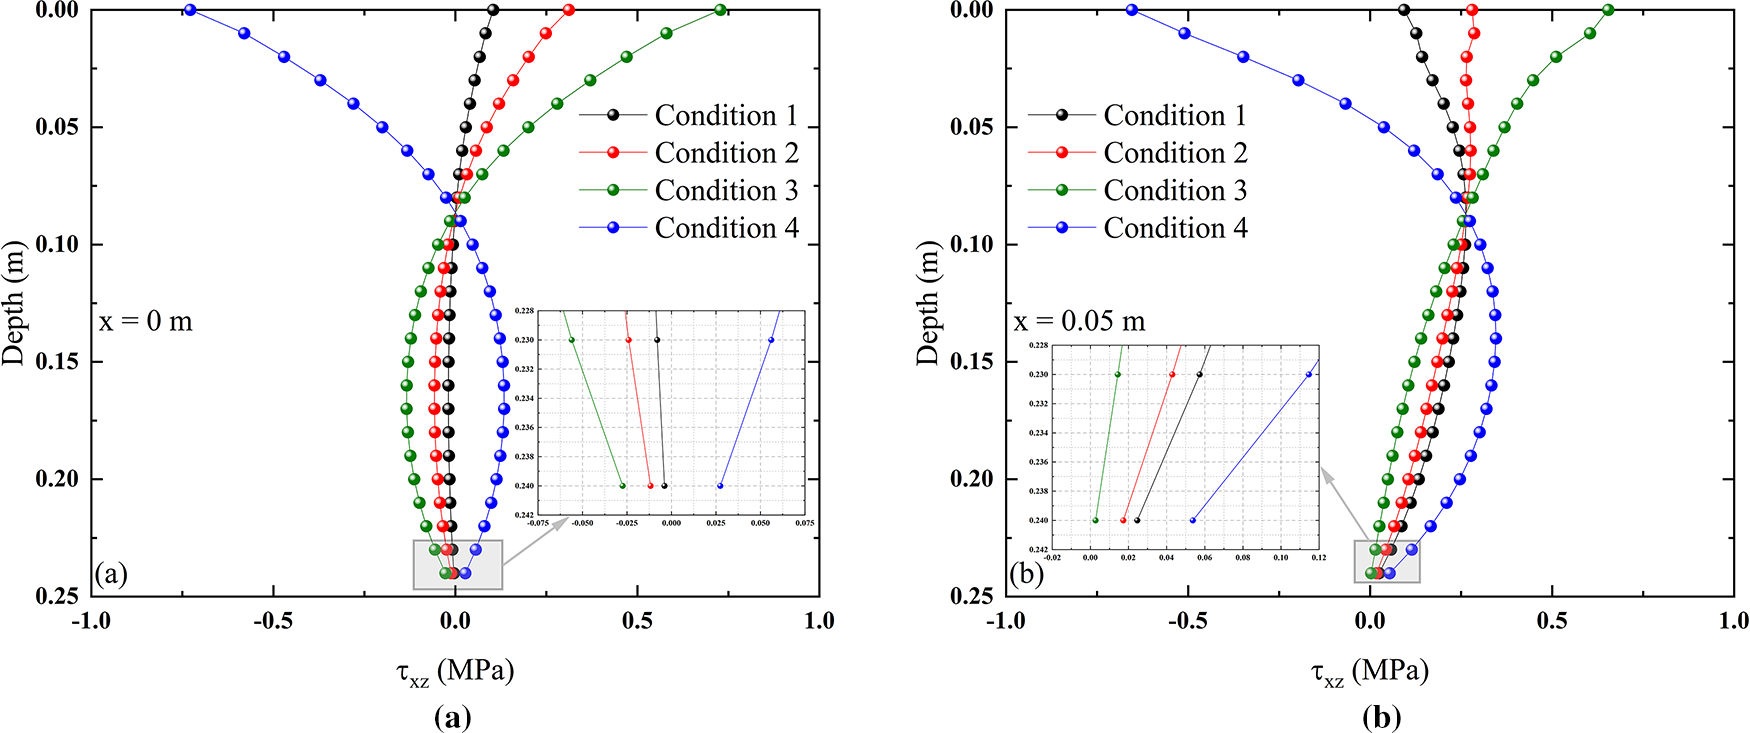
Figure 17: Shear stress variation along depth under different conditions: (a)
The distribution of shear stress along the horizontal direction under different conditions is shown in Fig. 18. When the horizontal load direction remains constant, as the horizontal load coefficient increases, the shear stress on the horizontal center position on the same side as the horizontal load direction tends to increase, while the shear stress on the other side tends to decrease. This variation simultaneously affects the rate of shear stress decay on both sides. When only the direction of the horizontal load is changed, the variation is distributed symmetrically around the horizontal center position.
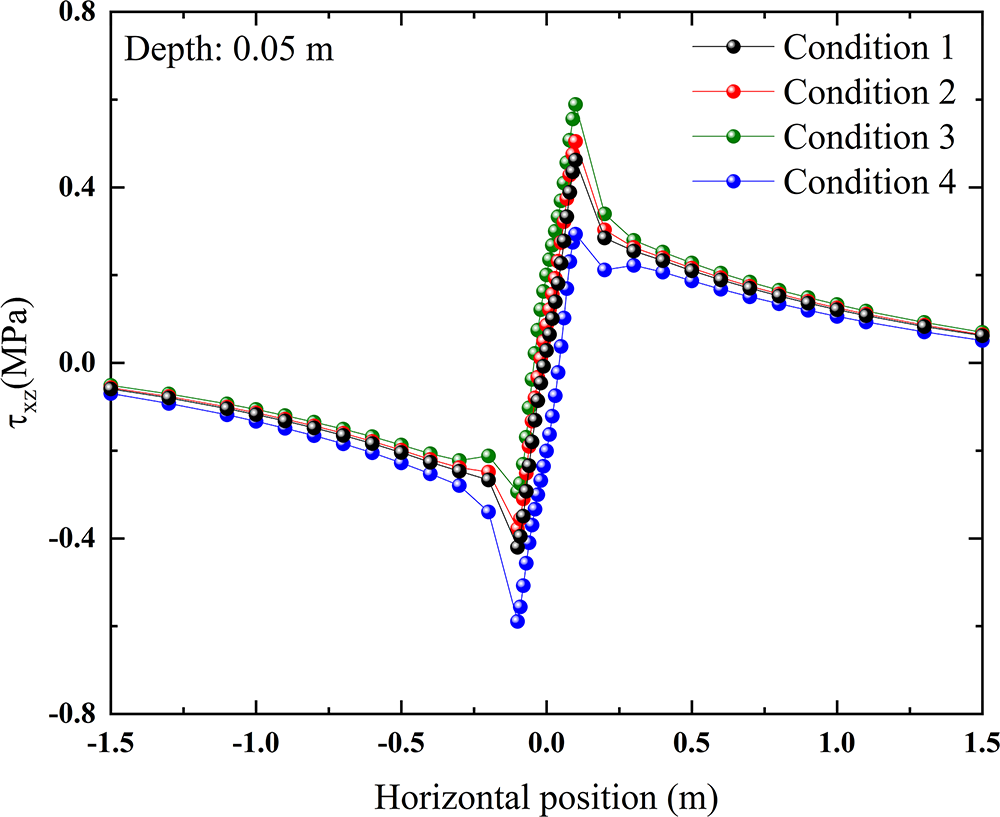
Figure 18: Shear stress variation along the horizontal direction under different conditions
4 Structural Optimization Analysis of Multi-Layer Composite Pavement
Due to the weak tensile strength of the concrete surface layer, which is the main load-bearing layer in multi-layer pavement structures, the internal tensile stress generated under different load combinations has a significant impact on structural damage (such as cracks). In addition, the presence of shear stress on the bottom surface of this layer also affects the health of the interlayer contact. Therefore, this section verifies the influence of three different structural optimization methods on the internal mechanical response of the cement concrete surface layer structure under the load conditions of Condition 1 in Fig. 9. Based on previous research, the vertical normal stress distribution along the depth direction of the concrete surface layer at the load center position, as well as the normal stress and shear stress in the horizontal direction of the bottom surface of the concrete surface layer, are taken as the research objects. Due to the weakening effect of the concrete surface layer, the vertical normal stress inside the structural layer is less than that on the surface. Therefore, it is only necessary to control the vertical load to be less than the compressive strength of the cement concrete material. Because of this, it’s important to focus on how different optimization methods affect the interlayer shear stress and the tensile stress at the bottom of the concrete surface layer.
4.1 Structural Stiffness Optimization Design
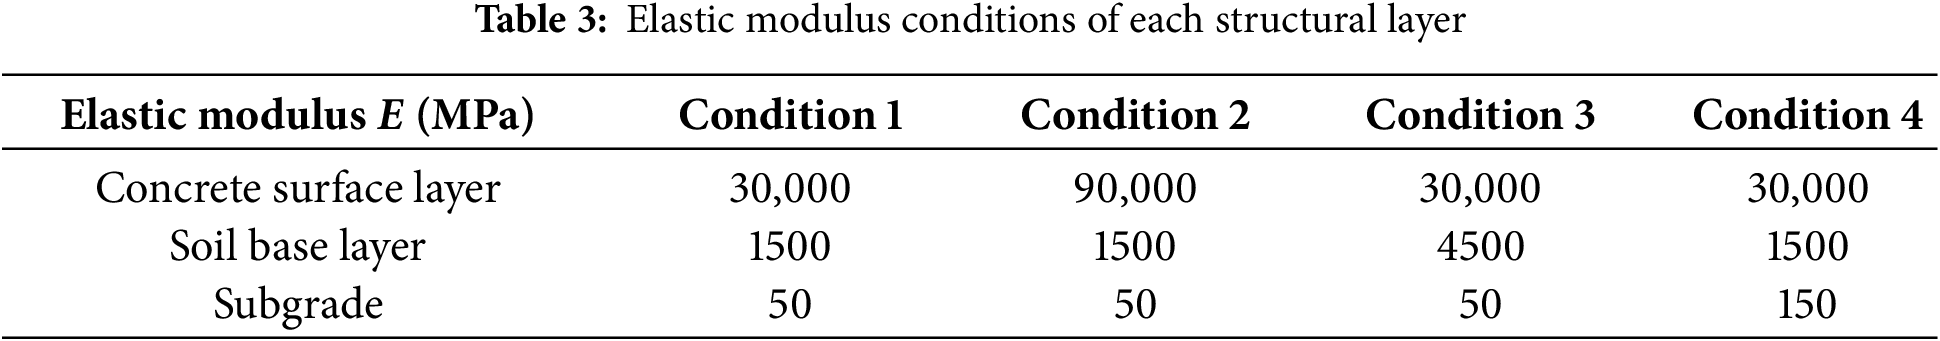
Existing research indicates that the stiffness of each structural layer significantly influences the distribution of structural stresses and strains [45–48]. This section studies the influence of the stiffness of the structural layer on the internal mechanical response of the concrete surface layer. The working conditions are set by changing the proportion of elastic modulus of different layers. With the material mechanical parameters shown in Table 1 as the reference, the conditions are shown in Table 3. To ensure the regularity is clearly evident, the elastic modulus of the structural layer for all other conditions is set to three times that of the control group (Condition 1).
The distribution of vertical normal stresses along the depth direction for each modulus condition is shown in Fig. 19a, and it can be seen from the comparative analysis of Conditions 1 to 3, the variation in vertical normal stress within the concrete surface layer increases with depth across the different conditions. Increasing the elastic modulus of either the soil base layer or the subgrade increases the vertical normal stress in the concrete surface layer. Increasing the elastic modulus of the concrete surface layer significantly reduces the overall vertical normal stress of the layer.
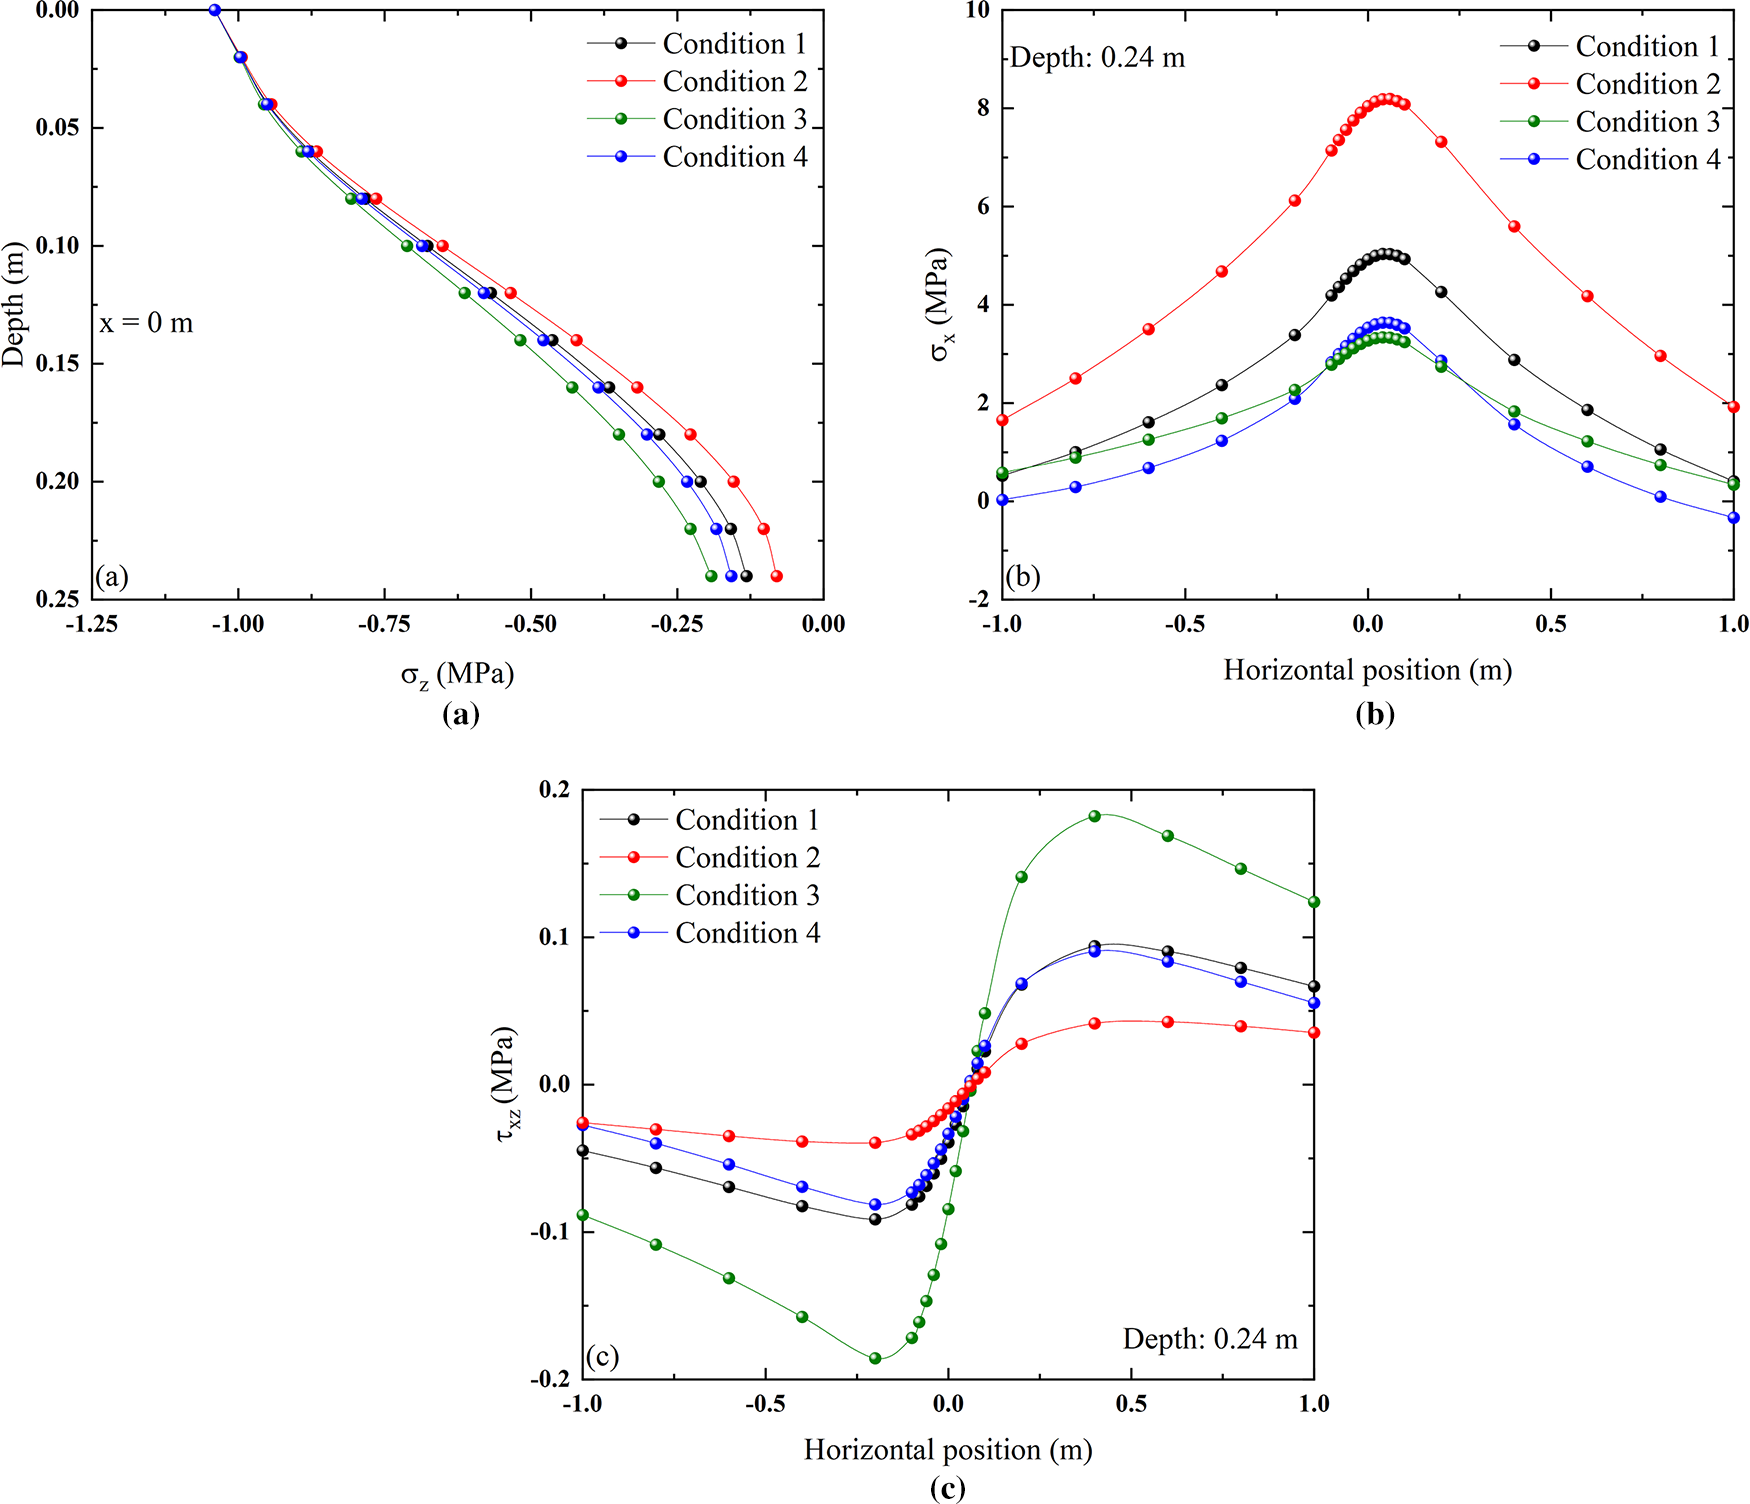
Figure 19: Stress field distribution under different conditions: (a) vertical normal stress varies along the depth direction; (b) horizontal normal stress varies along the horizontal direction; (c) shear stress varies along the horizontal direction
The horizontal normal stress distribution of the bottom surface of the concrete surface layer in the horizontal direction under each condition is shown in Fig. 19b. Increasing the proportion of the elastic modulus of the concrete surface layer significantly increases the peak value of its normal stress, while increasing the proportion of the elastic modulus of the soil base layer effectively reduces the peak value of the tensile stress in the horizontal direction, thereby preventing cracks from forming at the bottom of the concrete surface layer.
The horizontal shear stress distribution of the bottom surface of the concrete surface layer under each condition is shown in Fig. 19c. Increasing the elastic modulus of the concrete surface layer can effectively reduce interlayer shear stress and prevent excessive relative displacement from causing slippage between layers. Through the triple mechanisms of enhancing load diffusion, improving deformation coordination, and optimizing modulus matching, the relative slip between the concrete surface layer and the soil base layer is effectively reduced, thereby diminishing interfacial shear stress. However, when the proportion of the elastic modulus of the soil base layer increases, the interlayer shear stress increases significantly, which negatively impacts the interlayer continuity.
As shown in Fig. 19a–c, the variation of the stress field of the concrete surface layer mainly depends on the variation of mechanical parameters between this layer and the adjacent soil base layer. For the subgrade, the influence of variations in its material parameters on the concrete surface layer is relatively small among the three stress fields. Therefore, if the mechanical response of the concrete surface layer is to be changed by altering the elastic modulus of the structural layer, it is only necessary to start from its own layer and adjacent layers, and control the proportion of different elastic modulus according to different requirements.
4.2 Structural Thickness Optimization
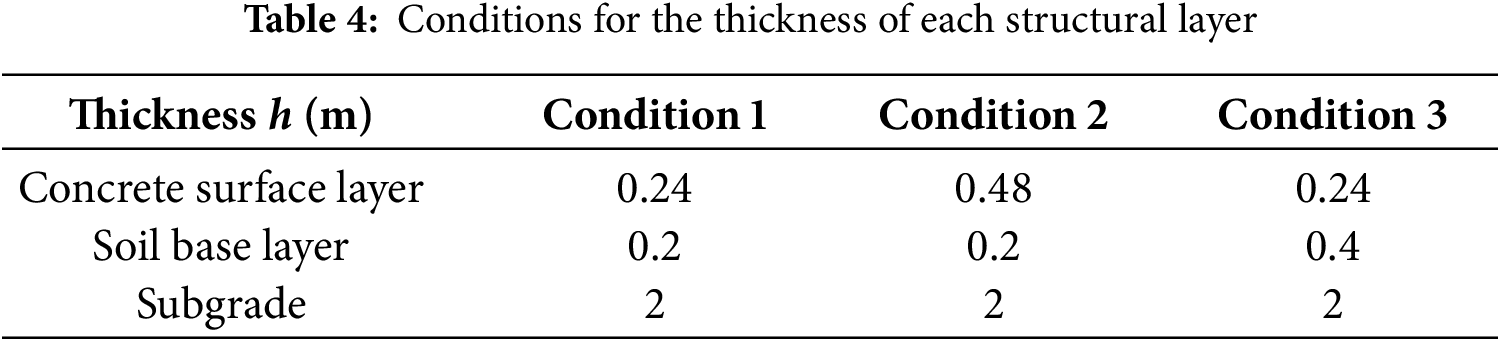
This section studies the influence of the internal mechanical response of the concrete surface layer by changing the proportion of thickness of the different structural layer. Due to the difficulty in controlling the thickness of the soil base in actual engineering projects, the variation of subgrade thickness is not considered in the condition setting. Using the structural layer thickness parameters shown in Table 1 as a reference, the following conditions are presented in Table 4.
The distribution of vertical normal stresses along the depth direction under each condition is shown in Fig. 20a. By comparing Condition 1 with Condition 3, it can be seen that increasing the proportion of soil base layer thickness leads to an overall increase in vertical normal stress within the concrete surface layer, resulting in an increase in the normal stress transmitted to the substructure. By comparing Condition 1 and Condition 2, it can be seen that although increasing the proportion of concrete surface layer thickness reduces the rate at which vertical normal stress attenuates within this layer, the normal stress transferred to the substructure is significantly reduced.
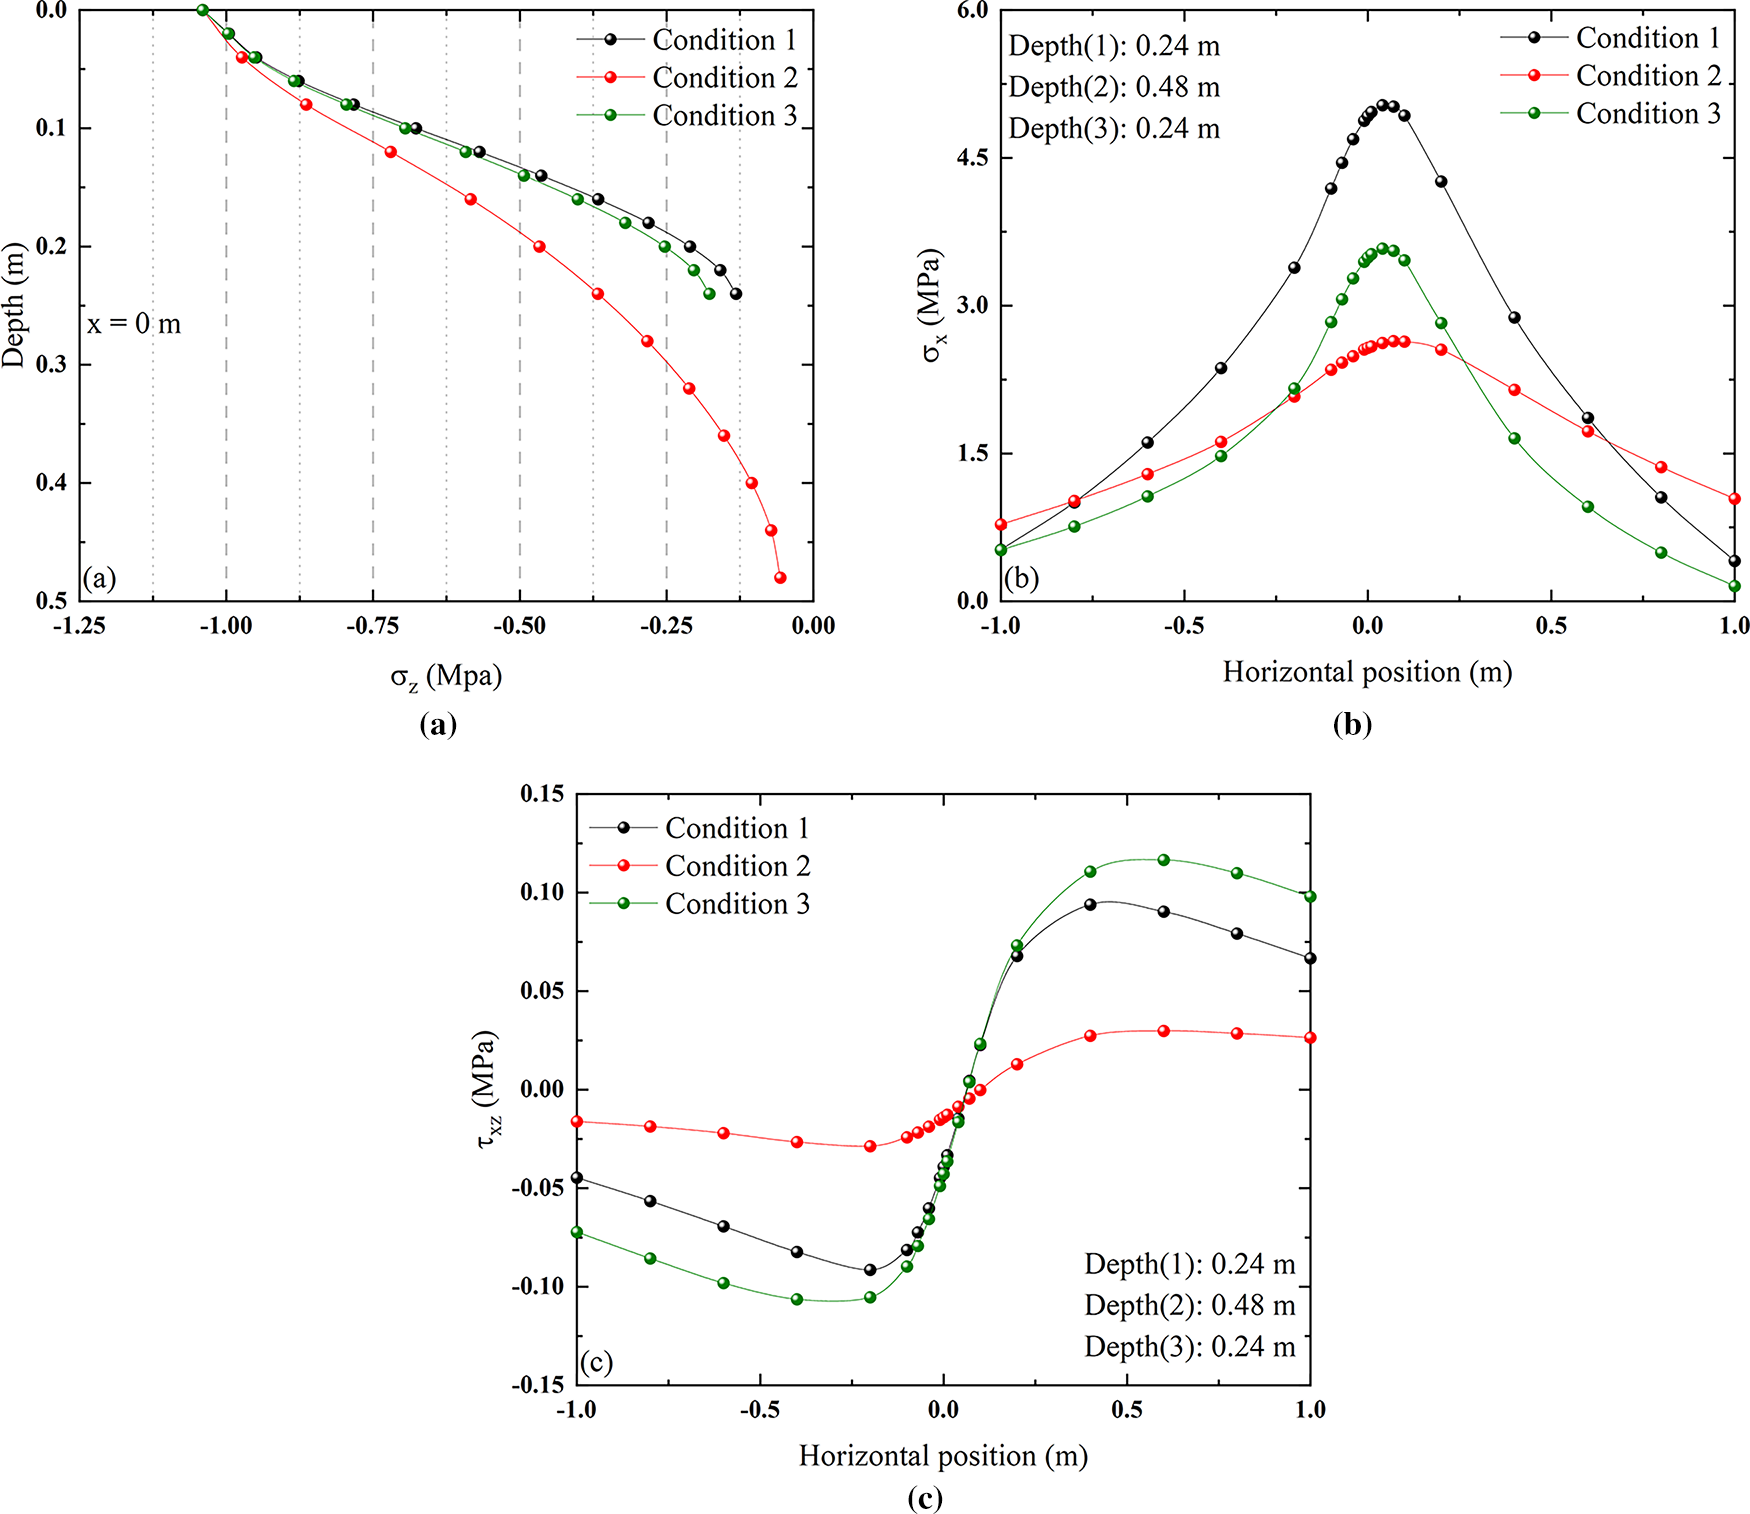
Figure 20: Stress field distribution under different conditions: (a) vertical normal stress varies along the depth direction; (b) horizontal normal stress varies along the horizontal direction; (c) shear stress varies along the horizontal direction
The distribution of horizontal normal stress along the horizontal direction under different conditions is shown in Fig. 20b. An isolated increase in the thickness proportion of either the concrete surface layer or the soil base layer reduces the peak tensile stress at the bottom of the concrete surface layer. However, comparing Condition 2 and Condition 3, it can be seen that when the proportion of the same thickness is increased, the positive effect of increasing the proportion of the concrete surface layer thickness on the structure is more obvious than that of increasing the proportion of the soil base layer thickness. Increasing the thickness brings the neutral axial to the interior of the high-modulus surface layer, thereby enhancing the safety of the most vulnerable areas—the base surface and interlayer interfaces. This approach systematically reduces critical responses and extends the fatigue life of the structure.
As shown in Fig. 20c, the shear stress between the concrete surface layer and the soil base layer varies significantly along the horizontal direction under different conditions. When increasing the proportion of soil base layer thickness, peak interlayer shear stresses in both directions demonstrate an upward trend. Critically, as these peaks approach the interlayer bond shear strength threshold, slippage and debonding become likely, triggering structural distresses. For Condition 2, increasing the thickness of the concrete surface layer can significantly reduce the peak shear stress in both directions between layers and reduce the risk of interlayer slippage.
Based on the above analysis, increasing the concrete surface layer thickness proportion consistently improves stress distribution at critical locations. In contrast, increasing the soil base layer thickness proportion provides only moderate benefits to tensile stress distribution in the concrete surface layer.
4.3 Structural Layer Distribution Optimization
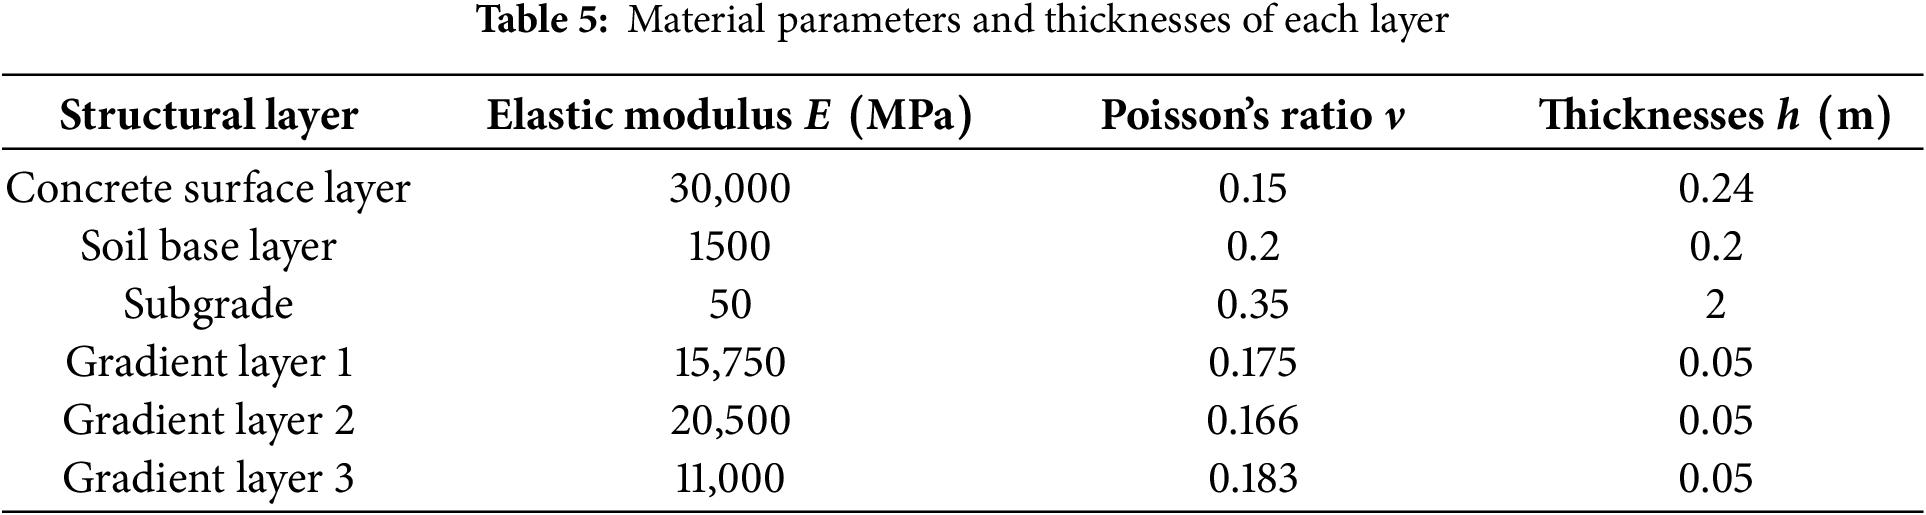
Due to the significant difference in elastic modulus between the concrete surface layer and the soil base layer within the cement concrete pavement structure, it leads to uneven stress distribution within the structure, such as abrupt changes in interfacial horizontal normal stress. Consequently, this section examines the internal mechanical response of the concrete surface layer under varied structural layer designs. Conditions were established by modifying the structural layer between these layers (Fig. 21), with corresponding material mechanical parameters detailed in Table 5. The mechanical parameters of the gradient layer are respectively taken as the median value and the third equal fraction of the mechanical parameters of the concrete surface layer and the soil base layer to form the gradient change.
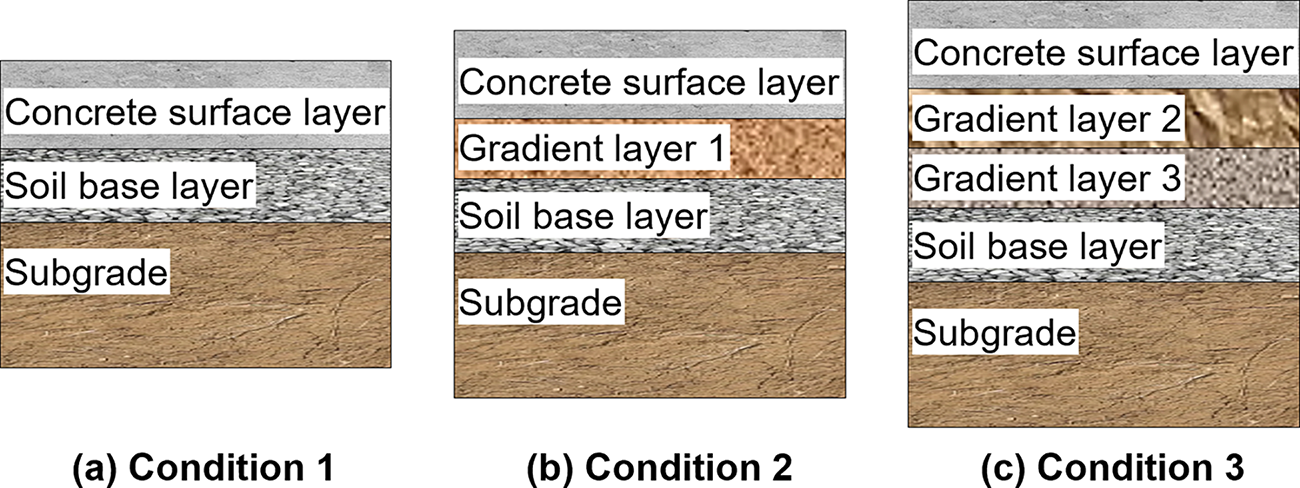
Figure 21: Structural design of composite layers
The distribution of the internal stress field within the structure under different layer composition conditions is shown in Fig. 22. Comparing Conditions 1–3 in Fig. 22b, incorporating a varying number of gradient layers between the concrete surface layer and the soil base layer significantly reduces the tensile stress at the bottom of the concrete surface layer. This reduction can substantially lower the risk of cracking due to excessive tensile stress.
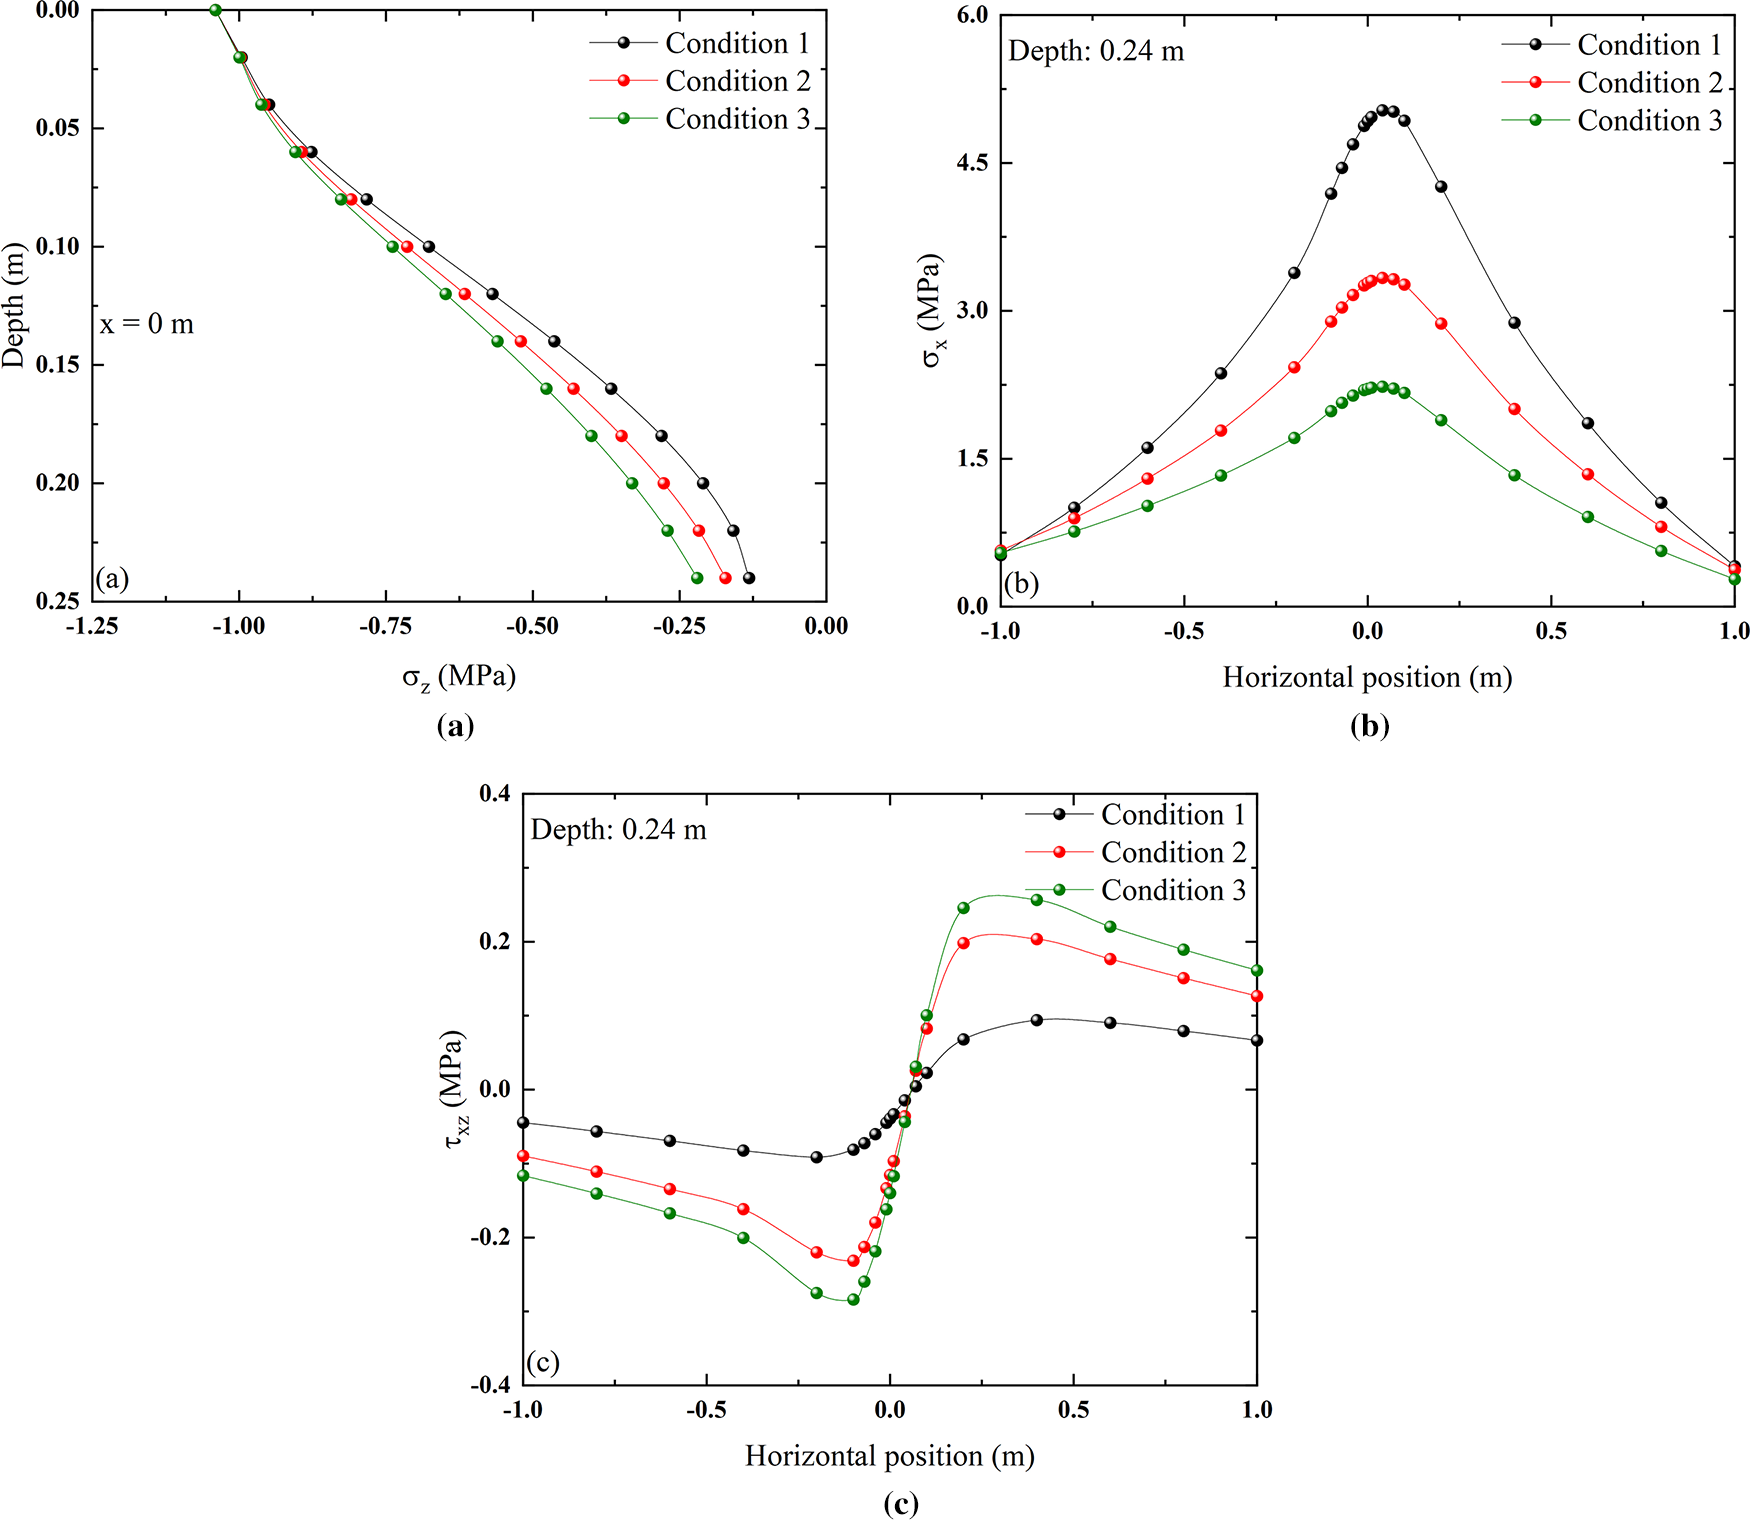
Figure 22: Stress field distribution under different conditions: (a) vertical normal stress varies along the depth direction; (b) horizontal normal stress varies along the horizontal direction; (c) shear stress varies along the horizontal direction
After adding a gradient layer between the concrete surface layer and the soil base layer, the vertical normal stress and the interlayer shear stress within the structure will increase to a certain extent. Although an increase in vertical normal stress does not lead to an increase in structural risk, an increase in the peak value of interlayer shear stress will increase slip at the interface of the bottom surface of the concrete surface layer to some extent. Therefore, when setting a gradient layer between the concrete surface layer and the soil base layer to prevent the structure from pulling apart and cracking, attention should be paid to the bonding condition between the concrete surface layer and the adjacent layers to reduce the risk of interlayer slip.
As shown in Fig. 23, based on the above structural optimization design solution, the following points can be summarized: (1) Increasing concrete surface layer thickness or modulus can reduce the risk of interlayer slippage and debonding; (2) Increasing concrete surface layer thickness, soil base layer thickness, and soil base layer modulus can all reduce the risk of tensile cracking at the bottom of the concrete, but considering the economic efficiency of the actual project, increasing soil base layer thickness or modulus is the optimal solution.
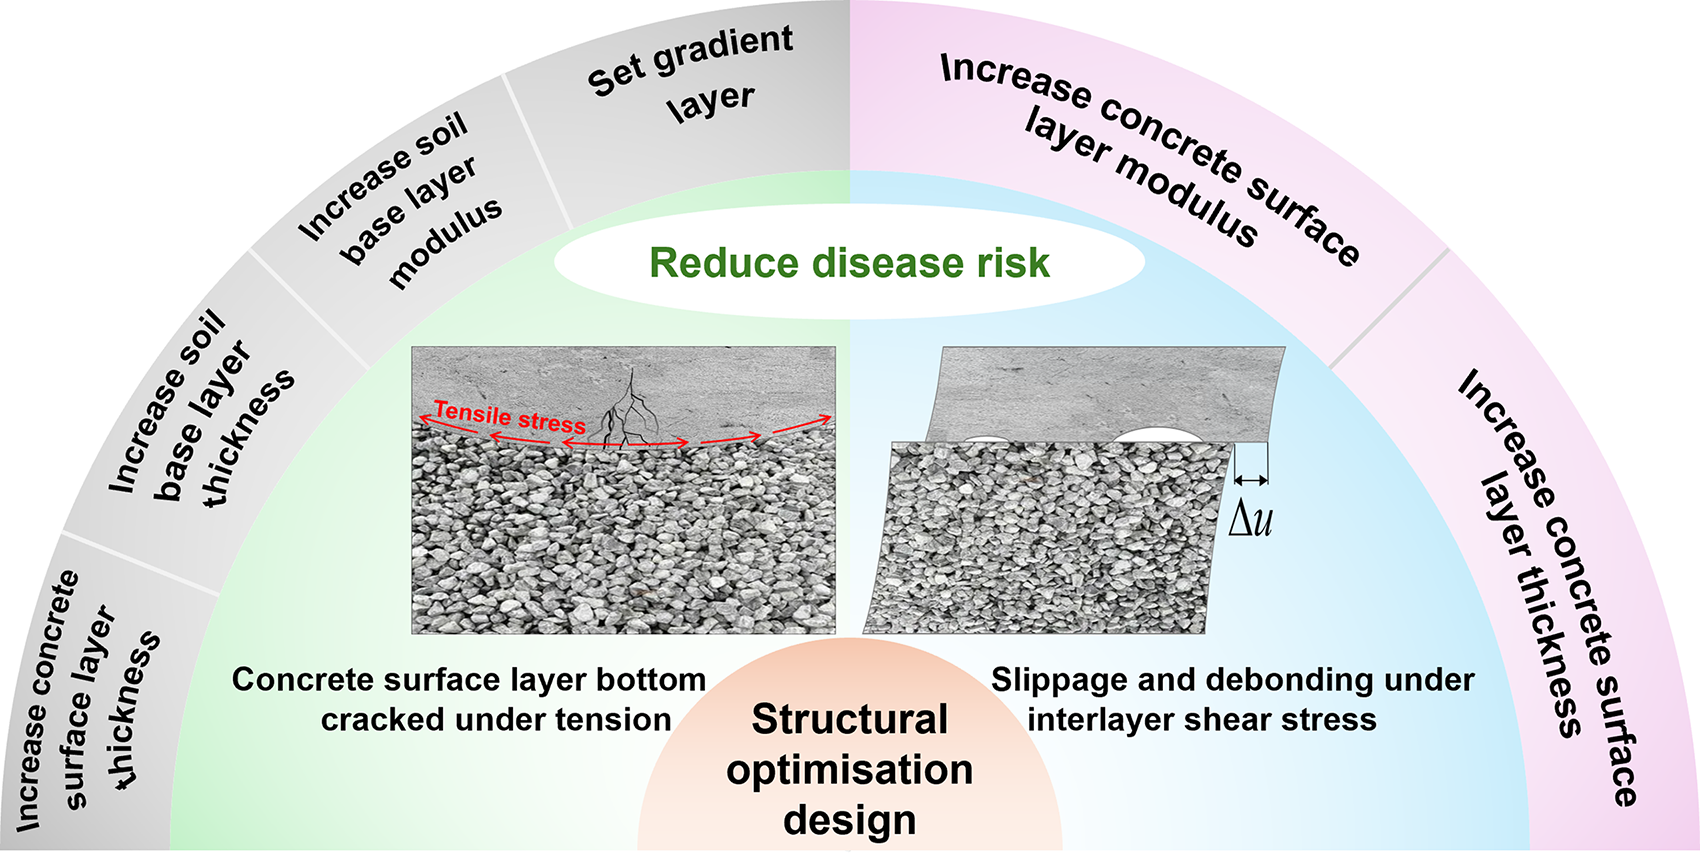
Figure 23: Summary of structural design optimization solutions
This paper employs the transfer matrix method to establish a two-dimensional model subjected only to vehicle loads, without considering interfacial degradation. Through theoretical modeling, analyze the mechanical response of multi-layer pavement structures under combined compressive and shear loads. The accuracy of the theoretical solution is verified by using finite element simulation results, and the proposed theoretical solution is used to explore the different mechanical responses of the structure. The internal stress distribution under different structural optimization methods has been analyzed to explore the impact on the internal mechanical response of the concrete surface layer, thereby providing guidance for the optimization and improvement of the performance of concrete pavement structures. The main conclusions are as follows:
(1) The combined use of Fourier and Laplace transforms simplifies the process of solving transfer matrices for multi-layer composite pavement structures. Based on this method, explicit sub-transfer elements for single-layer media can be obtained, significantly reducing the cumulative error of the algorithm. The theoretical solution is verified by using finite element simulation results, proving the feasibility and accuracy of the proposed method in solving the stress fields of multi-layer medium structures.
(2) The concrete surface layer is the main load-bearing part. It can weaken most of the vertical normal stress and shear stress, and transfer them to the substructure. The soil base layer further attenuates the mechanical response transmitted from the layers above and transmits it downward, resulting in a smaller overall mechanical response of the subgrade. The dangerous parts of each structural layer are located below the load application area. The structure can be optimized by controlling the mechanical response within this dangerous vertical area.
(3) Compared to scenarios without horizontal loading, applying horizontal loads increases the risk of interlayer slippage and crack formation within the structure. Horizontal loading increases peak stress magnitudes, and these peaks correlate positively with the horizontal load coefficient. Additionally, the locations of peak vertical normal stress and horizontal normal stress shift toward the direction of the horizontal load.
(4) Increasing the thickness of the concrete surface layer, or the thickness of the subgrade, or enhancing the stiffness of the subgrade, or employing gradient layers, can significantly reduce the peak tensile stress at the bottom of the concrete surface layer. This effectively reduces the risk of tensile cracking initiation. Furthermore, increasing both the thickness and stiffness of the concrete surface layer reduces peak interfacial shear stress, thereby diminishing the damage risk of interfacial slip and debonding.
The model proposed in this paper does not account for temperature effects or interfacial contact degradation. Subsequent work can further incorporate temperature terms into the control equations to develop an analytical framework for the coupled effects of vehicle loading and temperature. The potential influence of nonlinear material properties, creep, or fatigue in long-term pavement performance will also be explored in the developed model. Based on the methodology proposed herein, interfacial degradation can be simulated by introducing an interfacial transmission layer. Altering its stiffness allows the degradation process to be characterized, which will be explored in future study.
Acknowledgement: Special thanks are due to Prof. Jinping Ou and Prof. Zhi Zhou of Dalian University of Technology, and Prof. Youhe Zhou and Prof. Xingzhe Wang of Lanzhou University. The findings and opinions expressed in this article are only those of the authors and do not necessarily reflect the views of the sponsors.
Funding Statement: The work was supported by Fundamental Research Funds for the Central Universities (No. lzujbky-2024-05), Innovation Foundation of Provincial Education Department of Gansu (2024B-005), Scientific Department of Gansu (24CXGA083, 24CXGA024, JK2024-28, JK2024-32 and 23CXJA0007), Industrial Support Plan Project of Provincial Education Department of Gansu (2025CYZC-003 and CYZC-2024-10) and the Hunan Natural Science Foundation Science and Education Joint Fund Project (2022JJ60109).
Author Contributions: Guo-Zhi Li: theoretical analysis, data curation and writing—original draft preparation; Hua-Ping Wang: conceptualization, methodology, writing—review and editing; Si-Kai Wang and Jing-Cheng Zhou: software, validation and investigation; Ping Xiang: instruction and validation. All authors reviewed the results and approved the final version of the manuscript.
Availability of Data and Materials: The data supporting the results reported in the paper can be accessed from the corresponding authors.
Ethics Approval: Not applicable.
Conflicts of Interest: The authors declare no conflicts of interest to report regarding the present study.
References
1. Zhan Y, Zhang Y, Nie Z, Luo Z, Qiu S, Wang J, et al. Intelligent paving and compaction technologies for asphalt pavement. Autom Constr. 2023;156:105081. doi:10.1016/j.autcon.2023.105081. [Google Scholar] [CrossRef]
2. Hossein AKM, Golroo A, Akhoundzadeh M. Smart embedded technologies and materials for enhanced pavement management. Autom Constr. 2024;168(12):105865. doi:10.1016/j.autcon.2024.105865. [Google Scholar] [CrossRef]
3. Gulisano F, Jimenez-Bermejo D, Castano-Solís S, Sánchez Diez LA, Gallego J. Development of self-sensing asphalt pavements: review and perspectives. Sensors. 2024;24(3):792. doi:10.3390/s24030792. [Google Scholar] [PubMed] [CrossRef]
4. Guo S, Dai Q, Si R, Sun X, Lu C. Evaluation of properties and performance of rubber-modified concrete for recycling of waste scrap tire. J Clean Prod. 2017;148(10):681–9. doi:10.1016/j.jclepro.2017.02.046. [Google Scholar] [CrossRef]
5. Chen S, Cao Y, He X, Su Y, Wang Y, Wang W, et al. Preparation and ageing resistance enhancement of RP/SBS composite asphalt by heterostructure copper oxalate nanoparticles/recycled polypropylene fiber. Constr Build Mater. 2025;473(8):140992. doi:10.1016/j.conbuildmat.2025.140992. [Google Scholar] [CrossRef]
6. Haider MM, Roy S, Paniagua F, Nassiri S, Mateos A. Field implementation of cellulose nanocrystals (CNC) in concrete pavement test track. Int J Pavement Eng. 2024;25(1):2375429. doi:10.1080/10298436.2024.2375429. [Google Scholar] [CrossRef]
7. Hale WM, Freyne SF, Bush TD, Russell BW. Properties of concrete mixtures containing slag cement and fly ash for use in transportation structures. Constr Build Mater. 2008;22(9):1990–2000. doi:10.1016/j.conbuildmat.2007.07.004. [Google Scholar] [CrossRef]
8. Hung CC, El-Tawil S, Chao SH. A review of developments and challenges for UHPC in structural engineering: behavior, analysis, and design. J Struct Eng. 2021;147(9):03121001. doi:10.1061/(asce)st.1943-541x.0003073. [Google Scholar] [PubMed] [CrossRef]
9. Zhang H, Calvi PM, Lehman D, Kuder K, Roeder C. Response of recycled coarse aggregate concrete subjected to pure shear. J Struct Eng. 2020;146(5):04020075. doi:10.1061/(asce)st.1943-541x.0002620. [Google Scholar] [PubMed] [CrossRef]
10. Roesler JR, Cervantes VG, Amirkhanian AN. Accelerated performance testing of concrete pavement with short slabs. Int J Pavement Eng. 2012;13(6):494–507. doi:10.1080/10298436.2011.575134. [Google Scholar] [CrossRef]
11. Zhong Y, Liu H. Theoretical analysis of overlay resisting crack propagation in old cement concrete pavement. Road Mater Pavement Des. 2014;15(3):701–11. doi:10.1080/14680629.2014.908133. [Google Scholar] [CrossRef]
12. Citir N, Gopisetti P, Ceylan H, Kim S. Evaluating the impact of overweight trucks on rigid pavement performance using AASHTOWare pavement ME design. Road Mater Pavement Des. 2024;25(1):168–85. doi:10.1080/14680629.2023.2199879. [Google Scholar] [CrossRef]
13. Dong P, Cao X, Tang B. Research on dynamic strain distribution patterns of asphalt pavement under the influence of hydro-thermo-mechanical interactions. Constr Build Mater. 2025;469(3):140448. doi:10.1016/j.conbuildmat.2025.140448. [Google Scholar] [CrossRef]
14. El-Kholy SA, Galal SA. A study on the effects of non-uniform tyre inflation pressure distribution on rigid pavement responses. Int J Pavement Eng. 2012;13(3):244–58. doi:10.1080/10298436.2011.623780. [Google Scholar] [CrossRef]
15. Zhuang W, Bi Y, Liu B, Hou D, Jing S, Lu X, et al. Mechanical properties of polyurethane mixture and load response behaviour of polyurethane composite pavement. Polymers. 2023;15(2):417. doi:10.3390/polym15020417. [Google Scholar] [PubMed] [CrossRef]
16. Wang T, Dong Z, Xu K, Ullah S, Wang D, Li Y. Numerical simulation of mechanical response analysis of asphalt pavement under dynamic loads with non-uniform tire-pavement contact stresses. Constr Build Mater. 2022;361(5):129711. doi:10.1016/j.conbuildmat.2022.129711. [Google Scholar] [CrossRef]
17. Zhang J, Cao D, Zhang J. Three-dimensional modelling and analysis of fracture characteristics of overlaid asphalt pavement with initial crack under temperature and traffic loading. Constr Build Mater. 2023;367(3):130306. doi:10.1016/j.conbuildmat.2023.130306. [Google Scholar] [CrossRef]
18. Zhu Z, Li X. Laminated composite plate model considering interfacial imperfection based on quasi-conforming element technique. Int J Numer Meth Eng. 2025;126(6):e70029. doi:10.1002/nme.70029. [Google Scholar] [CrossRef]
19. Giffin BD, Zoller MJ. A layered solid finite element formulation with interlaminar enhanced displacements for the modeling of laminated composite structures. Int J Numer Meth Eng. 2024;125(23):e7581. doi:10.1002/nme.7581. [Google Scholar] [CrossRef]
20. Cao Y, Zhang F, Sha A, Liu Z, Li J, Hao Y. Energy harvesting performance of a full-pressure piezoelectric transducer applied in pavement structures. Energy Build. 2022;266(14):112143. doi:10.1016/j.enbuild.2022.112143. [Google Scholar] [CrossRef]
21. Hou Z, Cao D, Peng P, Ding X, Ma T, Cheng J. Analysis of strain transfer characteristics of fiber Bragg gratings for asphalt pavement health monitoring. Materials. 2025;18(15):3489. doi:10.3390/ma18153489. [Google Scholar] [PubMed] [CrossRef]
22. Wang H, Xiang P, Jiang L. Optical fiber sensor based in-field structural performance monitoring of multilayered asphalt pavement. J Light Technol. 2018;36(17):3624–32. doi:10.1109/JLT.2018.2838122. [Google Scholar] [CrossRef]
23. Wang HP, Wu YB, Zhang C, Xiang P. Monitoring data motivated health condition assessment of cement concrete pavements in field based on FBG sensing technology. Struct Health Monit. 2025;24(5):3088–119. doi:10.1177/14759217241268821. [Google Scholar] [CrossRef]
24. Liu X, Wang H, Wu Q, Wang Y. Uncertainty-based analysis of random load signal and fatigue life for mechanical structures. Arch Comput Meth Eng. 2022;29(1):375–95. doi:10.1007/s11831-021-09579-6. [Google Scholar] [CrossRef]
25. Mindlin RD. Force at a point in the interior of a semi-infinite solid. Physics. 1936;7(5):195–202. doi:10.1063/1.1745385. [Google Scholar] [CrossRef]
26. Pan E. Static Green’s functions in multilayered half spaces. Appl Math Model. 1997;21(8):509–21. doi:10.1016/S0307-904X(97)00053-X. [Google Scholar] [CrossRef]
27. Ai ZY, Gu GL, Zhao YZ, Yang JJ. An exact solution to layered transversely isotropic poroelastic media under vertical rectangular moving loads. Comput Geotech. 2021;138(5):104314. doi:10.1016/j.compgeo.2021.104314. [Google Scholar] [CrossRef]
28. Ba Z, Liang J. Fundamental solutions of a multi-layered transversely isotropic saturated half-space subjected to moving point forces and pore pressure. Eng Anal Bound Elem. 2017;76(2):40–58. doi:10.1016/j.enganabound.2016.12.006. [Google Scholar] [CrossRef]
29. Ai ZY, Feng WY, Zhao YZ. Analytical layer element analysis for non-axisymmetric problem of multilayered thermoelastic media. Comput Geotech. 2022;147(2):104759. doi:10.1016/j.compgeo.2022.104759. [Google Scholar] [CrossRef]
30. Ai ZY, Jiang XB, Hu YD. Analytical layer-element solution for 3D transversely isotropic multilayered foundation. Soils Found. 2014;54(5):967–73. doi:10.1016/j.sandf.2014.09.002. [Google Scholar] [CrossRef]
31. Nam MH, Lee KH. Unsymmetrically loaded cylindrical tank on elastic foundation. J Eng Mech. 2000;126(12):1257–61. doi:10.1061/(asce)0733-9399(2000)126:12(1257). [Google Scholar] [CrossRef]
32. Ai ZY, Yue ZQ, Tham LG, Yang M. Extended Sneddon and Muki solutions for multilayered elastic materials. Int J Eng Sci. 2002;40(13):1453–83. doi:10.1016/S0020-7225(02)00022-8. [Google Scholar] [CrossRef]
33. Chen YZ. Transfer matrix method for solution of FGMs thick-walled cylinder with arbitrary inhomogeneous elastic response. Smart Struct Syst. 2018;21(4):469–77. [Google Scholar]
34. Wang H, Al-Qadi IL. Evaluation of surface-related pavement damage due to tire braking. Road Mater Pavement Des. 2010;11(1):101–21. doi:10.3166/rmpd.11.101-121. [Google Scholar] [CrossRef]
35. Jia X, Hu W, Zhu D. Investigation of interlayer shear failure of concrete bridge deck asphalt overlay utilizing shear strength envelopes. Eng Fail Anal. 2021;123(7):105278. doi:10.1016/j.engfailanal.2021.105278. [Google Scholar] [CrossRef]
36. Li S, Liu X, Liu Z. Interlaminar shear fatigue and damage characteristics of asphalt layer for asphalt overlay on rigid pavement. Constr Build Mater. 2014;68(1):341–7. doi:10.1016/j.conbuildmat.2014.06.053. [Google Scholar] [CrossRef]
37. Patil VA, Sawant VA, Deb K. 2-D finite element analysis of rigid pavement considering dynamic vehicle-pavement interaction effects. Appl Math Model. 2013;37(3):1282–94. doi:10.1016/j.apm.2012.03.034. [Google Scholar] [CrossRef]
38. Sawant V. Dynamic analysis of rigid pavement with vehicle-pavement interaction. Int J Pavement Eng. 2009;10(1):63–72. doi:10.1080/10298430802342716. [Google Scholar] [CrossRef]
39. Wang HP, Ni YQ, Dai JG, Yuan MD. Interfacial debonding detection of strengthened steel structures by using smart CFRP-FBG composites. Smart Mater Struct. 2019;28(11):115001. doi:10.1088/1361-665x/ab3add. [Google Scholar] [CrossRef]
40. Zhang C, Lai SX, Wang HP. Structural modal parameter recognition and related damage identification methods under environmental excitations: a review. Struct Durab Health Monit. 2025;19(1):25–54. doi:10.32604/sdhm.2024.053662. [Google Scholar] [CrossRef]
41. Chen C, Wang HP, He SZ, Chen J, Sun L. Fatigue performance analysis of carbon fiber reinforced polymer composite antenna beam under random vibration actions based on FBG sensor array. Chin J Appl Mech. 2025:1–12. (In Chinese). [Google Scholar]
42. Liu R, Li C, Wang L, Zhang X, Li G. Multi-objective design of blending fuel by intelligent optimization algorithms. Trans Tianjin Univ. 2024;30(3):221–37. doi:10.1007/s12209-024-00393-2. [Google Scholar] [CrossRef]
43. Zhou Y, Di S, Xiang C, Li W, Wang L. Damage identification in simply supported bridge based on rotational-angle influence lines method. Trans Tianjin Univ. 2018;24(6):587–601. doi:10.1007/s12209-018-0135-9. [Google Scholar] [CrossRef]
44. Wang HP, Li GZ, Wang TC, Wu YB, Peng BR. Long-term monitoring data motivated structural performance assessment of cement concrete pavement structures built with FBG sensors in field. Road Mater Pavement Des. 2025:1–34. doi:10.1080/14680629.2025.2542240. [Google Scholar] [CrossRef]
45. Saffari PR, Thongchom C, Jearsiripongkul T, Saffari PR, Keawsawasvong S, Kongwat S. Thermo-vibro-acoustic analysis of pavement under a harmonically rectangular moving load. Int J Thermofluids. 2023;20:100409. doi:10.1016/j.ijft.2023.100409. [Google Scholar] [CrossRef]
46. Nega A, Gedafa D, Nikraz H. Stress and strain characteristics in flexible pavement using three-dimensional nonlinear finite element analysis. Int J Pavement Res Technol. 2024;17(6):1498–512. doi:10.1007/s42947-024-00422-2. [Google Scholar] [CrossRef]
47. Wang X, Fan B, Ma X, Liu X, Deng H, Hu X. Structure design and fatigue performance of rigid-flexible composite pavement using engineered cementitious composites (ECC). Constr Build Mater. 2025;465(3):140165. doi:10.1016/j.conbuildmat.2025.140165. [Google Scholar] [CrossRef]
48. Lyu ST, Zhao P, Lu WW, Peng XH, Wang JP, Chen Q, et al. Review on long-life-oriented life extension design of existing expressway asphalt pavement. J Traffic Transp Eng. 2024;24(2):20–49. (In Chinese). doi:10.19818/j.cnki.1671-1637.2024.02.002. [Google Scholar] [CrossRef]
Cite This Article
 Copyright © 2025 The Author(s). Published by Tech Science Press.
This work is licensed under a Creative Commons Attribution 4.0 International License , which permits unrestricted use, distribution, and reproduction in any medium, provided the original work is properly cited.
 Downloads
 Citation Tools