
 Submit a Paper
 Propose a Special lssue
 Open Access
ARTICLE
An Explainable Deep Learning Framework for Kidney Cancer Classification Using VGG16 and Layer-Wise Relevance Propagation on CT Images
1 School of Computer Science, National College of Business Administration and Economics, Lahore, 5400, Pakistan
2 Department of Computer Science and Engineering, College of Applied Studies, King Saud University, Riyadh, 11543, Saudi Arabia
3 Computer Science and Engineering, Saveetha School of Engineering, Saveetha Institute of Medical and Technical Sciences, Chennai, 602105, Tamilnadu
4 Applied Science Research Center, Applied Science Private University, Amman, 11931, Jordan
5 Department of Software, Faculty of Artificial Intelligence and Software, Gachon University, Seongnam-si, 13557, Republic of Korea
6 Department of Computer Science, College of Computer and Information Sciences, King Saud University, Riyadh, 11633, Saudi Arabia
* Corresponding Authors: Khan Muhammad Adnan. Email: ; Ahmad Almogren. Email:
Computer Modeling in Engineering & Sciences 2025, 145(3), 4129-4152. https://doi.org/10.32604/cmes.2025.073149
Received 11 September 2025; Accepted 14 November 2025; Issue published 23 December 2025
 View Full Text
 Download PDF
Abstract
Early and accurate cancer diagnosis through medical imaging is crucial for guiding treatment and enhancing patient survival. However, many state-of-the-art deep learning (DL) methods remain opaque and lack clinical interpretability. This paper presents an explainable artificial intelligence (XAI) framework that combines a fine-tuned Visual Geometry Group 16-layer network (VGG16) convolutional neural network with layer-wise relevance propagation (LRP) to deliver high-performance classification and transparent decision support. This approach is evaluated on the publicly available Kaggle kidney cancer imaging dataset, which comprises labeled cancerous and non-cancerous kidney scans. The proposed model achieved 98.75% overall accuracy, with precision, recall, and F1-score each exceeding 98% on an independent test set. Crucially, LRP-derived heatmaps consistently localize anatomically and pathologically significant regions such as tumor margins in agreement with established clinical criteria. The proposed framework enhances clinician trust by delivering pixel-level justifications alongside state-of-the-art predictive performance. It facilitates informed decision-making, thereby addressing a key barrier to the clinical adoption of DL in oncology.Keywords
Cancer remains one of the leading causes of morbidity and mortality worldwide, posing a significant global health challenge. Nearly 20 million new cancer cases and 9.7 million deaths were reported in 2022, with projections indicating a 77% increase by 2050, disproportionately affecting low- and medium-HDI countries [1]. Among cancers, kidney cancer ranks 14th globally, with over 430,000 new cases and nearly 156,000 deaths in 2022, emphasizing the critical need for early diagnosis and effective treatment strategies [2]. This highlights the importance of focusing on renal cell carcinoma (RCC), the primary form of kidney cancer.
RCC represents approximately 2% of global cancer cases. While localized RCC has a 5-year survival of 93%, metastatic disease drops to 12%, underscoring the need for early detection and improved management [3]. Epidemiological studies show that RCC incidence and outcomes vary regionally, with Asia, Europe, and North America showing distinct cases and mortality distributions. Men face a higher incidence and more aggressive disease, and Africa is expected to see the sharpest increase [4]. The risk profile for RCC includes male sex, obesity, hypertension, smoking, and chronic kidney disease. Clear cell RCC is the predominant subtype, and early diagnosis depends heavily on imaging modalities such as CT and MRI [5].
Most RCC cases are asymptomatic and are detected incidentally, while symptomatic cases usually indicate advanced disease with poorer survival [6]. Symptom-based detection is unreliable, emphasizing the need for non-invasive screening and biomarker development to enable earlier diagnosis [7]. Advances in multiparametric MRI and molecular imaging (e.g., 99mTc-sestamibi SPECT/CT, girentuximab PET/CT) increasingly enable accurate subtype prediction and differentiation of benign renal masses, while radiomics and AI promise “virtual biopsy” capabilities. However, realizing clinical benefit requires robust data management, standardization, and explainable AI methods to ensure generalizability and regulatory translation [8]. Imaging remains central in RCC management, with contrast-enhanced CT as the gold standard for diagnosis, staging, and subtyping, complemented by MRI and ultrasound. A biopsy is often required for definitive histological confirmation [9].
Despite improvements, conventional modalities sometimes fail to distinguish benign from malignant lesions, contributing to overtreatment. Building on these advances, the integration of AI into medical imaging represents the next frontier, enabling automated image analysis, radiogenomics, and precision diagnostics. While AI enhances diagnostic accuracy and treatment planning, its clinical translation requires solutions to challenges in data standardization, generalizability, and explainability [10].
The integration of AI and radiomics into clinical workflows has further enhanced diagnostic accuracy, grading, and prognosis, including RCC subtype classification and personalized treatment planning [11]. Early detection frameworks using segmentation, classification, and object detection improve diagnostic efficiency, sometimes exceeding radiologist performance, while methods like multi-task learning and synthetic image generation enhance training and model robustness [12].
ML and DL, particularly convolutional neural networks (CNNs) and transfer learning (TL), reduce reliance on handcrafted features and improve reproducibility in imaging studies [13]. Models such as SVM and Multilayer Perceptron (MLP) applied to CT or MRI data achieve high accuracy, although limitations remain due to dataset size and potential overfitting [14]. Broader reviews confirm the strong performance of CNN-based classification networks (e.g., ResNet50V2) and segmentation models (V-Net, 3D U-Net), highlighting the need for larger, diverse datasets and multi-task learning approaches [15]. Integrating CT imaging with clinical metadata enhances RCC diagnosis and surgical decision-making. Frameworks using DenseAUXNet201 and YOLOv7 achieved 85%–90% accuracy for subtype classification and treatment planning [16].
Similarly, MRI-based texture analysis can distinguish low- from high-grade RCC, demonstrating the potential of non-invasive preoperative grading with 86%–95% accuracy [17]. DL frameworks such as kidney Cancer Detection and Classification employing a Snake Optimizer with DL on Pathological Images (KCDC-SODLPI) incorporate preprocessing, feature extraction, hyperparameter tuning, and classification, achieving high accuracy and low computational time for RCC histopathology analysis [18]. RCC Grading Network (RCCGNet), using Shared Channel Residual (SCR) blocks, enables automated grading of RCC from histopathology slides, achieving high accuracy, precision, and F1-score while remaining computationally efficient [19].
ResNet-based Directed Acyclic Graph–Support Vector Machine (DAG-SVM) frameworks classify RCC subtypes and predict survival outcomes from histopathology images, identifying morphological biomarkers associated with prognosis [20].
Comparative analysis of ML models, including DT, XGBoost, KNN, RF, and SVM, shows that SVM achieves superior accuracy for kidney tumor classification, though explainability and single-dataset reliance remain limitations [21]. Radiomics combined with ML differentiates small RCC from AMLwvf using multiphasic CT images, with shape and first-order statistical features serving as reliable imaging biomarkers [22]. Decision support systems like Convolutional Integrated Deep Learning–Based Decision Support System for Kidney Cancer (CIDL-DSSKC) demonstrate high accuracy and efficiency in automated kidney cancer detection from CT images, supporting clinical workflow improvements [23]. Recent studies, such as Multi-scale Graph Learning for Ovarian Tumor Segmentation from CT Images [24], highlight advancements in CT-based tumor analysis, motivating the present study’s focus on explainable kidney cancer classification.
Evaluations of multiple DL architectures, including DenseNet-201, show near-perfect accuracy in kidney cancer detection, further enhancing clinical decision support [25]. Comprehensive reviews highlight the expanding role of DL in RCC imaging, with CNN architectures proving particularly effective for segmentation and classification tasks. Nonetheless, key challenges remain, notably dataset imbalance and the limited interpretability of DL models, which hinder reliable clinical adoption [26]. DL applications in RCC imaging demonstrate high accuracy in tumor classification, grading, and prognosis prediction, while emphasizing the need for larger datasets, standardized protocols, and explainable AI [27]. Deep neural networks for RCC, also showed high accuracy in subtype classification (93.5%) and survival prediction (81%). CNNs like ResNet performed best, demonstrating that DNNs can aid pathologists in diagnosis and prognosis, though further large-scale validation is needed [28].
Finally, surveys of ML and DL techniques in kidney cancer show significant improvements in early detection, classification, and segmentation, while highlighting challenges related to dataset diversity, class imbalance, and model complexity [29].
Understanding human interaction with AI is equally important. Explanations from AI systems can reduce human overreliance when decision-makers strategically weigh the costs and benefits of verifying predictions. Studies show that task difficulty, explanation clarity, and perceived benefits are key factors in fostering appropriate reliance, emphasizing the importance of interpretable AI frameworks in improving human-AI collaboration [30].
The field of XAI addresses the need for transparency and interpretability in AI systems. A unified framework defines explanations as processes that describe facts to facilitate human understanding and interpretations as the assignment of meaning, structuring XAI methods around What, How, and Why, and enabling standardized evaluation of methods such as LIME, SHAP, and MDNet [31].
Despite these achievements, AI models continue to face limitations of reproducibility and interpretability. Reviews across multiple diseases note challenges related to data noise, missing values, and uncertainty. To address this, Refs. [32,33] highlight the importance of XAI techniques such as saliency maps, feature visualization, and proxy models. These methods not only enhance transparency but also strengthen clinician trust, paving the way for safer and more reliable integration of AI into Kidney cancer diagnosis and precision oncology.
Building on these advances, there is a growing need for explainable DL frameworks that not only achieve high accuracy in kidney cancer detection and classification but also provide interpretability to support clinical decision-making. CNNs such as VGG16, combined with techniques like LRP, offer the potential to highlight image regions contributing to model predictions, thereby enhancing transparency and trust in automated diagnosis. Motivated by these requirements, this study employs the VGG16 architecture augmented with an LRP-based XAI technique to achieve high diagnostic performance and interpretability. By illustrating relevance maps alongside classification outputs, the proposed approach aims to deliver a powerful yet transparent tool for early kidney cancer detection, bridging the gap between state-of-the-art DL capabilities and real-world clinical applicability.
The remainder of paper is organized as follows: Section 2 reviews related work on AI-based kidney cancer diagnostics; Section 3 details the methodology, including the VGG16 model design and LRP-based XAI integration; Section 4 reports experimental results and provides a comprehensive performance analysis; and Section 5 offers concluding remarks, discusses limitations, and outlines directions for future research.
Kidney cancer, predominantly RCC, presents a significant clinical challenge due to its often asymptomatic early stages and its propensity for rapid progression to advanced, treatment-resistant disease. Although advancements in imaging modalities and minimally invasive biopsy techniques have improved detection, conventional diagnostic pathways still yield under- and over diagnosis, with profound implications for patient outcomes. Recent research has focused on integrating molecular biomarkers, ML algorithms, and novel imaging approaches to enhance diagnostic precision.
Early work by Ali et al. [34] demonstrated the utility of miRNA profiles for RCC subtype classification using data from The Cancer Genome Atlas (TCGA). By applying neighborhood component analysis, the research reduced 1627 candidate miRNAs to a panel of 35. They trained long short-term memory (LSTM) network that achieved classification accuracies of 97.2% using all features and 95.4% with the reduced panel. This study underscored the potential of compact, informative biomarker sets for non-imaging diagnostics.
Building on molecular diagnostics, another team [35] combined histopathology imaging with proteomics to diagnose clear cell RCC (ccRCC). They employed a VGG16-based CNN on 783 H&E-stained whole-slide images (95% accuracy) alongside the RF classifier trained on 9964 proteomic features (98% accuracy). Their multi-omics AI framework demonstrates how complementary data streams can significantly enhance diagnostic performance.
Meanwhile, the field of radiogenomics has gained attention. Kocak et al. [36] utilized high-dimensional CT texture features and an RF model to predict (polybromo-1) PBRM1 mutation status in ccRCC, achieving 95.0% accuracy on augmented corticomedullary-phase images. This radiogenomic approach outperformed an artificial neural network baseline, highlighting the promise of non-invasive genotypic profiling.
Similarly, another research group [37] modified GoogLeNet with TL to classify RCC subtypes (clear cell, papillary, chromophobe) across three CT phases. Trained on 169 biopsy-verified cases, their model reached 84.8%–88.8% accuracy, though a need for larger and balanced datasets was emphasized to enhance multi-class performance further.
To address the kidney cancer prognostic prediction, Ref. [38] introduced COST-HDL, a cost-sensitive hybrid DL framework that fused TCGA gene-expression data with clinical variables. Their deep autoencoder–focal-loss network achieved 96.98% accuracy for primary diagnosis but reported more moderate performance for tumor stage (56.70%) and vital status (76.72%), reflecting the inherent complexity of prognostic modeling.
In the domain of MRI, Ref. [39] trained a ResNet50 CNN on T2- and contrast-enhanced T1-weighted scans from 430 stage I–II RCC lesions. The network successfully distinguished low (I–II) from high (III–IV) histological grades with 88% accuracy (sensitivity 89%, specificity 88%) on held-out Fuhrman-graded cases, and 83% accuracy (sensitivity 92%, specificity 78%) on an independent WHO/ISUP cohort.
Using transcriptomics for staging, Ref. [40] applied a three-step feature selection pipeline to TCGA RNA-seq profiles, yielding a 23-gene prognostic signature (“FJL set”). Among five classifiers, an SVM attained 81.15% accuracy in distinguishing early (I/II) from late (III/IV) ccRCC on an external test set, outperforming previous gene panels.
Turning back to CT imaging, Ref. [41] developed RC-CAD, a two-stage computer-assisted diagnosis system using multiphase contrast-enhanced features and a multilayer perceptron. Stage 1 differentiated RCC from angiomyolipoma (AML) with zero AML misclassifications, while Stage 2 achieved 89.6% accuracy in ccRCC vs. non-ccRCC classification.
An end-to-end deep model [42] further streamlined CT analysis by combining 3D CNN-based segmentation with subtype classification. This framework demonstrated up to 72% accuracy, surpassing radiologist performance on key differentiation tasks, although work done noted room for improving classification robustness.
Ultrasound, a notoriously noisy modality, has also benefited from AI [43], which proposed a pipeline integrating a 59-layer residual network for blind despeckling with a ResNet-101 + SVM classifier. On 4940 augmented images, peak tumor detection accuracy reached 87.31% under low noise but fell to 70.19% at high noise, underscoring the critical role of preprocessing.
Expanding to MRI patches, Ref. [44] fine-tuned AlexNet to distinguish ccRCC from oncocytoma in 243 pathologically confirmed lesions. The model achieved 91% accuracy in five-fold cross-validation and 81% on a held-out test, though limited oncocytoma samples and the absence of external validation constrained its generalizability.
On CT again, Ref. [45] trained six CNN architectures, including MobileNetV2, which achieved 96.86% validation and 93.33% test accuracy, for papillary vs. chromophobe RCC, outperforming radiologists (85%). However, the study lacked multicenter validation and relied on manual segmentations.
Fusing scales in histopathology, Ref. [46] developed a multiscale multiple-instance ResNet-50 that processed whole-slide images at three magnifications. On 52 slides, the system achieved 93% ± 4.9% accuracy and 95.6% ± 5.2% specificity in ccRCC subtyping, mirroring the pathologist’s multi-view review process.
Classic vs. DL comparisons by [47] showed Light Gradient Boosting Machine (GBM) (94.09%) and DenseNet-121 (98.22%) performance on CT-based tumor classification, yet both suffered under speckle noise, indicating a need for models robust to real-world variability.
Combining biochemical and imaging data, Ref. [48] introduced a multimodal CNN trained on the kidney CT dataset, achieving 88% overall accuracy and F1-scores above 0.88 across normal, cyst, stone, and tumor classes, highlighting the synergy of tabular and image features.
Finally, Refs. [49,50] explored multi-subtype classification: Ref. [49] trained Inception V3 and ResNet-50 on 554 contrast-enhanced CT scans to classify five renal histologic tumor subtypes (max 84.9% accuracy). At the same time, Ref. [50] fused DenseNet-extracted MRI features into an SVM (90% accuracy across ccRCC, chromophobe RCC (chRCC), and papillary RCC (pRCC)). Both studies, although promising, faced dataset imbalance and lacked built-in explainability.
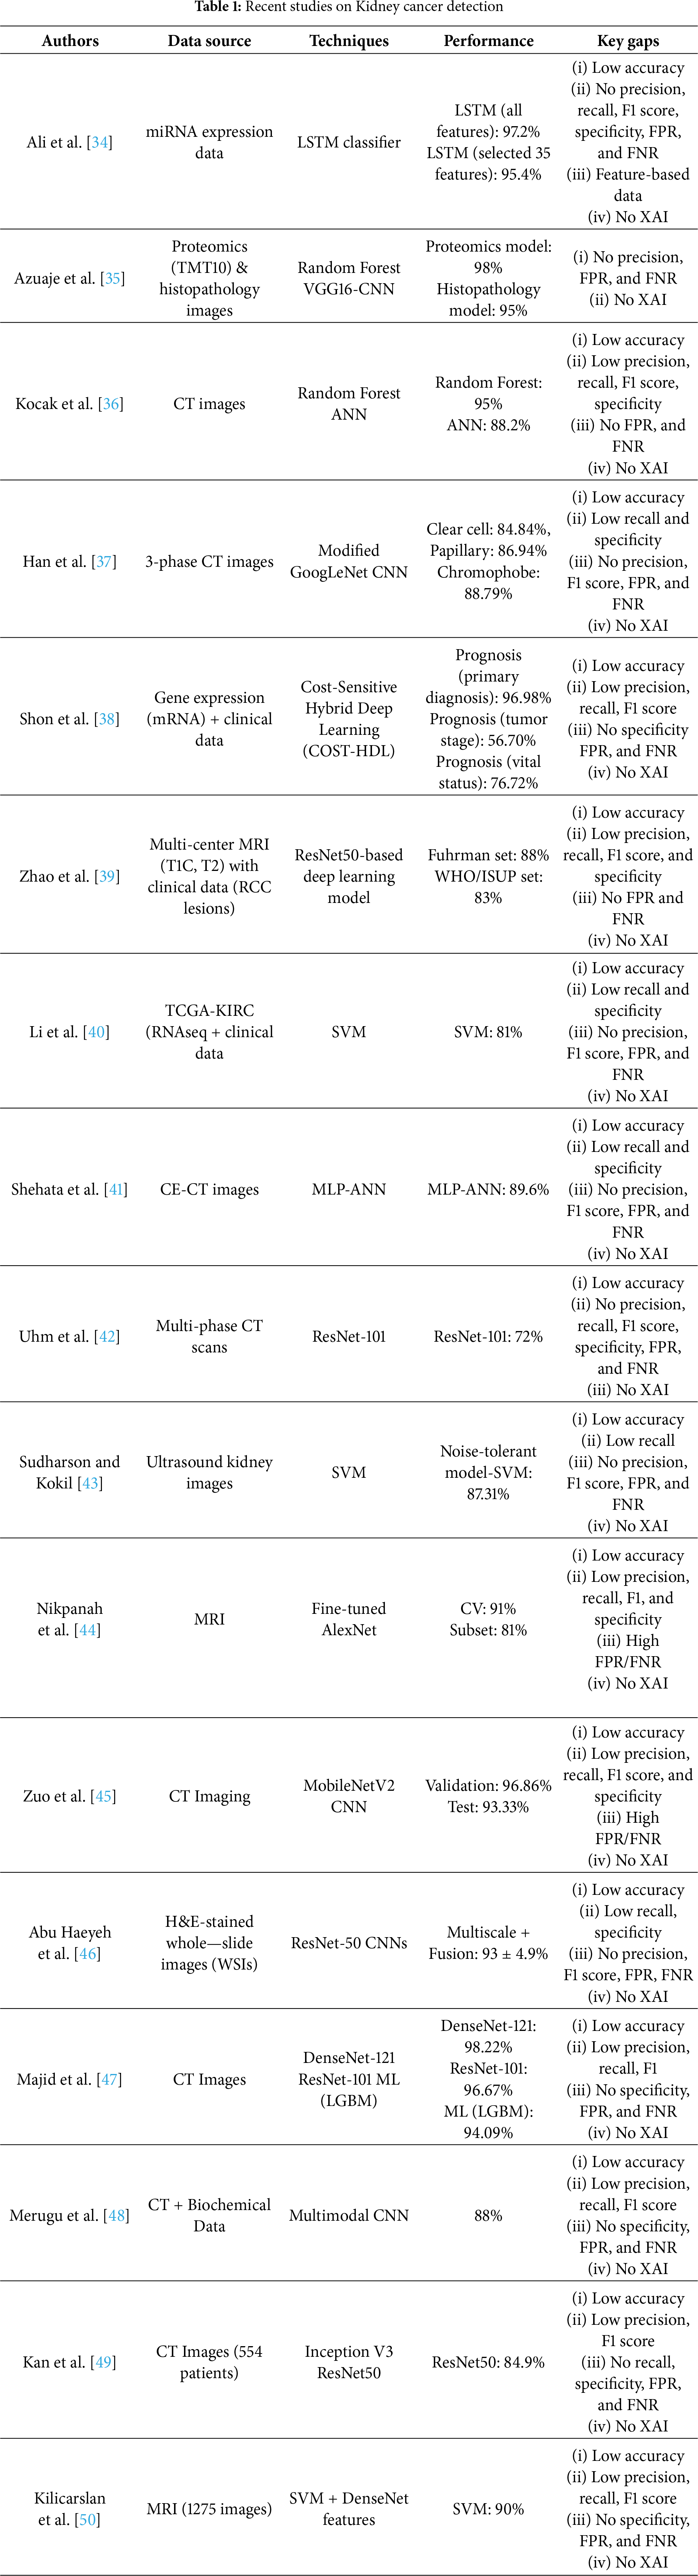
While existing literature has made valuable contributions to the field, some areas could benefit from further exploration. Table 1 presents the most recent AI-based methods for diagnosing kidney cancer, highlighting datasets, approaches, performance, and current methodological limitations. Although some models exhibit high performance, they often do not scale easily to other downstream tasks, become less interpretable, or are influenced by poor data quality or class imbalance. The cumulative lack of XAI in all these studies highlights the requirement for interpretable models in clinical studies.
Motivation and Key Contributions
Despite notable advances in applying DL to kidney cancer diagnosis, three critical challenges persist: interpretability, diagnostic accuracy, and generalizability. Most models available today are “black boxes”, providing the model user with little to no explanation of their decision-making, resulting in reduced clinical confidence and adoption. Furthermore, many approaches fall short of the rigorous sensitivity and specificity required for early-stage detection, and performance often degrades when confronted with heterogeneous data sources or real-world imaging protocols.
This research article introduces an explainable DL framework for kidney cancer detection in CT images to address these gaps. This study achieves state-of-the-art classification performance by integrating a fine-tuned VGG16 backbone with LRP while producing pixel-level heatmaps aligned with radiological expertise.
The principal contributions of this paper are as follows:
1. VGG16-Based TL Framework: A deep TL model, fine-tuned on a publicly available kidney cancer CT dataset, autonomously extracts discriminative features to distinguish cancerous from non-cancerous renal tissue, achieving 98.75% accuracy, a clear improvement compared to previous approaches.
2. LRP-Driven Interpretability: The LRP module generates high-resolution, pixel-level heatmaps that transparently expose the image regions driving each prediction. This makes the model transparent, shows model interpretability, aligns model outputs with clinical reasoning, and enhances practitioner confidence.
3. Rigorous Multi-Metric Validation: Comprehensive evaluation across accuracy, misclassification rate, precision, sensitivity (recall), specificity, false positive rate (FPR), false negative rate (FNR), and F1-score establishes the model’s robustness and reliability on a held-out test set.
4. State-of-the-Art Benchmarking: Comparative analysis against existing AI-driven kidney cancer diagnostic approaches [34–51] demonstrates superior accuracy, underscoring the framework’s potential to advance clinical decision support in oncology.
AI techniques can provide significant benefits for routine screening and early detection of kidney cancer. Fig. 1 presents the proposed framework, which combines DL and XAI to classify kidney cancer from CT images into two main phases: training and testing. The dataset comprises abdominal CT scans in JPEG format (512 × 512 pixels), labeled as kidney cancer or normal. All images are resized to 224 × 224 × 3 to standardize input dimensions, and the dataset is randomly partitioned into 80% for training and 20% for testing while preserving class balance.
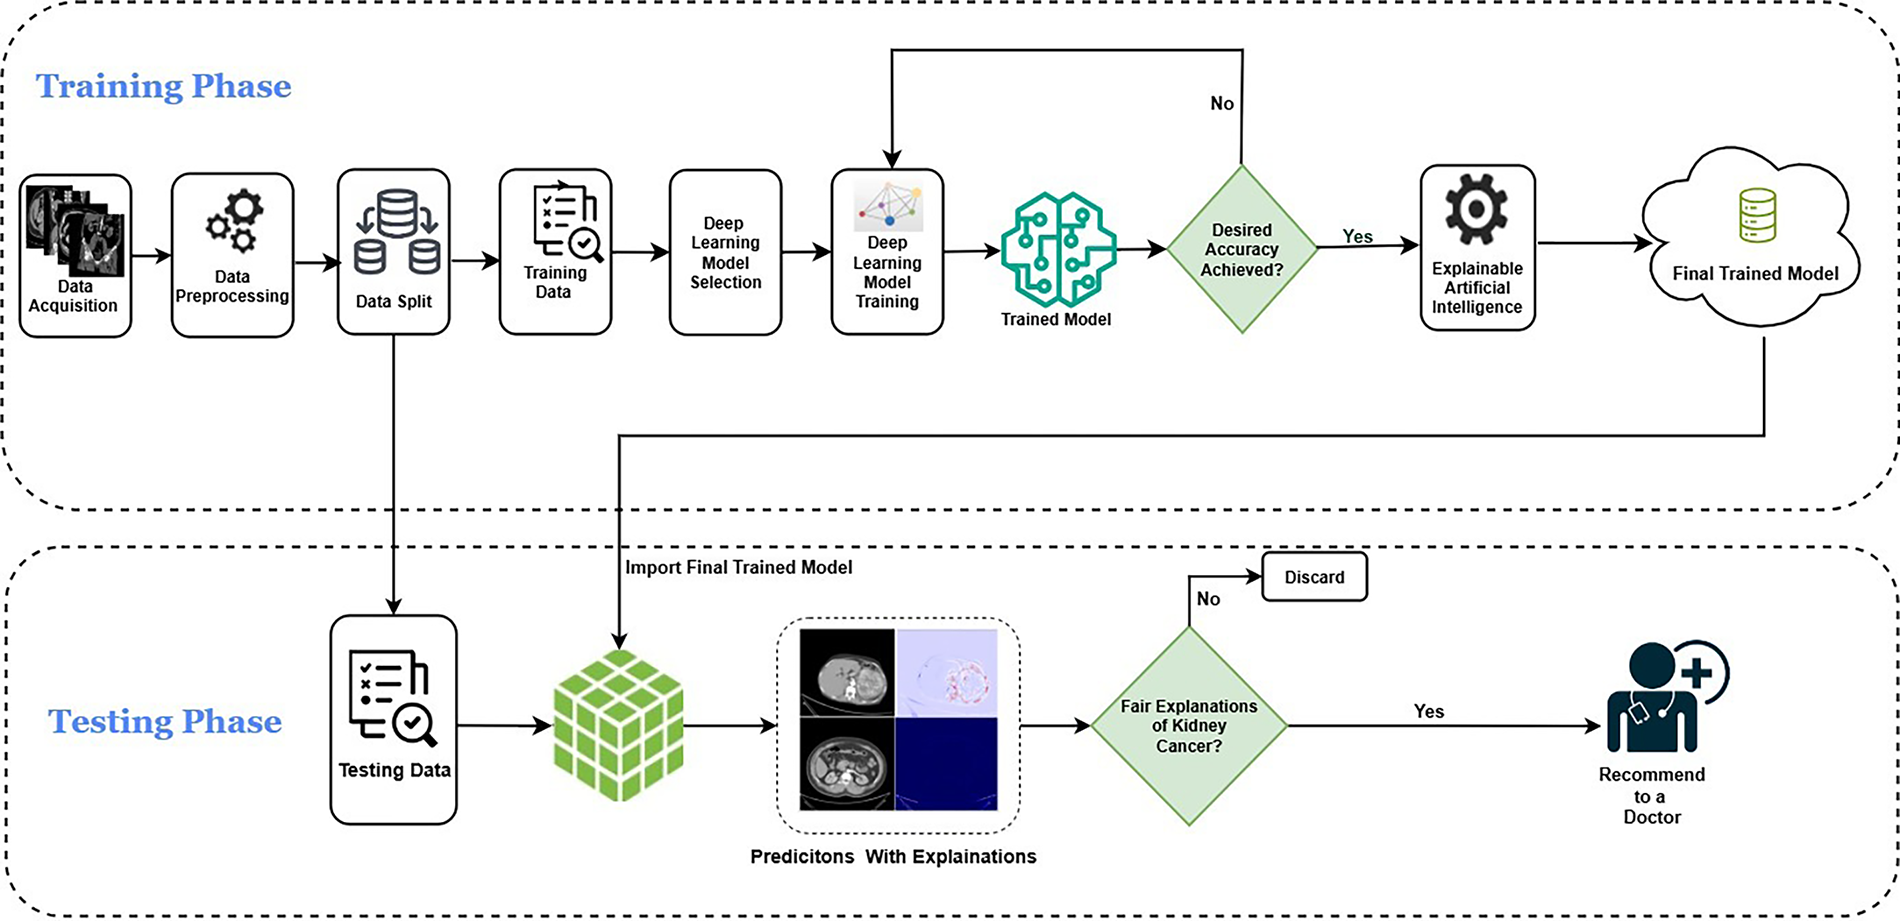
Figure 1: The proposed kidney cancer identification model using DL empowered with XAI
In the training phase, the preprocessed training images are fed into a VGG16 backbone pretrained on ImageNet and adapted through TL. Lower convolutional layers remain frozen to retain generic visual features, while deeper layers are fine-tuned to capture disease-specific representations. The classification head is replaced with a two-unit softmax layer for binary prediction. Training is performed using categorical cross-entropy loss and the Adam optimizer, with early stopping applied to prevent overfitting. Model performance is iteratively monitored, and once the target accuracy is achieved, LRP is employed to ensure interpretability of the predictions. The final trained model is then stored securely in a cloud environment for subsequent evaluation. In this architecture, data integrity and model security are critical. The proposed framework can incorporate encryption during data transmission and storage to mitigate unauthorized interception. Moreover, using secure authentication protocols and blockchain-based audit trails can enhance traceability and prevent model tampering, ensuring trustworthy AI operations in medical contexts.
In the testing phase, the cloud-stored model is retrieved and applied to the held-out test data, which undergoes the same preprocessing pipeline. The model generates predictions that are further explained using LRP, producing heatmaps that highlight the regions most relevant to the classification. These explanations are assessed for fairness and clinical plausibility; outputs failing to meet interpretability standards are discarded, while valid and clinically aligned results are retained. The final predictions and their corresponding explanations are then recommended to medical experts for potential use in diagnostic decision-making.
This cloud-based framework, depicted in Fig. 1, ensures that trained models are reproducible, scalable, and accessible for large-scale testing, multi-center validation, and future integration into AI-assisted clinical workflows.
This study employed a publicly available Kaggle dataset [51] of 10,000 labeled kidney CT images, evenly divided between cancerous and normal cases. The images encompass a diverse range of lesion presentations, ensuring comprehensive representation for model development. Fig. 2 illustrates representative CT images from both classes. To ensure ethical compliance and data protection, all dataset files were anonymized prior to use, removing any personally identifiable metadata or patient information. While the Kaggle dataset is publicly available, it was handled under privacy-preserving principles consistent with medical data governance standards such as HIPAA (Health Insurance Portability and Accountability Act) and GDPR (General Data Protection Regulation). In potential clinical deployment, data encryption and controlled access mechanisms would be essential to maintain patient confidentiality and prevent unauthorized access.
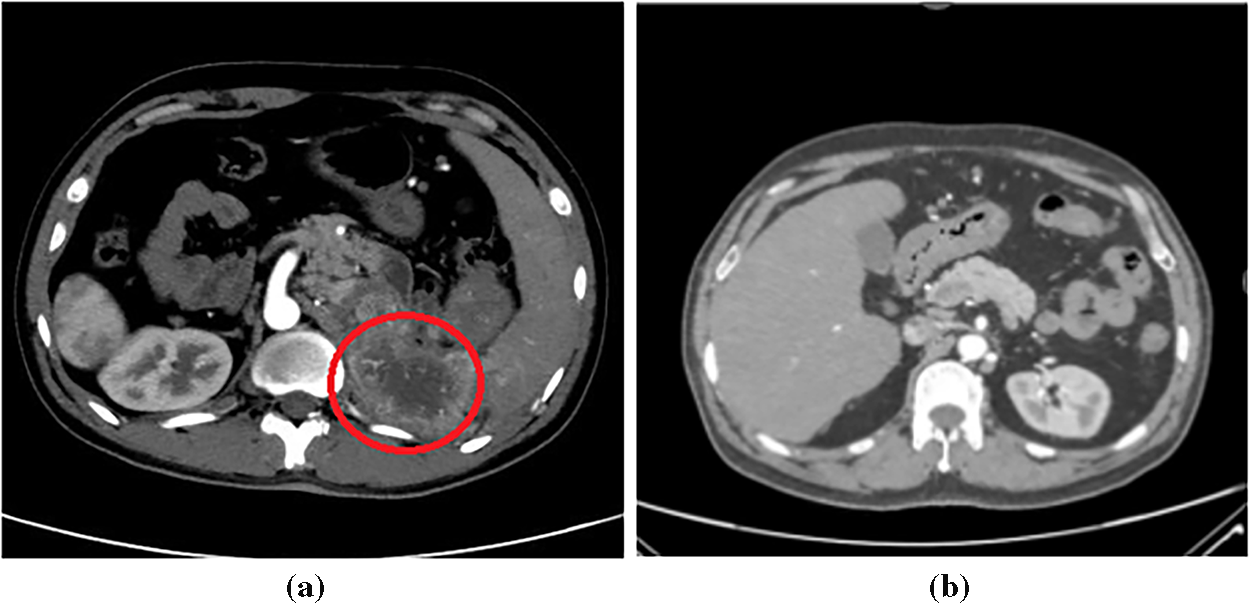
Figure 2: Sample kidney CT images: (a) Cancerous; (b) Normal
TL accelerates convergence and enhances generalizability by initializing the CNN with ImageNet-pretrained weights and by giving a strong starting point and enabling faster, higher-quality learning (higher start, higher slope, higher asymptote) [52,53]. In CNN-based transfer learning, the early layers typically capture basic visual properties such as edges, lines, and contours, which can be retained, while later layers are fine-tuned along with a task-specific classification head to adapt to the target domain [54]. This preserves stable foundational representations while adapting higher-order filters to renal lesion morphology and contrast patterns.
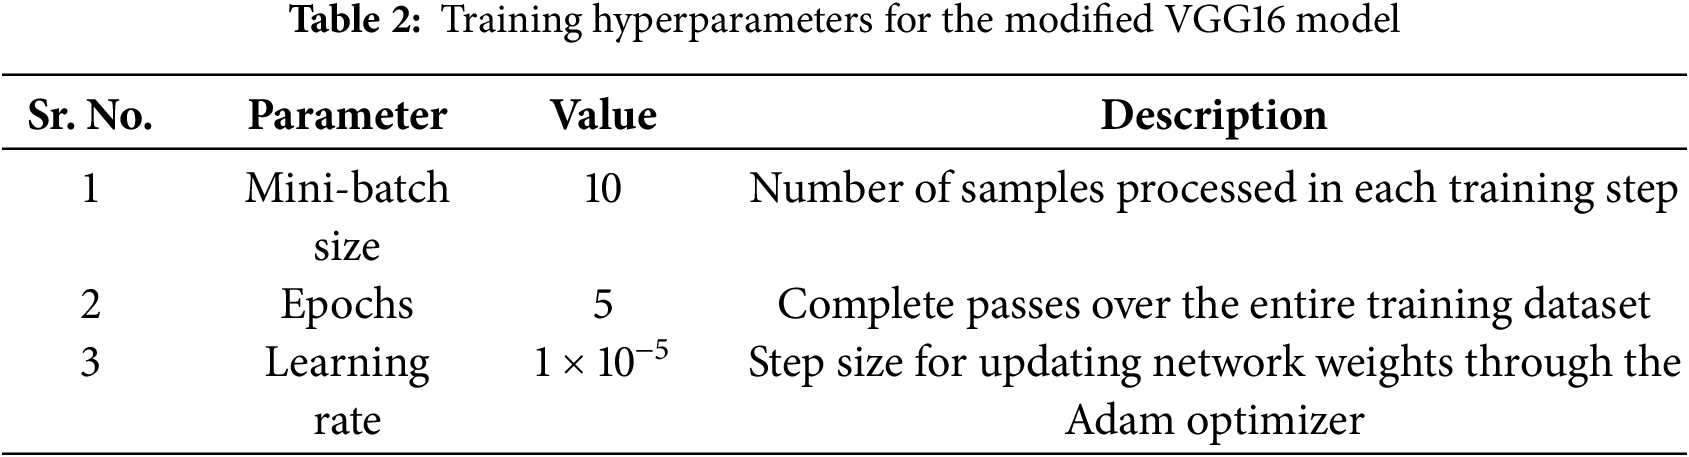
This study uses the VGG16 architecture [55] as a backbone, leveraging ImageNet pretraining for robust feature extraction. The convolutional layers up to block 3 were frozen to retain generic low-level representations, while the deeper convolutional blocks and the classifier were fine-tuned on the kidney CT dataset. Training employed the Adam optimizer with a learning rate of 1 × 10⁻⁵, batch size 10, and cross-entropy loss for 5 epochs without a scheduler. These hyperparameters were empirically selected to achieve stable convergence and high diagnostic accuracy.
3.3 Explainable Artificial Intelligence
Many DL models are inherently difficult to interpret. They often have millions of parameters and depend on intricate patterns and correlations that defy explanation. This complexity can lead to concerns about bias, privacy, ethics, fairness, and transparency [56]. XAI techniques address this opacity by generating interpretable outputs that reveal how an AI system makes its decisions, thereby fostering trust, fairness, and accountability in clinical applications [57].
This study employs LRP [58,59] to trace model decisions to individual input pixels. LRP propagates relevance scores from the output layer through the network, generating high-resolution heatmaps that pinpoint the image regions most responsible for each prediction [60]. By visualizing feature-level contributions, this research approach offers LRP that provides transparent insight into a model’s reasoning, thereby supporting validation and increasing trust in AI-driven decision-making across domains such as medical imaging and genomics [61].
Compared to gradient-based methods (e.g., Grad-CAM) or occlusion sensitivity, LRP offers finer spatial resolution, which is crucial for pinpointing subtle pathological structures in kidney CT scans. In addition to interpretability, explainability methods must safeguard sensitive data. XAI visualizations, especially pixel-level heatmaps, can inadvertently expose private anatomical details if misused. Hence, privacy-preserving explainable AI (PP-XAI) techniques—such as differential privacy during model training and controlled visualization access—should be adopted to prevent data leakage while maintaining transparency.
This section presents the experimental settings, training parameters, evaluation metrics, explainability visualizations, and benchmarking outcomes for the proposed DL model in kidney cancer classification. The model was developed using PyTorch, an open-source DL framework known for its flexibility and dynamic computational graph capabilities. PyTorch facilitated efficient design, training, and evaluation of the network architecture, supported by a broad range of libraries and a strong developer community.
Python 3.10 was the primary programming language due to its simplicity and robust ecosystem. Libraries such as NumPy, Pandas, and Matplotlib were employed for data preprocessing, visualization, and performance evaluation.
Google Colab was the development and execution environment, offering access to cloud-based GPUs and TPUs that significantly accelerated model training. All experiments were conducted within this platform using the free GPU runtime. The implementation leveraged PyTorch for model training, while supplementary libraries, including OpenCV and scikit-learn, were integrated for image processing, data manipulation, and metric computation. The experimental pipeline was designed to ensure reproducibility, scalability, and relevance for potential clinical research applications.
4.2 Training Configuration and Hyperparameters
The model was trained on 8000 images and tested on 2000 images. A detailed overview of the training hyperparameters on the modified VGG16-based model, along with their corresponding descriptions, is provided in Table 2.
To assess the model’s diagnostic performance, research employed the following metrics: true positives (Cp/Sp), denoting correctly identified cancerous kidneys; false negatives (Cn/Sn), indicating cancerous kidneys misclassified as normal; false positives (Ce/Se), representing healthy kidneys incorrectly classified as cancerous; and true negatives (Cm/Sm), corresponding to correctly identified normal kidneys.
This study derives key performance metrics from these counts that directly impact patient outcomes with Eqs. (1)–(8) [62,63]. These computed metrics encompassed accuracy, misclassification rate, precision, sensitivity, specificity, FPR, FNR, and F1 Score.
Accuracy is the ratio of correctly predicted observations to the total observations; it is the ratio of correct class predictions to the total predicted instances, expressed as a percentage.
The proportion of misclassified cases relative to the total number of predictions, which is usually expressed as a ratio or percentage of the total.
Precision measures the ratio of true positive predictions to the total positive predictions made by a model, emphasizing the accuracy of positive classifications.
Sensitivity is the true positive rate, which is the ratio of the true positive predictions to the observations that are positive by the model.
Specificity is the ratio of true negative predictions to all actual negative instances and characterizes a model’s ability to identify negatives correctly.
FPR depicts the ratio of incorrectly predicted positive samples to the actual negative samples and indicates the model’s misclassification of negatives to positives.
FNR is the proportion of false negative predictions to the number of true positive cases, indicating the model’s capability to misjudge the positive samples as negative.
The F1 Score is the harmonic mean of precision and sensitivity, providing a metric that balances both aspects of classification accuracy.
These metrics are calculated using a confusion matrix (CM).
A CM is a simple tabular tool for visualizing the performance of a classification model by comparing its predicted labels against the true (ground-truth) labels.
For the binary classification problem, the CM in Fig. 3 reports the model’s performance on the test set of 2000 images. For every 1000 non-cancer images, it classified 975 as non-cancer and 25 as cancer (false positives). All 1000 cancer images were predicted accurately, resulting in a good accuracy of 98.75%.
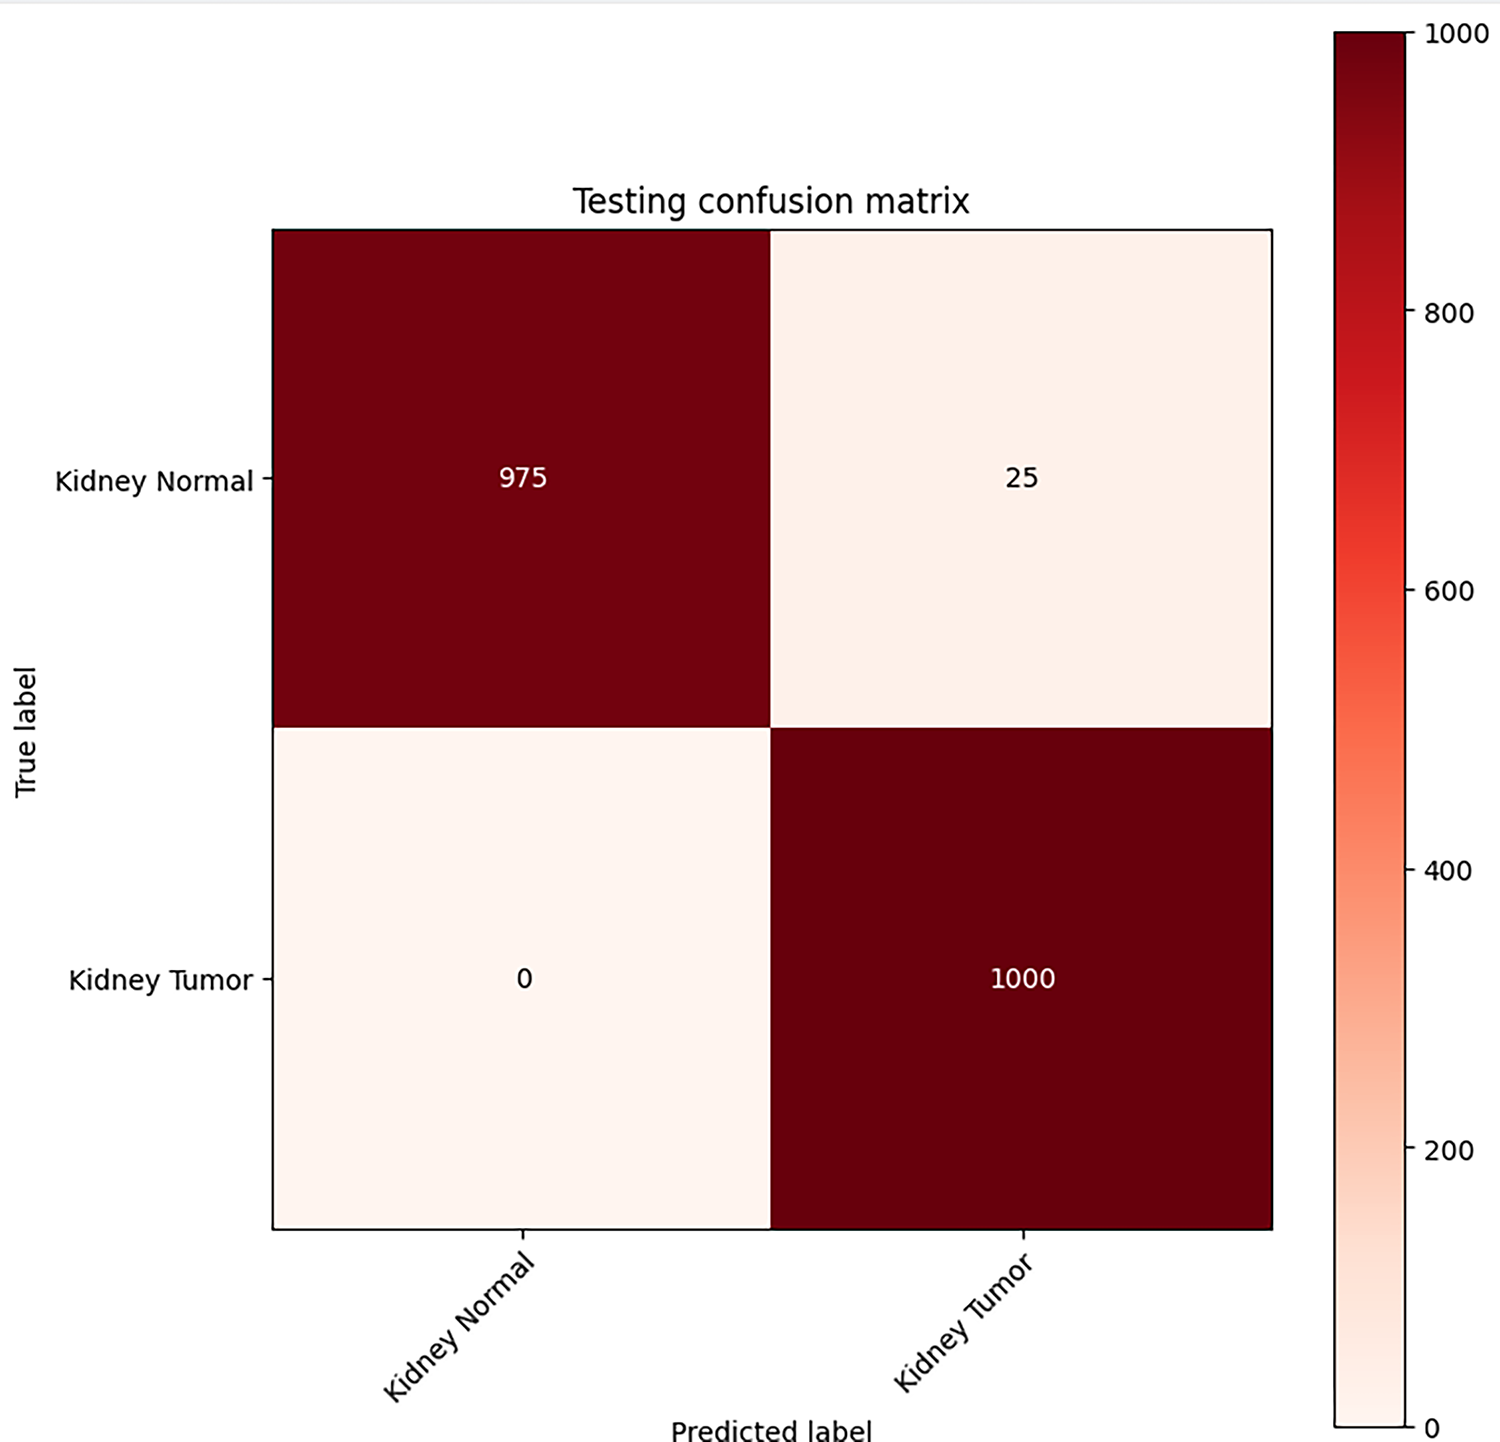
Figure 3: Classification performance CM for VGG16-based kidney cancer detector
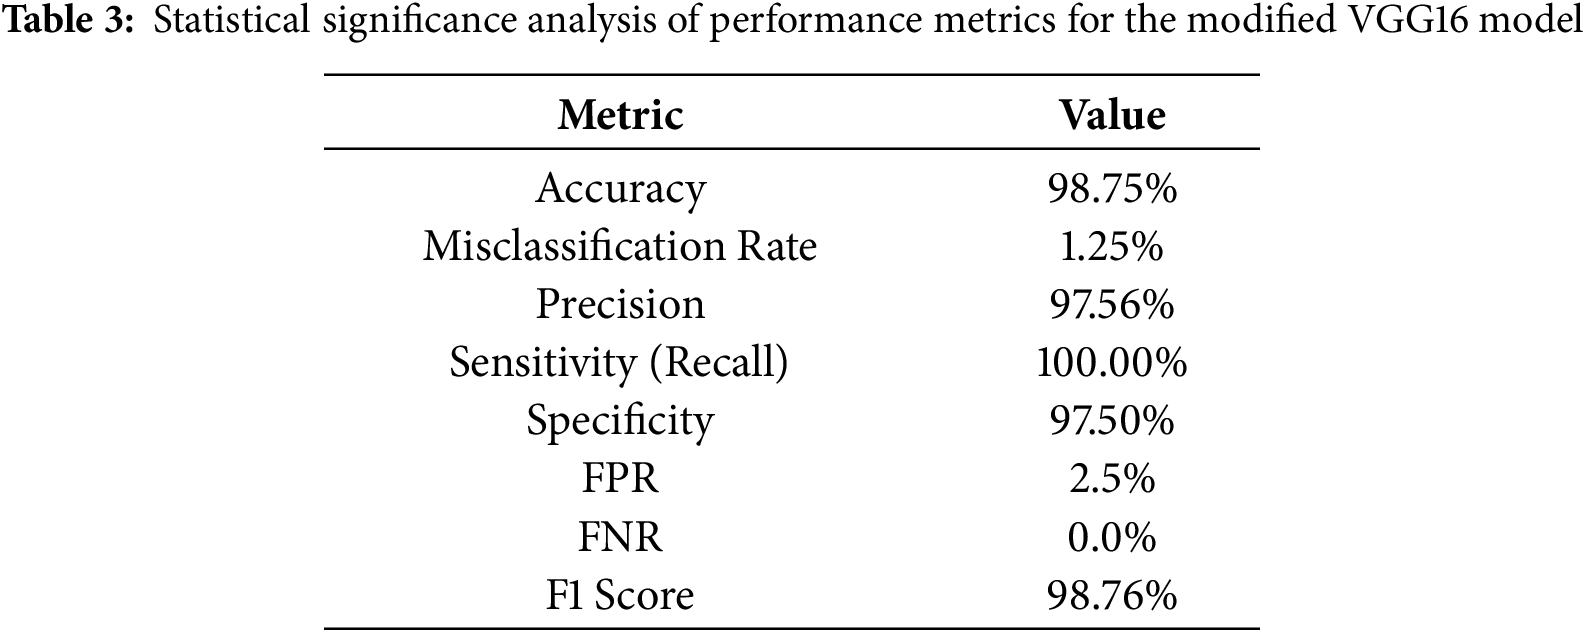
Table 3 summarizes the statistical significance of each performance metric and provides a comprehensive evaluation of the model’s accuracy, error minimization, and the trade-off between false negatives and true positives.
Applying LRP to the fine-tuned VGG16 model reveals the regions within abdominal CT slices that drive the network’s “cancer” vs. “normal” classification decisions. The resulting heatmaps, as shown in Fig. 4, illustrate the model’s interpretability by displaying original CT images (middle column) and generated LRP heatmaps (right column).
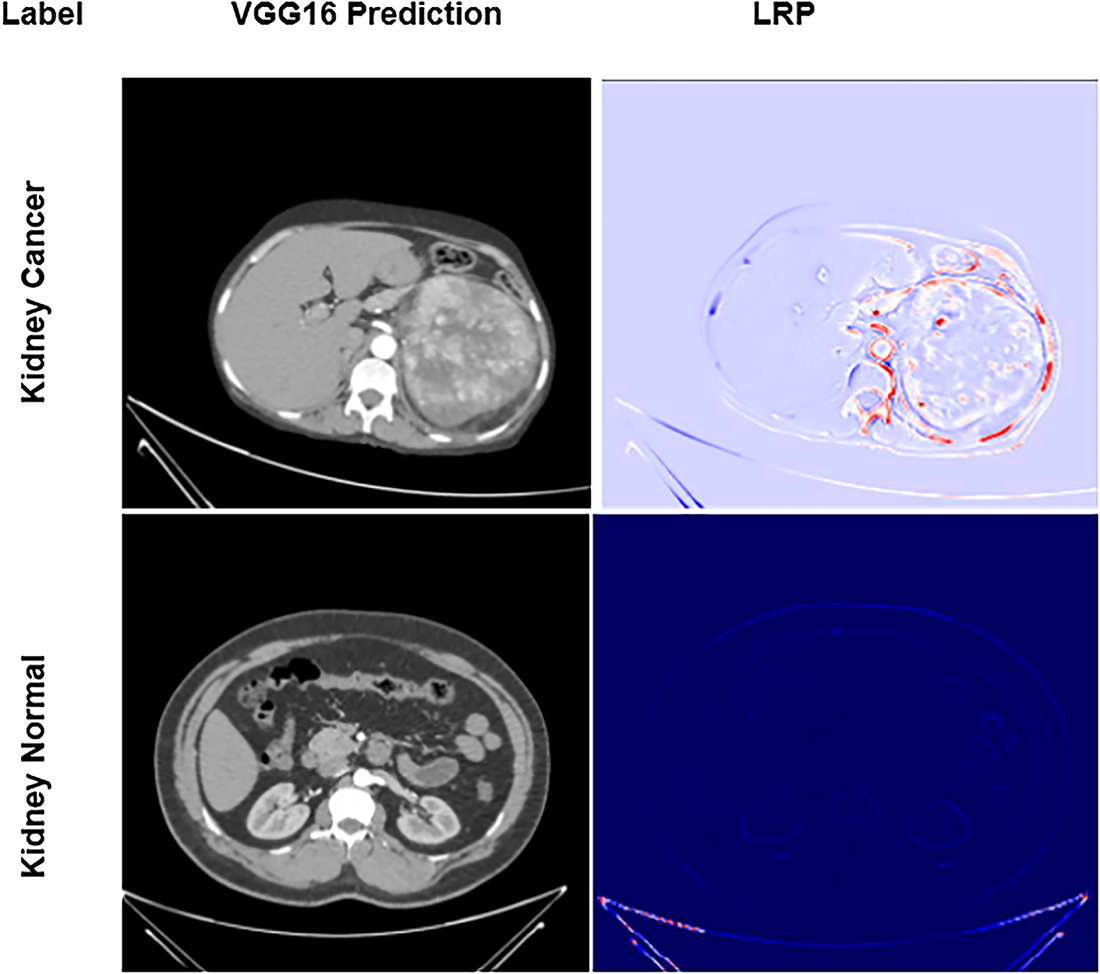
Figure 4: Explained predictions: LRP heatmaps for the fine-tuned VGG16 model
In the top row, the CT image of a confirmed kidney cancer case is presented alongside its corresponding LRP map. Regions highlighted in red denote the areas of most excellent model attention, specifically, contrast-enhanced lesions and irregular tissue densities characteristic of cancer growth. The VGG16 network accurately localizes these pathologically meaningful regions, reinforcing that its predictions are grounded in clinically relevant features. These attention heatmaps thus offer compelling visual evidence that the model’s decisions rely on genuine cancer morphology, bolstering confidence in its application for diagnostic support.
By contrast, the bottom row illustrates a CT image from a healthy subject. Here, the LRP map appears almost uniformly blue, indicating minimal relevance scores across the image and confirming the absence of suspicious features. This stark visual differentiation between cancerous and non-cancerous cases underscores the model’s capacity to distinguish true cancer signatures from normal anatomical variations, further validating its reliability and interpretability in clinical contexts.
The LRP heatmaps in Fig. 4 improve model transparency by revealing voxel-level contributions to the network’s diagnostic decisions. They show that the model mainly attends to lesion boundaries and dense heterogeneous regions, indicating sensitivity to tumor size and texture. Lower-intensity activations often correspond to small or low-contrast tumors, suggesting occasional difficulty in distinguishing subtle lesions. However, these visualizations represent model-driven relevance rather than direct pathophysiological causation and are interpreted as supportive interpretability tools rather than clinical evidence.
Quantitative Validation of Explainability through Perturbation Test
While the qualitative LRP heatmaps (Fig. 4) provide visual insight into model attention, further quantitative validation was conducted to objectively assess their reliability. A perturbation-based evaluation was conducted using occlusion sensitivity and insertion–deletion analysis.
In the occlusion sensitivity map (Fig. 5a), local image patches were progressively masked, and the corresponding decline in prediction probability was recorded. Regions exhibiting the greatest probability drop (dark red zones) correspond to tumor-containing regions, confirming that the model’s diagnostic confidence is heavily dependent on these highlighted areas.
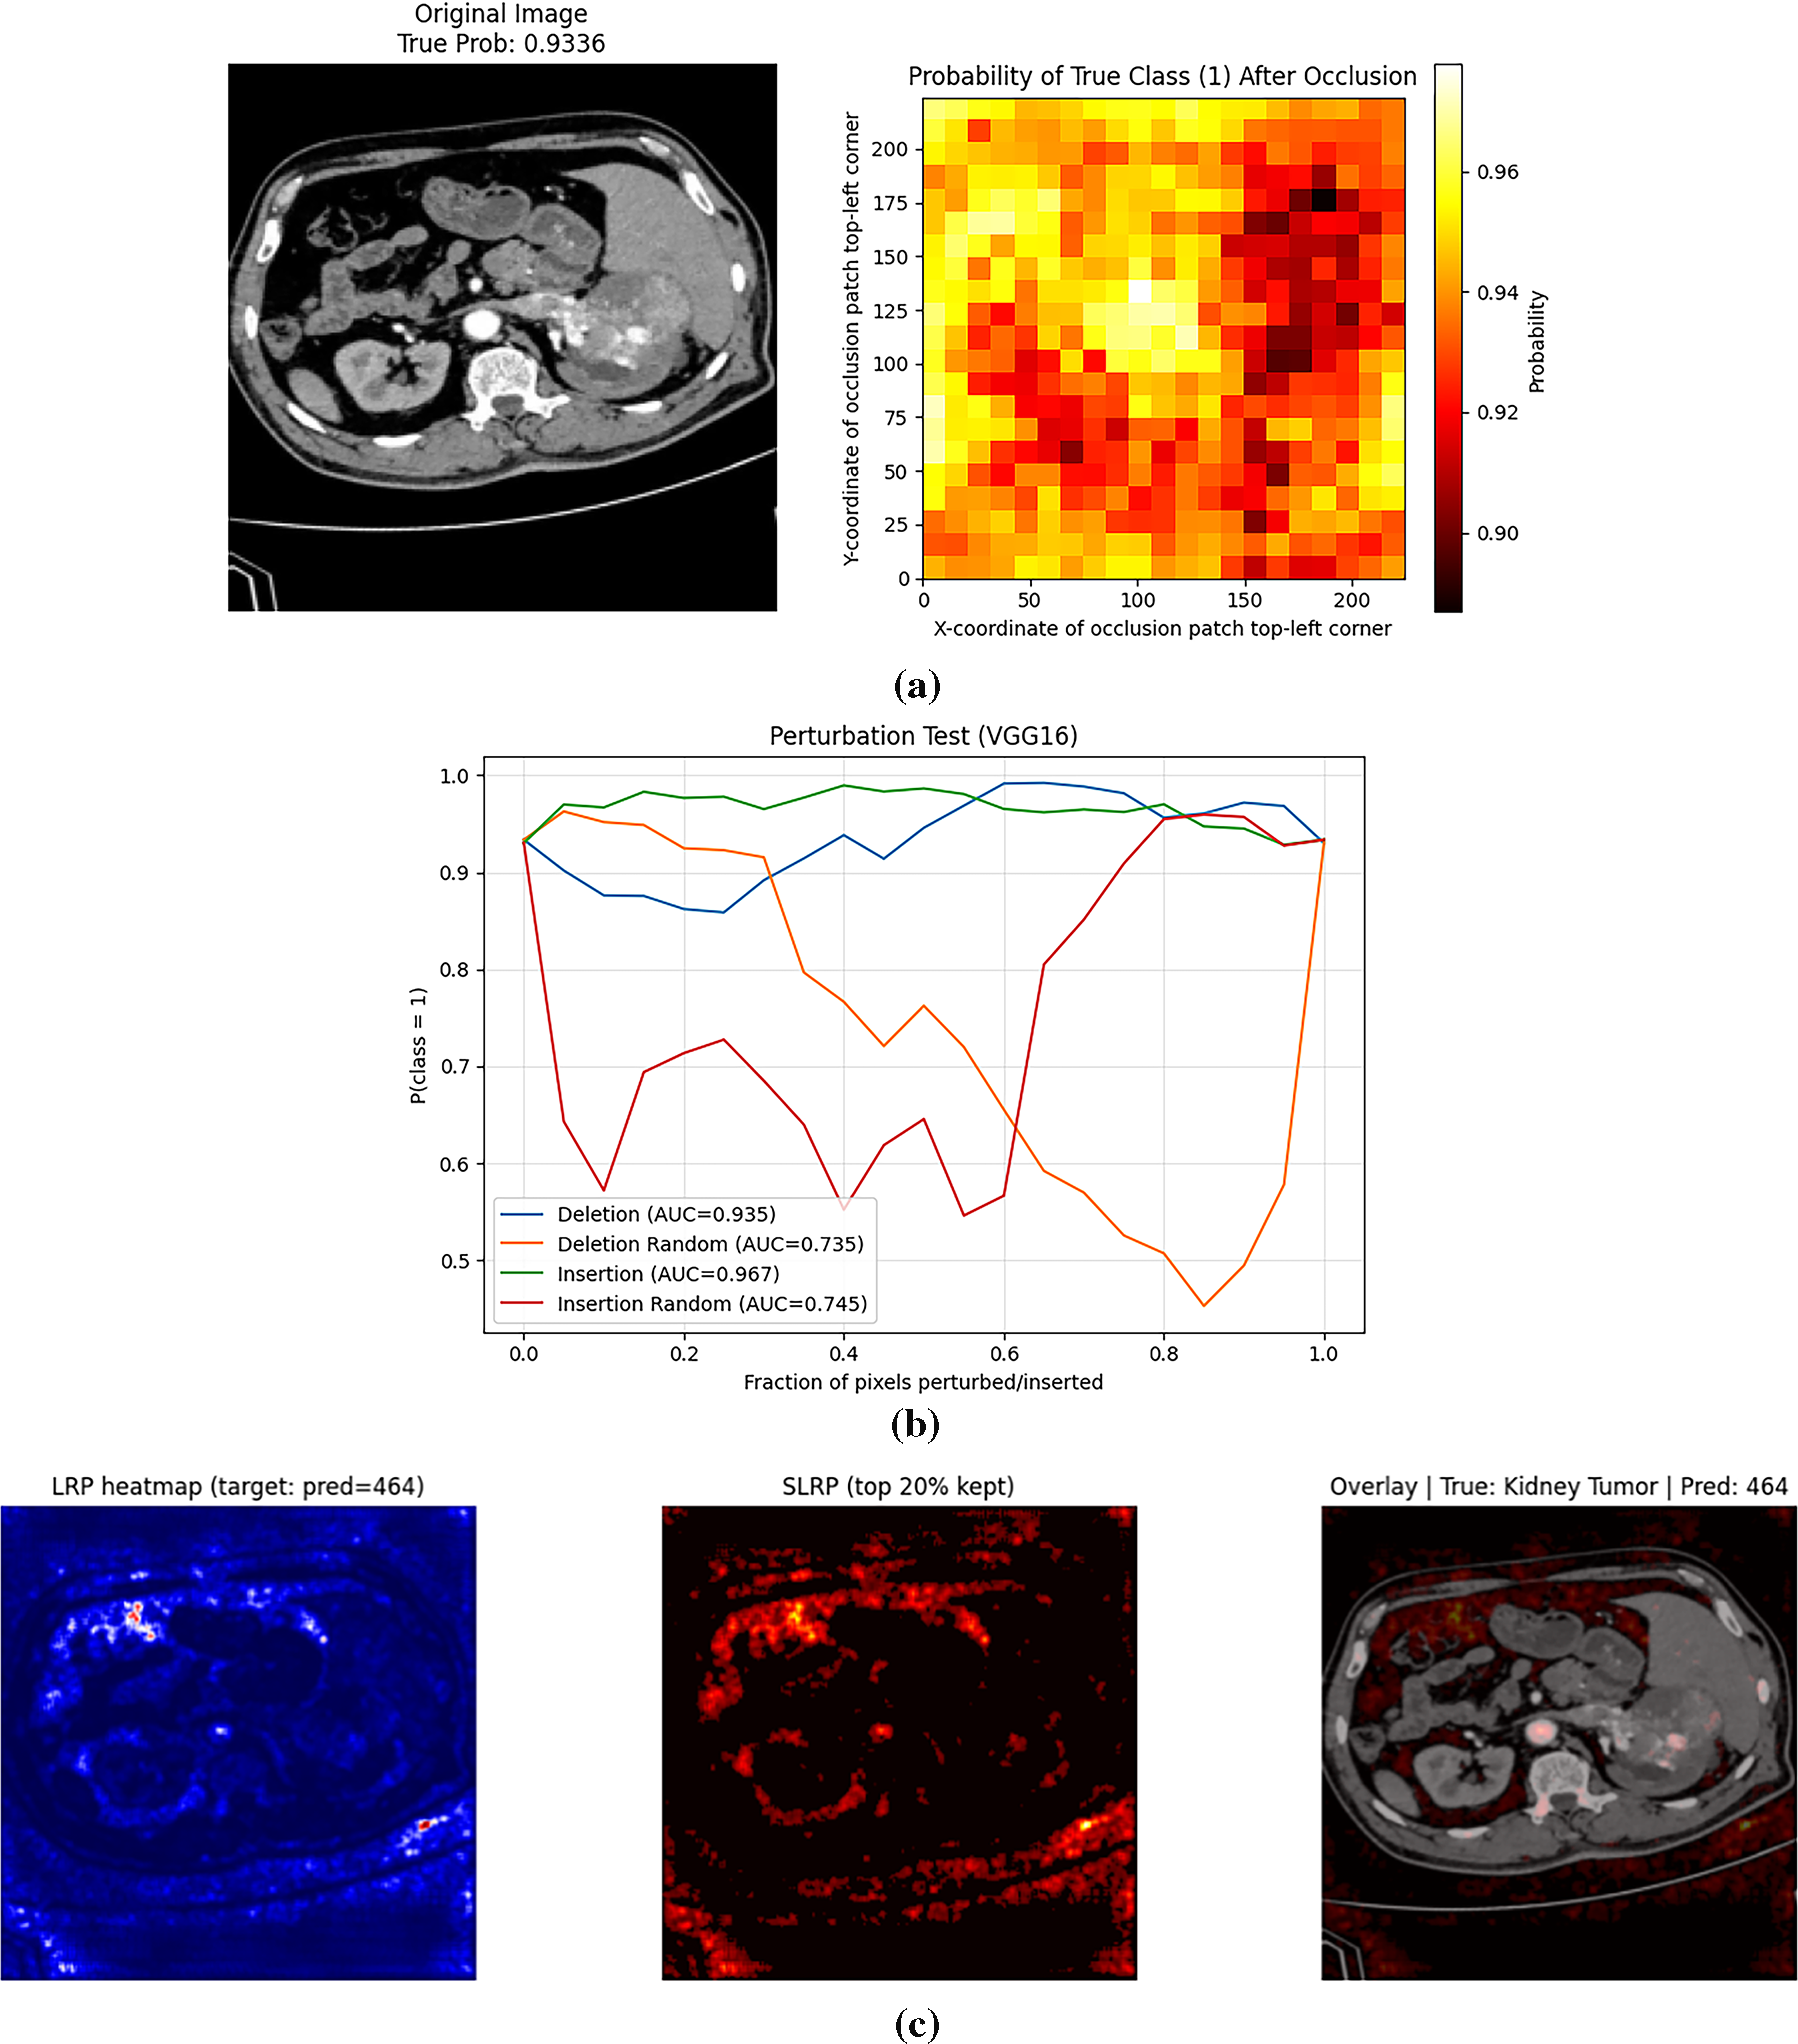
Figure 5: (a): Occlusion sensitivity map showing probability change after local masking (b): Insertion–deletion curves confirming model reliance on clinically relevant regions (c): Selective LRP showing refined relevance
The perturbation curves (Fig. 5b) further quantify this effect. The deletion curve (AUC = 0.935) demonstrates a rapid decline in classification probability as the most relevant pixels are removed, while the insertion curve (AUC = 0.967) shows a sharp increase in confidence as important regions are reintroduced. Both curves distinctly outperform the random baselines (AUC ≈ 0.73–0.75), validating that the model’s predictions rely on clinically meaningful regions rather than random background features.
This objective perturbation analysis strengthens the interpretability assessment by linking relevance maps to measurable prediction behavior, thus reducing subjective bias and providing empirical support for the heatmap-based explanations. It confirms that the fine-tuned VGG16 model focuses on anatomically and pathologically relevant kidney regions that drive its cancer-detection capability.
To further enhance interpretability and address the potential noise observed in standard LRP maps, a Selective Layer-wise Relevance Propagation (SLRP) method is implemented on the trained VGG16 model. As illustrated in Fig. 5c, SLRP preserves only the most salient 20% of relevance values, effectively suppressing diffuse or irrelevant activations and concentrating attributions on diagnostically significant regions. Compared to conventional LRP, the SLRP map exhibits sharper localization and greater correspondence with the true lesion boundaries. This selective refinement significantly improves the visual coherence and diagnostic trustworthiness of the generated explanations, aligning with the rigorous benchmarking of enhanced XAI methods.
4.5 Comparison with Previous Studies
Table 4 reports a thorough performance comparison of the proposed VGG16-based model with LRP and other existing kidney cancer classification models. Compared to most existing works that do not consider XAI, the proposed pipeline outperforms them, yielding the best accuracy (98.75%) with 0% false negatives, making it more reliable for clinical settings. The presented model’s high precision and F1 Score indicate its generalization capability for recognizing kidney cancer.
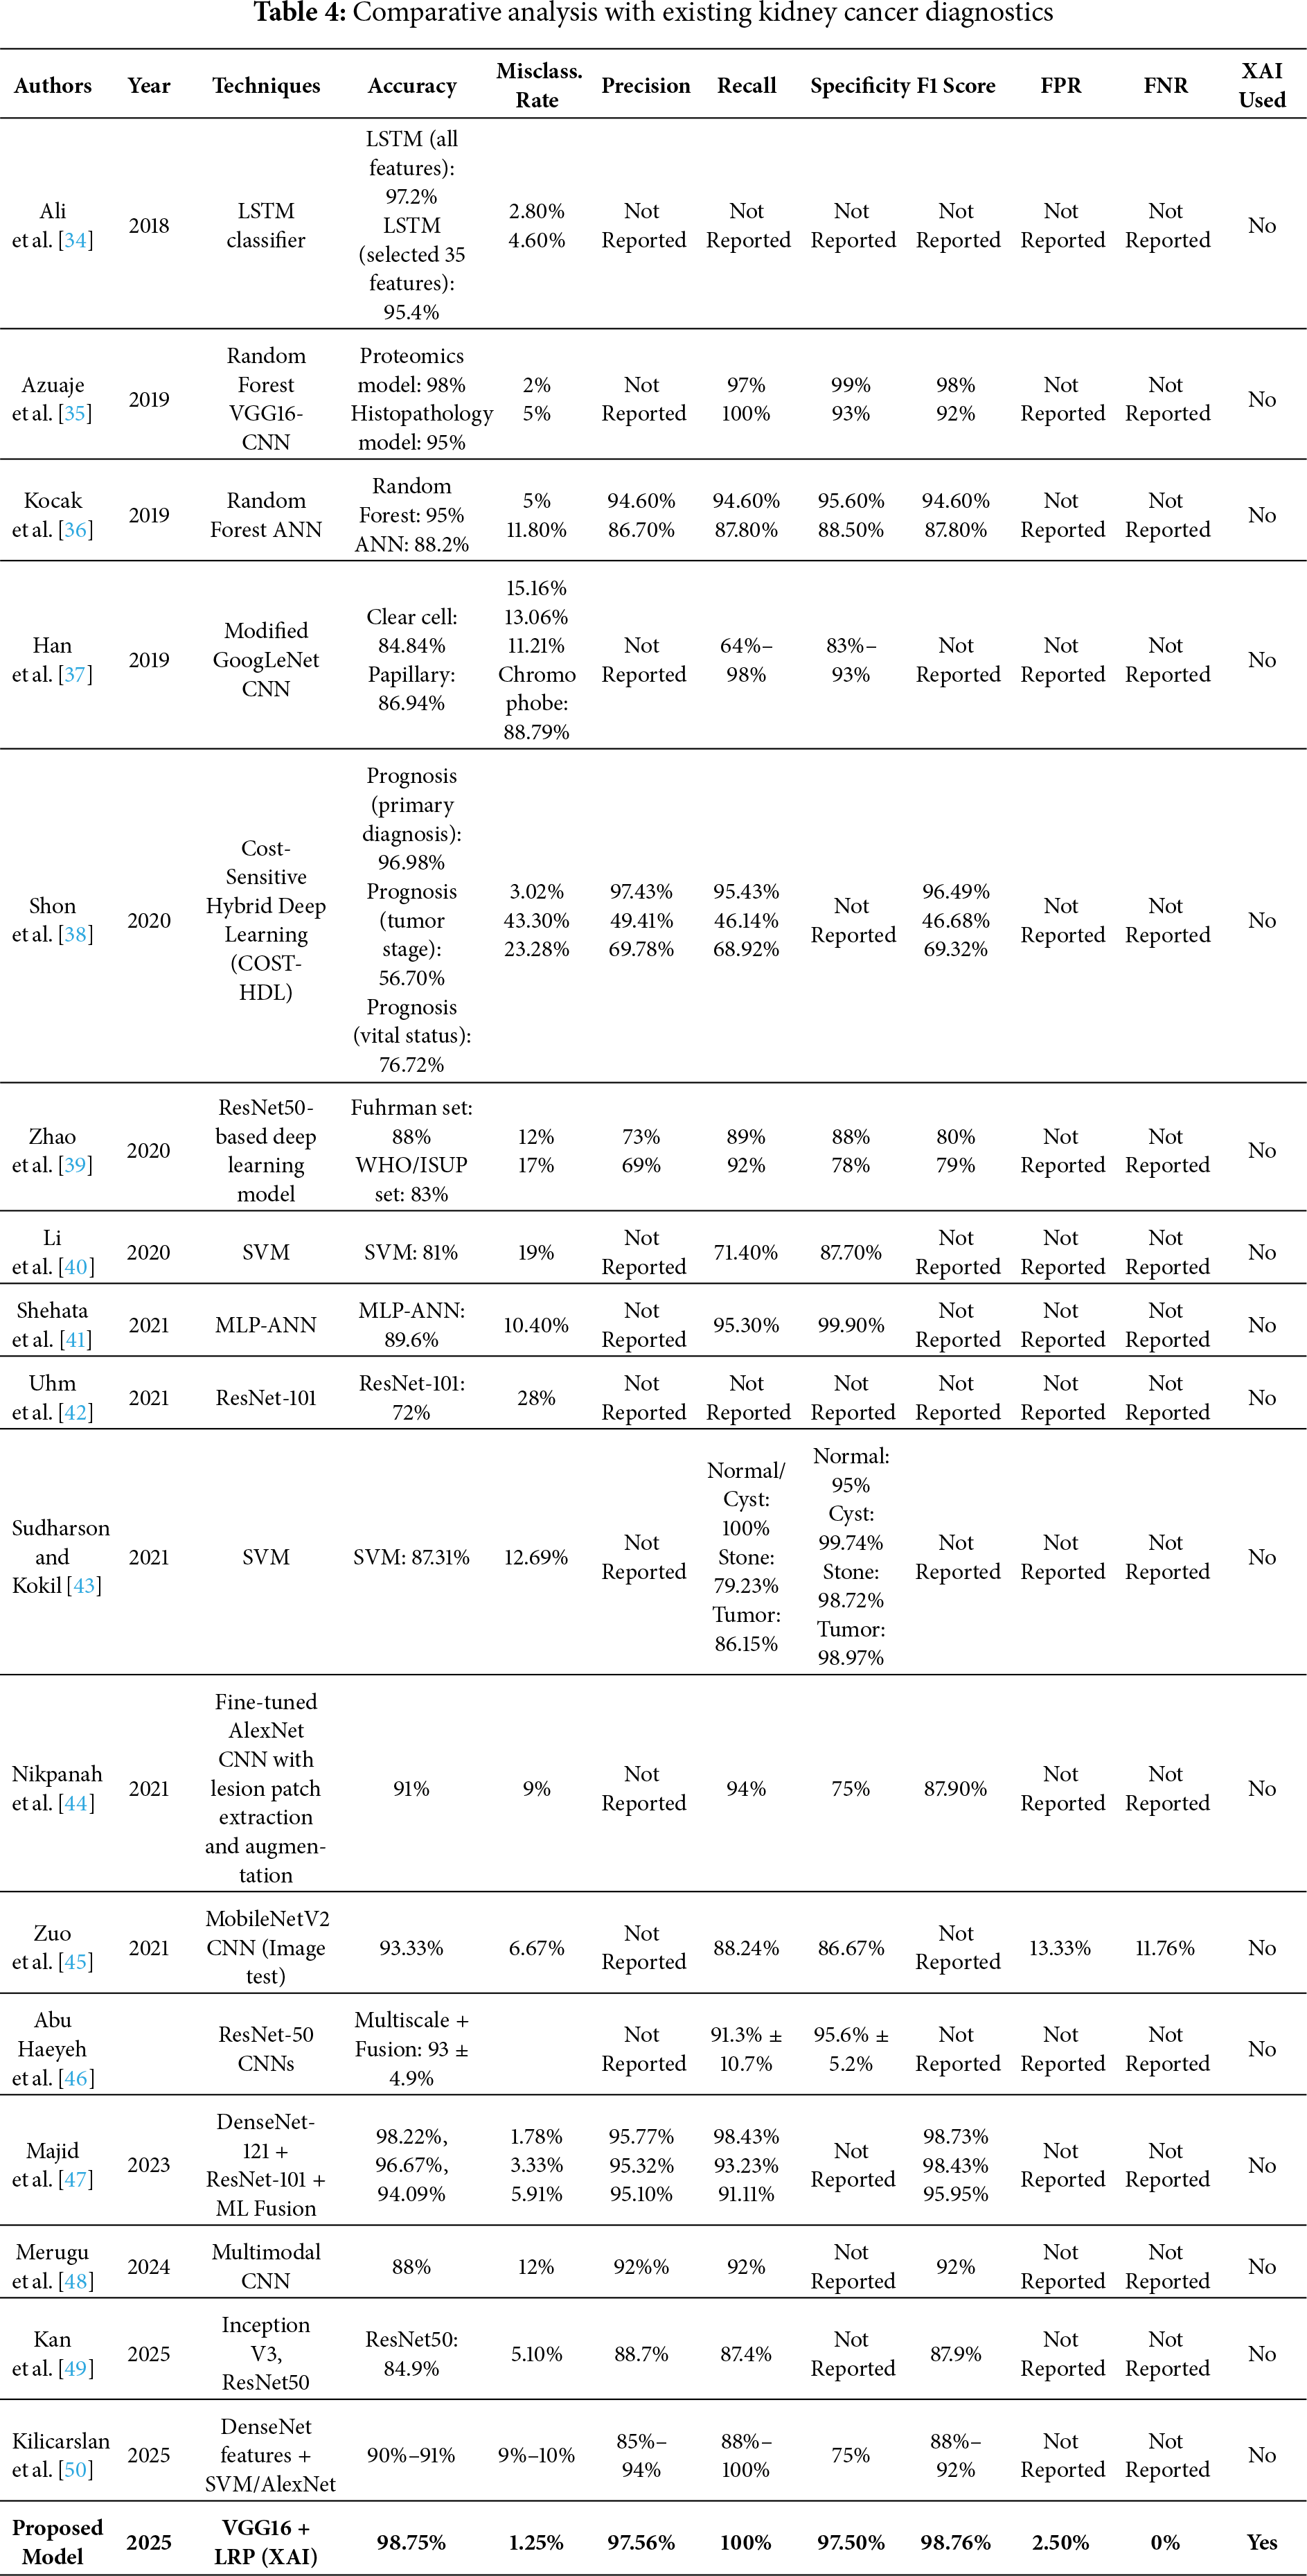
To the best of current knowledge, the VGG16-based model with LRP proposed in this paper achieves improved kidney cancer classification compared to existing methods. Unlike prior approaches that rely predominantly on non-XAI-integrated architectures, the presented model delivers enhanced prediction accuracy and interpretability, thereby increasing its clinical applicability. For instance, Ref. [41] achieved an accuracy of 89.6% using morphological features and MLP-ANN without employing any explainability method. Similarly, Ref. [45] also utilized MobileNetV2 and achieved an accuracy of 93.33% on the test data; however, their model did not explain the decision-making process. Newer attempts, such as those by [48], achieved 98.22% accuracy with DenseNet-121 alone, but without XAI, to enhance clinician confidence. The proposed model, however, not only outperforms it with an accuracy of 98.75% and an F1-score of 98.76%, but also reduces the proportion of false negatives to zero, ensuring that all cancer cases are correctly predicted. LRP allows for pixel-wise heat maps, explaining each prediction’s basis (transparency). This simultaneous focus on performance and explainability makes the proposed framework stand out from current models and fills the gap between AI effectiveness and medical applicability.
To quantify the impact of each component in the proposed framework, an ablation analysis was performed. The baseline pretrained VGG16 model, without fine-tuning, achieved an average accuracy of ≈94% on the test set. After fine-tuning with optimized hyperparameters (Table 2), the accuracy increased to ≈96.8%, demonstrating improved feature adaptation to renal CT data. Incorporating the Layer-wise Relevance Propagation (LRP) module enhanced both diagnostic precision and interpretability, raising accuracy to 98.3% and generating clinically aligned heatmaps. The final integration of Selective LRP (SLRP) further refined these attributions, emphasizing diagnostically relevant tumor regions and achieving the highest performance of 98.75% accuracy, 97.56% precision, and 0% FNR. This step-wise improvement confirms that fine-tuning, LRP, and SLRP each contribute distinctly to robustness, reliability, and interpretability.
5 Conclusions and Future Directions
In conclusion, early and accurate detection of kidney cancer is essential for preserving renal function and improving patient outcomes. This study fine-tuned a VGG16 convolutional neural network to differentiate between cancerous and healthy renal tissue on CT images, achieving an overall accuracy of 98.75%. To improve fairness, transparency, and interpretability, the study also aimed to enhance the model’s performance. This paper incorporated LRP and SLRP to unveil the model’s “black-box” decisions, thereby boosting clinician confidence and reducing diagnostic turnaround.
SLRP integration made the model’s decision process transparent, enhancing interpretability and fostering clinician confidence while reducing diagnostic turnaround times. The model’s performance on the Kaggle dataset may not fully generalize to real-world clinical settings, underscoring the need for external validation across multi-center, diverse cohorts.
Extending this evaluation to larger, more diverse imaging cohorts will be essential for validating the model’s robustness across heterogeneous patient populations. Future studies will focus on enhancing explanation clarity and robustness through advanced interpretability strategies such as Selective Layer-wise Relevance Propagation (SLRP) and hybrid deep visualization frameworks for improved feature localization. To ensure ethical and transparent deployment, future directions will explore blockchain-enabled data stewardship frameworks that provide secure, immutable audit trails for training data and model updates. In parallel, privacy-preserving learning paradigms such as Federated Learning (FL) and Homomorphic Encryption (HE) will be investigated to enable collaborative model training across institutions without sharing raw patient data. Together, these efforts will advance a trustworthy, privacy-aware, and clinically transparent AI ecosystem for kidney cancer diagnosis and care.
Acknowledgement: Not applicable.
Funding Statement: This work was supported through the Ongoing Research Funding Program (ORF-2025-498), King Saud University, Riyadh, Saudi Arabia.
Author Contributions: Study conception and design: Naila Sammar Naz, Asma Batool, Fahad Ahmed, Ayman Altameem, Ateeq Ur Rehman, Khan Muhammad Adnan and Ahmad Almogren; data collection: Naila Sammar Naz and Fahad Ahmed; analysis and interpretation of results: Asma Batool, Naila Sammar Naz, Ahmad Almogren and Khan Muhammad Adnan; draft manuscript preparation: Asma Batool, Fahad Ahmed and Naila Sammar Naz; supervision: Fahad Ahmed, Naila Sammar Naz, Khan Muhammad Adnan and Ahmad Almogren. All authors reviewed the results and approved the final version of the manuscript.
Availability of Data and Materials: The data and materials used in this study is publically available at Kaggle repository https://www.kaggle.com/datasets/obulisainaren/multi-cancer/data (accessed on 01 September 2025).
Ethics Approval: Not applicable.
Conflicts of Interest: The authors declare no conflicts of interest to report regarding the present study.
References
1. Bray F, Laversanne M, Sung H, Ferlay J, Siegel RL, Soerjomataram I, et al. Global cancer statistics 2022: GLOBOCAN estimates of incidence and mortality worldwide for 36 cancers in 185 countries. CA Cancer J Clin. 2024;74(3):229–63. doi:10.3322/caac.21834. [Google Scholar] [PubMed] [CrossRef]
2. International Agency for Research on Cancer. Kidney Fact Sheet—GLOBOCAN 2022 (version 1.1—08 Feb 2024) [Internet]. 2024 [cited 2025 Sep 1]. Available from: https://gco.iarc.who.int/media/globocan/factsheets/cancers/29-kidney-fact-sheet.pdf. [Google Scholar]
3. Padala SA, Barsouk A, Thandra KC, Saginala K, Mohammed A, Vakiti A, et al. Epidemiology of renal cell carcinoma. World J Oncol. 2020;11(3):79–87. doi:10.14740/wjon1279. [Google Scholar] [PubMed] [CrossRef]
4. Larcher A, Campi R, Bex A, Bray F, Bukavina L, Jonasch E, et al. Epidemiology of renal cancer: incidence, mortality, survival, genetic predisposition, and risk factors. Eur Urol. 2025;88(4):341–58. doi:10.1016/j.eururo.2025.06.005. [Google Scholar] [PubMed] [CrossRef]
5. Bahadoram S, Davoodi M, Hassanzadeh S, Bahadoram M, Barahman M, Mafakher L. Renal cell carcinoma: an overview of the epidemiology, diagnosis, and treatment. G Ital Nefrol. 2022;39(3):2022. [Google Scholar] [PubMed]
6. Makino T, Kadomoto S, Izumi K, Mizokami A. Epidemiology and prevention of renal cell carcinoma. Cancers. 2022;14(16):4059. doi:10.3390/cancers14164059. [Google Scholar] [PubMed] [CrossRef]
7. Vasudev NS, Wilson M, Stewart GD, Adeyoju A, Cartledge J, Kimuli M, et al. Challenges of early renal cancer detection: symptom patterns and incidental diagnosis rate in a multicentre prospective UK cohort of patients presenting with suspected renal cancer. BMJ Open. 2020;10(5):e035938. doi:10.1136/bmjopen-2019-035938. [Google Scholar] [PubMed] [CrossRef]
8. Roussel E, Capitanio U, Kutikov A, Oosterwijk E, Pedrosa I, Rowe SP, et al. Novel imaging methods for renal mass characterization: a collaborative review. Eur Urol. 2022;81(5):476–88. doi:10.1016/j.eururo.2022.01.040. [Google Scholar] [PubMed] [CrossRef]
9. Woon D, Qin S, Al-Khanaty A, Perera M, Lawrentschuk N. Imaging in renal cell carcinoma detection. Diagnostics. 2024;14(18):2105. doi:10.3390/diagnostics14182105. [Google Scholar] [PubMed] [CrossRef]
10. Panayides AS, Amini A, Filipovic ND, Sharma A, Tsaftaris SA, Young A, et al. AI in medical imaging informatics: current challenges and future directions. IEEE J Biomed Health Inform. 2020;24(7):1837–57. doi:10.1109/JBHI.2020.2991043. [Google Scholar] [PubMed] [CrossRef]
11. Feretzakis G, Juliebø-Jones P, Tsaturyan A, Sener TE, Verykios VS, Karapiperis D, et al. Emerging trends in AI and radiomics for bladder, kidney, and prostate cancer: a critical review. Cancers. 2024;16(4):810. doi:10.3390/cancers16040810. [Google Scholar] [PubMed] [CrossRef]
12. McGough WC, Sanchez LE, McCague C, Stewart GD, Schönlieb CB, Sala E, et al. Artificial intelligence for early detection of renal cancer in computed tomography: a review. Camb Prisms Precis Med. 2023;1:e4. doi:10.1017/pcm.2022.9. [Google Scholar] [PubMed] [CrossRef]
13. Abdalredha Kadhim D, Abed Mohammed M. A comprehensive review of artificial intelligence approaches in kidney cancer medical images diagnosis, datasets, challenges and issues and future directions. Int J Math Stat Comput Sci. 2024;2:199–243. doi:10.59543/ijmscs.v2i.9747. [Google Scholar] [CrossRef]
14. Kadhim DA, Abed Mohammed M. Advanced machine learning models for accurate kidney cancer classification using CT images. Mesopotamian J Big Data. 2025;2025:1–25. doi:10.58496/mjbd/2025/001. [Google Scholar] [CrossRef]
15. Gharaibeh M, Alzu’bi D, Abdullah M, Hmeidi I, Al Nasar MR, Abualigah L, et al. Radiology imaging scans for early diagnosis of kidney tumors: a review of data analytics-based machine learning and deep learning approaches. Big Data Cogn Comput. 2022;6(1):29. doi:10.3390/bdcc6010029. [Google Scholar] [CrossRef]
16. Mahmud S, Abbas TO, Mushtak A, Prithula J, Chowdhury MEH. Kidney cancer diagnosis and surgery selection by machine learning from CT scans combined with clinical metadata. Cancers. 2023;15(12):3189. doi:10.3390/cancers15123189. [Google Scholar] [PubMed] [CrossRef]
17. Chen XY, Zhang Y, Chen YX, Huang ZQ, Xia XY, Yan YX, et al. MRI-based grading of clear cell renal cell carcinoma using a machine learning classifier. Front Oncol. 2021;11:708655. doi:10.3389/fonc.2021.708655. [Google Scholar] [PubMed] [CrossRef]
18. Almukadi W, Abdel-Khalek S, Bahaddad AA, Alghamdi AM. Driven early detection of chronic kidney cancer disease based on machine learning technique. PLoS One. 2025;20(7):e0326080. doi:10.1371/journal.pone.0326080. [Google Scholar] [PubMed] [CrossRef]
19. Chanchal AK, Lal S, Kumar R, Kwak JT, Kini J. A novel dataset and efficient deep learning framework for automated grading of renal cell carcinoma from kidney histopathology images. Sci Rep. 2023;13(1):5728. doi:10.1038/s41598-023-31275-7. [Google Scholar] [PubMed] [CrossRef]
20. Tabibu S, Vinod PK, Jawahar CV. Pan-renal cell carcinoma classification and survival prediction from histopathology images using deep learning. Sci Rep. 2019;9(1):10509. doi:10.1038/s41598-019-46718-3. [Google Scholar] [PubMed] [CrossRef]
21. Anand V, Khajuria A, Pachauri RK, Gupta V. Optimized machine learning based comparative analysis of predictive models for classification of kidney tumors. Sci Rep. 2025;15(1):30358. doi:10.1038/s41598-025-15414-w. [Google Scholar] [PubMed] [CrossRef]
22. Yang R, Wu J, Sun L, Lai S, Xu Y, Liu X, et al. Radiomics of small renal masses on multiphasic CT: accuracy of machine learning-based classification models for the differentiation of renal cell carcinoma and angiomyolipoma without visible fat. Eur Radiol. 2020;30(2):1254–63. doi:10.1007/s00330-019-06384-5. [Google Scholar] [PubMed] [CrossRef]
23. Tounsi M, Abdulhussain DY, Azar AT, Al-Khayyat A, Ibraheem IK. Deep learning model-based decision support system for kidney cancer on renal images. Eng Technol Appl Sci Res. 2024;14(5):17177–87. doi:10.48084/etasr.8335. [Google Scholar] [CrossRef]
24. Liu Z, Zhao C, Lu Y, Jiang Y, Yan J. Multi-scale graph learning for ovarian tumor segmentation from CT images. Neurocomputing. 2022;512(1):398–407. doi:10.1016/j.neucom.2022.09.093. [Google Scholar] [CrossRef]
25. Etem T, Teke M. Enhanced deep learning based decision support system for kidney tumour detection. BenchCouncil Trans Benchmarks Stand Eval. 2024;4(2):100174. doi:10.1016/j.tbench.2024.100174. [Google Scholar] [CrossRef]
26. Zhang X, Li S, Chen B, Liu Y, Wang J. Imaging-based deep learning in kidney diseases: recent progress and future prospects. Quant Imaging Med Surg. 2025;15(3):1054–72. doi:10.21037/qims-24-678. [Google Scholar] [CrossRef]
27. Wang Z, Zhang X, Wang X, Li J, Zhang Y, Zhang T, et al. Deep learning techniques for imaging diagnosis of renal cell carcinoma: current and emerging trends. Front Oncol. 2023;13:1152622. doi:10.3389/fonc.2023.1152622. [Google Scholar] [PubMed] [CrossRef]
28. Chandramohan D, Garapati HN, Nangia U, Simhadri PK, Lapsiwala B, Jena NK, et al. Diagnostic accuracy of deep learning in detection and prognostication of renal cell carcinoma: a systematic review and meta-analysis. Front Med. 2024;11:1447057. doi:10.3389/fmed.2024.1447057. [Google Scholar] [PubMed] [CrossRef]
29. Gujarathi SM, Shrivastava R, Kumar Angadi S. A survey of kidney cancer analysis using machine learning and deep learning algorithms. J Electr Syst. 2024;20(4):1163–72. doi:10.52783/jes.3237. [Google Scholar] [CrossRef]
30. Vasconcelos H, Jörke M, Grunde-McLaughlin M, Gerstenberg T, Bernstein MS, Krishna R. Explanations can reduce overreliance on AI systems during decision-making. Proc ACM Hum Comput Interact. 2023;7(CSCW1):1–38. doi:10.1145/3579605. [Google Scholar] [CrossRef]
31. Palacio S, Lucieri A, Munir M, Hees J, Ahmed S, Dengel A. XAI handbook: towards a unified framework for explainable AI. arXiv:2105.06677. 2021. [Google Scholar]
32. Papadimitroulas P, Brocki L, Chung NC, Marchadour W, Vermet F, Gaubert L, et al. Artificial intelligence: deep learning in oncological radiomics and challenges of interpretability and data harmonization. Phys Med. 2021;83:108–21. doi:10.1016/j.ejmp.2021.03.009. [Google Scholar] [PubMed] [CrossRef]
33. Hrinivich WT, Wang T, Wang C. Editorial: interpretable and explainable machine learning models in oncology. Front Oncol. 2023;13:1184428. doi:10.3389/fonc.2023.1184428. [Google Scholar] [PubMed] [CrossRef]
34. Ali AM, Zhuang H, Ibrahim A, Rehman O, Huang M, Wu A. A machine learning approach for the classification of kidney cancer subtypes using miRNA genome data. Appl Sci. 2018;8(12):2422. doi:10.3390/app8122422. [Google Scholar] [CrossRef]
35. Azuaje F, Kim SY, Perez Hernandez D, Dittmar G. Connecting histopathology imaging and proteomics in kidney cancer through machine learning. J Clin Med. 2019;8(10):1535. doi:10.3390/jcm8101535. [Google Scholar] [PubMed] [CrossRef]
36. Kocak B, Durmaz ES, Ates E, Ulusan MB. Radiogenomics in clear cell renal cell carcinoma: machine learning-based high-dimensional quantitative CT texture analysis in predicting PBRM1 mutation status. Am J Roentgenol. 2019;212(3):W55–63. doi:10.2214/AJR.18.20443. [Google Scholar] [PubMed] [CrossRef]
37. Han S, Hwang SI, Lee HJ. The classification of renal cancer in 3-phase CT images using a deep learning method. J Digit Imaging. 2019;32(4):638–43. doi:10.1007/s10278-019-00230-2. [Google Scholar] [PubMed] [CrossRef]
38. Shon HS, Batbaatar E, Kim KO, Cha EJ, Kim KA. Classification of kidney cancer data using cost-sensitive hybrid deep learning approach. Symmetry. 2020;12(1):154. doi:10.3390/sym12010154. [Google Scholar] [CrossRef]
39. Zhao Y, Chang M, Wang R, Xi IL, Chang K, Huang RY, et al. Deep learning based on MRI for differentiation of low- and high-grade in low-stage renal cell carcinoma. J Magn Reson Imaging. 2020;52(5):1542–9. doi:10.1002/jmri.27153. [Google Scholar] [PubMed] [CrossRef]
40. Li F, Yang M, Li Y, Zhang M, Wang W, Yuan D, et al. An improved clear cell renal cell carcinoma stage prediction model based on gene sets. BMC Bioinformatics. 2020;21(1):232. doi:10.1186/s12859-020-03543-0. [Google Scholar] [PubMed] [CrossRef]
41. Shehata M, Alksas A, Abouelkheir RT, Elmahdy A, Shaffie A, Soliman A, et al. A comprehensive computer-assisted diagnosis system for early assessment of renal cancer tumors. Sensors. 2021;21(14):4928. doi:10.3390/s21144928. [Google Scholar] [PubMed] [CrossRef]
42. Uhm KH, Jung SW, Choi MH, Shin HK, Yoo JI, Oh SW, et al. Deep learning for end-to-end kidney cancer diagnosis on multi-phase abdominal computed tomography. npj Precis Oncol. 2021;5(1):54. doi:10.1038/s41698-021-00195-y. [Google Scholar] [PubMed] [CrossRef]
43. Sudharson S, Kokil P. Computer-aided diagnosis system for the classification of multi-class kidney abnormalities in the noisy ultrasound images. Comput Methods Programs Biomed. 2021;205:106071. doi:10.1016/j.cmpb.2021.106071. [Google Scholar] [PubMed] [CrossRef]
44. Nikpanah M, Xu Z, Jin D, Farhadi F, Saboury B, Ball MW, et al. A deep-learning based artificial intelligence (AI) approach for differentiation of clear cell renal cell carcinoma from oncocytoma on multi-phasic MRI. Clin Imaging. 2021;77:291–8. doi:10.1016/j.clinimag.2021.06.016. [Google Scholar] [PubMed] [CrossRef]
45. Zuo T, Zheng Y, He L, Chen T, Zheng B, Zheng S, et al. Automated classification of papillary renal cell carcinoma and chromophobe renal cell carcinoma based on a small computed tomography imaging dataset using deep learning. Front Oncol. 2021;11:746750. doi:10.3389/fonc.2021.746750. [Google Scholar] [PubMed] [CrossRef]
46. Abu Haeyeh Y, Ghazal M, El-Baz A, Talaat IM. Development and evaluation of a novel deep-learning-based framework for the classification of renal histopathology images. Bioengineering. 2022;9(9):423. doi:10.3390/bioengineering9090423. [Google Scholar] [PubMed] [CrossRef]
47. Majid M, Gulzar Y, Ayoub S, Khan F, Ahmad Reegu F, Mir MS, et al. Enhanced transfer learning strategies for effective kidney tumor classification with CT imaging. Int J Adv Comput Sci Appl. 2023;14(8):421–32. doi:10.14569/ijacsa.2023.0140847. [Google Scholar] [CrossRef]
48. Merugu NB, Rajavignesh R, Sharma NB, Vijayarajeswari R, Ashok Bedekar K, Shanmugapriya K. Leveraging multimodal machine learning for enhanced kidney condition classification: a novel approach to detect tumors, stones, and cysts in CT images. 2024 [cited 2025 Sep 1]. Available from: https://papers.ssrn.com/sol3/papers.cfm?abstract_id=5109719. [Google Scholar]
49. Kan HC, Lin PH, Shao IH, Cheng SC, Fan TY, Chang YH, et al. Using deep learning to differentiate among histology renal tumor types in computed tomography scans. BMC Med Imaging. 2025;25(1):66. doi:10.1186/s12880-025-01606-3. [Google Scholar] [PubMed] [CrossRef]
50. Kilicarslan G, Cetintas D, Tuncer T, Yildirim M. Fusion-based deep learning approach for renal cell carcinoma subtype detection using multi-phasic MRI data. Diagnostics. 2025;15(13):1636. doi:10.3390/diagnostics15131636. [Google Scholar] [PubMed] [CrossRef]
51. Multi cancer dataset: 8 types of cancer images for machine learning & medical image classification. 2022 [cited 2025 Aug 1]. Available from: https://www.kaggle.com/datasets/obulisainaren/multi-cancer/data. [Google Scholar]
52. Hosna A, Merry E, Gyalmo J, Alom Z, Aung Z, Azim MA. Transfer learning: a friendly introduction. J Big Data. 2022;9(1):102. doi:10.1186/s40537-022-00652-w. [Google Scholar] [PubMed] [CrossRef]
53. Shao L, Zhu F, Li X. Transfer learning for visual categorization: a survey. IEEE Trans Neural Netw Learn Syst. 2015;26(5):1019–34. doi:10.1109/TNNLS.2014.2330900. [Google Scholar] [PubMed] [CrossRef]
54. Alzubaidi L, Al-Amidie M, Al-Asadi A, Humaidi AJ, Al-Shamma O, Fadhel MA, et al. Novel transfer learning approach for medical imaging with limited labeled data. Cancers. 2021;13(7):1590. doi:10.3390/cancers13071590. [Google Scholar] [PubMed] [CrossRef]
55. Tammina S. Transfer learning using VGG-16 with deep convolutional neural network for classifying images. Int J Sci Res Publ. 2019;9(10):9420. doi:10.29322/ijsrp.9.10.2019.p9420. [Google Scholar] [CrossRef]
56. Rawal P, Ahuja D, Saini ML, Chandel H, Raj R. Cancer detection and treatment using explainable AI. Int J Sci Res Mod Technol. 2024;3(9):1–8. doi:10.38124/ijsrmt.v3i9.47. [Google Scholar] [CrossRef]
57. Rosenbacke R, Melhus Å, McKee M, Stuckler D. How explainable artificial intelligence can increase or decrease clinicians’ trust in AI applications in health care: systematic review. JMIR AI. 2024;3:e53207. doi:10.2196/53207. [Google Scholar] [PubMed] [CrossRef]
58. Böhle M, Eitel F, Weygandt M, Ritter K. Layer-wise relevance propagation for explaining deep neural network decisions in MRI-based Alzheimer’s disease classification. Front Aging Neurosci. 2019;11:194. doi:10.3389/fnagi.2019.00194. [Google Scholar] [PubMed] [CrossRef]
59. Grezmak J, Zhang J, Wang P, Loparo KA, Gao RX. Interpretable convolutional neural network through layer-wise relevance propagation for machine fault diagnosis. IEEE Sens J. 2020;20(6):3172–81. doi:10.1109/JSEN.2019.2958787. [Google Scholar] [CrossRef]
60. Politeknik MI, Malang N, Rashid A, Rashid A. Layer-wise relevance propagation in large-scale neural networks for medical diagnosis. Res Med Sci Rev. 2025;3(4):6–18. [Google Scholar]
61. Chereda H, Leha A, Beißbarth T. Stable feature selection utilizing graph convolutional neural network and layer-wise relevance propagation for biomarker discovery in breast cancer. Artif Intell Med. 2024;151:102840. doi:10.1016/j.artmed.2024.102840. [Google Scholar] [PubMed] [CrossRef]
62. Obi JC. A comparative study of several classification metrics and their performances on data. World J Adv Eng Technol Sci. 2023;8(1):308–14. doi:10.30574/wjaets.2023.8.1.0054. [Google Scholar] [CrossRef]
63. Tharwat A. Classification assessment methods: a detailed tutorial. 2018 [cited 2025 Sep 1]. Available from: https://www.researchgate.net/publication/327148996. [Google Scholar]
Cite This Article
 Copyright © 2025 The Author(s). Published by Tech Science Press.
This work is licensed under a Creative Commons Attribution 4.0 International License , which permits unrestricted use, distribution, and reproduction in any medium, provided the original work is properly cited.
 Downloads
 Citation Tools