
 Submit a Paper
 Propose a Special lssue
 Open Access
ARTICLE
Optimized XGBoost-Based Framework for Robust Prediction of the Compressive Strength of Recycled Aggregate Concrete Incorporating Silica Fume, Slag, and Fly Ash
1 Department of Civil Engineering, College of Engineering, King Saud University, P.O. Box 800, Riyadh, 11421, Saudi Arabia
2 School of Civil Engineering, College of Engineering, Sudan University of Science and Technology, Eastern Daim, Khartoum, P.O. Box 72, Sudan
3 Department of Civil and Environmental Engineering, Florida International University, Miami, FL 33174, USA
* Corresponding Author: Yassir M. Abbas. Email:
Computer Modeling in Engineering & Sciences 2025, 145(3), 3279-3307. https://doi.org/10.32604/cmes.2025.074069
Received 01 October 2025; Accepted 12 November 2025; Issue published 23 December 2025
 View Full Text
 Download PDF
Abstract
Accurately predicting the compressive strength of recycled aggregate concrete (RAC) incorporating supplementary cementitious materials (SCMs) remains a critical challenge due to the heterogeneous nature of recycled aggregates (RA) and the complex interactions among multiple binder constituents. This study advances the field by developing the most extensive and rigorously preprocessed database to date, which comprises 1243 RAC mixtures containing silica fume, fly ash, and ground-granulated blast-furnace slag. A hybrid, domain-informed machine-learning framework was then proposed, coupling optimized Extreme Gradient Boosting (XGBoost) with civil engineering expertise to capture the complex chemical and microstructural mechanisms that govern RAC performance. Systematic grid-search optimization (n_estimators = 50, learning_rate = 0.2, max_depth = 7) produced superior predictive accuracy (training R2 = 0.9923, testing R2 = 0.937; MAE = 2.378 MPa; RMSE = 3.591 MPa), which outperformed Extra Trees, Light Gradient Boosting, and traditional regressors. Beyond prediction, model interpretability was achieved using Shapley additive explanations and partial dependence analyses, which revealed curing age as the dominant strength driver, while water-to-binder ratio and recycled aggregate water absorption exhibited strong negative influences. Three-dimensional interaction plots further demonstrated how optimal superplasticizer dosages reduce the strength loss associated with high recycled aggregate content. In summary, this work provides a novel, explainable, and data-driven framework that achieves high predictive accuracy with mechanistic transparency and offers a powerful, interpretable tool for the design and optimization of sustainable RAC mixtures.Keywords
Concrete remains one of the most extensively utilized materials in construction due to its notable advantages, including high strength, durability under corrosive conditions, cost-effectiveness, and ease of application. However, because natural aggregates (NA) constitute a primary component of concrete, the widespread use of concrete raises significant environmental concerns. These include the depletion of natural aggregate resources, substantial CO2 emissions, and the accumulation of demolition waste leading to landfill overcapacity [1–3]. To address these issues, various alternatives have been explored, such as the incorporation of innovative materials (e.g., elastomeric composites), supplementary cementitious materials (SCMs), alkali-activated materials (AAMs), and recycled constituents like glass particles [4–7]. Among these strategies, the reuse of recycled aggregate concrete (RAC) sourced from demolished reinforced concrete (RC) structures has garnered considerable attention. Utilizing RCA offers several environmental benefits: it reduces CO2 emissions, conserves natural resources, minimizes construction and demolition waste [8–11], alleviates landfill space demands, and mitigates the broader environmental impacts associated with discarded concrete [12–14].
To conduct a systematic investigation of studies on RAC, the review began with the formulation of a precise research question: How can interpretable machine learning (ML) techniques be utilized to examine the role of SCMs in enhancing the mechanical strength of RAC, with a specific focus on silica fume, slag, and fly ash? This question guided the identification of relevant search terms, including: (“Recycled aggregate (RA)” and “concrete”) and (“compressive strength (CS)” or “mechanical properties” or “structural performance”) and (“optimization” or “prediction” or “modeling” or “machine learning”). A comprehensive search within the Web of Science Core Collection (Http://Clarivate.Com/Academia-Government/Scientific-and-Academic-Research/Research-Discovery-and-Referencing/Web-of-Science/Web-of-Science-Core-Collection/, accessed on 11 November 2025) yielded 171 articles published between 2018 and March 2025. To refine the dataset, exclusion criteria were implemented, restricting the selection to English-language publications. The literature selection process is depicted in Fig. 1. To further enhance relevance, a secondary screening based on title significance (Fig. 1) reduced the pool to 18 key studies, which will be analyzed in detail in the following paragraphs.
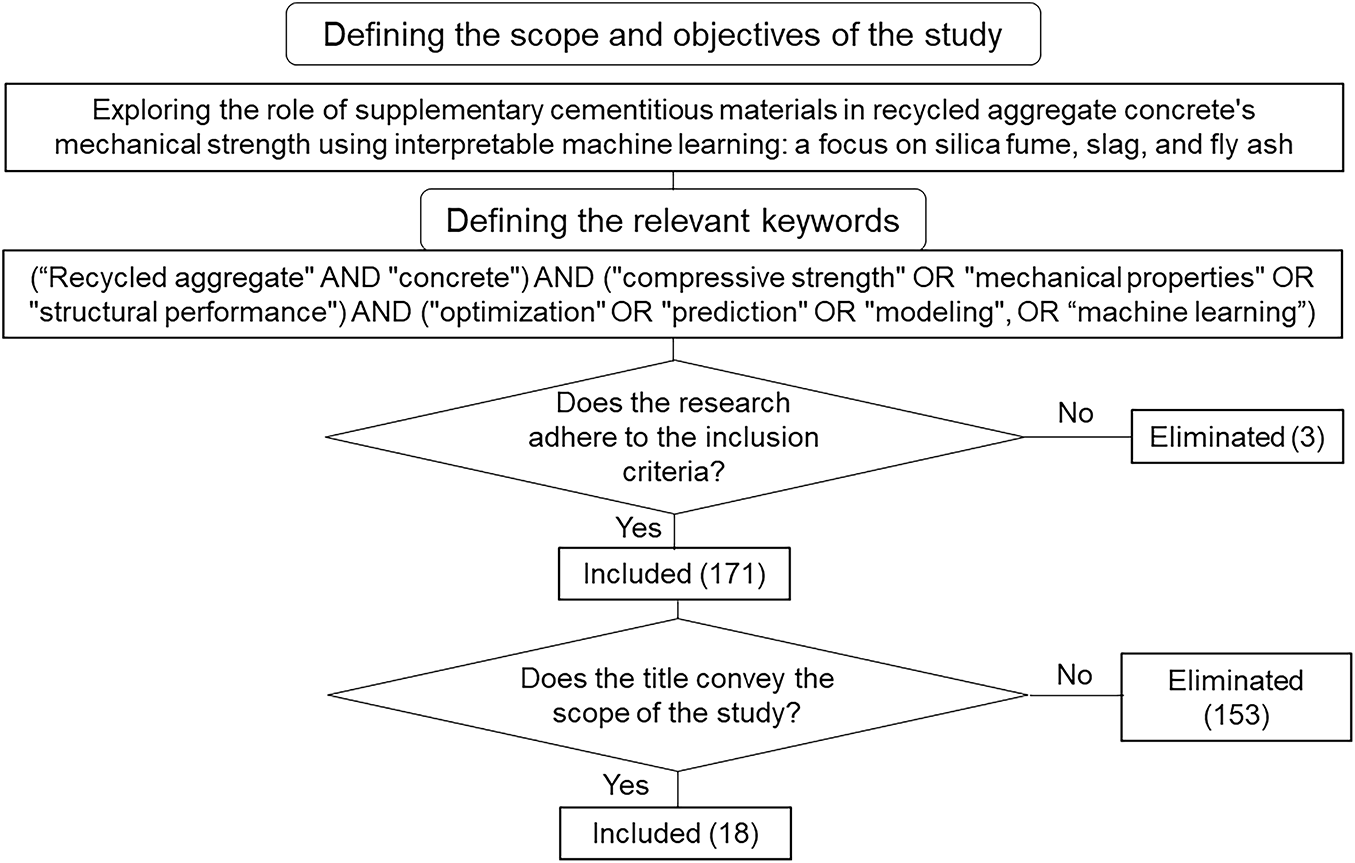
Figure 1: The systematic methodology employed for literature collection. (Inclusion Criteria: Only scientific articles written in English)
RAC has gained prominence as a sustainable alternative in modern construction due to its potential to mitigate environmental impacts by reducing both carbon emissions and construction waste. As its adoption increases, reliable prediction of its CS becomes essential for ensuring structural integrity. To this end, ML has been increasingly employed for modeling the mechanical behavior of RAC with high precision. Traditional empirical and semi-empirical models for RAC compressive strength prediction, developed through regression analysis on experimental datasets, have achieved moderate accuracy with correlation coefficients typically ranging from 0.50 to 0.80 [15–19]. However, these approaches face significant limitations, including poor generalization beyond specific mix proportion ranges, inability to capture complex nonlinear interactions among multiple parameters, and sensitivity to dataset bias and experimental variability. These constraints are particularly pronounced in RAC systems incorporating SCMs, where multi-parameter interactions become increasingly complex and difficult to model through conventional regression techniques.
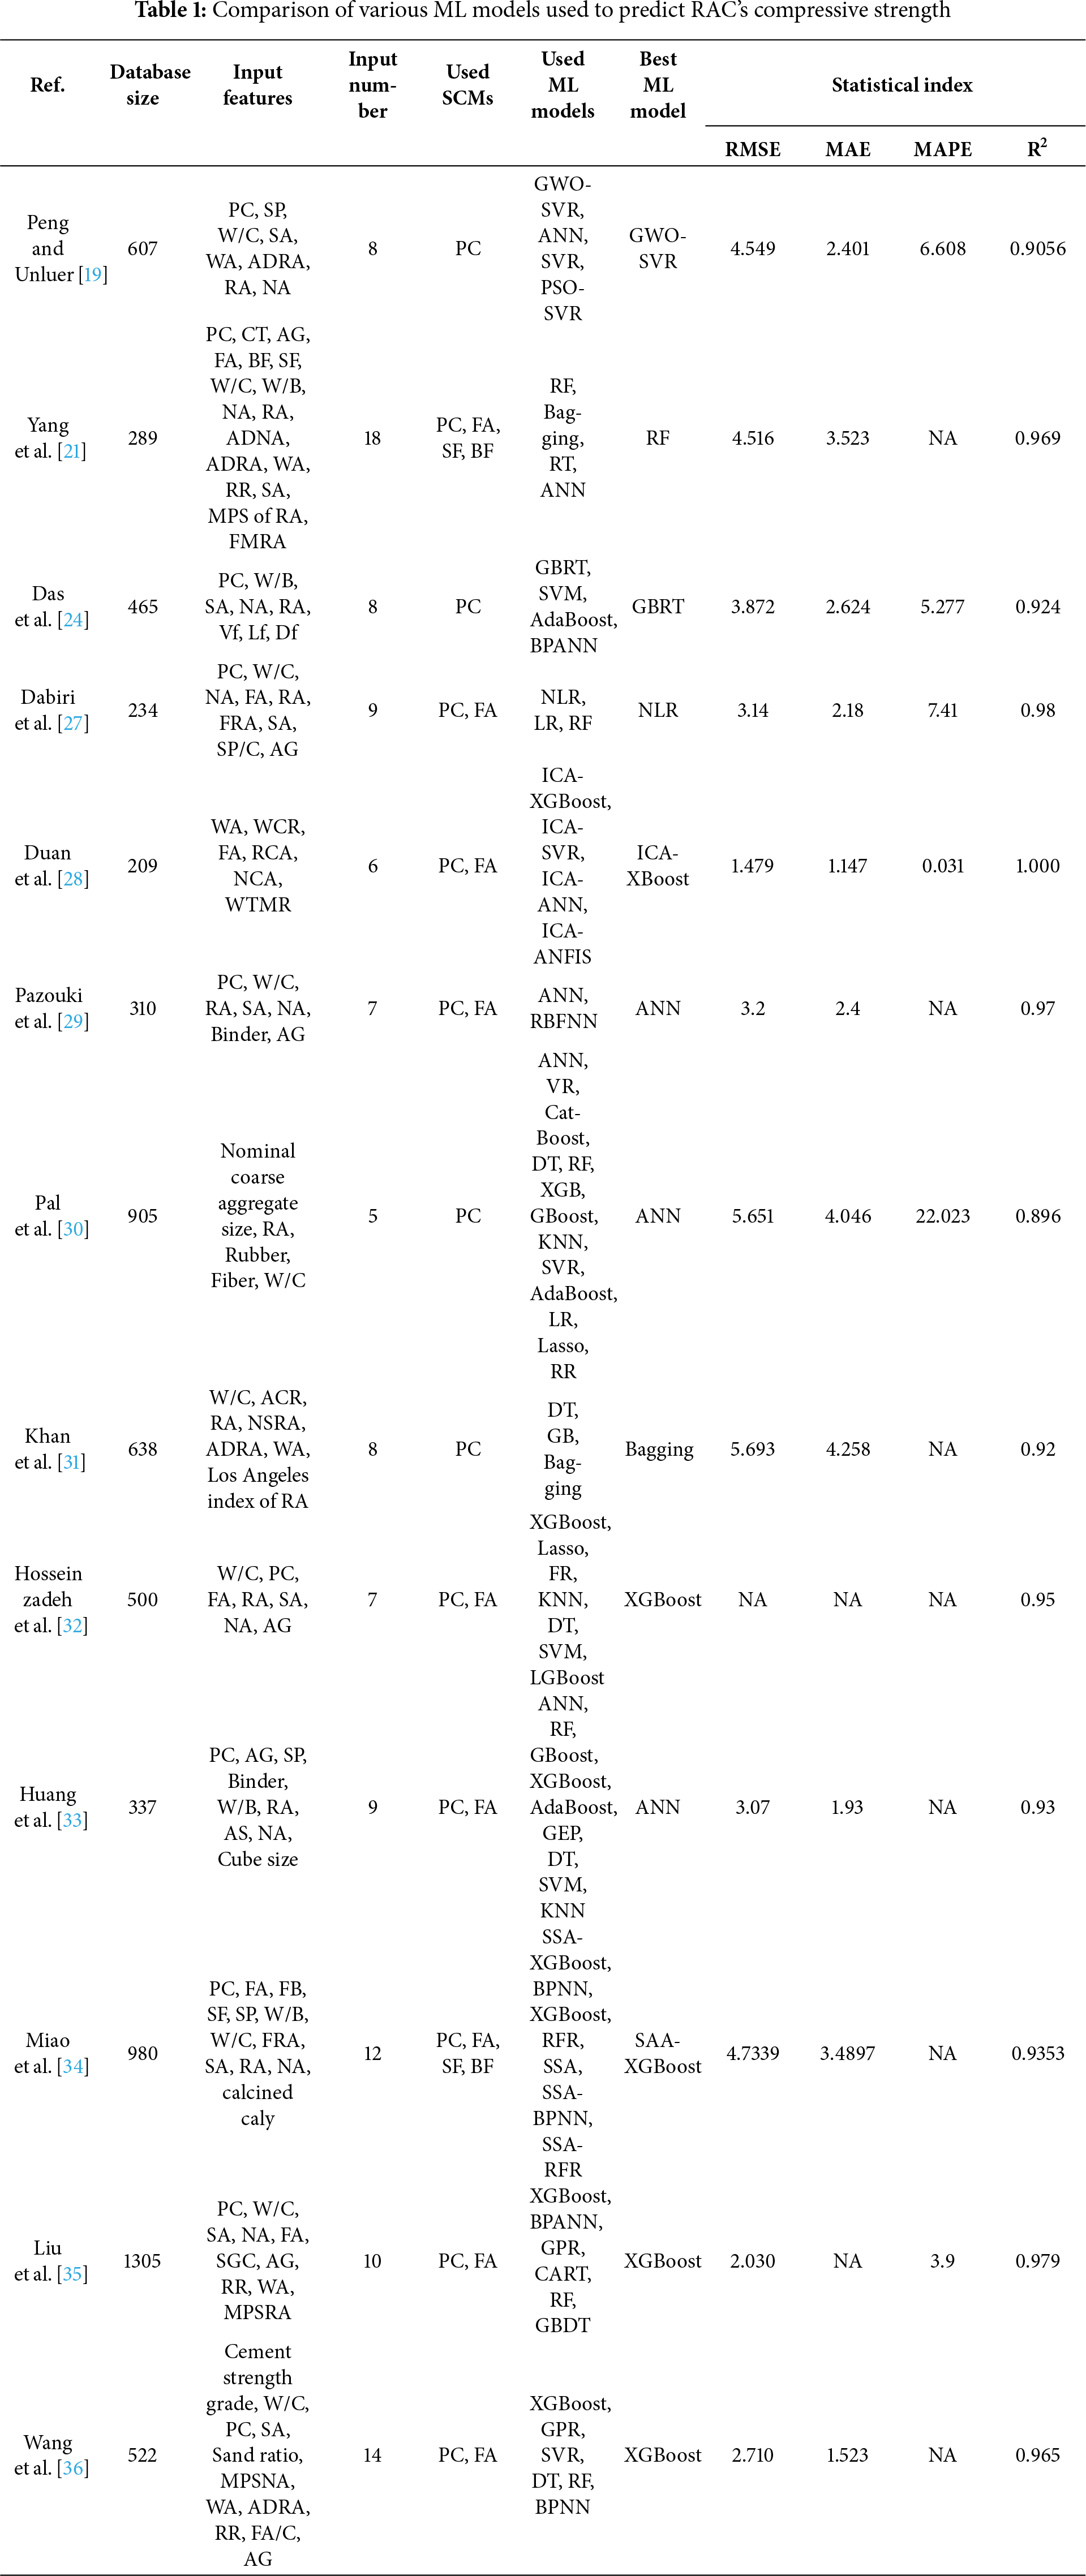
In the literature, a wide range of ML techniques, including regression-based models, neural networks, and ensemble learners, has been applied to capture the nonlinear relationships governing RAC properties. Unlike empirical equations that rely on simplified mathematical relationships, ML algorithms can effectively learn from heterogeneous datasets and identify complex patterns that govern material behavior. Among these, ensemble-based boosting approaches, particularly XGBoost, Gradient Boosting, and their hybrid variants, have consistently demonstrated the highest accuracy with correlation coefficients typically exceeding 0.94–0.99 due to their robustness and ability to model complex material interactions [20–24]. This superior performance stems from their capacity to handle nonlinear interactions among parameters such as water-binder ratio, recycled aggregate water absorption, superplasticizer content, and SCM compositions (relationships that conventional empirical models struggle to adequately represent). These models outperform conventional predictive methods across diverse datasets and input parameters, underscoring their suitability for RAC applications. Recent studies have demonstrated the potential of DL in predicting the mechanical performance of sustainable concretes. A chemistry-informed convolutional neural network (CNN) optimised with the enhanced bat algorithm accurately predicted the compressive strength of geopolymer concrete using key mix and curing parameters (R2 = 0.997 for training, 0.978 for testing) [25]. Likewise, a hybrid CNN–long short-term memory (LSTM) model with an attention mechanism and enhanced firefly optimisation effectively estimated the compressive strength of rubberised concrete (R2 = 0.967 for training, 0.943 for testing) [26], as listed in Table 1. Both models, supported by SHapley Additive exPlanations (SHAP) analysis, identified critical mix parameters influencing strength, highlighting DL as a powerful and cost-effective tool for sustainable concrete design. Furthermore, modern ML frameworks offer interpretability through techniques such as SHAP and partial dependence plots, providing both predictive accuracy and mechanistic insights that empirical models typically cannot deliver. Despite these advancements, existing studies continue to face limitations related to dataset quality, model generalization, and the integration of parameters associated with SCMs. These challenges highlight the need for more comprehensive databases, robust model selection strategies, and interpretable ML frameworks that can reliably account for RAC’s inherent heterogeneity.
In light of the limitations identified in previous studies, the present research introduces a comprehensive, data-driven, and interpretable framework for predicting the CS of RAC that incorporates SCMs. The principal innovation of this work is the development and thorough preprocessing of the largest and most heterogeneous database to date, which includes 1243 RAC mixtures containing silica fume, fly ash, and ground-granulated blast-furnace slag. Building upon this foundation, an advanced hybrid machine-learning approach was established by integrating gradient-boosting algorithms, particularly an optimized Extreme Gradient Boosting (XGBoost) model, with civil engineering domain expertise to capture the nonlinear chemical and microstructural interactions governing RAC performance. Through systematic hyperparameter tuning and interpretability analyses based on SHAP and partial dependence plots, the study not only achieves state-of-the-art predictive accuracy (testing R2 = 0.937) but also provides mechanistic insights into the relative influence of mix parameters such as curing age, water-to-binder ratio, and recycled aggregate water absorption. The combination of robust predictive modeling, physical interpretability, and large-scale data integration represents a significant advancement over existing empirical and black-box ML models. Hence, this research offers both a methodological contribution through the development of a validated, explainable gradient-boosting framework and a practical contribution by providing an interpretable predictive tool that can guide the design of sustainable RAC mixtures with enhanced reliability.
The performance of a ML model is highly dependent on the quality and comprehensiveness of its training dataset [37]. To enhance the accuracy of predictions, a well-curated and extensive database is essential. The database was systematically constructed through comprehensive literature searches of major academic databases, including Web of Science, Scopus, and Google Scholar, using targeted keywords such as “RAC”, “SCMs,” “SF”, “FA”, “slag”, “CS”, and their combinations. Only peer-reviewed experimental studies reporting complete mix design details and standardized compressive strength measurements under controlled laboratory conditions were considered for inclusion. Inclusion criteria required: (i) complete reporting of all mix design parameters, (ii) specified curing age and conditions, (iii) adherence to standard testing procedures (ASTM, EN, or equivalent), and (iv) clear documentation of RA properties. Exclusion criteria encompassed: (i) non-standard curing conditions (elevated temperature, accelerated curing), (ii) non-standard testing procedures deviating from established codes, and (iii) duplicate datasets from identical research programs.
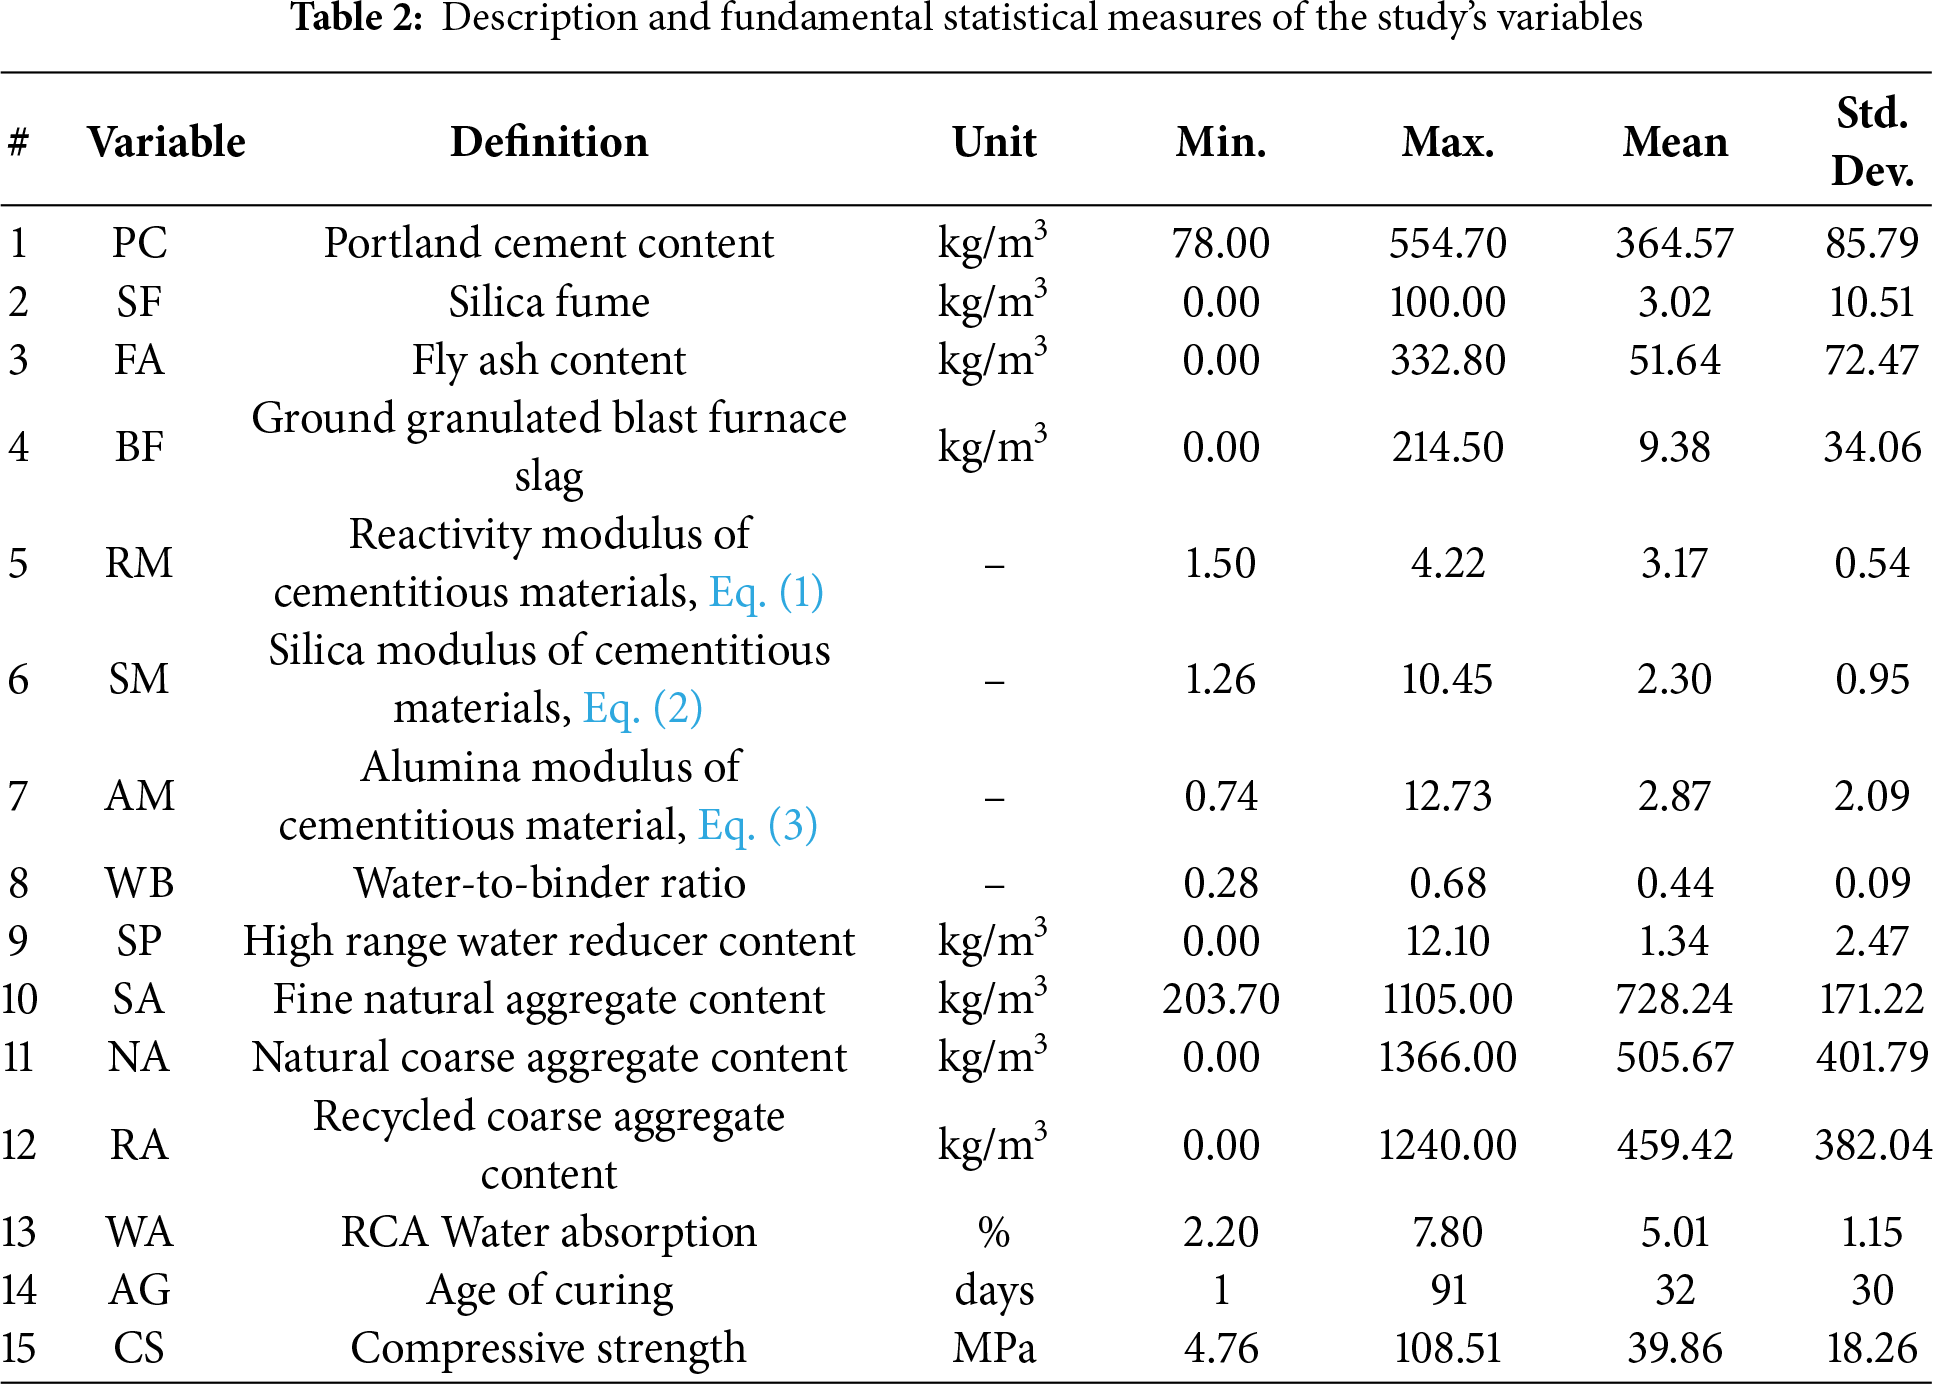
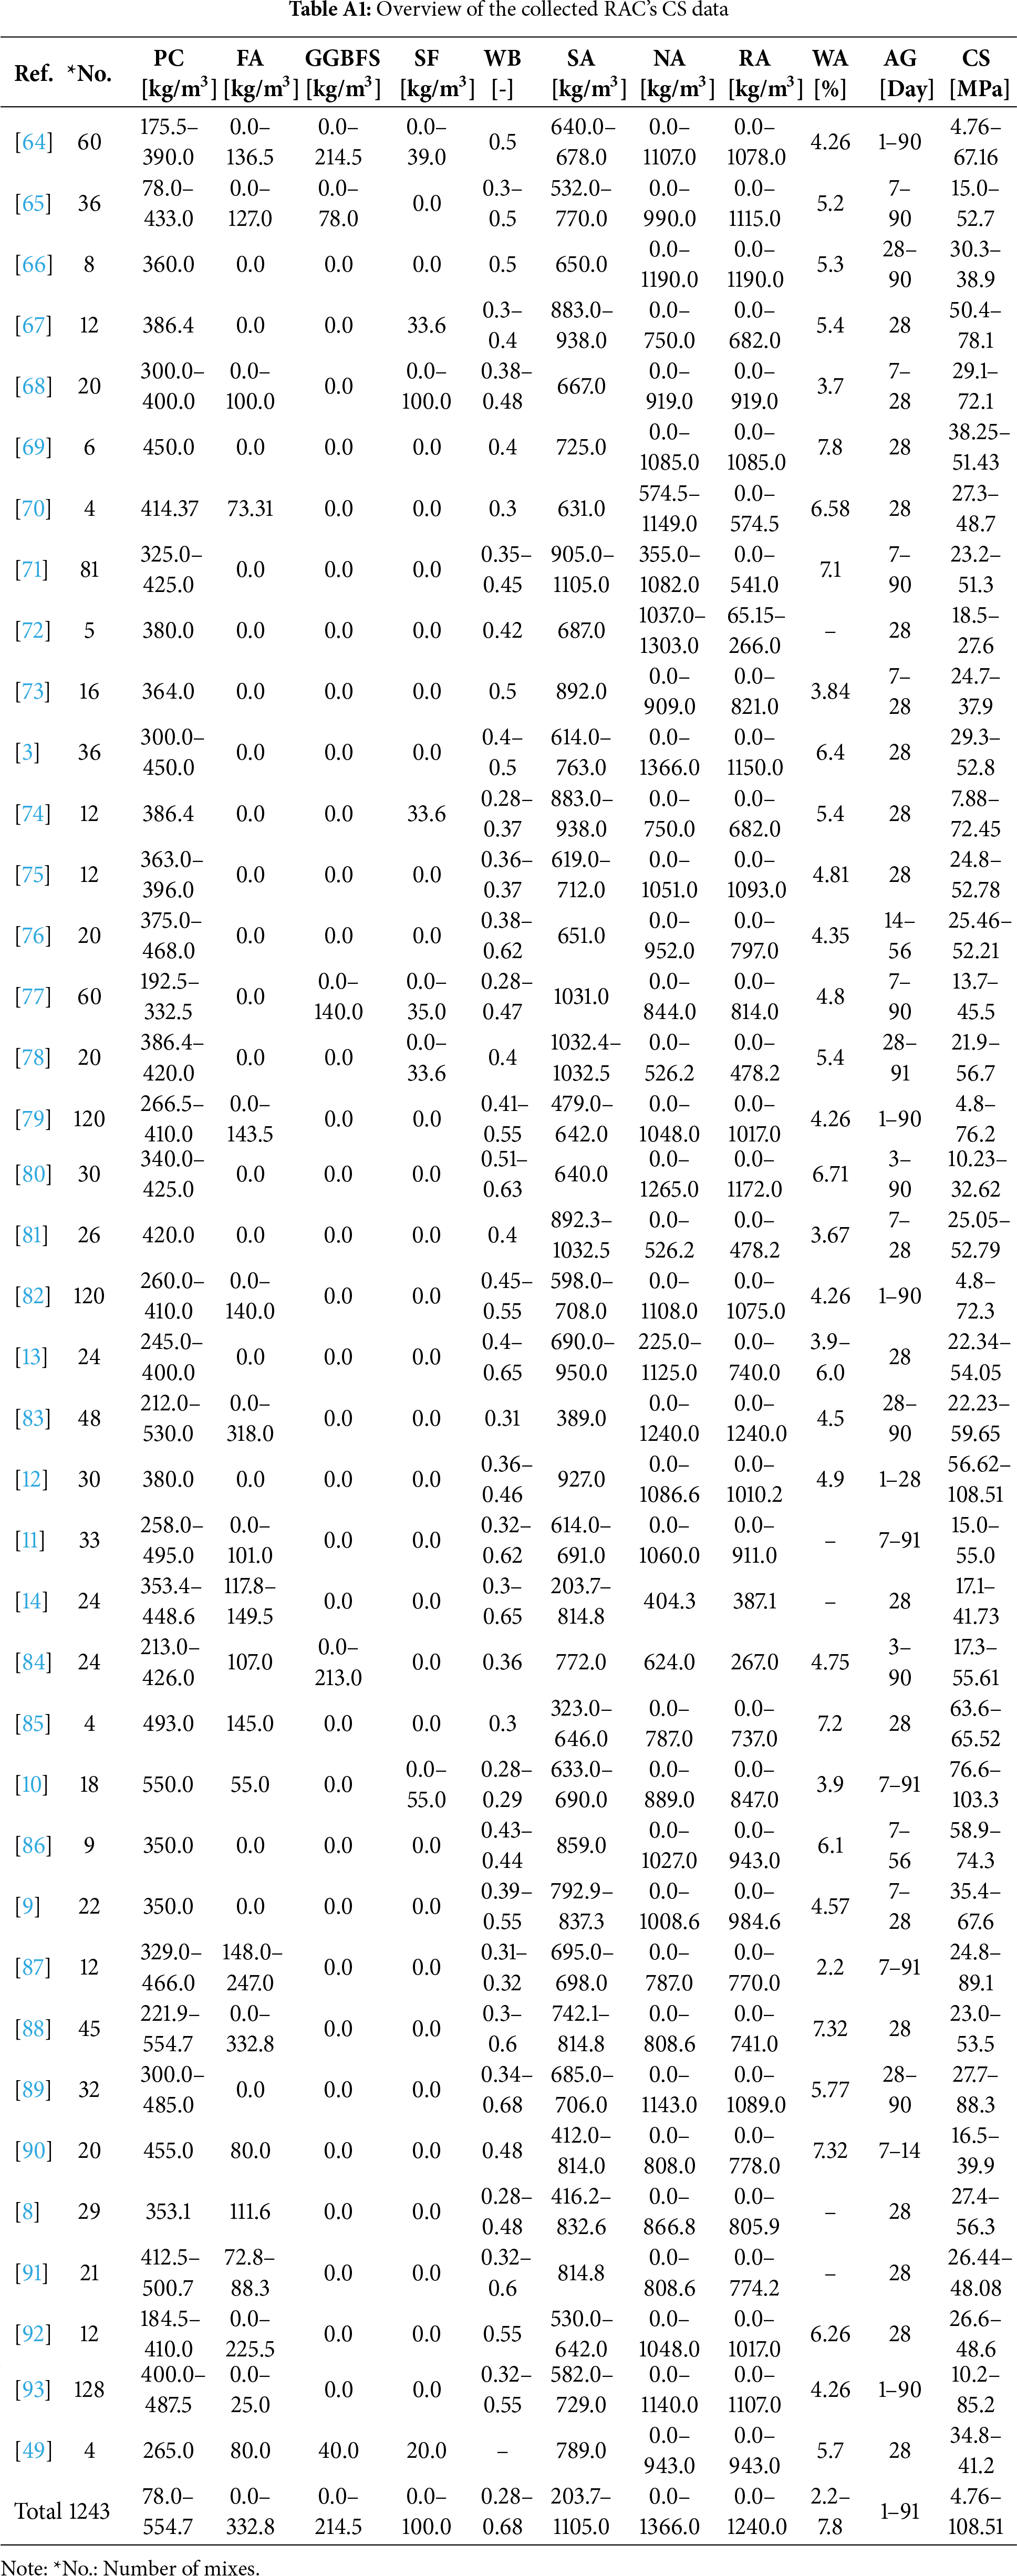
In this study, a dataset comprising 1243 RACs mix designs including PC, BF, SF, and FA under standard curing conditions was compiled from 39 independent experimental studies (see Appendix A, Table A1). These sources were meticulously selected based on the richness of their data and their alignment with the study’s objectives, ensuring that the dataset remains both robust and relevant. This rigorous curation process established a high-quality database that supports the reliability of the ML model training and validation procedures. Maintaining high-quality data is critical for validating the model’s predictive reliability and practical applicability. The dataset includes 14 input variables and one target variable (CS). Table 2 presents a detailed statistical summary of the key parameters influencing the mechanical behavior of RAC, encompassing 14 independent variables and one dependent variable (i.e., the CS). The binder components, PC, SF, FA, and BF, exhibit significant variability, with PC showing the highest mean (364.57 kg/m3) and a substantial standard deviation (85.79 kg/m3), indicating diverse cement dosages across mix designs. The inclusion of SCMs, such as SF (mean: 3.02 kg/m3) and FA (mean: 51.64 kg/m3), suggests a wide range of blended cementitious systems. The WB varies between 0.28 and 0.69, with a mean of 0.44 and a standard deviation of 0.09, reflecting its critical role in workability and strength development. Aggregate properties exhibit notable dispersion, particularly for NA, which has a high standard deviation (401.79 kg/m3), and RA, which varies from 0 to 1240 kg/m3 with a mean of 459.42 kg/m3, highlighting different levels of aggregate replacement. The RA’s WA remains relatively stable (mean: 5.01%, std. dev.: 1.15%), reinforcing the known porosity concerns of RA. The CS demonstrates a broad range from 4.76 to 108.51 MPa (mean: 39.86 MPa, StdDev.: 18.26 MPa), capturing the inherent variability in RAC performance. This extensive variation in material composition and mechanical properties underlines the complexity of RAC mix design and suggests that ML models could be instrumental in identifying nonlinear relationships and optimizing mixtures for enhanced performance.
The dataset was curated to include the detailed oxide compositions of both the base cement and all SCMs, forming the basis for computing the concrete’s equivalent cementitious modulus according to the procedure established by Abellan-Garcia et al. [38]. Establishing the relative modulus of each SCM is a critical step for determining the equivalent reactivity indices of the concrete mixture, as highlighted in [38]. To this end, the equivalent modulus for each constituent is evaluated independently by applying the method set out in Eqs. (1)–(3).
here,
2.2 Visualization of the Study Variables
The violin plots (Fig. 2) provide a detailed statistical analysis of key parameters influencing RACs’ performance, illustrating their distribution, central tendency, and variability. CMs, such as PC, FA, BF, and SF, exhibit distinct patterns, with FA and SF showing right-skewed distributions indicative of their limited but strategic use as partial cement replacements. Admixtures like SP display multimodal distributions, reflecting their tailored incorporation to optimize workability and setting time. The relatively stable WB suggests controlled mix designs, while the broader distributions of NA and RA highlight material heterogeneity, particularly in WA. The equivalent modulus of each mixture, represented by RM, SM, and AM, varies depending on the material composition, influencing the overall stiffness and mechanical response of the mixture. The study label (CS) exhibits a dense central distribution with a wide range, influenced by mix composition and curing conditions, while the clustering of AG aligns with standard testing protocols. These trends emphasize the role of mixture optimization, material properties, and curing duration in defining RACs’ performance, warranting further multivariate analysis to refine predictive modeling.
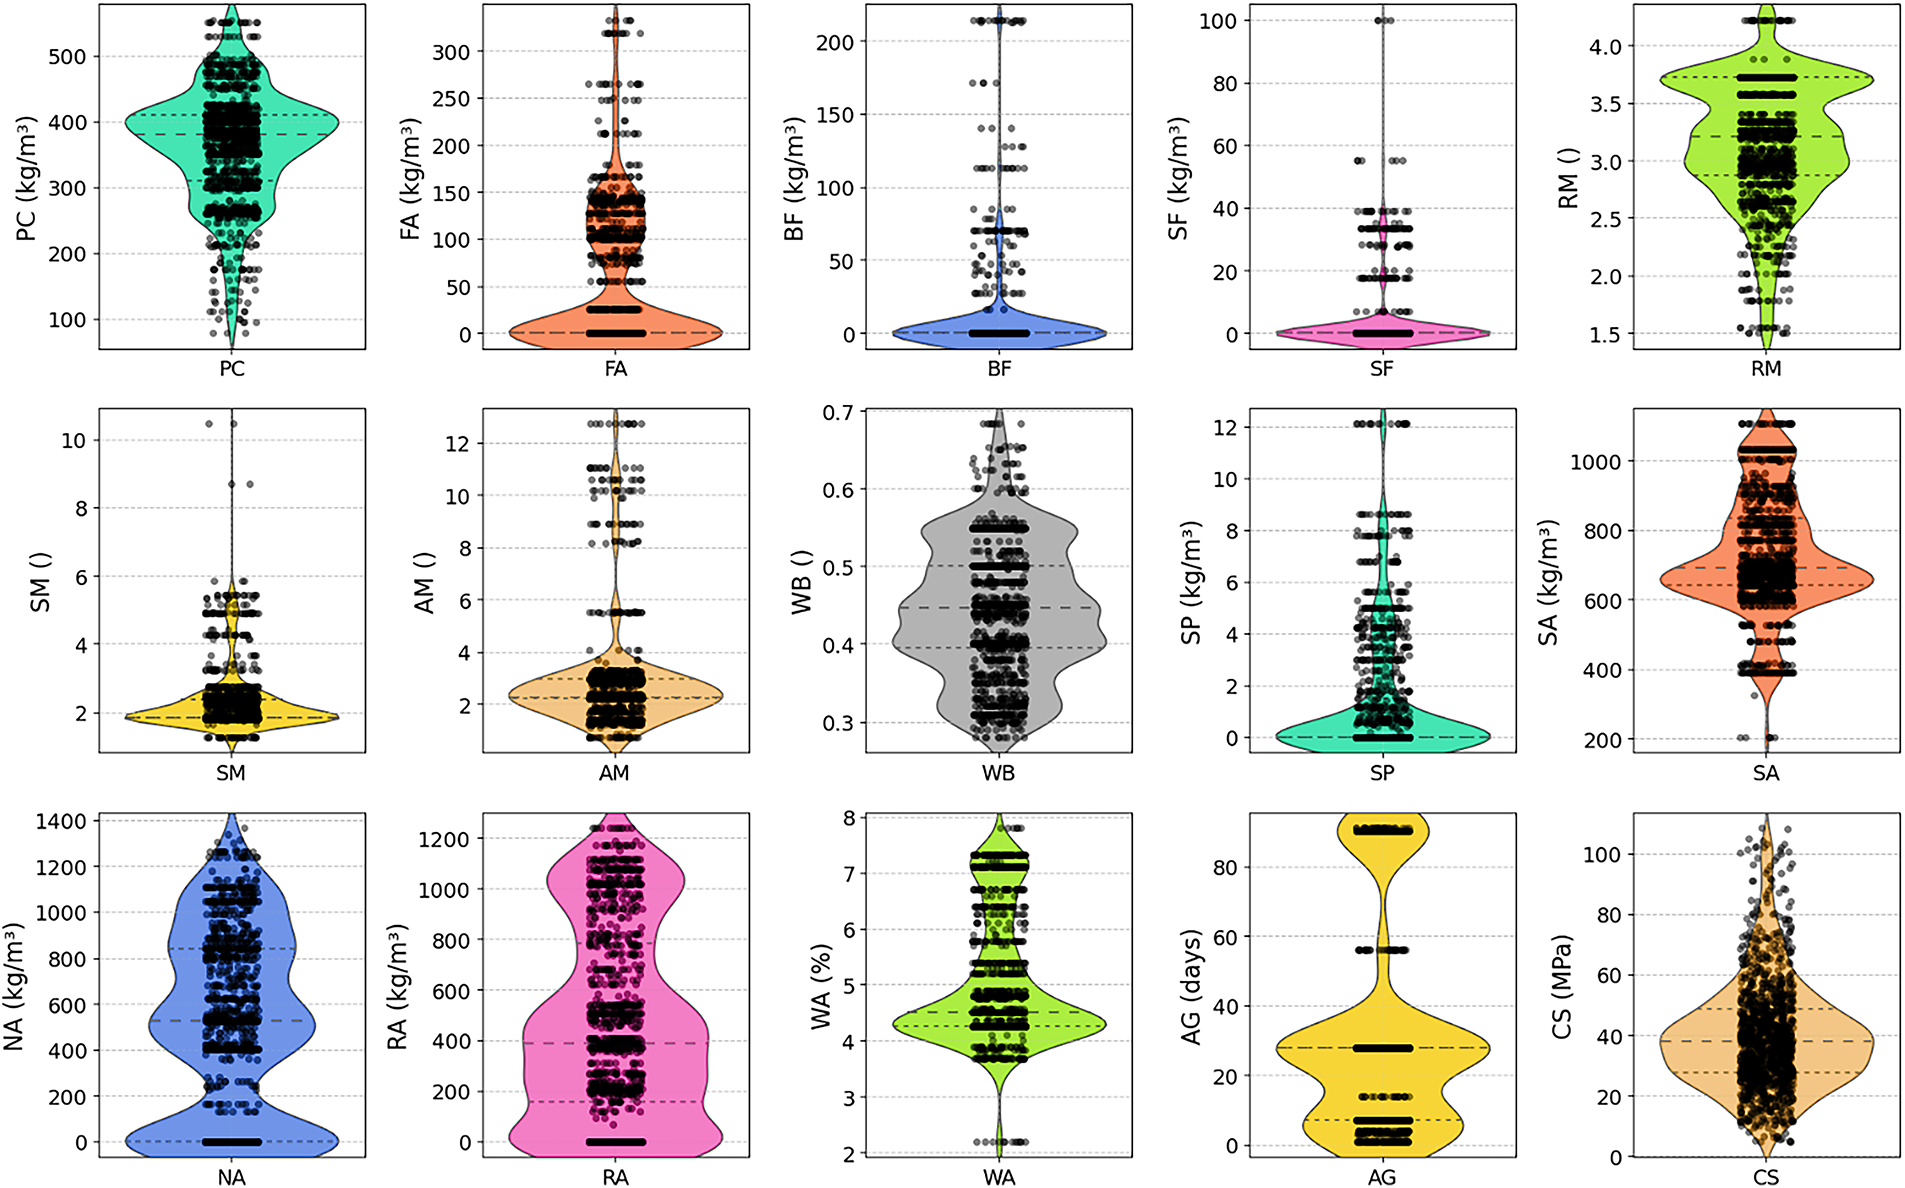
Figure 2: A violin plot visualizing the variables of the study
2.3 Correlation Analysis of Study Variables
To characterize how the input variables interact, the study explored both monotonic and strictly linear associations across the dataset. Two complementary statistical metrics were applied: (i) the Pearson product–moment coefficient
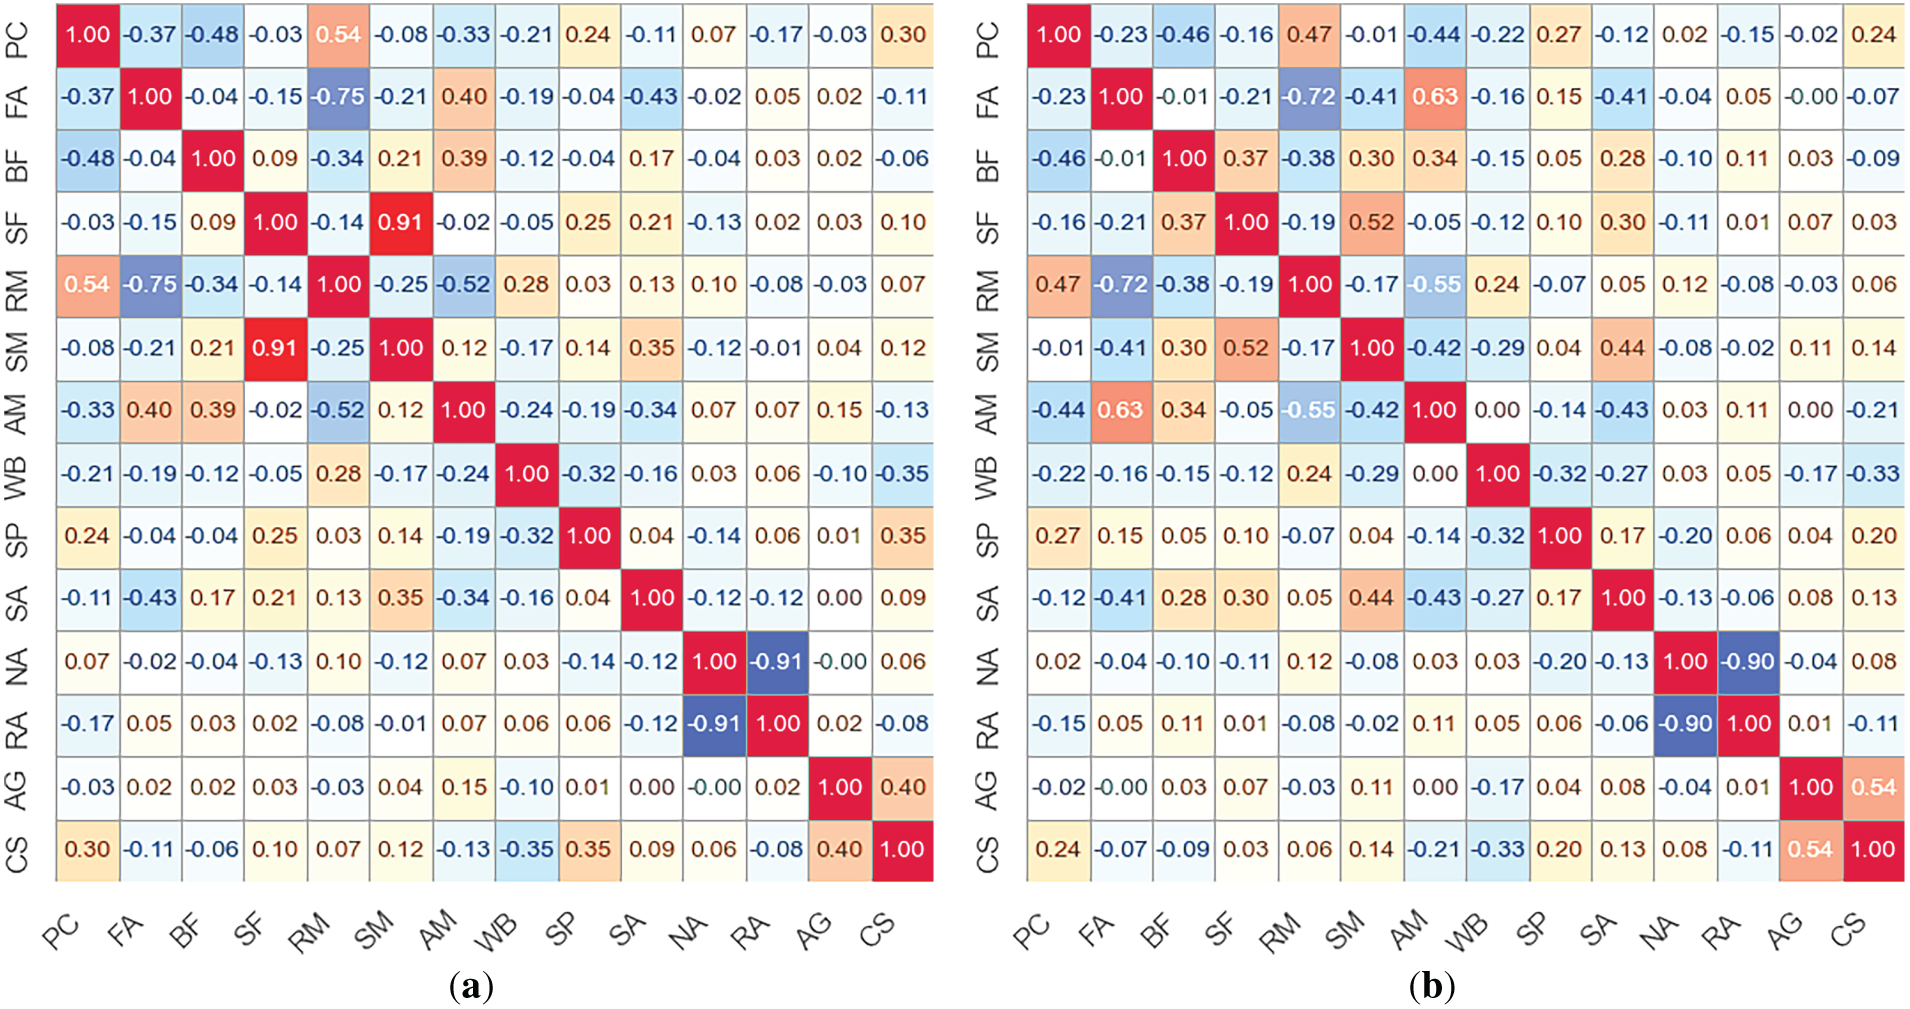
Figure 3: (a) Pearson’s, and (b) Spearman’s correlation heat maps
In the correlation formulas, each paired observation is indexed by
The correlation heat illustrates the relationships between key variables using Pearson’s [Fig. 3a] and Spearman’s [Fig. 3b] correlation coefficients. Pearson’s correlation quantifies linear relationships, while Spearman’s captures monotonic trends, offering complementary insights into the dataset’s structure. The results indicate strong correlations among CMs, suggesting their simultaneous use in optimizing RACs’ performance. Additionally, WB exhibits a negative correlation with CS, reinforcing the well-established principle that increased water content leads to higher porosity and reduced strength [39,40]. The relationship between RA and NA highlights the inverse balance in mix compositions incorporating varying aggregate types. The observed differences between Pearson’s and Spearman’s coefficients suggest potential nonlinear dependencies in admixtures and mechanical properties.
2.4 Data Preprocessing Protocols
Before model training, it was essential to screen the dataset for abnormal observations to preserve both the accuracy and the stability of subsequent regression models [41]. The study employed Cook’s Distance, a well-established diagnostic that quantifies the influence of individual records on the regression model. This approach has been extensively documented in regression diagnostics literature [42–44] and remains a robust method for identifying influential or anomalous data points. Any data points exceeding the reference threshold in Fig. 4a were classified as highly influential and consequently treated as outliers. To confirm the robustness of this filtering process and to ensure that no valid high-strength data were unconsciously excluded, additional distribution-based methods were applied to the entire dataset. Specifically, Cook’s Distance identified 82 influential observations (6.6%), whereas the Z-score (|Z|>3) and Interquartile Range (IQR; 1.5 × IQR) techniques flagged 23 and 48 cases, respectively, with 19 observations being common across all three approaches. This robust overlap demonstrates the reliability of Cook’s Distance in capturing genuine anomalies. Moreover, re-estimating the model after removing each outlier set produced stable or improved predictive performance (R2 increased from 0.77 to 0.87, and RMSE decreased from 7.2 to 5.5 MPa), which supports that the exclusion of these points enhanced the model’s robustness without discarding valid high-strength records. The refined dataset, illustrated in Fig. 4b, exhibits a clearer and more coherent relationship after outlier removal. The resulting dataset, reduced to 1161 valid entries, was then partitioned into training and testing subsets in an 80:20 ratio to maintain a representative balance for model calibration and performance evaluation.
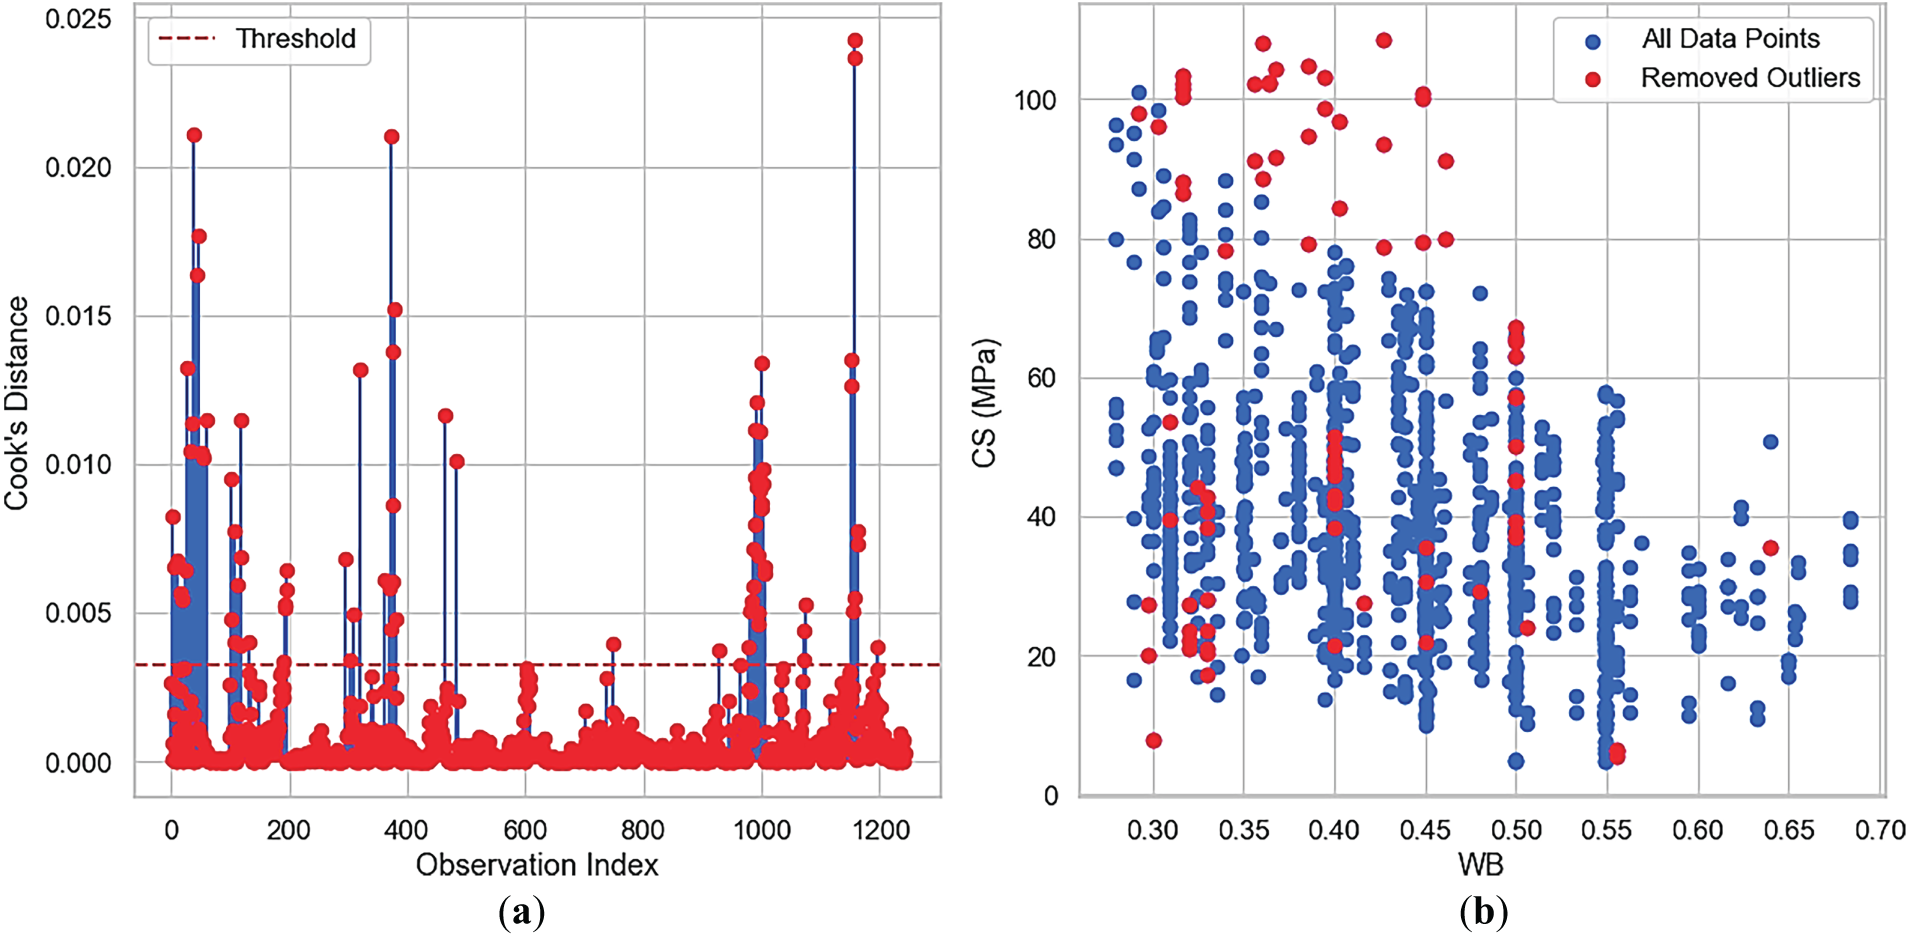
Figure 4: (a) Cook’s distance for outlier detection, and (b) scatter plot illustrating the eliminated outlier
Figs. 5 and 6 illustrate the frequency distributions and corresponding boxplots of three selected variables, including PC, WB, and RA. Before preprocessing (Fig. 5), the distributions exhibit varying degrees of skewness and dispersion. PC is right-skewed, with a concentration around 400 kg/m3. WB has a multimodal distribution with peaks at distinct intervals and a relatively uniform spread, while RA is highly skewed, with a high concentration near zero and significant outliers. After preprocessing (Fig. 6), the key transformation observed is normalization, which maps all values onto a [0, 1] scale. The general shape of the distributions is retained, ensuring that intrinsic data structures remain intact. PC and WB show preserved patterns, while RA still exhibits some skewness, suggesting that additional transformations, such as log-scaling, may be required. The primary objectives of preprocessing include ensuring comparability by scaling features to a common range, mitigating the effects of outliers, and preserving essential distribution characteristics. While normalization effectively standardizes the data, persistent skewness in RA suggests that more sophisticated transformations may be beneficial for optimizing data representation in ML applications. In this study, the min-max scaling approach was selected to ensure consistency across the diverse range of algorithms applied (refer to Section 3). This approach provided a uniform input range suitable for both scale-sensitive models (e.g., neural networks and support vector regression) and scale-invariant models (e.g., Random Forest, Extra Trees, and XGBoost). Although the RA variable remained moderately skewed after normalization, comparative trials using logarithmic and Yeo-Johnson power transformations [45] revealed negligible effects on model performance (ΔR2 < 2.3% and ΔRMSE < 0.8 MPa). These findings confirm that the adopted scaling method effectively preserved predictive stability and interpretability across the developed ML framework, without requiring additional nonlinear transformations.
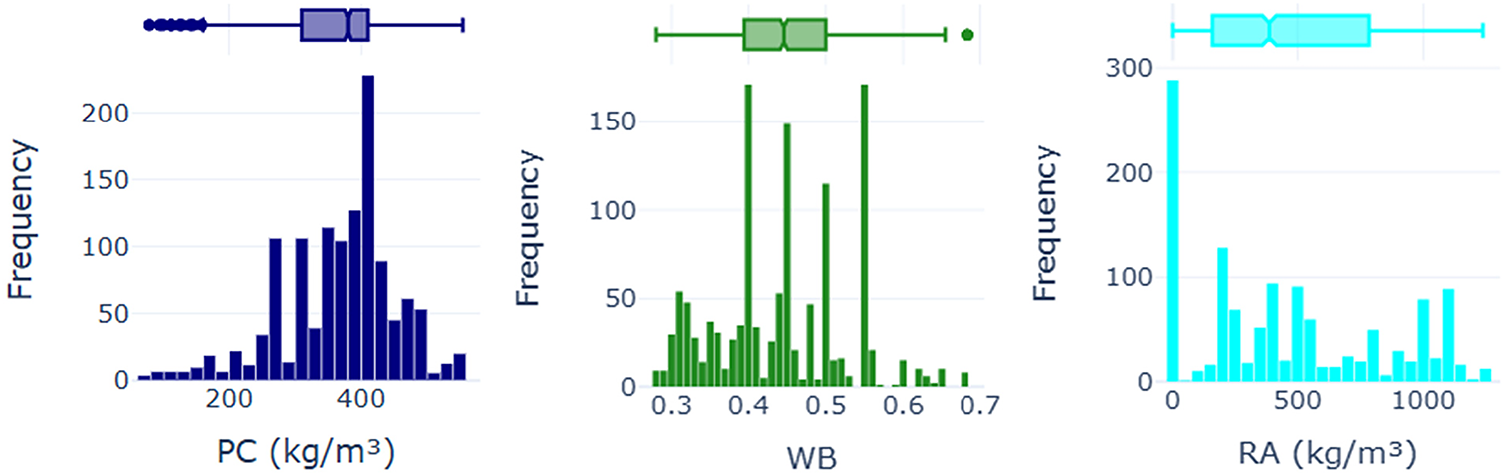
Figure 5: Distribution of some of the key features before preprocessing
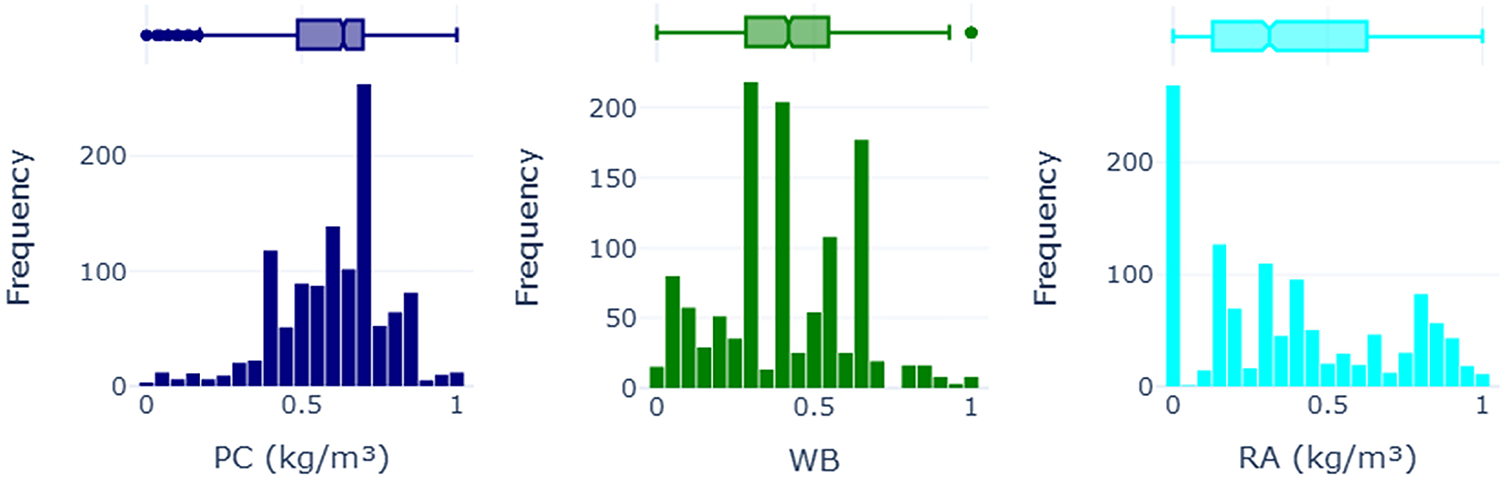
Figure 6: Distribution of some of the key features after preprocessing
Moreover, Fig. 7 presents the distribution of the study label (CS) before and after preprocessing. Both histograms exhibit a roughly normal distribution, with a peak around 50 MPa and a spread extending up to approximately 100 MPa. The boxplots indicate the presence of outliers, particularly on the upper end, suggesting variability in high-strength samples. Notably, the preprocessing step does not significantly alter the overall shape of the distribution, indicating that the transformation applied primarily focused on standardization rather than structural modification. This suggests that the preprocessing method preserved the statistical properties of the CS data while ensuring consistency across the dataset, a crucial aspect for maintaining data integrity in predictive modeling applications.
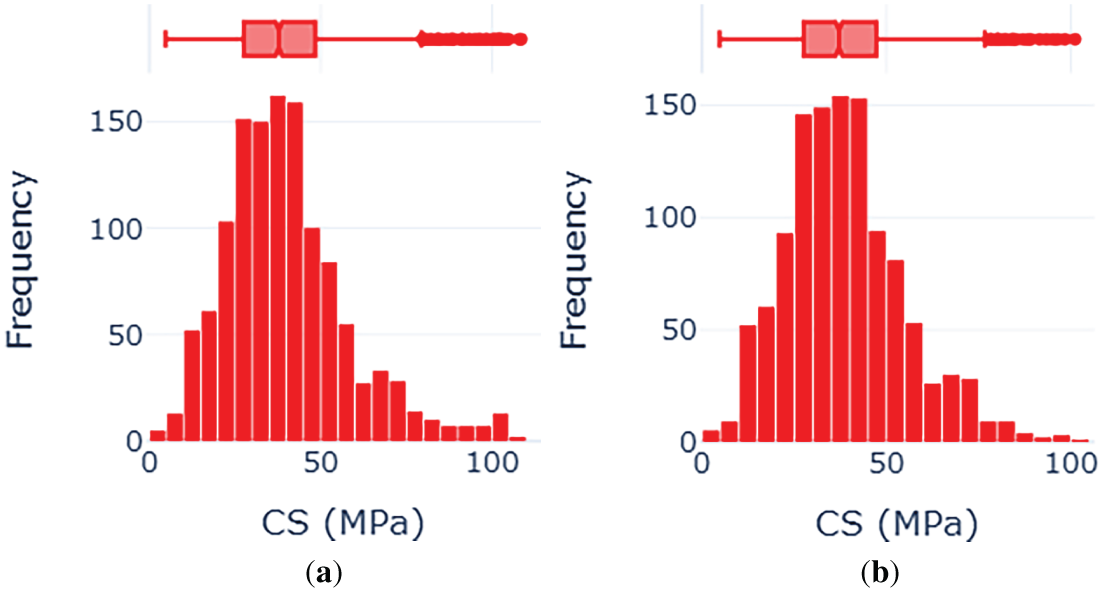
Figure 7: Distribution of the study label: (a) before-, and (b) after-preprocessing
3 Machine Learning Methodology
To enable a rigorous and unbiased evaluation of predictive performance, the dataset was first organized through a carefully planned partitioning procedure. The predictor variables (
• Classical linear estimators, namely Ordinary Least Squares, Ridge, Lasso, Elastic Net, and Bayesian Ridge, offered straightforward interpretability and efficient handling of linear trends. To capture more complex or non-linear patterns, the analysis incorporated K-Nearest Neighbors, Decision Trees, and Support Vector Regression.
• Ensemble approaches, such as Random Forests, Extra Trees, Gradient Boosting, AdaBoost, and Bagging Regressors, were added to exploit the strength of multiple base learners and to reduce both variance and bias.
• Advanced gradient-boosting implementations, specifically XGBoost and LightGBM, were included for their scalability and strong performance on high-dimensional data.
• Artificial Neural Networks (ANNs) with hidden layers ranging from 16 to 256 neurons and training horizons up to 200 iterations provided a deep-learning perspective capable of modeling intricate dependencies.
Most algorithms were implemented through the scikit-learn ecosystem, while XGBoost and LightGBM were accessed via their dedicated libraries. This modular design allowed consistent training, validation, and performance comparison across all candidate models, which facilitates the selection of the most suitable approach for the characteristics of the refined dataset and the study’s predictive objectives.
4.1 Comprehensive Modeling Using the Full Feature Set
4.1.1 Performance of the Selected ML Algorithms
Table 3 presents the performance metrics of various ML algorithms applied to the dataset. The models were evaluated using multiple statistical indicators, including the coefficient of determination (
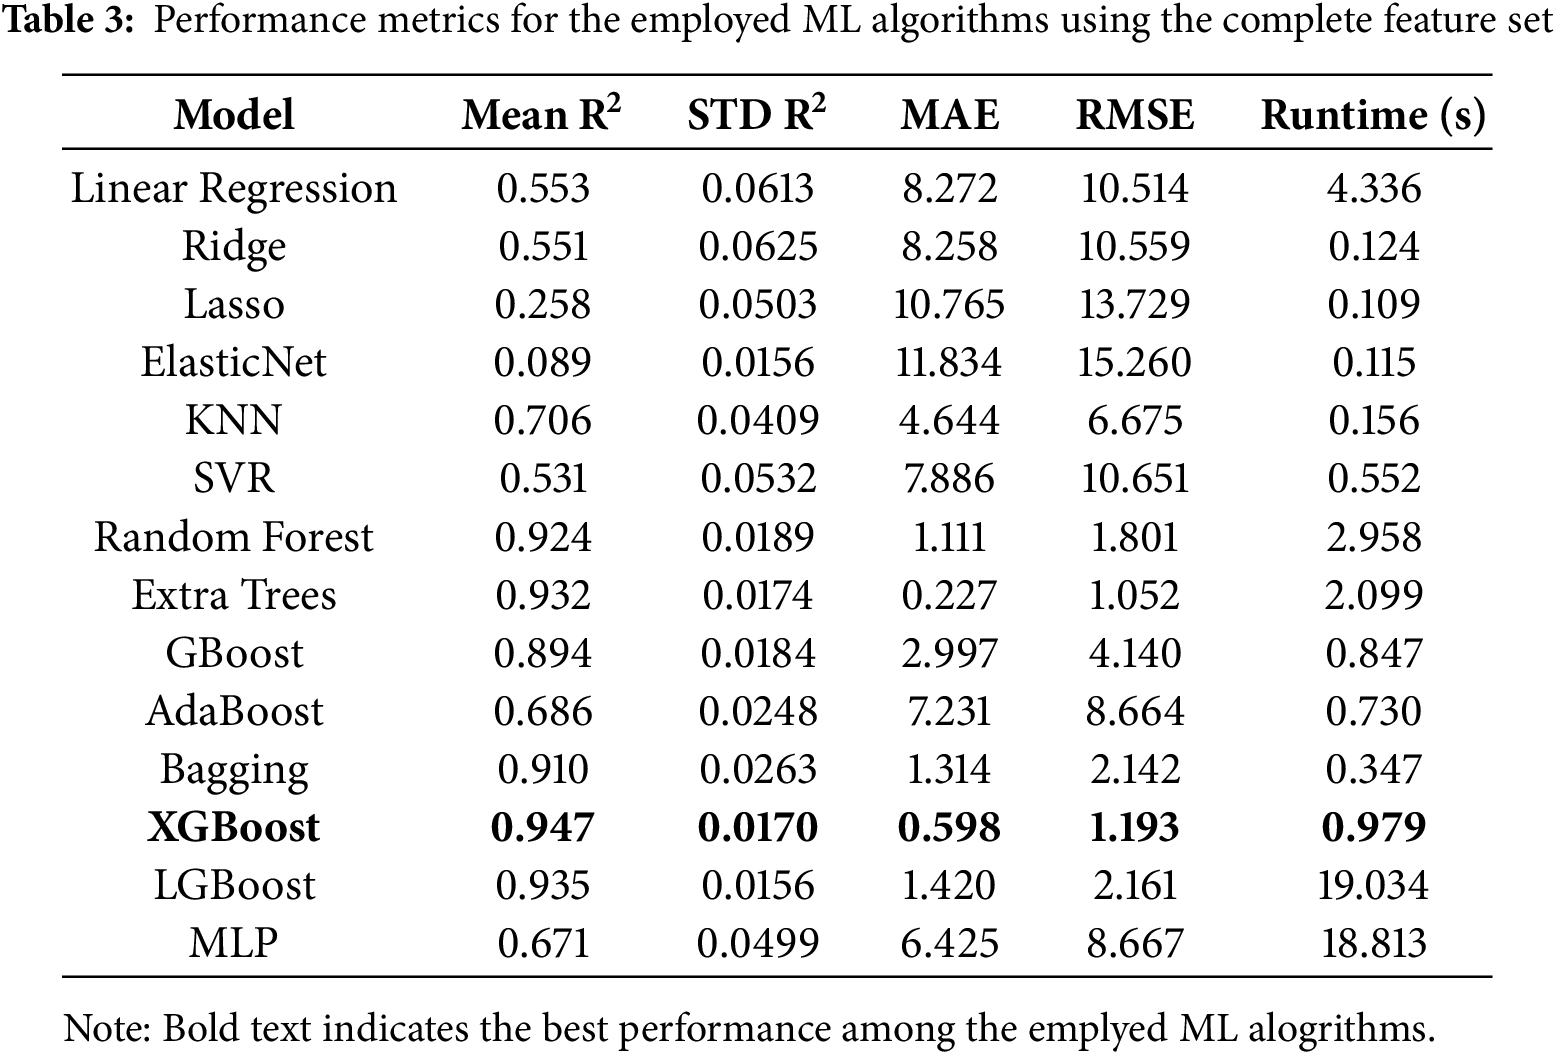
The superior performance of XGBoost can be attributed to its efficient handling of complex data patterns, regularization mechanisms that prevent overfitting, and an optimized gradient-boosting framework. In contrast, traditional regression models struggled due to their linear assumptions, and computationally expensive models like LGBoost and MLP did not provide a substantial performance advantage over XGBoost. Given the superior performance demonstrated by XGBoost, it was selected for subsequent analysis.
Fig. 8 presents the feature importance ranking based on absolute SHAP values, offering insight into the contribution of each variable to the predictive model of CS. In Fig. 8a, which considers the complete feature set, AG exhibits the highest influence with a mean absolute SHAP value of 7.25, followed by WA (3.2) and WB (2.92). Other significant contributors include SP with an absolute SHAP value of 2.24 and PC with 2.13, while features such as BF and SF show negligible impact. The cumulative importance curve indicates that approximately 95% of the total feature contribution is captured by the most influential variables. To reduce the model’s complexity, the features AM, RM, FA, SF, and BF will be excluded. Consequently, only the features demonstrating approximately 95% significance will be retained in the simplified model, referred to as the ‘Pruned Model’. In Fig. 8b, after dimensionality reduction, the model retains the most relevant predictors, reducing redundancy while maintaining predictive performance. The top-ranked features remain largely unchanged, with AG (7.16), WA (3.26), and WB (3.05) maintaining dominance. However, the retained subset captures only 80% of the total importance, suggesting a trade-off between model simplification and information retention. The exclusion of lower-impact variables likely enhances model interpretability without significantly compromising accuracy. The relatively lower mean absolute SHAP value of PC (2.07) suggests that while cement content contributes to CS, other factors, such as aggregate and water proportions, play a more substantial role in determining strength variations.
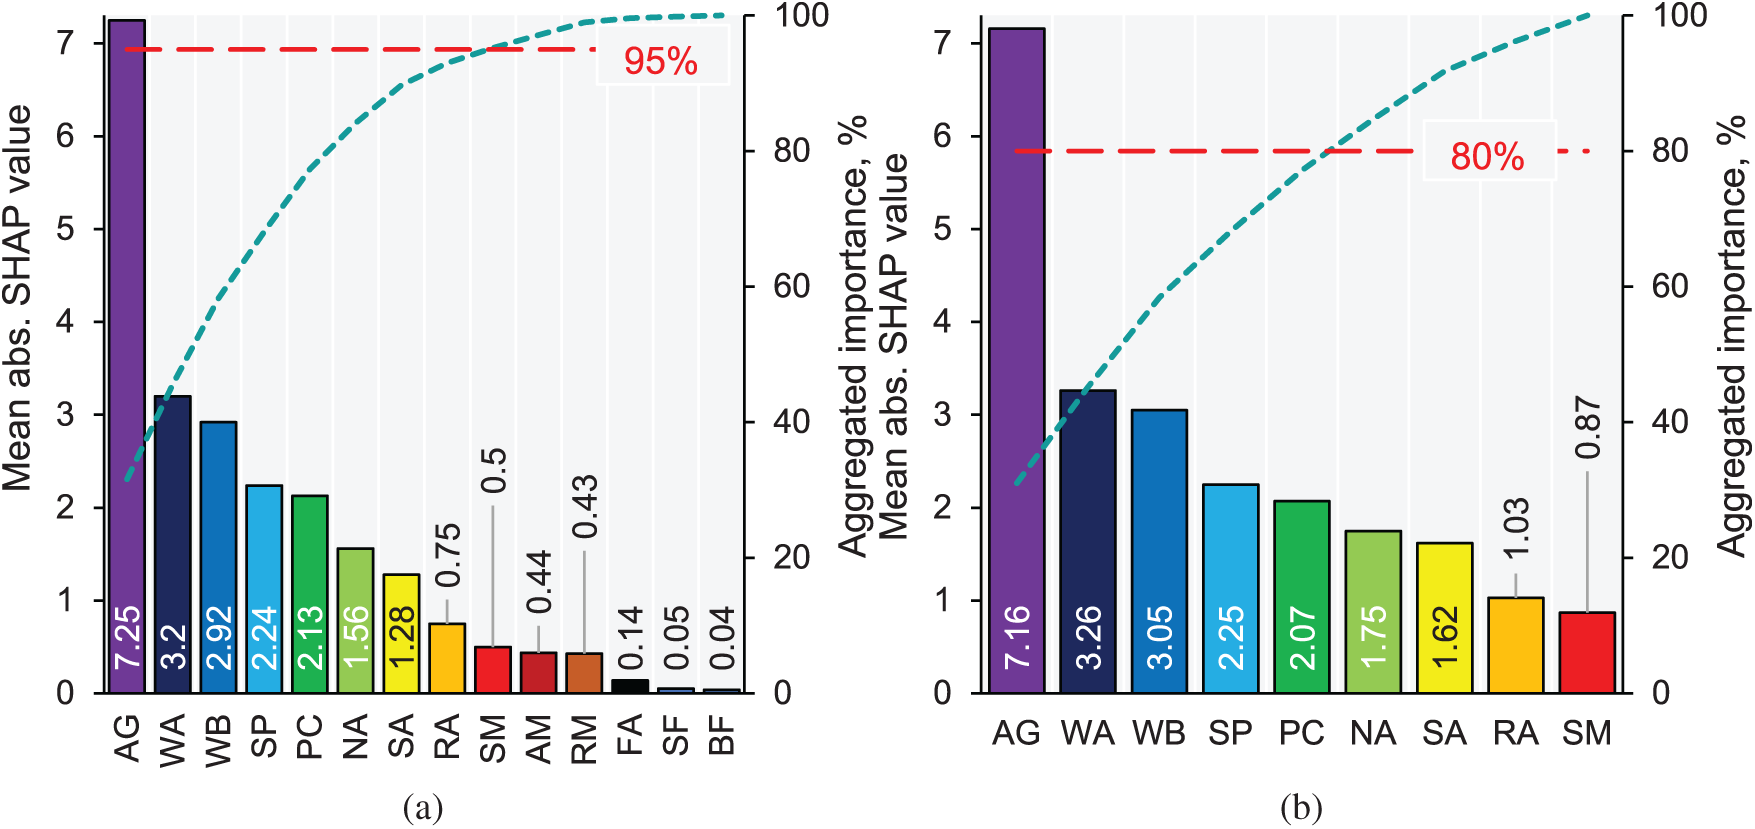
Figure 8: Feature importance ranking using the absolute SHAP values: (a) complete feature set and (b) selected features following dimensionality reduction
4.1.3 Enhancing the Efficiency of the XGBoost Model
This study implements a systematic hyperparameter optimization strategy to enhance the predictive performance of an XGBoost model. A comprehensive grid search was conducted to assess the influence of three critical hyperparameters: (i) the number of estimators (50–1000), (ii) the maximum tree depth (2–10), and (iii) the learning rate (0.01–1.0). The tuning process was performed in Python [46] (v3.13.2), leveraging NumPy (https://numpy.org/) for numerical computations and Pandas for structured data processing. The optimal configuration for the full feature set was determined as n_estimators = 50, learning_rate = 0.2, and max_depth = 7, whereas the reduced feature set achieved its best performance with n_estimators = 500, learning_rate = 0.1, and max_depth = 4. Fig. 9 presents the relationship between training and validation RMSE for different hyperparameter configurations, comparing models trained with the complete and reduced feature sets. Each point represents a model evaluated during optimization, with the best-performing model highlighted in red. In Fig. 9a, using the complete feature set, training RMSE ranges from approximately 0.5 to 8.0 MPa, while validation RMSE varies between 3.7 and 6.1 MPa. The optimal model, identified at (training RMSE ≈ 0.9 MPa, validation RMSE ≈ 3.7 MPa), achieves a balance between model complexity and generalization. In Fig. 9b, with the reduced feature set, training RMSE falls between 1.1 and 7.8 MPa, and validation RMSE spans 3.7 to 8.7 MPa. The best model, with training RMSE ≈ 1.7 MPa and validation RMSE ≈ 3.7 MPa, demonstrates improved generalization, likely due to reduced dimensionality and lower risk of overfitting. The dispersion of models with high training RMSE and widely varying validation RMSE highlights the sensitivity of performance to hyperparameter selection, emphasizing the importance of rigorous tuning to optimize predictive accuracy while mitigating overfitting.
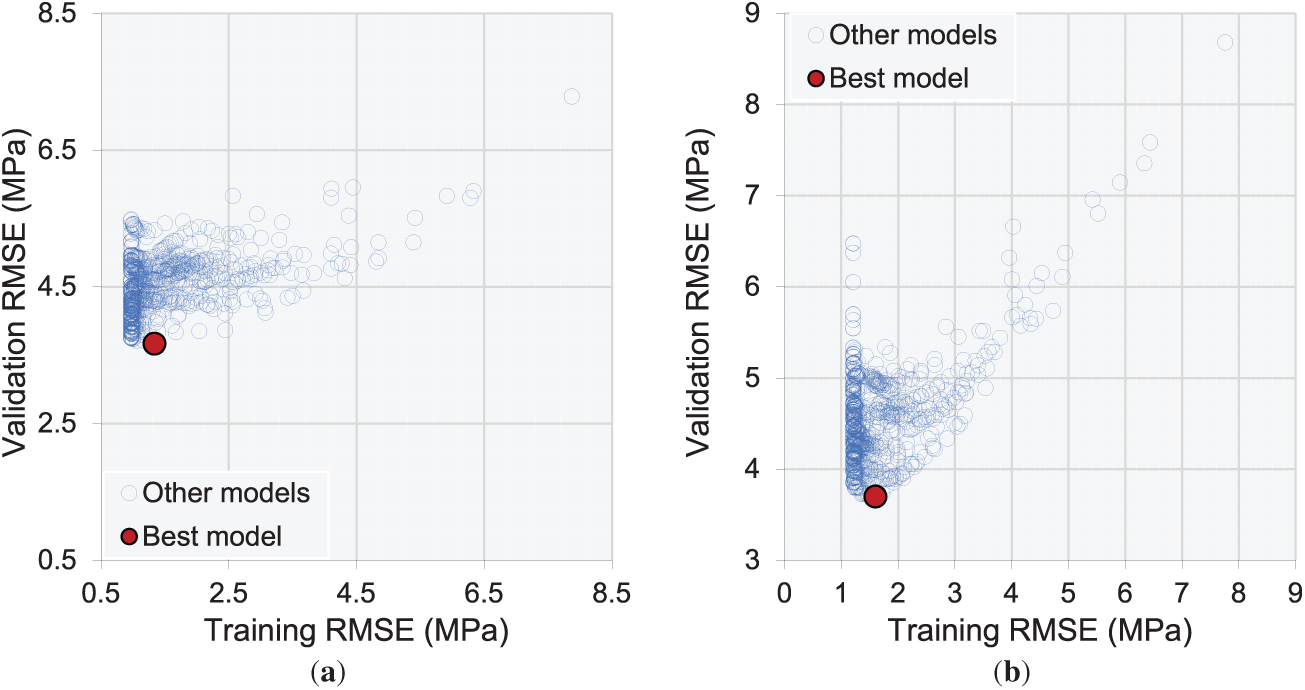
Figure 9: Training and validation loss trends observed during hyperparameter optimization: (a) utilizing the complete feature set and (b) employing the reduced feature set
Fig. 10 compares the predicted and actual CS values for the training and testing datasets. For the training set [Fig. 10a], the model shows an excellent fit (R2 = 0.9923, MAE = 0.861 MPa, RMSE = 1.408 MPa), with points closely following the equality line. For the testing set [Fig. 10b], performance remains strong (R2 = 0.937, MAE = 2.378 MPa, RMSE = 3.591 MPa), although the higher error indicates slight overfitting and reduced generalization to unseen data. Nonetheless, the close alignment between predicted and actual values confirms that the model maintains robust predictive capability, with the modest accuracy drop reflecting the normal balance between model complexity and generalization.
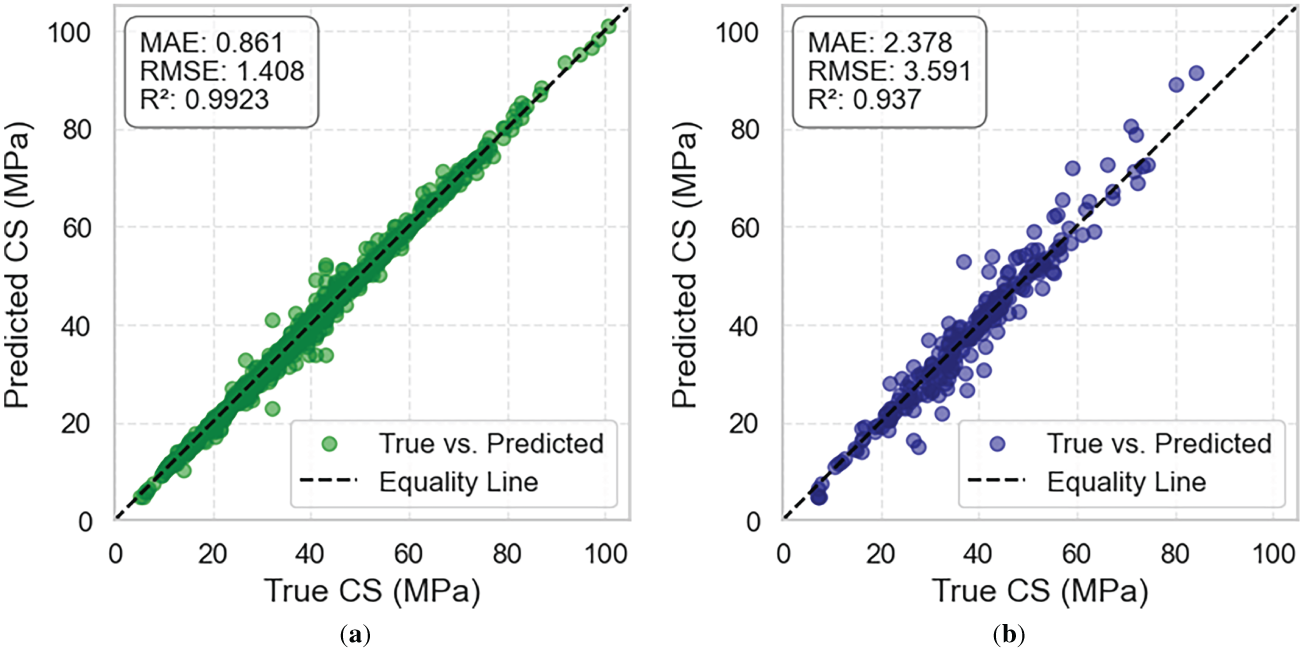
Figure 10: Comparison of predicted and actual values for: (a) the training dataset and (b) the testing dataset, using the model incorporating all variables
4.2 Performance of the Optimum Pruned Model
Fig. 11 presents the performance of the optimum Pruned model. In the training set [Fig. 11a], the predicted and measured CS values align closely, with R2 = 0.989, MAE = 0.929 MPa, and RMSE = 1.602 MPa, which confirms excellent learning behavior. In the testing set [Fig. 11b], the model maintains strong generalization (R2 = 0.936, MAE = 2.490 MPa, RMSE = 3.987 MPa), with only a modest drop in accuracy. This small gap between training and testing results indicates limited overfitting and demonstrates that the model can reliably predict unseen data. The inclusion of chemically informed features further contributed to stable performance by better representing the underlying material behavior.
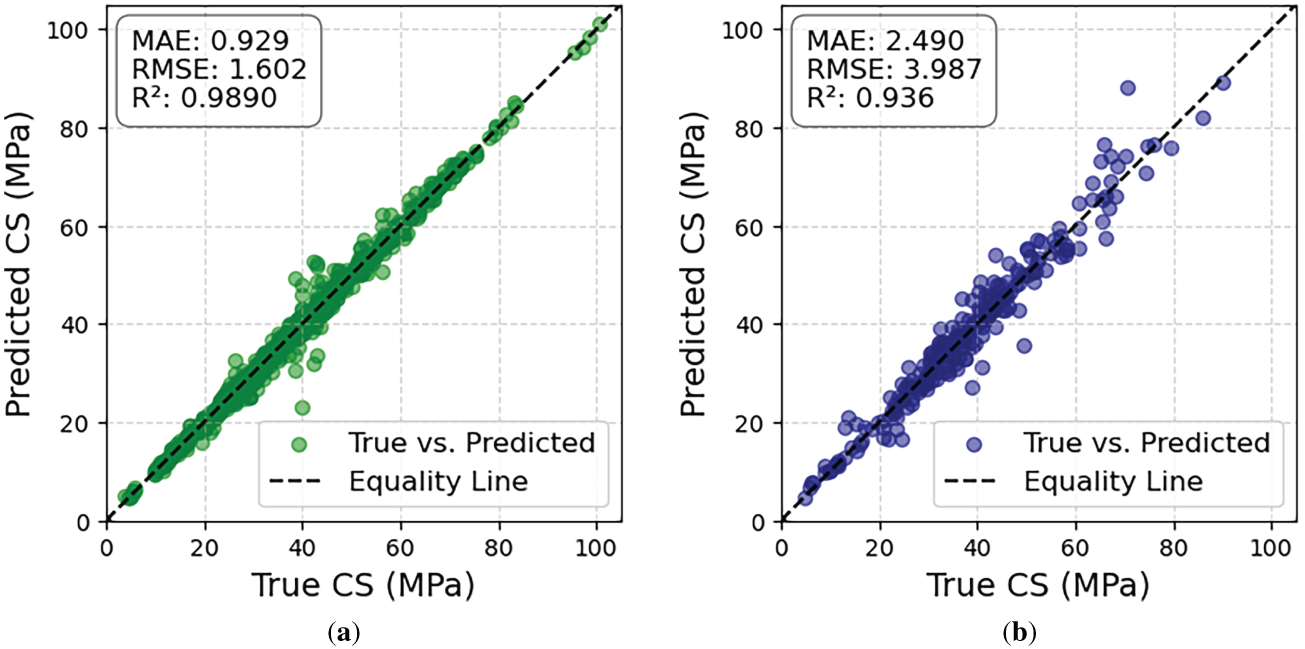
Figure 11: Predictions vs. true values for: (a) training and (b) testing datasets
4.3 Interpretation of the Optimum Pruned Model
4.3.1 Impact of Significant Features on the Model’s Output
Fig. 12 shows the impact of key features on the Pruned model’s outputs based on true SHAP values. Among all variables, AG exhibits the widest range of SHAP values, indicating a dominant influence on model predictions. Higher AG values are strongly associated with positive SHAP impacts, suggesting that increased AG significantly enhances the CS predicted by the model. This trend aligns with the well-established understanding that longer curing improves the hydration of cementitious materials, leading to denser microstructures and better mechanical performance [34,47–49]. WA and WB also exert substantial effects. For WB, higher values correspond to negative SHAP values, implying that an increased water-binder ratio reduces model outputs, likely reflecting a decrease in strength and durability due to higher porosity [50–52]. Conversely, lower WA values shift SHAP impacts positively, indicating that aggregates with lower water absorption contribute to better performance by minimizing internal water loss and shrinkage [53,54]. SP and PC show moderate but notable influences. Higher SP values are associated with positive SHAP effects, reflecting improved workability and reduced water demand. PC exhibits a more balanced SHAP distribution, suggesting that both excessive and insufficient cement contents can impact the output depending on the context of other mix design parameters. SA, NA, RA, and SM display narrower SHAP distributions, indicating relatively lower individual impacts. Notably, higher NA and RA values generally correspond to negative SHAP impacts, consistent with the notion that excessive replacement with RA can degrade mechanical properties if not carefully controlled [55,56]. It is noteworthy that AG was retained as a continuous variable between 1–91 days (Table 2) without transformation. This decision reflects the fundamental role of hydration kinetics in governing compressive strength evolution and enables the model to learn generalizable strength-age relationships across the full curing duration [57]. Despite AG’s expected dominance, SHAP analysis confirmed that other features (WB, WA, SP, and PC) retained meaningful and mechanistically consistent influence, which demonstrates that the model captured multi-parameter interactions rather than collapsing into single-feature dependence.
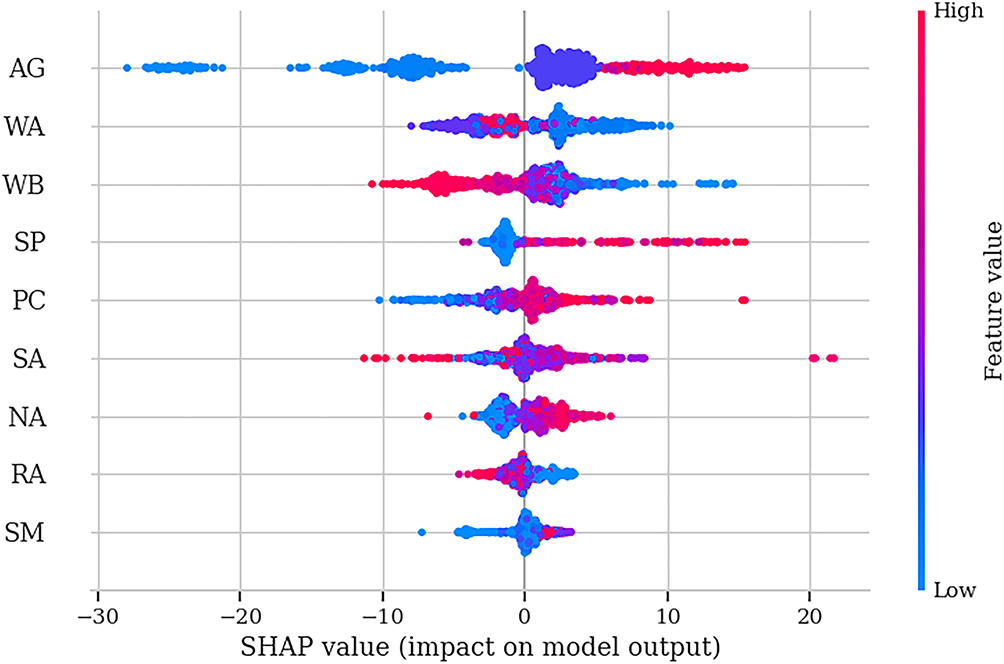
Figure 12: Influence of key features on the outputs of the Pruned model via true SHAP values
It is important to note that SHAP importance is derived from game-theoretic Shapley values [58], which quantify marginal contributions to predictions across all feature coalitions and are independent of feature frequency, occurrence count, or raw magnitude in physical units. In the present dataset (Table 2), SCMs [i.e., SF (mean 3.02 kg/m3) and BF (mean 9.38 kg/m3)] exhibit low absolute dosages and high dispersion relative to PC (mean 364.57 kg/m3), which results in genuinely weak global influence as reflected by their narrow SHAP ranges. Subsequent pruning of these low-impact features (Section 4.2) preserved model accuracy (testing R2 = 0.937), which confirms that their low SHAP importance represents true marginal influence rather than sampling or frequency artifacts. The stability of dominant features (AG, WB, WA) across folds and the alignment of SHAP directions with established physical mechanisms (e.g., increasing WB increases porosity and lowers CS) further validate the interpretability framework.
4.3.2 Partial Dependence Plots
Partial dependence plots (PDPs) offer an interpretable visualization of the marginal effect of individual features on an ML model’s predictions [59–61]. By averaging the predictions over the dataset while varying a single feature, PDPs reveal how the model’s output is influenced by changes in that specific feature, isolating its contribution from the interactions with other variables. In this study, PDPs are used to assess the effect of key input parameters on the predicted CS of RAC, as shown in Fig. 13. AG exhibits a strong positive and monotonic trend, with CS increasing sharply at early ages (up to 28 days) and continuing to rise at a slower rate thereafter. This behavior is consistent with the SHAP analysis depicted in Fig. 12. WB shows a clear negative trend, where higher values consistently reduce CS due to increased porosity and reduced matrix density [50–52]. PC demonstrates a nonlinear, threshold-based trend, remaining relatively stable at low contents but contributing positively beyond approximately 400 kg/m3, where additional binder enhances matrix cohesion. These observations align well with the findings of SHAP depicted in Fig. 12. SP displays a positive threshold effect, improving CS once dosage levels exceed about 4 kg/m3, where gains in workability and compaction become more pronounced. SA follows a non-monotonic trend, improving CS up to an optimal content (~800 kg/m3), beyond which excessive sand disrupts aggregate skeleton stability and reduces strength. This finding suggests that an optimal sand content improves particle packing and reduces voids, but excessive sand may disrupt the coarse aggregate skeleton, weakening the concrete [55,56]. WA exhibits a negative trend, where CS generally decreases as WA increases beyond 3%–4%. Aggregates with higher water absorption introduce more internal porosity and weaken the interfacial transition zone, leading to reduced strength [55,56]. NA shows a positive trend, with higher contents improving CS due to the superior mechanical properties of natural aggregates, whereas RA has a mildly negative trend, reflecting the detrimental effects of residual mortar and higher porosity. Increased RA content is associated with a modest decrease in strength, which is consistent with the understanding that RA often has attached mortar and greater porosity, reducing the quality of the concrete [50–52]. SM demonstrates no clear trend, indicating a negligible influence on CS within the tested range. These results collectively highlight that AG, water-related parameters (WB and WA), and aggregate composition exert the most pronounced effects.
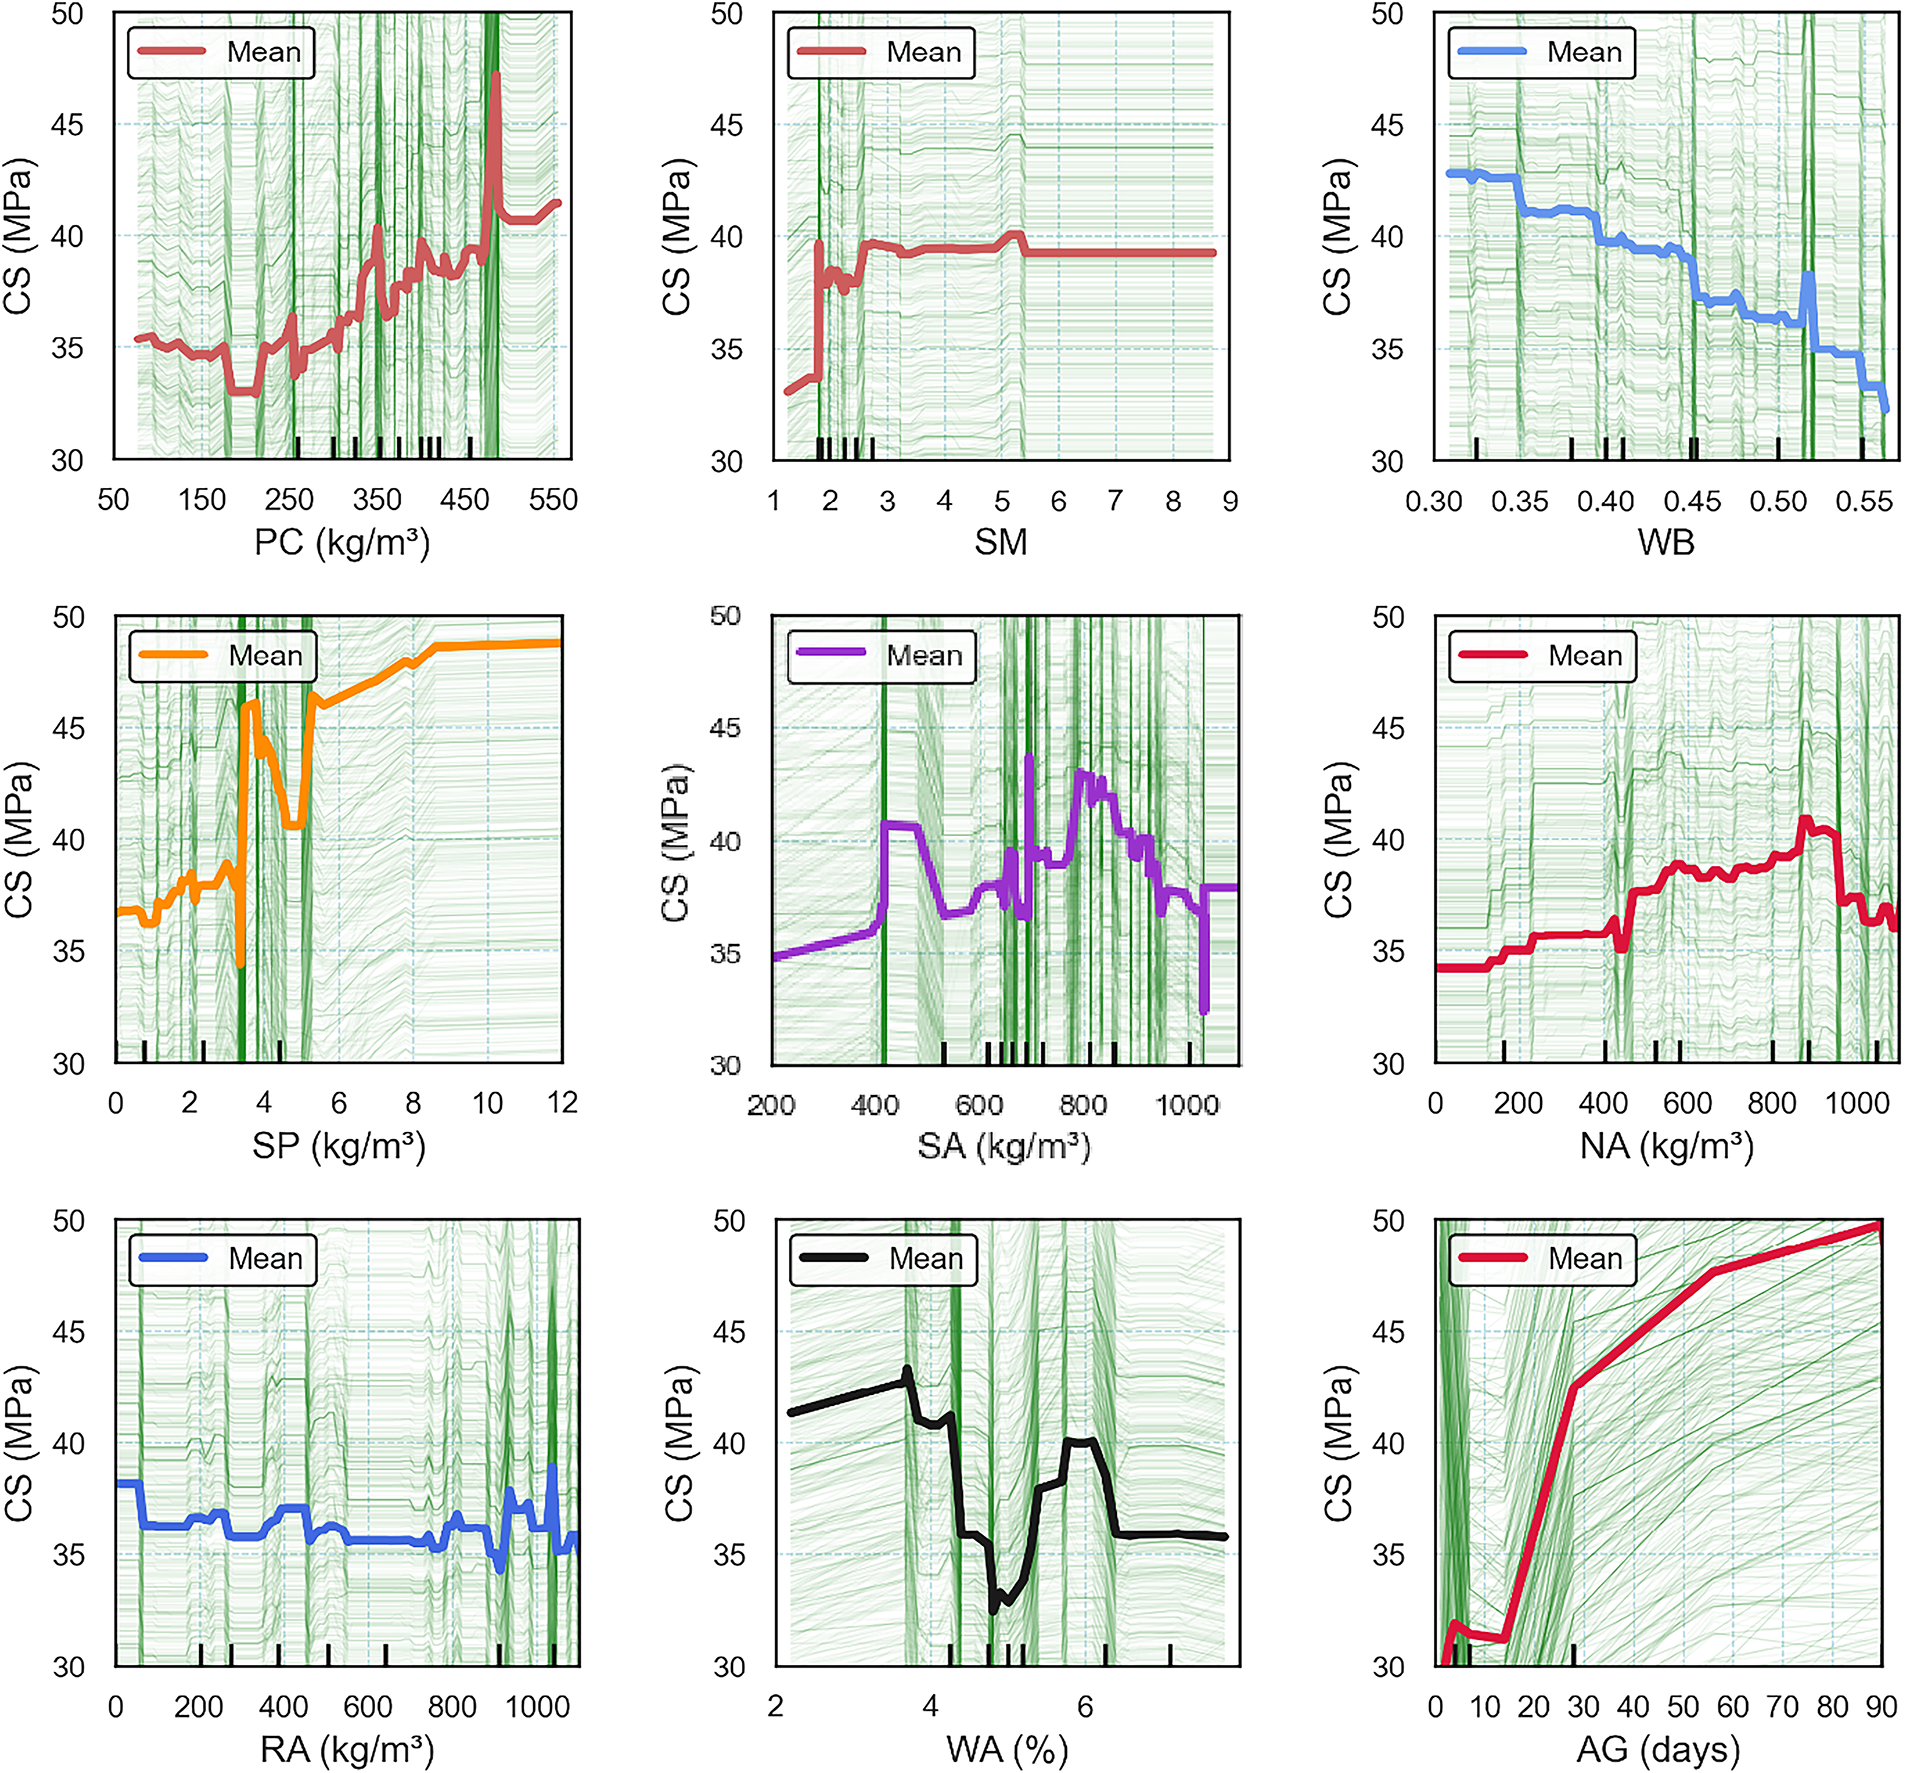
Figure 13: Partial dependence plots illustrating the impact of key features on the predicted CS
4.3.3 Recycled Aggregate Interactions
Fig. 14 presents iso-surface 3D plots illustrating the interaction effects between RA and various features on the predicted CS of RACs. These visualizations provide a deeper understanding of the combined influences of two variables simultaneously on the model output, beyond the marginal effects captured by PDPs. In Fig. 14a, the interaction between RA and PC is depicted. At low RA levels, increases in PC correlate with moderate gains in CS. However, as RA content rises, the beneficial effect of increasing PC diminishes, suggesting that a higher amount of PC cannot fully compensate for the detrimental effects of excessive RA, likely due to inherent porosity and weaker interfacial transition zones associated with recycled materials [60,62]. Fig. 14b shows the combined influence of RA and SM. Across the range of SM values, CS remains relatively stable at low RA content but declines as RA content increases. This indicates that while SM may slightly enhance durability or mitigate some deficiencies, it offers limited improvement to CS when RA content is high. The interaction between RA and SP [Fig. 14c] reveals a pronounced beneficial effect. At lower RA contents, increases in SP lead to modest improvements in CS; however, at higher RA levels, greater SP content significantly enhances CS [51,63]. This pattern suggests that adequate superplasticizer dosages are crucial for maintaining workability and achieving dense packing in mixes with high RA content, thus partially offsetting the negative effects of RA. Fig. 14d illustrates the interaction between RA and SA. A moderate SA appears to support higher CS across all RA levels, while either very low or very high SA leads to reductions in strength. In Fig. 14e, the combined effects of RA and WA are explored [56,62,63]. CS is generally higher when WA is low, regardless of RA content, emphasizing the detrimental role of aggregates with high water absorption [55,56]. At elevated RA contents, increased WA exacerbates strength loss, highlighting the sensitivity of RAC to the quality of the aggregate phase. Finally, Fig. 14f depicts the interaction between RA and NA. As expected, higher NA contents consistently lead to greater CS, and this positive effect is more pronounced at lower RA levels.
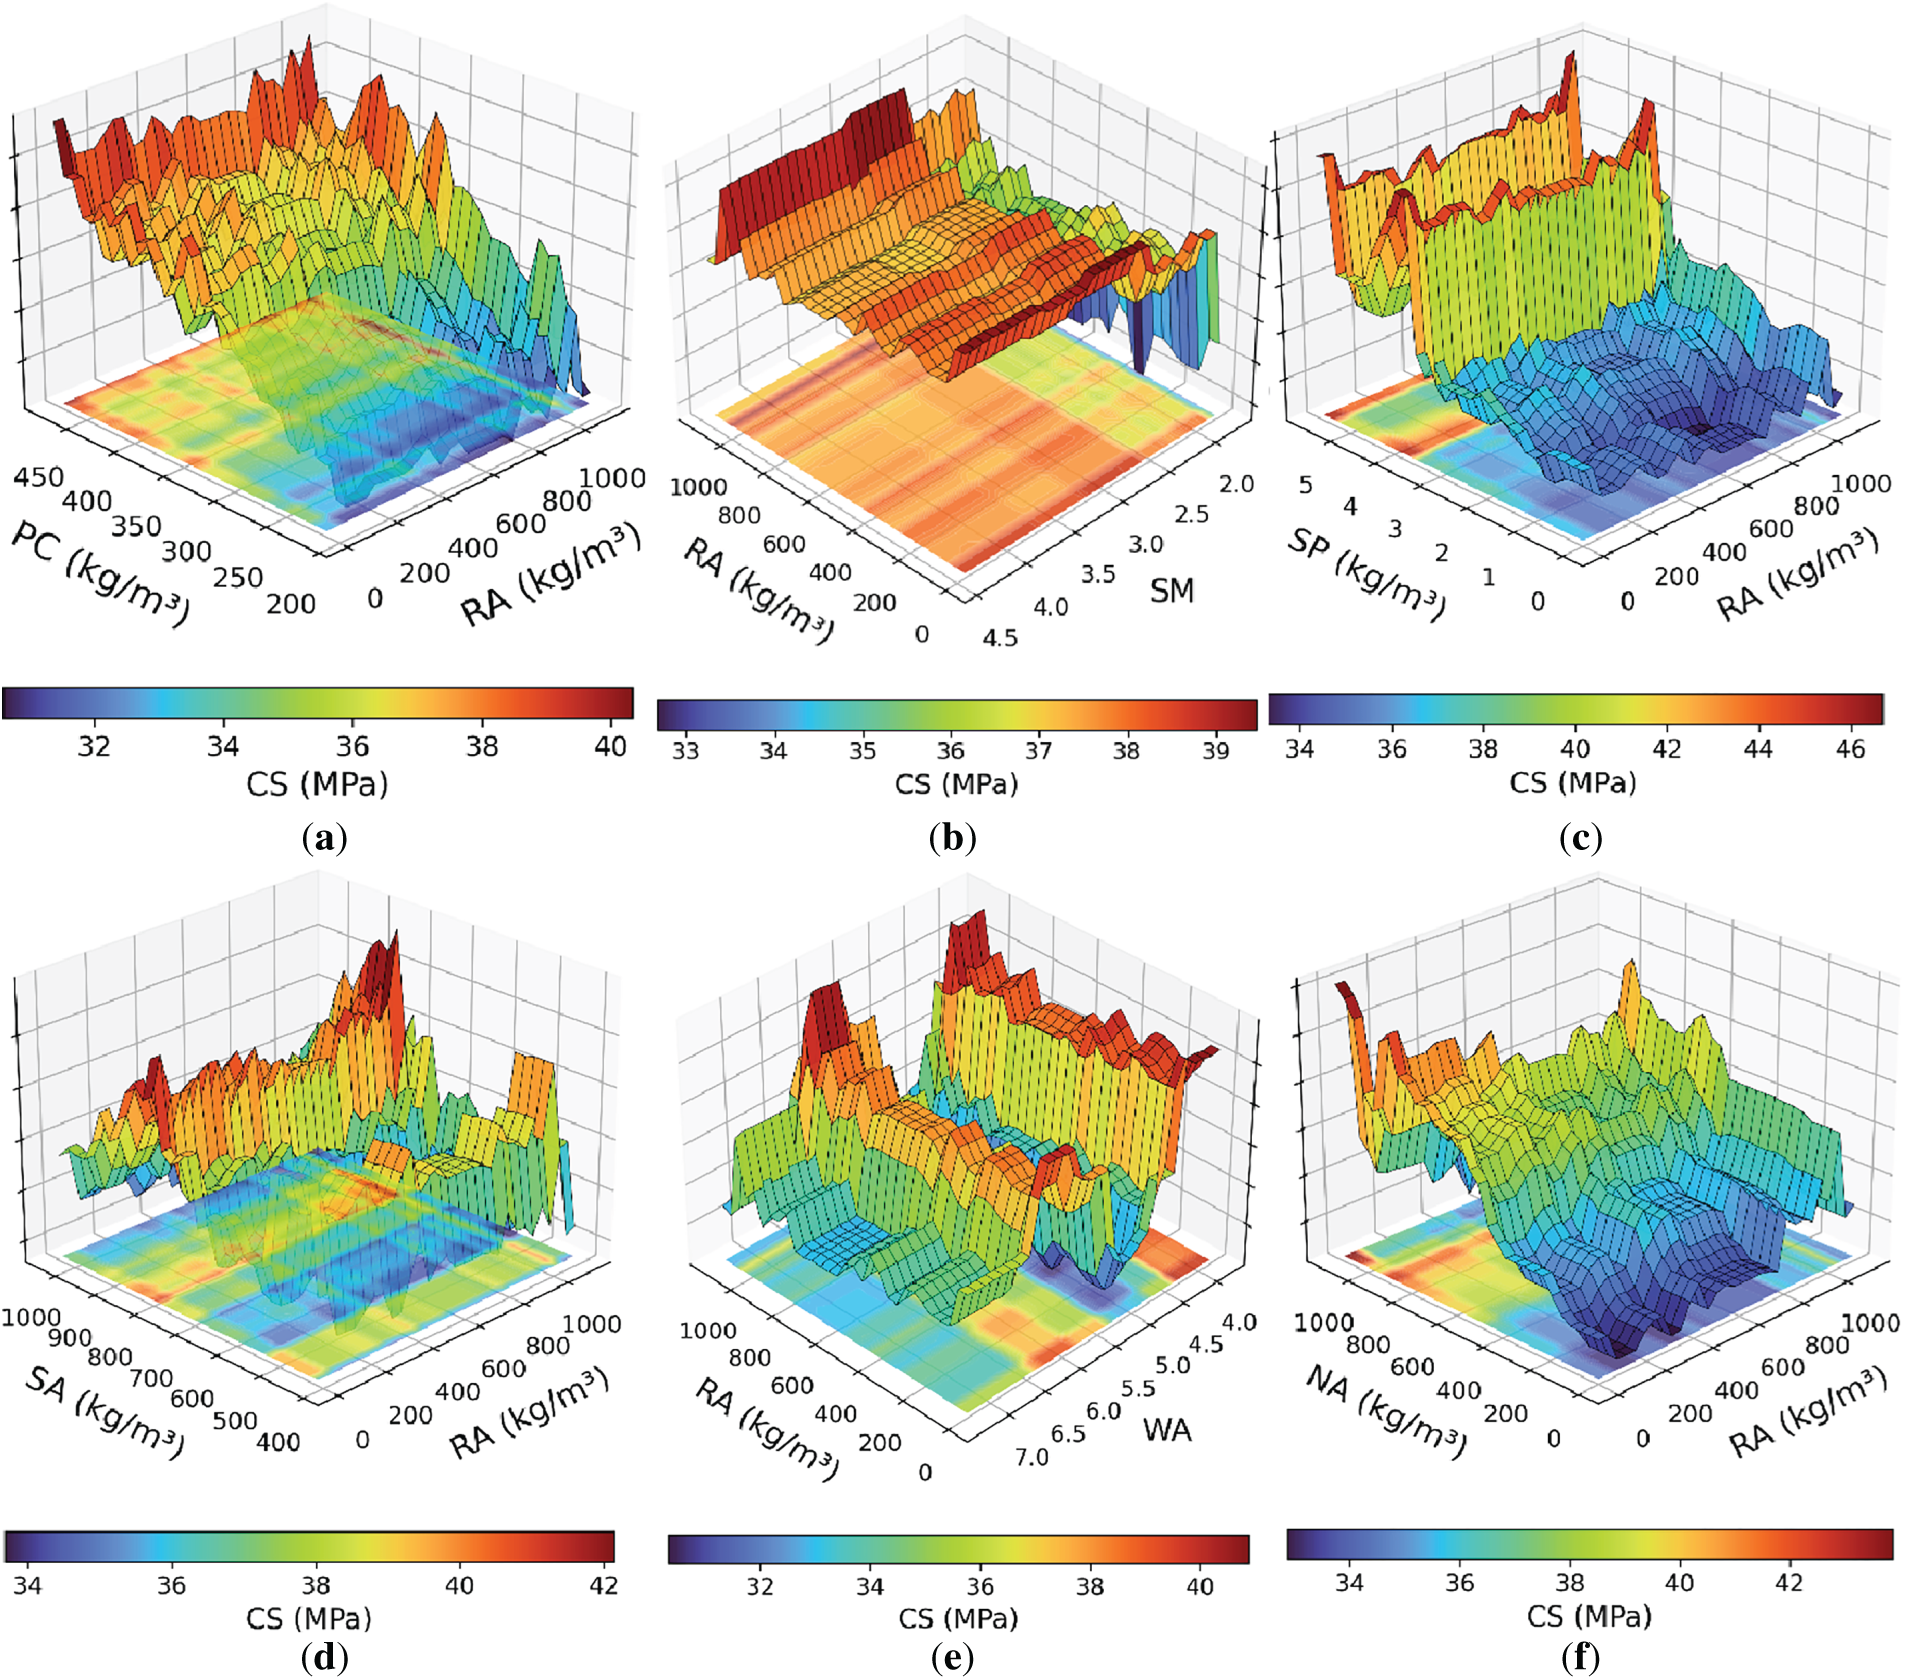
Figure 14: Influence of RA- (a) PC, (b) SM, (c) SP, (d) SA, (e) WA, and (f) NA interactions
This investigation established a robust predictive framework for the CS of RAC using a comprehensive dataset of 1243 mixtures incorporating various SCMs. The hybrid machine learning approach, integrating engineering knowledge with advanced statistical techniques, yielded several key insights:
(1) Among all algorithms, XGBoost achieved the best predictive accuracy (R2 = 0.947, MAE = 0.598, RMSE = 1.193) with superior computational efficiency, outperforming Extra Trees, LightGBM, and all conventional regressors. SHAP analysis revealed AG as the dominant predictor of CS (mean absolute SHAP ≈ 7.25), followed by WA (≈3.2) and WB (≈2.92). Pruning low-impact features (AM, RM, FA, SF, BF) retained ~80% of total importance while preserving accuracy to enhance model interpretability without significant loss of predictive performance.
(2) PDPs confirmed AG as the strongest positive driver of CS, with rapid early gains. Higher WB and WA reduced CS by increasing porosity, while SP and PC enhanced strength beyond thresholds (~4 kg/m3 SP, ~400 kg/m3 PC). Optimal SA (~800 kg/m3) maximized strength; excessive RA slightly lowered CS, whereas NA improved it.
Despite the strong predictive performance of the developed model, certain limitations remain. The low representation of certain SCMs (e.g., SF and BF) and broad variability in AG and RA absorption introduce uncertainty in isolated effect estimation. Future work should expand data coverage to balance SCM representation and explore symbolic regression or hybrid models for closed-form predictive equations. Field-scale validation and long-term durability testing are further recommended to confirm the model’s robustness and practical applicability.
Acknowledgement: The authors would like to thank Ongoing Research Funding Program, (ORFT-2025-025-6), King Saud University, Riyadh, Saudi Arabia for financial support.
Funding Statement: This work was supported by the Ongoing Research Funding Program (Grant No. ORFT-2025-025-6) at King Saud University, Riyadh, Saudi Arabia. The grant was awarded to Yassir M. Abbas. The sponsor’s website is available at https://ksu.edu.sa/en (accessed on 11 November 2025).
Author Contributions: The authors confirm contribution to the paper as follows: Conceptualization, Yassir M. Abbas; methodology, Yassir M. Abbas & Ammar Babiker; software, Yassir M. Abbas & Ammar Babiker; formal analysis, Yassir M. Abbas & Ammar Babiker; investigation, Yassir M. Abbas, Ammar Babiker, & Fouad Ismail Ismail; resources, Yassir M. Abbas; data curation, Ammar Babiker; writing—original draft preparation, Ammar Babiker, & Fouad Ismail Ismail; writing—review and editing, Yassir M. Abbas & Ammar Babiker; visualization, Yassir M. Abbas, Ammar Babiker, & Fouad Ismail Ismail; funding acquisition, Yassir M. Abbas. All authors reviewed the results and approved the final version of the manuscript.
Availability of Data and Materials: The data that support the findings of this study are available on request from the corresponding author, Yassir M. Abbas. The data are not publicly available due to their inclusion in an ongoing collaborative project containing pending intellectual property evaluations that restrict immediate open access.
Ethics Approval: Not applicable.
Conflicts of Interest: The authors declare no conflicts of interest to report regarding the present study.
Nomenclature
| ML | Machine Learning |
| ANN | Artificial Neural Network |
| KNN | K-Nearest Neighbors |
| GPR | Gaussian Process Regression |
| RF | Random Forest |
| AdaBoost | Adaptive Boosting |
| GBoost | Gradient Boosting |
| XGBoost | Extreme Gradient Boosting |
| CatBoos | Categorial Boosting |
| LGBoost | Light Gradient Boosting |
| SVM | Support Vector Machine |
| RBFNN | Radial Basis Function Neural Network |
| SVR | Support Vector Machine |
| DT | Decision Tree |
| RT | Random Tree |
| BP | Backpropagation |
| GBDT | Gradient Boosting Decision Tree |
| BPNN | Backpropagation Neural Network |
| MLP | MultiLayer Perceptron |
| SSA | Sparrow Search Algorithm |
| BO-TPE | Bayesian Optimization with a Tree-structured Parzen Estimator |
| GPR | Gaussian Process Regression |
| CART | Classification and Regression Tree |
| PDP | Partial Dependence Plot |
| RMSE | Root Mean Squared Error |
| MSE | Mean Squared Error |
| MAE | Mean Absolute Error |
| RAC | Recycled Aggregate Concrete |
| RA | Recycled coarse aggregate |
| RR | Recycled aggregate percentage ratio |
| PC | Portland cement content |
| SF | Silica fume content |
| FA | Fly ash content |
| BF | Blast furnace slag |
| SP | Superplasticizer |
| NA | Natural coarse aggregate content |
| WA | RA water absorption |
| AG | Age of curing |
| W/B | Water-to-binder ratio |
| W/C | Water-to-cements ratio |
| W | Water content |
| CS | Compressive strength |
| CT | Cement type |
| MPSRA | Maximum particle size of recycled aggregate |
| MPSNA | Maximum particle size of natural aggregate |
| ADNA | Apparent density of natural aggregate |
| ADRA | Apparent density of recycled aggregate |
| FMRA | Fineness modulus of recycled aggregate |
| SGC | Strength grade of cement |
| ACR | Aggregate-to-cement ratio |
| NSRA | Nominal size of recycled aggregate |
| SP/C | Superplasticizer-to-cement ratio |
| FA/C | Fly ash-to-cement ratio |
| SCM | Supplementary cementitious materials |
References
1. Manzi S, Mazzotti C, Bignozzi MC. Short and long-term behavior of structural concrete with recycled concrete aggregate. Cem Concr Compos. 2013;37(5):312–18. doi:10.1016/J.CEMCONCOMP.2013.01.003. [Google Scholar] [CrossRef]
2. Nedeljković M, Visser J, Šavija B, Valcke S, Schlangen E. Use of fine recycled concrete aggregates in concrete: a critical review. J Build Eng. 2021;38(1):102196. doi:10.1016/j.jobe.2021.102196. [Google Scholar] [CrossRef]
3. Thomas J, Thaickavil NN, Wilson PM. Strength and durability of concrete containing recycled concrete aggregates. J Build Eng. 2018;19(5):349–65. doi:10.1016/J.JOBE.2018.05.007. [Google Scholar] [CrossRef]
4. Dabiri H, Sharbatdar MK, Kavyani A, Baghdadi M. The influence of replacing sand with waste glass particle on the physical and mechanical parameters of concrete. Civil Eng J. 2018;4(7):1646–52. doi:10.28991/CEJ-03091101. [Google Scholar] [CrossRef]
5. Gravina RJ, Xie T, Giustozzi F, Zhao X, Visintin P. Assessment of the variability and uncertainty of using post-customer plastics as natural aggregate replacement in concrete. Constr Build Mater. 2021;273(7):121747. doi:10.1016/J.CONBUILDMAT.2020.121747. [Google Scholar] [CrossRef]
6. Xiao R, Jiang X, Wang Y, He Q, Huang B. Experimental and thermodynamic study of alkali-activated waste glass and calcium sulfoaluminate cement blends: shrinkage, efflorescence potential, and phase assemblages. J Mater Civ Eng. 2021;33:04021312. doi:10.1061/(ASCE)MT.1943-5533.0003941. [Google Scholar] [CrossRef]
7. Kaish ABMA, Odimegwu TC, Zakaria I, Abood MM. Effects of different industrial waste materials as partial replacement of fine aggregate on strength and microstructure properties of concrete. J Build Eng. 2021;35(1):102092. doi:10.1016/J.JOBE.2020.102092. [Google Scholar] [CrossRef]
8. Kou YW. Preliminary study on main mechanical properties and bond-slip performance of self-compacting concrete with recycle aggregates from precast rejects [master thesis]. Guangzhou, China: South China University of Technology; 2020. [Google Scholar]
9. Soares D, Brito JDe, Ferreira J, Pacheco J. Use of coarse recycled aggregates from precast concrete rejects: mechanical and durability performance. Constr Build Mater. 2014;71(2):263–72. doi:10.1016/J.CONBUILDMAT.2014.08.034. [Google Scholar] [CrossRef]
10. Pedro D, de Brito J, Evangelista L. Mechanical characterization of high performance concrete prepared with recycled aggregates and silica fume from precast industry. J Clean Prod. 2017;164(4–5):939–49. doi:10.1016/J.JCLEPRO.2017.06.249. [Google Scholar] [CrossRef]
11. Kim K, Shin M, Cha S. Combined effects of recycled aggregate and fly ash towards concrete sustainability. Constr Build Mater. 2013;48(4):499–507. doi:10.1016/J.CONBUILDMAT.2013.07.014. [Google Scholar] [CrossRef]
12. Andreu G, Miren E. Experimental analysis of properties of high performance recycled aggregate concrete. Constr Build Mater. 2014;52(8):227–35. doi:10.1016/J.CONBUILDMAT.2013.11.054. [Google Scholar] [CrossRef]
13. Zega CJ, Di Maio ÁA, Zerbino RL. Influence of natural coarse aggregate type on the transport properties of recycled concrete. J Mater Civ Eng. 2013;26(6):04014006. doi:10.1061/(ASCE)MT.1943-5533.0000910. [Google Scholar] [CrossRef]
14. Yu Y, Fang GH, Kurda R, Sabuj AR, Zhao XY. An agile, intelligent and scalable framework for mix design optimization of green concrete incorporating recycled aggregates from precast rejects. Case Stud Constr Mater. 2024;20(9):e03156. doi:10.1016/J.CSCM.2024.E03156. [Google Scholar] [CrossRef]
15. Pandey S, Paudel S, Devkota K, Kshetri K, Asteris PG. Machine learning unveils the complex nonlinearity of concrete materials’ uniaxial compressive strength. Int J Constr Manag. 2025;25(6):635–49. doi:10.1080/15623599.2024.2345008. [Google Scholar] [CrossRef]
16. Ahmad A, Chaiyasarn K, Farooq F, Ahmad W, Suparp S, Aslam F. Compressive strength prediction via gene expression programming (GEP) and artificial neural network (ANN) for concrete containing RCA. Buildings. 2021;11(8):324. doi:10.3390/buildings11080324. [Google Scholar] [CrossRef]
17. Jaglan A, Singh RR. Recycled aggregate concrete incorporating GGBS and polypropylene fibers using RSM and machine learning techniques. Buildings. 2024;15(1):66. doi:10.3390/buildings15010066. [Google Scholar] [CrossRef]
18. Tipu RK, Batra V, Suman, Pandya KS, Panchal VR. Efficient compressive strength prediction of concrete incorporating recycled coarse aggregate using Newton’s boosted backpropagation neural network (NB-BPNN). Structures. 2023;58(2):105559. doi:10.1016/j.istruc.2023.105559. [Google Scholar] [CrossRef]
19. Peng Y, Unluer C. Modeling the mechanical properties of recycled aggregate concrete using hybrid machine learning algorithms. Resour Conserv Recycl. 2023;190(10):106812. doi:10.1016/J.RESCONREC.2022.106812. [Google Scholar] [CrossRef]
20. Golafshani E, Khodadadi N, Ngo T, Nanni A, Behnood A. Modelling the compressive strength of geopolymer recycled aggregate concrete using ensemble machine learning. Adv Eng Softw. 2024;191:103611. doi:10.1016/J.ADVENGSOFT.2024.103611. [Google Scholar] [CrossRef]
21. Yang S, Sun J, Zhifeng X. Prediction on compressive strength of recycled aggregate self-compacting concrete by machine learning method. J Build Eng. 2024;88(10):109055. doi:10.1016/J.JOBE.2024.109055. [Google Scholar] [CrossRef]
22. Hosseini Sarcheshmeh A, Etemadfard H, Najmoddin A, Ghalehnovi M. Hyperparameters’ role in machine learning algorithm for modeling of compressive strength of recycled aggregate concrete. Innov Infrastruct Solut. 2024;9:1–29. doi:10.1007/S41062-024-01471-Z/FIGURES/28. [Google Scholar] [CrossRef]
23. Yu Y, Wu W, Yan J, Zang J. Probabilistic models for shear strength of circular and square concrete-filled steel tubes. AIP Adv. 2025;15(2):1681. doi:10.1063/5.0250829. [Google Scholar] [CrossRef]
24. Das P, Kashem A, Rahat JU, Karim R. A comparative study of ensemble machine learning models for compressive strength prediction in recycled aggregate concrete and parametric analysis. Multis Multidiscip Model Experi Des. 2024;7:3457–82. doi:10.1007/S41939-024-00409-3/METRICS. [Google Scholar] [CrossRef]
25. Yu Y, Al-Damad IMA, Foster S, Nezhad AA, Hajimohammadi A. Compressive strength prediction of fly ash/slag-based geopolymer concrete using EBA-optimised chemistry-informed interpretable deep learning model. Develop Built Environ. 2025;23(1):100736. doi:10.1016/j.dibe.2025.100736. [Google Scholar] [CrossRef]
26. Yu Y, Jayathilakage R, Liu Y, Hajimohammadi A. Intelligent compressive strength prediction of sustainable rubberised concrete using an optimised interpretable deep CNN-LSTM model with attention mechanism. Appl Soft Comput. 2025;185:113993. doi:10.1016/j.asoc.2025.113993. [Google Scholar] [CrossRef]
27. Dabiri H, Kioumarsi M, Kheyroddin A, Kandiri A, Sartipi F. Compressive strength of concrete with recycled aggregate; a machine learning-based evaluation. Clean Mater. 2022;3(1):100044. doi:10.1016/J.CLEMA.2022.100044. [Google Scholar] [CrossRef]
28. Duan J, Asteris PG, Nguyen H, Bui XN, Moayedi H. A novel artificial intelligence technique to predict compressive strength of recycled aggregate concrete using ICA-XGBoost model. Eng Comput. 2021;37:3329–46. doi:10.1007/S00366-020-01003-0/METRICS. [Google Scholar] [CrossRef]
29. Pazouki G, Pourghorban A. Using a hybrid artificial intelligence method for estimating the compressive strength of recycled aggregate self-compacting concrete. Eur J Environ Civil Eng. 2022;26(12):5569–93. doi:10.1080/19648189.2021.1908915. [Google Scholar] [CrossRef]
30. Pal A, Ahmed KS, Hossain FZ, Alam MS. Machine learning models for predicting compressive strength of fiber-reinforced concrete containing waste rubber and recycled aggregate. J Clean Prod. 2023;423(6):138673. doi:10.1016/J.JCLEPRO.2023.138673. [Google Scholar] [CrossRef]
31. Khan K, Ahmad W, Amin MN, Aslam F, Ahmad A, Al-Faiad MA. Comparison of prediction models based on machine learning for the compressive strength estimation of recycled aggregate concrete. Materials. 2022;15(10):3430. doi:10.3390/MA15103430. [Google Scholar] [PubMed] [CrossRef]
32. Hosseinzadeh M, Dehestani M, Hosseinzadeh A. Prediction of mechanical properties of recycled aggregate fly ash concrete employing machine learning algorithms. J Build Eng. 2023;76(7):107006. doi:10.1016/J.JOBE.2023.107006. [Google Scholar] [CrossRef]
33. Huang P, Dai K, Yu X. Machine learning approach for investigating compressive strength of self-compacting concrete containing supplementary cementitious materials and recycled aggregate. J Build Eng. 2023;79(10):107904. doi:10.1016/J.JOBE.2023.107904. [Google Scholar] [CrossRef]
34. Miao X, Zhu JX, Zhu WB, Wang Y, Peng L, Le Dong H, et al. Intelligent prediction of comprehensive mechanical properties of recycled aggregate concrete with supplementary cementitious materials using hybrid machine learning algorithms. Case Stud Construct Mat. 2024;21:e03708. doi:10.1016/J.CSCM.2024.E03708. [Google Scholar] [CrossRef]
35. Liu K, Zheng J, Dong S, Xie W, Zhang X. Mixture optimization of mechanical, economical, and environmental objectives for sustainable recycled aggregate concrete based on machine learning and metaheuristic algorithms. J Build Eng. 2023;63(9):105570. doi:10.1016/j.jobe.2022.105570. [Google Scholar] [CrossRef]
36. Wang Q, Zhao Y, Sun L, Zheng H, Liang X. Exploring economic and environmental impacts of recycled aggregate concrete using particle swarm optimization algorithm. J Clean Prod. 2024;475(11):143713. doi:10.1016/j.jclepro.2024.143713. [Google Scholar] [CrossRef]
37. Siddique R, Aggarwal P, Aggarwal Y. Prediction of compressive strength of self-compacting concrete containing bottom ash using artificial neural networks. Adv Eng Softw. 2011;42(10):780–6. doi:10.1016/j.advengsoft.2011.05.016. [Google Scholar] [CrossRef]
38. Abellan-Garcia J, Fernández-Gómez J, Iqbal Khan M, Abbas YM, Pacheco-Bustos C. ANN approach to evaluate the effects of supplementary cementitious materials on the compressive strength of recycled aggregate concrete. Constr Build Mater. 2023;402(1):132992. doi:10.1016/j.conbuildmat.2023.132992. [Google Scholar] [CrossRef]
39. Liu X, Wang X, Zhang T, Zhu P, Liu H. Effects of manufactured sand and steam-curing temperature on the compressive strength of recycled concrete with different water/binder ratios. Materials. 2023;16(24):7635. doi:10.3390/ma16247635. [Google Scholar] [PubMed] [CrossRef]
40. Peng GF, Wang S, Li T. Mechanical properties of recycled aggregate concrete at high and low water to binder ratios. Key Eng Mater. 2014;629-630:321–9. doi:10.4028/www.scientific.net/KEM.629-630.321. [Google Scholar] [CrossRef]
41. Riani M, Atkinson AC. Robust diagnostic data analysis: transformations in regression. Technometrics. 2000;42(4):384–94. doi:10.1080/00401706.2000.10485711. [Google Scholar] [CrossRef]
42. Emenike IC. Outlier detection in a repeated measure design. Qual Reliab Eng Int. 2023;39(6):2582–93. doi:10.1002/qre.3364. [Google Scholar] [CrossRef]
43. Peña D. Detecting outliers and influential and sensitive observations in linear regression. In: Springer handbooks. Berlin/Heidelberg, Germany: Springer; 2023. doi:10.1007/978-1-4471-7503-2_31. [Google Scholar] [CrossRef]
44. Lartey C, Liu J, Asamoah RK, Greet C, Zanin M, Skinner W. Effective outlier detection for ensuring data quality in flotation data modelling using machine learning (ML) algorithms. Minerals. 2024;14(9):925. doi:10.3390/min14090925. [Google Scholar] [CrossRef]
45. Liu BH, Zhang LW, Wei YQ, Chen C. Dual power transformation and yeo–johnson techniques for static and dynamic reliability assessments. Buildings. 2024;14(11):3625. doi:10.3390/BUILDINGS14113625. [Google Scholar] [CrossRef]
46. Van Rossum G. Python reference manual. Amsterdam, The Netherlands: CWI; 1995. [Google Scholar]
47. Yang G, Li Q, Guo Y, Liu H, Zheng S, Chen M. Study on the mechanical properties and durability of recycled aggregate concrete under the internal curing condition. Materials. 2022;15(17):5914. doi:10.3390/MA15175914. [Google Scholar] [PubMed] [CrossRef]
48. Kou SC, Poon CS, Etxeberria M. Influence of recycled aggregates on long term mechanical properties and pore size distribution of concrete. Cem Concr Compos. 2011;33(2):286–91. doi:10.1016/J.CEMCONCOMP.2010.10.003. [Google Scholar] [CrossRef]
49. Zhu P, Hao Y, Liu H, Wang X, Gu L. Durability evaluation of recycled aggregate concrete in a complex environment. J Clean Prod. 2020;273(2):122569. doi:10.1016/J.JCLEPRO.2020.122569. [Google Scholar] [CrossRef]
50. Meng T, Wei H, Yang X, Zhang B, Zhang Y, Zhang C. Effect of mixed recycled aggregate on the mechanical strength and microstructure of concrete under different water cement ratios. Materials. 2021;14(10):2631. doi:10.3390/MA14102631. [Google Scholar] [PubMed] [CrossRef]
51. Peng GF, Huang YZ, Wang HS, Zhang JF, Liu QB. Mechanical properties of recycled aggregate concrete at low and high water/binder ratios. Adv Mater Sci Eng. 2013;2013:842929. doi:10.1155/2013/842929. [Google Scholar] [CrossRef]
52. Peng GF, Liu QB, Guo ZB, Hou QX, Cao SQ, Zhang JF. Mechanical properties and permeability of recycled aggregate concrete at low water/binder ratio. Key Eng Mater. 2011;477:16–22. doi:10.4028/WWW.SCIENTIFIC.NET/KEM.477.16. [Google Scholar] [CrossRef]
53. Liu W, Zhang H, Chen Z, Tao J, Zhang X, Zhao B. Performance of pervious concrete influenced by typical properties of recycled concrete aggregate and suggestions for practical use. Road Mater Pavement Des. 2024;25(5):1090–111. doi:10.1080/14680629.2023.2238082. [Google Scholar] [CrossRef]
54. Cho SW, Cho SE, Brand AS. A meta-analysis of the effect of moisture content of recycled concrete aggregate on the compressive strength of concrete. Appl Sci. 2024;14:3512. doi:10.3390/APP14083512/S1. [Google Scholar] [CrossRef]
55. Pereiro-Barceló J, Lenz E, Torres B, Estevan L. Mechanical properties of recycled aggregate concrete reinforced with conventional and recycled steel fibers and exposed to high temperatures. Constr Build Mater. 2024;452:138976. doi:10.1016/J.CONBUILDMAT.2024.138976. [Google Scholar] [CrossRef]
56. Jiang Y, Tam VWY, Jiang C, Le KN. A review on mechanical properties and durability of recycled coarse aggregate concrete exposed to elevated temperatures. Renew Sustain Energ Rev. 2025;217(56):115730. doi:10.1016/J.RSER.2025.115730. [Google Scholar] [CrossRef]
57. Mehta PK, Monteiro PJM. Concrete microstructure, properties and materials; 2017. [Google Scholar]
58. Lundberg SM, Allen PG, Lee S-I. A unified approach to interpreting model predictions. Adv Neural Inf Process Syst. 2017;30:1–10. [Google Scholar]
59. Babiker A, Abbas YM, Khan MI, Ismail FI. From robust deep-learning regression to refined design formulas for punching shear strength of internal GFRP-reinforced flat slab-column connections. Eng Struct. 2025;326:119534. doi:10.1016/j.engstruct.2024.119534. [Google Scholar] [CrossRef]
60. Babiker A, Abbas YM, Khan MI, Abdel-Magid T. Optimizing compressive strength of quaternary-blended cement concrete through ensemble-instance-based machine learning. Mater Today Commun. 2024;39:109150. doi:10.1016/j.mtcomm.2024.109150. [Google Scholar] [CrossRef]
61. Babiker A, Abbas YM, Khan MI, Khatib JM. Improving predictive accuracy for punching shear strength in fiber-reinforced polymer concrete slab-column connections via robust deep learning. Structures. 2024;70:107797. doi:10.1016/j.istruc.2024.107797. [Google Scholar] [CrossRef]
62. Ahmad Bhat J. Effect of strength of parent concrete on the mechanical properties of recycled aggregate concrete. Mater Today Proc. 2021;42:1462–9. doi:10.1016/J.MATPR.2021.01.310. [Google Scholar] [CrossRef]
63. Zheng Y, Zhang Y, Zhang P. Methods for improving the durability of recycled aggregate concrete: a review. J Mater Res Technol. 2021;15:6367–86. doi:10.1016/J.JMRT.2021.11.085. [Google Scholar] [CrossRef]
64. Kou S, Poon C, Agrela F. Comparisons of natural and recycled aggregate concretes prepared with the addition of different mineral admixtures. Cem Concr Compos. 2011;33(8):788–95. doi:10.1016/j.cemconcomp.2011.05.009. [Google Scholar] [CrossRef]
65. Babalola OE, Awoyera PO, Tran MT, Le DH, Olalusi OB, Viloria A, et al. Mechanical and durability properties of recycled aggregate concrete with ternary binder system and optimized mix proportion. J Mater Res Technol. 2020;9(3):6521–32. doi:10.1016/J.JMRT.2020.04.038. [Google Scholar] [CrossRef]
66. Ma Z, Liu M, Tang Q, Liang C, Duan Z. Chloride permeability of recycled aggregate concrete under the coupling effect of freezing-thawing, elevated temperature or mechanical damage. Constr Build Mater. 2020;237(10):117648. doi:10.1016/J.CONBUILDMAT.2019.117648. [Google Scholar] [CrossRef]
67. Sasanipour H, Aslani F, Taherinezhad J. Chloride ion permeability improvement of recycled aggregate concrete using pretreated recycled aggregates by silica fume slurry. Constr Build Mater. 2021;270(5):121498. doi:10.1016/J.CONBUILDMAT.2020.121498. [Google Scholar] [CrossRef]
68. Dimitriou G, Savva P, Petrou MF. Enhancing mechanical and durability properties of recycled aggregate concrete. Constr Build Mater. 2018;158:228–35. doi:10.1016/j.conbuildmat.2017.09.137. [Google Scholar] [CrossRef]
69. Shan H, Yu Z. Strength, chloride ion penetration, and nanoscale characteristics of concrete prepared with nano-silica slurry pre-coated recycled aggregate. Buildings. 2022;12(10):1707. doi:10.3390/BUILDINGS12101707. [Google Scholar] [CrossRef]
70. Zong L, Fei Z, Zhang S. Permeability of recycled aggregate concrete containing fly ash and clay brick waste. J Clean Prod. 2014;70(2):175–82. doi:10.1016/J.JCLEPRO.2014.02.040. [Google Scholar] [CrossRef]
71. Amiri M, Hatami F, Golafshani EM. Evaluating the synergic effect of waste rubber powder and recycled concrete aggregate on mechanical properties and durability of concrete. Case Stud Constr Mater. 2021;15(2):e00639. doi:10.1016/J.CSCM.2021.E00639. [Google Scholar] [CrossRef]
72. Surendar M, Beulah Gnana Ananthi G, Sharaniya M, Deepak MS, Soundarya TV. Mechanical properties of concrete with recycled aggregate and M−sand. Mater Today Proc. 2021;44:1723–30. doi:10.1016/J.MATPR.2020.11.896. [Google Scholar] [CrossRef]
73. Chinzorigt G, Lim MK, Yu M, Lee H, Enkbold O, Choi D. Strength, shrinkage and creep and durability aspects of concrete including CO2 treated recycled fine aggregate. Cem Concr Res. 2020;136(111):106062. doi:10.1016/J.CEMCONRES.2020.106062. [Google Scholar] [CrossRef]
74. Sasanipour H, Aslani F. Durability assessment of concrete containing surface pretreated coarse recycled concrete aggregates. Constr Build Mater. 2020;264:120203. doi:10.1016/J.CONBUILDMAT.2020.120203. [Google Scholar] [CrossRef]
75. Yang S, Lee H. Drying shrinkage and rapid chloride penetration resistance of recycled aggregate concretes using cement paste dissociation agent. Materials. 2021;14(6):1478. doi:10.3390/MA14061478. [Google Scholar] [PubMed] [CrossRef]
76. Nassar RUD, Soroushian P. Strength and durability of recycled aggregate concrete containing milled glass as partial replacement for cement. Constr Build Mater. 2012;29(2):368–77. doi:10.1016/J.CONBUILDMAT.2011.10.061. [Google Scholar] [CrossRef]
77. Habibi A, Ramezanianpour AM, Mahdikhani M. RSM-based optimized mix design of recycled aggregate concrete containing supplementary cementitious materials based on waste generation and global warming potential. Resour Conserv Recycl. 2021;167(4):105420. doi:10.1016/j.resconrec.2021.105420. [Google Scholar] [CrossRef]
78. Sasanipour H, Aslani F. Effect of specimen shape, silica fume, and curing age on durability properties of self-compacting concrete incorporating coarse recycled concrete aggregates. Constr Build Mater. 2019;228:117054. doi:10.1016/J.CONBUILDMAT.2019.117054. [Google Scholar] [CrossRef]
79. Kou SC, Poon CS. Enhancing the durability properties of concrete prepared with coarse recycled aggregate. Constr Build Mater. 2012;35(5):69–76. doi:10.1016/J.CONBUILDMAT.2012.02.032. [Google Scholar] [CrossRef]
80. Masood B, Elahi A, Barbhuiya S, Ali B. Mechanical and durability performance of recycled aggregate concrete incorporating low calcium bentonite. Constr Build Mater. 2020;237(3):117760. doi:10.1016/J.CONBUILDMAT.2019.117760. [Google Scholar] [CrossRef]
81. Sasanipour H, Aslani F. Durability properties evaluation of self-compacting concrete prepared with waste fine and coarse recycled concrete aggregates. Constr Build Mater. 2020;236(9):117540. doi:10.1016/J.CONBUILDMAT.2019.117540. [Google Scholar] [CrossRef]
82. Kou SC, Poon CS, Chan D. Influence of fly ash as cement replacement on the properties of recycled aggregate concrete. J Mater Civ Eng. 2007;19:709–17. doi:10.1061/(ASCE)0899-1561(2007)19:9(709). [Google Scholar] [CrossRef]
83. Saravanakumar P, Dhinakaran G. Durability aspects of HVFA-based recycled aggregate concrete. Mag Concr Res. 2014;66(4):186–95. doi:10.1680/macr.13.00200. [Google Scholar] [CrossRef]
84. Pan Z, Zhou J, Jiang X, Xu Y, Jin R, Ma J, et al. Investigating the effects of steel slag powder on the properties of self-compacting concrete with recycled aggregates. Constr Build Mater. 2019;200(4):570–7. doi:10.1016/J.CONBUILDMAT.2018.12.150. [Google Scholar] [CrossRef]
85. Barroqueiro T, da Silva PR, de Brito J. High-performance self-compacting concrete with recycled aggregates from the precast industry: durability assessment. Buildings. 2020;10(6):113. doi:10.3390/BUILDINGS10060113. [Google Scholar] [CrossRef]
86. Pedro D, de Brito J, Evangelista L. Structural concrete with simultaneous incorporation of fine and coarse recycled concrete aggregates: mechanical, durability and long-term properties. Constr Build Mater. 2017;154(6):294–309. doi:10.1016/J.CONBUILDMAT.2017.07.215. [Google Scholar] [CrossRef]
87. Santos SA, Da Silva PR, De Brito J. Durability evaluation of self-compacting concrete with recycled aggregates from the precast industry. Mag Concr Res. 2019;71(24):1265–82. doi:10.1680/JMACR.18.00225. [Google Scholar] [CrossRef]
88. Yu Y, Zhao X, Xie T, Wang X. Eco-, economic- and mechanical-efficiencies of using precast rejects as coarse aggregates in self-compacting concrete. Case Stud Constr Mater. 2022;17(11):e01591. doi:10.1016/J.CSCM.2022.E01591. [Google Scholar] [CrossRef]
89. Duan ZH, Poon CS. Properties of recycled aggregate concrete made with recycled aggregates with different amounts of old adhered mortars. Mater Des. 2014;58:19–29. doi:10.1016/j.matdes.2014.01.044. [Google Scholar] [CrossRef]
90. Yu Y, Zhou L, Lin L. Compressive stress-strain relationship and its variability of basalt fiber reinforced recycled aggregate concrete. AIP Adv. 2024;14:75320. doi:10.1063/5.0220434/3304153. [Google Scholar] [CrossRef]
91. Liao Z. Bond-slip behavior and tensile stiffness of FRP reinforcement and precast recycled aggregate concrete. Guangzhou, China: Guangdong University of Technology Guangzhou; 2023. [Google Scholar]
92. Kou SC, Poon CS. Long-term mechanical and durability properties of recycled aggregate concrete prepared with the incorporation of fly ash. Cem Concr Compos. 2013;37(5):12–9. doi:10.1016/J.CEMCONCOMP.2012.12.011. [Google Scholar] [CrossRef]
93. Kou SC, Poon CS, Chan D. Influence of fly ash as a cement addition on the hardened properties of recycled aggregate concrete. Mater Struct/Mater Et Construct. 2008;41:1191–201. doi:10.1617/S11527-007-9317-Y/METRICS. [Google Scholar] [CrossRef]
Cite This Article
 Copyright © 2025 The Author(s). Published by Tech Science Press.
This work is licensed under a Creative Commons Attribution 4.0 International License , which permits unrestricted use, distribution, and reproduction in any medium, provided the original work is properly cited.
 Downloads
 Citation Tools