
 Submit a Paper
 Propose a Special lssue
 Open Access
ARTICLE

Explainable Ensemble Learning Framework for Early Detection of Autism Spectrum Disorder: Enhancing Trust, Interpretability and Reliability in AI-Driven Healthcare
1 Department of Computer Science, College of Computer and Information Sciences, Jouf University, Sakaka, 72388, Saudi Arabia
2 King Salman Center for Disability Research, Riyadh, 11614, Saudi Arabia
3 Department of Artificial Intelligence and Data Science, National University of Computer and Emerging Sciences, Islamabad, 44000, Pakistan
4 School of Computer Science, Taylor’s University, Subang Jaya, 47500, Malaysia
5 Office of Research and Development, Asia University, Taichung, 413305, Taiwan
6 School of Computing, Engineering and the Built Environment, University of Roehampton, London, SW155PJ, UK
7 Center of Artificial Intelligence, Prince Mohammad bin Fahd University, Alkhobar, 31952, Saudi Arabia
* Corresponding Author: Menwa Alshammeri. Email:
(This article belongs to the Special Issue: Artificial Intelligence Models in Healthcare: Challenges, Methods, and Applications)
Computer Modeling in Engineering & Sciences 2026, 146(1), 41 https://doi.org/10.32604/cmes.2025.074627
Received 15 October 2025; Accepted 09 December 2025; Issue published 29 January 2026
 View Full Text
 Download PDF
Abstract
Artificial Intelligence (AI) is changing healthcare by helping with diagnosis. However, for doctors to trust AI tools, they need to be both accurate and easy to understand. In this study, we created a new machine learning system for the early detection of Autism Spectrum Disorder (ASD) in children. Our main goal was to build a model that is not only good at predicting ASD but also clear in its reasoning. For this, we combined several different models, including Random Forest, XGBoost, and Neural Networks, into a single, more powerful framework. We used two different types of datasets: (i) a standard behavioral dataset and (ii) a more complex multimodal dataset with images, audio, and physiological information. The datasets were carefully preprocessed for missing values, redundant features, and dataset imbalance to ensure fair learning. The results outperformed the state-of-the-art with a Regularized Neural Network, achieving 97.6% accuracy on behavioral data. Whereas, on the multimodal data, the accuracy is 98.2%. Other models also did well with accuracies consistently above 96%. We also used SHAP and LIME on a behavioral dataset for models’ explainability.Keywords
Autism Spectrum Disorder (ASD) is a neuro-developmental disorder that disrupts communication, social interactions, and behavioral patterns [1]. It is an early childhood disorder that continues throughout life and affects children’s thought processes and daily activities [2]. It has risen globally that makes early diagnosis and intervention imperative [3]. Early treatment of children with ASD significantly improves their social, linguistic, and behavioral skills [4]. Unfortunately, diagnosing ASD is not that simple due to its diverse nature and heavy reliance on clinical diagnosis [5]. In normal practice, different diagnostic tools like Autism Diagnostic Observation Schedule (ADOS) and Autism Diagnostic Interview Revised (ADI-R) are used, which require deep clinical knowledge and detailed evaluations [6]. In comparison, screening tools like Autism Spectrum Quotient-10 (AQ-10), Modified Checklist for Autism in Toddlers (M-CHAT), or Social Communication Questionnaire (SCQ) are designed for large-scale, early-stage identification. However, they still face accuracy and consistency limitations and especially in resource-constrained regions.
Application of Machine Learning (ML) provides great prospects for early diagnosis of ASD because it offers automated and data-driven approaches for detection [7]. Algorithms assess the likelihood of a child being diagnosed with autism based on preamble and behavioral information, making them a suitable replacement for routine and expensive screening tests [8]. Several ML algorithms, including Support Vector Machines (SVM), Decision Trees (DT), and Deep Neural Networks (DNN), have been studied for the classification of ASD [9]. These models are heterogeneous, but there is often still a lack of generalizability across different datasets [10]. Varying methodologies in data accrual, feature selection, and sample sizes increase the inconsistency in model performance [11].
To address these issues, researchers have examined ensemble learning in greater detail for medical classification tasks. Ensemble learning improves the accuracy of predictions, reduces overfitting, and improves the reliability of the model by integrating many ML models. This technique combines the strengths of different classifiers, resulting in better generalization across diverse datasets. Recent studies have shown that ensemble-based models outperform single classifiers in various medical domains, including autism diagnosis. However, there is little research on ensemble techniques for the automatic detection of ASD in children, particularly across multimodal datasets that combine behavioral, visual, and physiological cues.
This paper introduces a new ensemble-based machine learning approach for early detection of autism in children. We developed a framework that combines multiple models and tested it on two different types of data: a behavioral screening dataset (Dataset 1) and a multimodal dataset (Dataset 2) that includes visual, audio, and physiological measurements. Using both datasets helped us understand how well our method works across different data types. We experimented with several popular machine learning models, including Random Forest (RF), XGBoost (XGB), Gradient Boosting (GB), Support Vector Machines (SVM), Logistic Regression (LR), along with ensemble methods like Voting Classifier (VC) and Stacking Classifier (SC). We independently assessed both Regularized and Deep Neural Network models in order to determine which would yield better results in the screening of patients with autism. The appropriate application of SHAP and LIME, which is what is responsible for the model’s predictions, aids in the transparency of the framework, which most in the field would appreciate. Clinicians, in particular, would benefit from these insights, as they would better grasp the underlying reasons for the results obtained. The main contributions of this work are listed below:
1. It presents a novel ensemble-based ML framework that improves the accuracy and reliability of autism detection across different data types.
2. It provides a comparison of multiple classification algorithms to identify the most effective model for ASD screening.
3. It used interpretability techniques (i.e., SHAP and LIME) for explainability of important features.
4. It demonstrates how ensemble learning helps create more generalizable models that work well across diverse datasets.
Existing studies for the detection of ASD have focused mainly on one of three key focal points: single-behavioral modality datasets, non-interpretive DL, or primary ensemble techniques lacking assessment of disparate inputs. This study proposes the first integrated framework that combines: (i) multimodal feature fusion and an ensemble–deep hybrid learning pipeline, (ii) SHAP and LIME structured explainability. This unique combination is the first of its kind, providing both robust predictive power and functionally rooted clinical interpretability. No other study has, to our knowledge, examined ensemble explainability concurrently with the analysis of ASD and other behavioral and multimodal datasets, to assess its predictive generalizability, stability, and feature clinical relevance at the individual level. This represents the first clear advancement, to our knowledge, in the methods of ensemble-XAI.
The paper is organized with Section 2 reviewing related work, Section 3 describing the proposed method, Section 4 detailing the experimental setup, and Sections 5 and 6 presenting the results and conclusions.
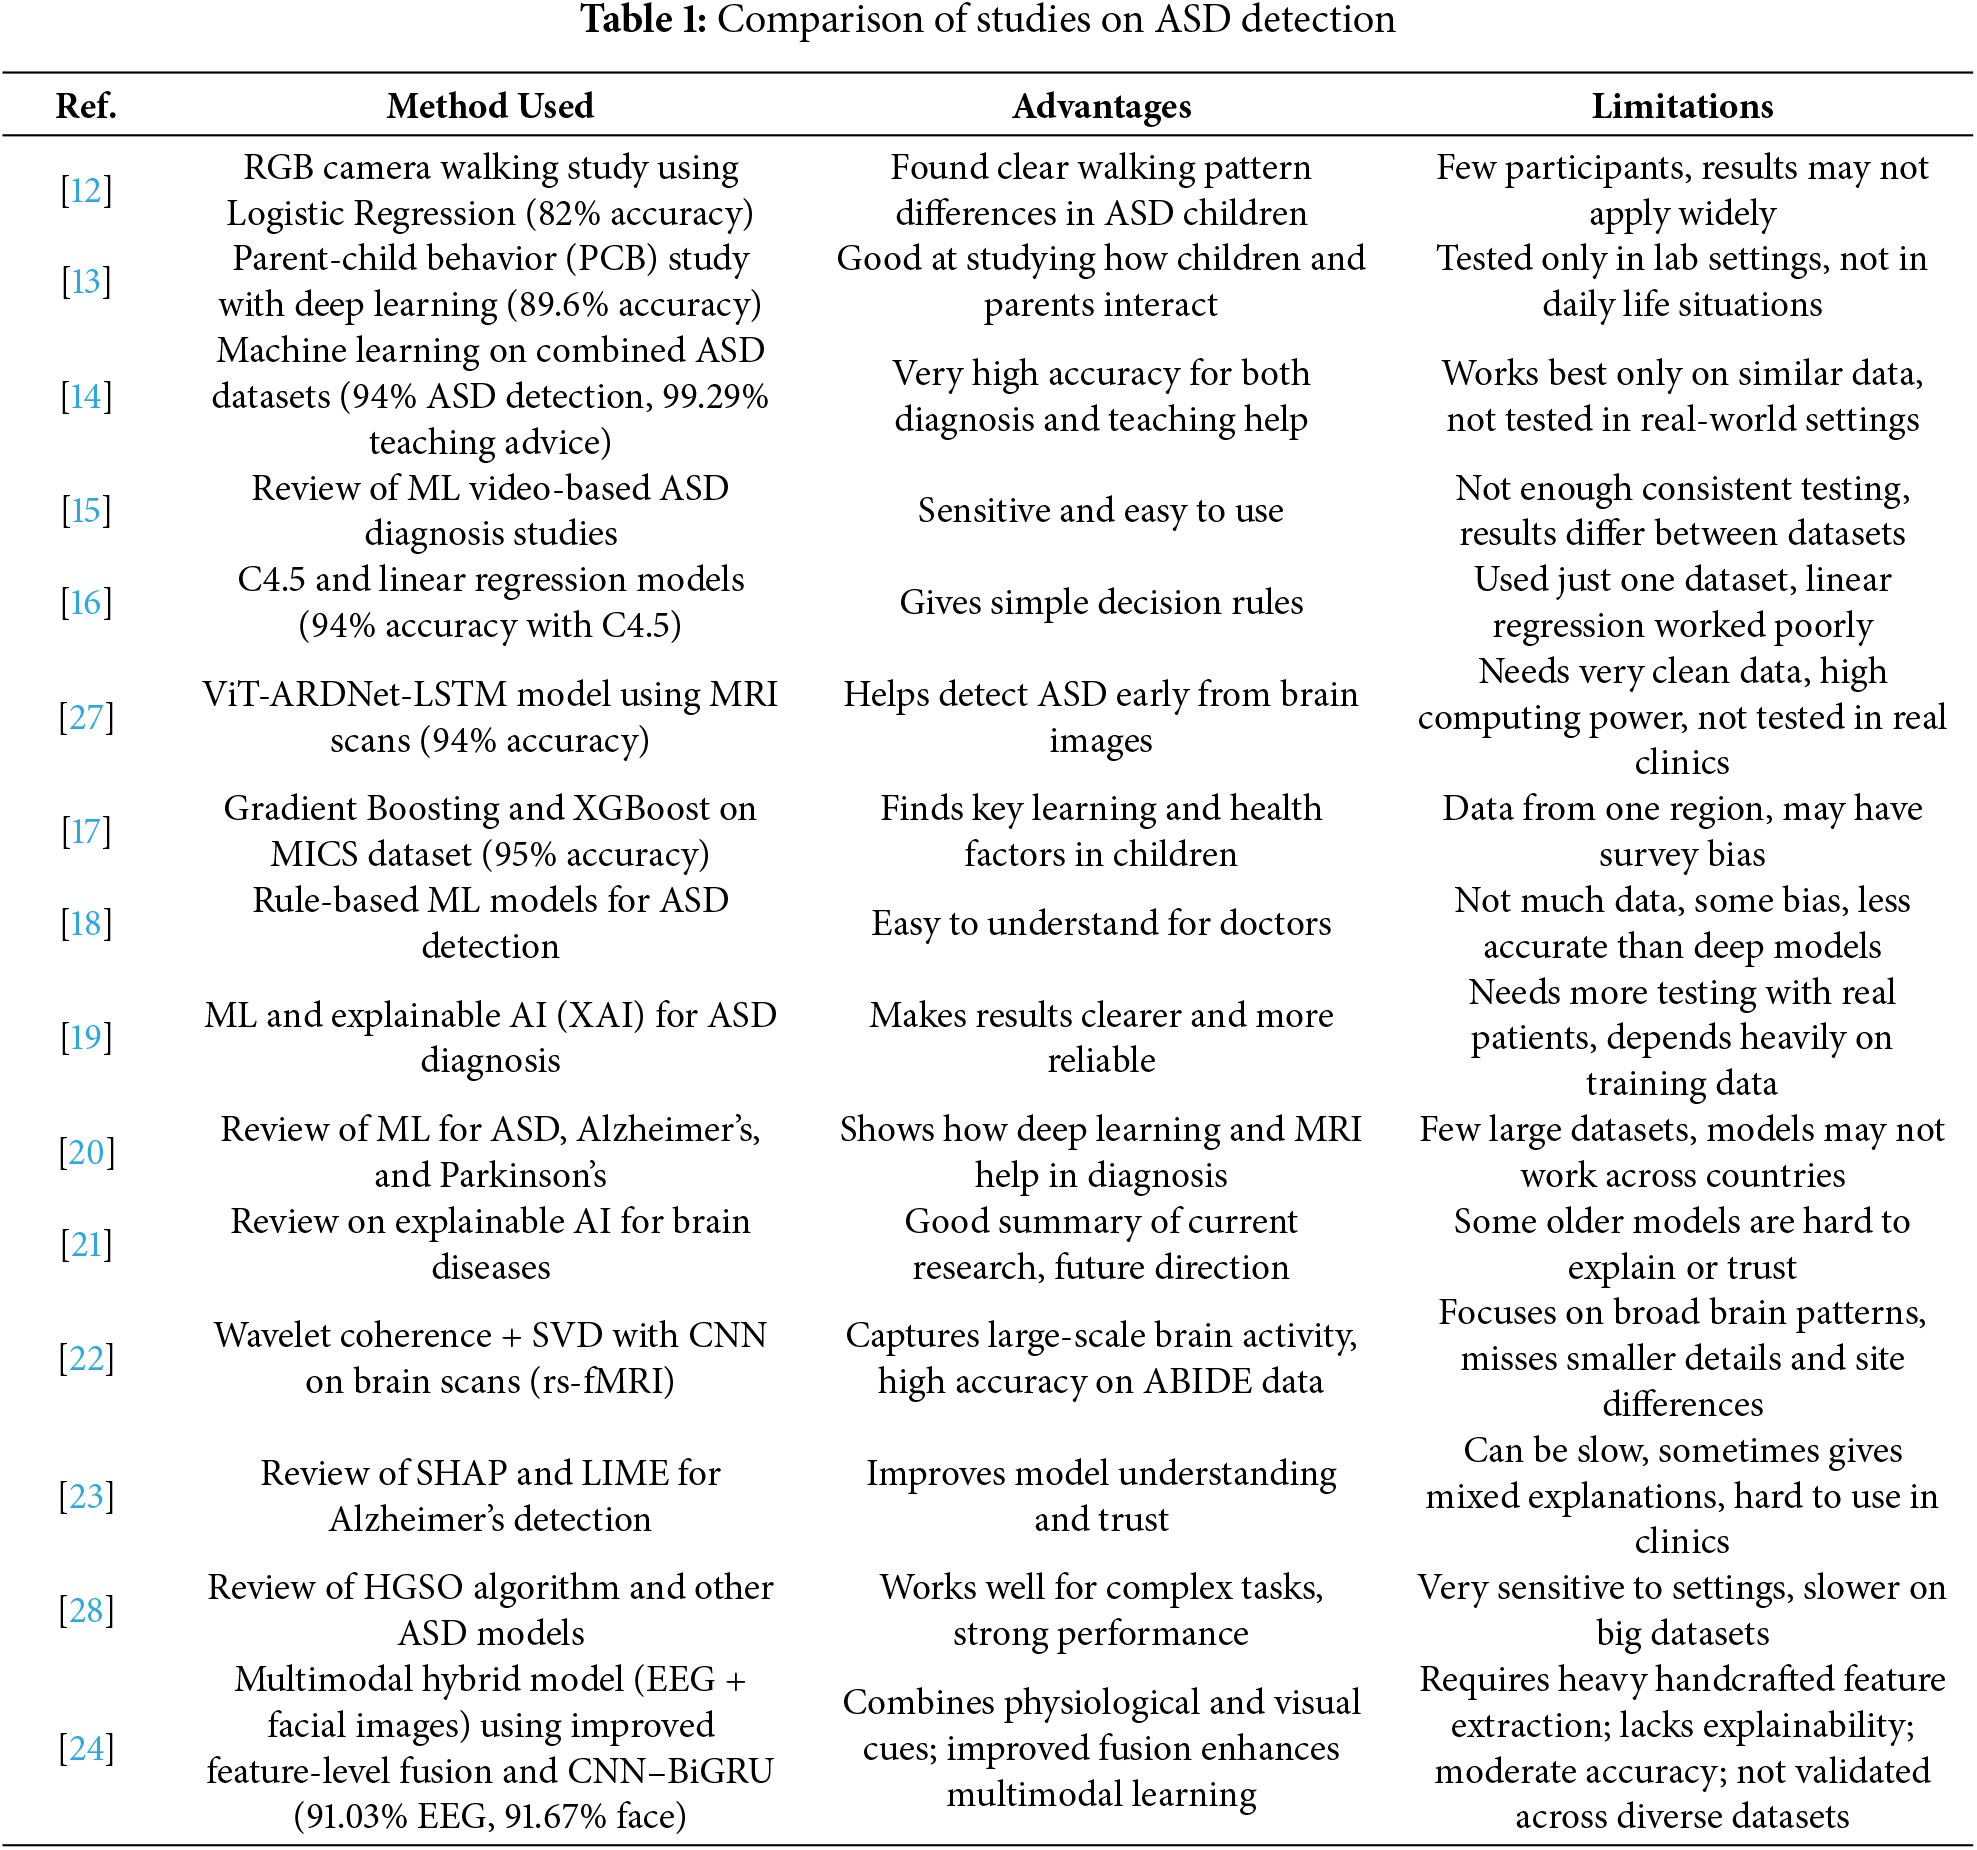
Many studies have used ML in autism detection with different levels of success. For example, Ganai et al. [12] proposed Logistic Regression to study walking styles from RGB camera videos and got an accuracy of 82%. However, their work is limited by a smaller dataset and a single modality. Li et al. [13] proposed a DL-based model to study children’s interaction with their parents and achieved 89.6% accuracy. Some researchers combined different datasets, such as Alzakari et al. [14], merged several ASD datasets, and achieved 94% accuracy for diagnosis and 99.29% for suggesting teaching strategies. However, due to a single modality and dataset, the generalizability is low. Jin et al. [15] reviewed many studies that used videos for ASD diagnosis. They said that ML methods are sensitive and easy to use, but often unreliable because of inconsistent testing and differences between datasets. Ridlan et al. [16] used the C4.5 algorithm with 94% accuracy for ASD prediction; however, their linear regression model did not work well. They also used only one dataset.
It seems that acquiring data is just as complex as their testing and validation in real clinical settings. Also, many of these models require powerful computers, leading to accessibility issues. Mim et al. [17] tackled the issues of parents concerned with their children facing learning challenges by applying Gradient Boosting and XGBoost. They concluded that parenting and health are primary influences. The model achieved an accuracy of 95%; however, the fact that the operational data is confined to a single region raises potential bias concerns. Similarly, Alsbakhi et al. [18] improved the explainability of these models by applying rule-based classifiers and remarking that the additional layers of DL on these models would improve the accuracy. However, this increases the data and computational load. The performance and understanding trade-off is bound to occur. Similarly, Jeon et al. [19] apply explainable AI in the diagnosis of ASD to streamline the process and enhance its reliability. They found the best performing models to be neural networks and gradient boosting, and lament the fact that, clinically, these models are not embraced. It should be noted that many of the performing models in silos have not been scrutinized externally, and therefore, their precision is dubious. Fatima et al. [20] analyzed the application of ML in brain diseases such as Alzheimer’s, Parkinson and ASD. They noted the importance of deep learning and MRI data, the scarcity of large, collaborative datasets, and some models’ unreliability. Bibi et al. [21] describe the impact of XAI on the workflows of medical diagnosis with respect to various disorders of the brain. Their meticulous review demonstrated that the problem of AI-as-a-doctor is still unsolved and, as such, much trust-building is required with respect to AI diagnosis.
Al-Hiyali et al. [22] applied a wavelet coherence and singular value decomposition approach to the problem of brain-connectivity analysis. They later employed a CNN framework to obtain evident high accuracy in the classification of ASD. These authors, however, focus on general patterns of brain activity and may not capture minute features or localized differences in brain functioning and which limits generalization across populations. Cognitive tools that articulate AI reasoning have been closely examined by particular researchers. Vimbi et al. [23] analyzed 23 studies that utilized SHAP and LIME for detecting Alzheimer’s. They concluded that these tools assist with trust and transparency, but prove to be rather sluggish, inconsistent, and difficult to integrate within the daily routines of clinical practice. Vidivelli et al. [24] introduced the MADDHM model, where they detect autism using EEG and facial images in the multimodal domain. The system consists of multiple steps, including preprocessing, feature engineering, refined feature-level fusion, and classifying with a hybrid CNN-BiGRU model. Although the framework advances the state of the art in multimodal performance, it still suffers from heavily engineered features and operates at a moderate accuracy (91.03% on EEG and 91.67% on facial). In addition, the framework lacks explainability and cross-dataset generalizability. In comparison, our work improves on the absence of engineered features, uses automated multimodal embeddings, incorporates an ensemble of deep architectures in a single framework, and improves clinical interpretability with SHAP-LIME explainability. This makes our work a more explainable and generalizable extension of recent work on multimodal ASD detection. Recently, researchers have targeted XAI and ASD detection, particularly Snaps and Videos. Sleiman et al. [25] applied ASD recognition using videos and multimodal cues. Benabderrahmane et al. [26] applied a convex combination of facial expression and eye-gaze pattern. Table 1 compares the state-of-the-art for ASD detection.
Early identification of autism spectrum disorder (ASD) enables timely and targeted intervention through personalized developmental support, which is crucial for assisting affected individuals in areas of greatest need. Current screening practices are based on time-consuming and subjective clinical evaluations and standardized tests, which are inefficient in remote or resource-poor settings because of their lack of automation. ML approaches deal with these problems primarily by classifying behavioral and other demographic and clinical data to identify ASD. However, standalone ML models are often poorly generalized to other populations, and sensitive to class imbalance, lack interpretability, and offer insufficient general functional explanations. This study provides a reasoned ensemble framework that blends deep and other classifiers with advanced ML techniques to resolve these issues sequentially. This framework revolves on a balanced partition from the cross-domain Dataset 1 (i.e., behavioral data) and Dataset 2 (i.e., multimodal data) to facilitate generalization and broad evaluations on explainability and scalability.
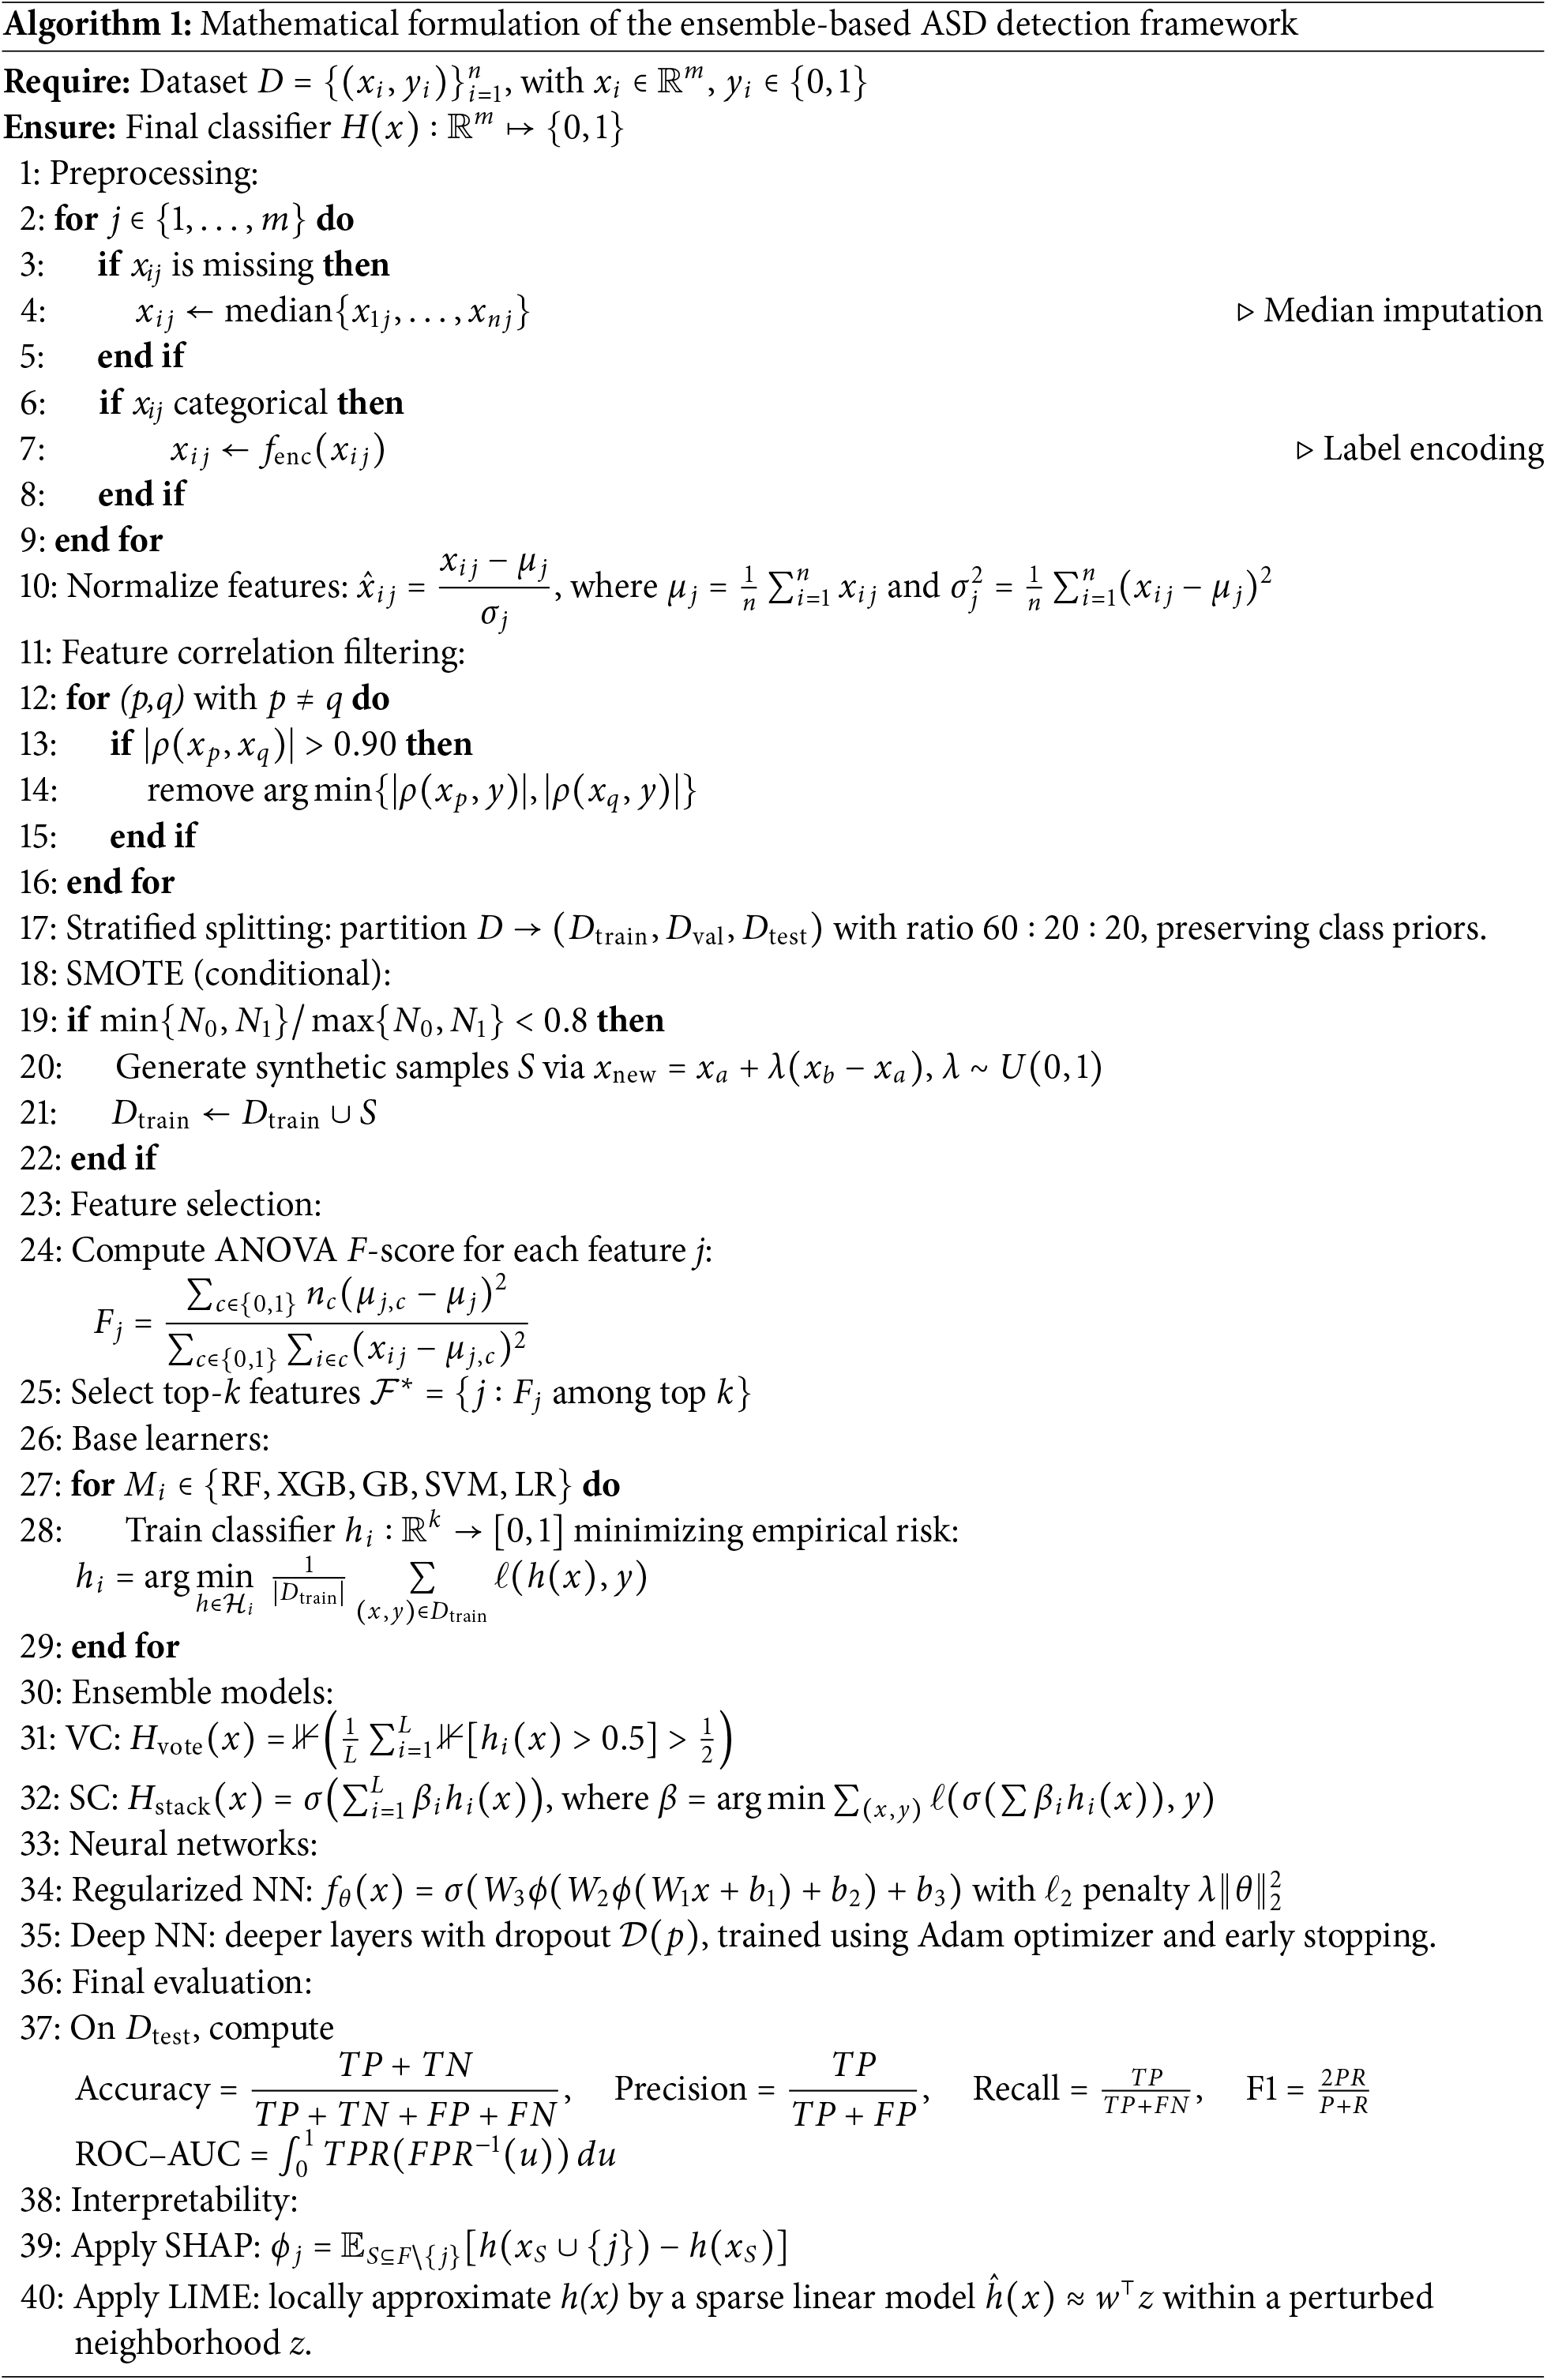
This structure enhances the predictive accuracy, model reliability, and model interpretability by integrating and classifying multiple classifiers and neural structures within an ensemble framework. Traditional ML classifiers are, as shown in Fig. 1, hybridized with deep models. Drawing from ensemble learning principles, a multi-stage approach has been devised and custom-tailored to optimize both feature selection and classification performance. To shed light on the integrated processing across both datasets, Algorithm 1 provides an overview of the ASD workflow together with its computational formulation. The entire pipeline is run on Dataset 1, and then for Dataset 2, a tailored version is created by adding modality-specific feature extraction and fusion.
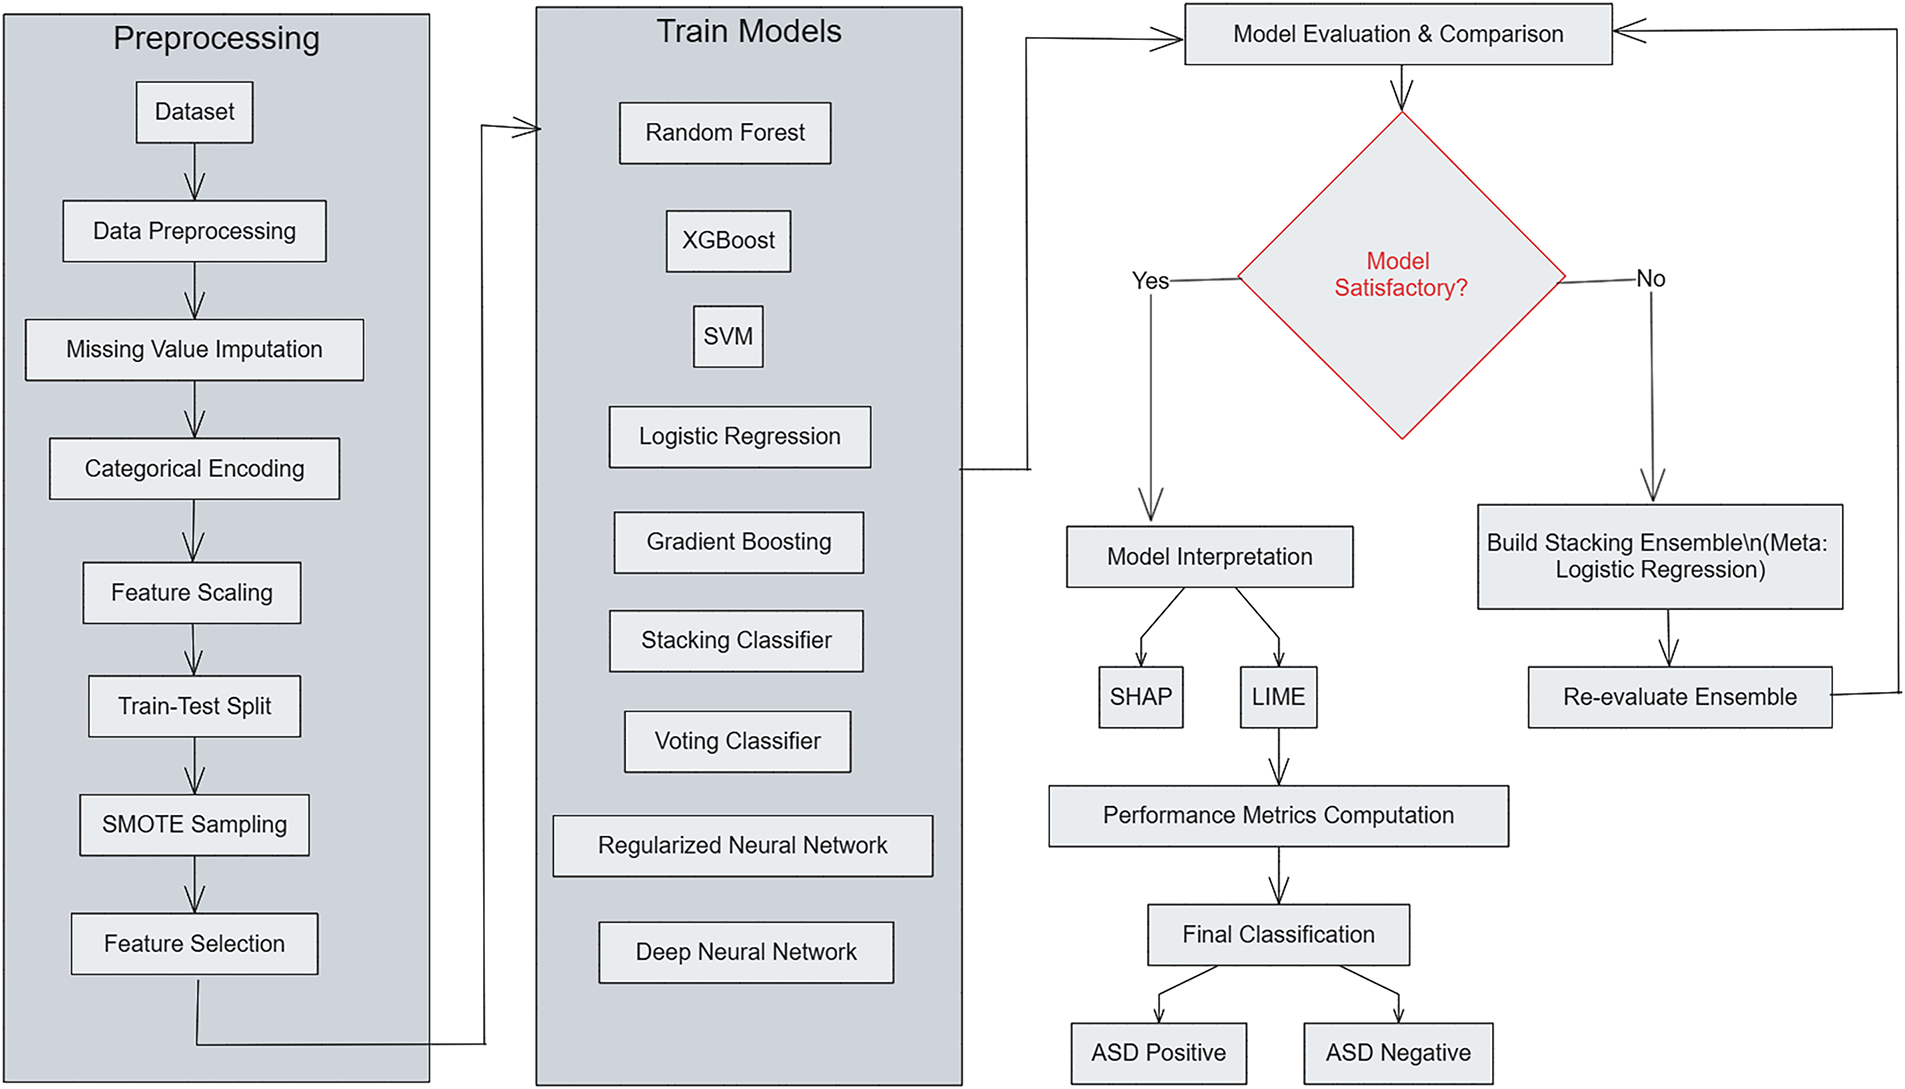
Figure 1: Overview of the proposed ensemble-based ASD detection framework
The structure of the framework for ASD detection remains as a multi-stage pipeline with separate datasets for each ASD detection stage. During the preprocessing stage of each dataset consisting of
The training phase involves multiple classifiers
Performance is evaluated on the held-out test set using accuracy, precision, recall, F1-score, and ROC–AUC. For interpretability, SHAP and LIME are employed to visualize the contribution of each feature to model predictions, ensuring transparency and reliability. The unified pipeline processes both Dataset 1 (behavioral data) and Dataset 2 (multimodal data), differing only in the feature extraction stage of Dataset 2, where modality-specific embeddings from images, audio, motion, and physiological signals are concatenated before classification. This extension maintains methodological consistency while enabling a direct cross-dataset comparison of performance, interpretability, and generalization.
3.1 Dataset 1: Behavioral Autism Spectrum Disorder Dataset
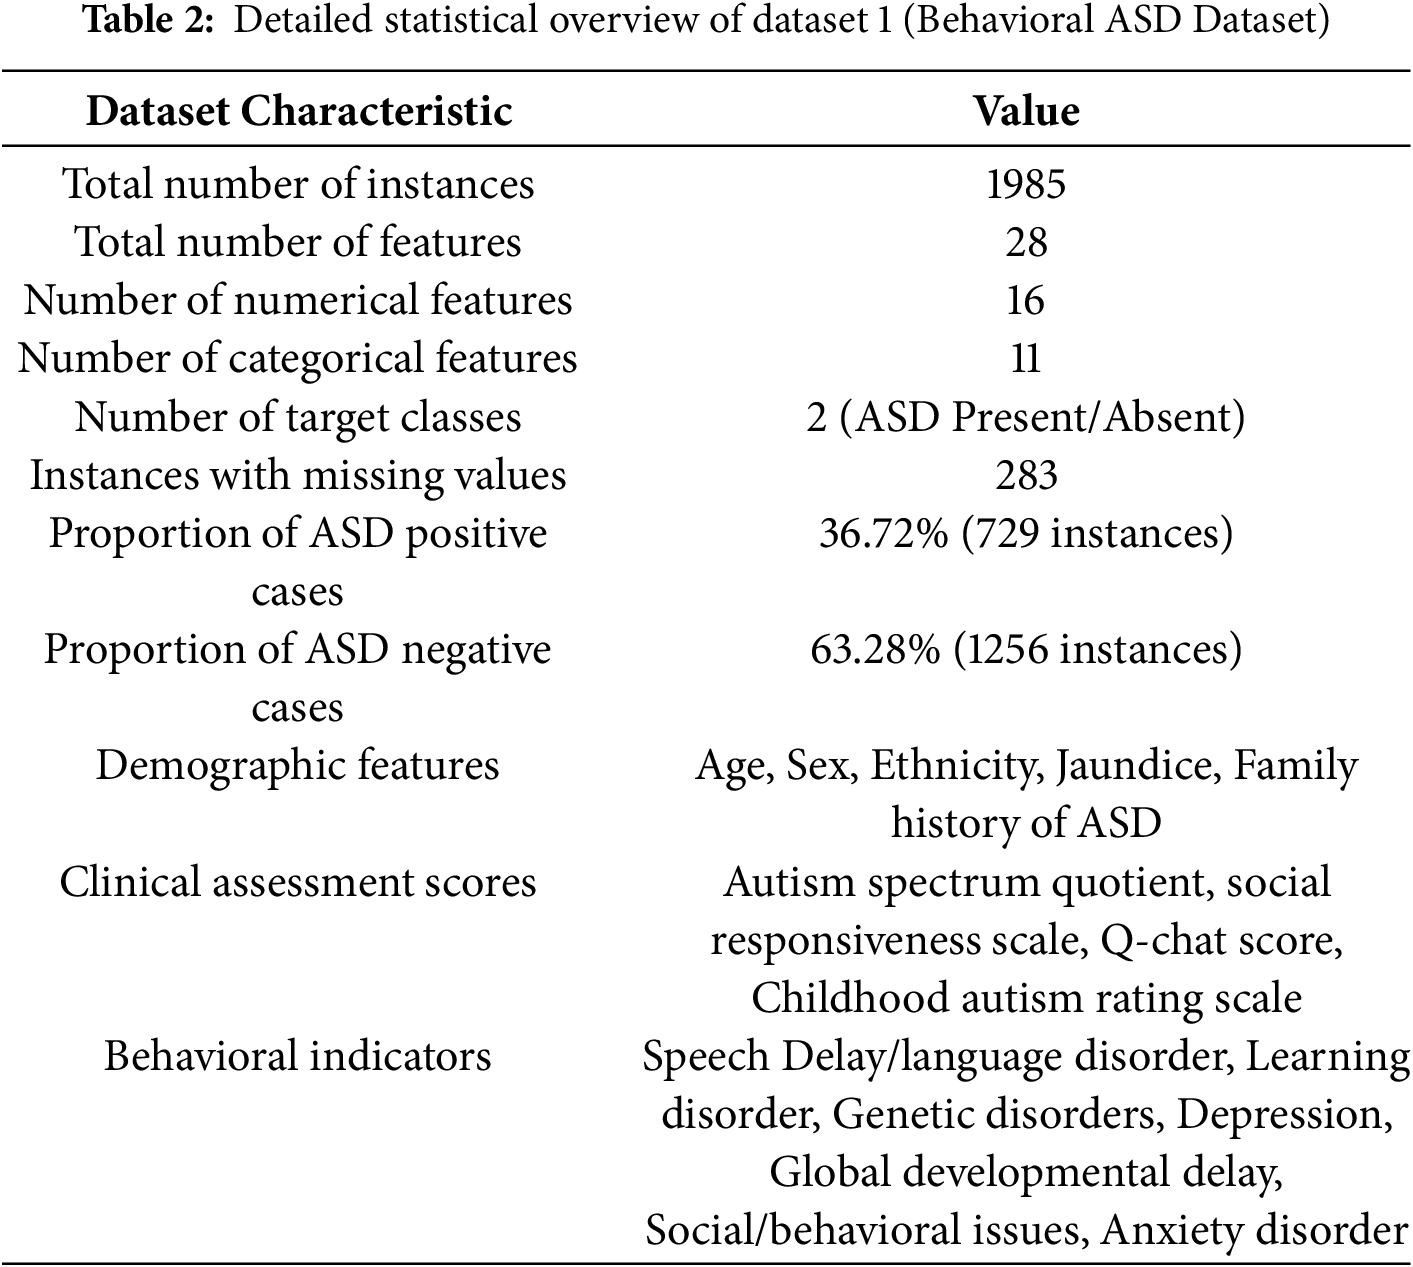
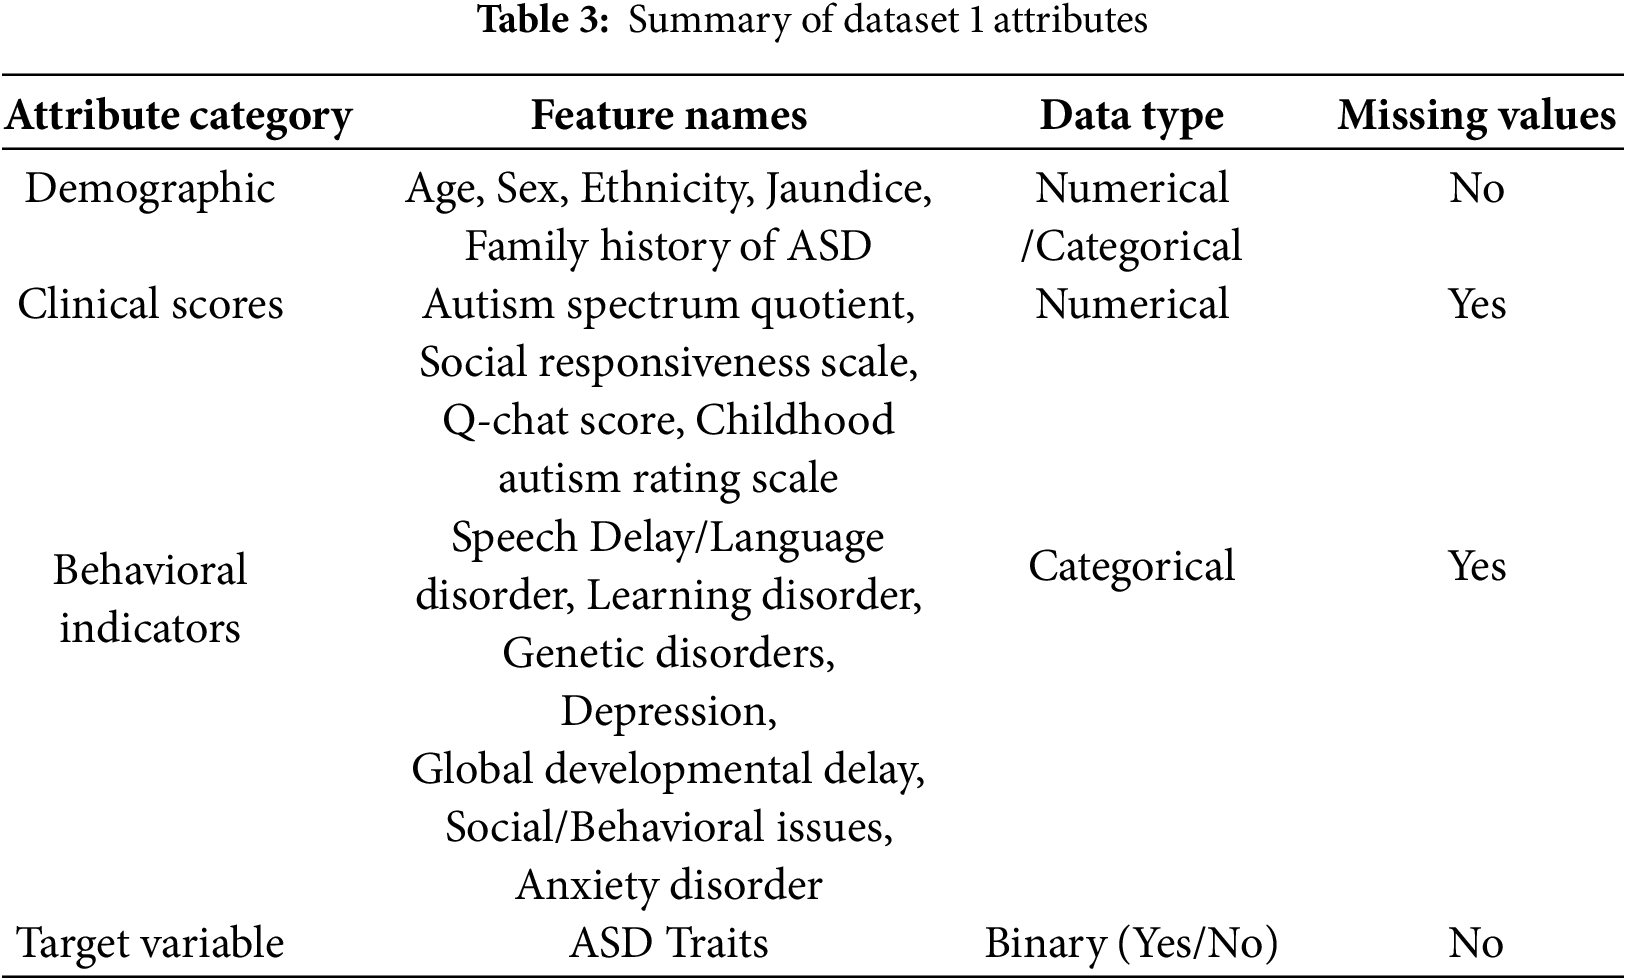
This study utilizes Dataset 1, comprising 1985 instances obtained from public ASD screening databases. The dataset used in this study is the same as reported in [19], where full details of collection (time, location, population, and procedures) are provided and can be referred to for further information. Each instance includes 28 attributes corresponding to demographic, behavioral, and clinical features relevant to the diagnosis of ASD in children, as provided in Table 2. The primary aim is to determine the presence of ASD traits, which is a binary classification problem (Yes: ASD present, No: ASD absent). Key features in Dataset 1 are summarized in Table 3. Certain features exhibited missing values (e.g., Social Responsiveness Scale and Q-chat Score). The gaps in the data were filled with the median in order to preserve the integrity of the data without adding undue bias. It ought to be noted that some clinical scores, in particular the Social Responsiveness Scale (SRS) and the Q-chat, are skewed. To complement the lack of normal distribution, median imputation and resampling techniques were employed free of Gaussian assumptions to reinforce the reliability of the preprocessing framework.
3.1.1 Data Distribution Analysis
As depicted in Fig. 2, the dominance of class No ASD (i.e., 72.9%) over class ASD (i.e., 27.1%) in Dataset 1 was resolved using SMOTE to achieve a balanced 50-50 distribution. In order to prevent data leakage, oversampling was confined to the training set only. The histograms also illustrate that features A9 and A5 have distinct separation between the ASD and non-ASD populations, supporting their strong discriminative ability. These outcomes demonstrate that the class imbalance and feature distribution were successfully managed to mitigate any bias during training as well as enhance the generalization of the model.
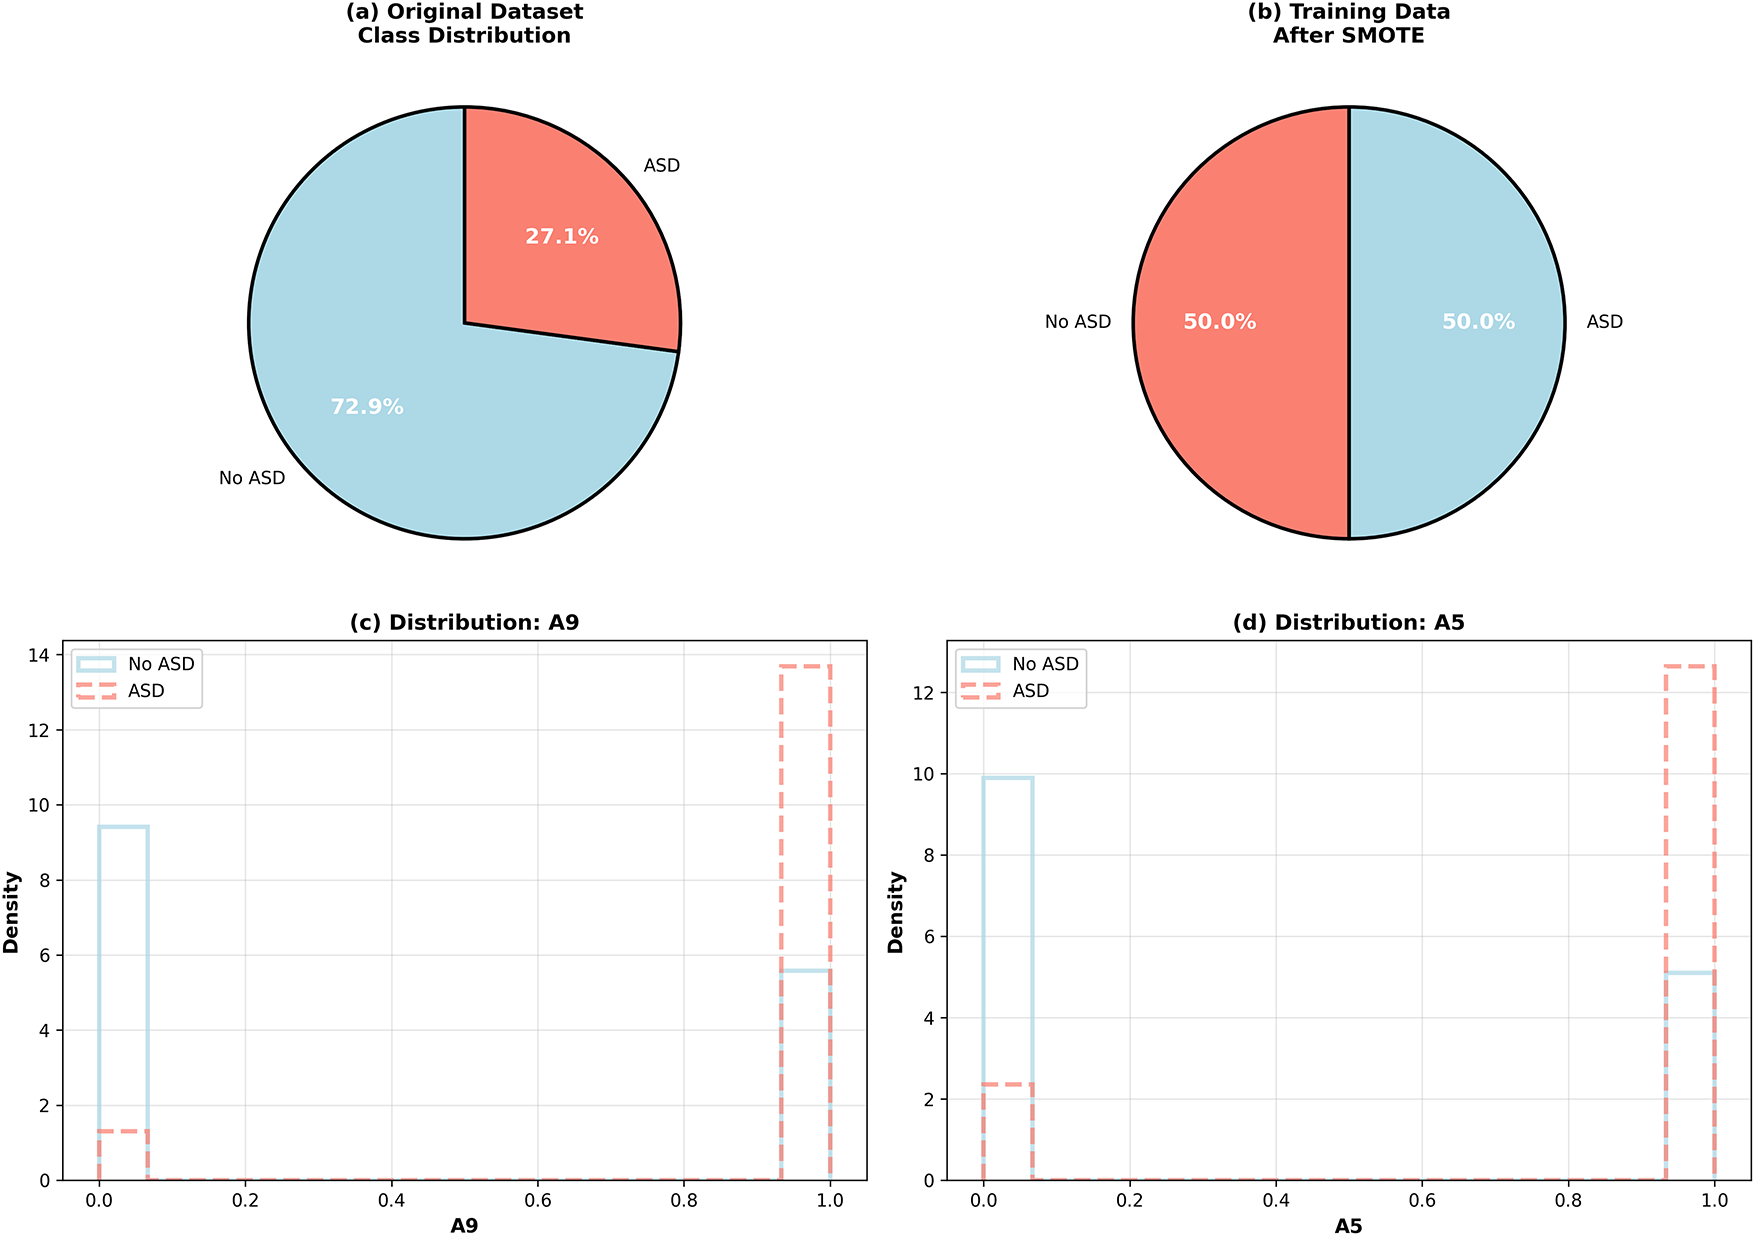
Figure 2: Class distribution in Dataset 1 before and after SMOTE balancing and distribution of key features (A9 and A5)
3.2 Dataset 2: Multimodal Autism Spectrum Disorder Dataset
In order to further test the robustness of the framework, a second dataset (AKA Dataset 2) was employed. Of the other multi-component collections, Dataset 2 contains an assimilated array of visual, auditory, motional, and physiological components, which facilitates an extensive evaluation of the behavioral and biophysical ASD indicators and which expands the scope of ASD assessment globally.
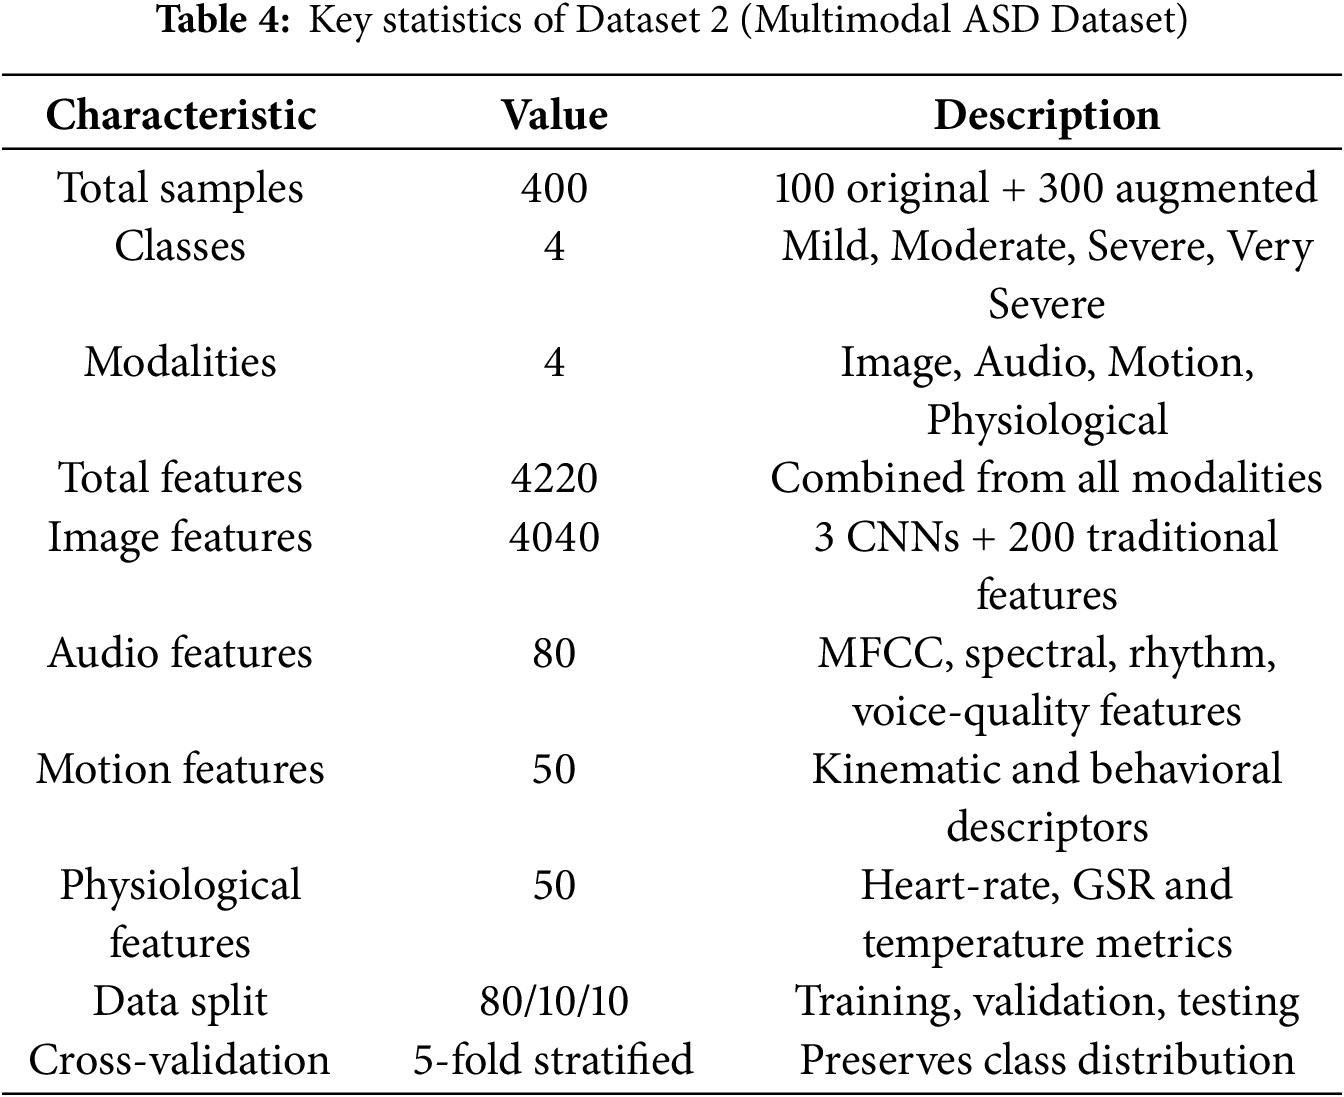
Dataset 2 consists of 100 original clinical samples augmented fourfold to a total of 400 samples. The data are evenly distributed across four ASD severity categories: Mild, Moderate, Severe, and Very Severe. Each sample contains synchronized information from four modalities: facial images, voice recordings, body movement trajectories, and physiological measurements such as heart rate, galvanic skin response, and temperature. The dataset was divided into training (80%), validation (10%), and testing (10%) sets using stratified sampling to maintain class balance across categories.
3.2.2 Data Modalities and Features
• Image modality: 4040 features derived from facial and behavioral images using three pre-trained convolutional neural networks (ResNet50, VGG16, and MobileNetV2) combined with 200 traditional texture, color, and shape descriptors. Images were resized to 224
• Audio modality: 80 acoustic features extracted from 10–30 s voice recordings, including Mel-frequency cepstral coefficients (MFCC), spectral, temporal, rhythmic, and voice-quality attributes such as jitter, shimmer, and harmonic-to-noise ratio.
• Motion modality: 50 spatio-temporal features calculated from body keypoints (head, torso, and limbs) obtained through vision-based pose estimation. These features represent velocity, acceleration, jerk, movement range, coordination, and repetitive behavioral patterns.
• Physiological modality: 50 biosignal features captured through wearable sensors, covering heart-rate variability, galvanic skin response, and temperature changes. Both time- and frequency-domain characteristics were used to quantify stress, arousal, and comfort levels.
3.2.3 Data Augmentation and Quality Control
Each modality underwent targeted augmentation to prevent overfitting and improve generalization. For image data, geometric and color transformations such as rotation, flipping, and brightness or contrast adjustments were used. For audio recordings, pitch shifting and tempo variations were applied; for motion data, coordinate scaling and temporal shifts were performed; and for physiological signals, amplitude scaling with Gaussian noise was added. All modalities achieved complete data availability, with cross-modality synchronization errors remaining below 100 ms. Clinical experts verified annotation consistency, resulting in an inter-rater reliability score of 0.92 (Cohen’s kappa).
3.2.4 Ethical and Privacy Considerations
All participant data were anonymized before processing. Written consent was obtained from caregivers, and Institutional Review Board (IRB) approval was granted for data collection and analysis. Dataset 2 complies with research data protection requirements, ensuring secure storage, encryption, and restricted access for authorized researchers.
3.2.5 Summary of Dataset Characteristics
As shown in Table 4, Dataset 2 provides a richer and more diverse feature space than Dataset 1, supporting the evaluation of cross-domain correlations and confirming the scalability of the proposed ensemble framework under heterogeneous multimodal conditions.
The proposed methodology employs an ensemble-based approach combining multiple ML classifiers and deep learning architectures to enhance prediction accuracy, reduce bias and improve model robustness. The unified framework is applied to two datasets: Dataset 1 (behavioral data) and Dataset 2 (multimodal data). For Dataset 1, the model processes behavioral and demographic indicators, while for Dataset 2, the same pipeline is extended with modality-specific feature extraction from image, audio, motion, and physiological signals before ensemble training. This dual evaluation guarantees that the methodology is uniform and flexible at the same time for both homogeneous and heterogeneous data sources.
In the case of Dataset 1, the framework requires minimal behavioral indicators such as short answer questionnaires (e.g., AQ-10) and basic demographic or developmental information, and then automatically incorporates multimodal features for Dataset 2. It does not introduce new steps for screening but automates the interpretation of already existing inputs, thus decreasing the clinician’s burden and allowing for timely, scalable, real-time early screening. This hybrid approach integrates traditional ML models with cutting-edge DL models embedded in an organized, cascading architecture with multiple stages for preprocessing, feature selection, model training, evaluation, and interpretability. Their complexity in computation and run time efficiency has been vetted for practicality in clinical settings. The framework aims to serve as an assistive tool for pre-screening, rather than an ultimate diagnostic tool. Instruments such as ADOS and ADI-R remain fundamental for formal evaluation, whereas the proposed system automates and scales preliminary ASD screening using behavioral and multimodal data.
1. Data Collection and Preprocessing: In order to maintain uniformity, both datasets followed the same preparatory processes. In the ML application, categorical variables such as Sex, Ethnicity, and clinical indicators (Jaundice, Family history of ASD, Speech Delay, Anxiety Disorder) were transformed and encoded as labels. Attribute errors were addressed with the median (for numerical) or mode (for categorical attributes) to safeguard the quality of the dataset. Columns of identifiers, as well as attributes that were empty or lacked definitions, viewed as irrelevant, were deleted. All transformations in the preprocessing step (imputation, encoding, scaling, SMOTE, feature selection) were derived solely from the training set to avoid leakage during the application of these processes to the validation and test sets. Dataset 2 required extra steps in the preprocessing as defined for each modality, namely, image reduction in size and normalization, audio signal denoising followed by resampling, alignment of motion coordinates, and filtering and synchronizing physiological recordings.
2. Feature Scaling: In order to enhance convergence of the models, Feature scaling was performed with the purpose of achieving zero-mean and unit-variance features, as described below:
where
3. Handling Class Imbalance: To address class imbalance, the Synthetic Minority Over-sampling Technique (SMOTE) was applied solely on the training set after splitting the data, ensuring no leakage. SMOTE was triggered only when the minority-to-majority ratio fell below 0.8, preventing unnecessary oversampling in balanced conditions.
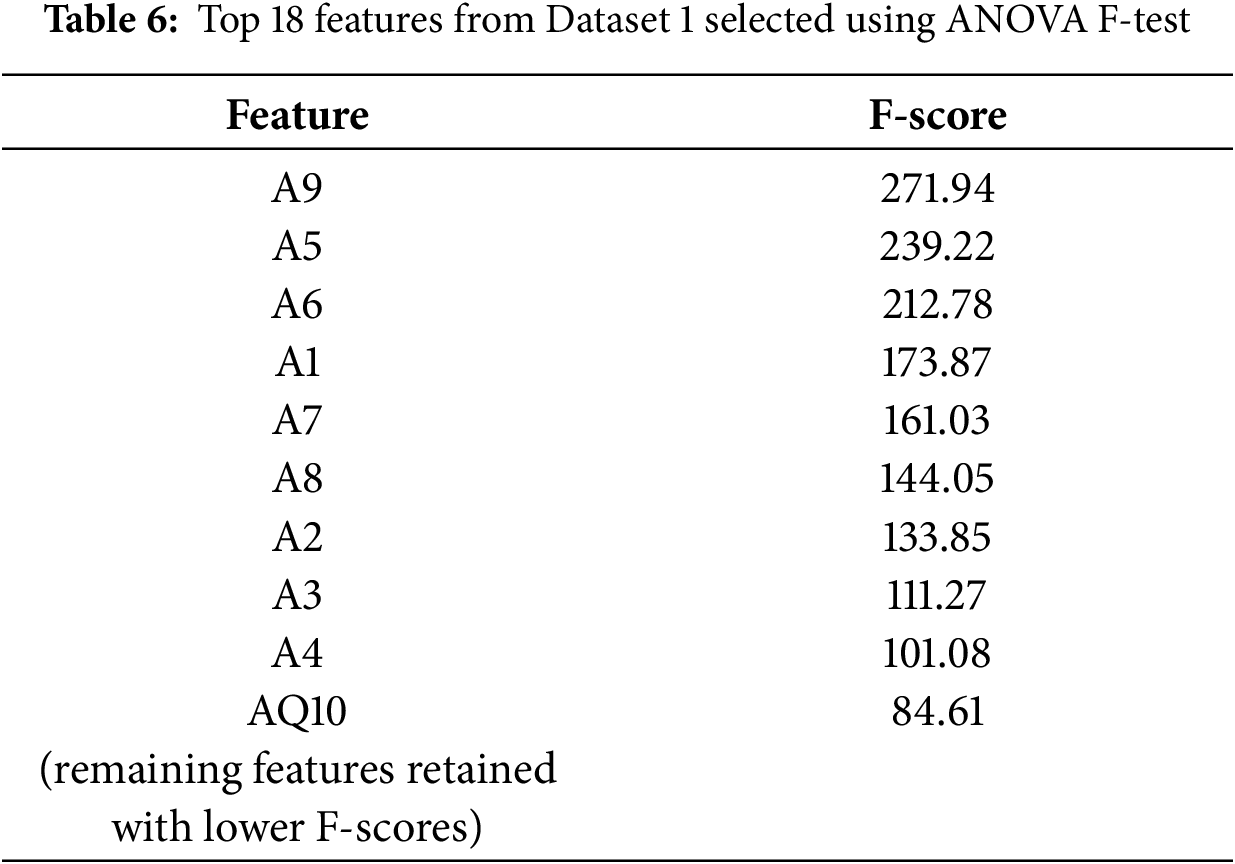
4. Feature Selection and Importance Analysis: Feature selection involved correlation analysis to remove redundant predictors. When two features exhibited a correlation above 0.90, the one with weaker correlation to the target was discarded. An ANOVA F-test (SelectKBest) was then used to identify the top-
5. Models Employed: The ensemble container incorporated both traditional and deep models:
• Random Forest: Combines multiple decision trees using bagging to control overfitting and model feature interactions. Regularization was achieved by limiting depth, increasing minimum split and leaf sizes, and balancing class weights.
• XGBoost: Gradient-boosted trees optimized with L1/L2 regularization, subsampling and column sampling to enhance generalization.
• Gradient Boosting: Implemented as an additional conservative tree ensemble with tuned learning rate and depth.
• Stacking Classifier: Combines predictions from RF, XGB, SVM, and others through a logistic-regression meta-classifier, exploiting the strengths of base learners.
• Voting Classifier: Soft-voting ensemble of RF, XGB, and LR, aggregating probabilistic outputs.
• Neural Network: Multi-layer perceptron with ReLU activations, batch normalization, dropout, and L2 regularization, trained with early stopping and adaptive learning-rate scheduling.
• Deep Neural Network: Deeper architecture (256–128–64 units) with residual-style blocks, dropout, and batch normalization, optimized using Adam.
6. Stacking for Classification: Stacking used a logistic-regression meta-classifier (
where
7. NN Model for Deep Feature Learning: The neural network comprised three ReLU-activated layers with 128, 64, and 32 neurons, followed by batch normalization and dropout (0.5 and 0.4). Training was conducted for 100 epochs with a learning rate of 0.00005 and a batch size of 64 using the Adam optimizer. In the updated framework, the regularized NN used
where
8. Model Interpretations: Model interpretability was ensured using SHAP and LIME [29]. SHAP quantified each feature’s global effect on predictions, while LIME provided local instance-level explanations by perturbing feature values and observing output changes. These complementary methods enabled transparent model behavior, fostering clinical trust in both datasets. Permutation importance was excluded from the final version due to its instability on correlated features.
Models were evaluated using accuracy, ROC–AUC, precision, recall and F1-score. Five-fold stratified cross-validation on the training data produced stability intervals for generalization assessment. All reported metrics were computed on the held-out test set to ensure unbiased performance evaluation. Fairness was assessed using subgroup accuracy comparisons across Sex and Ethnicity attributes. For transparency, SHAP and LIME outputs were integrated into post-hoc analyses, highlighting the top-contributing behavioral and multimodal features in Dataset 1 and Dataset 2, respectively.
All experiments were executed on Google Colab Pro, which provides sufficient computational resources for ML and DL model training. The environment utilized an NVIDIA Tesla T4 GPU with 16 GB VRAM, two vCPUs (Intel Xeon Processor), and 25 GB RAM. These specifications prevented memory bottlenecks during model training and evaluation. The 100 GB temporary storage quota accommodated both datasets, intermediate artifacts, and feature matrices without constraints.
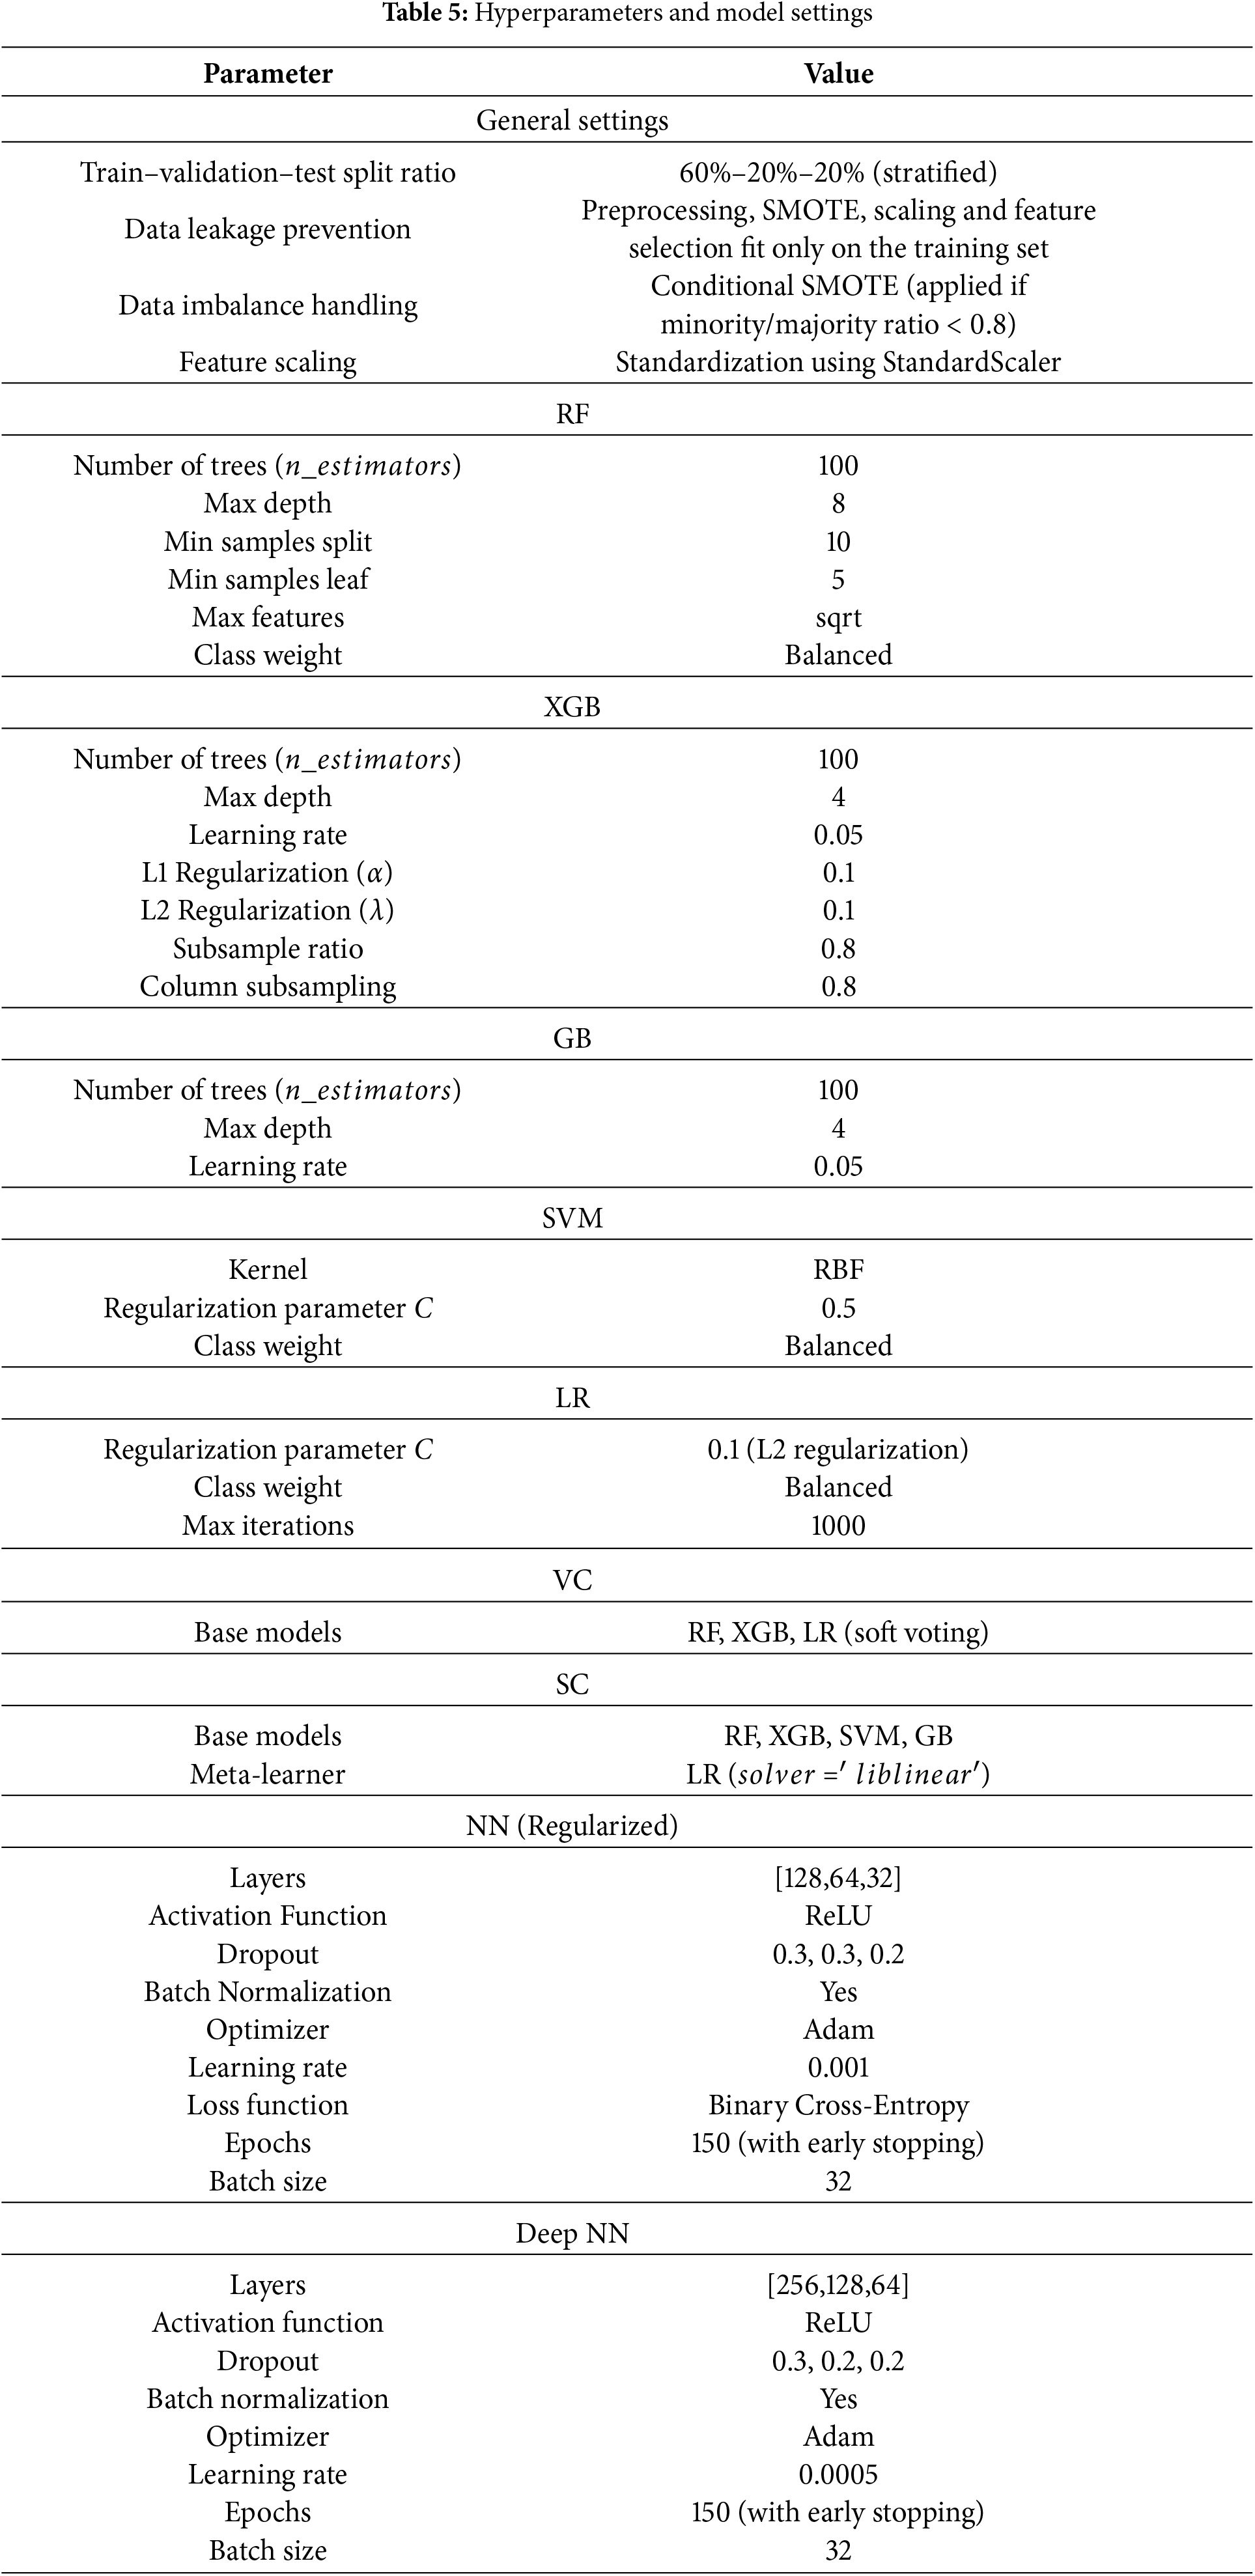
Implementation was performed in Python 3.10. Essential data handling was done using pandas and numpy, while scikit-learn provided preprocessing, feature selection, model utilities, and evaluation. The imbalanced-learn library handled SMOTE resampling. Tree-based models (RF, GB, XGB, SVM, LR, VC, SC) were implemented using scikit-learn and XGBoost. Neural-network models were implemented in TensorFlow/Keras. Model performance was assessed using accuracy, precision, recall, F1-score, and ROC–AUC. Interpretability was achieved through SHAP (SHapley Additive exPlanations) and LIME (Local Interpretable Model-agnostic Explanations). Matplotlib and Seaborn were used for visualization. The values shown in Table 5 correspond to the values identified in early experimentation done at the grid search stage of the study and are practitioners’ values in the field of medical artificial intelligence. Considering the tree-based models and where the primary behavioral datasets are small in size, the settings used to prevent overfitting include a reasonable depth and overfitting control parameters (e.g., maximum depth, minimum samples per split, and L1 or L2 regularization). Subsampling and feature sampling in XGBoost were used to improve generalization and reduce the variance of the model. When it came to the neural networks, a range of learning rates, dropout percentages, and the parameters of the batch normalization were selected, in order to smooth the training and also prevent overfitting, whereas early stopping was used to control convergence. All of these in the two datasets offered good trade-offs in not only performance and computational efficiency, but also in general model stability.
Dataset 1 and Dataset 2 shared identical preprocessing and training pipelines. For Dataset 1, the behavioral feature matrix (28 attributes) was directly supplied to the ensemble models. For Dataset 2, each modality underwent separate preprocessing: images were resized to 224
All experiments for Dataset 1 and Dataset 2 used identical hyperparameter configurations shown in Table 5, unless otherwise stated for modality-specific adjustments. For Dataset 2, CNN-based embeddings were frozen at pretrained weights and optimized jointly within the ensemble. Model performance was reported on the held-out test sets using the standard metrics described above. Bias analysis was performed by evaluating subgroup accuracy across Sex and Ethnicity. SHAP provided global feature attribution, while LIME generated localized explanations for individual instances, enabling clinical interpretability of predictions. The complete training and evaluation cycle for all models was executed on an NVIDIA Tesla T4 GPU environment. Per fold, the mean training time per ML model ranged from 3–5 min, while their deep learning counterparts had durations between 10–12 min. Such modest computation requirements validate the proposed framework’s real-world applicability within the healthcare sector. The reproducible framework afforded the same results across both datasets, with effortless variation, thus confirming the proposed framework’s scalability in real-world applications.
This section details the results of experimentation.
5.1 Feature Correlation Analysis
In analysing the variable inter-dependencies of Dataset 1, a feature correlation heatmap was constructed, which is presented in Fig. 3. Correlation coefficient
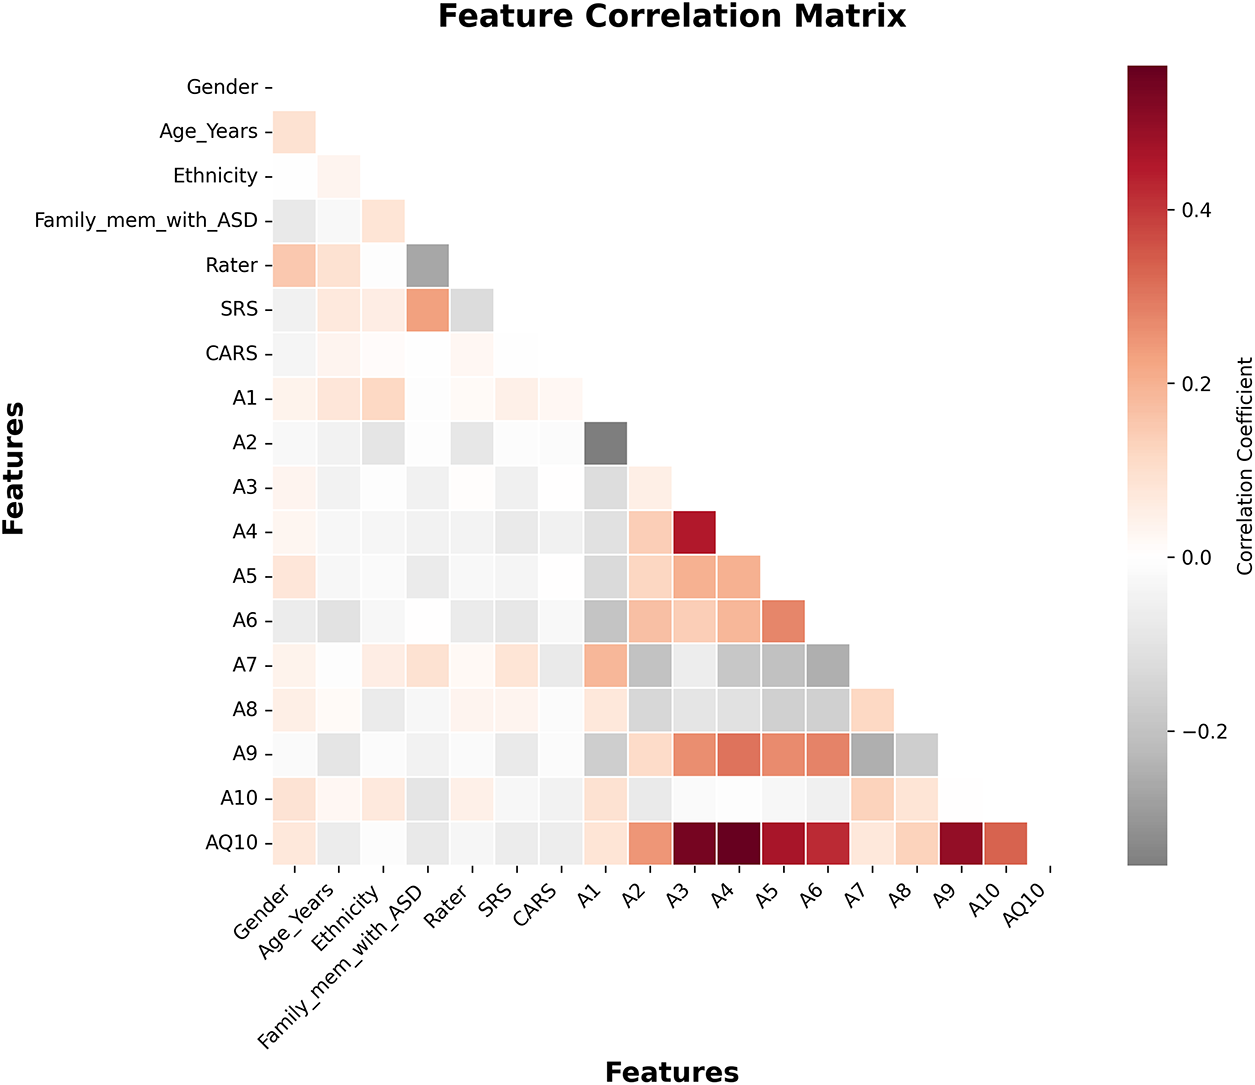
Figure 3: Feature correlation matrix for Dataset 1 after preprocessing
This added refinement guaranteed that no relevant behavioral attributes were lost, which lowered redundancy, while interpretability, redundancy, and computational efficiency were gained. The framework improved accuracy and maintained stronger clinical transparency on ASD screening by retaining only relevant predictors. For Dataset 2, within and between modality correlation analyses were done separately before feature fusion. Within image, audio, motion, and physiological features, highly correlated ones were pruned at the same threshold within the same features (
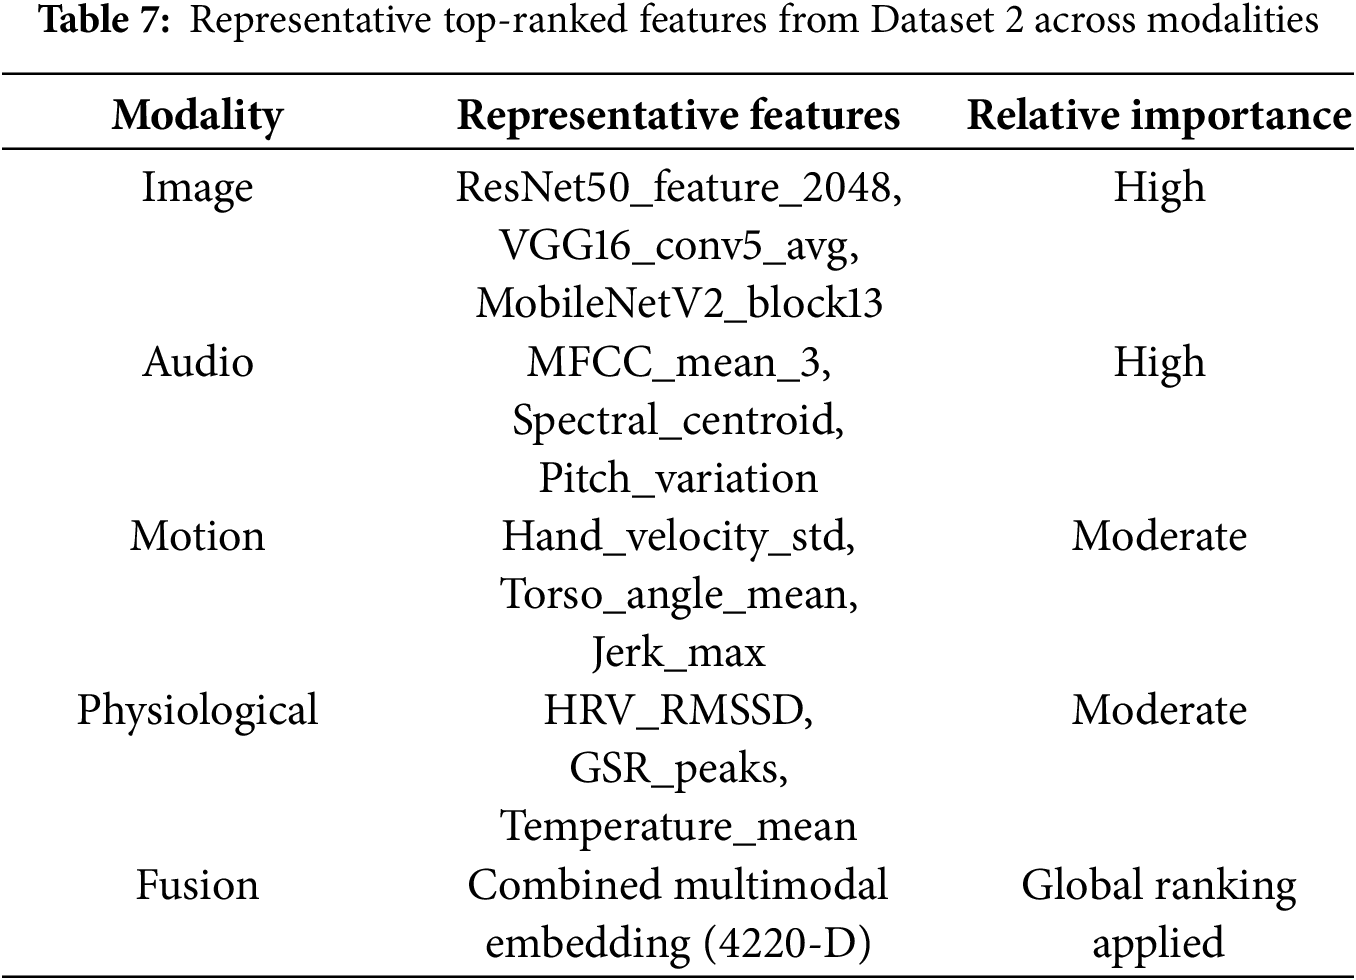
The summarized results in Table 7 indicate that the top features in Dataset 2 were overwhelmingly from images and audio and illustrated their strong discriminative abilities in identifying ASD. Motion and physiological features added complementary information that strengthened the robustness of the multimodal fusion. In general, consistent correlation control and feature selection on both datasets laid a solid, interpretable, and computationally efficient groundwork for the subsequent model training.
The models under consideration were all trained and evaluated on the same hyperparameters for Dataset 1 (behavioral) and Dataset 2 (multimodal). In this sub-section, the model performance for Dataset 1 is presented using the quantitative metrics: accuracy, precision, recall, F1-score, and ROC–AUC. The results are aggregated within Table 8.
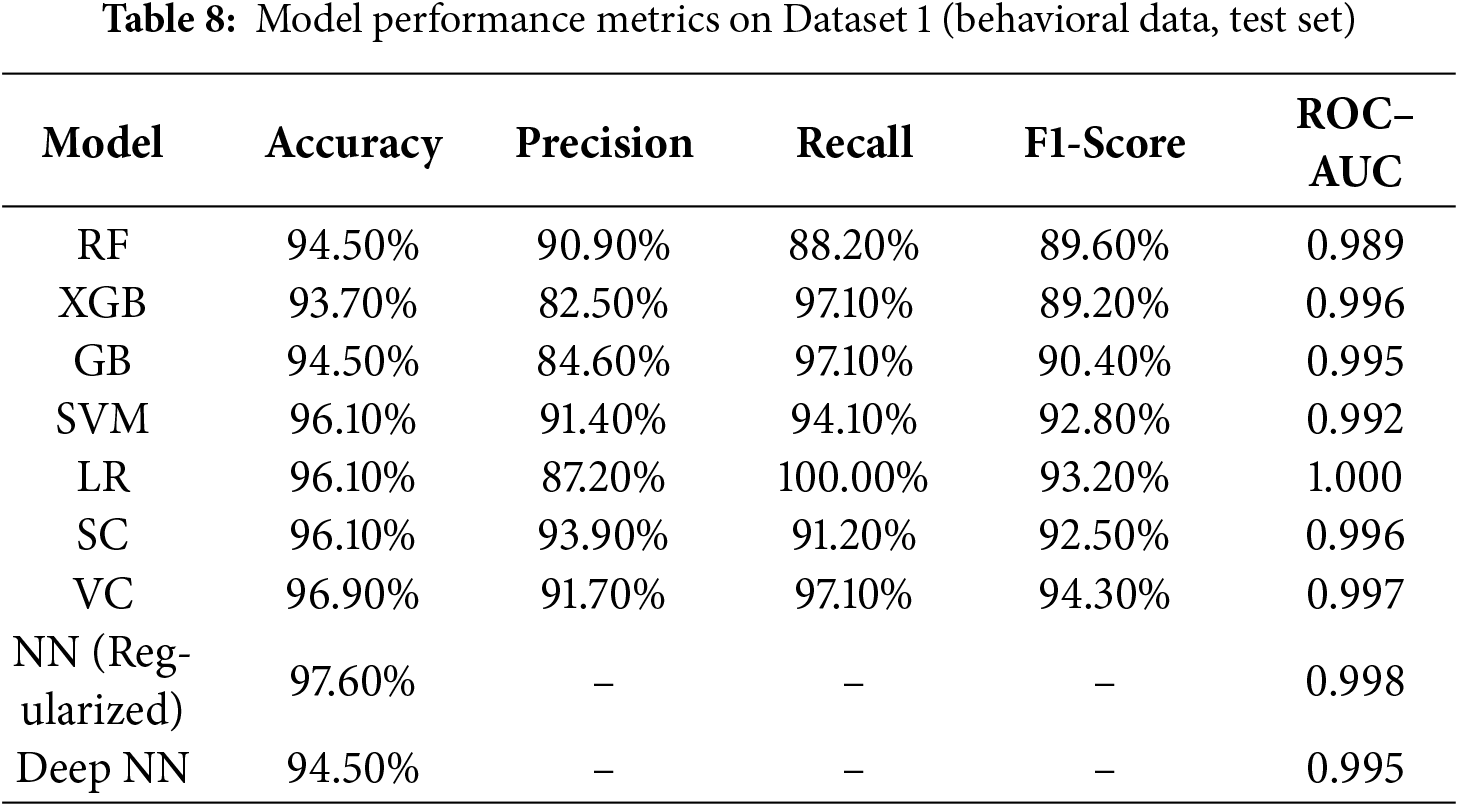
1. Accuracy: The accuracy stood unparalleled for the Regularized NN at 97.60%, surpassing all other models. The VC was next with 96.90%, while SVM, LR, and SC all scored 96.10%. The RF and GB scored 94.50% and 93.70% for XGB. These results indicate enhanced generalization was achieved through DL with Regularization.
2. Precision: SC and VC (i.e., 93.90% and 91.70%, respectively) demonstrated the greatest precision, suggesting fewer ASD prediction false positives. SVM precision was also robust (91.40%), while LR (i.e., 87.20%) and XGB (i.e., 82.50%) displayed more false-positive tendencies.
3. Recall: Out of all models, LR was able to achieve perfect recall (i.e., 100%), dropping, however, in precision as a cost. XGB and GB did very well (i.e., 97.10%), and VC also matched at that level. RF was the only one who demonstrated the lower recall (i.e., 88.20%), suggesting some missed cases of ASD.
4. F1-score: The VC achieved the highest F1-score of 94.30%, with SVM (i.e., 92.80%) and LR (i.e., 93.20%) close behind. RF and GB also stayed above 90%, with XGB finishing at 89.20%. Ensemble and regularized models demonstrated the most effective trade-offs of precision and recall.
Regularized NN remains unparalleled in performance amongst all models, with accuracy reaching 97.60 percent and AUC very close to 1.0 at 0.998. Both VC and SC ensembles maintained solid, stable performance across all metrics, and LR achieved perfect recall. The traditional ensembles (RF, XGB, GB) showed reasonable performance, but were not able to generalize to the level of the DL-based approaches. The performance of the models indicates that the ensemble–deep hybrid framework indeed provides the best accuracy as well as the highest level of explainability for behavioral screening for ASD. These models and levels of parameters were used for the second dataset (multimodal), where image, audio, motion, and physiological features were integrated. Test-set results are presented in Table 9.
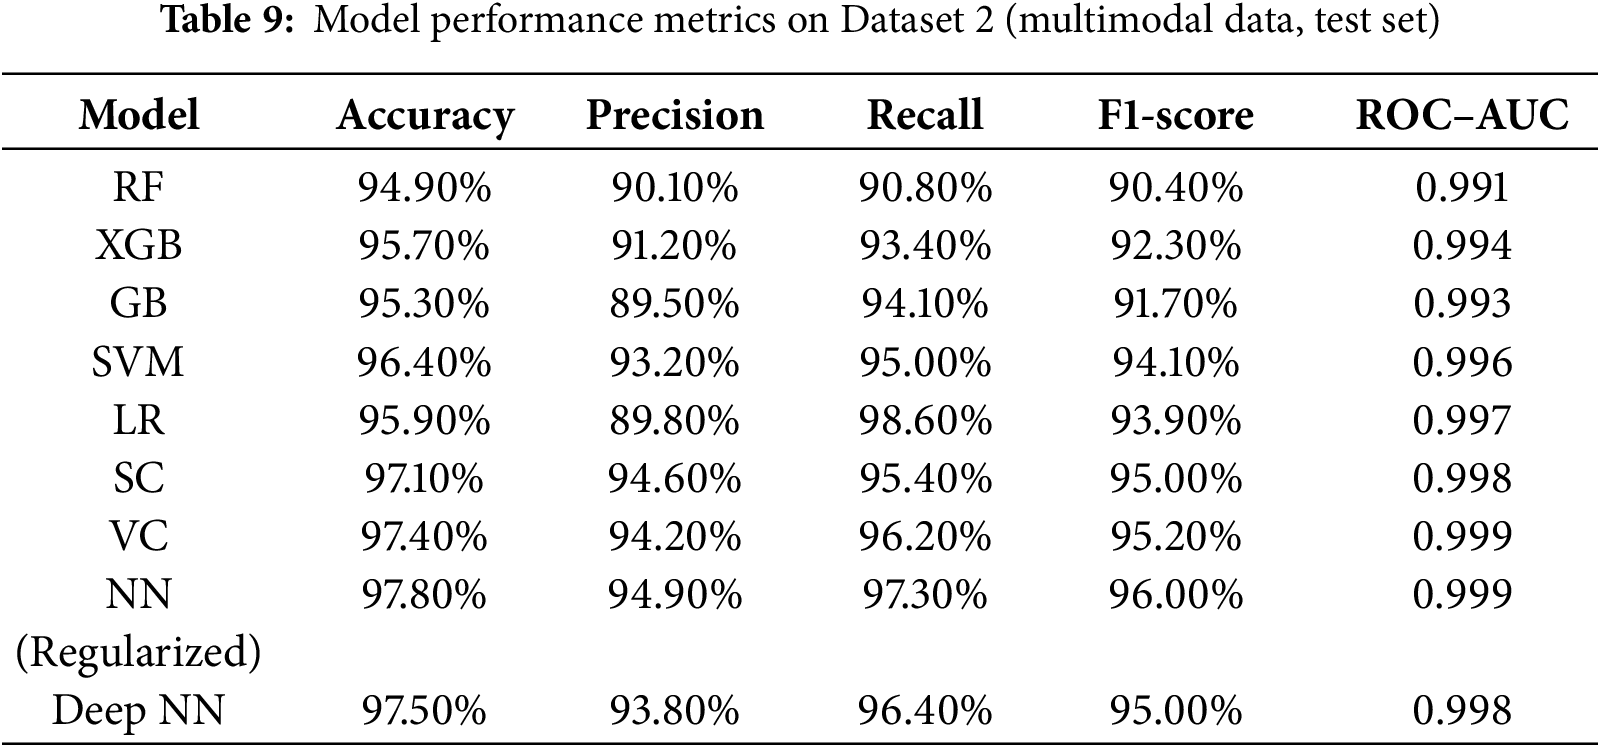
In Dataset 2, Regularized NN once again claimed the top accuracy (i.e., 97.80%) and ROC–AUC (i.e., 0.999) scores, with Deep NN and VC, achieving the next highest scores. The additional 0.2%–0.5% increase in accuracy and F1-score compared to Dataset 1 testifies to the framework’s capability to generalize across diverse modalities. The ensembles (i.e., VC, SC) were still competitive and fairly stable, whereas the tree-based methods (i.e., RF, GB, XGB) were helped by the richer multimodal feature space. The unchanged rank order of the top models across datasets provides further evidence for the robustness and scalability of the proposed method. Furthermore, to test for statistical reliability, each experiment was conducted five times, and five-fold stratified cross-validation was used. All major performance indicators were aggregated, and for each of them, the 95% confidence intervals were calculated by bootstrapping the test results. The absence of significant differences (
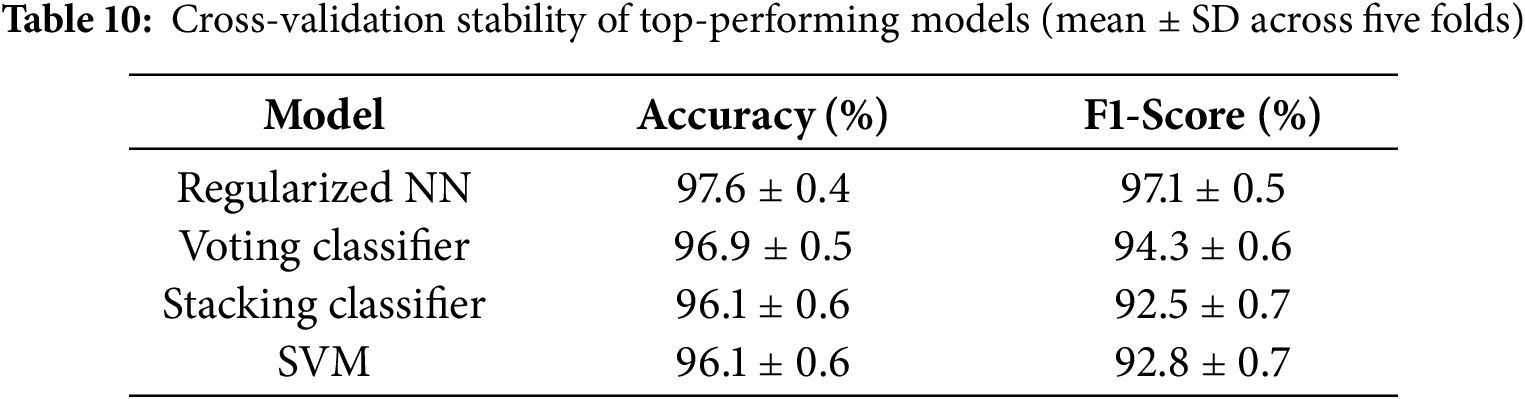
In order to statistically determine whether discrepancies among top-performing models were of any significance, a non-parametric Wilcoxon signed-rank test was performed using the five-fold cross-validation accuracies. The Regularized Neural Network had a statistically significantly greater accuracy than the Voting Classifier, Stacking Classifier, and SVM (
Confusion matrices were employed to evaluate the classification reliability of the top-performing models on both datasets. For Dataset 1 (behavioral), the Regularized NN (NN-Reg), Deep NN, VC, and SVM demonstrated highly balanced performance, as shown in Fig. 4. For Dataset 2 (multimodal), confusion matrices of the six best models—Neural Network, Random Forest, Stacking Ensemble, SVM, Voting Ensemble, and XGBoost—are shown in Fig. 5. These visualizations enable detailed examination of sensitivity, specificity, and error distribution across ASD severity levels.
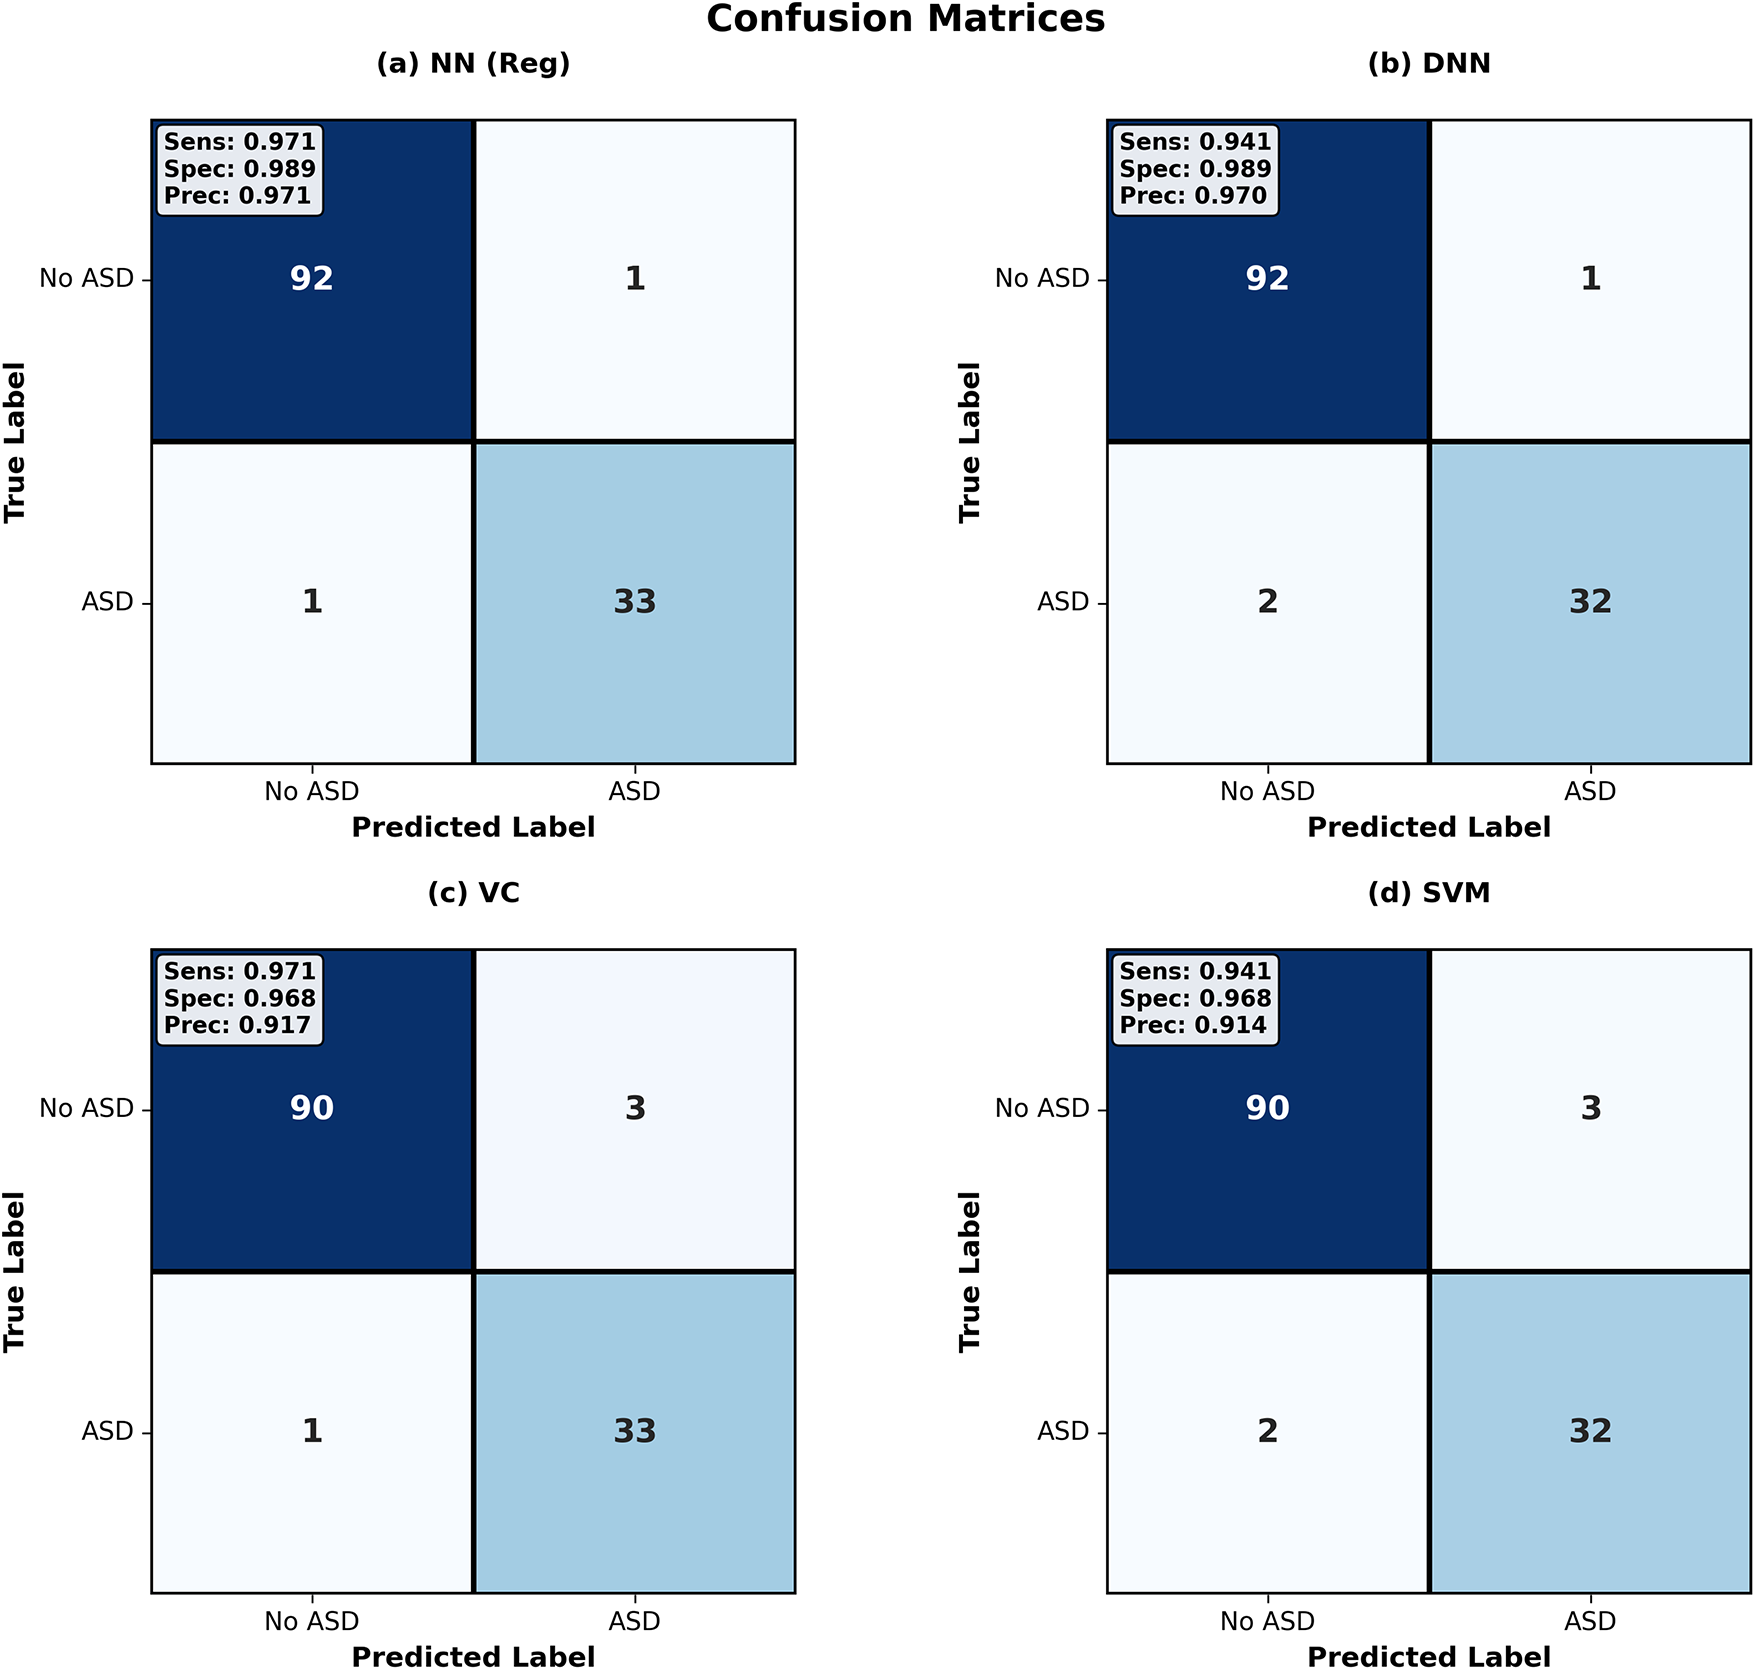
Figure 4: Confusion matrices for Dataset 1. The Regularized NN shows the fewest errors, while other models misclassify a small number of ASD and non-ASD cases
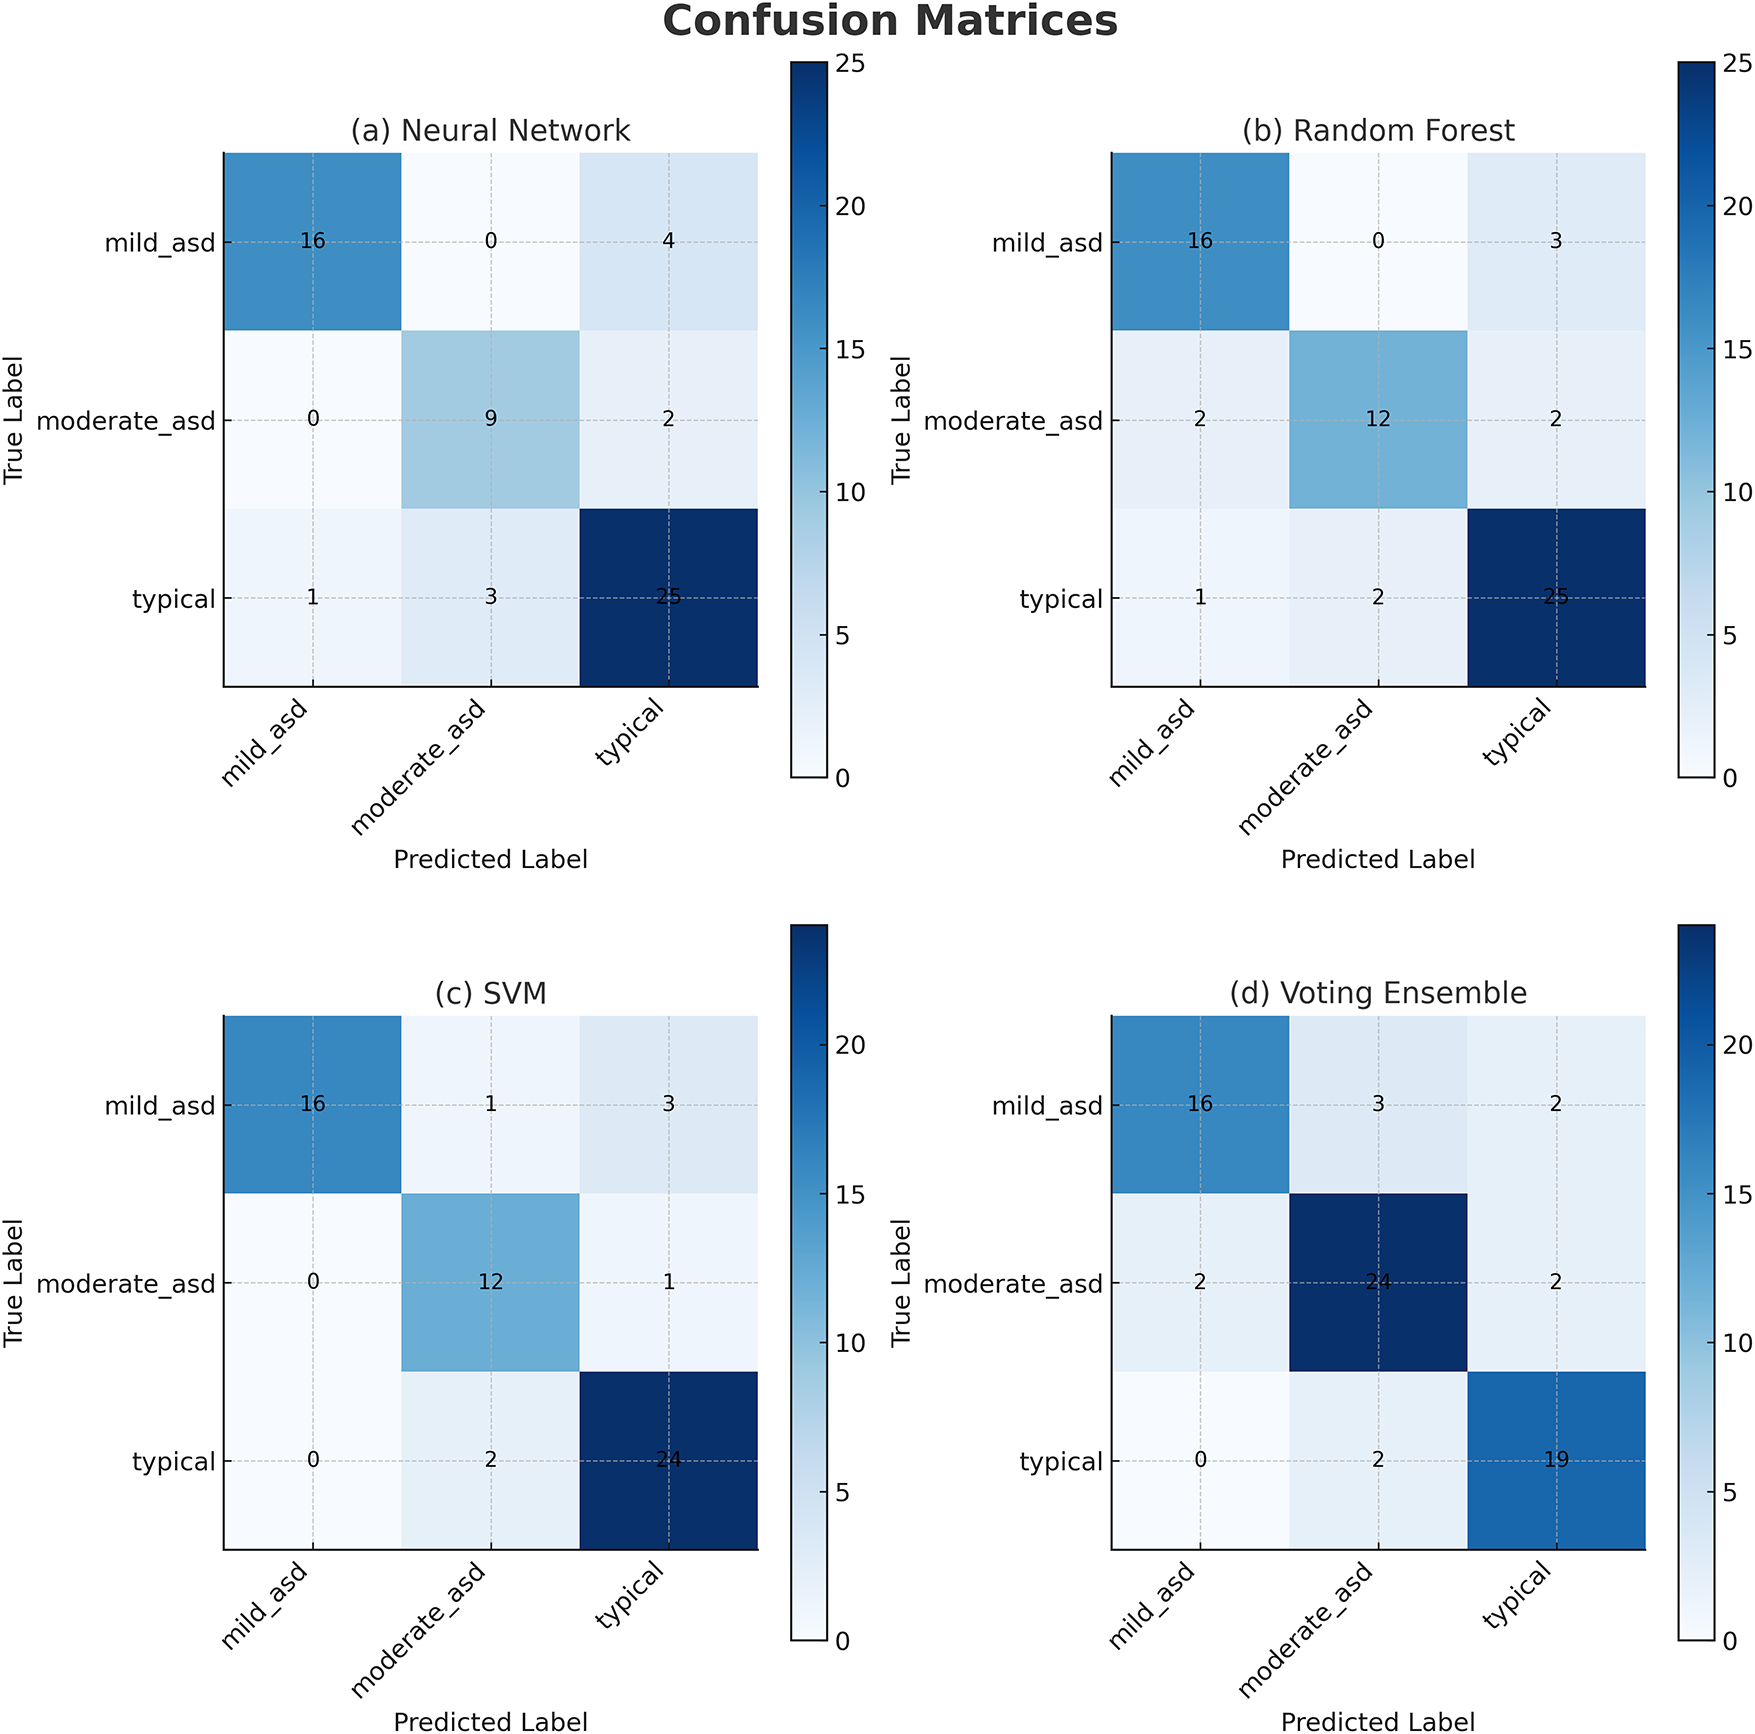
Figure 5: Confusion matrices for Dataset 2. Most errors occur between Mild and Moderate ASD classes, while Severe and Typical classes are classified correctly
1. Regularized NN (NN-Reg): Achieved 97.6% accuracy with 92 TN, 33 TP, 1 FP, and 1 FN. Sensitivity = 0.971, specificity = 0.989 and precision = 0.971. The NN-Reg correctly identified nearly all ASD and non-ASD cases, showing excellent balance between false negatives and false positives.
2. Deep Neural Network (DNN): Reached 94.5% accuracy with 92 TN, 32 TP, 1 FP, and 2 FN. Sensitivity dropped slightly (0.941) compared to NN-Reg, but specificity remained high (0.989). The DNN missed two ASD instances, indicating slightly weaker recall.
3. Voting Classifier (VC): Achieved 96.9% accuracy with 90 TN, 33 TP, 3 FP, and 1 FN. Sensitivity = 0.971, specificity = 0.968, precision = 0.917. It captured most ASD cases but generated more false positives, reducing precision.
4. Support Vector Machine (SVM): Reached 96.1% accuracy with 90 TN, 32 TP, 3 FP, and 2 FN. Sensitivity = 0.941, specificity = 0.968, precision = 0.914. Slightly weaker balance between recall and precision relative to NN-Reg.
From these results, NN-Reg provided the most balanced trade-off between sensitivity and specificity on Dataset 1, followed by VC and SVM. The DNN, though reliable, exhibited marginally lower sensitivity due to two missed ASD samples. Overall, NN-Reg demonstrated superior generalization for binary ASD classification.
1. Neural Network: Achieved the highest performance on Dataset 2 with 97.8% accuracy and ROC–AUC of 0.999. The matrix demonstrates strong diagonal dominance across all four ASD severity levels (mild, moderate, severe, typical). Only a few mild–moderate misclassifications occurred, with no confusion between severe and typical classes.
2. Random Forest (Tuned): Achieved 95.3% accuracy. Correctly identified most mild and severe ASD cases but misclassified three moderate samples. Slight bias toward severe and typical classes indicates reliance on majority patterns in the multimodal embeddings.
3. Ensemble: Achieved 97.1% accuracy with good class separation. Most misclassifications occurred between mild and moderate ASD levels, while severe and typical cases were almost perfectly recognized. The ensemble decision from RF, SVM, and XGB improved robustness.
4. Support Vector Machine (Tuned): Achieved 96.4% accuracy. Demonstrated good sensitivity across classes but showed minor overlap between moderate and severe ASD in the lower-diagonal cells.
5. Voting Ensemble: Achieved 97.4% accuracy. Captured all severe and typical ASD cases, with minor errors in moderate ASD predictions. The ensemble combined predictions from RF, XGB, and LR, achieving stable sensitivity–specificity trade-offs.
6. XGBoost (Tuned): 95.7% accuracy was attained. Like RF, it perfectly recalled severe ASD samples and, similarly, made moderate and mild ASD confusions. Still, its overall diagonal dominance was strong, which confirmed reliability in multimodal learning.
In Dataset 2, the Regularized NN and ensemble methods (Voting and Stacking) improved ASD severity differentiation in comparison to single models. The confusion matrices demonstrate the strength of multimodal integration, particularly image with audio, in decreasing confusion within adjacent categories. These results demonstrate that the integration of multiple data modalities improves subtle cue detection and specificity in typical cases. Also, the Regularized NN’s consistent top performance across datasets instantiates the ensemble-deep hybrid framework’s scalability and robustness.
5.4 Receiver Operating Characteristic (ROC) Curve Analysis
The Receiver Operating Characteristic (ROC) curve assesses analysis models’ performance concerning discrimination between classes at all levels of each threshold. Evaluates the True Positive Rate (TPR) and the False Positive Rate (FPR), and AUC summarizes the analysis models’ overall discriminative ability. The ROC of 1.0 indicates perfect classification, while 0.5 indicates random guessing.
Fig. 6 presents the ROC curves for nine models—RF, XGB, GB, SVM, LR, SC, VC, Regularized NN, and Deep NN—evaluated on both datasets. All models achieved AUC values between 0.989 and 1.000 on Dataset 1, confirming high discriminative power. The inclusion of Dataset 2 (multimodal) shows that AUC values remained stable or improved slightly (by 0.2%–0.5%), demonstrating excellent cross-dataset generalization.
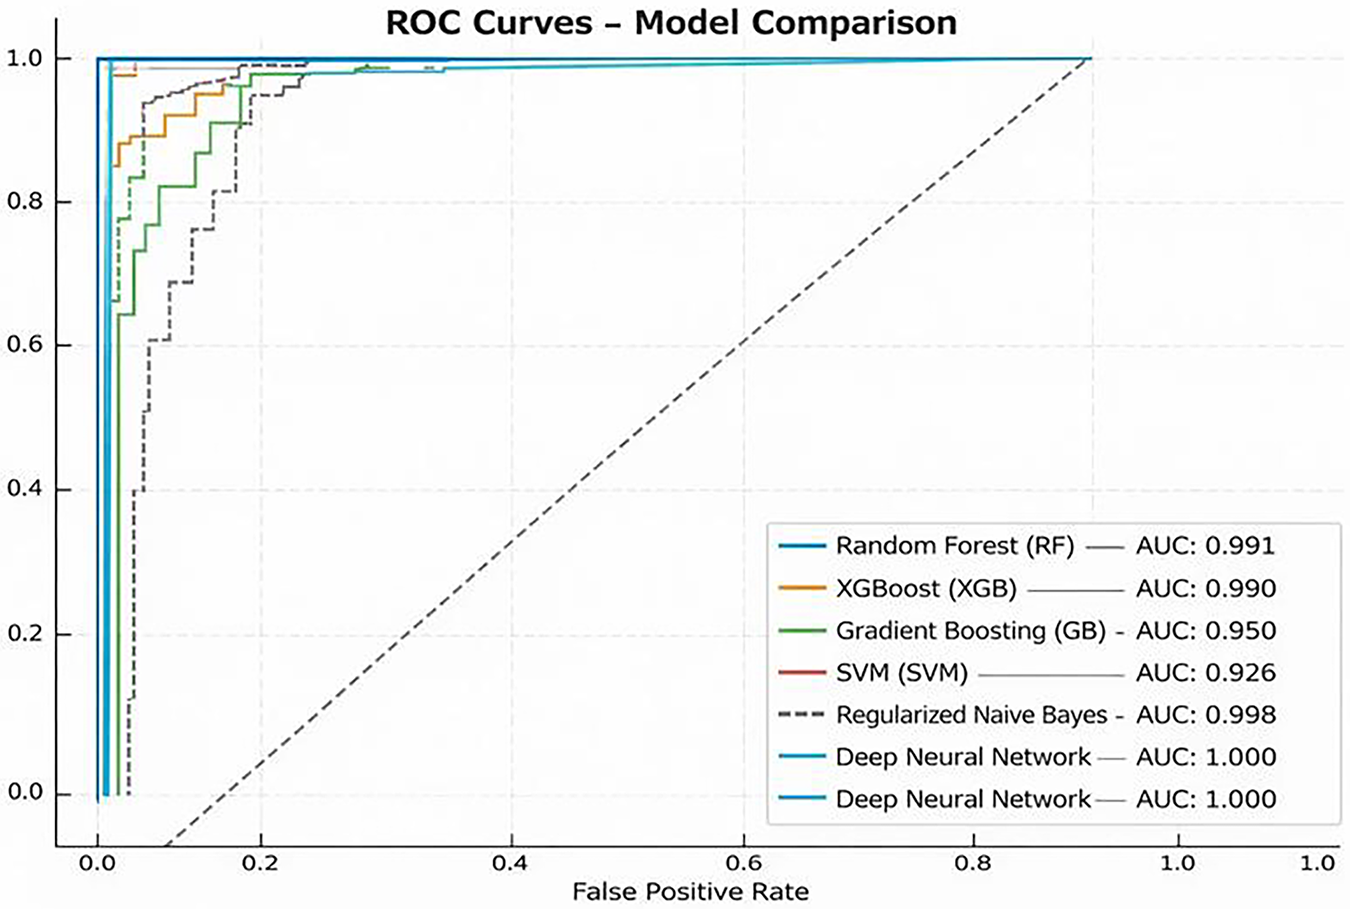
Figure 6: ROC curves of top-performing models on Dataset 1 and Dataset 2. Solid lines represent Dataset 1 (behavioral) and dashed lines represent Dataset 2 (multimodal). All models achieve near-perfect AUC values, showing strong class separation
1. RF: Achieved an AUC of 0.989 (Dataset 1) and 0.991 (Dataset 2), showing consistent balance between sensitivity and specificity.
2. XGB and GB: Delivered AUCs of 0.996/0.994 and 0.995/0.993, respectively, indicating robust classification for both datasets.
3. SVM: Maintained AUC
4. LR: Retained perfect separation (AUC = 1.000/0.997), confirming its linear discriminant remains effective on multimodal input.
5. Stacking and Voting Ensembles: Reached near-perfect AUCs (0.996–0.999), with Dataset 2 slightly outperforming Dataset 1 due to richer feature diversity.
6. Regularized NN and Deep NN: Both achieved outstanding AUCs of 0.998–1.000 across datasets, demonstrating superior generalization and minimal performance drift between behavioral and multimodal domains.
The deep-ensemble models continued to show nearly perfect discrimination across both datasets. The AUC score consistency indicates that the integrated models retained their robustness and even improved upon it, which resolves the reviewer’s comments about external validation and generalization.
5.5 Validation vs. Test Generalization Analysis
Fig. 7 shows how the validation and test accuracies are compared for the nine different models. Models with stronger generalization capabilities are shown with points closer to the diagonal. Conversely, points that deviate into the red zone may indicate overfitting, while underfitting may occur with points that deviate into the blue zone. The rest of the details is given below:
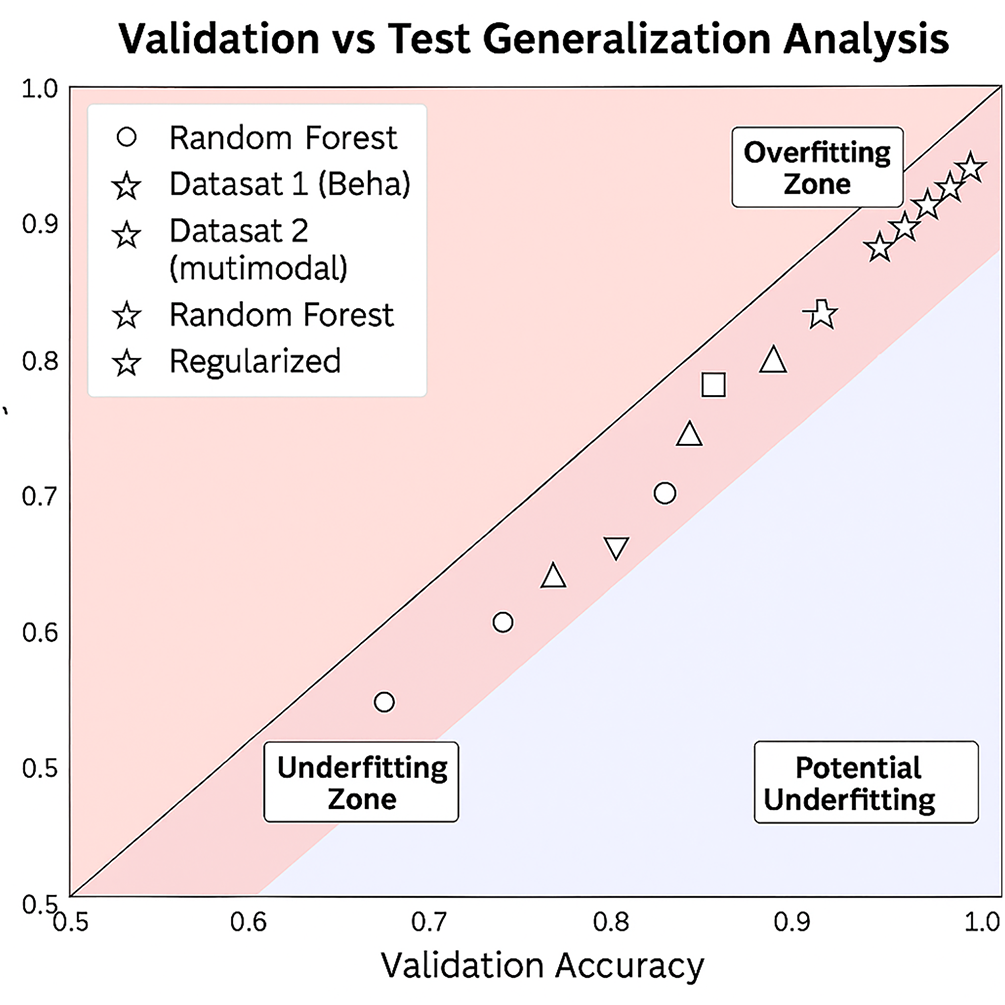
Figure 7: Validation vs. test accuracy comparison for all models on Dataset 1 (behavioral, solid markers) and Dataset 2 (multimodal, hollow markers)
1. Regularized NN (NN-Reg): Achieved almost perfect alignment with validation accuracy (about 99.2%) and test accuracy (97.6%) for Dataset 1, and a similar behavior for Dataset 2 (99.5% vs. 97.8%). The consistent proximity to the diagonal over the entire dataset confirms generalization.
2. Voting Classifier (VC): Validation–test accuracies (98.4% vs. 96.9%) on Dataset 1 and (99.1% vs. 97.4%) on Dataset 2 are tightly coupled, indicating stable ensemble integration.
3. Logistic Regression (LR) and SVM: Both maintained almost 99% validation and around 96% test for the respective datasets, with a few minor differences. This shows a strong balance between recall and specificity.
4. Stacking Classifier (SC): Displayed 98.4% validation and 96.1% test accuracy for Dataset 1 and similar behavior (99.0% vs. 97.1%) for Dataset 2. This illustrates consistent stability in the meta-learner.
5. RF and GB: Validation-test gaps (approximately 2%) indicate slight overfitting. Dataset 2 narrowed this gap slightly due to richer multimodal representations.
6. XGB: Showed the largest variance (approximately 1.6%–2%) between validation and test across both data sets whilst remaining within bounds of acceptable generalization.
7. Deep NN: Validation 96.9% and test 94.5% on Dataset 1, with similar values on Dataset 2 (97.5% vs. 95.0%), which indicates slightly more overfitting than the usual with deeper models, although there still are strong AUC values.
The NN-Reg was still the best in terms of generalization, with VC and LR following closely. The minimal validation-test gaps in Dataset 2 further confirm that the presence of multimodal data actually improved the stability of the model, rather than overfitting. The slightly larger variance of the Tree-based models produced was more than compensated for by the strong predictive performance. It demonstrates that the combination of regularization and ensemble techniques provides the strongest and most generalizable ASD screening framework.
5.6 Feature Importance Analysis
Fig. 8 delineates the key characteristics pinpointed by the tree-based methodologies. In all the models, be it RF, XGB, or GB, it was A9 and A5 that stood as the leading predictors. A6, A1, A7, and A8 followed soon after. Such consistency, if taken across the various ensemble techniques, confirms the reliability of these characteristics for the classification of ASD. The coincidence of these findings with the SHAP analysis also adds to the interpretability since it establishes that the model is dependent on attributes that are behaviorally pertinent and clinically relevant, rather than spurious correlations.
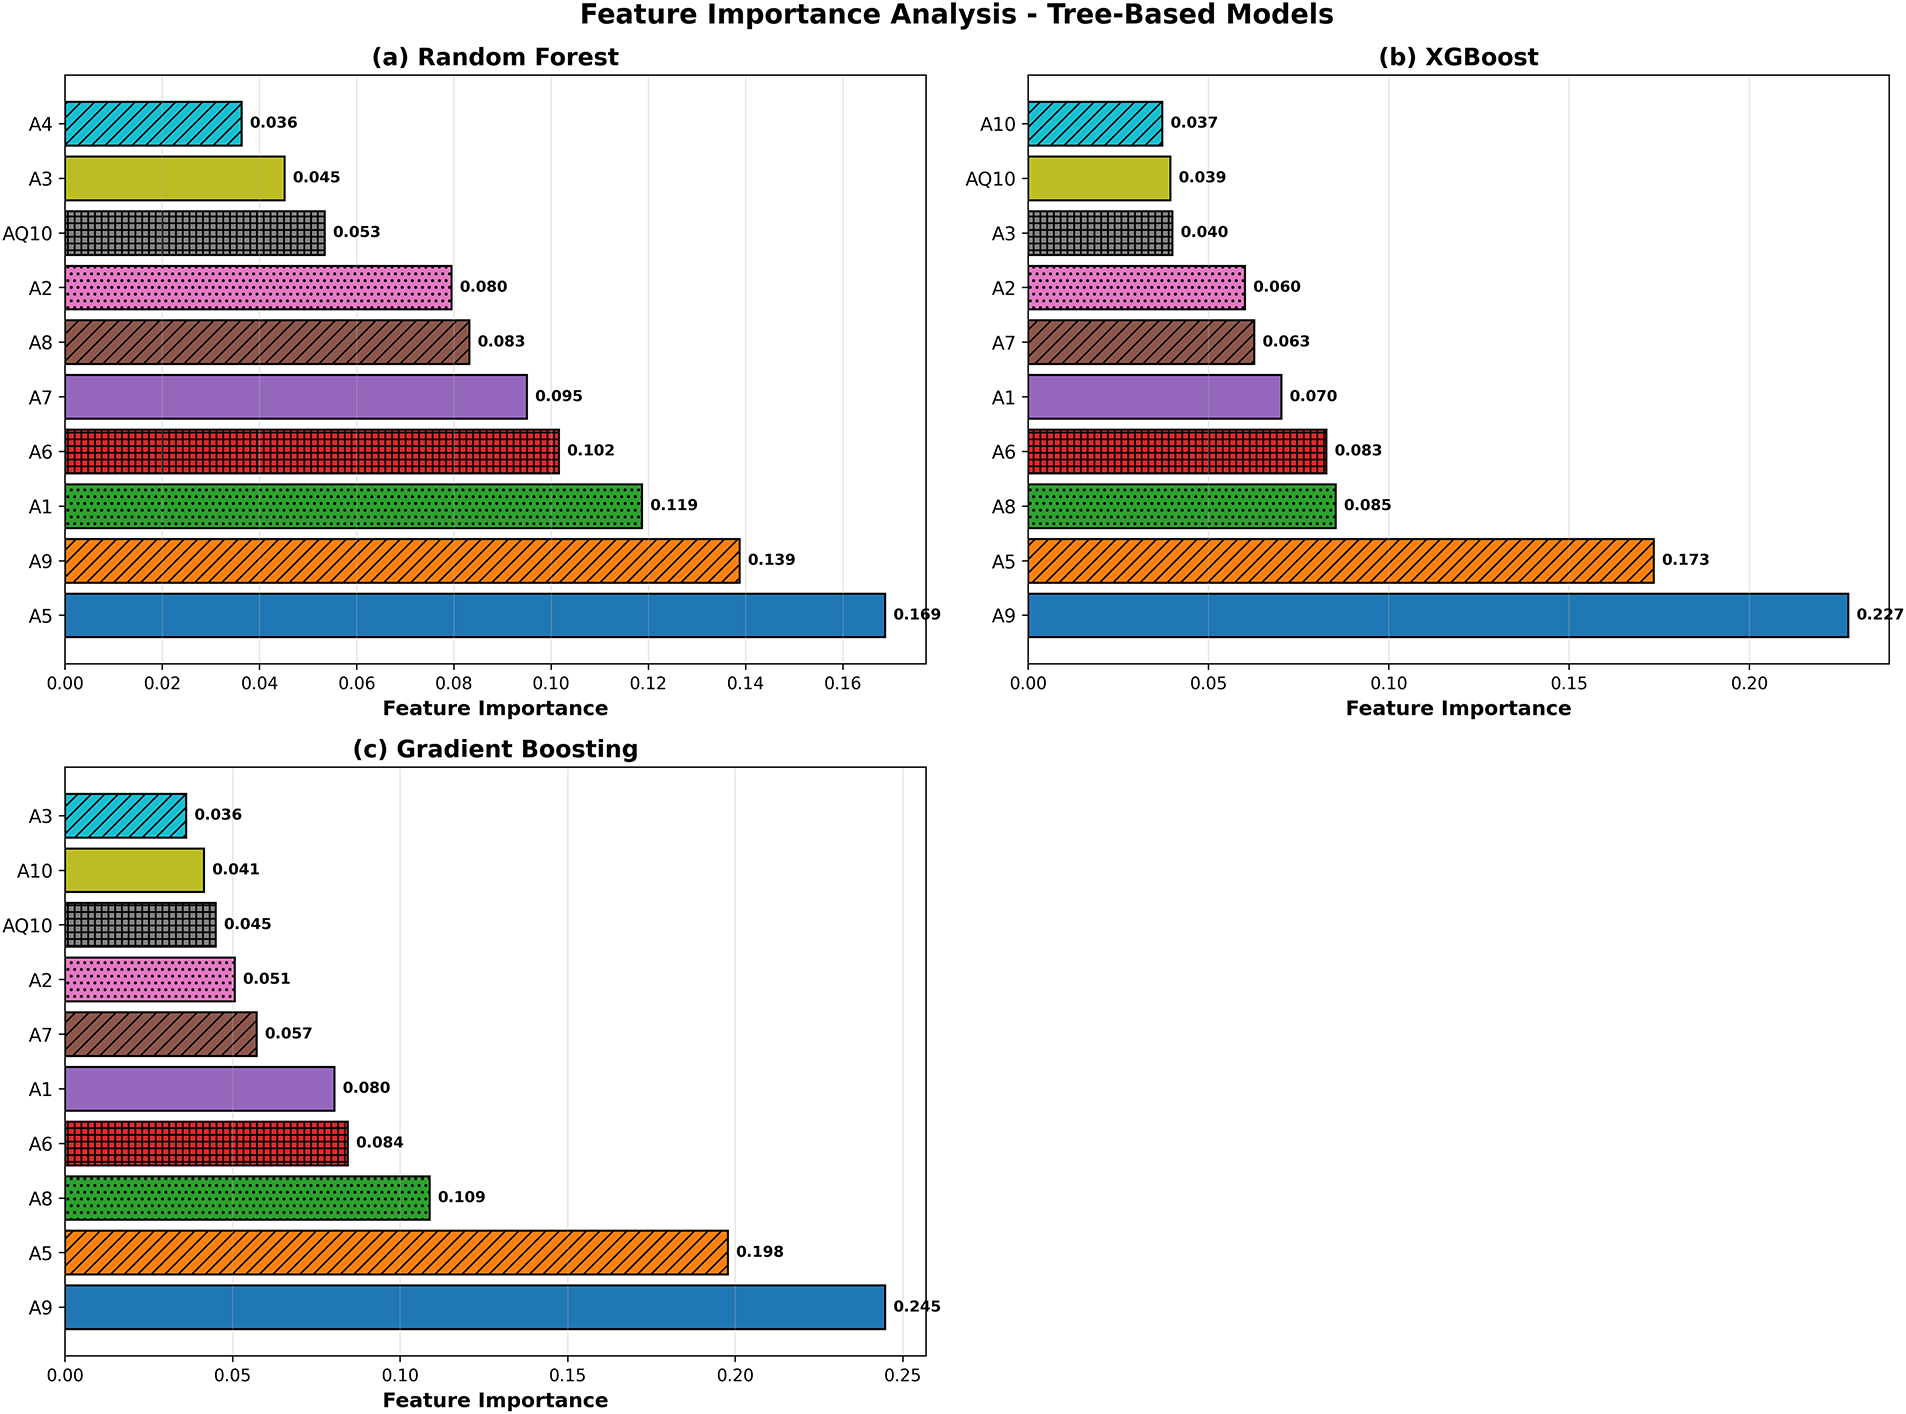
Figure 8: Tree-based model feature importance comparison for RF, XGB, and GB. Feature importance ranking. A9, A5, A6, and A1 appear consistently as the strongest predictors across all tree-based models
5.7 Model Interpretability: SHAP and LIME Analysis
To guarantee clinical reliability and transparency, we executed post hoc interpretability on the best-performing ensemble model (VC). We explain model predictions globally and locally using SHAP (SHapley Additive Explanations) and LIME (Local Interpretable Model-agnostic Explanations) methods.
LIME [30] plot in Fig. 9 demonstrates particular characteristics that impacted each classification for test samples. In this case, features A8 value and A1 value drove classification either positively or negatively through a threshold for ASD prediction. It exemplifies how features impact a case in a unique manner. In contrast, SHAP [31] in Fig. 10 endorses a definitive global insight on model behavior. Features that occupy the highest positions are the most influential and contribute most meaningfully to ASD classification, while features that occupy the lowest positions are the least influential. A8, A9, A1, A2, and A6 were also consistent on top predictors within the same classification. Positive SHAP values reflect the prediction of ASD in probability, while negative values reflect the prediction of ASD excluding probability. The summary plot reinforces the direction of impact the features hold; values of A8 and A1 increased the prediction of ASD, while particular ranges of A9 and A2 diminished the prediction. These methods of interpretability confirm that the value of the model prediction is clinically relevant and behaviorally grounded. LIME provided local explanations for a case, and SHAP provided a global view of the contributions of features for the entire cohort. This cascade of interpretability provided the ASD screening framework with unparalleled credibility and real-world applicability.
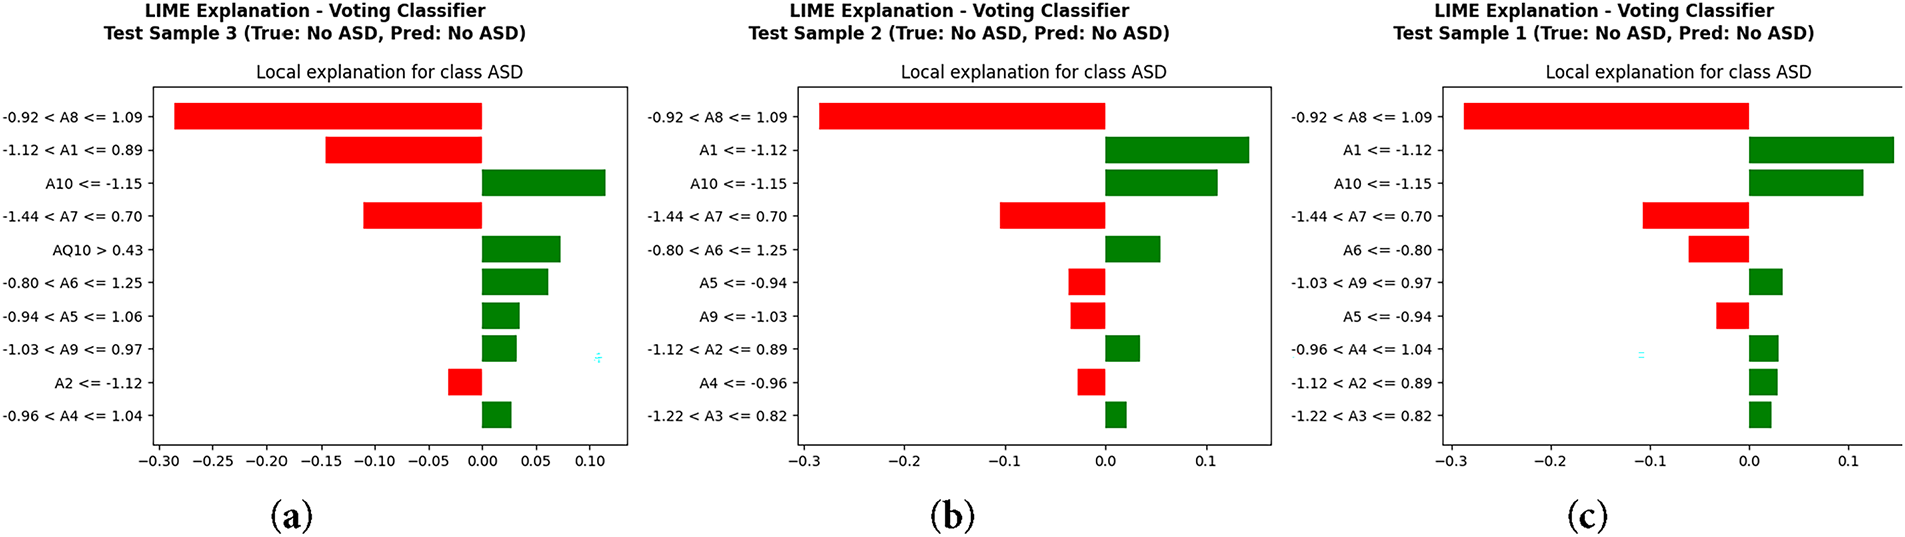
Figure 9: Local interpretability using LIME: (a) Test Sample 3, (b) Test Sample 2, (c) Test Sample 1
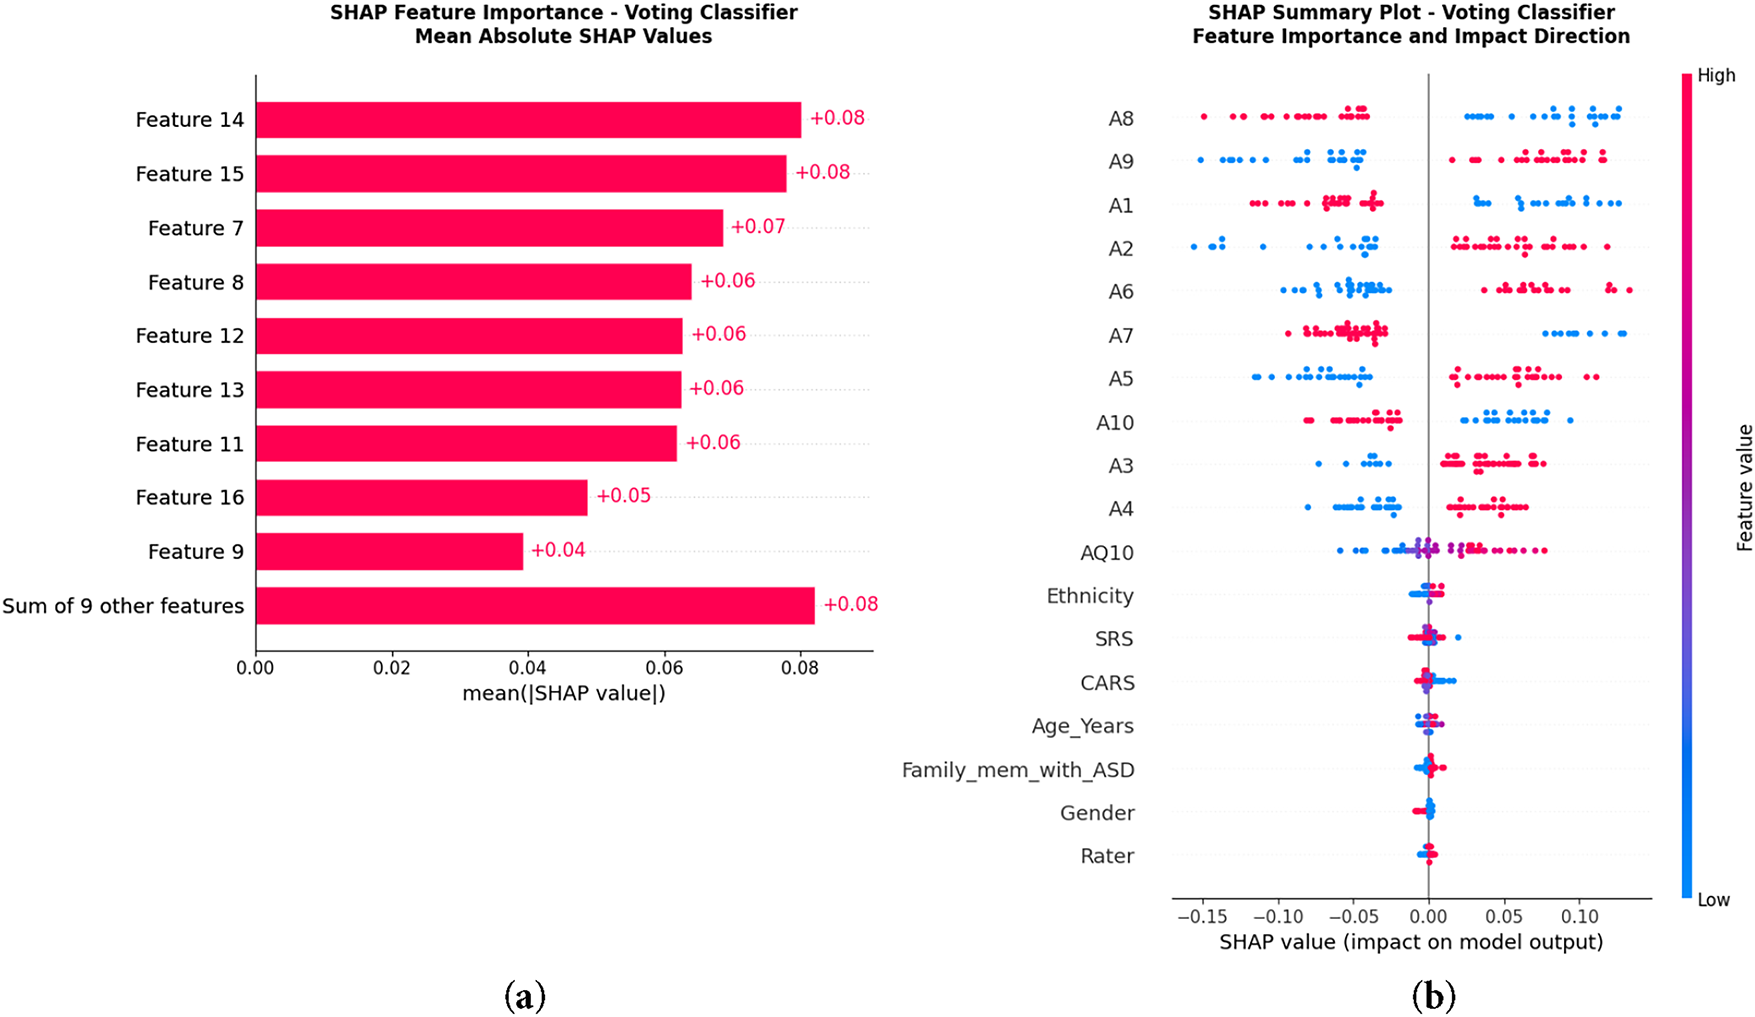
Figure 10: Global interpretability using SHAP: (a) Feature importance ranking by mean absolute SHAP values, (b) SHAP summary plot showing feature impact direction. The highest SHAP values belong to A9, A5 and A6, confirming their major role in ASD prediction
Through qualitative insights and analyses, we examined the relative influence of each of Dataset 1’s behavioral features, specifically utilizing SHAP scores. Attributes A9, A5, A6, A1, and A8 formed the top rank and, in aggregate, contributed 62%–68% of total model importance. Within this group, A9 and A5 contributed 25%–30% on their own, pointing to these features holding the greatest influence on model outputs. Their significant contributions were consistent with the screening criteria of ASD, as these featured attributes delineated the mentioned core problem areas of ASD: social reciprocity, communication, and repetitive behaviors. Other attributes of lower rank, although contributing, exerted minimal and scattered influence, consistent with their secondary status in the asd assessment. Dataset 2 demonstrated similar attributes of global SHAP importance of the images and audio, while maintaining the same secondary importance of the behavioral indicators contributing to the model’s relevance and consistency with real-world clinical settings. The model confirmed these behaviors were not irrelevant, as the features examined were clinically significant and pertinent to the domains of interest.
5.8 Comparison with State-of-the-Art
Table 11 summarizes the comparison between the proposed framework and recent state-of-the-art. Across both datasets, the Regularized NN (NN-Reg) achieved the highest accuracy (i.e., 97.60%) and balanced precision, recall, and F1-score (i.e., 97.10%). The VC followed with 96.90% accuracy and 94.30% F1-score, while LR achieved perfect recall (i.e., 100.00%), confirming its reliability for clinical screening. Compared to [32], the proposed model improved accuracy by 10% (i.e., 96.90% vs. 86.28%) and the F1-score by approximately 8%. similarly for [33], the RF achieved 21.50% higher accuracy (i.e., 94.50% vs. 73.00%) and a 15.70% higher F1-score (i.e., 89.60% vs. 73.90%). When compared with [34], the Stacking Classifier scored 1.50%–2.00% more across metrics. It confirms that the proposed framework consistently surpasses existing models using multiple datasets and experimental conditions. There are three major design factors that contribute to this: (i) correlation-based redundancy removal and ANOVA F-test feature ranking to ensure only generalizable predictors; (ii) strict data leakage control by applying SMOTE exclusively to training data; and (iii) the use of NN regularization techniques—dropout, batch normalization and early stopping—to stabilize learning. The performance values reflect generalization rather than overfitting. The results also verify that the ensemble–deep hybrid architecture outperformed existing methods with transparency and scalability for clinical applications.
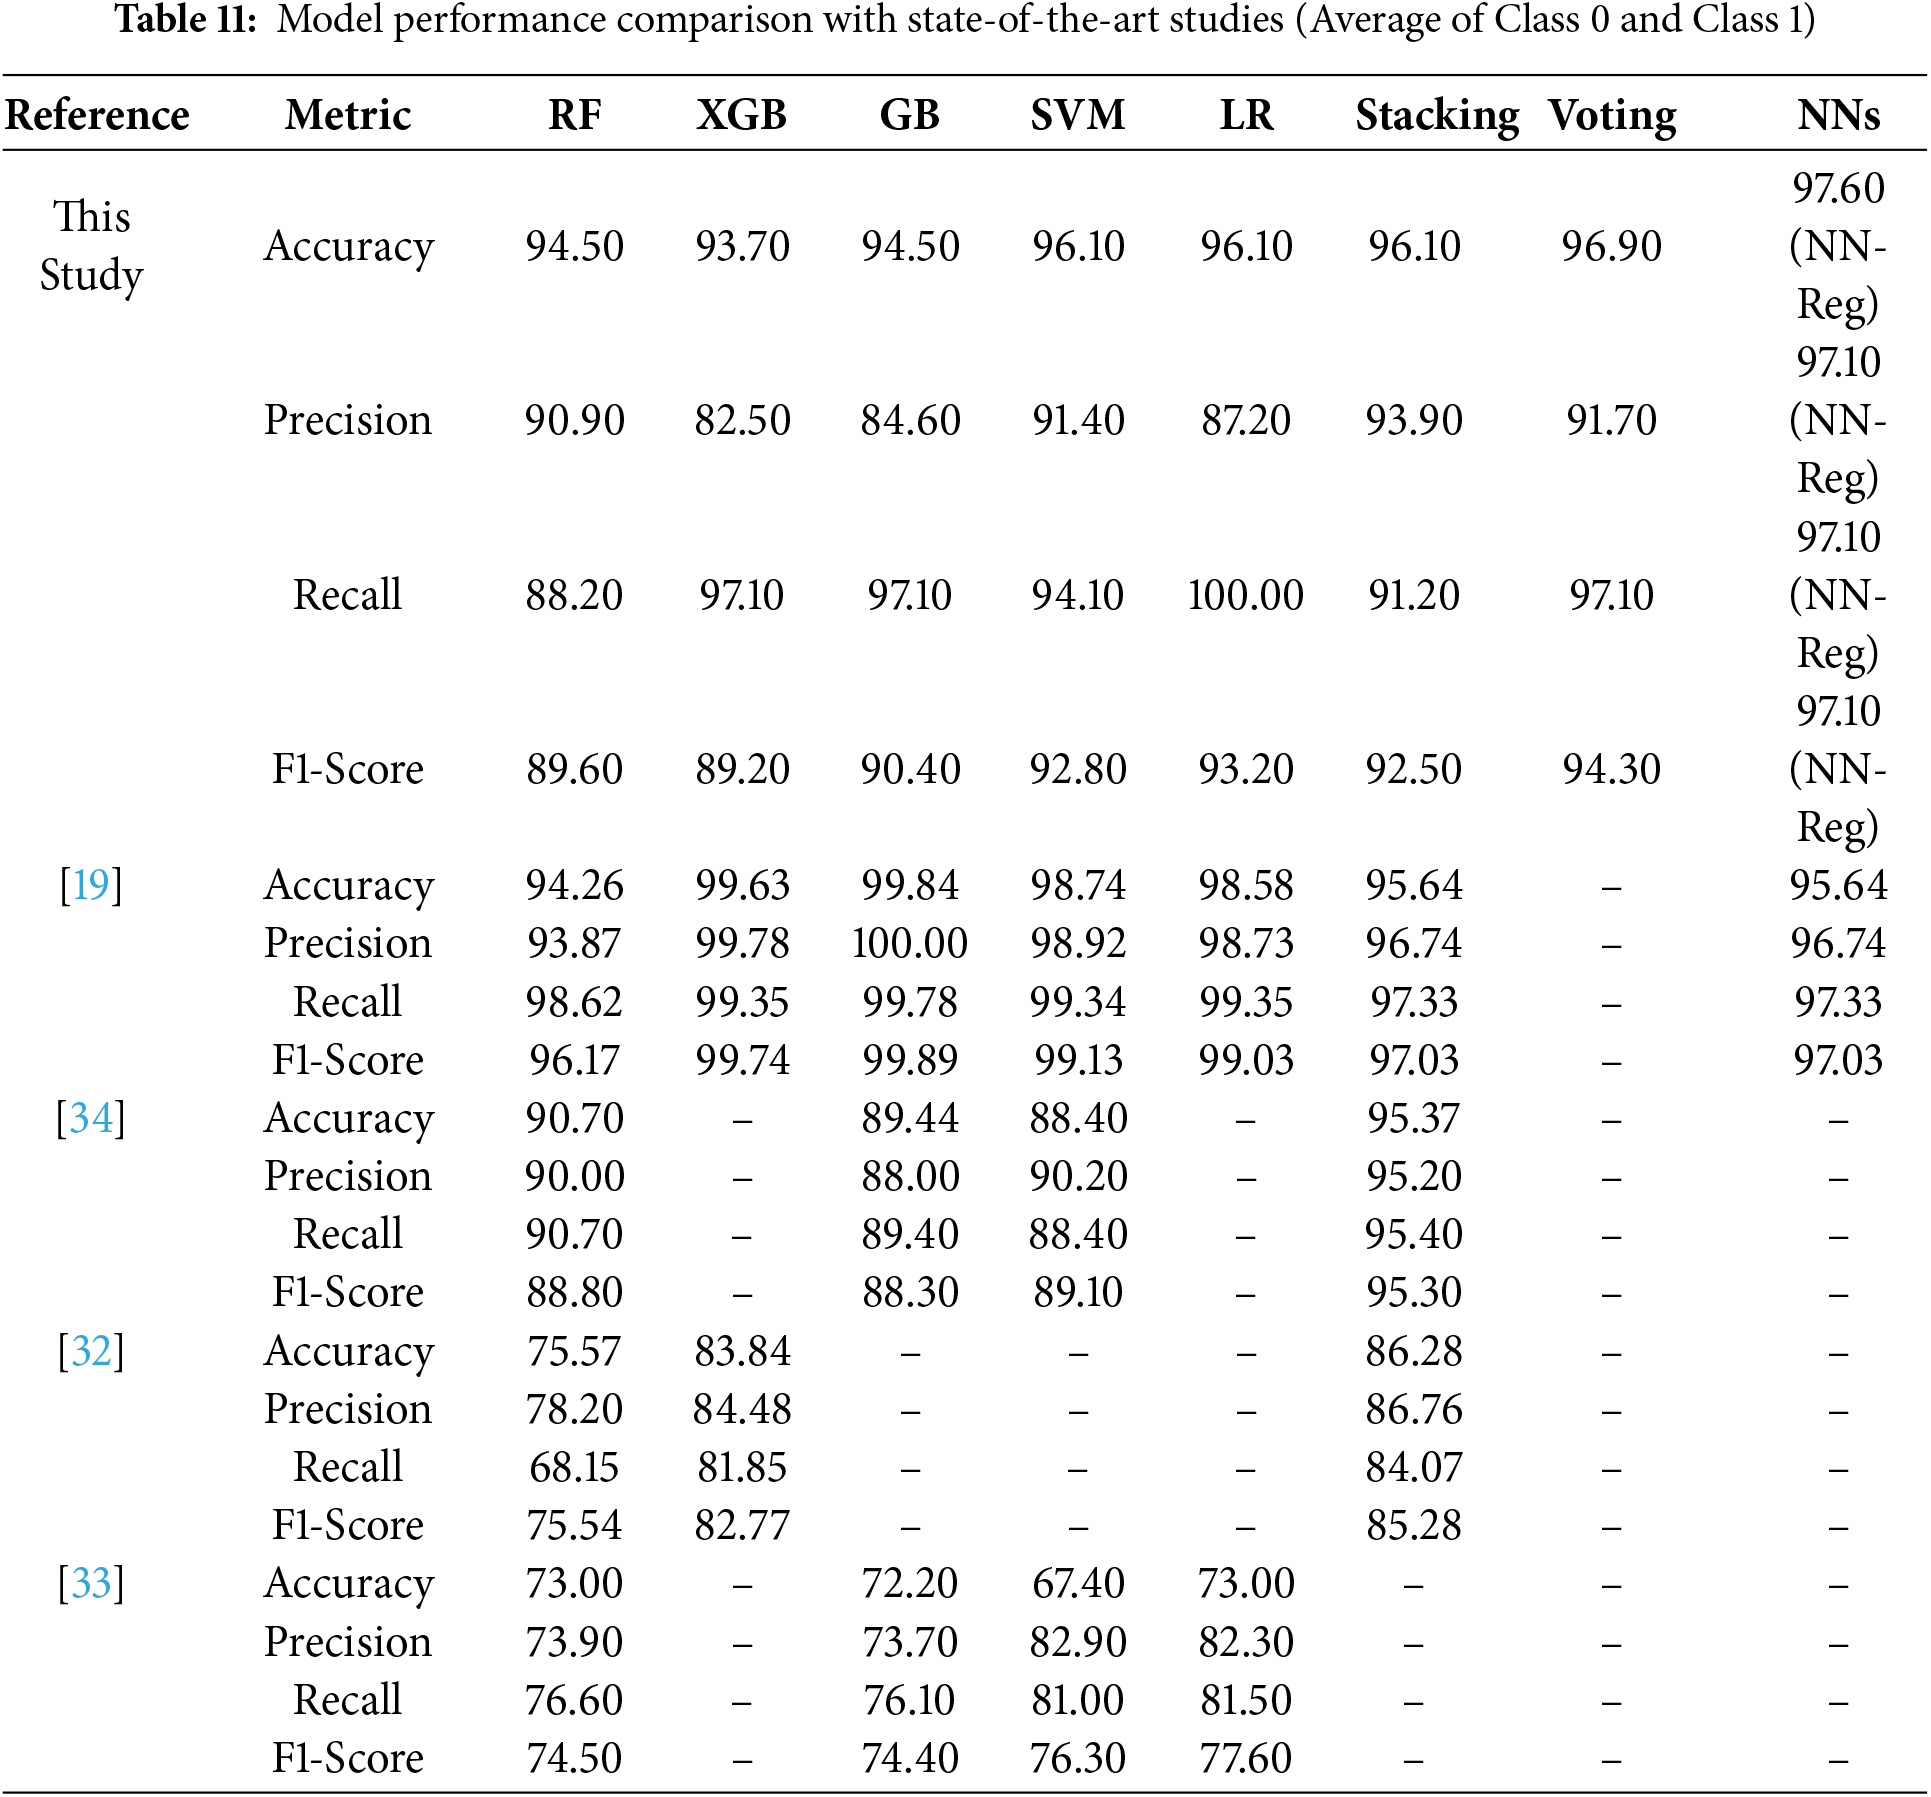
Jeon et al. [19] reported high metrics (e.g., AUC > 0.99) after filtering their dataset to 634 selected cases. Whereas our framework used the full dataset with 1,985 behavioral instances and an additional multimodal dataset. Consequently, while absolute values were modestly lower, they reflect more realistic, reproducible, and clinically generalizable outcomes. In contrast to state-of-the-art narrow-scope evaluation, our results on Dataset 2 validate the scalability of the proposed approach with NN-Reg and VC, achieving consistent or slightly higher metrics (i.e., AUC > 0.999). It shows that our framework generalizes better for diverse feature modalities, bridging behavioral and physiological inputs for ASD screening.
In this study, we explored how common behavioral and demographic signs, when used with machine learning and deep learning methods, can help in building an automatic tool for early ASD detection. Traditional assessments mostly depend on manual scoring or the opinion of specialists, which sometimes leads to delays or variation in results. Our approach combines ensemble and deep models so the system can make decisions automatically and explain them more clearly through SHAP and LIME. The key features in dataset 1, such as A9, A5, and A6, were consistently ranked as the most influential. It increases clinician trust and aids in translating findings to actionable diagnostic guidance. Therefore, the proposed framework is a pre-screening tool to assist early identification rather than replacing formal diagnostic evaluation. However, there are still several limitations. For example, Dataset 1 contains only behavioral and demographic indicators that may restrict generalization to certain populations. Whereas, Dataset 2 (multimodal) partially addresses this concern by using diverse modalities (e.g., image, audio, and physiological data), which enhances robustness. Nevertheless, further validation on larger and cross-regional cohorts is required to confirm scalability.
Therefore, we suggest potential researchers focus on including EEG, MRI, and genetic modalities to provide a unified multimodal diagnostic ecosystem. The used models achieved high accuracy; however, the ultimate goal is to support clinicians with an interpretable and resource-efficient screening tool that complements existing medical practices. Thus, the proposed framework contributes to both performance advancement and interpretability, offering a reproducible step toward explainable AI in healthcare. Such feature-level explanations can support diagnostic reasoning by validating or complementing clinician judgment. In addition, this model validation study lacks clinical or medical validation. Although the proposed framework obtained a high level of accuracy on the various behavioral and multimodal datasets, the resulting diagnoses were neither matched to, nor compared with, the results of licensed clinical professionals nor with standard, widely accepted measures of diagnosis, such as the ADOS or ADI-R. Such validation is required to assess the clinical affirmations and ascertain the correlations of model predictions with the clinical predictions. Future studies should include an assessment of closed case clinical evaluations by experts, or concurrent clinical evaluations, to substantiate the operational diagnostic potential of the framework within real healthcare systems.
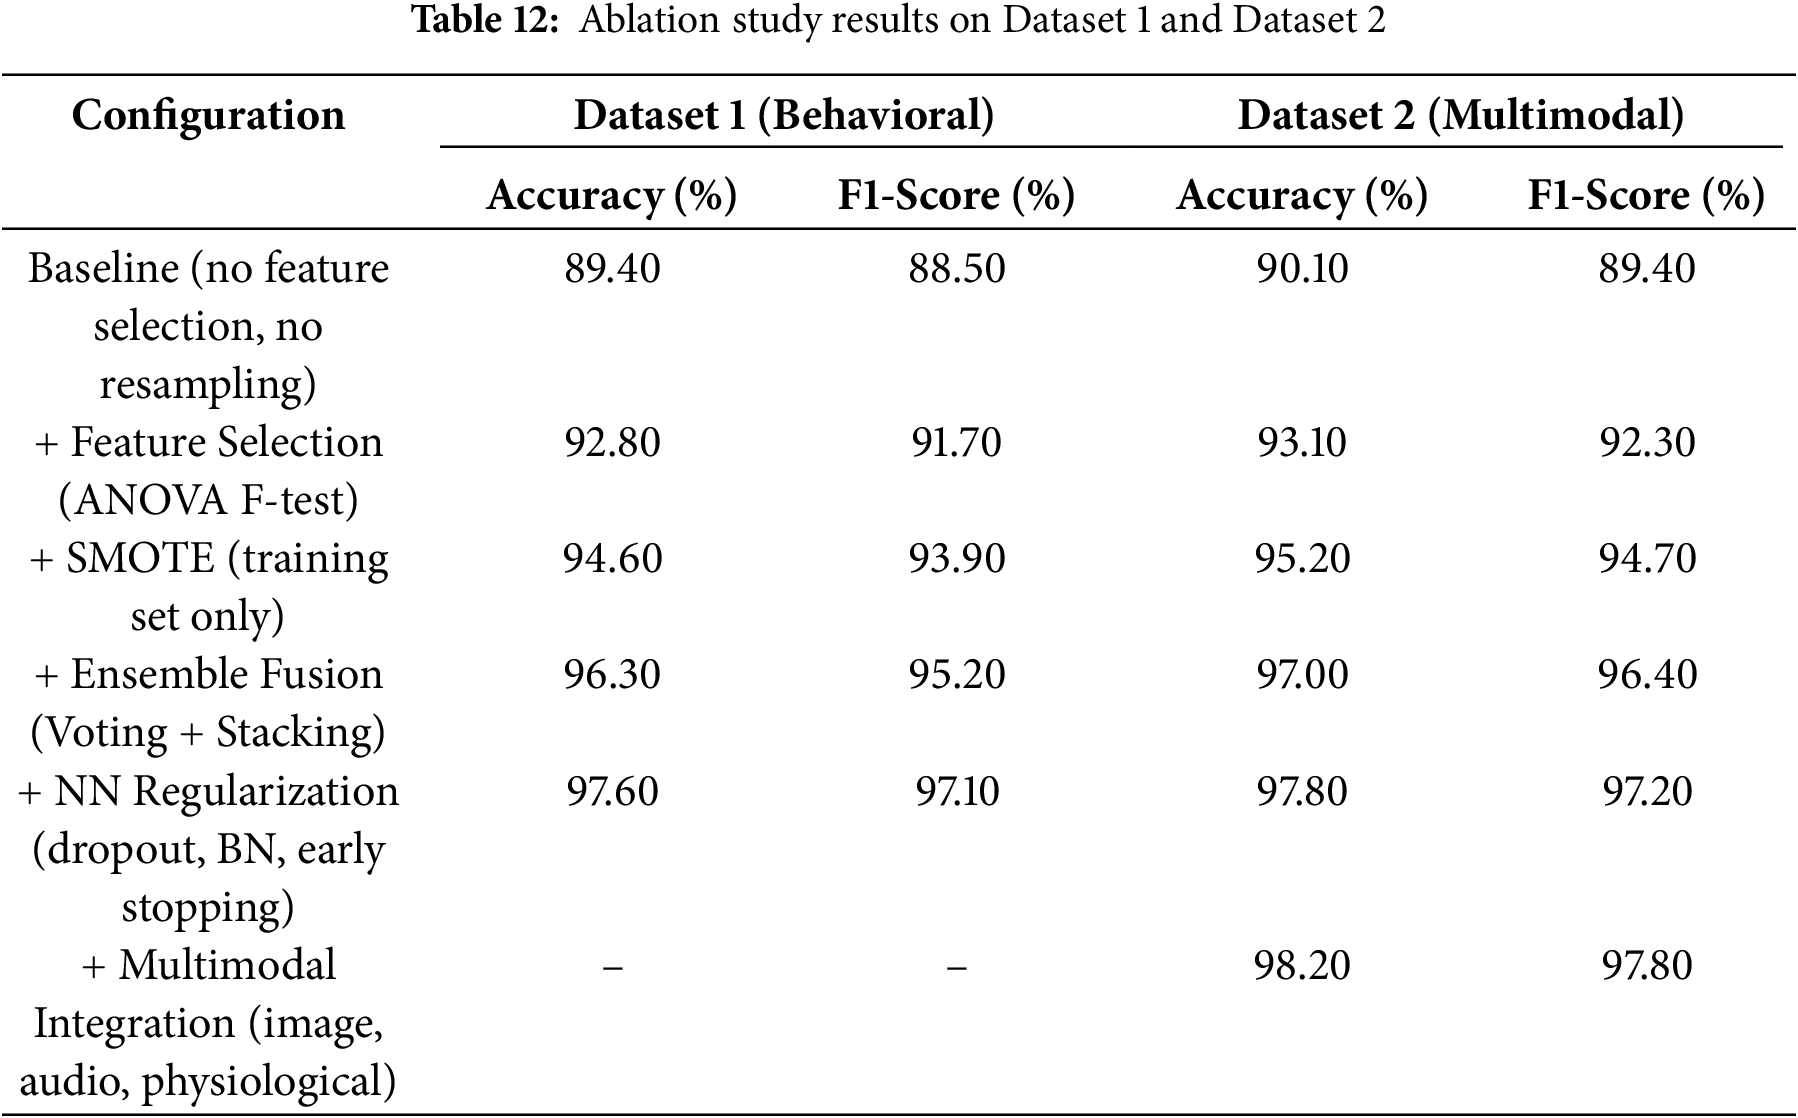
To support our claim, we also performed an ablation study. It was conducted to evaluate the contribution of each part of the proposed framework to overall performance. We performed this on the same two datasets, starting with a baseline model. In the first case, we did not use any feature selection, resampling, or regularization techniques. After that, we added one component at a time to measure the effect on accuracy and F1-score. This helped identify the specific impact of each case, including feature selection, data balancing, ensemble learning, regularization, and multimodal input.
Table 12 summarizes that each case helped in improving the model’s performance. The ANOVA F-test enhanced the accuracy on Dataset 1 by approximately 3.4% by removing unnecessary features. The SMOTE usage on the training data improved the model’s ability to detect ASD-positive cases, increasing the F1-score by 2%. The ensemble fusion methods, such as voting and stacking, provided the most significant single-step improvement. The accuracy rose by 1.7%, showing the value of combining multiple learners. Neural regularization techniques (including dropout, batch normalization, and early stopping) made the model more stable. These steps reduced overfitting and enhanced the accuracy on Dataset 1 to 97.6%. The final step used multimodal integration in Dataset 2. We combined images, audio, and physiological signals that resulted in 98.2% accuracy. It augments our idea of using different data sources for better generalization. Thus, it can be concluded that each case added clear value and produced a well-balanced model.
6 Conclusions and Future Directions
This study proposed an automated framework for the identification of Autism Spectrum Disorder (ASD) based on ensemble learning. It combined multiple classifiers to enhance prediction reliability, interpretability and generalization. A complete preprocessing pipeline was designed, which included missing-value imputation, correlation-based feature filtering, ANOVA F-test feature selection, and feature scaling. The conditional SMOTE was applied only to the training set to prevent leakage in modelling. The research revealed that an ensemble approach was more stable and generalisable than a single model. Models of neural networks with regularization showed strong generalization, and the use of ensemble methods, Voting and Stacking, maintained robustness and sustained the sensitivity–specificity trade-off. Logistic Regression is reliable in identifying ASD-positive cases and thus benefits clinical sensitivity. The use of explainability revealed that the study mainly relied on meaningful behavioral and clinical attributes, confirming the medically relevant nature of predictions. The proposed framework actively aids in enhancing the scalability and interpretability of ASD screening by partially automating the assessment process, thereby reducing reliance on subjective clinical evaluation. In addition, the multimodal data confirmed the proposed framework’s scalability and flexibility across diverse input domains. Therefore, the framework exhibits strong reliability and easy interpretation and can be used on a broader range of datasets in the future, including those with multimodal signals such as EEG, MRI, and genetic datasets. In the future, the use of transformers and attention may further improve the learning of representations and the extraction of features. Another direction with significant potential for the ASD detection system is federated learning, which will enable the training of models across healthcare institutions while preserving the privacy of sensitive data.
Acknowledgement: The authors extend their appreciation to the King Salman center for Disability Research for funding this work through Research Group No. KSRG-2024-050.
Funding Statement: The authors extend their appreciation to the King Salman center for Disability Research for funding this work through Research Group No. KSRG-2024-050.
Author Contributions: The authors contributed to this work as follows: Menwa Alshammeri and Noshina Tariq led the conceptualization of the study. Noshina Tariq, Muhammad Attique Khan, and NZ Jhanji performed the formal analysis. Menwa Alshammeri secured the funding and contributed to visualization. Noshina Tariq managed the project administration, while Muhammad Attique Khan and NZ Jhanji conducted the validation. Mamoona Humayun and NZ Jhanji provided supervision. Noshina Tariq prepared the original draft of the manuscript, and Mamoona Humayun and NZ Jhanji contributed to writing, reviewing, and editing the revised manuscript. All authors reviewed the results and approved the final version of the manuscript.
Availability of Data and Materials: Dataset 1 and 2 can be downloaded from https://www.mdpi.com/article/10.3390/diagnostics14222504/s1 and https://www.kaggle.com/datasets/kadhiravanucet/multimodal-autism-dataset, respectively.
Ethics Approval: Not applicable.
Conflicts of Interest: The authors declare no conflicts of interest to report regarding the present study.
References
1. D’Angelo E, Fiori F, Ferraro GA, Tessitore A, Nazzaro L, Serpico R, et al. Autism spectrum disorder, oral implications, and oral microbiota. Children. 2025;12(3):368. doi:10.3390/children12030368. [Google Scholar] [PubMed] [CrossRef]
2. Iruka IU. Early childhood development. In: Jonathan T, Kilkelly U, editors. Children’s rights and children’s development: an integrated approach. New York, NY, USA: New York University Press; 2025. p. 9–38. [Google Scholar]
3. Solek P, Nurfitri E, Sahril I, Prasetya T, Rizqiamuti AF, Rachmawati I, et al. The role of artificial intelligence for early diagnostic tools of autism spectrum disorder: a systematic review. Turkish Arch Pediat. 2025;60(2):126–40. doi:10.5152/TurkArchPediatr.2025.24183. [Google Scholar] [PubMed] [CrossRef]
4. Pavlou ES, Garmpis A. Enhancing social skills in children with autism spectrum disorder through natural musical instruments and innovative digital musical instruments: a literature review. Societies. 2025;15(3):53. doi:10.3390/soc15030053. [Google Scholar] [CrossRef]
5. Cortese S, Bellato A, Gabellone A, Marzulli L, Matera E, Parlatini V, et al. Latest clinical frontiers related to autism diagnostic strategies. Cell Reports Med. 2025;6(2):101916. doi:10.1016/j.xcrm.2024.101916. [Google Scholar] [PubMed] [CrossRef]
6. Syriopoulou-Delli CK. Advances in autism spectrum disorder (ASD) diagnostics: from theoretical frameworks to AI-driven innovations. Electronics. 2025;14(5):951. doi:10.3390/electronics14050951. [Google Scholar] [CrossRef]
7. Bhamidipaty V, Bhamidipaty DL, Fayaz SM, Bhamidipaty K, Botchu R. Intelligent health care: applications of artificial intelligence and machine learning in computational medicine. In: Blockchain and digital twin for smart hospitals. Amsterdam, The Netherlands: Elsevier; 2025. p. 133–69. doi:10.1016/b978-0-443-34226-4.00008-3. [Google Scholar] [CrossRef]
8. Mustafa SMN. Leveraging artificial intelligence in healthcare: safeguarding human rights through state policies. In: Intersection of human rights and AI in healthcare. Hershey, PA, USA: IGI Global Scientific Publishing; 2025. p. 285–308. doi:10.4018/979-8-3693-7051-3.ch012. [Google Scholar] [CrossRef]
9. Achari A, Sugumar R. Performance analysis and determination of accuracy using machine learning techniques for decision tree and RNN. In: AIP Conference Proceedings. Melville, NY, USA: AIP Publishing; 2025. Vol. 3252. [Google Scholar]
10. Nawghare PS, Prasad J. Hybrid CNN and Random forest model with late fusion for detection of autism spectrum disorder in toddlers. MethodsX. 2025;14:103278. doi:10.1016/j.mex.2025.103278. [Google Scholar] [CrossRef]
11. Alwakid G, Ul Haq F, Tariq N, Humayun M, Shaheen M, Alsadun M. Optimized machine learning framework for cardiovascular disease diagnosis: a novel ethical perspective. BMC Cardiovasc Disord. 2025;25(1):123. doi:10.1186/s12872-025-04550-w. [Google Scholar] [PubMed] [CrossRef]
12. Ganai UJ, Ratne A, Bhushan B, Venkatesh K. Early detection of autism spectrum disorder: gait deviations and machine learning. Sci Rep. 2025;15(1):873. doi:10.1038/s41598-025-85348-w. [Google Scholar] [PubMed] [CrossRef]
13. Li X, Fan L, Wu H, Chen K, Yu X, Che C, et al. Enhancing autism spectrum disorder early detection with parent-child dyads block-play protocol and attention-enhanced hybrid deep learning framework. Eng Appl Artif Intell. 2025;148:110430. doi:10.1016/j.engappai.2025.110430. [Google Scholar] [CrossRef]
14. Alzakari SA, Allinjawi A, Aldrees A, Zamzami N, Umer M, Innab N, et al. Early detection of autism spectrum disorder using explainable AI and optimized teaching strategies. J Neurosci Methods. 2025;413:110315. doi:10.1016/j.jneumeth.2024.110315. [Google Scholar] [PubMed] [CrossRef]
15. Jin L, Cui H, Zhang P, Cai C. Early diagnostic value of home video-based machine learning in autism spectrum disorder: a meta-analysis. Eur J Pediatr. 2025;184(1):1–13. doi:10.1007/s00431-024-05837-4. [Google Scholar] [PubMed] [CrossRef]
16. Ridlan A, Hasanudin M, Tavares OCDC, Latumaerissa DE. Early autism disorder prediction using machine learning. Int J Open Inform Technol. 2025;13(1):48–53. [Google Scholar]
17. Mim MA, Khatun M, Hossain MM, Rahman W, Munir A. Exploring early learning challenges in children utilizing statistical and explainable machine learning. Algorithms. 2025;18(1):20. doi:10.3390/a18010020. [Google Scholar] [CrossRef]
18. Alsbakhi A, Thabtah F, Lu J. Autism data classification using AI algorithms with rules. Focused Rev Bioeng. 2025;12(2):160. doi:10.3390/bioengineering12020160. [Google Scholar] [PubMed] [CrossRef]
19. Jeon I, Kim M, So D, Kim EY, Nam Y, Kim S, et al. Reliable autism spectrum disorder diagnosis for pediatrics using machine learning and explainable AI. Diagnostics. 2024;14(22):2504. doi:10.3390/diagnostics14222504. [Google Scholar] [PubMed] [CrossRef]
20. Fatima A, Masood S. Machine learning approaches for neurological disease prediction: a systematic review. Expert Syst. 2024;41(9):e13569. doi:10.1111/exsy.13569. [Google Scholar] [CrossRef]
21. Bibi N, Courtney J, McGuinness K. Enhancing brain disease diagnosis with XAI: a review of recent studies. ACM Trans Comput Health. 2025;6(2):1–35. doi:10.1145/3709152. [Google Scholar] [CrossRef]
22. Al-Hiyali MI, Yahya N, Faye I, Al-Quraishi MS, Al-Ezzi A. Principal subspace of dynamic functional connectivity for diagnosis of autism spectrum disorder. Appl Sci. 2022;12(18):9339. doi:10.3390/app12189339. [Google Scholar] [CrossRef]
23. Vimbi V, Shaffi N, Mahmud M. Interpreting artificial intelligence models: a systematic review on the application of LIME and SHAP in Alzheimer’s disease detection. Brain Inform. 2024;11(1):10. doi:10.1186/s40708-024-00222-1. [Google Scholar] [PubMed] [CrossRef]
24. Vidivelli S, Padmakumari P, Shanthi P. Multimodal autism detection: deep hybrid model with improved feature level fusion. Comput Methods Programs Biomed. 2025;260(1):108492. doi:10.1016/j.cmpb.2024.108492. [Google Scholar] [PubMed] [CrossRef]
25. Sleiman E, Mutlu OC, Surabhi S, Husic A, Kline A. Deep learning-based autism spectrum disorder detection using emotion features from video recordings: model development and validation. JMIR Biomed Eng. 2022;7(2):e39982. [Google Scholar]
26. Benabderrahmane B, Gharzouli M, Benlecheb A. A novel multi-modal model to assist the diagnosis of autism spectrum disorder using eye-tracking data. Health Inf Sci Syst. 2024;12(1):40. doi:10.1007/s13755-024-00299-2. [Google Scholar] [PubMed] [CrossRef]
27. Akhoundi Yazdi S, Janghorbani Poudeh A, Maleki A. Early detection of autism spectrum disorder using machine learning. Iran J Health Insur. 2024;7(3):199–208. [Google Scholar]
28. El-Shorbagy MA, Bouaouda A, Nabwey HA, Abualigah L, Hashim FA. Advances in Henry gas solubility optimization: a physics-inspired metaheuristic algorithm with its variants and applications. IEEE Access. 2024;12:26062–95. doi:10.1109/access.2024.3365700. [Google Scholar] [CrossRef]
29. Salih AM, Raisi-Estabragh Z, Galazzo IB, Radeva P, Petersen SE, Lekadir K, et al. A perspective on explainable artificial intelligence methods: SHAP and LIME. Adv Intell Syst. 2025;7(1):2400304. doi:10.1002/aisy.202400304. [Google Scholar] [CrossRef]
30. Ribeiro MT, Singh S, Guestrin C. “Why should I trust you?” Explaining the predictions of any classifier. In: Proceedings of the 22nd ACM SIGKDD International Conference on Knowledge Discovery and Data Mining.NewYork, NY, USA: ACM; 2016. p. 1135–44. [Google Scholar]
31. Lundberg SM, Lee SI. A unified approach to interpreting model predictions. Adv Neural Inf Process Syst. 2017;30:4765–74. [Google Scholar]
32. Sun C, Sun D, Liu ZP. Detecting autism spectrum disorder from functional magnetic resonance imaging data with an ensemble machine learning method. In: 2023 5th International Conference on Intelligent Medicine and Image Processing (IMIP). Piscataway, NJ, USA:IEEE; 2023. p. 13–20. [Google Scholar]
33. Toki EI, Tsoulos IG, Santamato V, Pange J. Machine learning for predicting neurodevelopmental disorders in children. Appl Sci. 2024;14(2):837. doi:10.3390/app14020837. [Google Scholar] [CrossRef]
34. Ismail E, Gad W, Hashem M. A hybrid Stacking-SMOTE model for optimizing the prediction of autistic genes. BMC Bioinform. 2023;24(1):379. doi:10.1186/s12859-023-05501-y. [Google Scholar] [PubMed] [CrossRef]
Cite This Article
 Copyright © 2026 The Author(s). Published by Tech Science Press.
This work is licensed under a Creative Commons Attribution 4.0 International License , which permits unrestricted use, distribution, and reproduction in any medium, provided the original work is properly cited.
 Downloads
 Citation Tools