
 Submit a Paper
 Propose a Special lssue
 Open Access
ARTICLE

Computational Modelling of Control of Laminar Separation Bubble over an Airfoil Using an Integrated Tubercle and Vortex Generator
1 Wind Engineering and Aerodynamic Research Laboratory, Department of Energy Systems Engineering, Erciyes University, Kayseri, Turkey
2 Scientific Research Projects Unit of Erciyes University, Erciyes University, Kayseri, Turkey
3 Dominion Energy Innovation Center, Clemson University, North Charleston, SC, USA
4 Graduate School of Natural and Applied Science, Erciyes University, Kayseri, Türkiye
5 MSG Teknoloji Ltd. Şti, Erciyes Teknopark Tekno-1 Binası, 61/20, Kayseri, Türkiye
* Corresponding Author: Mustafa Serdar Genç. Email:
(This article belongs to the Special Issue: Modeling and Applications of Bubble and Droplet in Engineering and Sciences)
Computer Modeling in Engineering & Sciences 2026, 146(2), 13 https://doi.org/10.32604/cmes.2026.074675
Received 15 October 2025; Accepted 26 January 2026; Issue published 26 February 2026
 View Full Text
 Download PDF
Abstract
This paper examines a model that combines vortex generators and leading-edge tubercles for controlling the laminar separation bubble (LSB) over an airfoil at low Reynolds numbers (Re). This new concept of passive flow control technique utilizing a tubercle and vortex generator (VG) close to the leading edge was analyzed numerically for a NACA0015 airfoil. In this study, the Shear Stress Transport (SST) turbulence model was employed in the numerical modelling. Numerical modelling was completed using the ANSYS-Fluent 18.2 solver. Analyses were conducted to investigate the flow pattern and understand the underlying LSB control phenomena that enabled the new passive flow control method to provide this significant performance benefit. The findings indicated that the new concept of passive flow control technique suppressed the formation of an LSB at the suction surface of the NACA0015 airfoil, resulting in a higher lift coefficient and improved aerodynamic performance. Improvements in LSB dynamics and aerodynamic performance through the passive flow control method lead to increased energy output and enhanced stability.Graphic Abstract
Keywords
A wind turbine generally operates at low chord-based Re numbers and different angles of attack. The viscous flow at low Reynolds numbers can cause leading-edge separation or stall over an airfoil [1–4]. Separation and leading-edge stall phenomena can cause undesired effects, resulting in decreased aerodynamic performance at a level that reduces lift coefficients. and increased fatigue loads damaging the structure of the wings [5–9], with higher noise levels disturbing the environment and reduced energy outputs [10,11]. To mitigate these adverse effects, various flow control mechanisms have been investigated numerically with Large Eddy Simulation (LES) and Reynolds Averaged Navier Stokes (RANS) models [6,7]. Besides, other numerical methods, including the ABC algorithm, were also performed to enhance the aerodynamic performance of airfoils [8–11]. Furthermore, different flow control strategies were applied as protrusion shapes and some acoustic techniques [12–14]. Recently, in computational modelling and experimental studies, bio-inspired solutions such as tubercles [15], dimples [9], serrations [16], grooves [17], flexible materials [18], and bionic airfoils [19–21] have been preferred as flow control techniques. Due to experimental challenges, numerous alternative flow control methods have been successfully studied using computational modelling techniques. These numerous numerical studies conducted with Large Eddy Simulation (LES) and Reynolds Averaged Navier Stokes (RANS) models [6,7] and flow control strategies [21–23] have shown that flow improvements can be achieved through the use of biomimetic designs. Compared to other passive flow control techniques, vortex generators are more frequently utilized because of their straightforward design and reduced operation cost [22,23].
Biomimetics is the study of replicating and imitating the characteristics of living organisms to apply them to engineering issues. In terms of numerical and experimental aerodynamic studies, these methods could be investigated for owls [24], the flight of butterflies [20,25,26], seagulls [25], tubercles [26], and humpback whales [27]. Swallowtail butterflies, characterized by their tail-like projections, exhibited increased aerodynamic performance, resulting in enhanced lift and reduced drag forces [20]. Flow can be controlled with leading-edge serrations (bioinspired grooves) by damping the adverse effects on the airfoil/wings [28–31]. Other types of bionic airfoils and tubercle structures were also investigated, and the breaking down of laminar separation bubbles (LSB) was observed [32,33]. Bio-inspired aerodynamic strategies have proven effective in enhancing performance and reducing flow-induced losses. Wang et al. [34] showed that leading-edge serrations and helical blade geometries improve the efficiency of vertical axis wind turbines, while Jaworski and Peake [35] demonstrated the noise-mitigation potential of poroelastic edges. Furthermore, Bechert et al. [36] and Sagong et al. [37] reported substantial skin-friction drag reductions using riblet-based and fish-inspired surface modifications.
The flow control techniques could be categorized into two classes: (i) active [38] and (ii) passive [39] control methods. These days, active control methods have started to lag behind passive ones, as they consume external energy. Moreover, the passive flow controllers are relatively simple in terms of their implementation. Several of those passive ones are referred to as employing riblet [34–37], taking into account dimples [9] and grooves [28–30], considering bio-inspired methods utilizing vortex generators (VGs) [22,23,40–42], performing leading-edge slats [43], using slits [44] and control rods [45].
Among the various passive flow control techniques observed in humpback whales, the bio-inspired leading-edge tubercles are rounded protuberances that have the capacity to enhance their power output compared to traditional straight leading-edge blades. A greater momentum transfer occurs within the boundary layer with the help of these surface shapes compared to their uncontrolled counterparts. Although formations of adverse pressure gradients (APGs) exist, this additional momentum exchange contributes to the flow remaining attached to the airfoil surface. As a passive flow device that enhances lift, tubercles alter the flow field around the airfoil [27,46,47]. The method by which vortex generators operate is to create rotating regions of fluid motion along surfaces in contact with airflow, thereby transferring momentum to the boundary layer. These vortices alter the structure of the thin boundary layer adjacent to the surface, where viscous effects are dominant. Thus, the VG structures intervene in the flow and provide momentum to the boundary layer. In addition, they offer a stronger boundary layer that can better withstand APGs and maintain attachment at higher angles of attack by promoting early transition to turbulence [40–42].
The aerodynamic behavior of the NACA0020 airfoil with and without tubercles was experimentally investigated by Miklosovic et al. at Reynolds numbers of 5.05 × 10⁵ and 5.20 × 10⁵ [27]. The results denoted that the stall angle and the overall maximum lift coefficient increased by 40% and 6%, respectively. Moreover, the drag forces decreased when the airfoil was in the post-stall regime. The uncontrolled case and different models, which had varied amplitude and wavelength, were examined by Johari et al. [46]. They found that airfoils performed differently from the baseline model in terms of stalling, with a postponement in separation when tubercles were applied. Additionally, it was observed that the leading-edge bumps had an adverse effect, decreasing the lift coefficient when the angle of attack was lower than the stall angle of the uncontrolled case. Wei et al. [47] investigated the control of flow on a hydrofoil, taking into account leading-edge serrations at a Reynolds number of 1.4 × 10⁴. Their findings indicated that the counter-rotating vortex pairs advanced on each serration, resulting in decreasing flow separations at angles of attack of 15° and 20°. Watts and Fish [48] attempted a numerical investigation to compare the aerodynamic characteristics of airfoils with and without tubercles. Their results demonstrated that an increment of 17.6% in lift-to-drag ratio was ensured at the airfoil with tubercles in comparison to the uncontrolled airfoil when the angle of attack was α = 10°. The application of tubercles on a delta wing was experimentally investigated by utilizing the stereoscopic particle image velocimetry (SPIV) by Goruney and Rockwell [49]. It was noted that the surface flow topology was influenced when the Reynolds number and angle of attack were 1.5 × 10⁴ and α = 25°, respectively. Hansen et al. [15] tested NACA0021 and NACA65-021 airfoils with tubercles to understand how the tubercles affected different full-span wings. The results showed that applying a tubercle to the NACA65-021 airfoil yielded more benefits than using it on the NACA0021, as the extent of the laminar boundary layer of the NACA65-021 was greater.
During the decades, applications of bio-inspired passive flow control with tubercles have been widely studied in a variety of fields such as the designs of micro air vehicles (MAVs) [50] and unmanned aerial vehicles (UAVs) [51], vertical [52,53] and horizontal [54] wind turbine blades, and fan blades [55]. Moreover, studies focusing on the separation-induced transition were performed in order to understand the mechanism of flow control in deep [56].
From the past to the present, the aerodynamic community has been investigating improved flow control techniques for aerodynamic and hydrodynamic vehicles, aiming to achieve desired outputs such as enhanced maneuverability, lift and thrust augmentation, and drag reduction. Thanks to advancements in technology, computational techniques are successfully employed and enable the accurate characterization of complex flow structures as well as delicate flow phenomena such as the laminar separation bubble (LSB). Rather than bio-inspired techniques, vortex generators were also considered to detect their effects on controlling and damping of LSB by Singh [57], and it is examined whether conventional vortex generators and lower boundary layer vortex generators controlled the LSB. The influence on the flow characteristics of these three-dimensional vortex generators with two distinct heights of 0.33 δ and 0.66 δ was examined. According to simulations, positioning vortex generators with a height of 0.33 δ reduces the LSB’s length by 62%, and adding vortex generators with a height of 0.66 δ eliminates the LSB. As the last study also shows, in the literature, tubercles and other passive flow control methods have been studied considerably, but independently. They were not investigating the computational modelling of the bubble dynamics together. Therefore, the combined effect of utilizing a tubercle and another passive flow controller together on the LSB dynamics was unclear. As a novelty of this study, the flow phenomena, as well as the LSB and vortex formations, were numerically investigated using a transition model on the NACA0015 airfoil with a tubercle and VGs combination at a Reynolds number of 1.25 × 10⁵ and different angles of attack.
Regarding the essential path of this study, a detailed literature review was conducted to identify numerical studies on the formation of LSB and to locate studies related to passive flow control with the tubercle in advance. This was seen in Section 1 of the paper. Section 2 consisted of the basic approaches. A detailed explanation of numerical simulations and a validation study was performed in Section 3. The ensured data from the experiments and numerical simulations were post-processed, evaluated, and then discussed in Section 4. The final remarks and limitations were ensured in the Section 5.
2 Organization of Experimental Approach
To examine the undesired flow phenomena such as boundary layer separation or the formation of LSB on both uncontrolled and controlled airfoils, and to understand how the modified model with both the whale’s tubercle form and the VG array behaves with the flow characteristics, the experimental apparatus is discussed as follows.
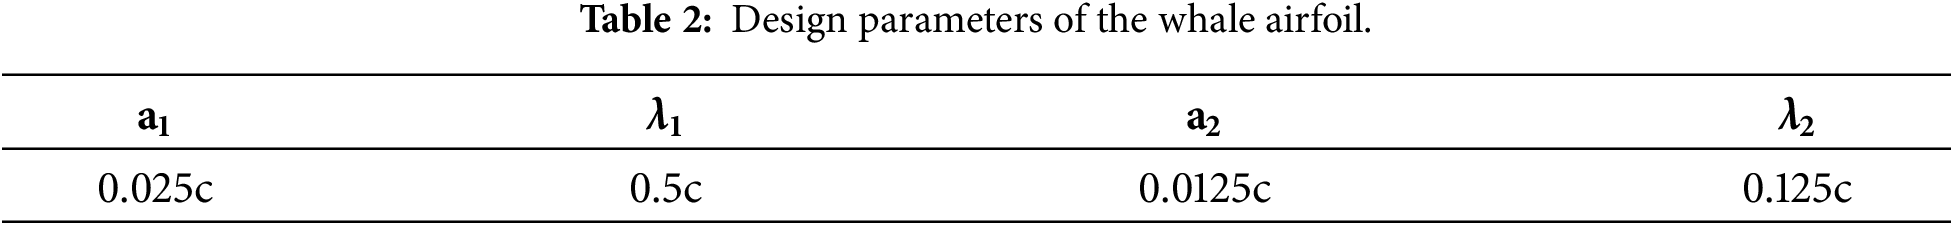
In this study, a symmetric NACA0015 airfoil was selected as a test specimen. The reason for choosing the symmetric airfoil was to be more suitable and similar to the cross-sectional profile of a whale’s flipper [15]. As seen in Fig. 1, the chord length of the airfoil was 180 mm, while its span was 300 mm. Moreover, the position of VGs was at x/c = 0.25. The optimum location of the VGs was selected based on previous studies [22,23]. In the literature, there are two types of VG configurations: co-rotating and counter-rotating arrays. Rectangular and counter-rotating VG configurations were employed on the surface of the NACA0015 airfoil in this study. The detailed and technical information, including VG dimensions, is demonstrated in Table 1. After designing the modified airfoil, it was manufactured using a 3D printer, a fast prototype method, as shown in Fig. 1b. The dimensions of the airfoil used in the study were determined based on the Re number. Having a smoother surface was more important in terms of maintaining fluid flow over the airfoil’s surface. Hence, all surfaces of the modified airfoil were cleaned and rubbed with sandpaper. Then, rectangular plexiglass and transparent end plates were mounted at each tip of the airfoil to avoid the influence of tip vortices.
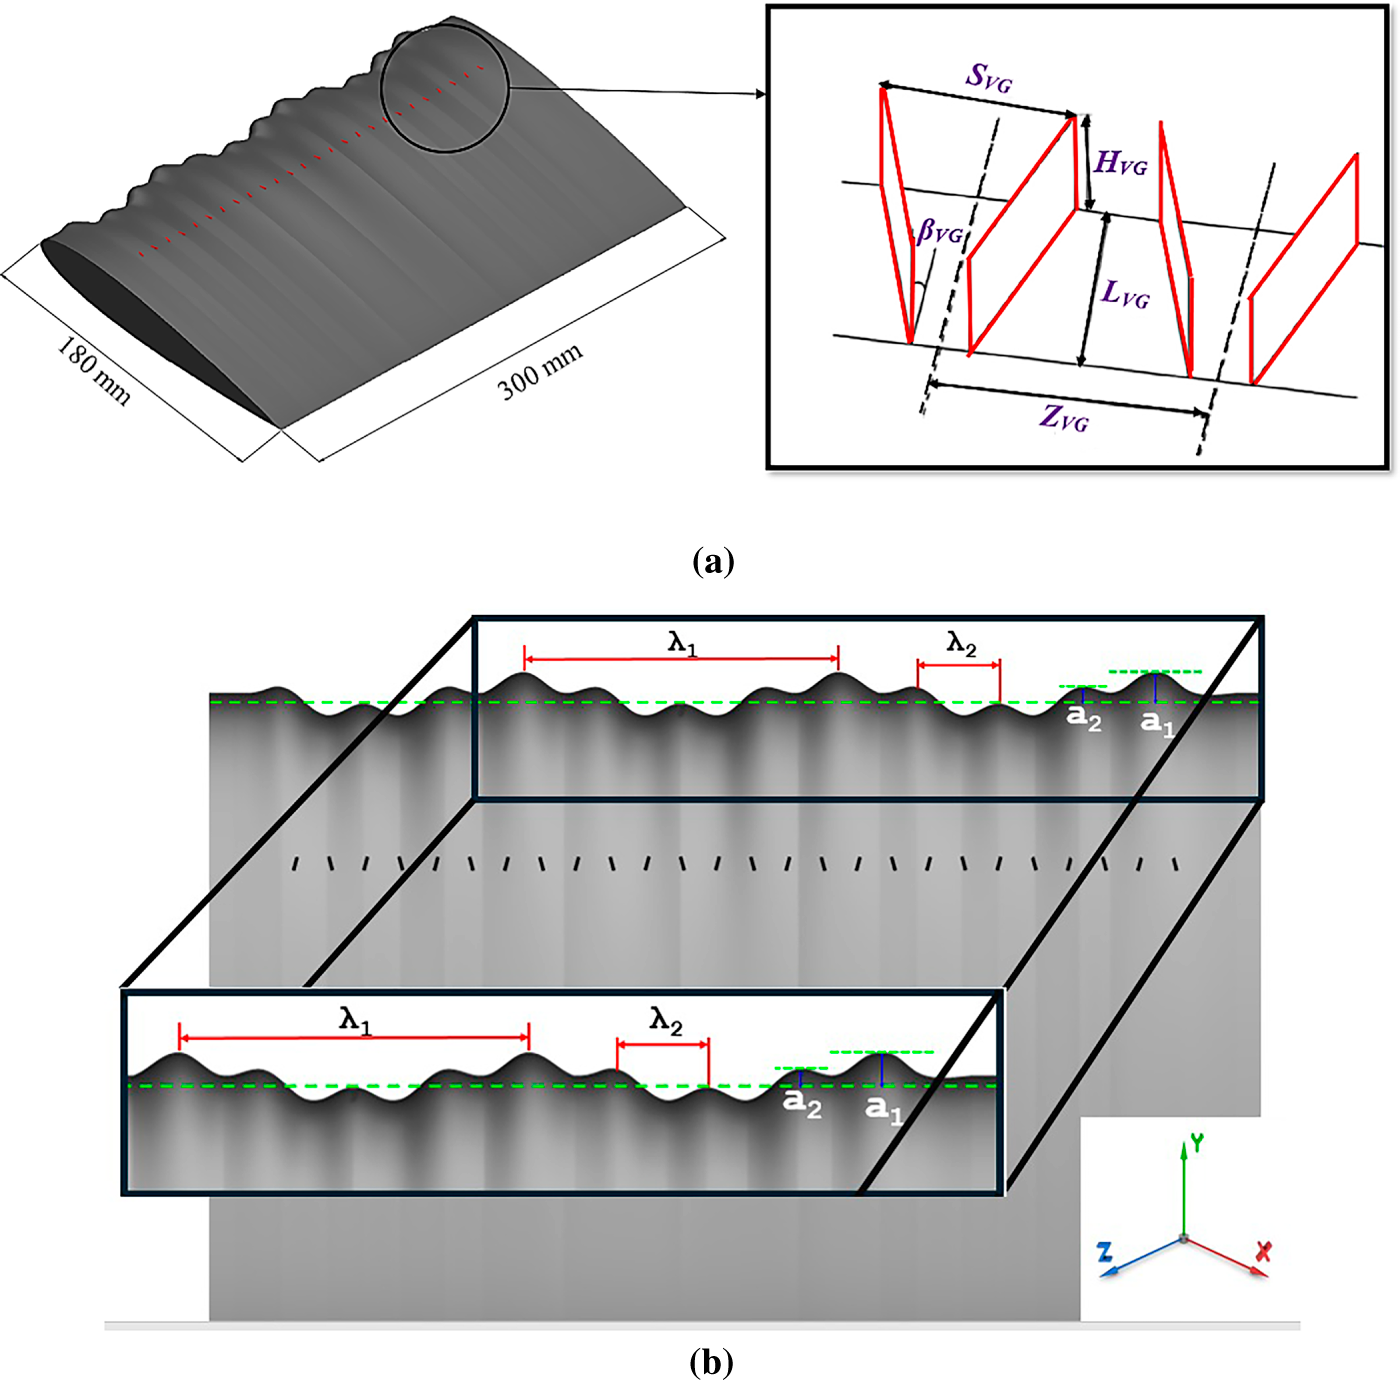
Figure 1: The geometry of the modified NACA0015 airfoil, (a) dimensions of VGs, (b) the tubercle structure created along the spanwise.
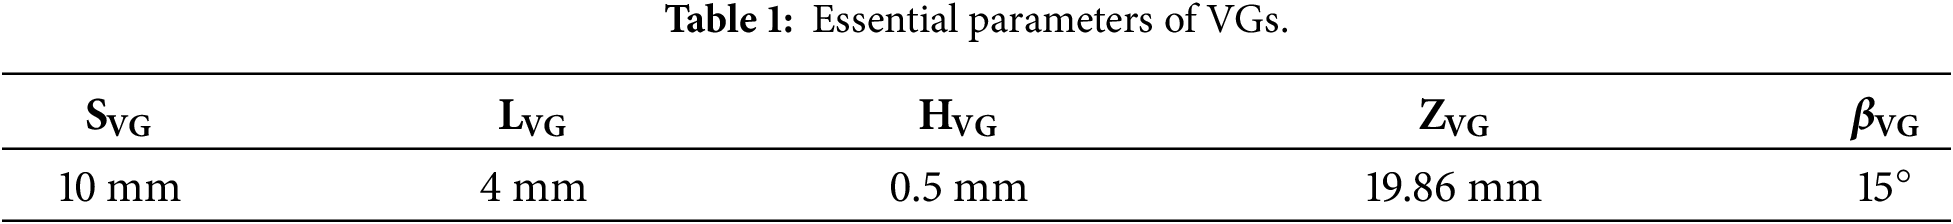
Related to the tubercle geometry at the leading edge, Eq. (1) has been extensively utilized in the literature [48,58]. The non-uniform tubercle geometry at the leading edge of the airfoil was produced to ensure a more truthful approximation according to the modified equation derived by Seyhan et al. [59].
In this equation, λ1 and λ2 represent the wavelengths, and a1 and a2 represent the amplitudes. The tubercle structure generated along the spanwise direction has a function defined by zLE. As shown in Table 2, regarding design parameters, λ1 and λ2 were set to c, 0.5, and 0.125 c, respectively. Meanwhile, a1 and a2 were selected to be 0.025 c and 0.0125 c, respectively.
In this study, three types of airfoils are included: the baseline case, the model with the whale’s tubercle form (Fig. 1b), and the modified model with both the whale’s tubercle form and VG arrays (Fig. 1a). Hereinafter, the baseline case, the model with the whale’s tubercle form, and the modified model with both the whale’s tubercle form and VG arrays were considered.
As a test facility, the suction-type and low-speed wind tunnel was used, belonging to the Wind Engineering and Aerodynamic Research Group Laboratory (WEAR) at Erciyes University. The tunnel has a square test section of 0.5 × 0.5 m. It has a nearly 4 m length and a transparent plexiglas coating around it to show the flow phenomenon. The wind tunnel can handle wind up to 45 m/s. It was possible to change the free stream velocity in the tunnel from 3 to 40 m/s. More elaborate information related to the wind tunnel was ensured. For Re = 0.63 × 10⁵ and 1.25 × 10⁵, where the tests are conducted, the velocity of the tunnel corresponds to 12.43 and 24.86 m/s, respectively. A change in velocity causes a change in the inertial force, and consequently, a change in the Reynolds number. This change, in turn, can reduce the adverse effects on flow caused by viscous forces. This change was observed in this study. The test chamber was scanned along the vertical axis using the DANTEC 55P15 probe, and the turbulence intensity was measured to be 0.6%. The blockage ratio in the test section was less than 7%, and the uncertainty of the test systems was less than 3%.
The surface oil flow visualization technique was employed to gain a deeper understanding of the flow events in the boundary layer and to investigate how the modified passive flow controller with whale and VG configurations affected the aerodynamics of the airfoil. The consistency must be appropriate to successfully identify the flow phenomena in the boundary layer using this technique. The inertia forces of the moving oil should also be less than the forces of viscosity and surface tension to prevent altering the conditions at the surface. The most popular pigments were titanium dioxide and fluorescent chrysene, whereas the most widely utilized oils are kerosene, light diesel, and transformer oil [60]. Oleic acid can also be added to the mixture to see the pigment deposit on the oiled surface. The oil mixture contained oleic acid, oil, kerosene, and titanium dioxide. Compared to other components, titanium dioxide was present in significantly less quantity. They were added to a beaker and mixed for five minutes. With the help of a thin brush, the produced oil combination was then applied to the airfoil surface.
2.4 Aerodynamic Force Measurement
Both the mean and time-dependent lift forces (FL) were measured with the aerodynamic force measurement. The experimental setup consists of strain gauges placed on the airfoil, which is fixed in the wind tunnel, and a data converter, as illustrated in Fig. 2. The joint of the strain gauge, airfoil, and force system shaft section is precisely integrated, and the measured strain is integrated with the data acquisition system. The calibration process was carried out to ensure that the measuring devices gave accurate and reliable results by applying known weights. During the experiment, airflow at various velocities was provided in the wind tunnel, and the lift force experienced by the airfoil was measured with the strain data obtained from strain gauges. Signals from the strain gauges were recorded at a sampling frequency of 1 kHz, resulting in a total of 1000 data points, each with a duration of 1 s. This high sampling frequency ensures measurements are more sensitive and accurate, allowing instantaneous changes to be detected. Thus, for the airfoils considered in the wind tunnel, the lift force measured at α = 0°–18° was converted into a lift coefficient using Eq. (2).
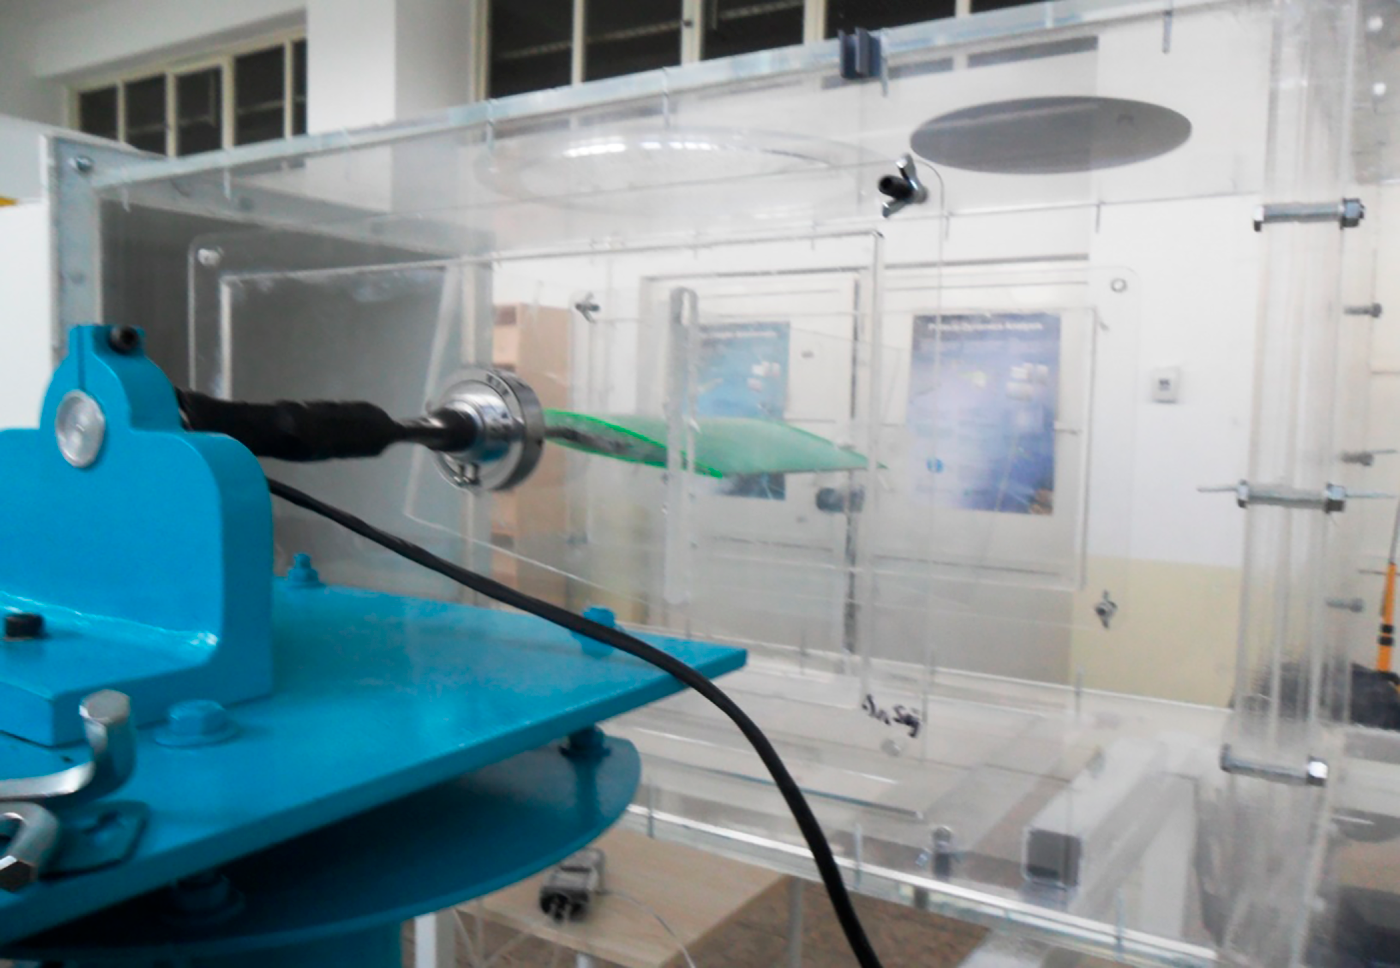
Figure 2: An illustration of the aerodynamic force measurement system.
In this section, detailed information is provided regarding numerical attempts, including the flow domain, computational grid, boundary conditions, and other relevant details.
3.1 The Flow Domain, Computational Grid, and Boundary Conditions
In this numerical study, information about the numerical model is presented in Fig. 3. Fig. 3a shows the flow field used in the model. The mesh structure created in the flow field is presented in Fig. 3b. The mesh structure designed for the airfoil using WG is given in Fig. 3c. The grid independence study for numerical modelling is shown in Fig. 4. Four different mesh structures were tested for Re = 1.25 × 10⁵ and α = 8°. Based on the results of the mesh independence study, a mesh size of approximately 15 million cells was selected. In this study, the computational grid was meshed in conjunction with a structured tetragonal grid (Fig. 3). The total number of grid nodes for Case-B, Case-W, and Case-WVG was nearly 15 million, as determined by the grid independence study. In relation to the numerical model, the Reynolds-Averaged Navier-Stokes (RANS) equations were employed to analyze the flow in this study. The second-order upwind approach was used to achieve spatial discretization and minimize numerical diffusion, following the selection of the Semi-Implicit Method for Pressure-Linked Equations (SIMPLE) solution methodology. To obtain the aerodynamic characteristics of all cases, the four-equation transition Shear Stress Transport (SST) turbulence model was used. The SST k-ω transport equations and two other transport equations formed the basis of this model [61]. This was derived based on the well-known two-equation k-ω Menter’s SST turbulence model, which models the turbulence kinetic energy (
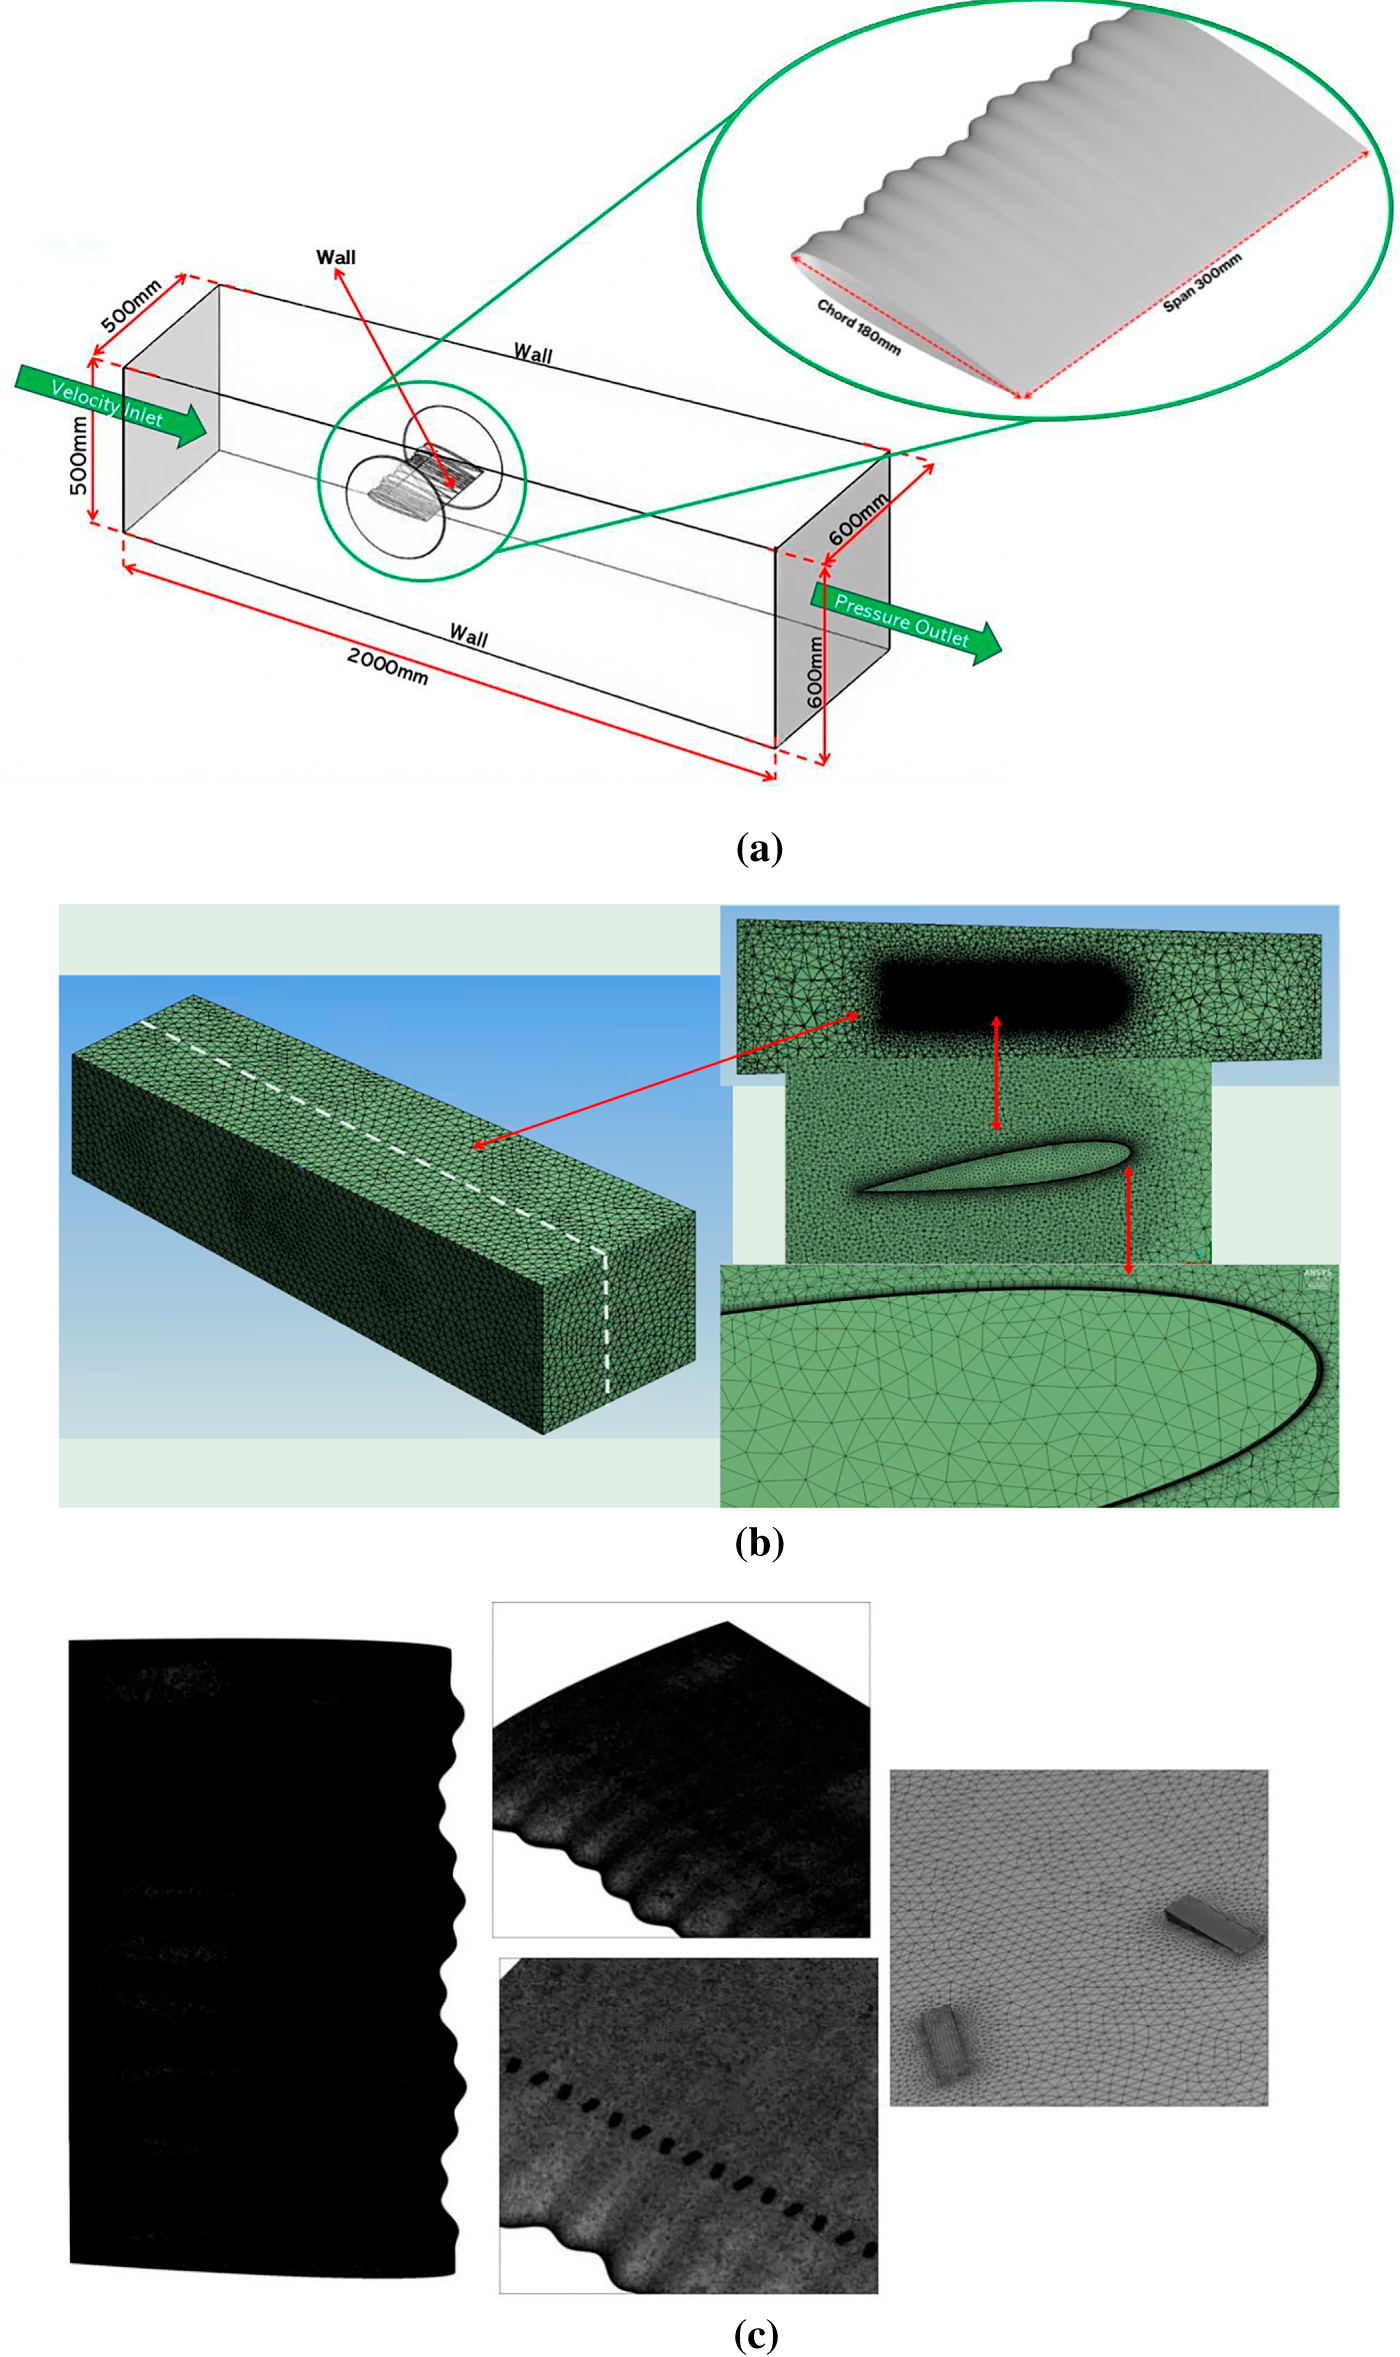
Figure 3: Geometrical definition of (a) numerical domain and boundary condition, (b) mesh structure of the model and (c) mesh structure around WG.
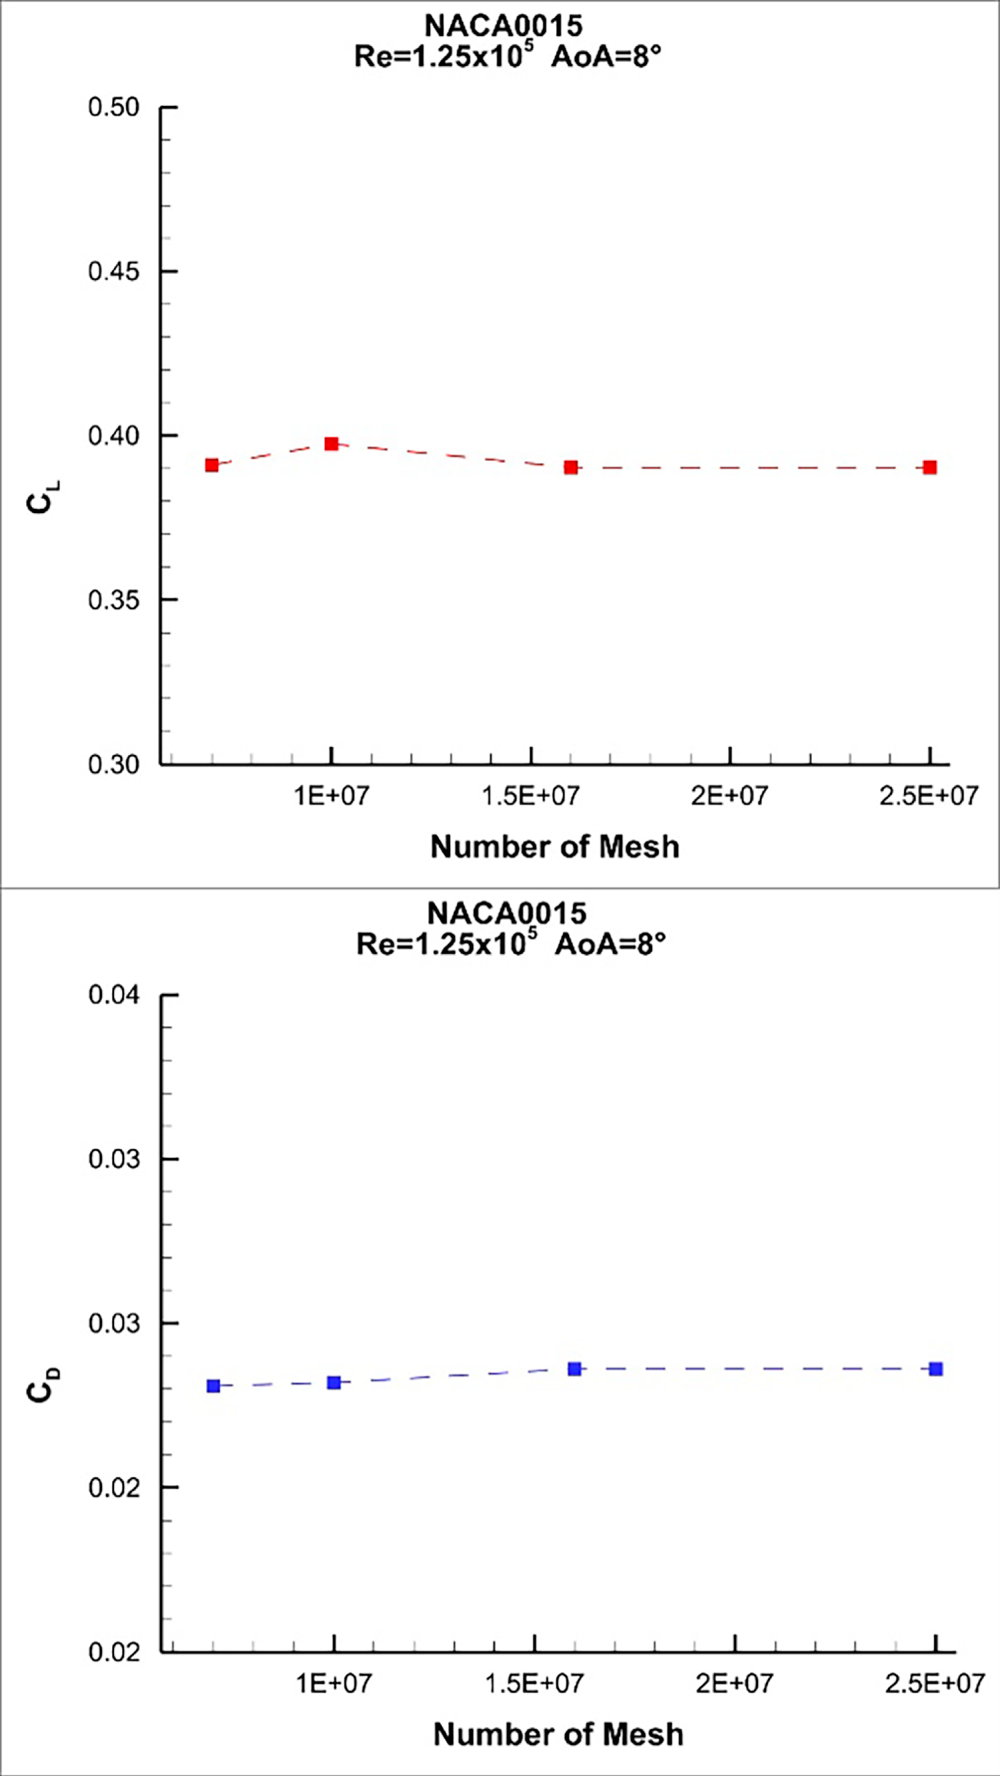
Figure 4: The grid independence study for numerical modelling.
Continuity equation:
Nondimensionalized equation of conservation of momentum:
The transport equations for the turbulence kinetic energy
Turbulence kinetic energy
Specific dissipation rate
Intermittency
Transition onset momentum thickness Reynolds number
This turbulence model was selected because it yielded reasonable results, providing a better explanation of the estimation of LSB, or laminar boundary layer separation, as well as improved accuracy in experiments [38,49,63].
The Transition SST model directly captures the effects of turbulent reattachment and laminar separation by incorporating local flow variables and governing equations for intermittency transport. In-depth examinations of turbulence generation, intermittency distribution, and velocity fields provide insight into the limitations of existing transition models at low Reynolds numbers, while also offering a deeper understanding of LSB dynamics. The equations were solved employing the ANSYS-Fluent 18.2 solver.
Related to the flow domain and mesh generation, as shown in Fig. 3, the mesh distribution and flow domain were ensured to be close to the airfoil’s surfaces. The airfoil’s chord was utilized to determine the domain dimensions. As was implemented in the authors’ previous studies [64–66], the airfoil was positioned 5c from the inlet and 6c from the outlet. It was indicated that the airfoil’s wake zone needed to be longer to allow for the full development of the wake in the downstream region. U∞ = 12.43 and 24.86 m/s was at the inlet, constant pressure was at the outlet, and stationary non-slip conditions were on the airfoil and flow domain walls. The mesh structure’s first layer was 4 × 10⁻⁶ m thick, and inflation layers with a 1.2 growth rate were employed. The convergence criterion for the residuals was 1 × 10⁻⁵. The dynamic viscosity was taken as μ = 1.789 × 10⁻⁵ kg/m s. Detailed information regarding the computational mesh was provided, as shown in Table 3.
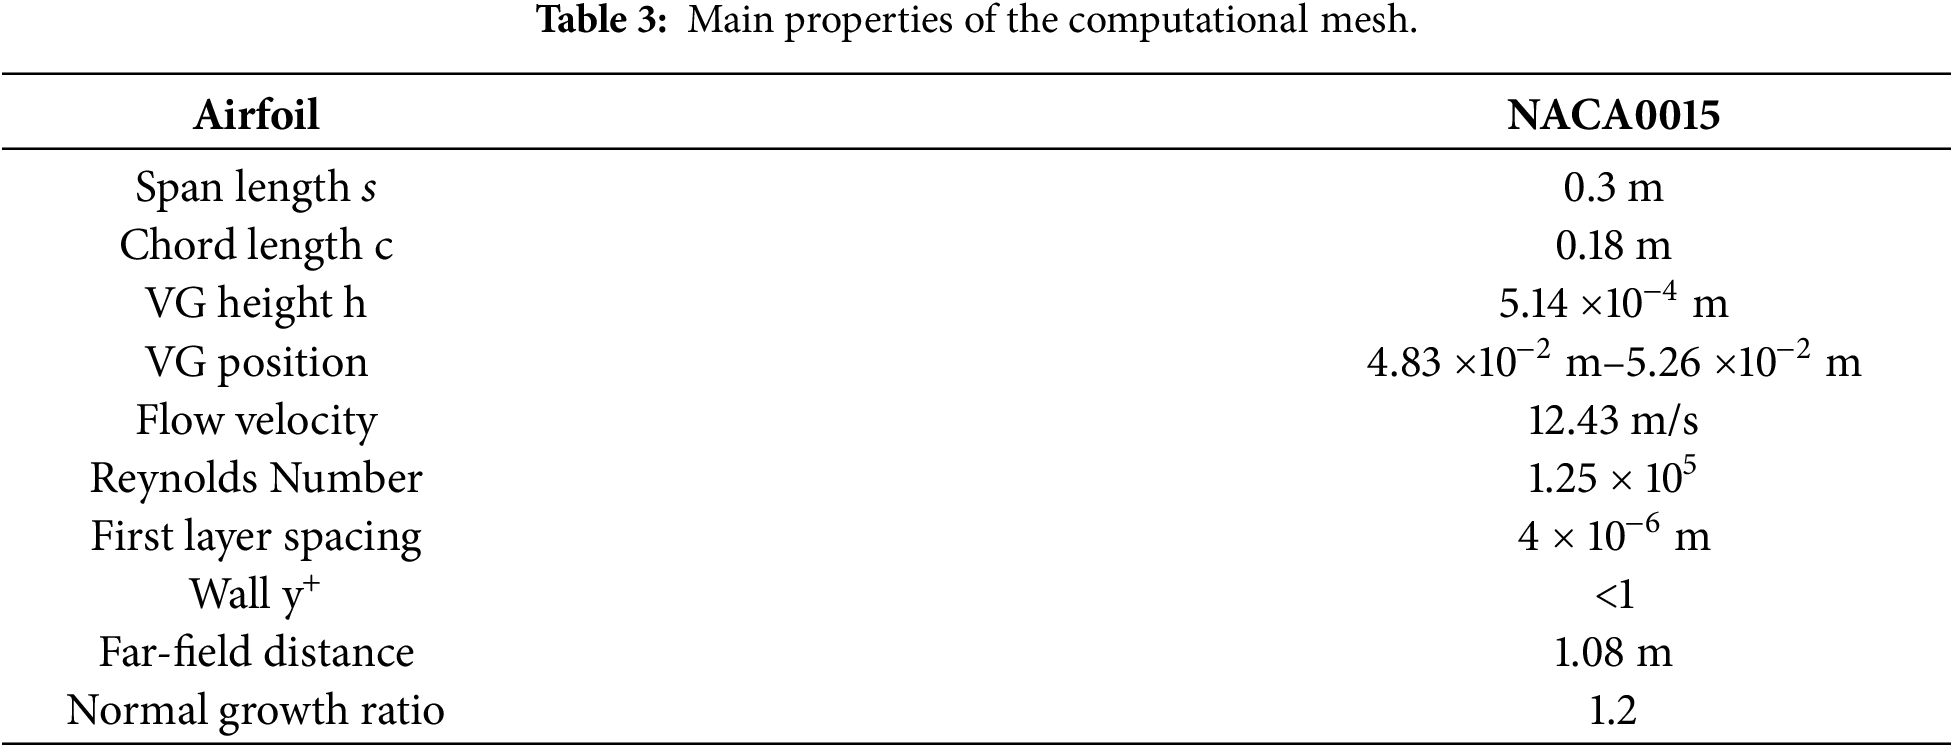
Fig. 5 displays the results of the aerodynamic lift (CL) and drag (CD) coefficients belonging to the uncontrolled and the controlled (whale-shaped model and the modified model with whale and VGs) cases at Re = 0.63 × 10⁵. Furthermore, the results of the current study are compared with those of Seyhan et al. [59] in terms of accuracy. In the validation case, the results are pretty consistent with one another. Furthermore, although there are slight differences due to experimental conditions and uncertainties, the trends appear consistent. However, depending on the turbulence model used in numerical modelling, there can be some variations in aerodynamic force coefficients. It was noted that, despite experimental differences resulting from the experimental environment and uncertainties, the trends remained consistent. Based on the previous experience of the current authors [65–67], the lack of linearity in the lift coefficient curves indicates the formation of LSB in low Reynolds number flows, and the sudden drop in the lift coefficient curve suggests abrupt stall and leading-edge separation due to a long LSB. Similar flow behaviors were observed in previous studies examining the aerodynamic performance of different airfoils [67–69].
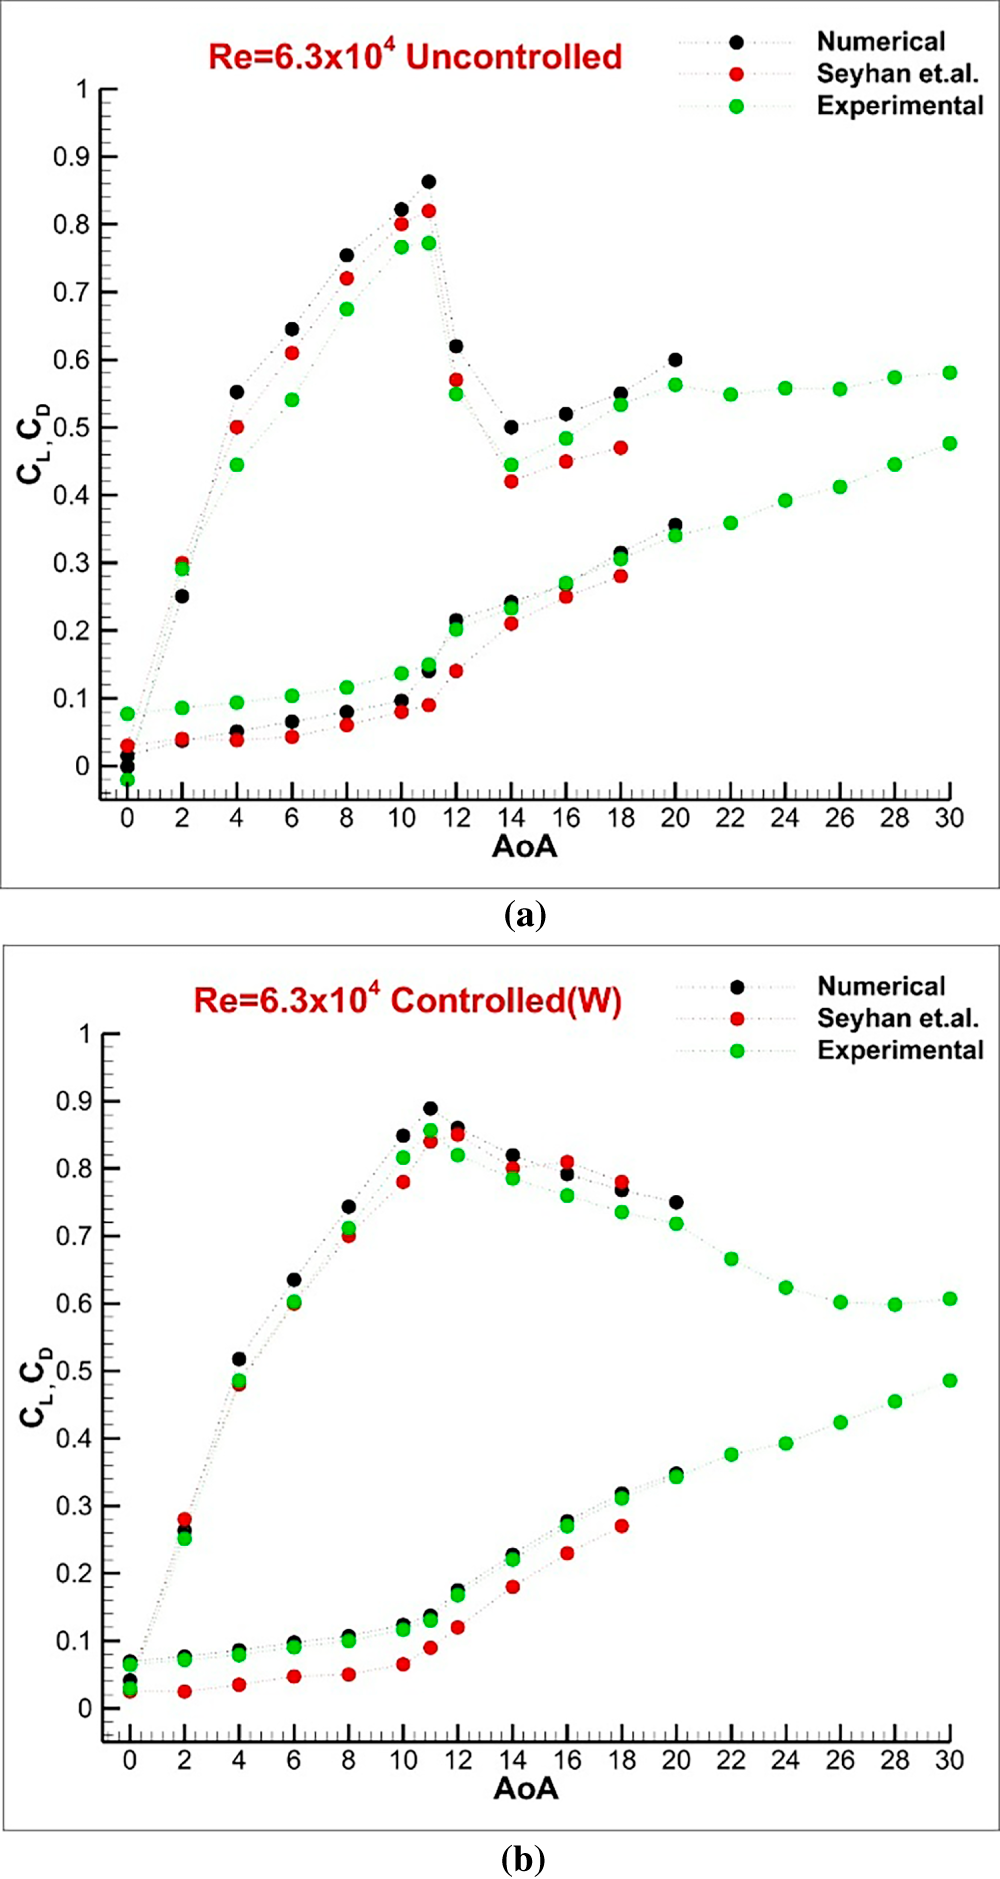
Figure 5: Comparison of aerodynamic force coefficients for (a) uncontrolled baseline case, (b) controlled whale-shaped airfoil at Re = 0.63 × 10⁵.
The graph for the modified model with whale tubercle and VG combinations (a novelty of the current paper) is illustrated in Fig. 6. For the baseline and the whale-shaped controlled case, the lift curves indicated that CL increased up to α = 11° at Re = 0.63 × 10⁵ (Fig. 6a). After α = 11°, the curves showed an abrupt stall. This was caused by the leading-edge separation due to the bubble bursting at low Reynolds number flows. The CL, max of the baseline case was around 0.76, whereas the maximum coefficient of the controlled case, just with the tubercle, was around 0.85. The maximum lift coefficient increased by 12%, while the drag coefficients decreased; however, the stall angle remained unchanged. For the controlled case of the modified model with the W+VGs case, it was observed that CL reached a maximum of 0.87. This indicates that utilizing VGs on the wind turbine blade with a tubercle provides an additional lift coefficient, increasing by 14.5% compared to other cases. The maximum lift coefficient was not just increased, but the stall angle was also postponed from α = 11° to α = 14°, and the drag coefficients decreased significantly. According to numerical modelling results at Re = 0.63 × 10⁵ and α = 14°, the lift coefficients for the baseline, W, and W+VGs were 0.42, 0.78, and 0.87, respectively. Under the same modelling conditions, the drag coefficient was 0.23, 0.22, and 0.13, respectively. The best CL/CD ratio was obtained for the case with W+VGs. Additionally, the stall characteristics changed, transitioning from an abrupt stall to a mild one. This, particularly with the combined use of the whale tubercle and VG configurations, resulted in a change in LSB dynamics due to the small vortices created, resulting in a flow with high momentum. Additionally, although small vortices formed in low-angle-of-attack flows reduce lift formation, these vortices control the flow and LSB by imparting momentum to the flow, particularly at stall and post-stall angles of attack. In real-world applications, this control translates to increased energy output and blade stability. Although there are anticipated challenges in manufacturing these types of blades, since the blades are produced in molds, these designs can be tested with new molds to achieve this increase in energy output, despite the initial costs. Moreover, considering the existence of VG applications in real turbine applications, this suggests that the new concept design presented in this study will not show significant difficulties in its applicability.
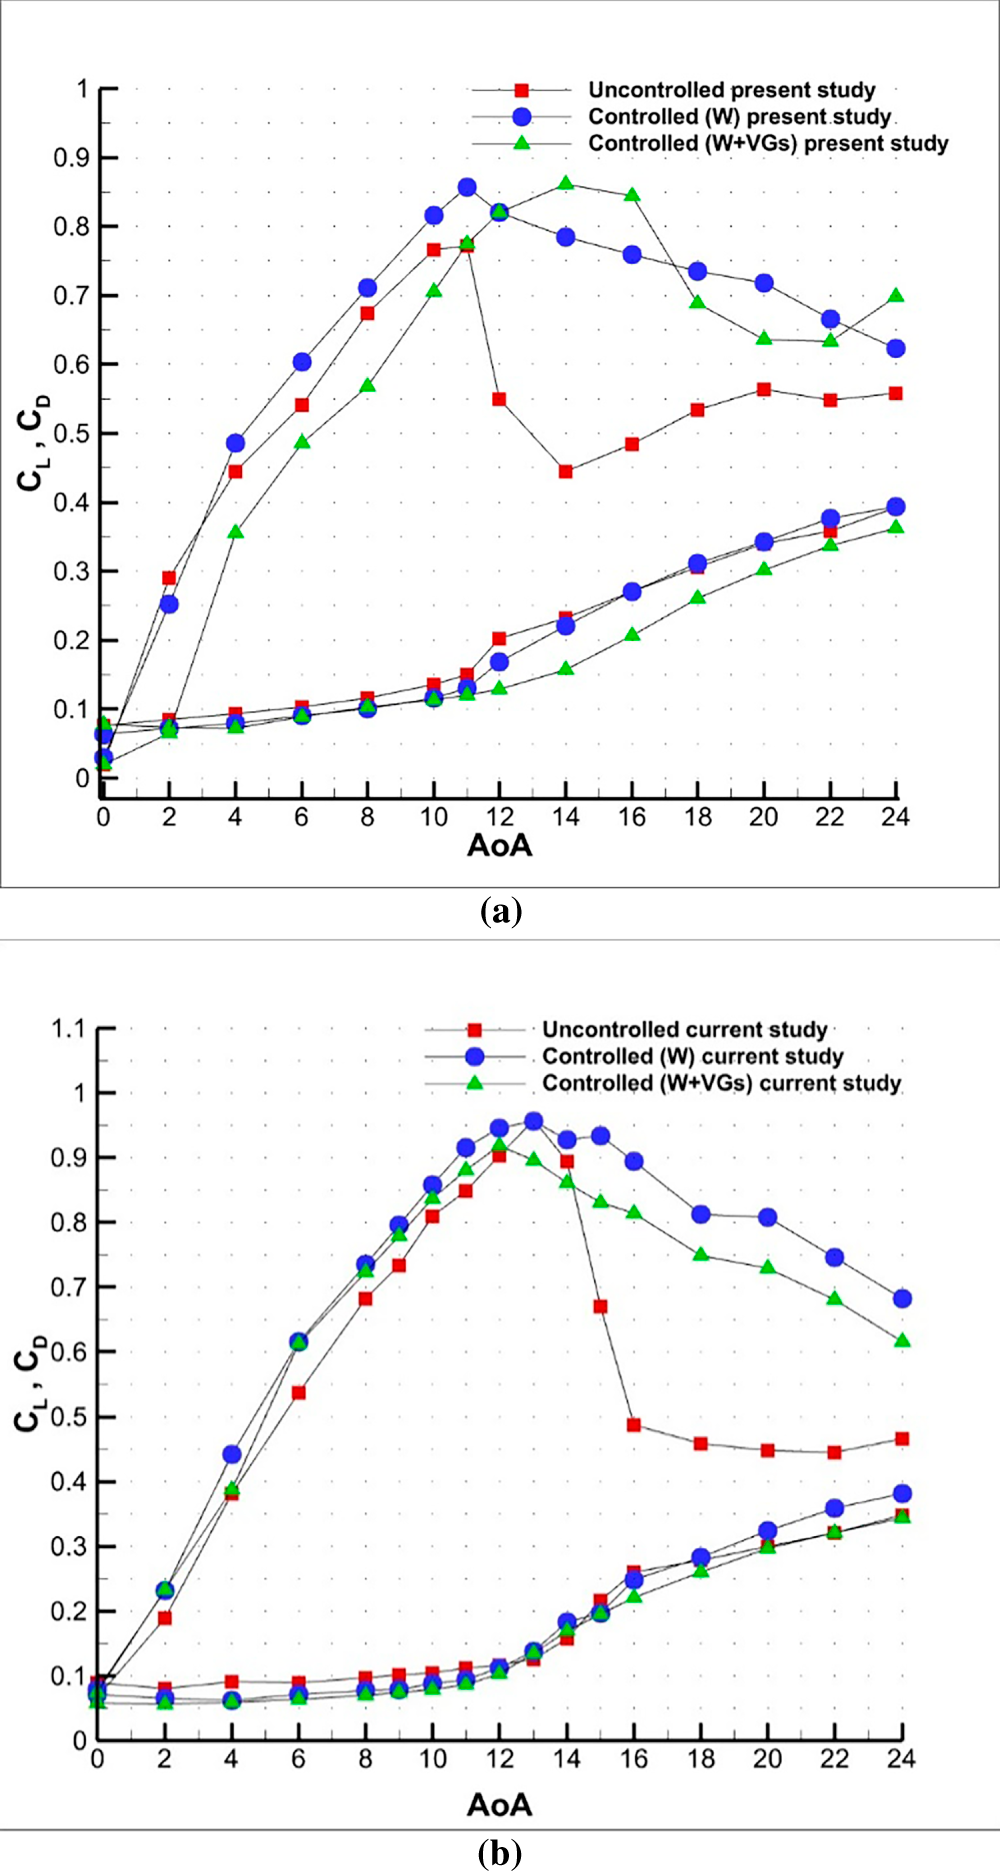
Figure 6: Comparison of experimental aerodynamic force coefficients for the uncontrolled and the controlled cases at (a) Re = 0.63 × 10⁵, (b) Re = 1.25 × 10⁵.
When examining all cases at Re = 1.25 × 10⁵ in Fig. 6b, a more linear trend was observed in the lift coefficient curve, with an increase in inertia and a decrease in LSB formation in the uncontrolled case. In the tuberculated controlled airfoil, minor improvements in lift coefficient and mild stall were observed before the stall due to the whale structure. In the W+VG-controlled airfoil, due to the use of VGs in addition to the whale structure, the resulting small vortices provide less improvement to the flow, resulting in an early stall. It was noted that an abrupt stall occurred in the uncontrolled case, whereas this situation was mitigated to a mild stall phenomenon by utilizing a passive flow controller. Additionally, a decrease in drag forces was observed in the controlled cases due to the formation of small vortices.
4.1 Experimental Results and Validation
The experimental results for both the baseline and controlled NACA0015 airfoils are presented in this section. Force measurements and oil flow visualization were performed to investigate the aerodynamic behavior at various angles of attack. The baseline airfoil serves as a reference, while the controlled airfoil allows evaluation of the effects of modifications on lift, drag, and flow separation. Experimental findings are further compared with numerical results from skin friction coefficient (Cfx) simulations and vorticity analyses to provide a comprehensive understanding of the flow characteristics.
Fig. 7 presents the changes in L/D ratios resulting from increases in lift coefficients and decreases in drag coefficients. An examination of these graphs demonstrated that controlled cases contributed to aerodynamic performance at both Reynolds numbers. When Fig. 7a is examined in detail, it can be seen that for Re = 0.63 × 10⁵, the highest CL/CD ratio is obtained for case W at the pre-stall angles, while after the post-stall angle, it is obtained for the case W+VGs. After a 20-degree angle of attack, the CL/CD ratios become very close to each other. At angles of attack greater than 20 degrees, the CL/CD ratios become very close to each other. According to the numerical modelling results obtained with a Re value of 1.25 × 10⁵ and α = 9°, the CL/CD ratio for the baseline, the W, and the W+VG cases is approximately 7.3, 10.1, and 10.6, respectively. In the post-stall case (α > 16°), W and W+VG give roughly the same values, and these values are greater than the base case. While the aerodynamic performance of the airfoil with a tubercle increased at all angles of attack, the increase was greater after stall for the W+VG airfoil. This means that while the vortices generated by VGs negatively impact LSB dynamics, in higher Reynolds number flows, the higher inertia before the stall results in smaller, higher-frequency vortices. These vortices impart momentum, positively impacting LSB dynamics.
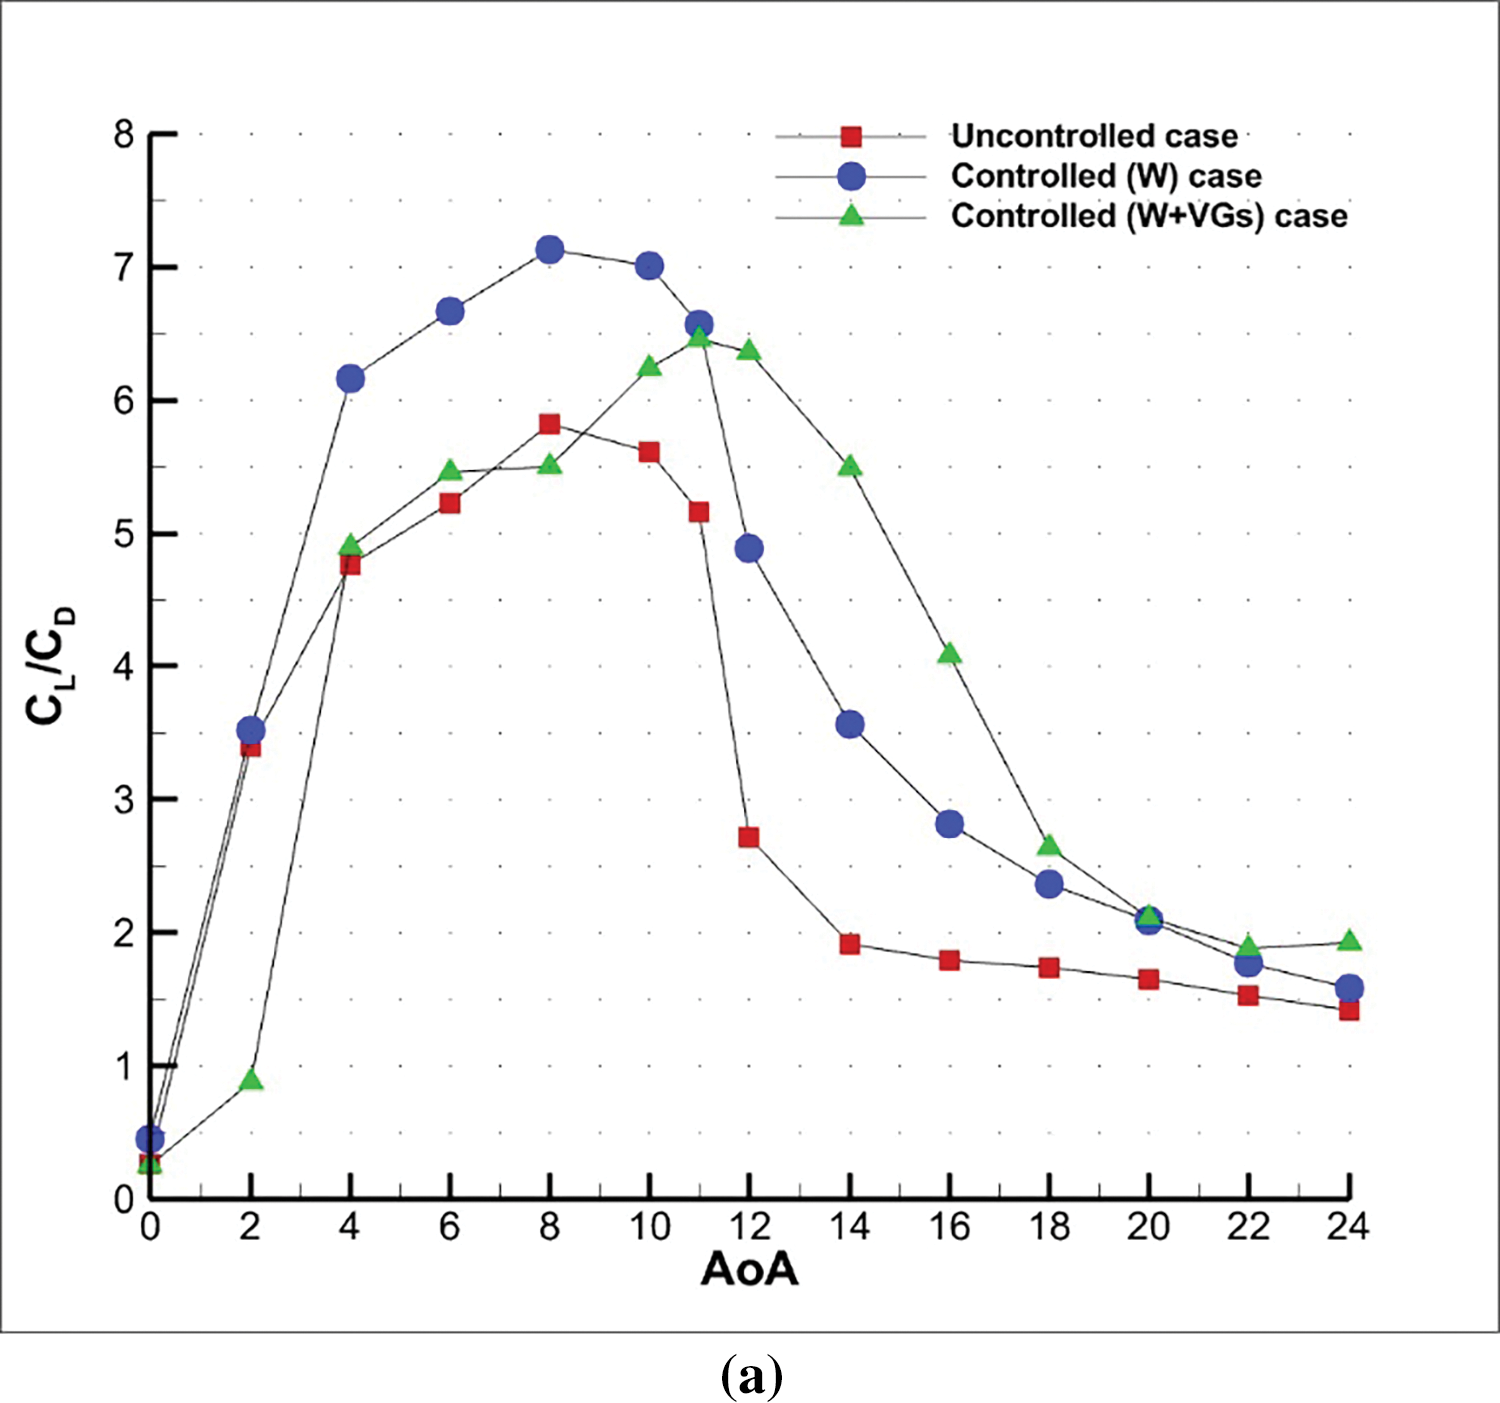
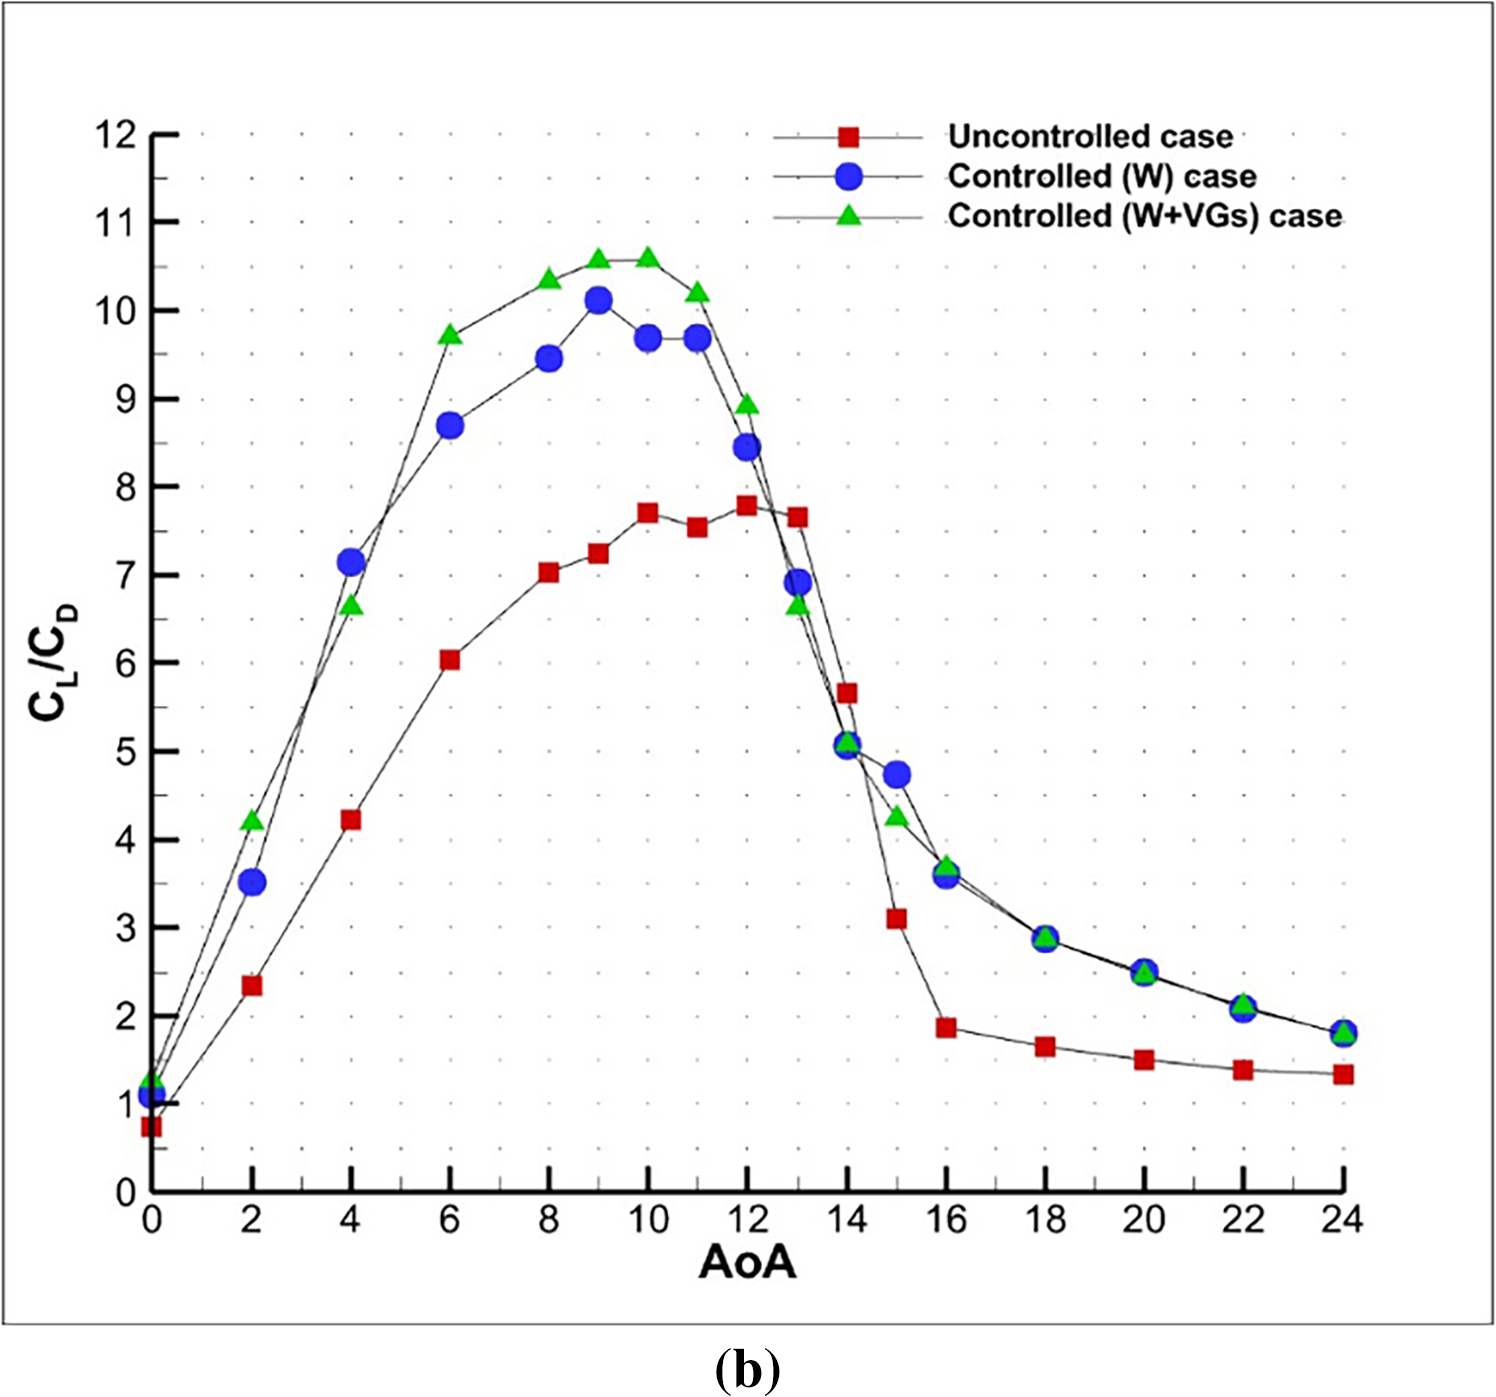
Figure 7: Comparison of L/D ratios of the uncontrolled and the controlled cases at (a) Re = 0.63 × 10⁵, (b) Re = 1.25 × 10⁵.
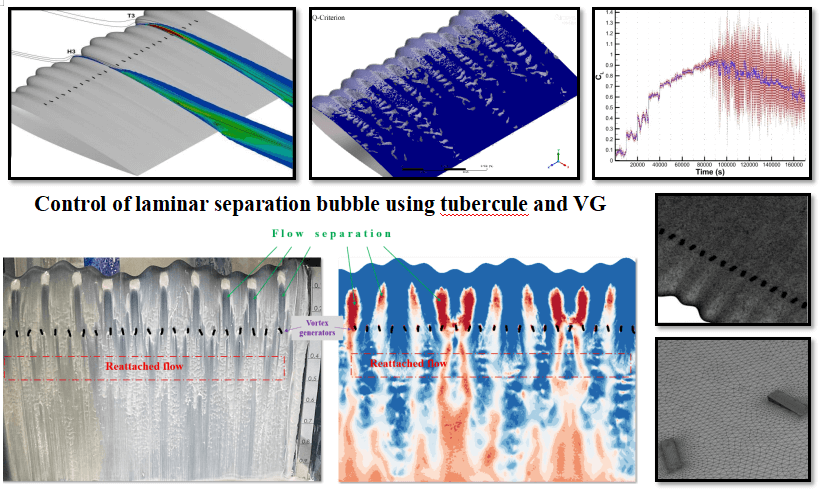
The time-dependent lift force results, which yield undulated lift curves, may provide more detailed and reasonable information than those obtained at their mean values. Driven by this motivation, apart from the mean CL results, the time-dependent CL histories of the uncontrolled and controlled cases obtained from experiments at Re = 1.25 × 10⁵ were compared with each other, as illustrated in Fig. 8. Each pair of columns represents an angle of attack in the graphs. Additionally, a moving average, calculated as the average of the previous 100 data points, was added to the graphs. This graph shows the lift fluctuations of the airfoil as it is affected by the unsteady changing LSB dynamics and flow conditions. The critical results were evident when Fig. 8 was carefully evaluated. For both graphs, the mean values of CL as lift fluctuations increased when the angle of attack increased gradually. The amplitude of those fluctuations before α = 10° was more pronounced in the curve of the uncontrolled cases. This indicated that the flow could not attach to the surface of the airfoil; instead, LSB formation occurred due to the presence of adverse pressure gradients. After α = 13°, a stall phenomenon occurred. It was also foreseen that the aerodynamic vibration was pronouncedly increased after the stall angle, as the fluid-structure interactions were more pronounced in the boundary layer. Regarding the results of the controlled cases, it was observed that utilizing a combination of tubercle and VGs application on NACA0015 not only increased the lift coefficient but also affected the LSB dynamics and reduced the aerodynamic vibration. Moreover, the spectral analysis results belonging to α = 10° and α = 16° were specifically provided to understand the effect of the passive flow controller on the LSB dynamics in Fig. 9. When looking at the spectral analysis graphs, it was seen that while the baseline case had lower-frequency peaks due to large vortices caused by the LSB and flow separation, the whale-shaped airfoil had shrunk in size due to the tubercle shape, increasing the peak frequency. In the W+VG airfoil case, the number of peak frequencies has risen to two due to the formation of small vortices, due to both the tubercle shape and the VGs.
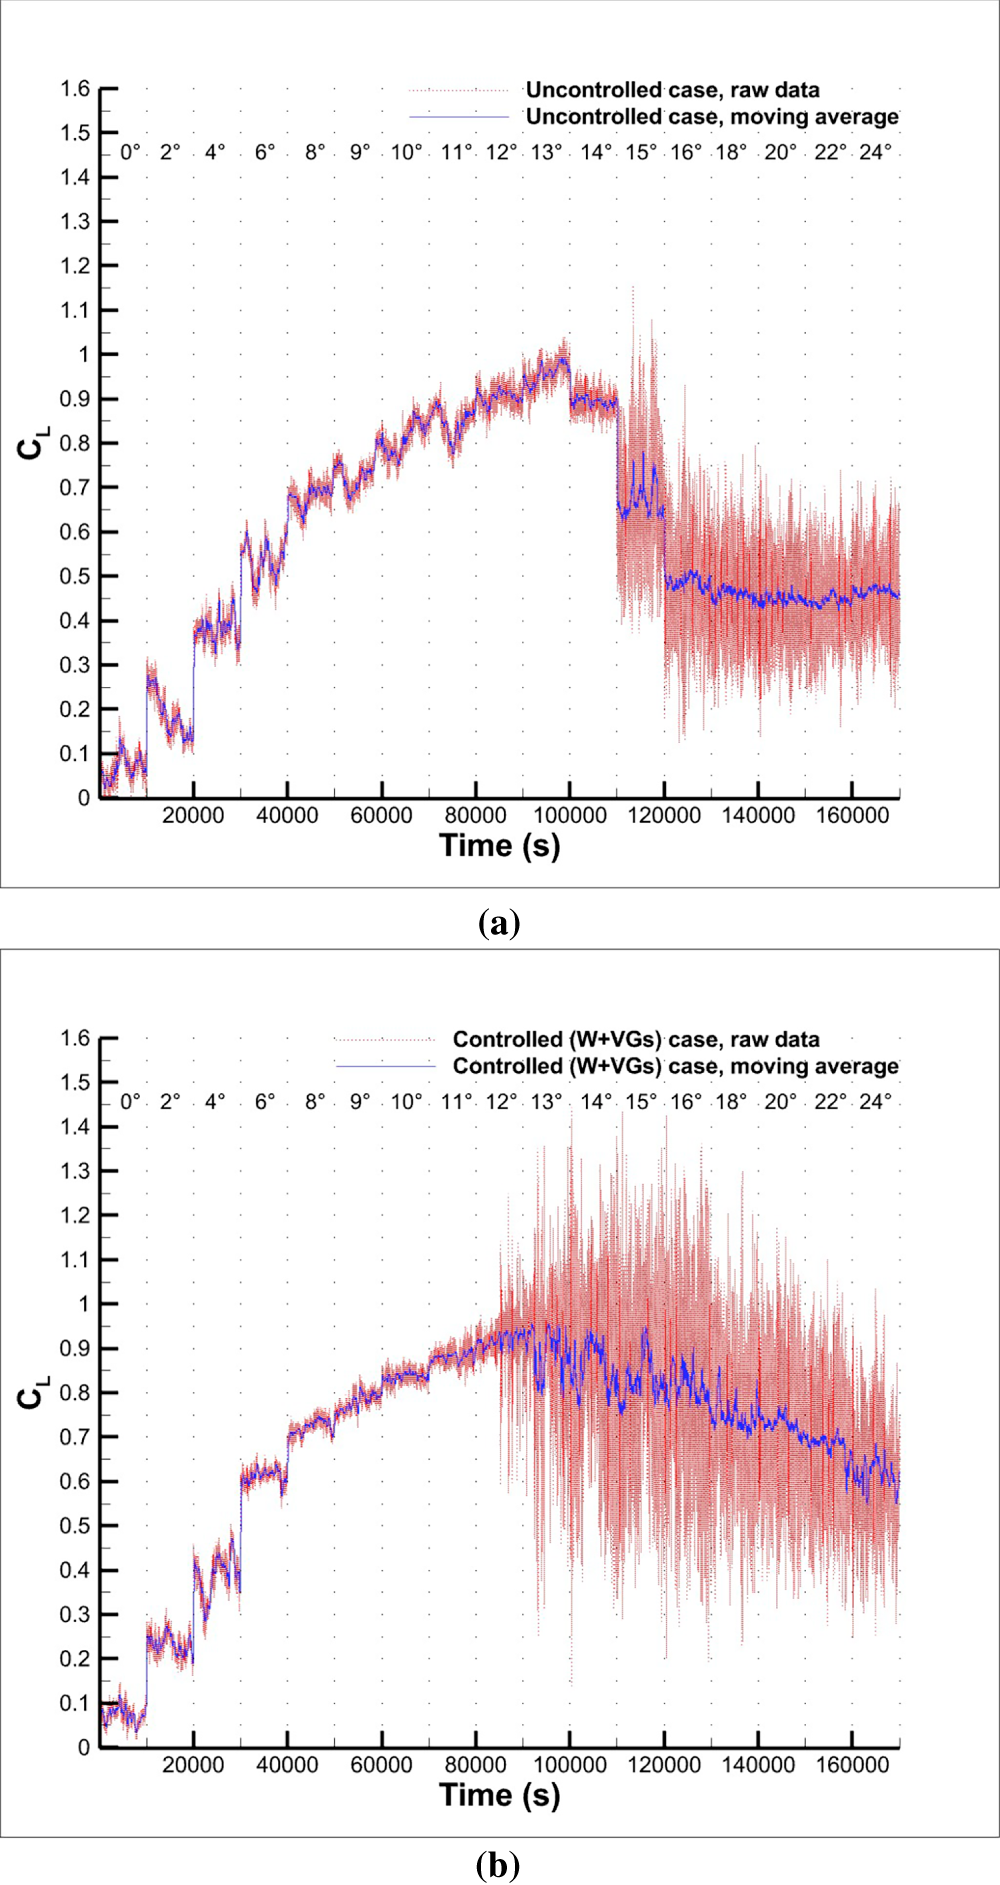
Figure 8: Time-dependent CL vs. time (s) at Re = 1.25 × 10⁵ for (a) the uncontrolled case, (b) the controlled (W+VGs) case.
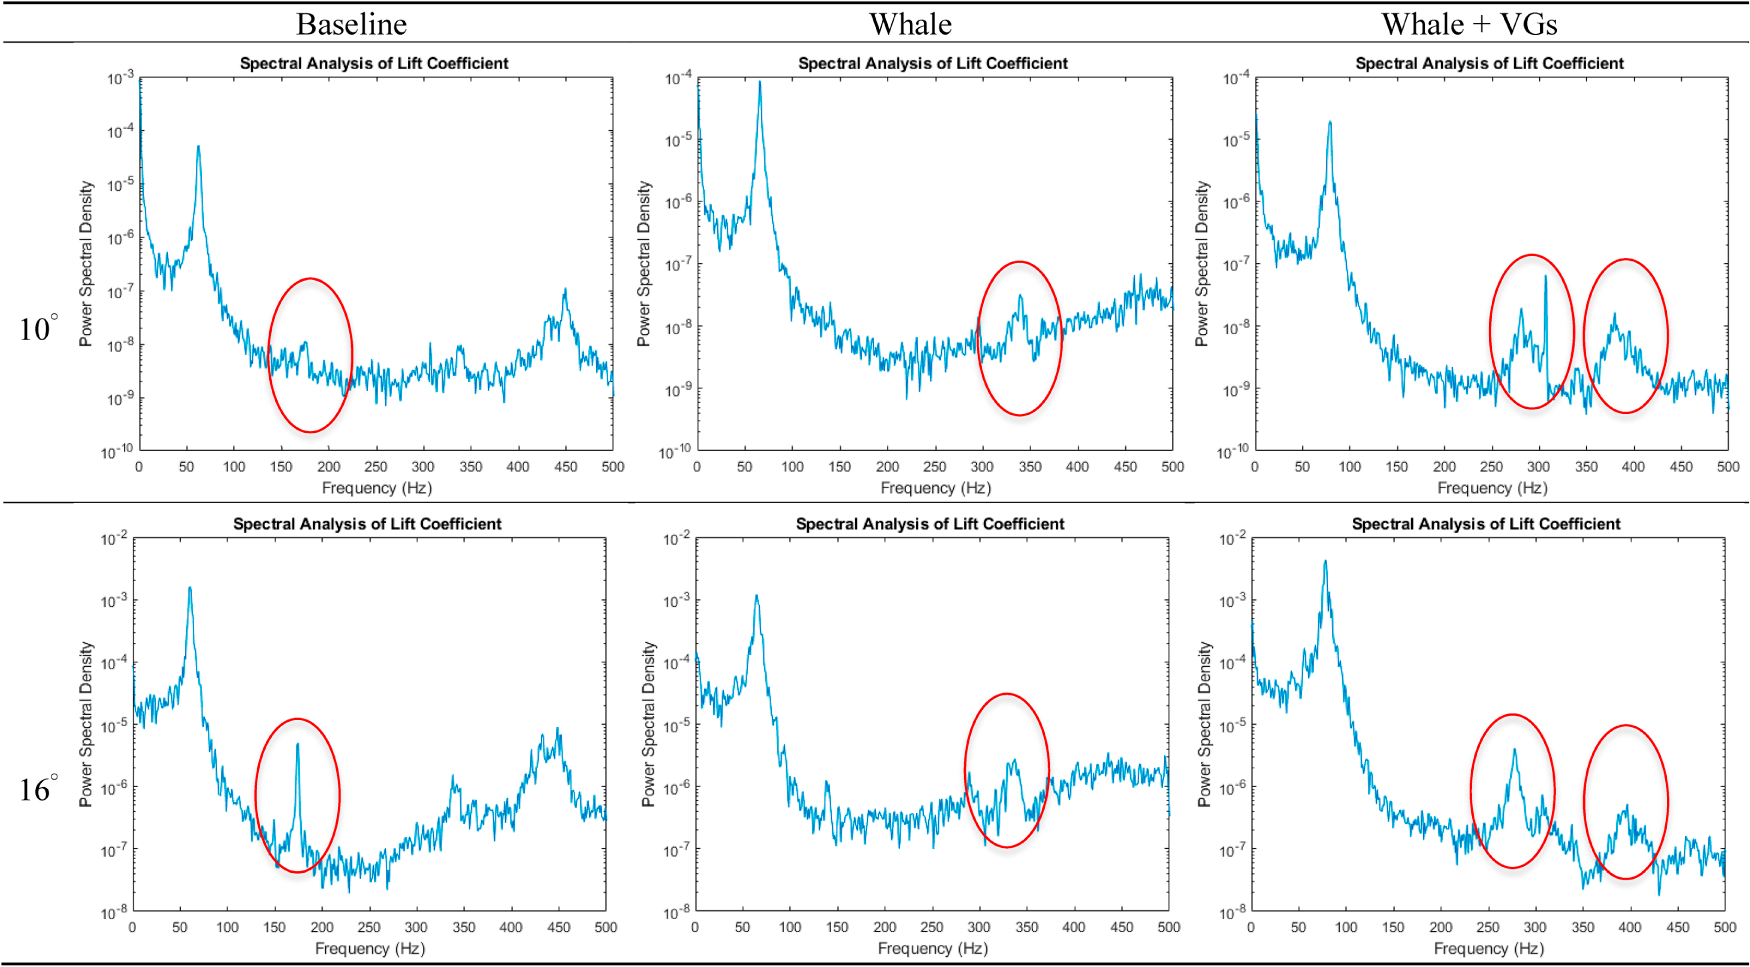
Figure 9: The spectral analysis results of time-dependent CL for all cases at Re = 1.25 × 10⁵.
In order to see the effect of whale tubercle airfoil shape and VGs on LSB dynamics in controlled cases in more detail, the flow physics results obtained from computational modelling results were discussed in the rest of the paper. Surface flow visualization and numerical Cfx results for NACA0015 airfoil at Re = 1.25 × 10⁵ were provided to capture the surface flow patterns along the suction surface of the uncontrolled cases, as seen in Fig. 10. Cfx was obtained from the x-wall shear stress in the numerical results. The negative values in the Cfx legend indicate the flow separation. The oil flow visualization results of the current study were investigated by comparing surface flow visualization for NACA634-021 airfoil at Re = 1.8 × 10⁵ in a literature study [67]. Fig. 10 clearly showed that laminar flow formed at the leading-edge part of the uncontrolled airfoils, followed by the formation of LSB at the middle part in both our computational modelling and experimental analysis. After the presence of LSB, a turbulent flow region occurred at the trailing edge. And, the tip vortex effects were seen in all cases. Furthermore, the numerical flow patterns obtained in the current study were in agreement with the results from the literature. Therefore, it was anticipated that the numerical findings of the current research would accurately provide knowledge related to the LSB dynamics and flow patterns formed in the controlled cases.
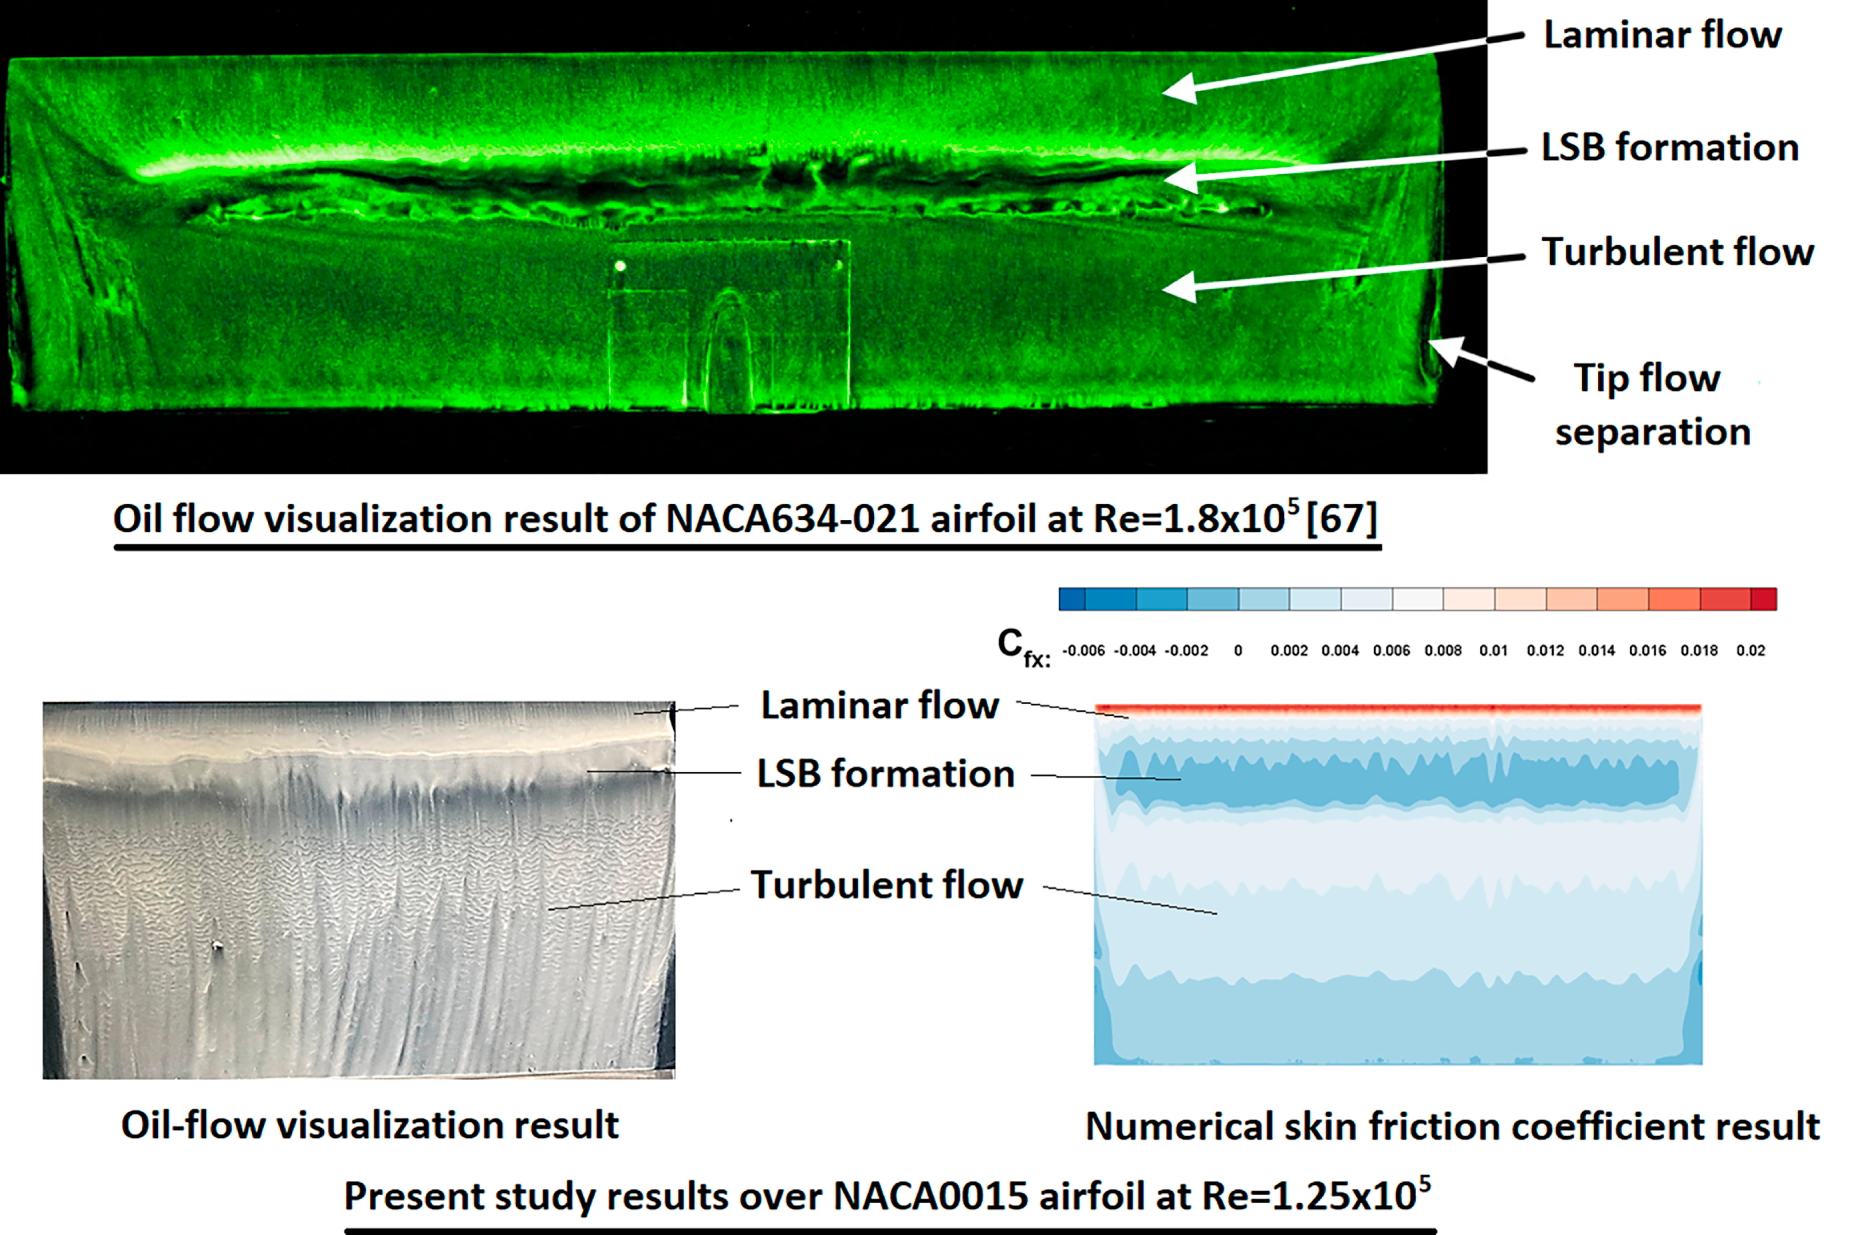
Figure 10: Comparison of surface flow visualization and numerical skin friction coefficient results.
The impacts of the controlled cases with the tubercle (W) and tubercle/VGs (W+VGs) combination on the flow features were comprehensively investigated through both computational modelling and experimental analysis at α = 8° and Re = 1.25 × 10⁵ as illustrated in Figs. 11 and 12, respectively. In terms of better clarifying the flow features on the controlled case (W), a sketch was joined at the top of the graph in Fig. 11. The results of surface oil flow visualization revealed that there was an oil accumulation in the downstream trough. Those flow patterns exerted by the oil accumulation clearly demonstrated the flow recirculation in this region, resulting in the existence of counter-rotation vortex pairs (CRVPs). Those surface CRVPs were primarily responsible for the spanwise pressure differences, in agreement with the findings of Wei et al. [67,70,71]. As explained, there was less pressure downstream of tubercle troughs compared to tubercle peaks due to the separated flow. This refers to the downstream flow of tubercle peaks, which are moved by pressure gradients into the trough regions, leading to oil accumulation in these regions. Additionally, the less dark region behind the CRVPs showed slight flow separations, which means the surface CRVP. As for the experimental and numerical flow patterns on the suction surface of the controlled case (W+VGs), the combination of tubercle and VGs, with the close-up inspection of VGs, was demonstrated numerically and experimentally in Fig. 12. As usual, oil accumulation and flow separation regions also existed in all cases. However, it was observed that their size was relatively smaller than that of the controlled case (W), as indicated by the numerical turbulence intensity contours in Fig. 13. Additionally, the reattached flow structures with the momentum transfer were visualized behind the VGs (Figs. 12 and 13) through numerical modelling, allowing for more detailed analyses. Focused on close-up inspection, the counter-rotation vortex pairs produced by VGs caused the flow to become reattached with momentum increasing (Fig. 13). It was also revealed that the formation of surface CRVPs had disappeared. This showed that the passive flow control combinations effectively impact the flow patterns compared to the baseline and the controlled case (W), as illustrated in Figs. 11–13. Apart from those findings, it was thought that separation reduction occurred due to the VG combination, which harmonized the spanwise flow disturbances when the modification was utilized. This played a dominant role in the lift curves in Fig. 5. It was noted that using a combination of passive flow control methods enabled higher lift than the controlled and controlled (W) cases.
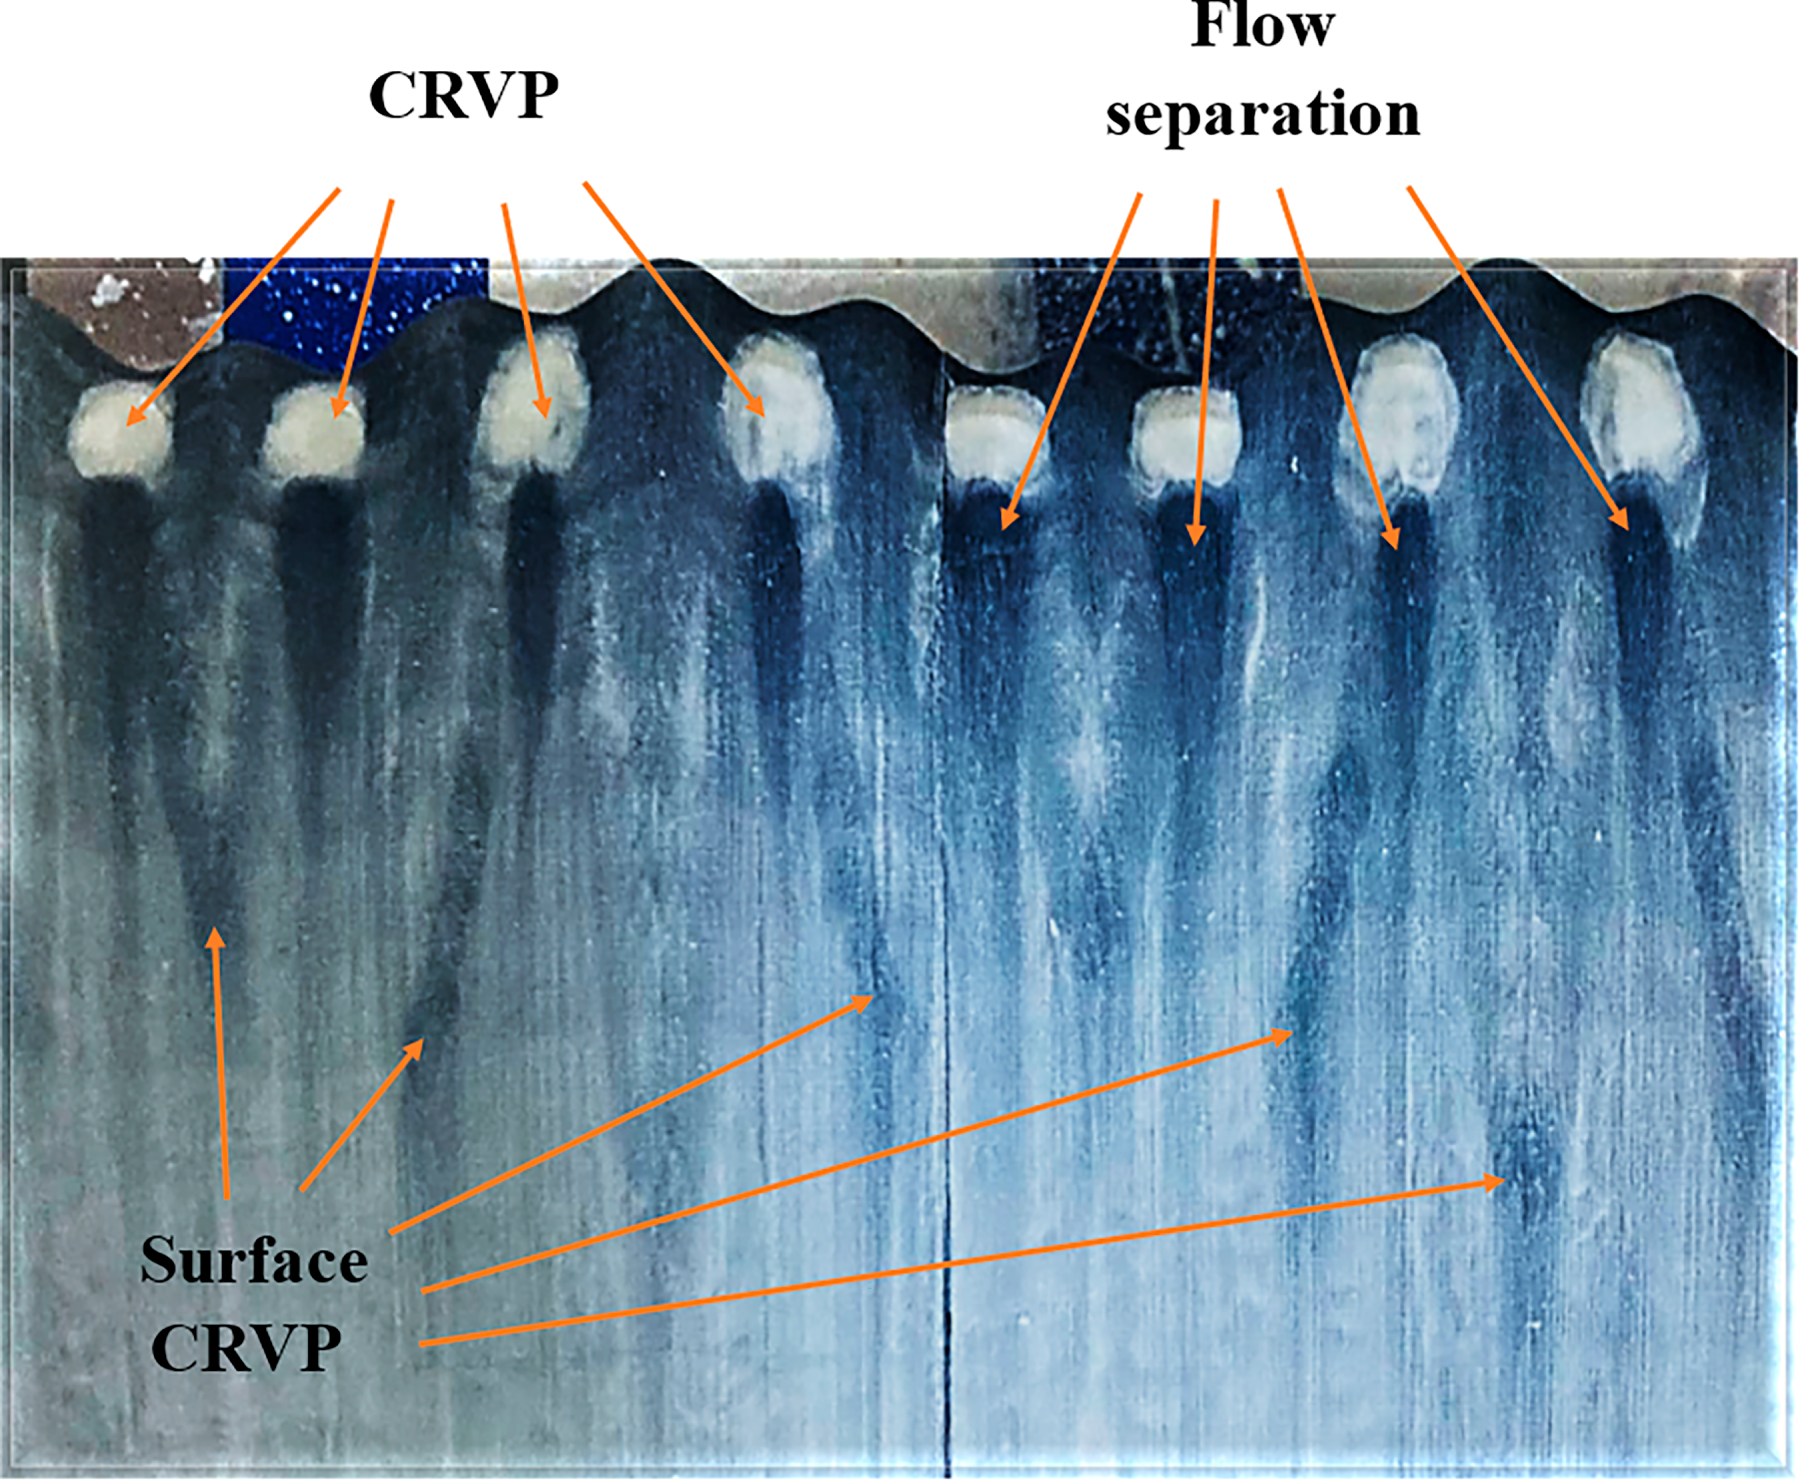
Figure 11: Surface oil flow visualization for the controlled (W) case, α = 8°, Re = 1.25 × 10⁵.
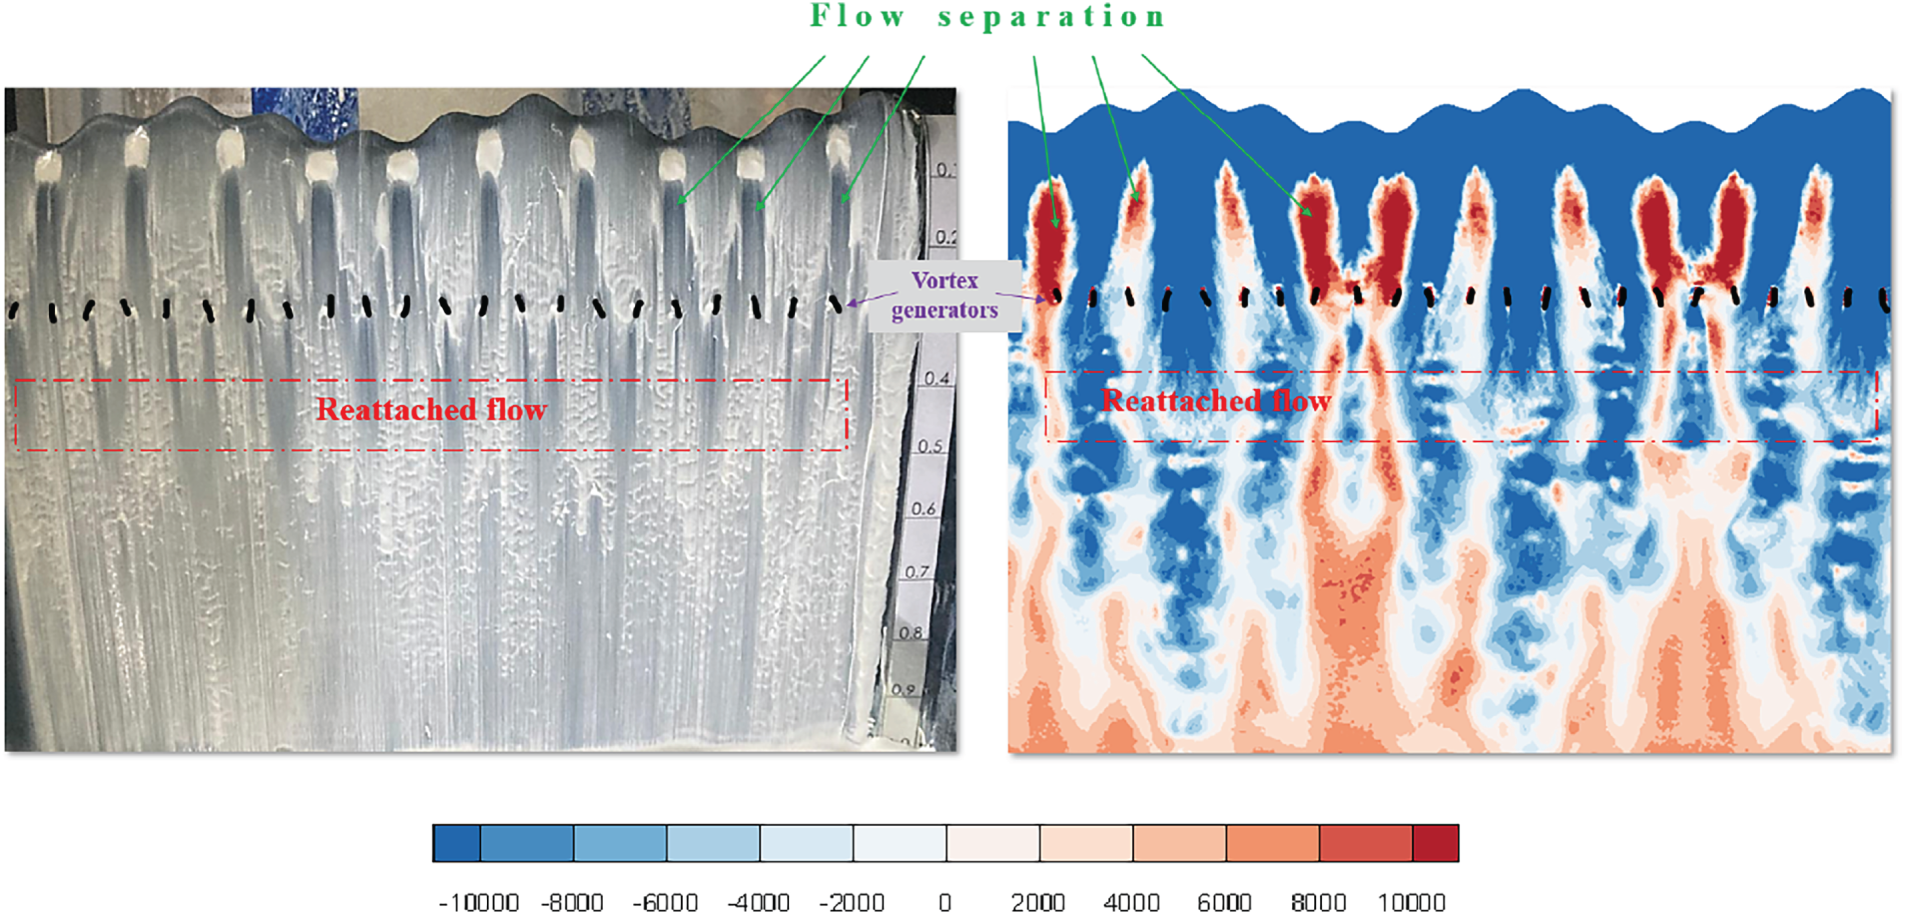
Figure 12: Surface oil flow visualization and numerical vorticity results for the controlled (W+VGs) case, α = 8°, Re = 1.25 × 10⁵.
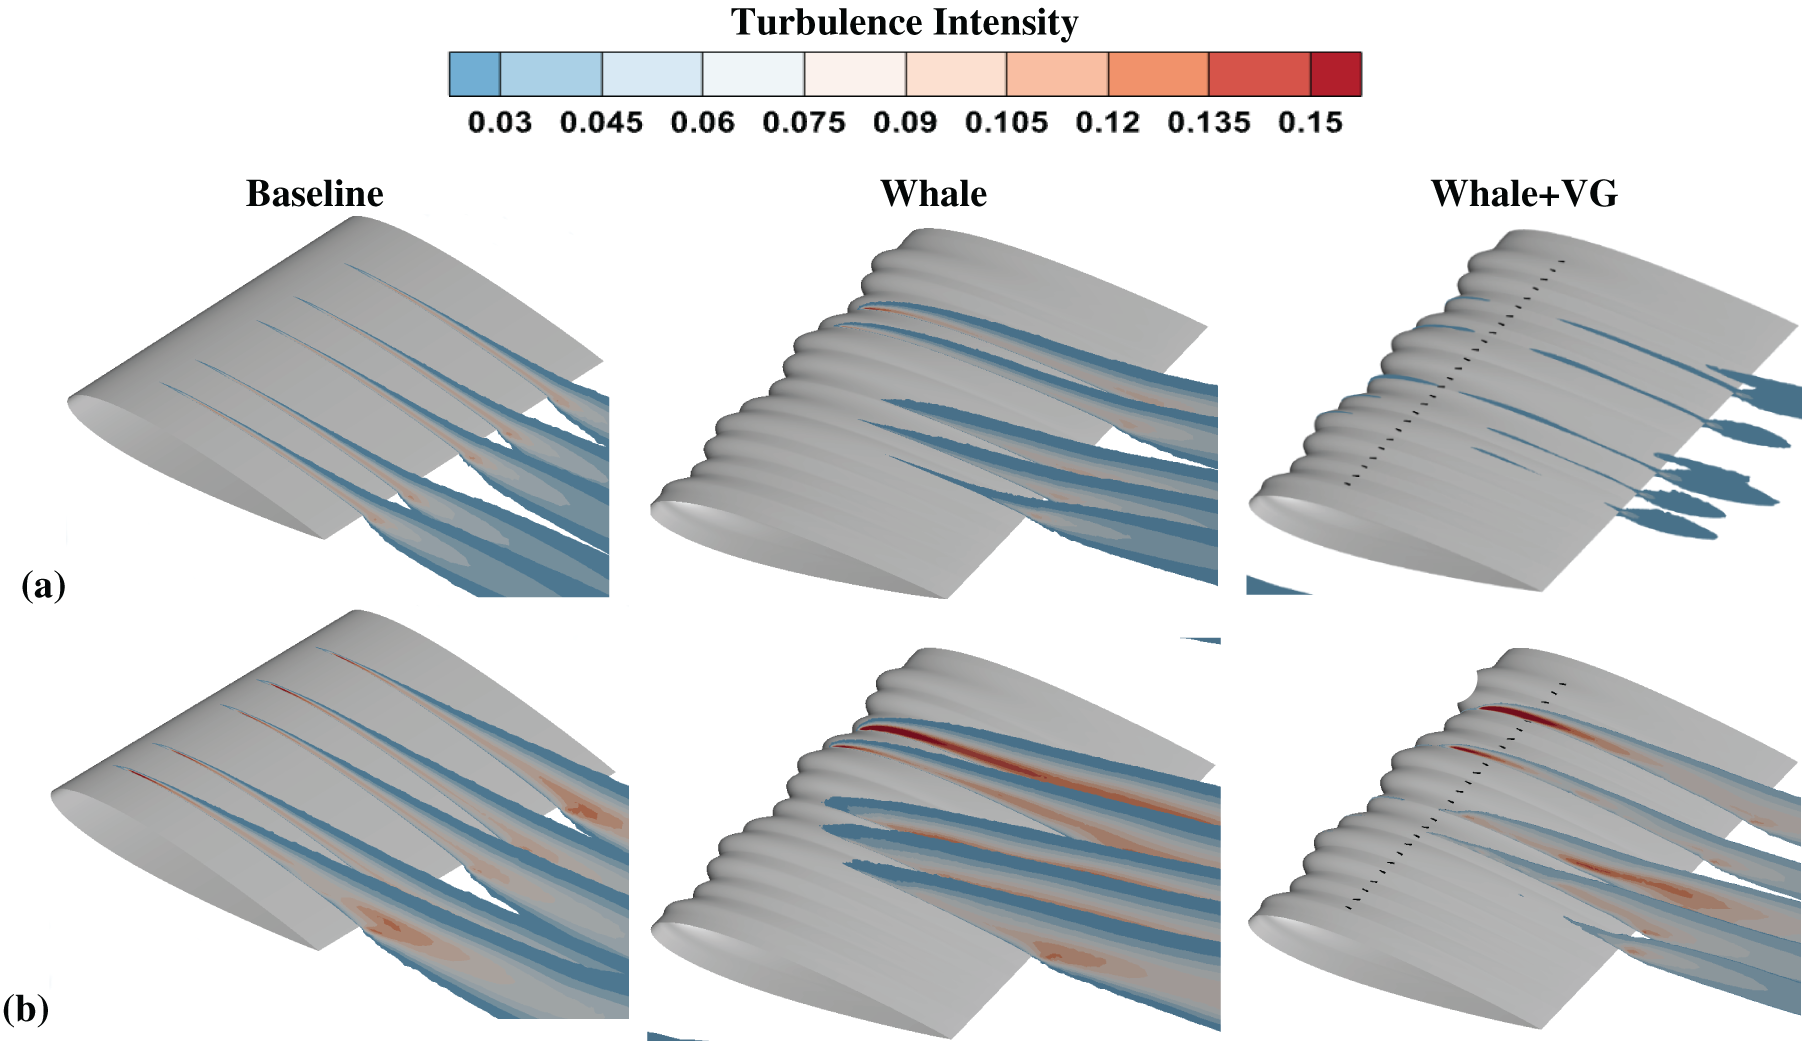
Figure 13: Numerical turbulence intensity of the uncontrolled and the controlled cases at (a) α = 8°, (b) α = 12°, and Re = 1.25 × 10⁵.
Turbulent kinetic energy distributions, turbulence intensity, and intermittency contours are analyzed to investigate the flow structures around both baseline and controlled NACA 0015 airfoils. Q-Criterion vortex regions are visualized to identify coherent vortex structures, while comparisons of Q-Criterion colored with TKE distributions over the airfoil surface and x-component velocity contours in the wake region provide a detailed understanding of the flow dynamics. These numerical observations are analyzed at the considered angles of attack to highlight the key aerodynamic characteristics of both baseline and controlled airfoils. The results regarding turbulence intensity obtained from numerical modelling are presented in Fig. 13 for three different cases with Re = 1.25 × 10⁵. According to these results, no change in turbulence intensity was observed in any of the planes in the baseline case. In the W case, the turbulence intensity in the region with the short protrusion is higher than in other areas. The same situation applies to W+VGs. To reveal the flow control capability of our new concept (W+VG) configuration in more detail, the numerical study results are depicted in Fig. 14. In these figures, turbulence kinetic energy contours were shown in detail in the controlled cases through the planes at troughs (T) and hills (H). As seen in Fig. 14, the transition to turbulence was accelerated at the troughs due to the flow circulations as mentioned in Fig. 11, and increases were observed in the turbulence kinetic energies after the transition to turbulence. In addition to these increases, the presence of vortex generators at the troughs increased the momentum gain to the flow, further improving the flow and reducing the LSB formations and trailing edge separations. In addition, the flow circulations were less at the hills, and therefore, the flow improvement and the decrease in trailing edge separation in the whale cases were limited. When the VGs coincided with these hills, the flow separations decreased with the momentum gain in the flow. Other parameters considered in evaluating the aerodynamic performance of the flow are turbulence, kinetic energy, and intermittency, as shown in Fig. 15.
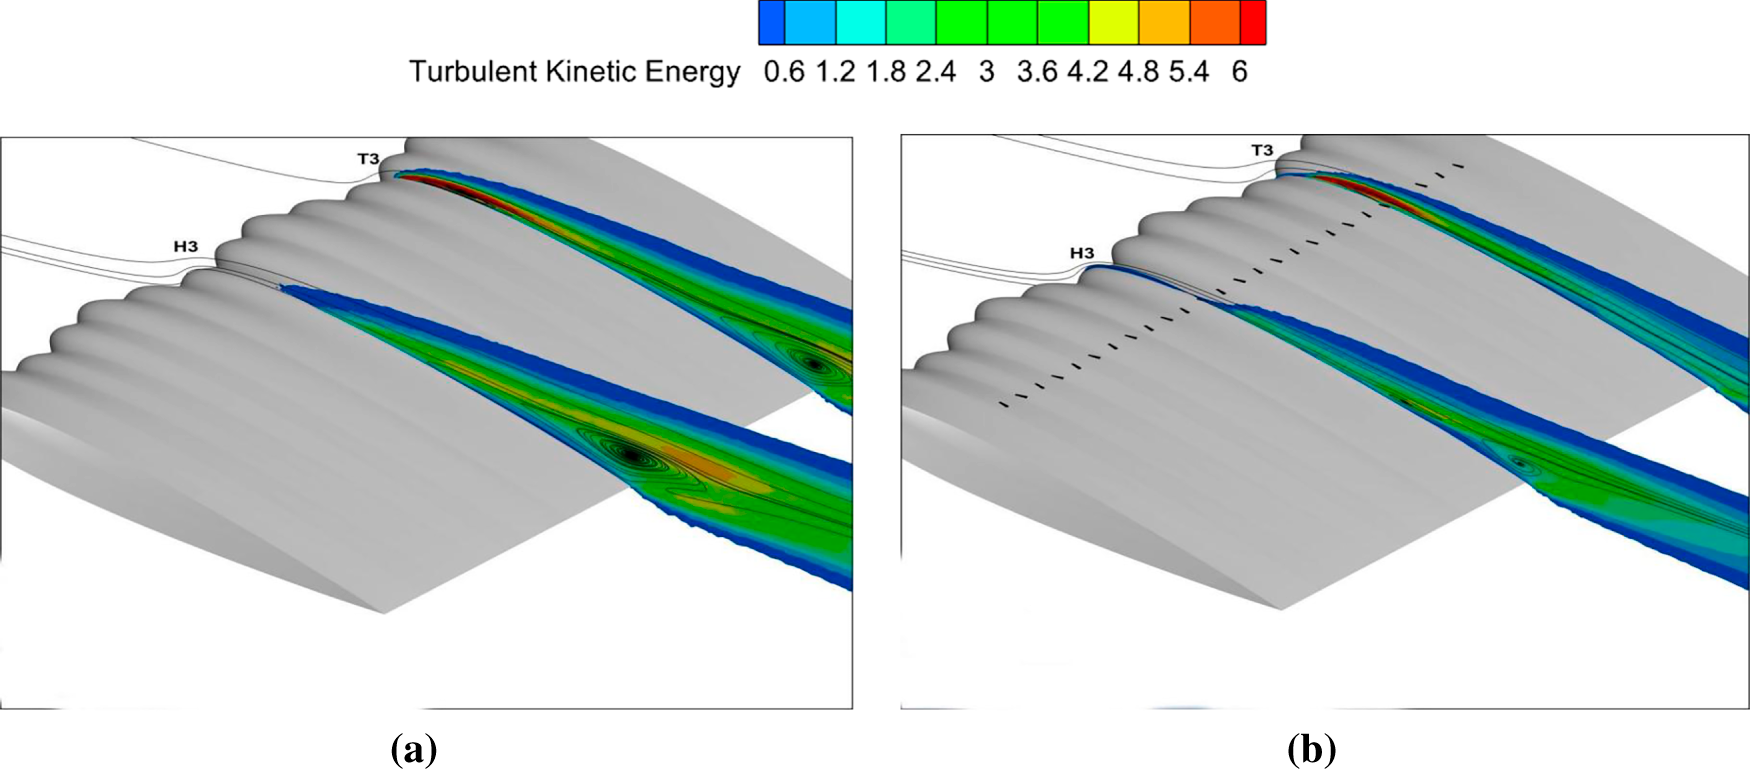
Figure 14: Numerical turbulent kinetic energy distributions of the controlled cases of (a) W and (b) W+VG at α = 12° and Re = 1.25 × 10⁵.
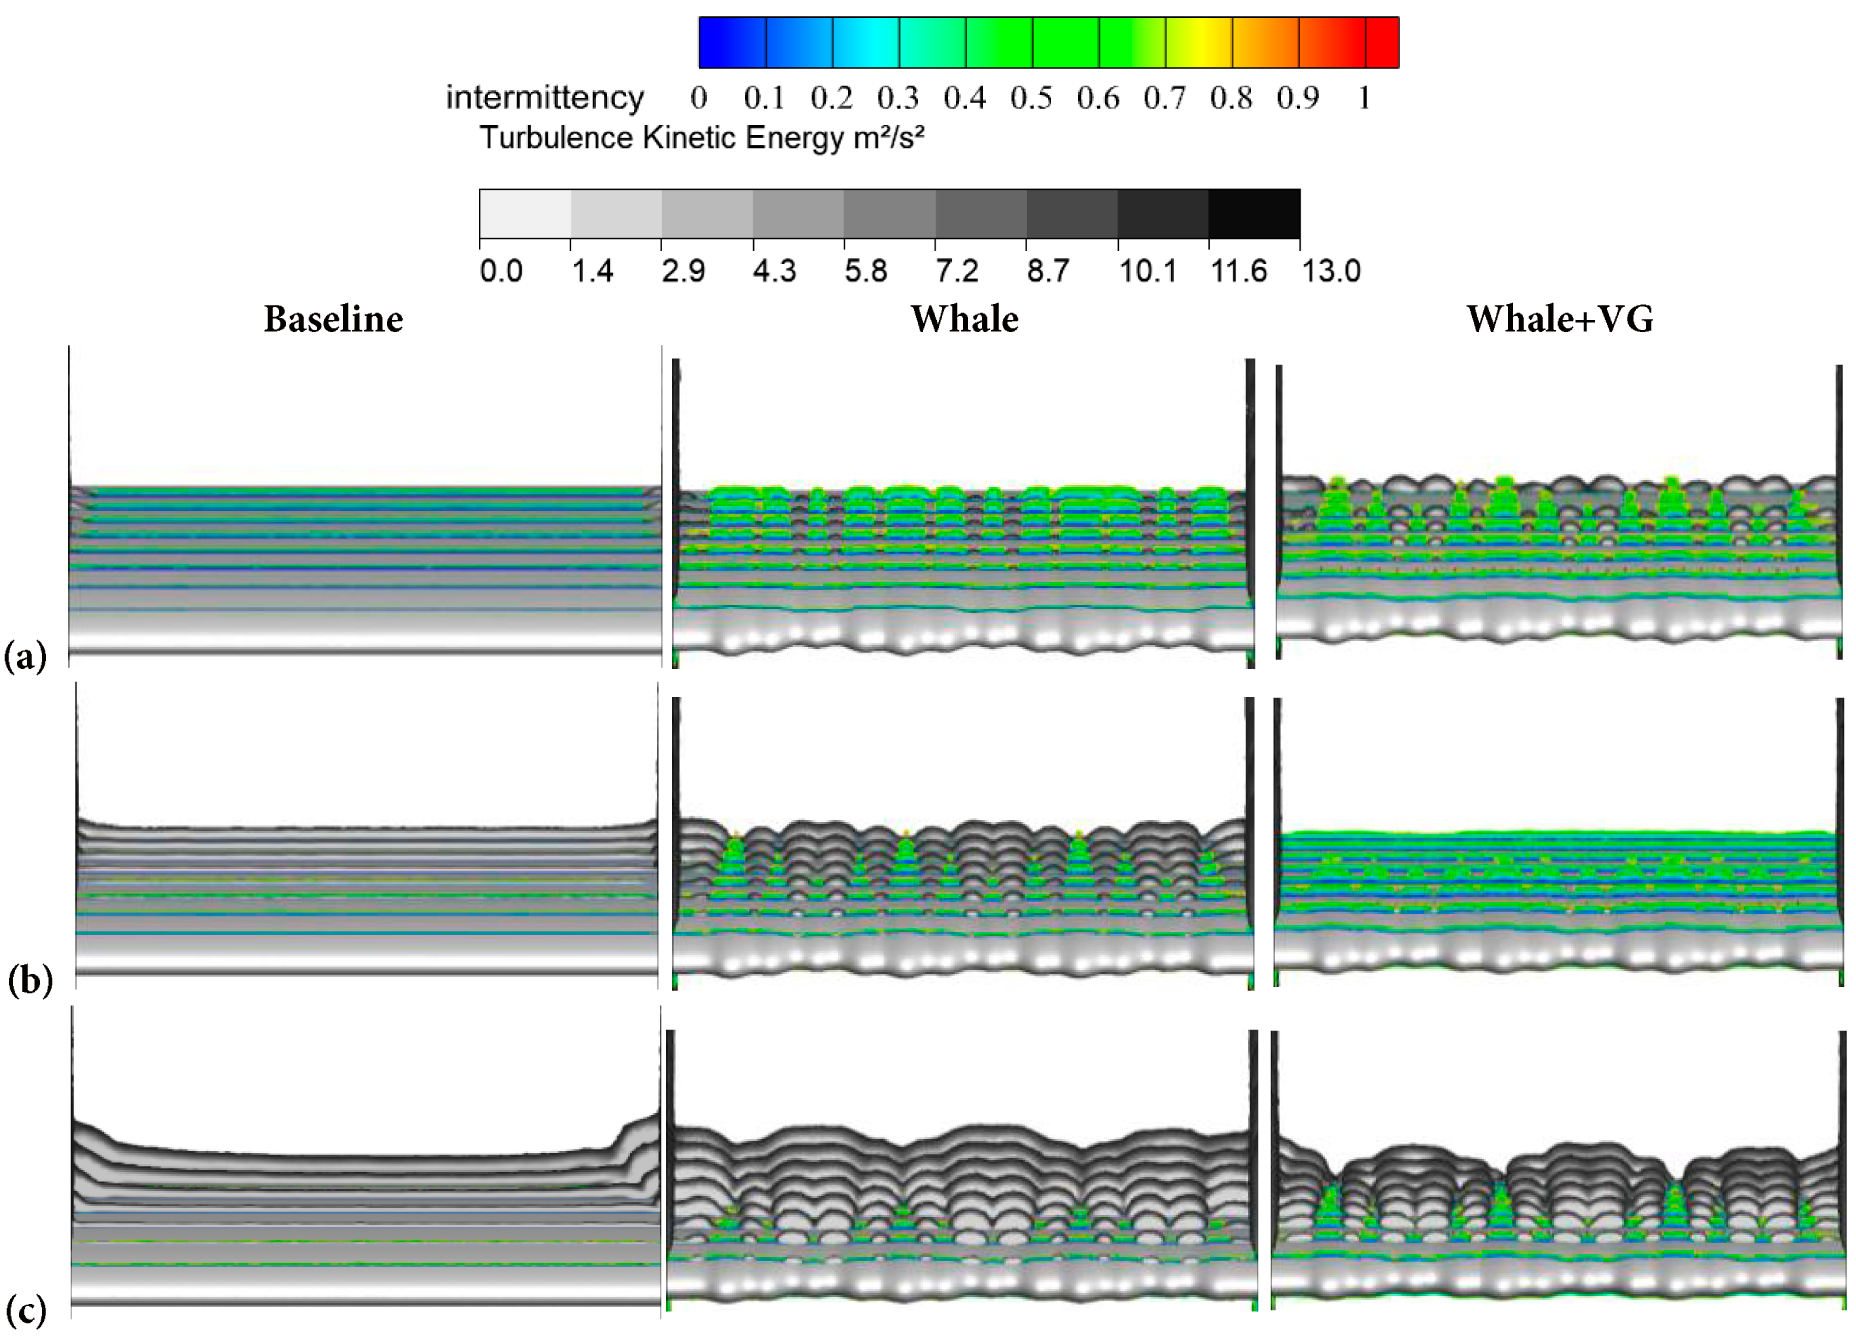
Figure 15: Turbulence intensity and intermittency contours at (a) α = 4°, (b) α = 8°, (c) α = 12° and Re = 1.25 × 10⁵.
As the freestream momentum energizes the shear layer at a distance from the boundary layer, it starts to reattach to the surface. At that point, intermittency and TKE are crucial in predicting the onset of transition, as shown in Fig. 15. Intermittency generally represents the time-averaged velocity fluctuations. A transition can usually be considered initiated when this value exceeds 0.5. Because it is used as a transport equation in some Computational Fluid Dynamics (CFD) codes, such as Transition-SST, it plays a critical role in accurately calculating the transition onset. Furthermore, the increase in turbulent kinetic energy along the flow direction, accompanied by intermittency, makes the transition to turbulence easier to observe and interpret. An examination of Fig. 15a reveals higher intermittency and TKE levels at the same x/c points in the W and W+VG profiles compared to the base profile. The same trend is observed, albeit more pronounced with increasing angle of attack, for the α = 8° case in Fig. 15b. In this scenario, TKE and intermittency reach higher intensities upstream than at α = 4°, indicating a shift toward the leading edge. At the α = 12° shown in Fig. 15c, while the W-shaped profile again exhibits an earlier and more stable transition to turbulence than the base profile, it can be argued that the W+VG profile requires improvement with increasing angle, particularly at the VG positions. This is because the transition to turbulence tends to occur earlier in the upstream direction. Additionally, another concept, the Q-criterion, an effective parameter for analyzing three-dimensional flow behavior, which was proposed by Hunt et al. in 1988 [72]. The Q-criterion term expresses the ratio of the vortex structure (rotation rate) to the strain in a flow. This phenomenon was formulated more clearly by Chong et al. as follows [73].
Above is the
In Fig. 16a, after a baseline leading edge, there are low-density Q structures and minimal, thin traces towards the tip, which can be considered indicators of weak 3-dimensionality and a laminar or semi-laminar boundary layer. Moreover, the sparseness of Q traces and low TKE indicate that LSB tends to be long and thin, limiting the transition to turbulence after the flow reattaches. Besides, considering the discontinuities in Q structures, it can be stated that the transition is delayed and spanwise coherence is high. Next, in Fig. 16a, which shows the whale-structured airfoil, the formation of vortex filaments is observed in the streamwise direction, aligning with the whale wave number along the leading edge. These vortices thickened the laminar boundary layer locally in upper regions from the surface by increasing the momentum transport, and therefore, LSB is divided into multiple short LSBs. An increase in the Q density indicates an early, yet local, transition. In addition to the leading-edge whale structure, vortex generators were integrated in Fig. 16 (W+VG), where the Q-criterion volume is the densest and continuous. This means that the boundary layer becomes fully turbulent earlier, and the LSB is either significantly shortened or entirely suppressed. When these conditions are examined in relation to angle of attack, the highest separation resistance is observed in the whale+vortex generator scenario. The flow most prone to separation occurs in the baseline profile. However, as the angle increases to 8° and 12° in Fig. 16b,c, this difference becomes even larger. When considered in terms of transition location, the transition shifts upstream as the angle increases in the baseline profile. In the whale configuration, the transition appears as local islands within the wave gaps. When the vortex generator is added, a displacement toward the leading edge also occurs as the angle increases. These conditions also affect the LSB dynamics, resulting in a single, long LSB in the baseline profile, a multi-segmented LSB that is shorter than the baseline in the whale profile, and a significantly shorter or even completely suppressed LSB in some areas of the W+VG configuration. This also indicates that the three-dimensionality is enhanced in both the W and W+VG profiles. To gain a detailed understanding, Fig. 17 illustrates the view of Fig. 18, which represents both Q structures and the wake (U-velocity) section from a plane at x/c = 0.23.
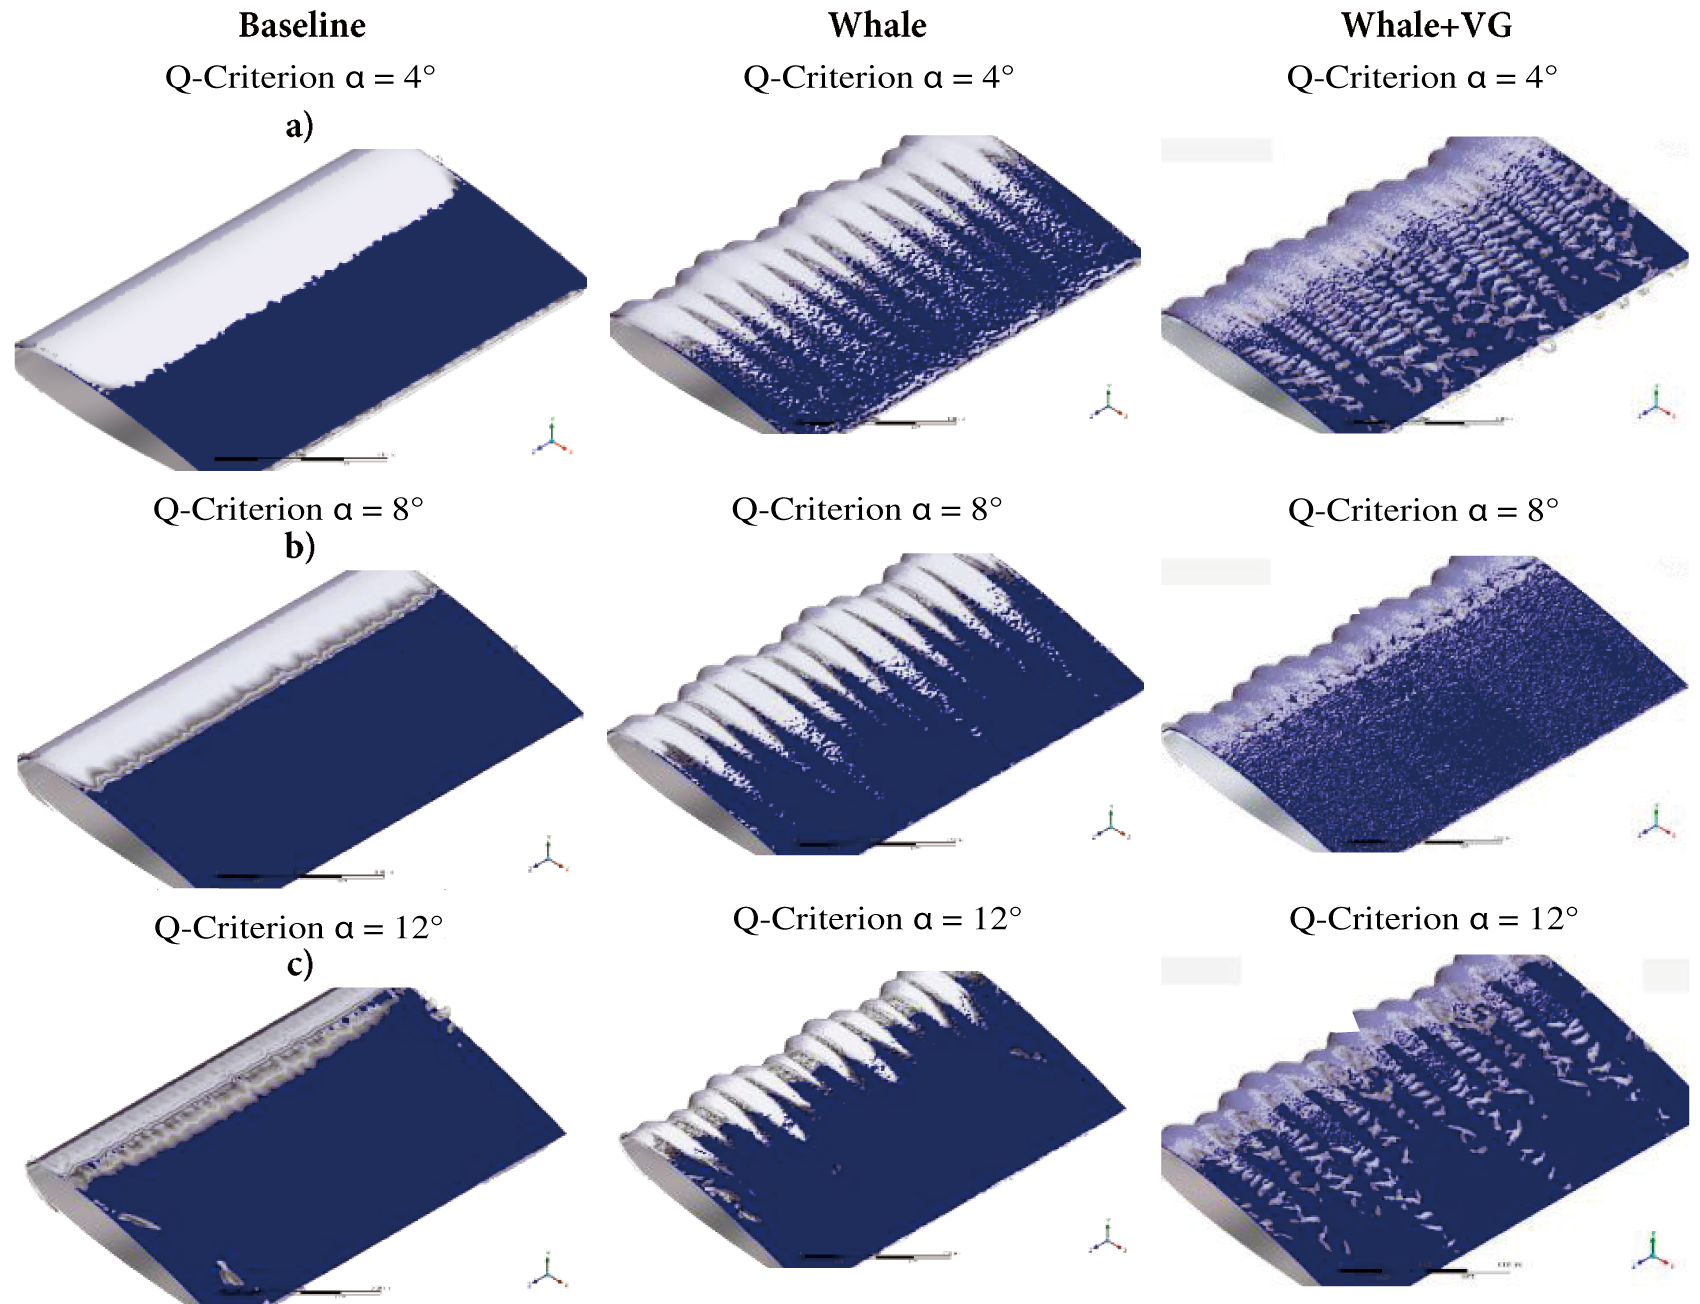
Figure 16: Q-Criterion vortex regions over the airfoil’s upper surface at (a) α = 4°, (b) α = 8°, (c) α = 12°, and Re = 1.25 × 10⁵.
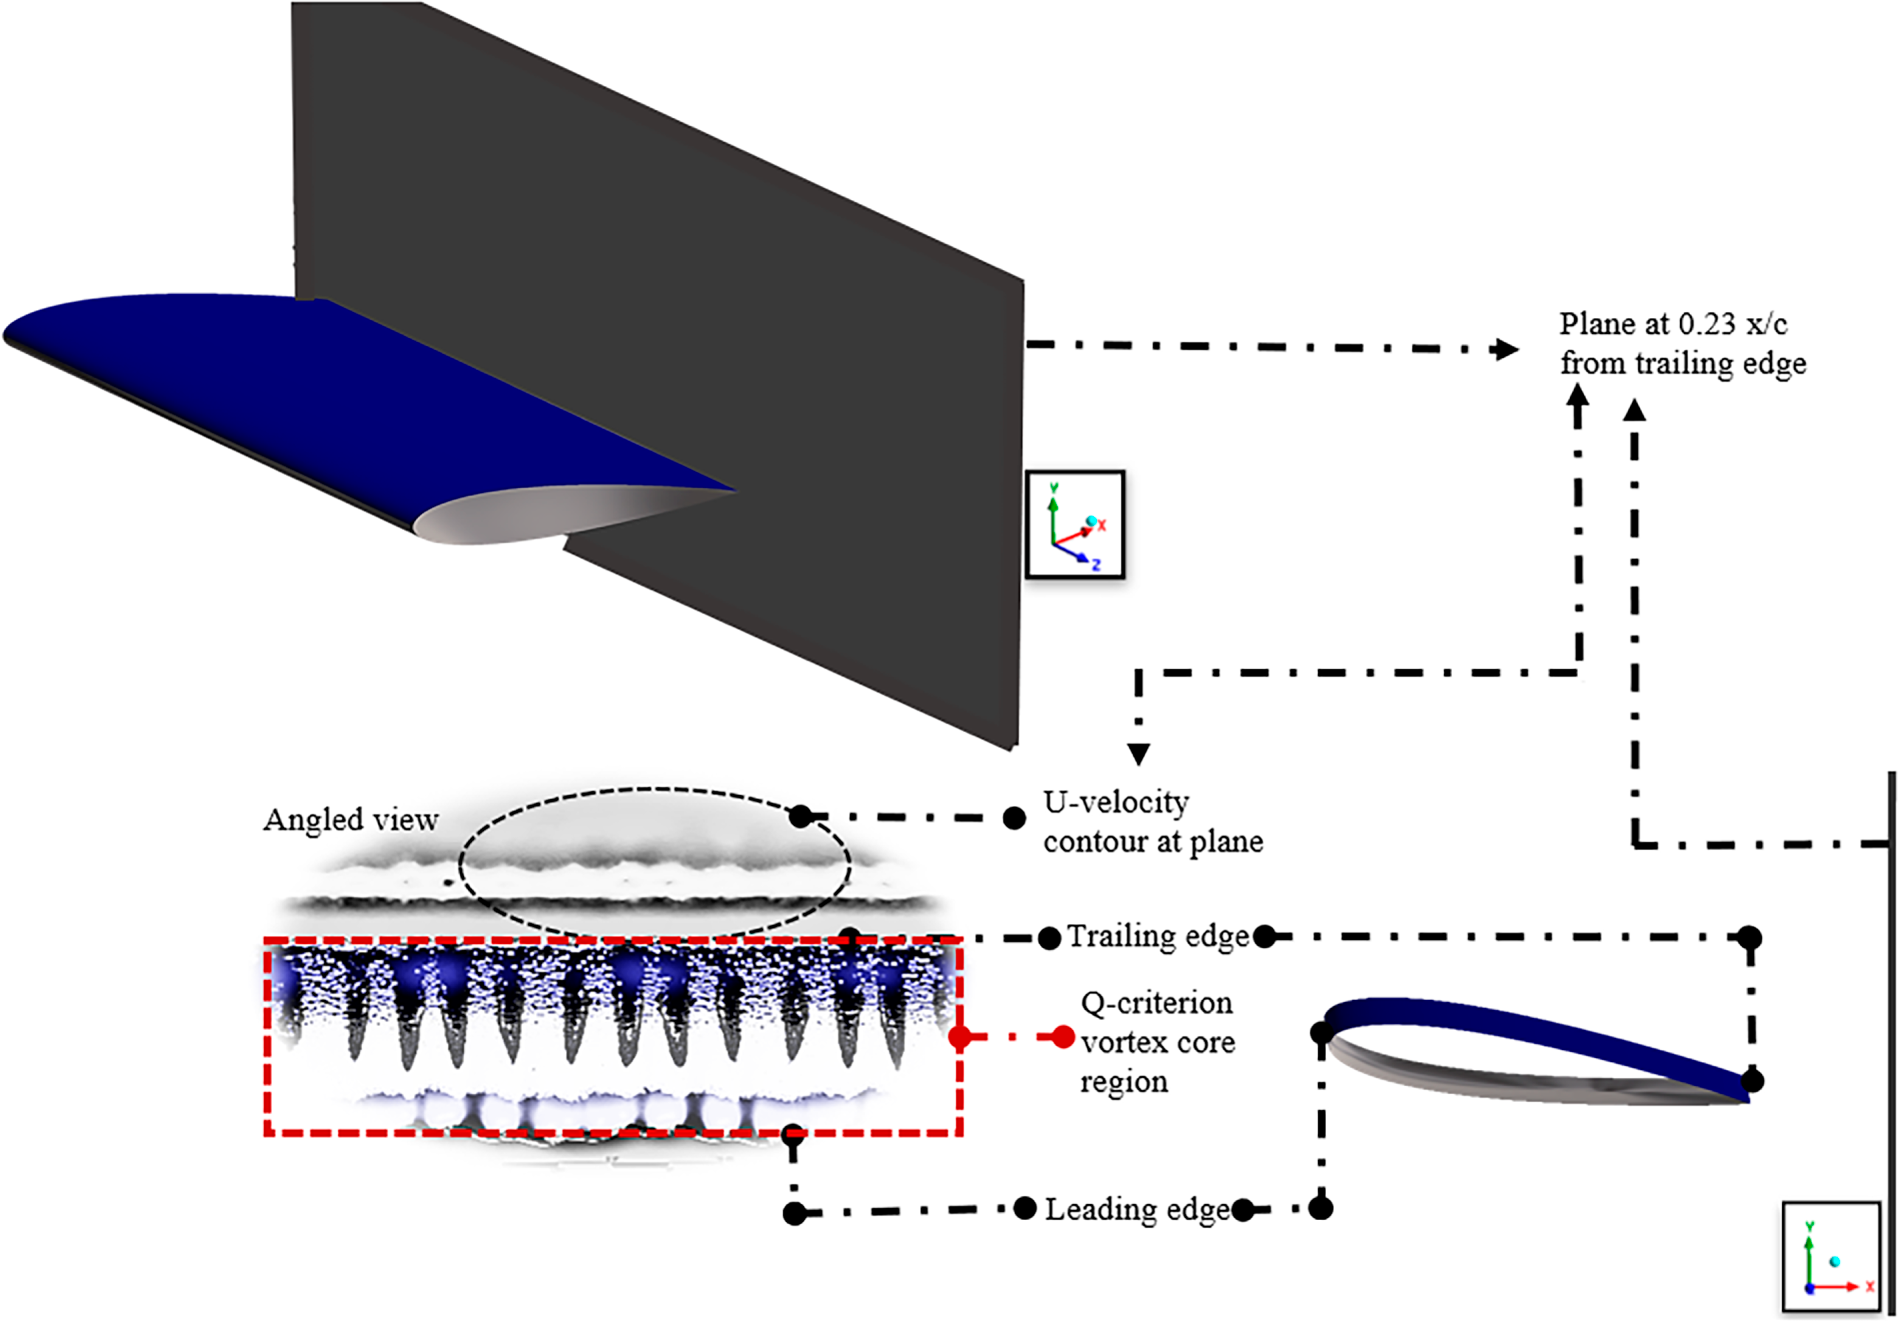
Figure 17: Visual explanation of the Q-Criterion and wake region shown in a combined figure.
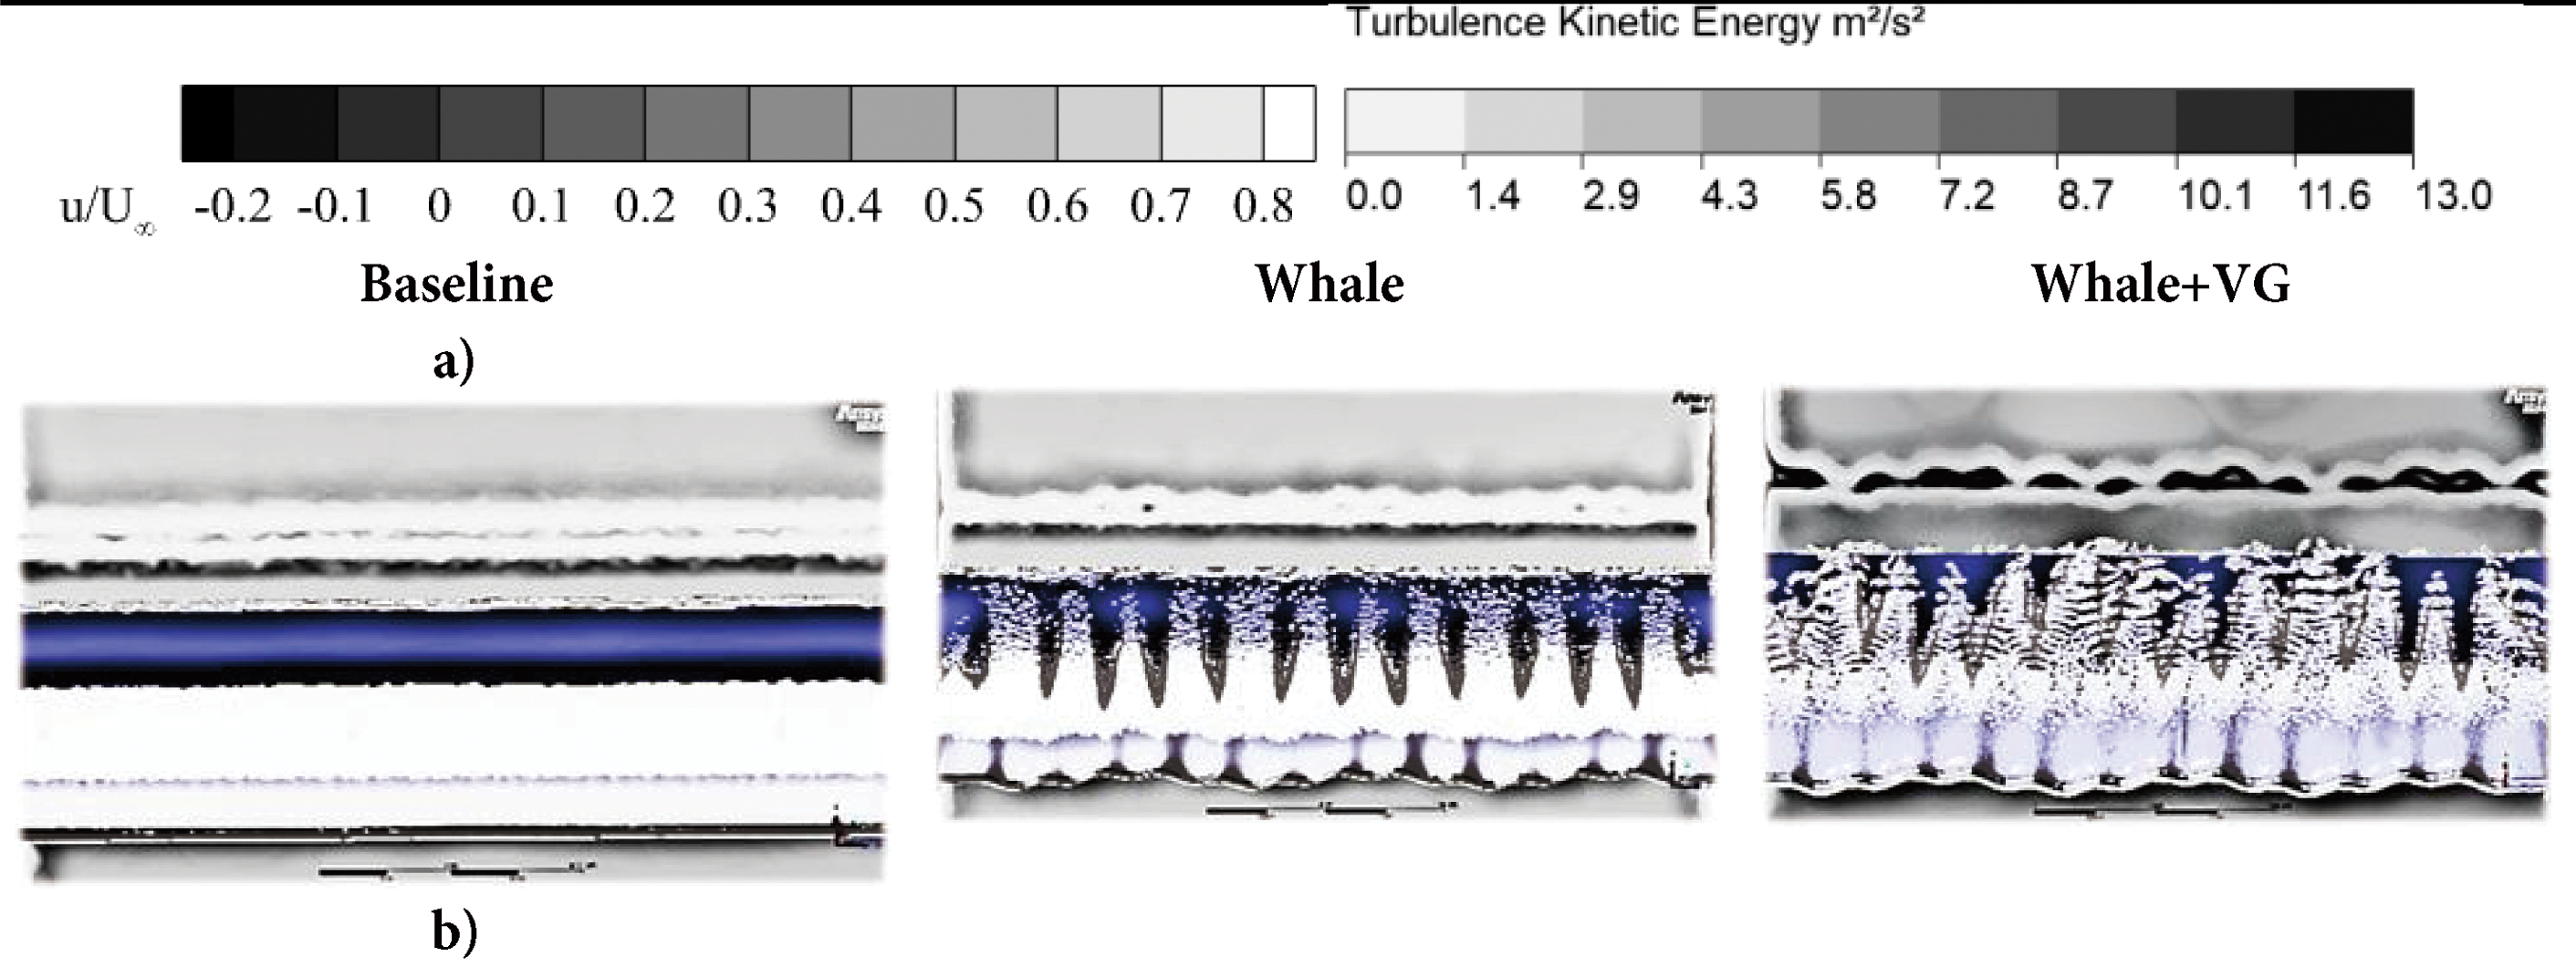
Figure 18: Comparison of Q-criterion colored with TKE distribution over the surface and x-component velocity contours at wake region at (a) α = 4°, (b) α = 8°, (c) α = 12°, and Re = 1.25 × 10⁵.
In Fig. 18 above, a cross-section of the U-velocity wake region is shown in the background and the Q-criterion iso-surfaces in the front (explained in Fig. 17). At α = 4°, in Fig. 18a, a narrow and spanwise coherent U-deficit band (low velocity region) and sparse Q structures are observed in the baseline profile, indicating a long LSB and a delayed transition. Conversely, in the whale profile, streamwise cores emerging in the troughs modulate the wake region in synchrony with the whale structure at the leading edge, breaking up the LSB and creating local early transition regions. In the W+VG configuration, the early and fully turbulent boundary layer can be explained by the presence of dense hairpin vortices and double-core wakes. At α = 8°, as shown in Fig. 18b, the KH-wavy and continuous shear layer together with the thickening wake showed a tendency towards flow separation. At the same time, in the whale profile, the cores maintained a better level of reattachment with a longer structure. At the α = 12° shown in Fig. 17c, the baseline profile approached stall with a wider shear plate. In the whale profile, there was continuity of flow between the channels, and separation was limited locally. The W+VG profile was again observed as the last to separate. However, it is essential to emphasize that whale profiles without vortex generators do not have the proper capabilities to eradicate the LSB since hairpin vortices are broken into smaller particles or distributed uniformly by VGs, which prevents the LSB from occurring as a single long form.
The objective of this study is to investigate the aerodynamic performance and the effect of the new concept passive control mechanism of the controlled NACA0015 airfoil using tubercles and VG on the LSB over the airfoil at different Reynolds numbers and angles of attack. Related to the passive flow control strategy, a new concept employing both tubercles and VGs simultaneously was used near the leading edge of the NACA0015 airfoil. Numerical simulations were conducted for this study to understand the effect of the new concept of passive flow control on the LSB over the airfoil. In this regard, the current study revealed the following conclusions:
– In the validation study, it was shown that an LSB formed near the leading edge of the uncontrolled airfoils in both numerical and experimental analysis. After the presence of LSB, a turbulent flow region occurred at the rear part. Consequently, the numerical findings of the current study provide valuable insights into the LSB dynamics and flow patterns observed in the controlled cases.
– At aerodynamic lift coefficient graphs, in the uncontrolled case, CL, max was around 0.76 at α = 11°, while it was approximately 0.85 at α = 11° and 0.87 at α = 14° in the controlled case (W) and case (W+VGs), respectively. Apart from increasing the lift coefficient, the aerodynamic stall was postponed.
– The stall characteristics changed, transitioning from an abrupt stall to a mild stall. This, particularly with the combined use of the whale tubercle and VG configurations, resulted in a change in LSB dynamics due to the small vortices created, resulting in a flow with high momentum. Additionally, although small vortices formed in low-angle-of-attack flows reduce lift formation, these vortices control the flow and LSB by imparting momentum to the flow, particularly at stall and post-stall angles of attack. Additionally, a decrease in drag forces was observed in the controlled cases due to the formation of small vortices.
– Time-dependent lift coefficient graphs show the lift fluctuations of the airfoil as it is affected by the unsteady changing LSB dynamics and flow conditions. The results demonstrated that the fluctuations were reduced by utilizing passive control techniques, thereby suppressing the LSB. Additionally, on NACA0015, the application of a combination of tubercle and VGs not only raised the lift coefficient but also reduced aerodynamic vibrations.
– At lower Reynolds numbers, while aerodynamic performance increased at all angles of attack for the airfoil with a tubercle, the increase was greater after the stall for the W+VGs airfoil. This means that while the vortices generated by VGs negatively impact LSB dynamics. At higher Reynolds number flows, aerodynamic performance increased at all angles of attack; particularly, the increase was most notable at moderate angles of attack (in the pre-stall region).
– In the numerical study results, turbulence kinetic energy contours in the controlled cases (W and W+VG) through the planes at troughs and hills were discussed. It was shown that the transition to turbulence was accelerated at the troughs due to the flow circulations, and increases in turbulence kinetic energy were observed after the transition to turbulence. In addition to these increases, the presence of VGs at the troughs enhanced the momentum gain to the flow, further improving the flow and reducing trailing-edge separations. The flow circulations were lower at the hills; therefore, the flow improvement and the decrease in trailing edge separation in the whale (W) cases were limited when the vortex generators coincided with these hills. The flow separations decreased with the increase in momentum of the flow. Moreover, although controlled cases showed a better transition characteristic in terms of aerodynamic performance, their positions should be optimized due to the deficiency at higher angles of attack, such as 12°, to dominate LSB formation and enhance the transition to turbulence, as indicated by the Q-Criterion and wake region results.
– Concerning the findings obtained from oil flow visualization and numerical simulations, the flow behind the VGs was energized with momentum transfer to the LSB region. Those energized flow structures enabled the formation of LSB to disappear at the middle part of the controlled NACA0015 airfoil, resulting in higher lift performance compared to the uncontrolled case.
The use of commercial CFD software has led to 0 s in modelling. In future studies, if open-source code is used to modify the transport equations of the transition model, more realistic empirical expressions derived from experimental results can be used to obtain more accurate results. This would allow for a better understanding of the effects of viscous forces, especially in modelling low-Reynolds-number flows, and enable a more comprehensible observation of LSB dynamics over the airfoil.
Consequently, the improvement in aerodynamic performance resulting from the new concept of passive flow control method leads to an increase in payload capacity for unmanned air vehicles or energy output in turbine blades. One may argue that the novel idea and combination of those passive flow controllers would offer a viable, affordable, and efficient way to improve the aerodynamic performance of airfoils and suppress the LSB in energy and aviation applications.
Acknowledgement: The authors would like to acknowledge funding from the Scientific Research Projects Unit of Erciyes University.
Funding Statement: The authors are grateful to the Scientific Research Projects Unit of Erciyes University under contract no: FDS-2022-11532 and FOA-2025-14773.
Author Contributions: The authors confirm contribution to the paper as follows: Conceptualization: Mustafa Serdar Genç, Halil Hakan Açıkel, Mustafa Özden; methodology: Mustafa Serdar Genç, Halil Hakan Açıkel, Mustafa Özden; software: Mustafa Özden, Eren Anıl Sezer, Muhammed Hatem; validation: Mustafa Serdar Genç, Halil Hakan Açıkel, Eren Anıl Sezer, Sinem Keskin; formal analysis: Mustafa Serdar Genç, Halil Hakan Açıkel, Eren Anıl Sezer, Sinem Keskin, Muhammed Hatem, Mustafa Özden; investigation: Eren Anıl Sezer, Sinem Keskin, Muhammed Hatem; data curation: Mustafa Serdar Genç, Eren Anıl Sezer, Mustafa Özden, Sinem Keskin, Muhammed Hatem; writing—original draft preparation: Mustafa Serdar Genç, Mustafa Özden, Sinem Keskin, Muhammed Hatem; writing—review and editing: Mustafa Serdar Genç, Halil Hakan Açıkel; visualization: Mustafa Serdar Genç, Halil Hakan Açıkel, Mustafa Özden, Eren Anıl Sezer, Sinem Keskin, Muhammed Hatem; supervision: Mustafa Serdar Genç, Halil Hakan Açıkel, Mustafa Özden; project administration: Mustafa Serdar Genç; funding acquisition: Mustafa Serdar Genç. All authors reviewed and approved the final version of the manuscript.
Availability of Data and Materials: Data available on request from the authors. The data that support the findings of this study are available from the corresponding author, Mustafa Serdar Genç, upon reasonable request.
Ethics Approval: Not applicable.
Conflicts of Interest: The authors declare no conflicts of interest.
References
1. Zhang H, Wen J, Zhan J, Xin D. Effects of blade number on the aerodynamic performance and wake characteristics of a small horizontal-axis wind turbine. Energy Convers Manag. 2022;273:116410. doi:10.1016/j.enconman.2022.116410. [Google Scholar] [CrossRef]
2. Miao W, Liu Q, Xu Z, Yue M, Li C, Zhang W. A comprehensive analysis of blade tip for vertical axis wind turbine: aerodynamics and the tip loss effect. Energy Convers Manag. 2022;253:115140. doi:10.1016/j.enconman.2021.115140. [Google Scholar] [CrossRef]
3. Sekhoune Özden K, Karasu İ, Serdar Genç M. Experimental investigation of the ground effect on a wing without/with trailing edge flap. Fluid Dyn Res. 2020;52(4):045504. doi:10.1088/1873-7005/aba1d8. [Google Scholar] [CrossRef]
4. Zilstra A, Johnson D. Transient development of a laminar separation bubble over a low Reynolds number airfoil. J Fluids Eng. 2026;1–33. doi:10.1115/1.4070836. [Google Scholar] [CrossRef]
5. Koca K, Genç MS, Özkan R. Mapping of laminar separation bubble and bubble-induced vibrations over a turbine blade at low Reynolds numbers. Ocean Eng. 2021;239:109867. doi:10.1016/j.oceaneng.2021.109867. [Google Scholar] [CrossRef]
6. Su R, Gao Z, Chen Y, Zhang C, Wang J. Large-eddy simulation of the influence of hairpin Vortex on pressure coefficient of an operating horizontal axis wind turbine. Energy Convers Manag. 2022;267:115864. doi:10.1016/j.enconman.2022.115864. [Google Scholar] [CrossRef]
7. Özkan R, Genç MS, Kayali İ. Multi-objective structural optimization of composite wind turbine blade using a novel hybrid approach of artificial bee colony algorithm based on the stochastic method. Comput Model Eng Sci. 2025;145(3):3349–80. doi:10.32604/cmes.2025.072519. [Google Scholar] [CrossRef]
8. Özkan R, Genç MS. Aerodynamic design and optimization of a small-scale wind turbine blade using a novel artificial bee colony algorithm based on blade element momentum (ABC-BEM) theory. Energy Convers Manag. 2023;283(2):116937. doi:10.1016/j.enconman.2023.116937. [Google Scholar] [CrossRef]
9. Qian X, Zhang B, Gao Z, Wang T, Zhang L, Li Y. Flutter limit optimization of offshore wind turbine blades considering different control and structural parameters. Ocean Eng. 2024;310:118558. doi:10.1016/j.oceaneng.2024.118558. [Google Scholar] [CrossRef]
10. Genç MS, Ozisik G, Kahraman N. Investigation of aerodynamics performance of NACA00-12 aerofoil with plain. ISI Bilim Ve Tek Derg J Therm Sci Technol. 2008;28(1):1–8. [Google Scholar]
11. Genç M, Kaynak Ü. Control of flow separation and transition point over an aerofoil at low Re number using simultaneous blowing and suction. In: 19th AIAA Computational Fluid Dynamics. San Antonio, Texas: AIAA; 2009. p. AIAA2009-3672. doi:10.2514/6.2009-3672. [Google Scholar] [CrossRef]
12. Roy S, Das B, Biswas A. Effect of leading-edge protrusion shapes for passive flow control measure on wind turbine blades. Ocean Eng. 2023;269(5):113688. doi:10.1016/j.oceaneng.2023.113688. [Google Scholar] [CrossRef]
13. Liu Q, Miao W, Bashir M, Xu Z, Yu N, Luo S, et al. Aerodynamic and aeroacoustic performance assessment of a vertical axis wind turbine by synergistic effect of blowing and suction. Energy Convers Manag. 2022;271:116289. doi:10.1016/j.enconman.2022.116289. [Google Scholar] [CrossRef]
14. Lv S, Li W, Jia Y, Liu H, Liu Q. Experimental analysis of aerodynamic optimization by vortex generators on wind turbine airfoils in turbulent flow. J Appl Fluid Mech. 2026;19(3):429–44. doi:10.1016/j.oceaneng.2025.122274. [Google Scholar] [CrossRef]
15. Hansen KL, Kelso RM, Dally BB. Performance variations of leading-edge tubercles for distinct airfoil profiles. AIAA J. 2011;49(1):185–94. doi:10.2514/1.j050631. [Google Scholar] [CrossRef]
16. Liu X, Kamliya Jawahar H, Azarpeyvand M, Theunissen R. Aerodynamic performance and wake development of airfoils with serrated trailing-edges. AIAA J. 2017;55(11):3669–80. doi:10.2514/1.j055817. [Google Scholar] [CrossRef]
17. Frohnapfel B, Jovanović J, Delgado A. Experimental investigations of turbulent drag reduction by surface-embedded grooves. J Fluid Mech. 2007;590:107–16. doi:10.1017/s0022112007008221. [Google Scholar] [CrossRef]
18. Açıkel HH, Serdar Genç M. Control of laminar separation bubble over wind turbine airfoil using partial flexibility on suction surface. Energy. 2018;165:176–90. doi:10.1016/j.energy.2018.09.040. [Google Scholar] [CrossRef]
19. Le Roy C, Debat V, Llaurens V. Adaptive evolution of butterfly wing shape: from morphology to behaviour. Biol Rev Camb Philos Soc. 2019;94(4):1261–81. doi:10.1111/brv.12500. [Google Scholar] [PubMed] [CrossRef]
20. Park H, Bae K, Lee B, Jeon WP, Choi H. Aerodynamic performance of a gliding swallowtail butterfly wing model. Exp Mech. 2010;50(9):1313–21. doi:10.1007/s11340-009-9330-x. [Google Scholar] [CrossRef]
21. Bodling A, Sharma A. Numerical investigation of noise reduction mechanisms in a bio-inspired airfoil. J Sound Vib. 2019;453:314–27. doi:10.1016/j.jsv.2019.02.004. [Google Scholar] [CrossRef]
22. Özden M, Genç MS, Koca K. Investigation of the effect of hidden Vortex generator-flap integrated mechanism revealed in low velocities on wind turbine blade flow. Energy Convers Manag. 2023;287(1):117107. doi:10.1016/j.enconman.2023.117107. [Google Scholar] [CrossRef]
23. Özden M, Genç MS, Koca K. Passive flow control application using single and double Vortex Generator on S809 wind turbine airfoil. Energies. 2023;16(14):5339. doi:10.3390/en16145339. [Google Scholar] [CrossRef]
24. Rao C, Ikeda T, Nakata T, Liu H. Owl-inspired leading-edge serrations play a crucial role in aerodynamic force production and sound suppression. Bioinspir Biomim. 2017;12(4):046008. doi:10.1088/1748-3190/aa7013. [Google Scholar] [PubMed] [CrossRef]
25. Hua X, Gu R, Jin J, Liu YR, Ma Y, Cong Q, et al. Numerical simulation and aerodynamic performance comparison between seagull aerofoil and NACA 4412 aerofoil under low-Reynolds. Adv Nat Sci. 2010;3:244–50. doi:10.3968/J.ANS.1715787020100302.029. [Google Scholar] [CrossRef]
26. Fernandes I, Sapkota Y, Mammen T, Rasheed A, Rebello C, Kim YH. Theoretical and experimental investigation of leading edge tubercles on the wing performance. In: 2013 Aviation Technology, Integration, and Operations Conference; 2013 Aug 12–14; Los Angeles, CA, USA. doi:10.2514/6.2013-4300. [Google Scholar] [CrossRef]
27. Miklosovic DS, Murray MM, Howle LE, Fish FE. Leading-edge tubercles delay stall on humpback whale (Megaptera novaeangliae) flippers. Phys Fluids. 2004;16(5):L39–42. doi:10.1063/1.1688341. [Google Scholar] [CrossRef]
28. Wang J, Nakata T, Liu H. Development of mixed flow fans with bio-inspired grooves. Biomimetics. 2019;4(4):72. doi:10.3390/biomimetics4040072. [Google Scholar] [PubMed] [CrossRef]
29. Dang Z, Song B, Mao Z, Yang G. Performance analysis of a horizontal axis ocean current turbine with spanwise microgrooved surface. Renew Energy. 2022;192(6):655–67. doi:10.1016/j.renene.2022.04.144. [Google Scholar] [CrossRef]
30. Dang Z, Mao Z, Tian W. Reduction of hydrodynamic noise of 3D hydrofoil with spanwise microgrooved surfaces inspired by sharkskin. J Mar Sci Eng. 2019;7(5):136. doi:10.3390/jmse7050136. [Google Scholar] [CrossRef]
31. Rostamzadeh N, Kelso RM, Dally BB, Hansen KL. The effect of undulating leading-edge modifications on NACA 0021 airfoil characteristics. Phys Fluids. 2013;25(11):117101. doi:10.1063/1.4828703. [Google Scholar] [CrossRef]
32. Joseph J, Sathyabhama A. Leading edge tubercle on wind turbine blade to mitigate problems of stall, hysteresis, and laminar separation bubble. Energy Convers Manag. 2022;255:115337. doi:10.1016/j.enconman.2022.115337. [Google Scholar] [CrossRef]
33. Huang S, Qiu H, Wang Y. Aerodynamic performance of horizontal axis wind turbine with application of dolphin head-shape and lever movement of skeleton bionic airfoils. Energy Convers Manag. 2022;267:115803. doi:10.1016/j.enconman.2022.115803. [Google Scholar] [CrossRef]
34. Wang Z, Wang Y, Zhuang M. Improvement of the aerodynamic performance of vertical axis wind turbines with leading-edge serrations and helical blades using CFD and Taguchi method. Energy Convers Manag. 2018;177:107–21. doi:10.1016/j.enconman.2018.09.028. [Google Scholar] [CrossRef]
35. Jaworski JW, Peake N. Aerodynamic noise from a poroelastic edge with implications for the silent flight of owls. J Fluid Mech. 2013;723:456–79. doi:10.1017/jfm.2013.139. [Google Scholar] [CrossRef]
36. Bechert DW, Bruse M, Hage W. Experiments with three-dimensional riblets as an idealized model of shark skin. Exp Fluids. 2000;28(5):403–12. doi:10.1007/s003480050400. [Google Scholar] [CrossRef]
37. Sagong W, Kim C, Choi S, Jeon WP, Choi H. Does the sailfish skin reduce the skin friction like the shark skin? Phys Fluids. 2008;20(10):101510. doi:10.1063/1.3005861. [Google Scholar] [CrossRef]
38. Scott Collis S, Joslin RD, Seifert A, Theofilis V. Issues in active flow control: theory, control, simulation, and experiment. Prog Aerosp Sci. 2004;40(4–5):237–89. doi:10.1016/j.paerosci.2004.06.001. [Google Scholar] [CrossRef]
39. Syawitri TP, Yao Y, Yao J, Chandra B. A review on the use of passive flow control devices as performance enhancement of lift-type vertical axis wind turbines. Wires Energy Environ. 2022;11(4):e435. doi:10.1002/wene.435. [Google Scholar] [CrossRef]
40. Lin JC. Review of research on low-profile Vortex generators to control boundary-layer separation. Prog Aerosp Sci. 2002;38(4–5):389–420. doi:10.1016/S0376-0421(02)00010-6. [Google Scholar] [CrossRef]
41. Liang F, Tang G, Xu C, Wang C, Wang Z, Wang J, et al. Experimental investigation on improving the energy separation efficiency of Vortex tube by optimizing the structure of Vortex generator. Appl Therm Eng. 2021;195(7):117222. doi:10.1016/j.applthermaleng.2021.117222. [Google Scholar] [CrossRef]
42. Boutoudj MS, Tebbiche H. Effects of micro-blowing and Vortex Generators on the boundary layer separation control of a NACA 0015 airfoil. Eurasia Proc Sci Technol Eng Math. 2024;32:116–22. doi:10.55549/epstem.1598067. [Google Scholar] [CrossRef]
43. Wang H, Jiang X, Chao Y, Li Q, Li M, Zheng W, et al. Effects of leading edge slat on flow separation and aerodynamic performance of wind turbine. Energy. 2019;182:988–98. doi:10.1016/j.energy.2019.06.096. [Google Scholar] [CrossRef]
44. Karasu İ. Flow control over a diamond-shaped cylinder using slits. Exp Therm Fluid Sci. 2020;112:109992. doi:10.1016/j.expthermflusci.2019.109992. [Google Scholar] [CrossRef]
45. Bakir F, Menfoukh L, Oualli H, Azzam T, Ravelet F, Pereira M, et al. Numerical investigation of parietal pressure distribution on NACA0012 wing controlled by micro-cylindrical rod arranged in tandem. Prog Comput Fluid Dyn Int J. 2022;1(1):1. doi:10.1504/pcfd.2022.10051919. [Google Scholar] [CrossRef]
46. Johari H, Henoch C, Custodio D, Levshin A. Effects of leading-edge protuberances on airfoil performance. AIAA J. 2007;45(11):2634–42. doi:10.2514/1.28497. [Google Scholar] [CrossRef]
47. Wei Z, New TH, Cui YD. An experimental study on flow separation control of hydrofoils with leading-edge tubercles at low Reynolds number. Ocean Eng. 2015;108:336–49. doi:10.1016/j.oceaneng.2015.08.004. [Google Scholar] [CrossRef]
48. Watts P, Fish FE. The influence of passive, leading edge tubercles on wing performance. [cited 2026 Jan 5]. Available from: https://www.proceedings.com/content/021/021192webtoc.pdf. [Google Scholar]
49. Goruney T, Rockwell D. Flow past a delta wing with a sinusoidal leading edge: near-surface topology and flow structure. Exp Fluids. 2009;47(2):321–31. doi:10.1007/s00348-009-0666-x. [Google Scholar] [CrossRef]
50. Guerreiro JLE, Sousa JMM. Low-Reynolds-number effects in passive stall control using sinusoidal leading edges. AIAA J. 2012;50(2):461–9. doi:10.2514/1.j051235. [Google Scholar] [CrossRef]
51. Sudhakar S, Karthikeyan N, Venkatakrishnan L. Influence of leading edge tubercles on aerodynamic characteristics of a high aspect-ratio UAV. Aerosp Sci Technol. 2017;69:281–9. doi:10.1016/j.ast.2017.06.031. [Google Scholar] [CrossRef]
52. Bai CJ, Lin YY, Lin SY, Wang WC. Computational fluid dynamics analysis of the vertical axis wind turbine blade with tubercle leading edge. J Renew Sustain Energy. 2015;7(3):033124. doi:10.1063/1.4922192. [Google Scholar] [CrossRef]
53. Wang Z, Zhuang M. Leading-edge serrations for performance improvement on a vertical-axis wind turbine at low tip-speed-ratios. Appl Energy. 2017;208:1184–97. doi:10.1016/j.apenergy.2017.09.034. [Google Scholar] [CrossRef]
54. Fish FE, Weber PW, Murray MM, Howle LE. The tubercles on humpback whales’ flippers: application of bio-inspired technology. Integr Comp Biol. 2011;51(1):203–13. doi:10.1093/icb/icr016. [Google Scholar] [PubMed] [CrossRef]
55. Corsini A, Delibra G, Sheard AG. The application of sinusoidal blade-leading edges in a fan-design methodology to improve stall resistance. Proc Inst Mech Eng Part A J Power Energy. 2014;228(3):255–71. doi:10.1177/0957650913514229. [Google Scholar] [CrossRef]
56. Marty J. Numerical investigations of separation-induced transition on high-lift low-pressure turbine using RANS and LES methods. Proc Inst Mech Eng Part A J Power Energy. 2014;228(8):924–52. doi:10.1177/0957650914548741. [Google Scholar] [CrossRef]
57. Singh NK. Control of laminar separation bubble using Vortex generators. J Appl Fluid Mech. 2019;12(3):891–905. doi:10.29252/jafm.12.03.29352. [Google Scholar] [CrossRef]
58. Lin YF, Lam K, Zou L, Liu Y. Numerical study of flows past airfoils with wavy surfaces. J Fluids Struct. 2013;36:136–48. doi:10.1016/j.jfluidstructs.2012.09.008. [Google Scholar] [CrossRef]
59. Seyhan M, Sarioglu M, Akansu YE. Influence of leading-edge tubercle with amplitude modulation on NACA 0015 airfoil. AIAA J. 2021;59(10):3965–78. doi:10.2514/1.j060180. [Google Scholar] [CrossRef]
60. Merzkirch W. Flow visualization. 2nd ed. Cambridge, MA, USA: Academic Press; 2012. [Google Scholar]
61. Wilcox DC. Turbulence modeling for CFD. Vol. 2. La Cañada Flintridge, CA, USA: DCW Industries; 1998. p. 103–217. [Google Scholar]
62. Menter FR. Two-equation eddy-viscosity turbulence models for engineering applications. AIAA J. 1994;32(8):1598–605. doi:10.2514/3.12149. [Google Scholar] [CrossRef]
63. Fish FE, Lauder GV. Passive and active flow control by swimming fishes and mammals. Annu Rev Fluid Mech. 2006;38(1):193–224. doi:10.1146/annurev.fluid.38.050304.092201. [Google Scholar] [CrossRef]
64. Genç MS, Kaynak Ü, Yapici H. Performance of transition model for predicting low R e aerofoil flows without/with single and simultaneous blowing and suction. Eur J Mech Fluids. 2011;30(2):218–35. doi:10.1016/j.euromechflu.2010.11.001. [Google Scholar] [CrossRef]
65. Karasu İ, Özden M, Genç MS. Performance assessment of transition models for three-dimensional flow over NACA4412 wings at low Reynolds numbers. J Fluids Eng. 2018;140(12):121102. doi:10.1115/1.4040228. [Google Scholar] [CrossRef]
66. Genç MS, Kaynak Ü, Lock GD. Flow over an aerofoil without and with a leading-edge slat at a transitional Reynolds number. Proc Inst Mech Eng Part G J Aerosp Eng. 2009;223(3):217–31. doi:10.1243/09544100jaero434. [Google Scholar] [CrossRef]
67. Wei Z, Toh JWA, Ibrahim IH, Zhang Y. Aerodynamic characteristics and surface flow structures of moderate aspect-ratio leading-edge tubercled wings. Eur J Mech Fluids. 2019;75(1):143–52. doi:10.1016/j.euromechflu.2019.01.001. [Google Scholar] [CrossRef]
68. Aşkan A, Tangöz S, Konar M. An investigation of aerodynamic behaviours and aerodynamic performance of a model wing formed from different profiles. Aeronaut J. 2023;127(1310):676–97. doi:10.1017/aer.2022.85. [Google Scholar] [CrossRef]
69. Tangöz S. Investigation of surface flow behaviors on wing model made of different airfoils. Çukurova Üniversitesi Mühendislik Fakültesi Dergisi. 2024;39(3):759–70. doi:10.21605/cukurovaumfd.1560184. [Google Scholar] [CrossRef]
70. Wei Z, Zang B, New TH, Cui YD. A proper orthogonal decomposition study on the unsteady flow behaviour of a hydrofoil with leading-edge tubercles. Ocean Eng. 2016;121:356–68. doi:10.1016/j.oceaneng.2016.05.043. [Google Scholar] [CrossRef]
71. Wei Z, New TH, Cui YD. Aerodynamic performance and surface flow structures of leading-edge tubercled tapered swept-back wings. AIAA J. 2018;56(1):423–31. doi:10.2514/1.j055663. [Google Scholar] [CrossRef]
72. Hunt JCR, Wray A, Moin P. Eddies, streams, and convergence zones in turbulent flows. In: Proceedings of the 1988 Summer Program; 1988 Jun 20–24; San Francisco, CA, USA. p. 193–208. [Google Scholar]
73. Chong MS, Perry AE, Cantwell BJ. A general classification of three-dimensional flow fields. Phys Fluids A Fluid Dyn. 1990;2(5):765–77. doi:10.1063/1.857730. [Google Scholar] [CrossRef]
Cite This Article
 Copyright © 2026 The Author(s). Published by Tech Science Press.
This work is licensed under a Creative Commons Attribution 4.0 International License , which permits unrestricted use, distribution, and reproduction in any medium, provided the original work is properly cited.
 Downloads
 Citation Tools