
 Submit a Paper
 Propose a Special lssue
 Open Access
ARTICLE

Multi-Label Classification Model Using Graph Convolutional Neural Network for Social Network Nodes
1 School of Artificial Intelligence, Guangzhou Huashang University, Guangzhou, 511300, China
2 School of the Environment, The University of Queensland, St Lucia 2, Brisbane, QLD-4072, Australia
3 School of Biological and Environmental Engineering, Xi’an University, Xi’an, 710065, China
4 Research Institute of Al Convergence, Hanyang University ERICA, Ansan-si, 15588, Republic of Korea
5 School of Automation, University of Electronic Science and Technology of China, Chengdu, 611731, China
* Corresponding Authors: Feng Bao. Email: ; Siyu Lu. Email:
(This article belongs to the Special Issue: Emerging Artificial Intelligence Technologies and Applications-II)
Computer Modeling in Engineering & Sciences 2026, 146(2), 44 https://doi.org/10.32604/cmes.2025.075239
Received 28 October 2025; Accepted 15 December 2025; Issue published 26 February 2026
 View Full Text
 Download PDF
Abstract
Graph neural networks (GNN) have shown strong performance in node classification tasks, yet most existing models rely on uniform or shared weight aggregation, lacking flexibility in modeling the varying strength of relationships among nodes. This paper proposes a novel graph coupling convolutional model that introduces an adaptive weighting mechanism to assign distinct importance to neighboring nodes based on their similarity to the central node. Unlike traditional methods, the proposed coupling strategy enhances the interpretability of node interactions while maintaining competitive classification performance. The model operates in the spatial domain, utilizing adjacency list structures for efficient convolution and addressing the limitations of weight sharing through a coupling-based similarity computation. Extensive experiments are conducted on five graph-structured datasets, including Cora, Citeseer, PubMed, Reddit, and BlogCatalog, as well as a custom topology dataset constructed from the Open University Learning Analytics Dataset (OULAD) educational platform. Results demonstrate that the proposed model achieves good classification accuracy, while significantly reducing training time through direct second-order neighbor fusion and data preprocessing. Moreover, analysis of neighborhood order reveals that considering third-order neighbors offers limited accuracy gains but introduces considerable computational overhead, confirming the efficiency of first- and second-order convolution in practical applications. Overall, the proposed graph coupling model offers a lightweight, interpretable, and effective framework for multi-label node classification in complex networks.Keywords
Social network node classification is an important direction in social network research [1–3]. The research on social network node label classification can bring many benefits to social network applications, such as publicity, recommendation, and other common social network applications [4]. As for the number of labels on social network nodes, it is divided into single-label classification and multi-label classification. Single-label classification focuses solely on determining whether a node possesses a single label, whereas multi-label classification requires determining which of the N labels a node belongs to [5]. As social neworks continue to grow, the nodes in social networks have more information about their own attributes and connections between nodes, and it is difficult for single-label classification methods to meet the classification requirements of social network nodes [6]. For example, a movie may contain horror, suspense, action, love, etc. It is inaccurate to classify it as only one of them. Obviously, a more reasonable multi-label classification of social network nodes is more suitable for today’s social network research [7,8]. There are many successful research projects of multi-label classification of interconnected social network nodes in a bipartite graph based on their own attributes [5,9,10] or based on the connection information between nodes [11,12].
Early approaches to multi-label classification in social networks primarily relied on traditional statistical methods such as Naive Bayes, decision trees, and support vector machines [13]. These methods typically treated each node independently, focusing solely on node attributes while ignoring the inherent relational structure of social networks. As a result, they often suffered from low accuracy and poor scalability, especially when applied to large-scale, complex networks.
Subsequent efforts incorporated inter-node connections using models like Bayesian networks [1,14] to enhance classification performance. However, these methods still faced critical limitations: they assumed directionality in inherently undirected networks and struggled with interpretability and computational efficiency [15,16].
Given these challenges, recent studies have advanced social network node classification through inductive and multi-perspective learning frameworks. Benedetti et al. [17] proposed IMMENSE (Inductive Multi-perspective User Classification in Social Networks), which integrates graph structural context, semantic embeddings, and behavioral signals to detect malicious or discriminative users in large-scale social networks. Their work highlights the importance of modeling multiple relational perspectives and dynamic connectivity, providing strong interpretability for real-world social media applications. Similarly, Xia et al. [18] introduced a hierarchical message-passing framework for social network analysis that dynamically adapts neighborhood aggregation across heterogeneous relation types. This approach emphasizes multi-level structural attention and adaptive neighbor selection to capture both local and global dependencies. Furthermore, Lin et al. [19] proposed a label-aware graph convolutional network, which incorporates label information into the convolution process to enhance text classification performance, further validating the effectiveness of optimizing graph convolution by introducing adaptive mechanisms. Together, these studies illustrate the growing trend toward adaptive, interpretable, and multi-view graph models for social network understanding. Building upon this trend, the present work introduces a graph coupling convolutional model that further enhances interpretability by assigning explicit, similarity-based coupling weights to each neighboring node.
In this paper, we propose a novel graph coupling convolutional model (MGCN-Coupling) for multi-label classification of nodes in social networks. The proposed approach integrates node attributes and topological connectivity through an adaptive coupling mechanism that dynamically adjusts the weight of each neighboring node based on its similarity to the central node. Unlike traditional graph convolutional networks (GCNs) that employ shared or fixed convolution parameters, our model learns node-specific coupling coefficients, thereby capturing the heterogeneous influence of neighbors and improving interpretability in complex graph structures.
The novelty of this work is reflected in several essential aspects that distinguish it from existing GNN and coupling-based models. First, rather than relying on homogeneous aggregation, the proposed model directly encodes both node attributes and structural relationships within a unified topological graph representation. This formulation reduces matrix complexity and dimensional redundancy while preserving critical structural information. The resulting framework efficiently performs multi-label classification on large-scale networks such as BlogCatalog and Reddit, where nodes represent users or posts and edges represent social connections or shared interactions.
Second, we introduce an adaptive coupling mechanism that replaces static convolutional weights with learnable, similarity-driven parameters obtained through a neural collaborative filtering (NCF) module. This mechanism computes a distinct coupling coefficient for each node pair, reflecting their relational strength in both attribute and structural spaces. By integrating this adaptive weighting into the convolutional process, the model ensures that the central node receives the most relevant information from its neighbors while maintaining a high level of interpretability in the learned representations.
Third, the proposed model fuses connection information with intrinsic node attributes to generate a comprehensive node embedding that captures both semantic and topological dependencies. This fused representation serves as the input for multi-label classification tasks, enabling the model to predict complex node categories that often overlap in real-world social networks.
Finally, we validate the effectiveness and generalizability of the proposed MGCN-Coupling model through extensive experiments on multiple benchmark datasets, including BlogCatalog, Reddit, Cora, Citeseer, PubMed, and a custom-constructed topology dataset derived from the Open University Learning Analytics Dataset (OULAD). The experimental results demonstrate that the proposed model achieves comparable or superior performance to existing methods such as GraphSAGE and standard GCNs, while offering greater interpretability and reduced computational overhead. Overall, this work provides a unified and interpretable framework for graph-based multi-label classification that advances the current state of graph neural network design.
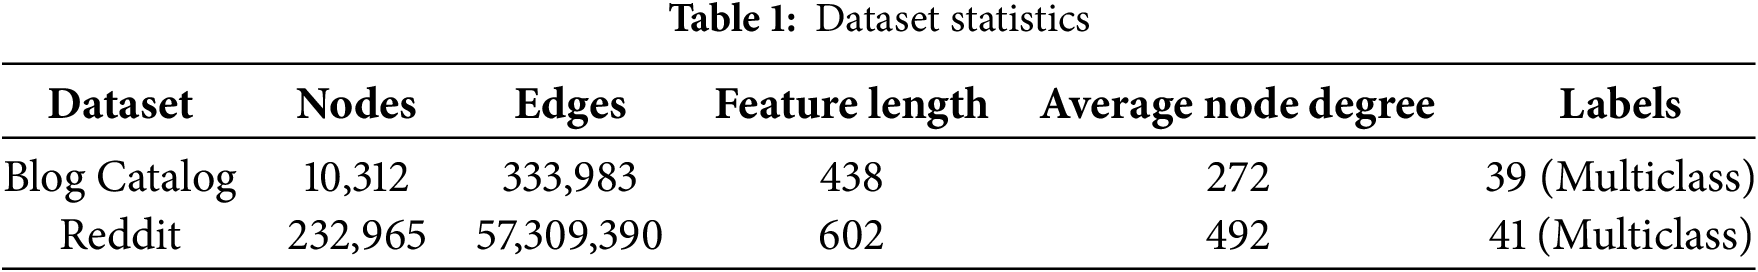
To experimentally verify the graph coupling model proposed in this paper, the experiment uses the public social network dataset BlogCatalog and Reddit as the research data. The BlogCatalog dataset [20] is a social relationship network. The topology map is composed of bloggers and his or her social relationships. The number of nodes in the BlogCatalog dataset is 10,312, the number of edges is 333,983, and the label dimension is 39. There are mainly two files, one is used to store the properties of the user node itself, and the other is used to store the connection relationship between the user node and the adjacent nodes. The label of the node is also composed of the node’s own attributes and the connection information between the nodes. Whether there is a connection between the nodes is determined by whether the nodes are friends. Reddit is a social news site where users can browse and post discussion threads. Other users can rate, comment on, or reply to posted content. (10.6084/m9.figshare.11923611.v3, accessed on 01 June 2025).
The Reddit dataset [21] is the discussion posts published by different users, as well as the user’s comments and replies obtained from the site, and the discussion posts will belong to different forum sub-sections. These discussion posts constitute the nodes in the topology graph. The features on the nodes are represented by the vectors obtained after the title and content of the discussion posts are processed by the natural language processing model. The labels of the nodes are the sub-sections to which the discussion posts belong. The connection depends on whether the same user has posted comments on both nodes. The task of node categorization is to categorize the sections of the Reddit site where posts appear. Specifically, the information constituting the node feature vector includes the title, comments, ratings, and reply to the post. The title of the post and user comments are text information, and the text vectorization operation is performed on the above information through the 300-dimensional GloVe Common Cral word vector library. Its label vector is represented by one-hot encoding. (https://snap.stanford.edu/graphsage/, accessed on 01 June 2025).
The statistics of the above two datasets are summarized in Table 1.
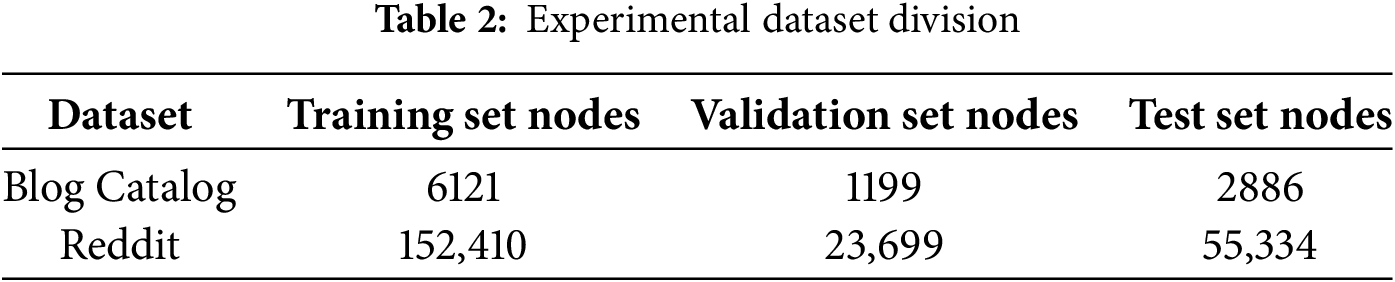
The dataset is classified into a labeled node set and a test set, and the labeled set is divided into a training set and a validation set, as shown in Table 2.
To validate the rationality of the model design, this study conducts experiments on three public citation network datasets, Cora, Citeseer, and PubMed, as well as one custom-built topology dataset derived from the OULAD educational data.
In the citation datasets, each document is treated as a node, and its content is represented by a one-hot encoded bag-of-words vector. The feature vector length corresponds to the total number of distinct words across all documents, with entries marked as 1 if the word appears in the document and 0 otherwise.
Connections between nodes are based on citation links, forming the graph’s adjacency matrix
The self-constructed dataset uses the publicly available Open University Learning Analytics Dataset (OULAD) to build a student-based topology graph. Nodes represent students, features include demographic and behavioral attributes, and edges are formed based on shared course registrations. Details of this dataset are illustrated in Fig. 1.
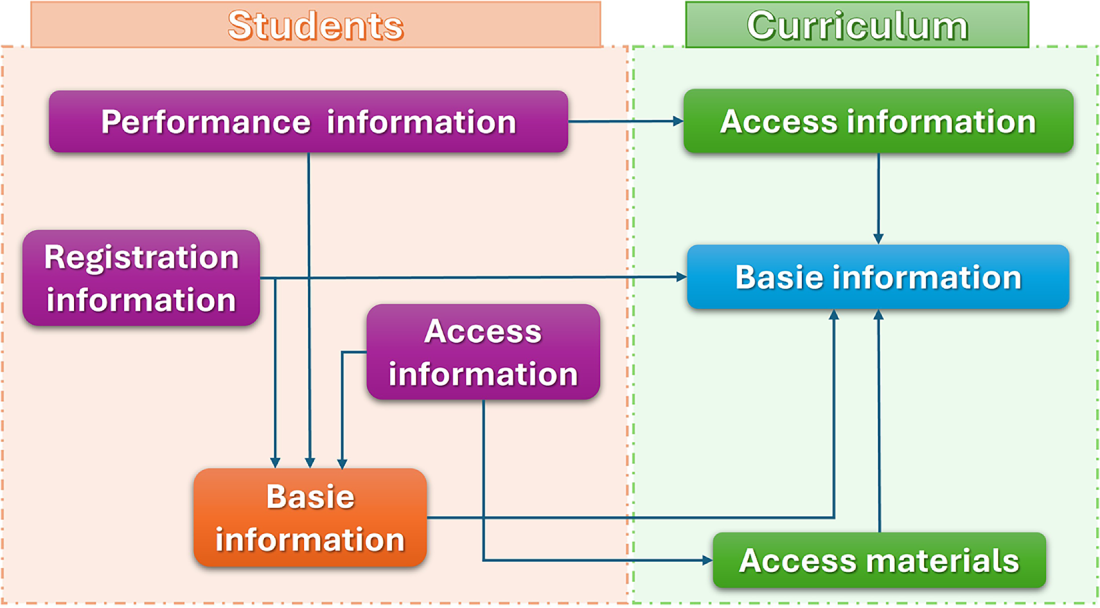
Figure 1: Composition of OULAD dataset
The student information used in this study is composed of four main components: (1) basic demo-graphic attributes such as gender, age, and highest education level; (2) course registration records; (3) online course usage data; and (4) academic performance data. In the constructed topological graph, each student is represented as a node. The node feature vector is built using all student information except course registration data and includes both categorical and numerical attributes. All attributes are encoded using one-hot encoding to form the final feature vector for each node.
The course registration information is used to establish connections between students. Specifically, if two students are enrolled in the same course, an edge is created between their corresponding nodes. The resulting adjacency matrix derived from these connections is identical to the previously defined matrix A, used to represent the graph topology. The final evaluation scores of students are used as node labels. These scores fall into four categories—Fail, Pass, Good, and Excellent, which are also encoded using one-hot encoding. The encoding process for both node features and label vectors is illustrated in Fig. 2.
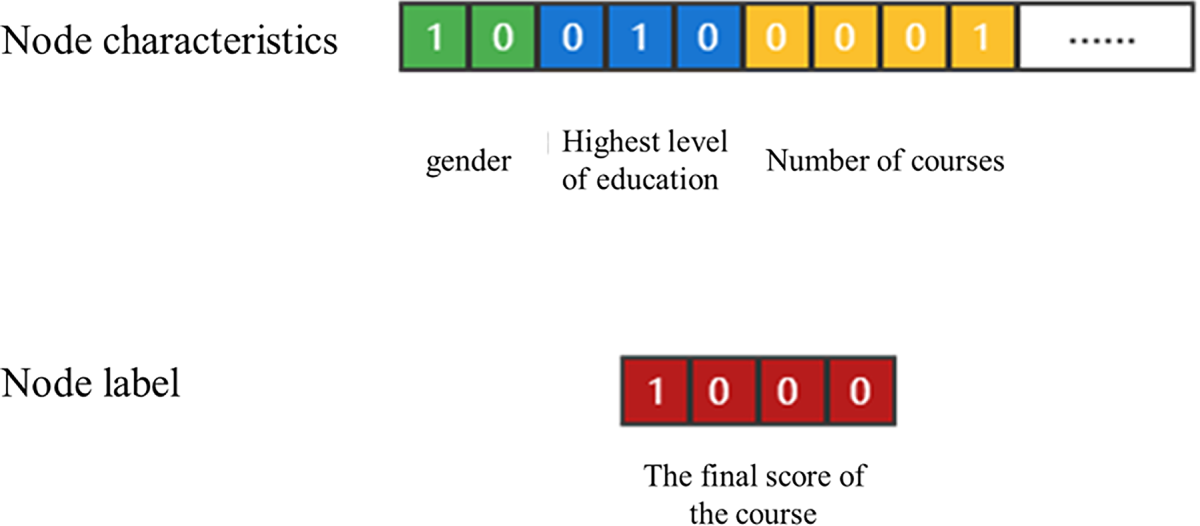
Figure 2: Encoding method of feature vector and label vector
3.1 Graph Convolution and Spatial Representation
The graph convolution model is designed to extract topological information by integrating each node’s intrinsic attributes with the structural connections to its neighbors. This process transforms the raw graph data into a feature representation that reflects both local and global dependencies within the network. Mathematically, the connection information between nodes can be expressed as a weighted summation of their attributes, while the updated node representation is obtained by fusing this aggregated information with the node’s original features, as shown in Eqs. (1) and (2).
where
The adjacency linked list of topological graph data is defined by the search strategy of Fig. 3a, and the result is shown in Fig. 3b.
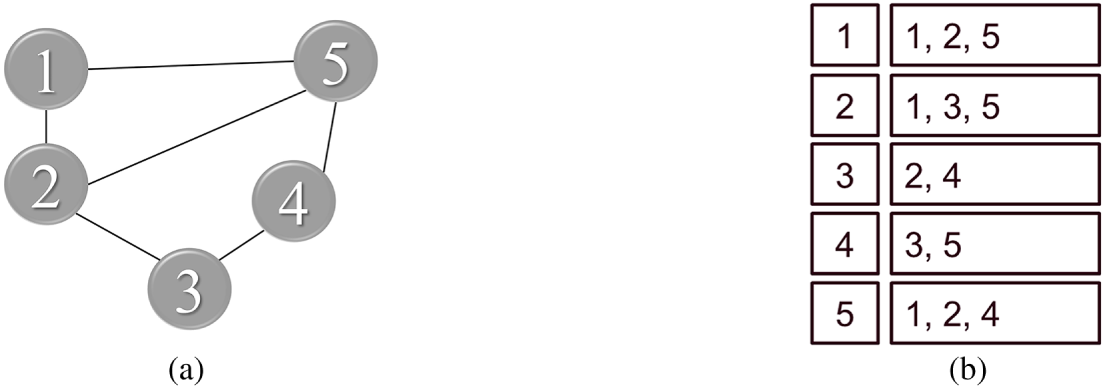
Figure 3: The adjacency liking to a list of topological graph data: (a) search strategy; (b) result
To implement this process efficiently in the spatial domain, the adjacency relationships of the topological graph are organized as linked lists. The search strategy for constructing these adjacency lists is illustrated in Fig. 3a, while the corresponding adjacency results are shown in Fig. 3b. This structure ensures that each node can directly access its neighbors without repeatedly traversing the entire graph, improving the computational efficiency of feature aggregation. However, as can be observed from Fig. 3, the number of neighboring nodes for each central node varies significantly, which poses a challenge to weight sharing in convolutional computation. When the total weights of a node and its neighbors are constrained to sum to one, the number of neighbors directly influences the assigned weights. For instance, if node 1 has two neighbors and node 2 has three, the coefficients between node 1 and node 2 cannot be shared consistently across both cases. Such inconsistencies may lead to conflicts in the learning process.
To address this issue, a fixed number of neighboring nodes is specified for each node [22]. When the actual number of neighbors exceeds this value, redundant ones are randomly pruned; when the number is smaller, virtual neighbors are sampled to maintain uniformity. The adjacency linked list obtained after this operation can be conveniently transformed into a matrix representation, facilitating vectorized convolution operations and ensuring consistency across the graph.
The feature updating process for a central node is illustrated in Fig. 4, where the similarity measure is set to 2 and the number of adjacent nodes is 1. In this example, the information from first-order neighbors is first aggregated to enhance the central node’s feature representation. Then, the second-order neighbors propagate their updated information to the central node through the previously selected first-order nodes. This hierarchical propagation allows the model to capture multi-level relational dependencies in the graph.
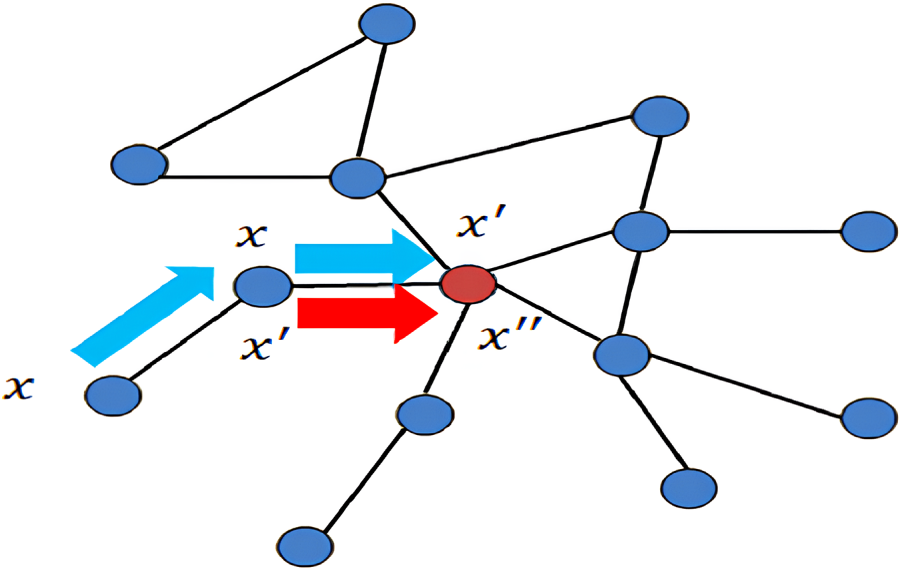
Figure 4: Schematic diagram of central node feature update
Although this spatial-domain approach effectively standardizes the neighborhood structure, several issues remain to be solved. The similarity measure and the number of neighboring nodes must be appropriately chosen to balance performance and computational cost. If too few neighbors are included, the model may lose contextual information; if too many are included, redundancy and noise may arise. Additionally, the shared-weight assumption neglects the varying strength of relationships between nodes, reducing the interpretability of the learned representations. These limitations motivate the development of the graph coupling convolution model introduced in the following section, which incorporates an adaptive weighting mechanism to overcome these challenges.
3.2 Graph Coupling Convolution Model
To address the limitations identified in Section 3.1, this section introduces a graph coupling convolution model built upon the spatial-domain convolution framework. The model is designed to enhance the flexibility and interpretability of node feature learning by refining how information is aggregated and fused within graph structures. Specifically, the following discussion elaborates on four key components of the proposed approach.
First, we establish a robust similarity measurement strategy that quantifies the relational strength between the central node and its neighbors, forming the foundation for adaptive weight assignment. Second, we define an appropriate neighbor selection mechanism that determines both the number and the order of neighboring nodes involved in the aggregation process, ensuring computational efficiency while maintaining representational accuracy. Third, we describe the fusion process through which each node’s intrinsic attributes are integrated with its connection information, allowing the model to capture both structural and semantic correlations. Finally, we explain the classifier training procedure, where the fused representations are utilized to predict multi-label categories for social network nodes. Together, these components constitute a unified modeling framework that effectively couples node similarity, neighborhood topology, and feature integration to achieve improved performance in multi-label node classification.
3.2.1 Determination of Similarity Measures
This section will introduce and analyze the similarity measures of different algorithms and obtain the value of the similarity measure of the graph coupling convolution model proposed in this paper. The most convenient way to use connection information in topological graph data is the graph embedding model. In feature extraction, the data is represented by dimensionality reduction and the connection information is completely preserved. It is required that similar nodes in the original graph are still close in the low-dimensional representation. It mainly includes three algorithms: Deep Walk [23], Line [24], and Node2Vec [25]. Since Node2Vec is an extension of the Deep Walk algorithm, these two algorithms are almost identical in the selection of similar measures.
The Deep Walk algorithm constructs a similar measure determined by the number of walks
The depth walk algorithm completes the k-order similarity measurement through the k walk of the central node, but at the same time does not consider the node’s own attributes. The Line algorithm is an algorithm that uses both the attributes of the node itself and the connection relationship between nodes. The first-order similarity is used to measure the two nodes directly connected in the topology graph, and the second-order similarity is used for the two nodes that have a common connection node. order similarity, and so on. The following Eqs. (3)–(5) represent the first-order similarity, the second-order similarity and the overall loss function, respectively.
where
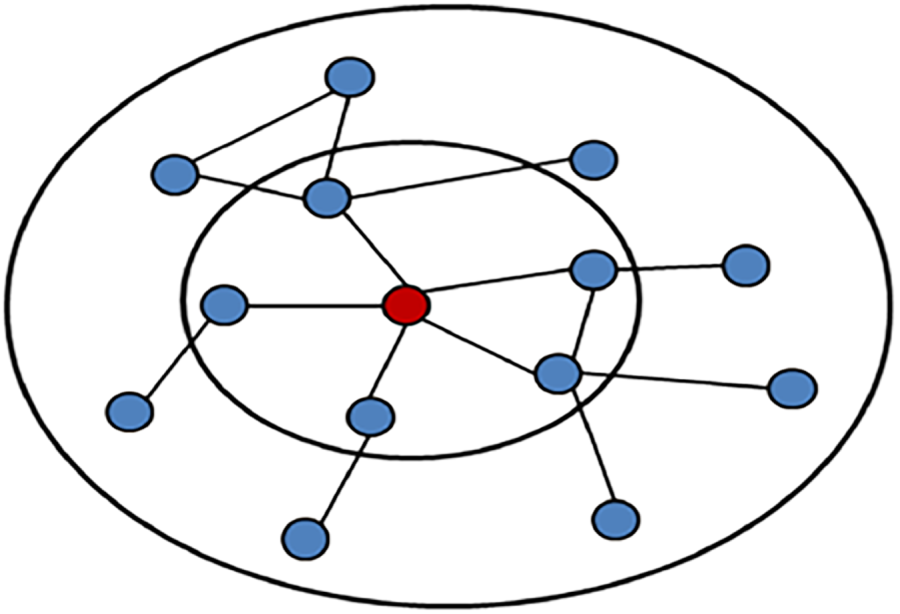
Figure 5: Similarity metric selection diagram
The first-order similarity indicates that two nodes are directly connected, and the second-order similarity indicates that the two nodes have a commonly connected node. Firstly, the above is consistent with the description of the similarity between nodes. Secondly, when the similarity is excessively high, it leads to a significant increase in computational workload, resulting in prolonged processing times.
3.2.2 Determination of the Number of Neighbor Nodes
Since the graph-coupling-based convolution model proposed in this paper is also implemented in the spatial domain, of course, there will also be problems such as weight coefficients cannot be shared and the central node may use itself as a neighbor node for node feature update operations. Due to the selection of similarity measures, this section proposes to construct two adjacency lists based on the selection of adjacent nodes, which are the first-order adjacency list
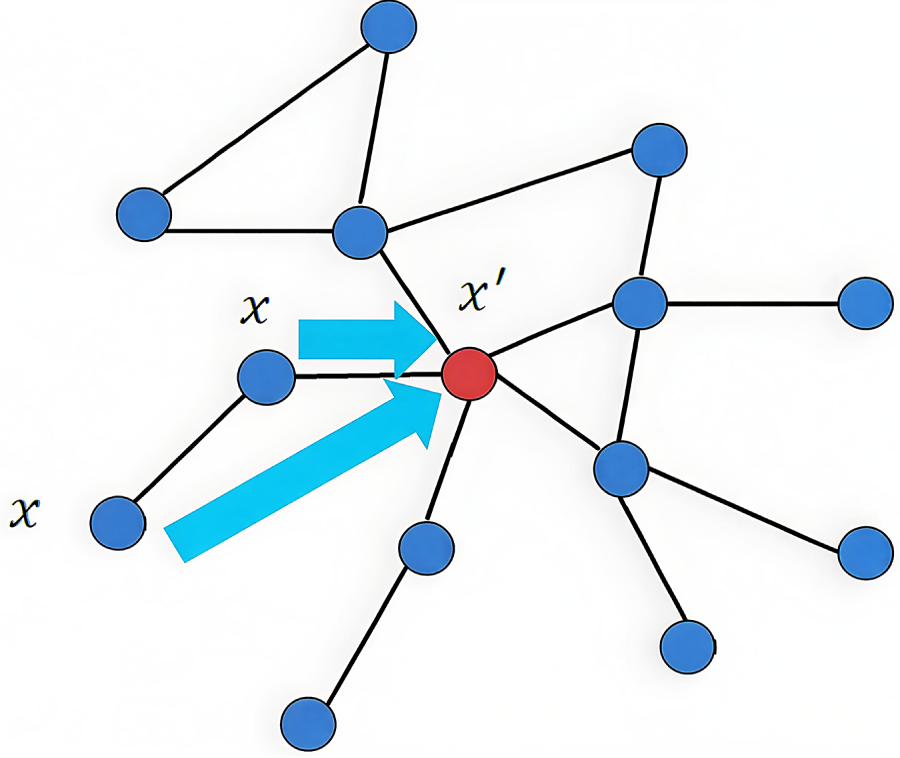
Figure 6: Graph coupling convolution model center node update policy
3.2.3 The Fusion Method of the Node’s Own Attributes and Connection Information
The fusion method of the node’s own attributes and connection information is shown in Eq. (6), in which the
where
Feature extraction in convolutional neural networks is traditionally applied to image data, where the discrete convolution operation functions as a weighted summation of neighboring pixel values. Extending this concept to graph-structured data, the proposed graph coupling convolution model assigns each node a distinct weighting coefficient that governs how its attributes contribute to the aggregated representation. These coefficients are initially randomized and subsequently optimized through backpropagation, enabling the model to learn meaningful relational strengths during training. Within this framework, the weight function
Existing definitions of convolution-layer weight coefficients can be grouped into two main categories. The first category comprises polynomial-based and homogenized schemes such as Chebyshev filters, in which the weights of all neighboring nodes are identical or shared. Although computationally simple, such uniform schemes fail to meet the above requirements for adaptive and interpretable weighting. The second category includes sequence-based and pooling-based methods, such as LSTM networks [26] and graph pooling operators. However, these methods are either designed for temporally ordered data or spatial transformations, which are irrelevant in the context of social networks where node connections are not temporally or geometrically constrained. Consequently, neither approach provides the interpretability or adaptive weighting desired in multi-relational social graphs.
To address these shortcomings, we introduce a coupling mechanism. This mechanism computes the similarity between each neighboring node and the central node to determine individual weight coefficients. These coefficients are then used to perform a weighted aggregation of neighboring node features. The coupling mechanism satisfies all three requirements: First, the weights are learnable and can be optimized via backpropagation; Second, they reflect the varying degrees of connectivity or similarity between nodes; And third, the mechanism offers strong interpretability, making it well-suited for graph-based learning tasks in social networks.
Graph Coupling Networks (GCNs) are convolutional models designed to operate on graph-structured data by leveraging graph coupling mechanisms. In this framework, the input consists of the raw node feature matrix
The coupling function
where
In this work, the similarity values are not precomputed but are dynamically obtained during each training iteration. The initial similarity structure follows the first- and second-order connectivity derived from Node2Vec principles, providing a structural prior. During training, these similarity scores are further refined jointly with model parameters through the NCF component, which learns nonlinear mappings between node pairs. As a result, the similarity function evolves adaptively with network optimization, allowing the coupling coefficients to represent both the structural closeness and feature-based relationships between nodes.
Compared with standard attention or correlation-based weighting methods, NCF offers greater flexibility in modeling nonlinear and asymmetric relationships between nodes. Attention mechanisms, such as those used in GATs, mainly rely on dot-product similarity and softmax normalization, which capture only linear dependencies and can become unstable in large or dense graphs. In contrast, NCF learns a nonlinear mapping between node pairs through a small neural network, allowing the coupling coefficient to represent more complex interaction patterns. It also models each pair of nodes independently, reducing sensitivity to neighborhood size. Therefore, NCF provides a more expressive and stable way to estimate pairwise connection strength while maintaining interpretability.
Based on these similar values, a weight coefficient
Although many attention-based GNNs adopt softmax normalization with a temperature parameter, this study employs simple sum normalization to ensure numerical stability and interpretability. Because the similarity scores
Using these learned weights, the updated representation of the central node
Finally, this aggregated feature is fused with the central node’s original attributes to produce the final output feature, enabling the model to simultaneously capture structural and feature-based relationships in the graph.
In this paper, the NCF is used to realize the assignment of weight coefficients corresponding to each adjacent node of the central node. When it comes to node feature inter-action, NCF uses neural structures to replace the inner product operation of Matrix Factorization, so that any function can be learned from data.
The characteristic of NCF is that it can better mine the relationship between nodes. Therefore, firstly, the attributes of the central node itself and the connection information between nodes are extracted separately, and then the weight coefficients corresponding to each adjacent node of the central node are obtained through NCF. At the same time, this paper optimizes the process of NCF, increases the activation function and only outputs the corresponding weight coefficient matrix, as shown in Fig. 7.
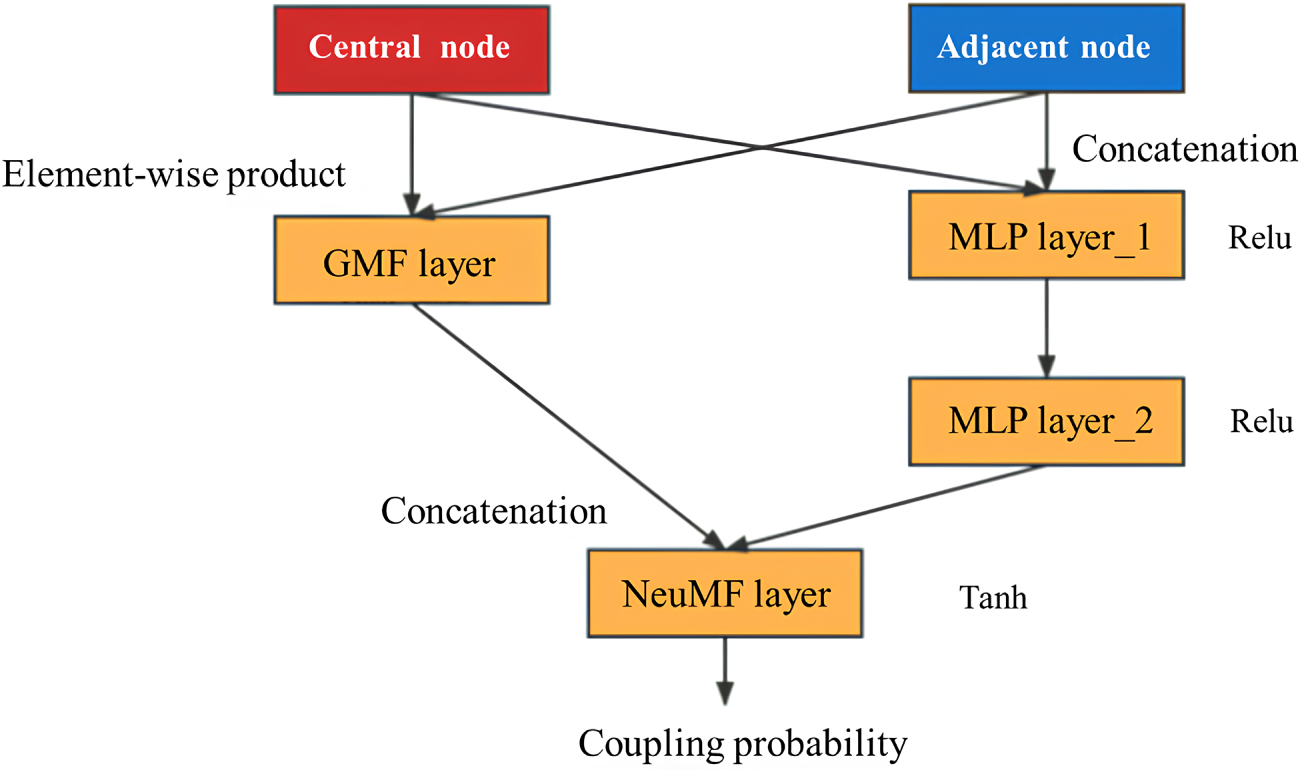
Figure 7: Coupling probability mining process realized by neural collaborative filtering
Each pair of node features
The introduction of the coupling mechanism is mainly to solve the explanatory problem of the determination of the weight coefficient. The larger the weight parameter is, the closer the relationship between the leader node and the central node is, and the greater the influence on the label classification of the central node. At the same time, due to the introduction of the coupling mechanism, the feature extraction of nodes is more accurate. The weight coefficient corresponding to the last adjacent node can be updated by back-propagation after each iteration of the node multi-label classification operation is completed to ensure better classification results.
Since the central node will accept the weighted summation result of the feature information of all its neighbor nodes, when accepting the connection information between the nodes, the central node and its own attributes are often forgotten. To integrate all the feature information to update the central node, the central node’s own attributes and the connection information between nodes are spliced together to form new feature information of the central node, as shown in Fig. 8.
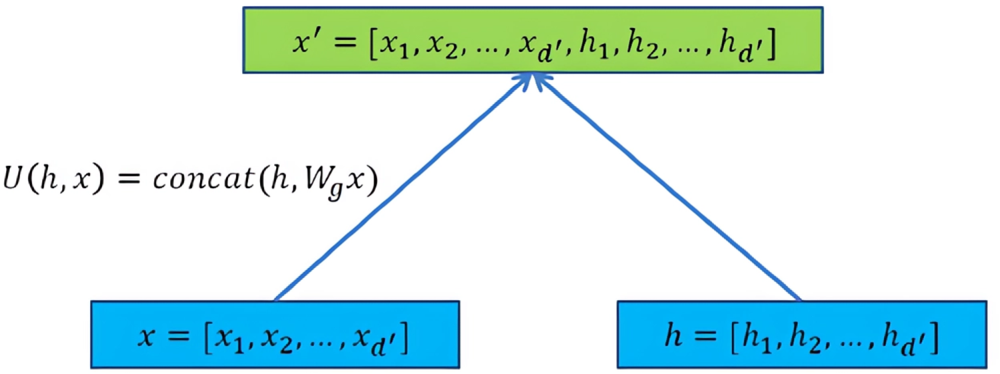
Figure 8: Schematic diagram of node new feature information
The new feature information of the node can be obtained from the previous section, and the next step is to train the classifier through the mapping relationship between the new feature information of the existing node label. The new feature information of the node is fused from the node’s own attributes and the connection information between the nodes. The new feature information of the node is used as the input, and the label classification result of the node is obtained through the classifier.
The classifier for the single-label classification task is shown in Eq. (11).
The classifier for the multi-label classification task is shown in Eq. (12).
In Eqs. (11) and (12), the function f represents the convolutional layer operation,
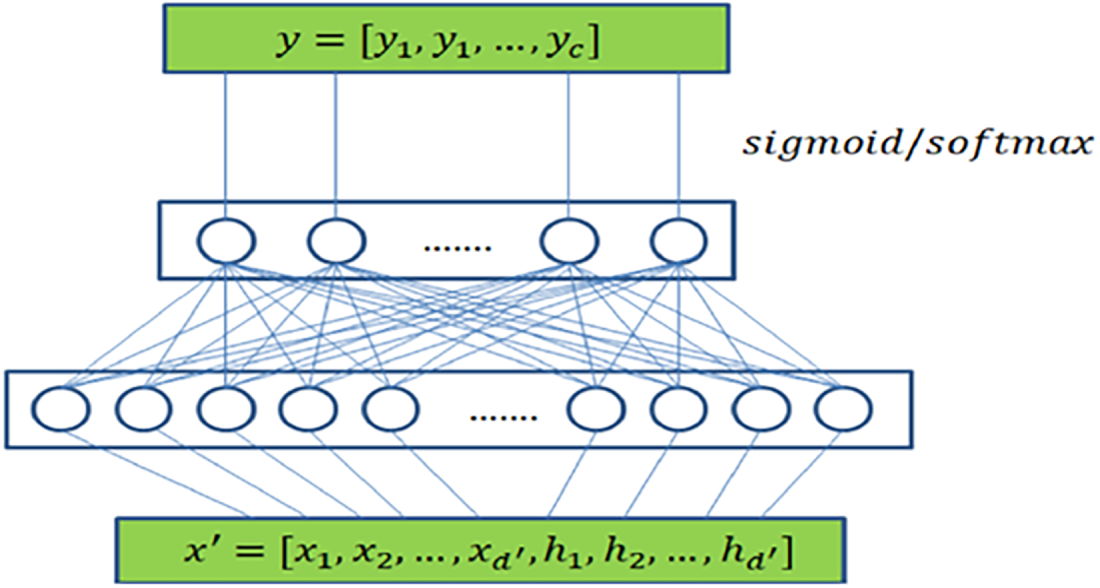
Figure 9: Classifier training diagram
3.2.5 Loss Function and Gradient Descent
After the classifier training in the previous section is completed, the results obtained by the classifier are compared with the real results to calculate the loss function. To avoid a decrease in model classification accuracy and prevent overfitting, the error is backpropagated to adjust the central node. The weight coefficients of neighbor nodes are updated to minimize the difference between the classification outcome and the ground truth. To train and update the weight coefficient of the adjacent nodes of the central node more conveniently, the gradient descent method is used for research.
The gradient descent method is also called the batch gradient descent method, that is, only a certain batch of nodes is trained. It does not make much difference to study the part alone when order similarity is used. The feature information of a node only includes its own attributes and the connection information of adjacent nodes, which also ensures that the in-fluence in local training will not be too satisfying. The advantage of the gradient descent method is that the speed is significantly improved after the number of research objects is reduced, and a locally trained classifier can also be applied to other homogeneous topological graphs. The algorithm flow framework is shown in Fig. 10.
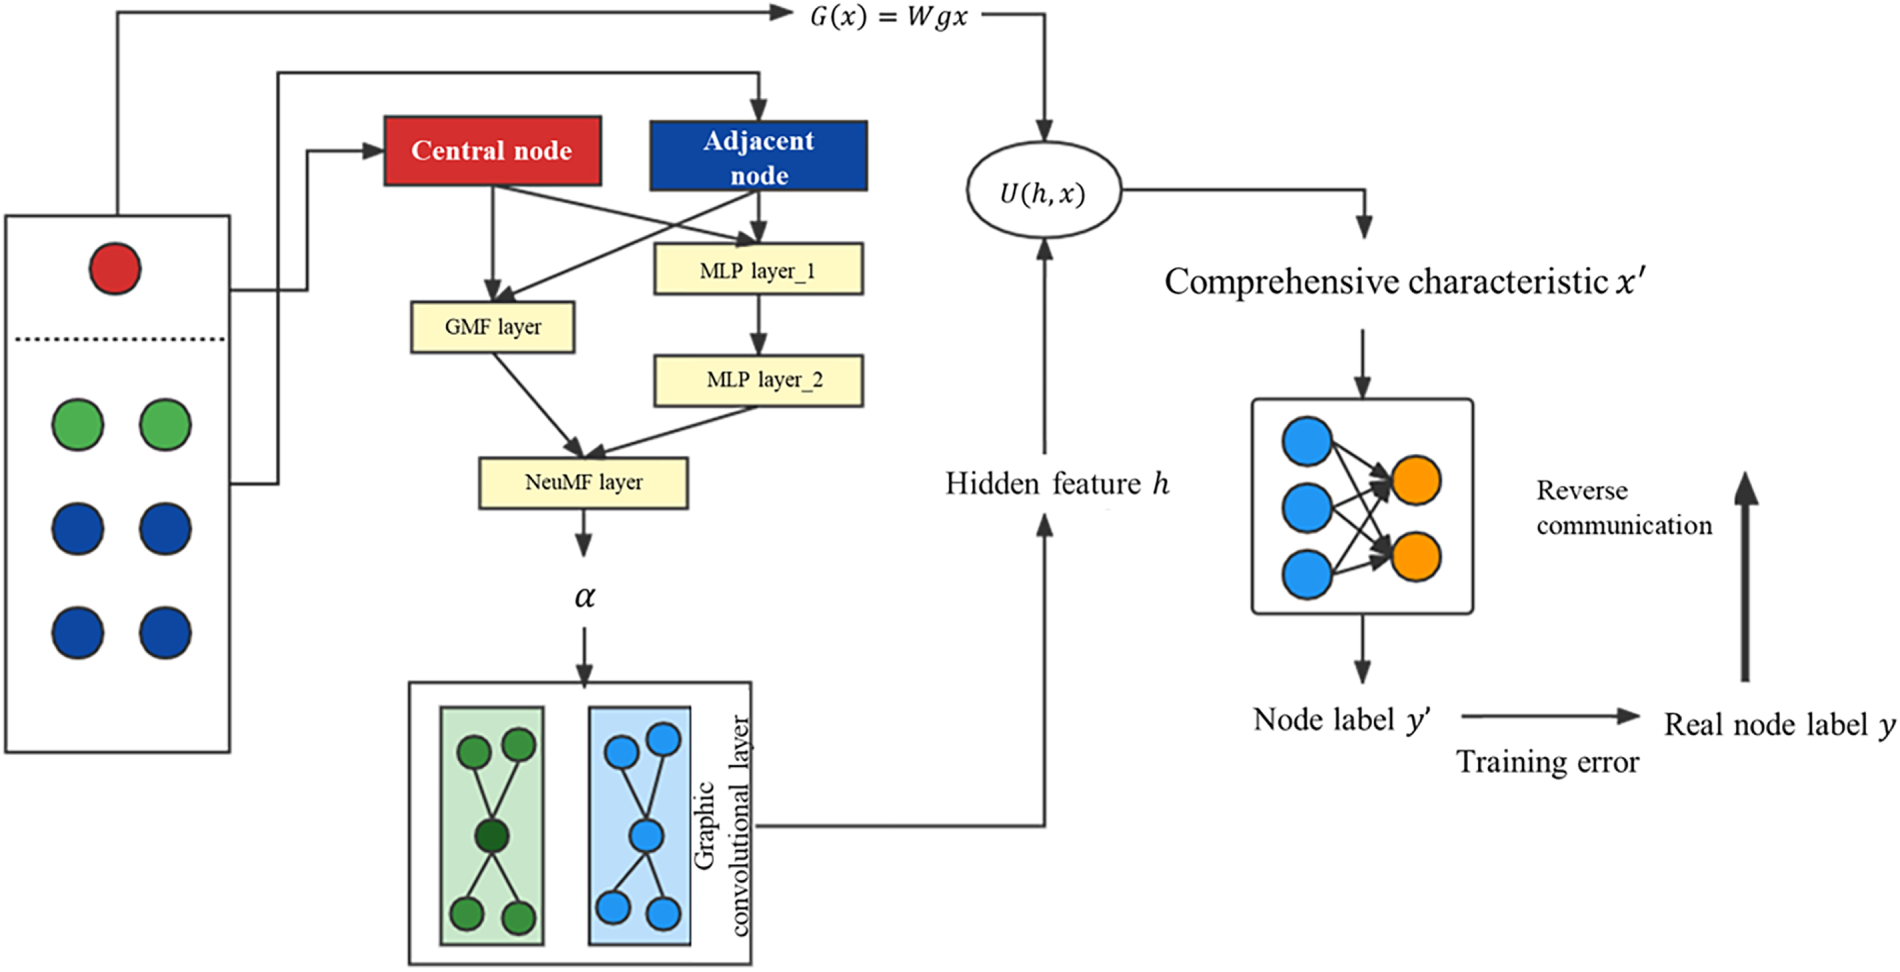
Figure 10: Overall framework of the model
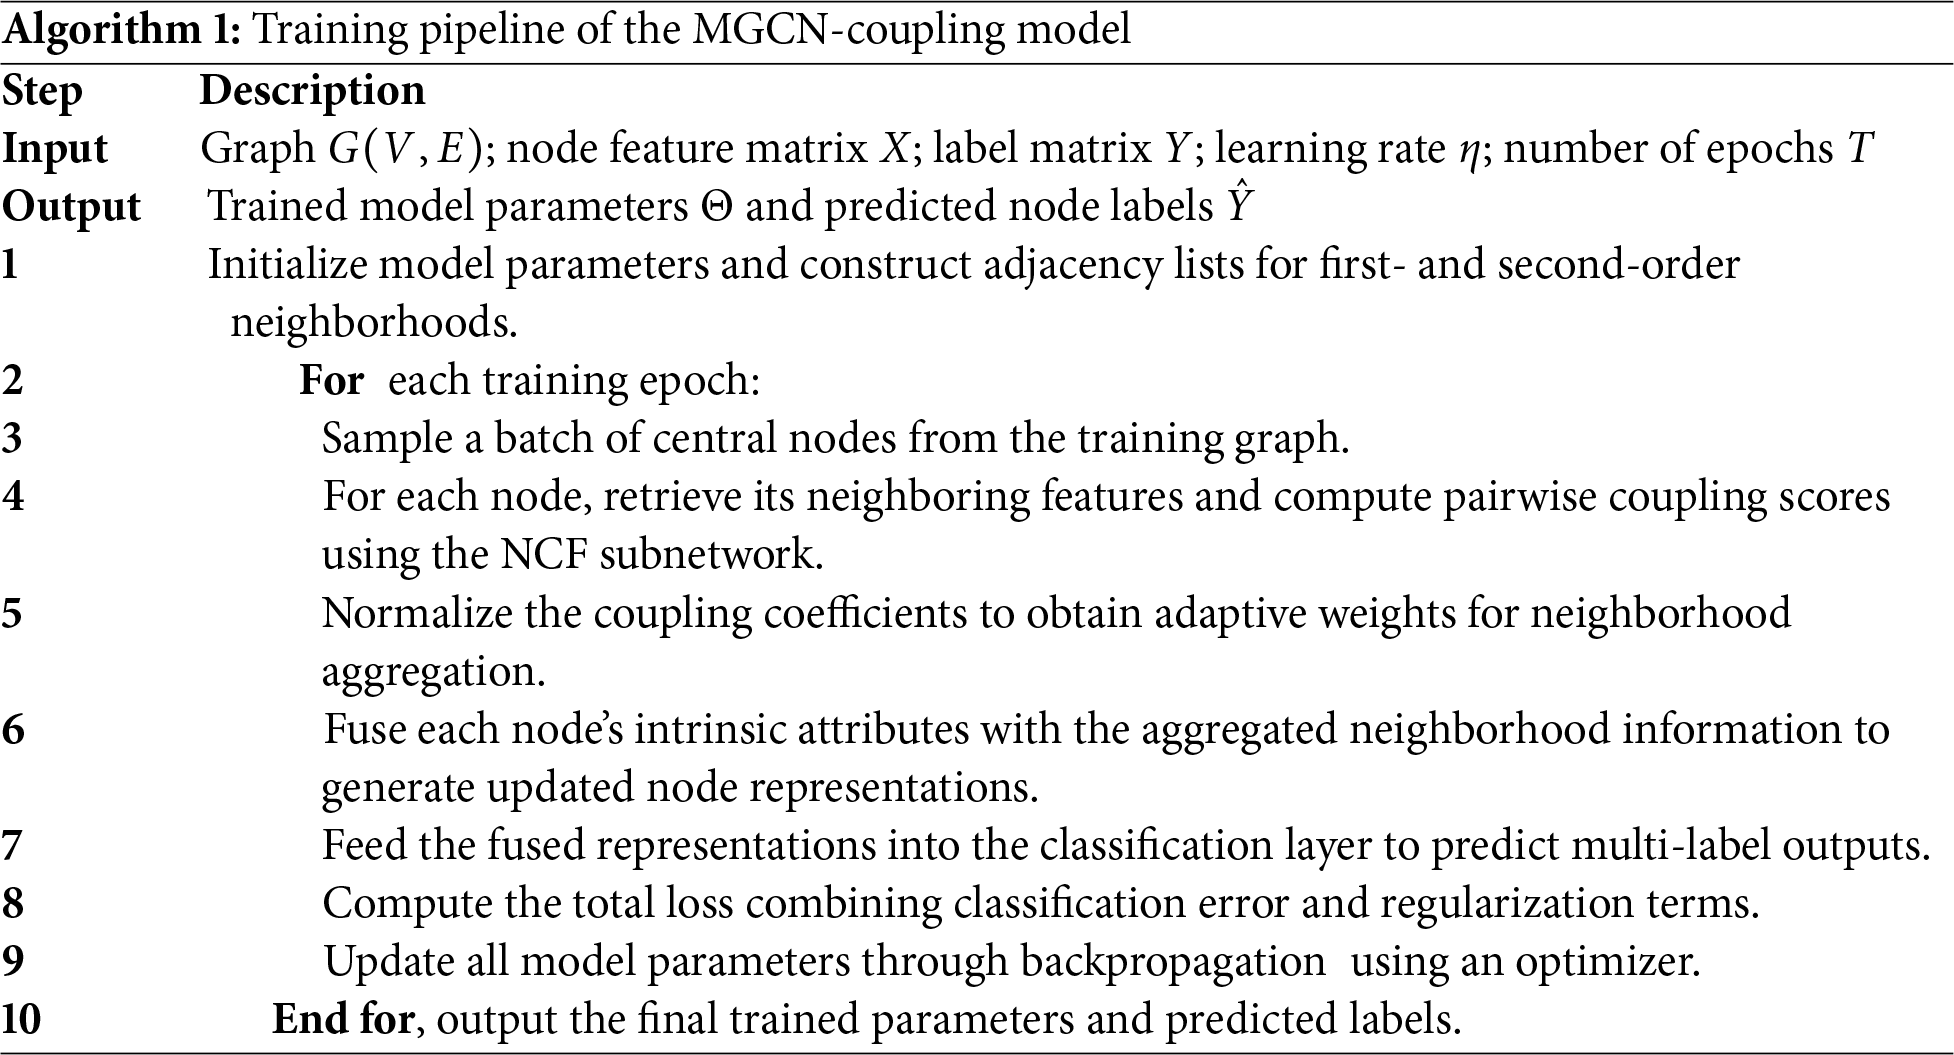
To improve the clarity and reproducibility of the proposed model, the overall training procedure of the MGCN-Coupling is summarized in Algorithm 1. This pseudocode outlines the main stages of the training pipeline, including input/output definitions, coupling coefficient computation, feature fusion, and classifier optimization.
4.1 Validation Experiment of Graph Coupling Model
4.1.1 Selection of Comparative Models
To compare with the graph coupling model proposed in this paper, three other models are selected in the experiment.
The first type is a classification model that does not consider the connection information between nodes, such as random classification model and multilayer perceptron model; the second type is a classification model that does not consider the connection information between nodes. The graph convolution model GraphSAGE [21] is chosen. GraphSAGE (Graph Sample and Aggregation) is a powerful graph representation learning algorithm that aims to learn node embeddings in a graph. It leverages the neighborhood information of nodes to generate informative and context-aware node representations. And it is then divided into four algorithm models according to the different aggregation functions: the third type is the graph coupling model proposed in this paper, which removes the coupling mechanism and distributes the weights equally.
4.1.2 Model Parameter Selection and Setting
Since the random classification model obtains the node classification results in a completely random way, no parameters need to be set. Next, we will focus on the parameter settings of the graph convolution model GraphSAGE, and construct two matrices
The general steps of the graph coupling neural network model have been explained clearly in the above chapters. Here is the selection of the number of nodes with given first-order and second-order similarity. The number of first-order similarities is 50% of the node degree, and the number of second-order similarities is half of the first order. The above node degree sizes are given in Table 1. At the same time, the convolutional network model MGCN-Mean with shared weights and the model MGCN-Coupling with different weights introduced by the coupling mechanism are experimentally verified to compare the influence of the coupling mechanism on the classification results.
4.1.3 Model Performance Test Evaluation Index
F1-Score is often used to represent the excellence of the model, and it can be calculated as Eq. (13):
In the Eq. (13), precision refers to proportion of true positive samples among the samples that are predicted to be positive, and recall refers to the proportion of correctly predicted positive examples among all positive examples. Eqs. (14) and (15) are the calculation for precision and recall:
TP (True Positive): Positive samples that are correctly predicted; FP (False Positive): Negative samples predicted as positive samples; FN (False Negative): Positive samples predicted as negative samples; TN (True Negative): Negative samples that are correctly predicted. F1 can only represent the classification result of a single label, so there is one last step: Score is equal to the average value of F1 values for each label. Therefore, in the end, the value of Score is used to represent the classification results of each model.
4.1.4 Model Performance Comparison Experimental Results
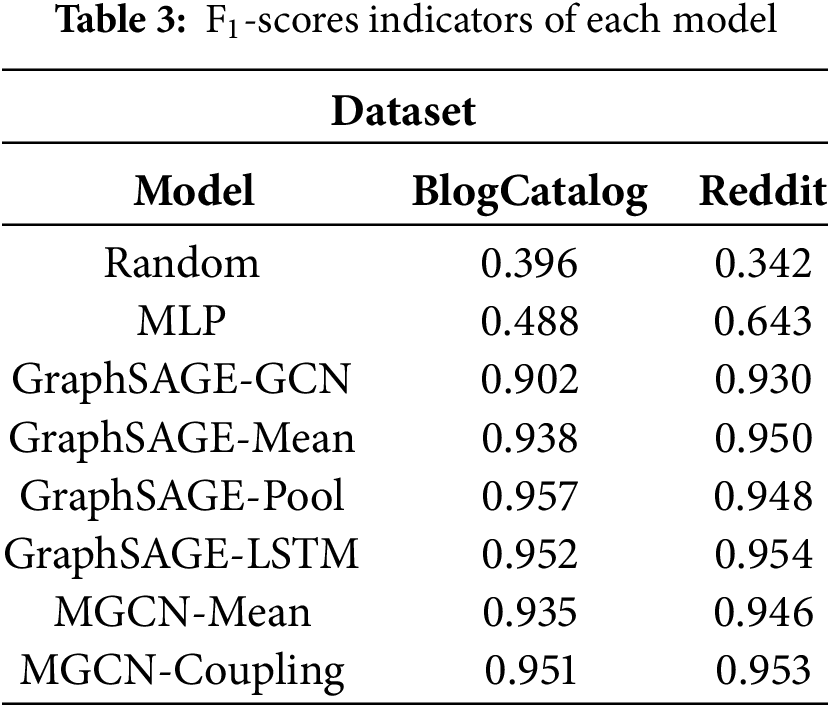
The graph coupling model proposed in this paper and several other mature algorithm models are clas-sified and tested on the above data sets, and the advantages and disadvantages of graph coupling density are obtained through the analysis of the results. To ensure the reliability of the reported results, all experiments were conducted five times under identical conditions, and the average performance is presented in Table 3.
4.2 Experiments to Verify the Rationality of the Model
This part of the experiment will verify the model using only the first-order similarity and second-order similarity through the public datasets Cora, Citeseer and Pubmed provided by the literature, and use the self-built dataset OULAD to explain the vector splicing operation using skip connections. The statistics of the datasets are shown in Table 4.
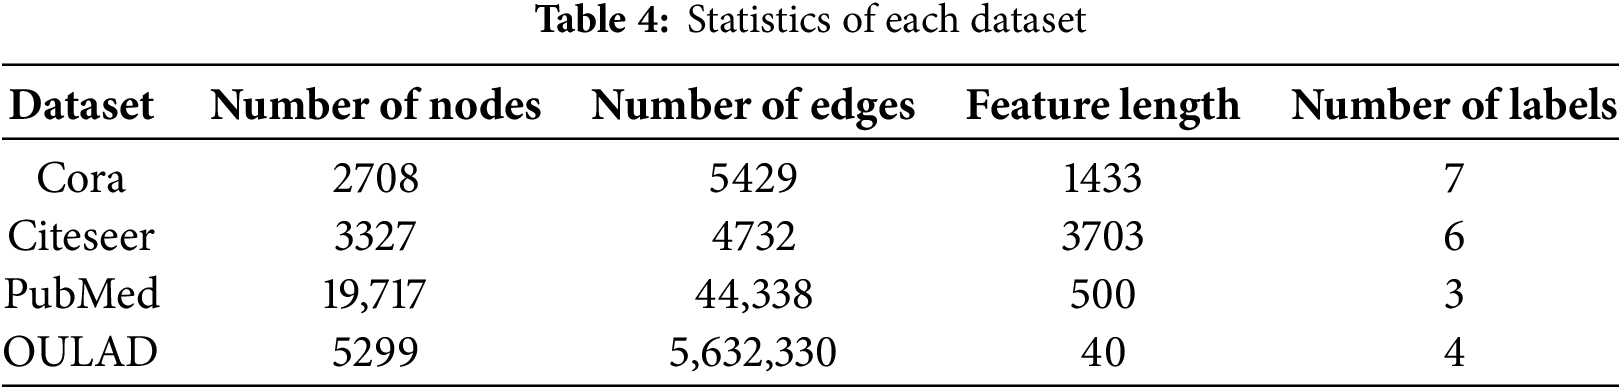
It can be observed from the table that the OULAD data is very dense, which corresponds to the degra-dation of the graph convolution model. This model used in this part of the experiment is the GCN model proposed in literature. The learning rate of the model is set to 0.01, the number of hidden layers is set to 64, and the dropout is set to 0.5. For the verification experiment of similarity selection, the experiment will compare the node classification accuracy and single training time considering different order neighbor-hoods. The experimental results are shown in Table 5, and the topology map data composed of the OULAD dataset is shown in Fig. 11.
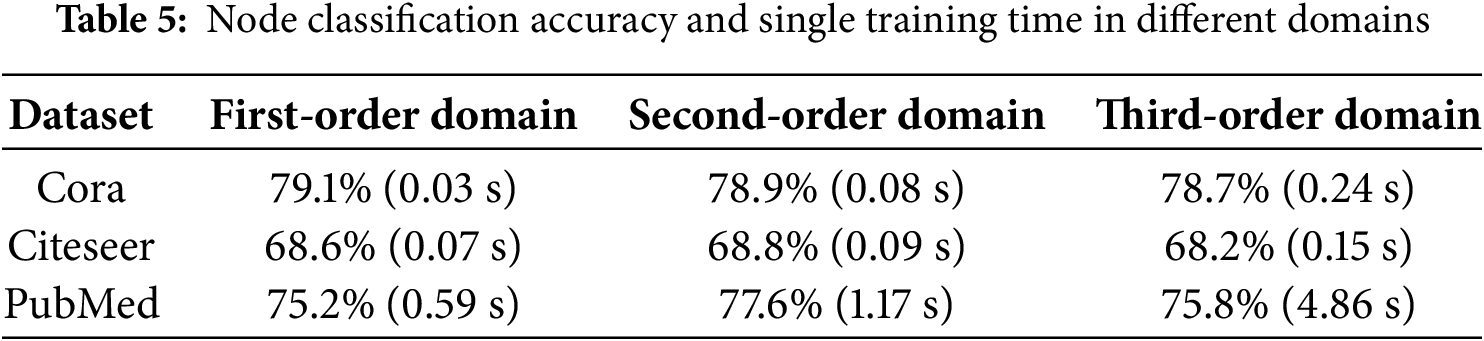
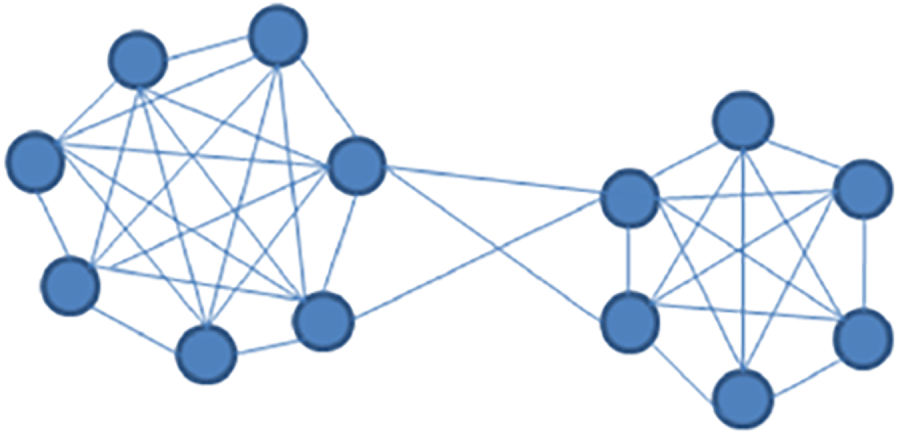
Figure 11: Schematic diagram of topology map data in the case of degradation
Since the criterion for the existence of connection information is whether the student represented by the node is enrolled in the same course, there is a connection between these nodes. The graph convolution model and its settings used in the experiment are consistent with the previous experiment, in which GCN is the original algorithm model and GCN-skip is an algorithm model that uses a skip connection mechanism for feature splicing. The structure of the GCN model and the GCN-skip model is similar. The main differ-ences are shown in Fig. 12. The left picture is the structure of the GCN model, and the right picture is the structure of the GCN-skip model.
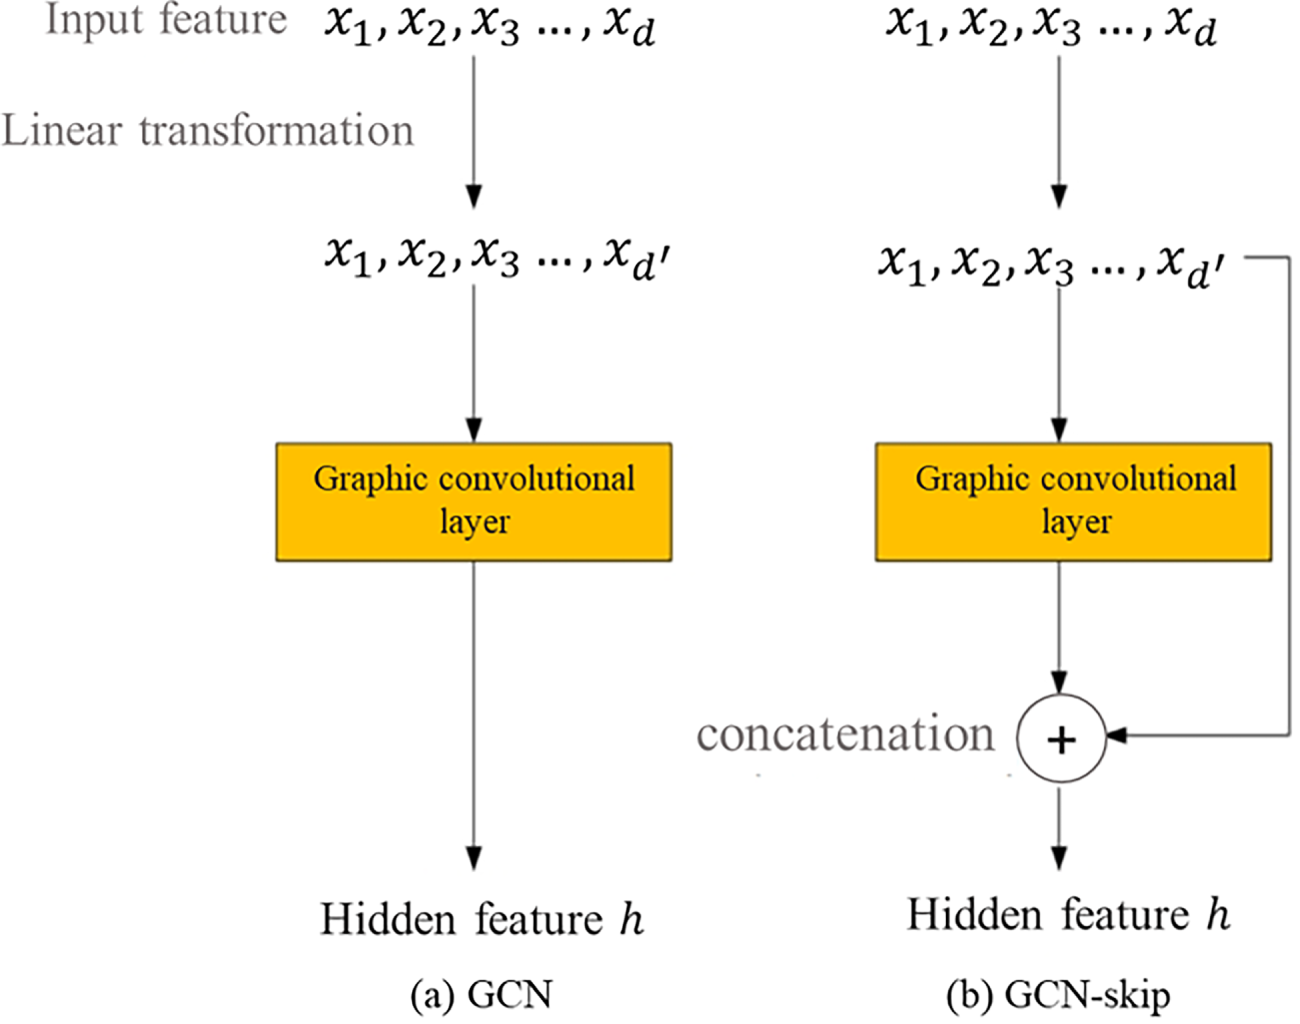
Figure 12: Schematic diagram of GCN and GCN-skip models
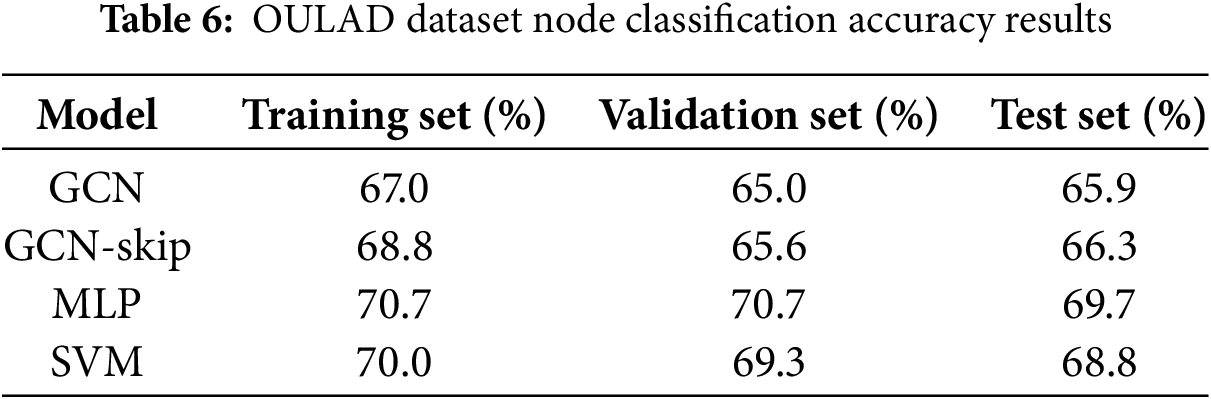
The comparison model of the experiment is Multi-Layer Perceptron (MLP) and Support Vector Ma-chine algorithm (SVM). The MLP consists of two fully connected layers, the hidden layer units are 64 and 32, respectively, and the dropout is set to 0.5, the learning rate is set to 0.01. The support vector machine uses a linear kernel. Accuracy is used to evaluate the classification results. The results are shown in Table 6.
To verify the rationality of the model structure in utilizing the similarity between nodes, the following experiments are designed in this section: the models for experimental comparison are MGCN-Mean and GraphSAGE-Mean, and the parameter settings of the two models are the same as described above.
The data used in the experiment is the PPI data set. The experiment compares the batch size of different training sample data batch = [8, 16, 32, 64, 128, 256, 512] and different learning rates learning rate = [0.5, 0.1, 0.05, 0.01, 0.005]. Batch training time, by taking the average training time of the same training batch size with different learning rate settings as a comparison. The blue column corresponds to the training time of the MGCN-Mean model, and the orange corresponds to the training time of the Graph SAGE model. The comparison results between the two are shown in Fig. 13.
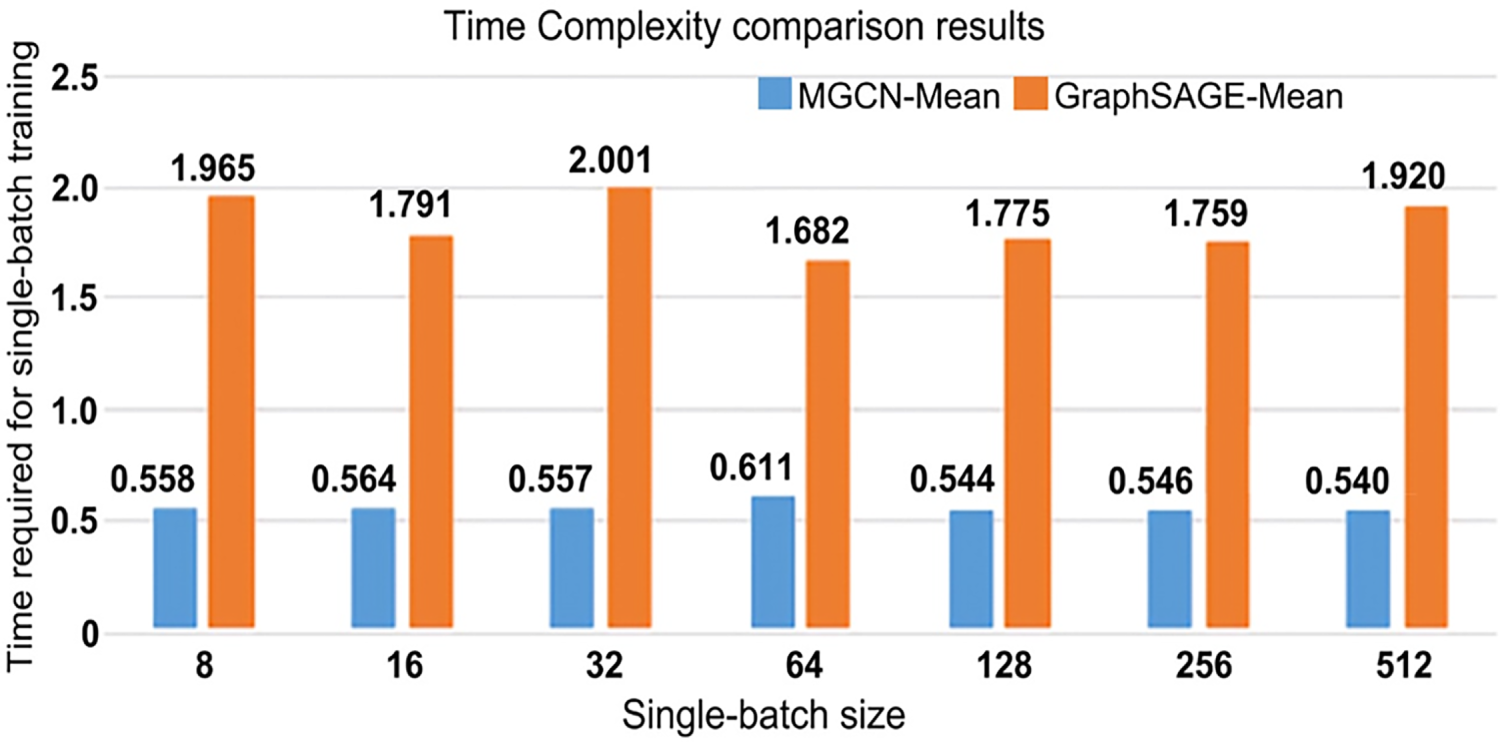
Figure 13: Comparison results of single batch training time
The experimental results demonstrate that the proposed graph coupling model outperforms traditional classification algorithms, particularly in multi-label node classification tasks within social networks. Compared to the MLP model, which relies solely on node attributes, the graph coupling model achieves nearly 50% higher classification scores. This performance gain highlights the critical role of topological connectivity in improving classification accuracy, underscoring the importance of incorporating relational information between nodes in graph-based tasks. Moreover, the adaptive neighbor-weighting mechanism explored in this work conceptually resonates with recent developments in distributed intelligence and networked decision-making.
In comparison to a weight-sharing graph convolutional model (MGCN-Mean), the coupling-based model yields a slightly better performance. Although the improvement is marginal, it suggests that the adaptive weighting mechanism introduced by the coupling strategy offers a more expressive modeling of node interactions than uniform aggregation. When evaluated against established GraphSAGE variants on the BlogCatalog dataset, the proposed model performs comparably across different implementations. This indicates that while the overall classification performance is close to that of mature graph neural networks, the interpretability brought by the learned coupling weights presents a notable advantage, as it enables the model to explain the importance of neighbor nodes based on their similarity to the central node. Interpretability in this context is inherently derived from the model’s structure rather than post-hoc analysis. The learned coupling coefficients
The experiments also reveal that incorporating third-order neighbors does not significantly improve classification accuracy but results in a substantial increase in training time, up to threefold on datasets such as Cora and Pubmed. Therefore, a trade-off between computational efficiency and modeling capacity suggests that aggregating first- and second-order neighbor features is a more effective and efficient choice. The model further benefits from a preprocessing strategy that avoids redundant neighbor extraction and directly integrates second-order neighbor features, which significantly reduces the training time per batch.
Although the proposed coupling mechanism introduces an interpretable and adaptive weighting process, the observed performance improvements over strong baselines such as GraphSAGE and MGCN-Mean remain relatively modest. This outcome can be attributed to several inherent factors in both the datasets and the model design. First, datasets such as Cora, Citeseer, and PubMed exhibit strong homophily, meaning that neighboring nodes tend to share similar labels. In such scenarios, uniform or mean aggregation—as used in GraphSAGE—already provides near-optimal results, thereby limiting the marginal benefit of adaptive coupling. Second, the coupling mechanism primarily enhances interpretability rather than introducing new representational capacity; the learned coupling coefficients refine the weight distribution among neighbors but do not alter the underlying feature propagation pattern. Consequently, its improvements are more evident in heterogeneous or weakly homophilic graphs such as Reddit and BlogCatalog, where node connectivity is more diverse. Furthermore, the model’s reliance on precomputed similarity measures introduces potential sources of bias when the graph contains noisy or incomplete edges. In these cases, the learned coupling coefficients may emphasize misleading relationships, leading to minor degradations in classification accuracy. Another limitation arises from computational trade-offs: while the coupling process reduces overfitting by imposing structure-aware weighting, it also increases parameterization and slows convergence slightly during early training epochs. These trade-offs explain why the overall accuracy gains are moderate, despite the conceptual and interpretive advantages of the coupling design.
Despite its promising results, the proposed approach presents certain limitations. First, its performance depends heavily on hyperparameters such as neighborhood order and similarity functions, and a unified tuning strategy across datasets is lacking. Second, the model’s generalization ability in cross-graph or inductive learning scenarios remains untested, as the current experiments are limited to single-graph training and evaluation. Third, although the model introduces an adaptive weighting mechanism, the additional computational cost may become a bottleneck when scaling large-scale graphs. Moreover, while the coupling mechanism enhances interpretability by capturing node-wise interaction strength, a quantitative assessment of this interpretability is still absent and needs further investigation.
Future research can address these issues by exploring sparse graph representations or low-rank ap-proximations to reduce computational complexity. Incorporating attention mechanisms could improve interpretability and enable dynamic feature selection among neighbors. The current model could also be extended to heterogeneous or temporal graphs to improve its adaptability in more complex real-world scenarios. In addition, integrating self-supervised pretraining strategies may enhance the model’s robustness in low-label or transfer learning settings, further broadening its applicability.
In summary, the proposed graph coupling convolutional model demonstrates good performance and interpretability in node classification tasks, but further improvements in scalability, generalization, and interpretability evaluation are necessary to advance its practical deployment in real-world graph learning systems.
This paper investigates the limitations of traditional multi-label classification algorithms that overlook the varying strengths of relationships between node attributes. To address this, a graph convolutional framework is introduced, and three key challenges related to incorporating node attributes and connection information are analyzed. Emphasis is placed on the implementation of graph convolution in the spatial domain, where node feature updates are derived from adjacent lists. The issue of weight sharing is explored in depth, leading to the development of a novel graph coupling convolution mechanism.
The proposed coupling mechanism enables adaptive weighting of neighboring nodes based on their similarity to the central node, thereby enhancing the model’s expressiveness and interpretability. The design rationale and operation of the graph coupling model are systematically introduced, highlighting how the coupling strategy avoids uniform weight assignments and supports meaningful feature aggregation. Building upon this framework, a set of node classification experiments is conducted on the public Blog-Catalog dataset and the Reddit dataset. Experimental procedures include the definition of model hyperparameters and the use of the F1-score as the evaluation metric. The results indicate that while the graph coupling model does not significantly outperform state-of-the-art classification models in terms of raw accuracy, it offers clear advantages in interpretability, as it allows the learned weight coefficients to reflect the relative importance of different neighbors.
In summary, the graph coupling model provides a valuable extension to standard graph convolutional approaches by incorporating interpretable, node-specific weight assignments. Although further improvements in scalability and generalization are needed, the proposed mechanism offers a promising direction for future research in interpretable graph learning.
Acknowledgement: Not applicable.
Funding Statement: Support by Sichuan Science and Technology Program [2023YFSY0026, 2023YFH0004] and Guangzhou Huashang University [2024HSZD01, HS2023JYSZH01].
Author Contributions: conceptualization, Feng Bao and Wenfeng Zheng; methodology, Yuxin Liu and Guangyu Xu; software, Guangyu Xu, Yu Zhou and Junmin Lyu; validation, Yu Zhou and Junmin Lyu; formal analysis, Yuxin Liu and Guangyu Xu; investigation, Guangyu Xu and Junmin Lyu; resources, Wenfeng Zheng and Feng Bao; data curation, Yuxin Liu and Guangyu Xu; writing—original draft preparation, Guangyu Xu, Wenfeng Zheng and Feng Bao; writing—review and editing, Siyu Lu and Wenfeng Zheng; visualization, Siyu Lu and Yu Zhou; supervision, Feng Bao; project administration, Wenfeng Zheng; funding acquisition, Feng Bao and Wenfeng Zheng. All authors reviewed the results and approved the final version of the manuscript.
Availability of Data and Materials: The datasets used in this study include both publicly available benchmark graph datasets and one proprietary dataset used to construct a custom topology. The Cora, Citeseer, and Pubmed citation network datasets were used to evaluate the structural rationality of the proposed model. These datasets are publicly available at the LINQS repository: https://linqs.org/datasets/ (accessed on 01 June 2025). The Reddit dataset, used for large-scale graph experiments, is available from the Stanford SNAP repository: https://snap.stanford.edu/graphsage/ (accessed on 01 June 2025). The BlogCatalog social network dataset was used for multi-label node classification experiments. It is publicly available at: 10.6084/m9.figshare.11923611.v3 (accessed on 01 June 2025). A custom topology dataset was constructed based on student learning behavior data from the Open University Learning Analytics Dataset (OULAD). Due to institu-tional and privacy considerations, this dataset is not publicly available but can be obtained by contacting the corresponding authors upon reasonable request.
Ethics Approval: Not applicable.
Conflicts of Interest: The authors declare no conflicts of interest to report regarding the present study.
References
1. Chen J, Mi R, Wang H, Wu H, Mo J, Guo J, et al. A review of few-shot and zero-shot learning for node classification in social networks. IEEE Trans Comput Soc Syst. 2025;12(4):1927–41. doi:10.1109/tcss.2024.3452697. [Google Scholar] [CrossRef]
2. Wang K, An J, Zhou M, Shi Z, Shi X, Kang Q. Minority-weighted graph neural network for imbalanced node classification in social networks of Internet of people. IEEE Internet Things J. 2023;10(1):330–40. doi:10.1109/jiot.2022.3200964. [Google Scholar] [CrossRef]
3. Li B, Pi D, Lin Y. Learning ladder neural networks for semi-supervised node classification in social network. Expert Syst Appl. 2021;165:113957. doi:10.1016/j.eswa.2020.113957. [Google Scholar] [CrossRef]
4. Shan F, Li F, Wang Z, Ji P, Wang M, Sun H. Deep learning social network access control model based on user preferences. Comput Model Eng Sci. 2024;140(1):1029–44. doi:10.32604/cmes.2024.047665. [Google Scholar] [CrossRef]
5. Merchant A, Mahadevan A, Mathioudakis M. Scalably using node attributes and graph structure for node classification. Entropy. 2022;24(7):906. doi:10.3390/e24070906. [Google Scholar] [PubMed] [CrossRef]
6. Li J, Huang Y, Chang H, Rong Y. Semi-supervised hierarchical graph classification. IEEE Trans Pattern Anal Mach Intell. 2022;45(5):6265–76. doi:10.1109/tpami.2022.3203703. [Google Scholar] [PubMed] [CrossRef]
7. Wang Y, Wen J, Zhang C, Xiang S. Graph aggregating-repelling network: do not trust all neighbors in heterophilic graphs. Neural Netw. 2024;178:106484. doi:10.1016/j.neunet.2024.106484. [Google Scholar] [PubMed] [CrossRef]
8. Xiao S, Lan G, Yang J, Li Y, Wen J. Securing the socio-cyber world: multiorder attribute node association classification for manipulated media. IEEE Trans Comput Soc Syst. 2024;11(4):4809–18. doi:10.1109/tcss.2022.3213832. [Google Scholar] [CrossRef]
9. Gopal GN, Kovoor BC, Shailesh S. An improved deep learning network, addressing graph node imbalance in social media rumor source detection. New Gener Comput. 2024;42(5):947–81. doi:10.1007/s00354-024-00270-5. [Google Scholar] [CrossRef]
10. An S, Hong B, Guo Z, Zhu S, Lin K, Yang F. Simultaneously local and global contrastive learning of graph representations. Eng Appl Artif Intell. 2025;145:110203. doi:10.1016/j.engappai.2025.110203. [Google Scholar] [CrossRef]
11. Singh A, Dar SS, Singh R, Kumar N. A hybrid similarity-aware graph neural network with transformer for node classification. Expert Syst Appl. 2025;279:127292. doi:10.1016/j.eswa.2025.127292. [Google Scholar] [CrossRef]
12. Song Y, Palanisamy B. MAPPING: debiasing graph neural networks for fair node classification with limited sensitive information leakage. World Wide Web. 2024;27(6):74. doi:10.1007/s11280-024-01312-0. [Google Scholar] [CrossRef]
13. Xu X, Du J, Xue Z. Multi-level self-adaptive prototypical networks for few-shot node classification on attributed networks. Neural Comput Appl. 2023;35(12):9131–44. doi:10.1007/s00521-022-08175-4. [Google Scholar] [CrossRef]
14. Zhang B, Mi Y, Zhang L, Zhang Y, Li M, Zhai Q, et al. Dynamic community detection method of a social network based on node embedding representation. Mathematics. 2022;10(24):4738. doi:10.3390/math10244738. [Google Scholar] [CrossRef]
15. Yu Y, Li J, Yuan Q, Shi Q, Shen H, Zhang L. Coupling dual graph convolution network and residual network for local climate zone mapping. IEEE J Sel Top Appl Earth Obs Remote Sens. 2022;15:1221–34. doi:10.1109/jstars.2021.3132394. [Google Scholar] [CrossRef]
16. Wang S, Qin X, Chi L. HashWalk: an efficient node classification method based on clique-compressed graph embedding. Pattern Recognit Lett. 2022;156:133–41. doi:10.1016/j.patrec.2022.02.001. [Google Scholar] [CrossRef]
17. Benedetti F, Pellicani A, Pio G, Ceci M. IMMENSE: inductive multi-perspective user classification in social networks. Online Soc Netw Medium. 2025;50:100335. doi:10.1016/j.osnem.2025.100335. [Google Scholar] [CrossRef]
18. Xia R, Zhang C, Zhang Y, Liu X, Yang B. A novel graph oversampling framework for node classification in class-imbalanced graphs. Sci China Inf Sci. 2024;67(6):162101. doi:10.1007/s11432-023-3897-2. [Google Scholar] [CrossRef]
19. Lin MY, Liu HC, Hsush SC. Enhanced text classification with label-aware graph convolutional networks. Electronics. 2024;13(15):2944. doi:10.3390/electronics13152944. [Google Scholar] [CrossRef]
20. Yuan L. G-KAN: graph Kolmogorov-Arnold network for node classification using contrastive learning. IEEE Access. 2025;13:100287–97. doi:10.1109/access.2025.3577059. [Google Scholar] [CrossRef]
21. Morini V, Sansoni M, Rossetti G, Pedreschi D, Castillo C. Participant behavior and community response in online mental health communities: insights from Reddit. Comput Hum Behav. 2025;165:108544. doi:10.1016/j.chb.2024.108544. [Google Scholar] [CrossRef]
22. Chen Z. Graph adaptive attention network with cross-entropy. Entropy. 2024;26(7):576. doi:10.3390/e26070576. [Google Scholar] [PubMed] [CrossRef]
23. Chen YL, Hsiao CH, Wu CC. An ensemble model for link prediction based on graph embedding. Decis Support Syst. 2022;157:113753. doi:10.1016/j.dss.2022.113753. [Google Scholar] [CrossRef]
24. Huang J, Lu T, Zhou X, Cheng B, Hu Z, Yu W, et al. HyperDNE: enhanced hypergraph neural network for dynamic network embedding. Neurocomputing. 2023;527:155–66. doi:10.1016/j.neucom.2023.01.039. [Google Scholar] [CrossRef]
25. Huang D, Song J, He Y. Community detection algorithm for social network based on node intimacy and graph embedding model. Eng Appl Artif Intell. 2024;132:107947. doi:10.1016/j.engappai.2024.107947. [Google Scholar] [CrossRef]
26. Al-Selwi SM, Hassan MF, Abdulkadir SJ, Muneer A, Sumiea EH, Alqushaibi A, et al. RNN-LSTM: from applications to modeling techniques and beyond—systematic review. J King Saud Univ Comput Inf Sci. 2024;36(5):102068. doi:10.1016/j.jksuci.2024.102068. [Google Scholar] [CrossRef]
27. Yang X, Zhou H, Zhao Z. Popularity-aware dynamic graph neural collaborative filtering with local-global convergence. Appl Soft Comput. 2025;179:113289. doi:10.1016/j.asoc.2025.113289. [Google Scholar] [CrossRef]
28. Veličković P, Cucurull G, Casanova A, Romero A, Lio P, Bengio Y. Graph attention networks. arXiv:1710.10903. 2017. [Google Scholar]
Cite This Article
 Copyright © 2026 The Author(s). Published by Tech Science Press.
This work is licensed under a Creative Commons Attribution 4.0 International License , which permits unrestricted use, distribution, and reproduction in any medium, provided the original work is properly cited.
 Downloads
 Citation Tools