
 Submit a Paper
 Propose a Special lssue
 Open Access
ARTICLE

Fuzzy k-Means Clustering-Based Machine Learning Models for LFO Damping in Electric Power System Networks
1 Control & Instrumentation Engineering Department, King Fahd University of Petroleum & Minerals, Dhahran, Saudi Arabia
2 Interdisciplinary Research Center for Sustainable Energy Systems, King Fahd University of Petroleum & Minerals, Dhahran, Saudi Arabia
* Corresponding Author: Md Shafiullah. Email:
(This article belongs to the Special Issue: Advanced Artificial Intelligence and Machine Learning Methods Applied to Energy Systems)
Computer Modeling in Engineering & Sciences 2026, 146(2), 27 https://doi.org/10.32604/cmes.2026.075269
Received 28 October 2025; Accepted 02 February 2026; Issue published 26 February 2026
 View Full Text
 Download PDF
Abstract
Various factors, including weak tie-lines into the electric power system (EPS) networks, can lead to low-frequency oscillations (LFOs), which are considered an instant, non-threatening situation, but slow-acting and poisonous. Considering the challenge mentioned, this article proposes a clustering-based machine learning (ML) framework to enhance the stability of EPS networks by suppressing LFOs through real-time tuning of key power system stabilizer (PSS) parameters. To validate the proposed strategy, two distinct EPS networks are selected: the single-machine infinite-bus (SMIB) with a single-stage PSS and the unified power flow controller (UPFC) coordinated SMIB with a double-stage PSS. To generate data under various loading conditions for both networks, an efficient but offline meta-heuristic algorithm, namely the grey wolf optimizer (GWO), is used, with the loading conditions as inputs and the key PSS parameters as outputs. The generated loading conditions are then clustered using the fuzzy k-means (FKM) clustering method. Finally, the group method of data handling (GMDH) and long short-term memory (LSTM) ML models are developed for clustered data to predict PSS key parameters in real time for any loading condition. A few well-known statistical performance indices (SPI) are considered for validation and robustness of the training and testing procedure of the developed FKM-GMDH and FKM-LSTM models based on the prediction of PSS parameters. The performance of the ML models is also evaluated using three stability indices (i.e., minimum damping ratio, eigenvalues, and time-domain simulations) after optimally tuned PSS with real-time estimated parameters under changing operating conditions. Besides, the outputs of the offline (GWO-based) metaheuristic model, proposed real-time (FKM-GMDH and FKM-LSTM) machine learning models, and previously reported literature models are compared. According to the results, the proposed methodology outperforms the others in enhancing the stability of the selected EPS networks by damping out the observed unwanted LFOs under various loading conditions.Keywords
This decade has seen surging energy demand driven by population growth and global business activity. Conventional EPS networks often operate at their maximum capacity to meet these energy demands, leading to violations of system constraints in some cases and, in turn, introducing instability. Besides, the rapid transformation of the transportation industry towards energy-consumption-based systems in recent decades has accordingly increased the use of electricity, particularly renewable energy [1–4]. On the other hand, the utility body is responsible for supplying customers with quality, reliability, and steady power to meet increased demand through the existing lines, unless these are upgraded/replaced with improved lines. Such situations introduce low-frequency oscillations, which are slow-burning phenomena and don’t cause immediate damage to the system if they’re appropriately damped. However, the LFO can become a harmful phenomenon within systems if it persists for a long time, ultimately leading to system instability. The dominant range of the LFOs is 0.1–2.5 Hz [5–8], and can be dangerously disruptive to systems connected through weak tie lines if proper damping is not provided in time, ultimately resulting in dynamic instability of the whole system.
The power system stabilizer is an auxiliary control technique employed to eliminate low-frequency oscillations. The basics of PSS design lie in the angle compensation to raise the damping torque, which has become a significant issue in designing and tuning the flexible alternating current transmission systems (FACTS) devices as various power system dampers, such as static volt-ampere reactive compensator (SVC), static synchronous series compensator (SSSC), static synchronous compensator (STATCOM), thyristor-controlled series capacitor (TCSC), unified power flow controller (UPFC), etc. Although many papers have applied this principle, it is essential to note that real-time industrial applications of PSS require careful on-site tuning despite its well-established theoretical foundations [9–12]. Although the automatic voltage regulator (AVR) is employed to control the synchronous generator’s voltage profile by regulating excitation, it generates an LFO in the system, as shown in [13]. The energy distribution of inter-area LFOs is analyzed for two power networks from three perspectives: voltage-angle deviation, rotor-speed deviation, and active-wer oscillation [14]. Due to advances in high-speed power electronics, FACTS devices are increasingly incorporated into the EPS networks to improve voltage and frequency, ensuring a reliable power supply. For instance, various FACTS devices, e.g., SVC [15,16], SSSC [15,16], STATCOM [17], proportional-integral-derivative-acceleration (PIDA)-controlled STATCOM [18,19], UPFC [20–22] were reported in the literature for enhancing system stability by damping out the LFOs. However, due to the presence of several power flow lines in some EPS networks, the parameters of FACTS devices require specific, optimal tuning. In such situations, FACTS devices are incorporated into the networks alongside PSS.
Several techniques have been proposed to tune the crucial parameters of PSSs incorporated into power systems. Recently, a large number of optimization algorithms have been introduced for tuning the PSS parameters, such as the water cycle algorithm [23], genetic algorithm [24], backtracking search algorithm [25,26], particle swarm optimization [27], differential evolution [28], bacteria foraging algorithm [29], artificial bee colony [30], harmony search algorithm [31], bat algorithm (BA) [32], and the ant lion algorithm [33], etc. Besides, Refs. [34–36], focused on improving the robustness of electric supply systems by damping LFOs using combined FACTS devices and PSS. The authors implemented various meta-heuristic algorithms to precisely balance the dominant variables of the PSS and achieve optimal actions from FACTS devices and the PSS to enhance system stability. However, the meta-heuristic approaches are instrumental in system analysis in offline mode, but they cannot determine the controller parameters online; therefore, there is a growing demand for various online-based machine learning approaches, including deep learning [12] and ensemble models [37]. However, when handling large amounts of data to build a data-based, model-free estimator, the data clustering approach yields better results than when it is not applied to the machine learning methods. The fuzzy k-means clustering technique has been employed in various applications to develop data-driven algorithms for achieving better results [38,39]. Considering the aforementioned notes, this article investigates the competency and robustness of the FKM-GMDH and FKM-LSTM methods for data clustering and controller tuning, aiming to enhance the overall stability profile of EPS networks under random operating conditions by mitigating the LFOs. The main novelties of the article are as follows:
• Firstly, two EPS networks, namely the SMIB and the UPFC-coordinated SMIB systems, were selected and modeled to develop and evaluate the proposed ML frameworks (FKM-GMDH and FKM-LSTM) for system stability enhancement.
• Secondly, the employment of the GWO technique for data generation and for optimal PSS parameter selection under system operating (loading) conditions, where the PSS parameters are the outputs and the loading conditions are the inputs to the GMDH and LSTM models.
• Thirdly, the employment of FKM clustering for the separation of the loading conditions as per the similarity of their feature distributions in both networks. Then, the development of GMDH and LSTM models for online tuning of PSS parameters under any random operating conditions is expected in EPS networks.
• Finally, the evaluation and comparison of the model’s effectiveness in improving system stability across several arbitrarily selected loading conditions using MDR, eigenvalue, and time-domain simulation analyses.
The rest of the paper is structured as follows: Section 2 describes the power network models under investigation. Section 3 interprets the methods considered in the paper. Section 4 explains data generation, processing, and model development stages. Section 5 presents the results and highlights the superiority and compatibility of the proposed model. Finally, Section 6 concludes by summarizing the results and suggesting future work.
In the analysis of damping low-frequency oscillations in EPS networks, two systems are considered: the power system stabilizer-integrated single-machine infinite bus (PSS-SMIB) system and the unified power flow controller-coordinated PSS-SMIB system. Their brief introductions are presented below:
2.1 Single Machine Infinite Bus System with PSS Only
A single-machine infinite-bus power system model is shown in Fig. 1, where one terminal of a synchronous generator is connected to the infinite bus via a transmission line, and a PSS is directly integrated with the generator’s other terminal. A one-stage lead-lag power system stabilizer is considered for this system to investigate the stability outline by damping out the LFOs from the network. The structure of the selected PSS is shown in Fig. 2. In this case, the washout filter adjusts the PSS input signal, and the control signal limiter controls the stabilizer output. The characteristic roots (eigenvalues) of the state matrix of the EPS network indicate whether the network is stable or unstable. The complete network, along with the PSS, is represented by a linearized state-space model of order six as shown in Eq. (1), where
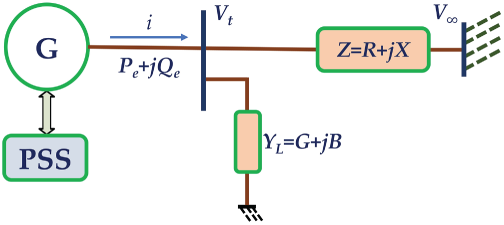
Figure 1: Generalized model of the first EPS network: PSS incorporated SMIB (Adapted from Refs. [40–42]).
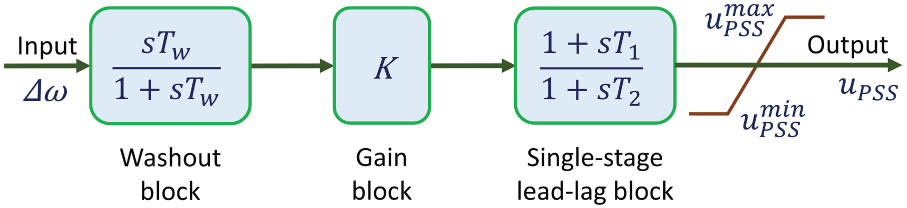
Figure 2: Arrangement of single-stage lead-lag PSS (Adapted from Refs. [40–42]).
The stable operation of the EPS network can only be confirmed if all the roots (eigenvalues) of the state matrix have negative real parts. On the contrary, one or more eigenvalues with positive real parts, meaning that the eigenvalue(s) lie on the right side of the imaginary axis, will result in the unstable operation of the system. Any minor disturbances in the network affect the roots of the state matrix by shifting the eigenvalues from the left half of the complex plane into the right half, introducing low-frequency oscillations and ultimately causing system instability if not addressed on time. In this scenario, the PSS plays a critical role in properly adjusting the position of the characteristic roots in the complex plane. Proper tuning of the PSS key parameters is crucial for achieving system stability and superior system performance. In light of the aforementioned note, this article proposes a new framework for tuning the PSS parameters in such an EPS network to achieve either competitive or superior performance compared to available strategies.
2.2 Single Machine Infinite Bus System Equipped with UPFC and PSS
A unified power flow controller and a double-stage lead-lag power system stabilizer are incorporated into a single-machine infinite bus EPS network, which is used as the second test system in this article and depicted in Fig. 3. To connect with the UPFC to the network, two transformers are used: the boosting transformer (BT) and the excitation transformer (ET). Two voltage-source converters (VSC-1 and VSC-2) are connected via a direct current (DC) link capacitor. In this case, the VSC-1 is connected to the network via the ET, while the VSC-2 at the other terminal is connected via the BT. According to the specifications shown in Fig. 3, two control parameters of the ET are the phase angle (
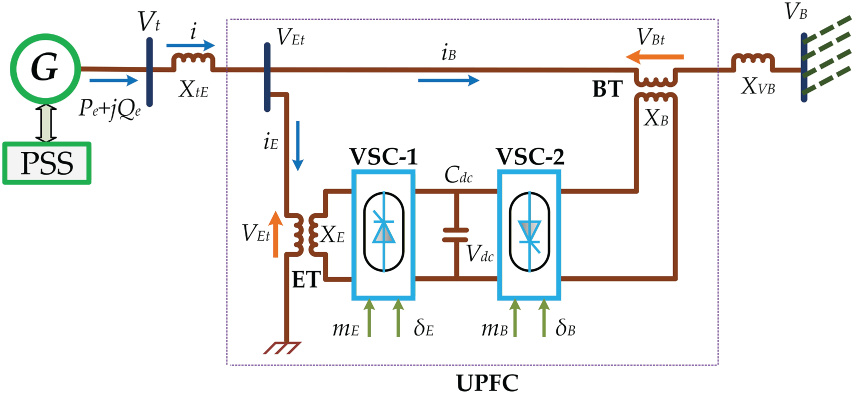
Figure 3: Generalized model of the second EPS network: SMIB equipped with UPFC and PSS (Adapted from Refs. [42–44]).
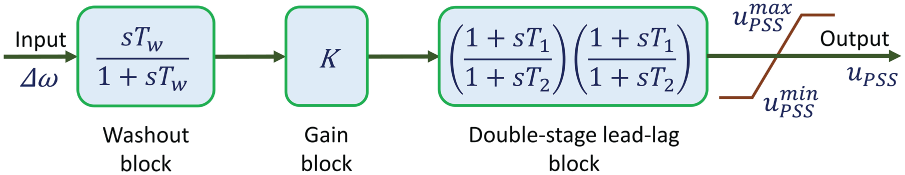
Figure 4: Constructional view of two-stage lead-lag PSS (Adapted from Refs. [42–44]).
As the state matrix is a ninth-order one, all nine characteristic roots (eigenvalues) of the network should be located in the left-half region (negative side) of the complex plane for system stability, meaning they should have negative real parts. In contrast, a positive real value for at least one of the roots will lead to system instability, while any zero real eigenvalue will be reflected in oscillatory operation of the system. During the stable operation of the system, any minor disturbance can introduce the LFOs, which may shift one or more roots (eigenvalues) into the right-half region (positive-side) of the complex plane. However, the appropriate action on the PSS within the shortest possible time can only maintain the proper placement of all eigenvalues within the stable zone, which requires optimal real-time tuning of the PSS key parameters. In light of the aforementioned note, this article also deploys the proposed ML framework to tune the PSS parameters for the second EPS network, achieving either competitive or superior performance compared to available strategies.
The following parts of this section briefly describe the methods in this article, ranging from data generation to all the way up to ML model development.
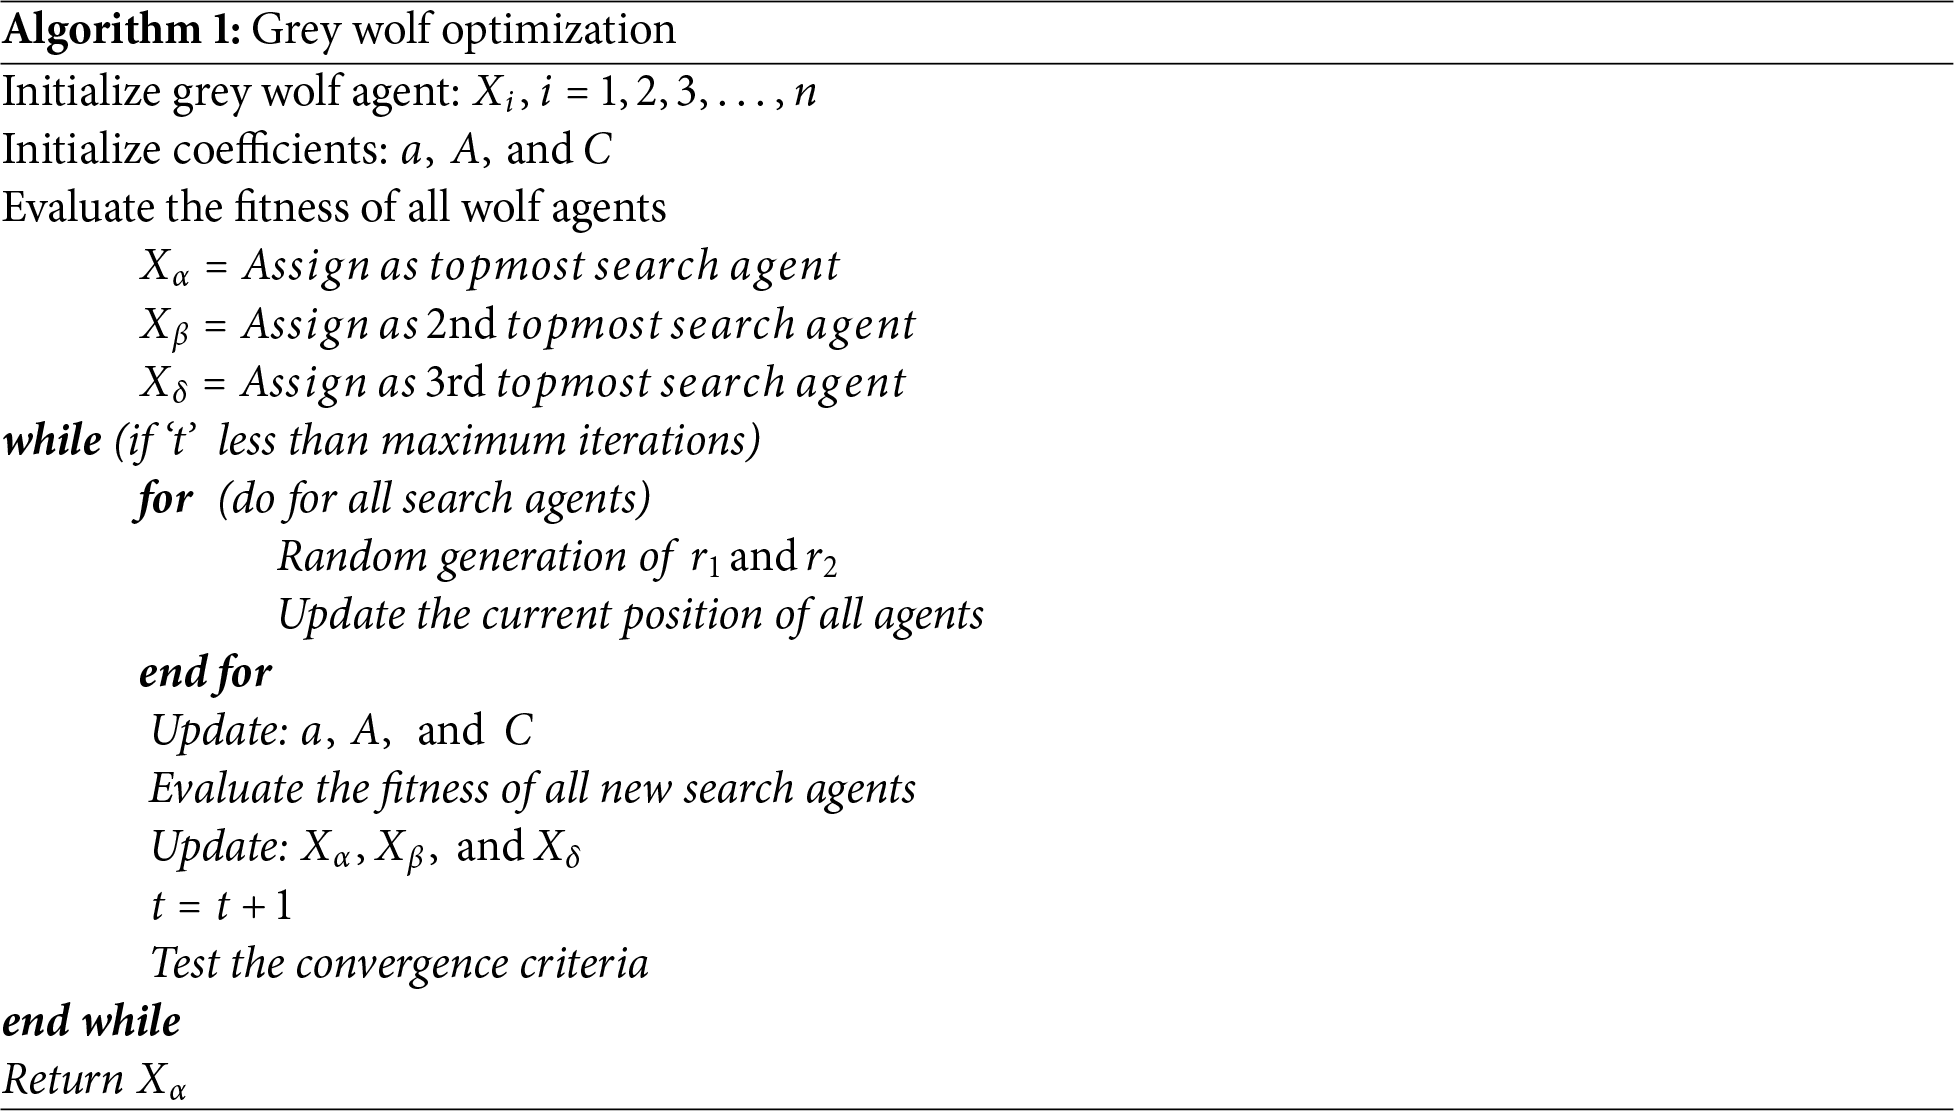
The grey wolf optimizer is an efficient, but offline-based, metaheuristic algorithm initially introduced in Ref. [45]. The GWO finds a global optimum solution to complex, non-linear, and non-differentiable constrained problems through an iterative process. It is inspired by the social and hunting behavior of grey wolves, which hunt cooperatively. According to wolves’ hunting mechanism, they are ranked into four categories: alphas, betas, deltas, and omegas, following a hierarchical dominance structure that reflects their strength and power. In the optimization process, prey is the targeted global solution, which is hunted following a specific hunting procedure within the social hierarchical chain. In this hunting process, alphas are the wolves at the top of the hierarchy, who mainly decide which prey (targeted solution) to select and lead the pack to the goal. On the other hand, the wolves in the following two hierarchically ranked groups, namely the betas and deltas, actively assist the leader wolves in achieving the global solution (best prey), while the last group of wolves, the omegas, follow the others in reaching or encircling the target. To get the best prey (the global optimum solution), the GWO algorithm mainly follows three steps: exploration, encircling, and finally attacking the target until it stops moving. Depending on a particular fitness or objective function, the algorithm continues until the convergence criteria are satisfied. According to this pseudocode, the GWO algorithm initializes a pack of agents (wolves) and other coefficient parameters. It tests the agents’ fitness to categorize into four groups, where, following the Eqs. (3)–(6) (as can be found in Ref. [45]), the topmost three groups are utilized to update the current positions of all agents in each iteration.
where, ‘t’ means the current iteration and ‘t + 1’ means the next iteration.
At the end of each iteration, the algorithm evaluates each agent’s fitness, updates the top three rank groups, and stores these values. After that, the GWO algorithm tests the stopping criteria; if the convergence criteria are satisfied, the optimization terminates and returns the topmost agent value as the global optimum, which is the position of alpha; otherwise, the iteration continues, as illustrated in the pseudocode (Algorithm 1).
Fuzzy k-means clustering is a data partitioning approach used to make a ‘k’ number of clusters from a set of data, depending on the similarity of the data set members. In this case, each cluster maintains an index, and each cluster member is treated as an observation with a position in the space. The observations are clustered so that all the objects in one cluster lie as close as possible to each other, but as far as possible from those in different clusters. In addition, each cluster is formed around a particular gravity point, with the centers fixed based on the nature of the data set. In this case, the k-means approach minimizes the sum of distances between gravity points and all the corresponding cluster observations. Besides, the number of clusters that yield the best partition of the data set depends on the data type. The best partitioning of the data set is measured by the silhouette plot and silhouette value, which means how many clusters will suit the prescribed data. The silhouette value for a given number of clusters is always in the range [1, −1]. Hence, the best silhouette value is considered ‘1’, while the silhouette value of ‘−1’ indicates the worst clustering or wrong assignment of observation(s) in the clusters [46–50].
3.3 Long Short-Term Memory Network
Long short-term memory (LSTM) networks are a special type of recurrent neural network. Hochreiter and Schmidhuber proposed them to minimize the impact of vanishing and exploding gradients while retaining some information when considering extremely long sequences. A crucial advancement of LSTMs over traditional models is the memory cell, which records data over time. An LSTM single cell consists of three gates: input, forget, and output, enabling accurate control over the information flow. These three gates work together to form a neural network that is important for selective data update or deletion. The input gate determines how much new information is added to the cell state from the current input. The sigmoid applied to the input yields outputs in the range of 0 to 1, “filtering” the additions to the cell state. In contrast, the forget gate determines which information in the cell state to retain or discard. The sigmoid function of the forget gate produces values between 0 and 1; values closer to 1 are retained, while values closer to 0 are discarded. Another task it offers is erasing information that is no longer needed, which helps reduce the vanishing gradient issue. Finally, the output gate determines which portion of the cell’s current state should be reflected in the LSTM unit’s output. It decides what data from the cell should be sent to the network’s intermediate layer. Fig. 5 presents the LSTM cell structure, where
where,
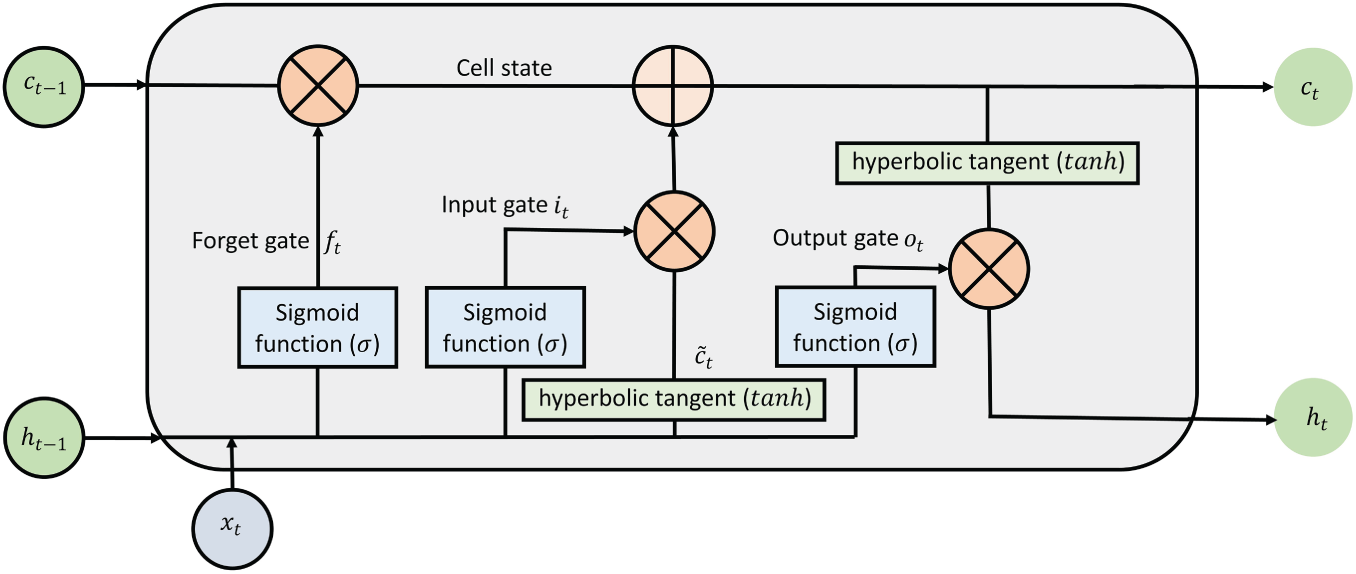
Figure 5: LSTM cell architecture (Adapted from Refs. [51–53]).
In contrast, the output of the input gate is represented by Eq. (8), which is later combined with the cell state as shown in Eq. (9):
where,
These gates and state updates enable the LSTM cell to maintain gradients over long sequences, thereby learning long-term dependencies. Since their inception, LSTM networks have undergone several modifications [54,55] and have been used for various applications [56–59].
3.4 Group Method of Data Handling
The group method of data handling is an inductive, algorithmic, mathematical regression approach used to model complex, unstructured, multi-parametric, and nonlinear systems. This naturally inspired learning GMDH algorithm was first introduced by Russian Mathematician and Cyberneticist Ivakhnenko [60,61]. Automatically, parametric and structural optimization is followed by the technique to fix the hidden layer numbers and corresponding neurons to approximate the actual output. The GMDH mainly uses second-order polynomials of various possible combinations of two variables from all input datasets to map the original nonlinear functional response [62,63]. The polynomials are tested in the neurons of every layer to minimize mapping errors and remove inefficient neurons relative to efficient ones. Thus, in each step, the network is reconfigured based on the mapping error minimization between input features and expected response. The basic structure of GMDH follows the least square regression method to minimize the mapping error [60–63]. The basic description in predicting the nonlinear functional output using a set of multiple variable input datasets is that the second-order transfer function ‘
where,
In constructing the GMDH model for predicting output values, the squared differences between the predicted and known actual outputs for each input are summed and minimized during the training of the GMDH network, as represented as follows:
But for GMDH network training, subsets of pairs of total input parameters are used to construct second-order polynomials, which are generated from the Kolmogorov–Gabor polynomial of the Volterra functional series. This equation is represented by Eq. (15).
where,
Indeed, least squares regression is considered a statistical method for estimating the coefficients/weights of a quadratic polynomial and the neurons of the GMDH network so that the predicted response is as close as possible to the actual output. To achieve this goal using the trained GMDH network, Eq. (17) is used as an example to be minimized for the best fit.
4 Data Generation and Model Development
The procedures for generating data for both electric networks using the GWO algorithm and for developing fuzzy k-means clustering-based ML models (LSTM and GMDH) are illustrated in the following subsections. Fig. 6 illustrates the proposed strategy combining the GWO, FKM, and two ML models (GMDH and LSTM) to enhance EPS network stability by damping out the LFOs.
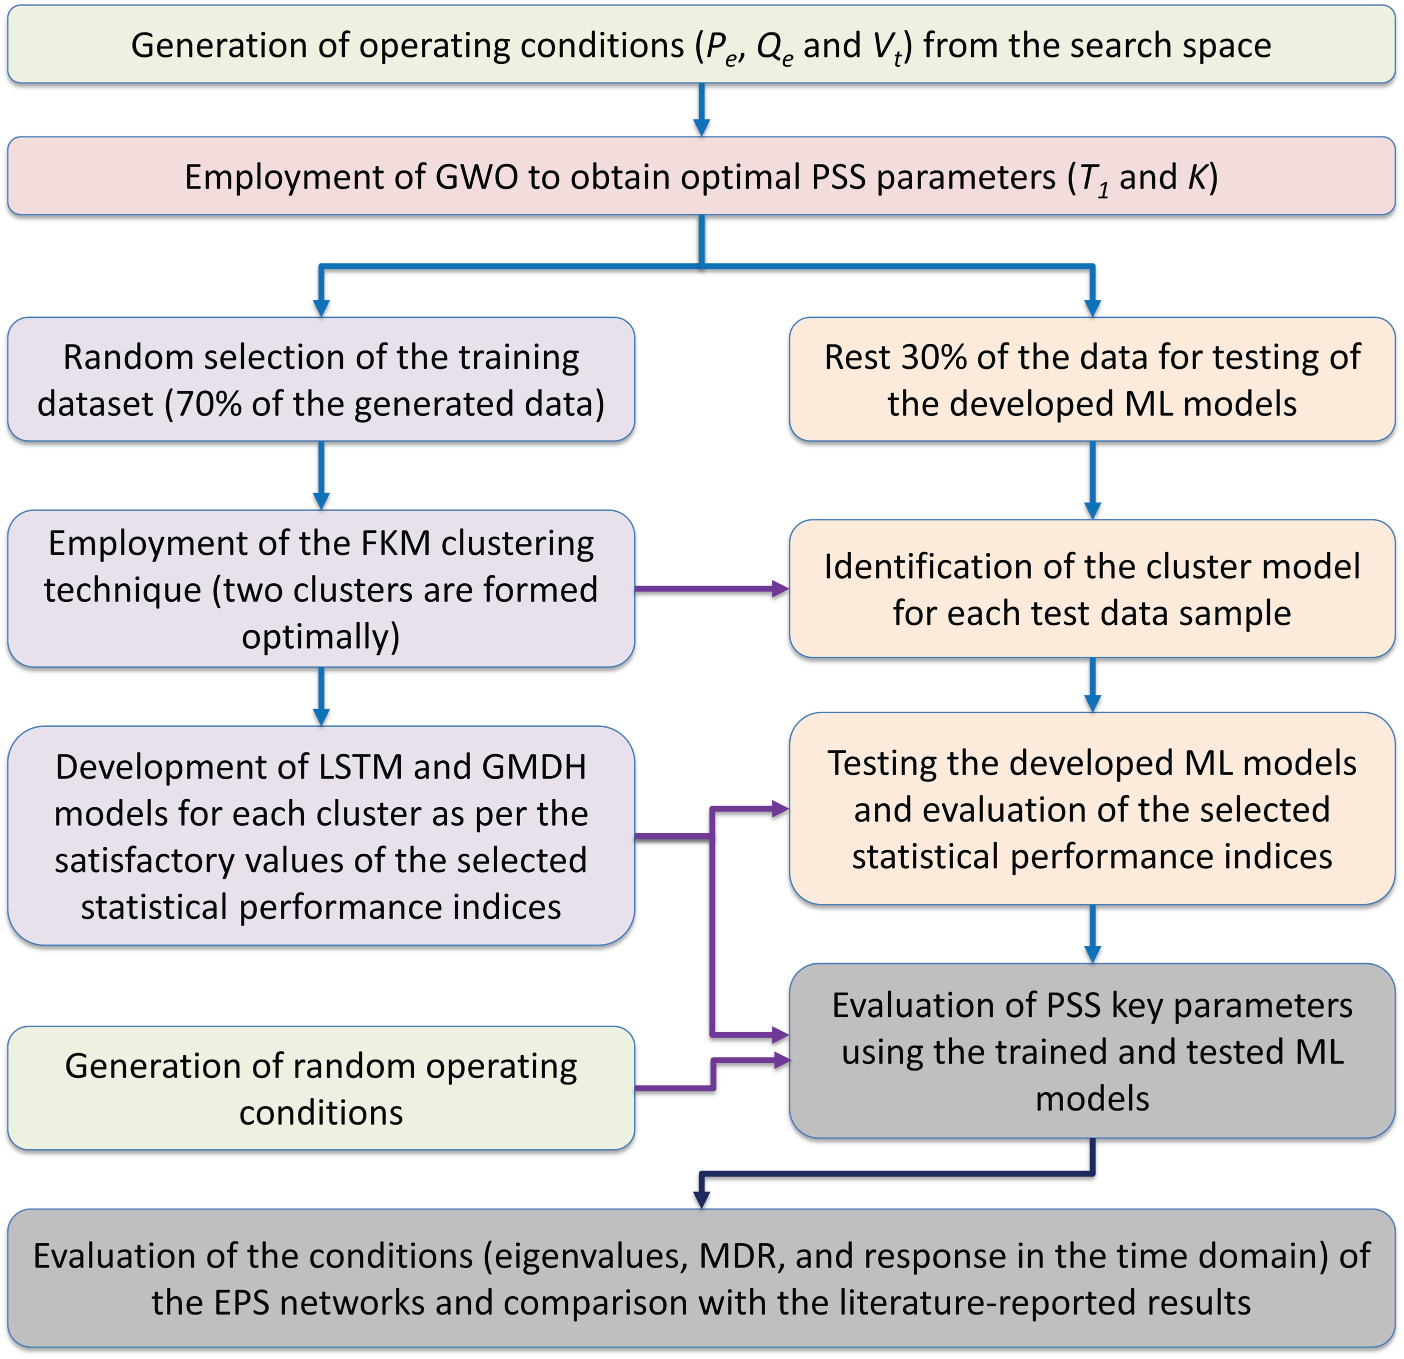
Figure 6: Flowchart of the proposed stability enhancement framework for the EPS networks.
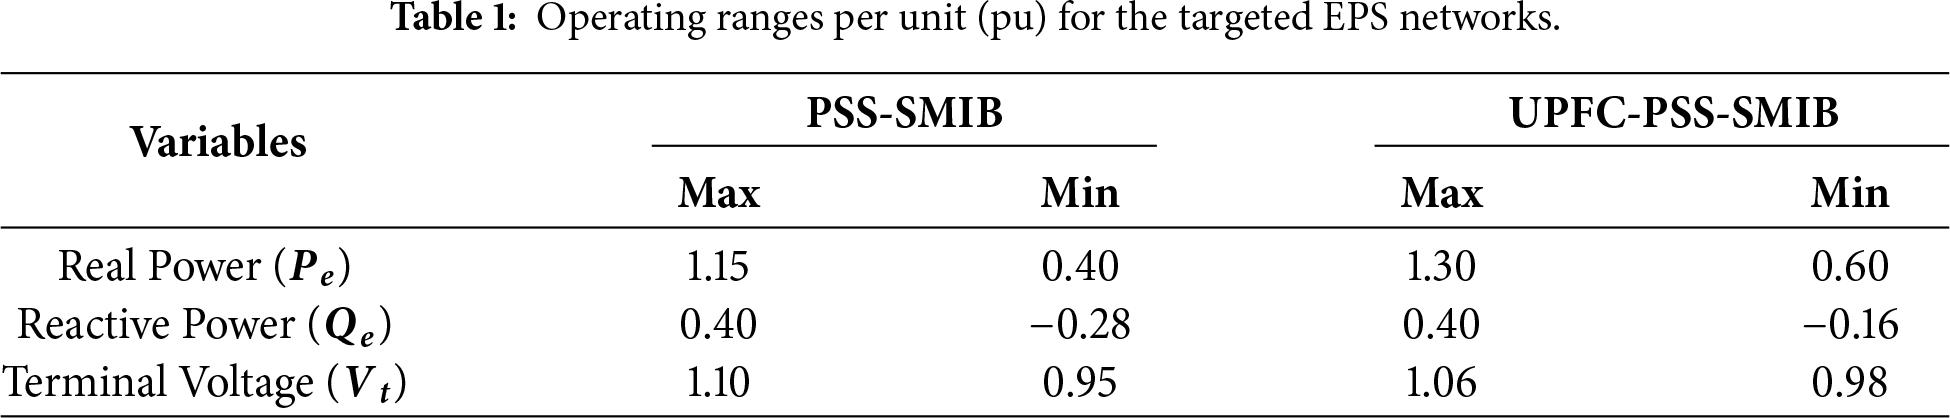
This article initially generated 1000 operating conditions from the operating ranges (Table 1) for both EPS networks. It is worth noting that the operating conditions for both networks are the real power (
The detailed formulation of the objective function and constraints for the second EPS network can be found in Ref. [26]. Fig. 7 illustrates the convergence curves for the first and second EPS networks under two arbitrarily generated operating (loading) conditions. Likewise, the GWO evaluated the PSS key parameters for all generated loading conditions (samples). For brevity’s sake, Table 2 compares the results for a single loading condition for each EPS network with the literature-reported strategy-obtained results and the GWO-tuned results. It can be observed that GWO achieved competitive fitness compared to the reported strategies in the literature. However, it is worth noting that GWO and other metaheuristic algorithms are offline, iterative optimization strategies that cannot be used for real-time optimization of PSS parameters, as required for continuously changing operating conditions in power systems. However, such strategies are crucial for developing ML models that can be used for real-time PSS parameter tuning.
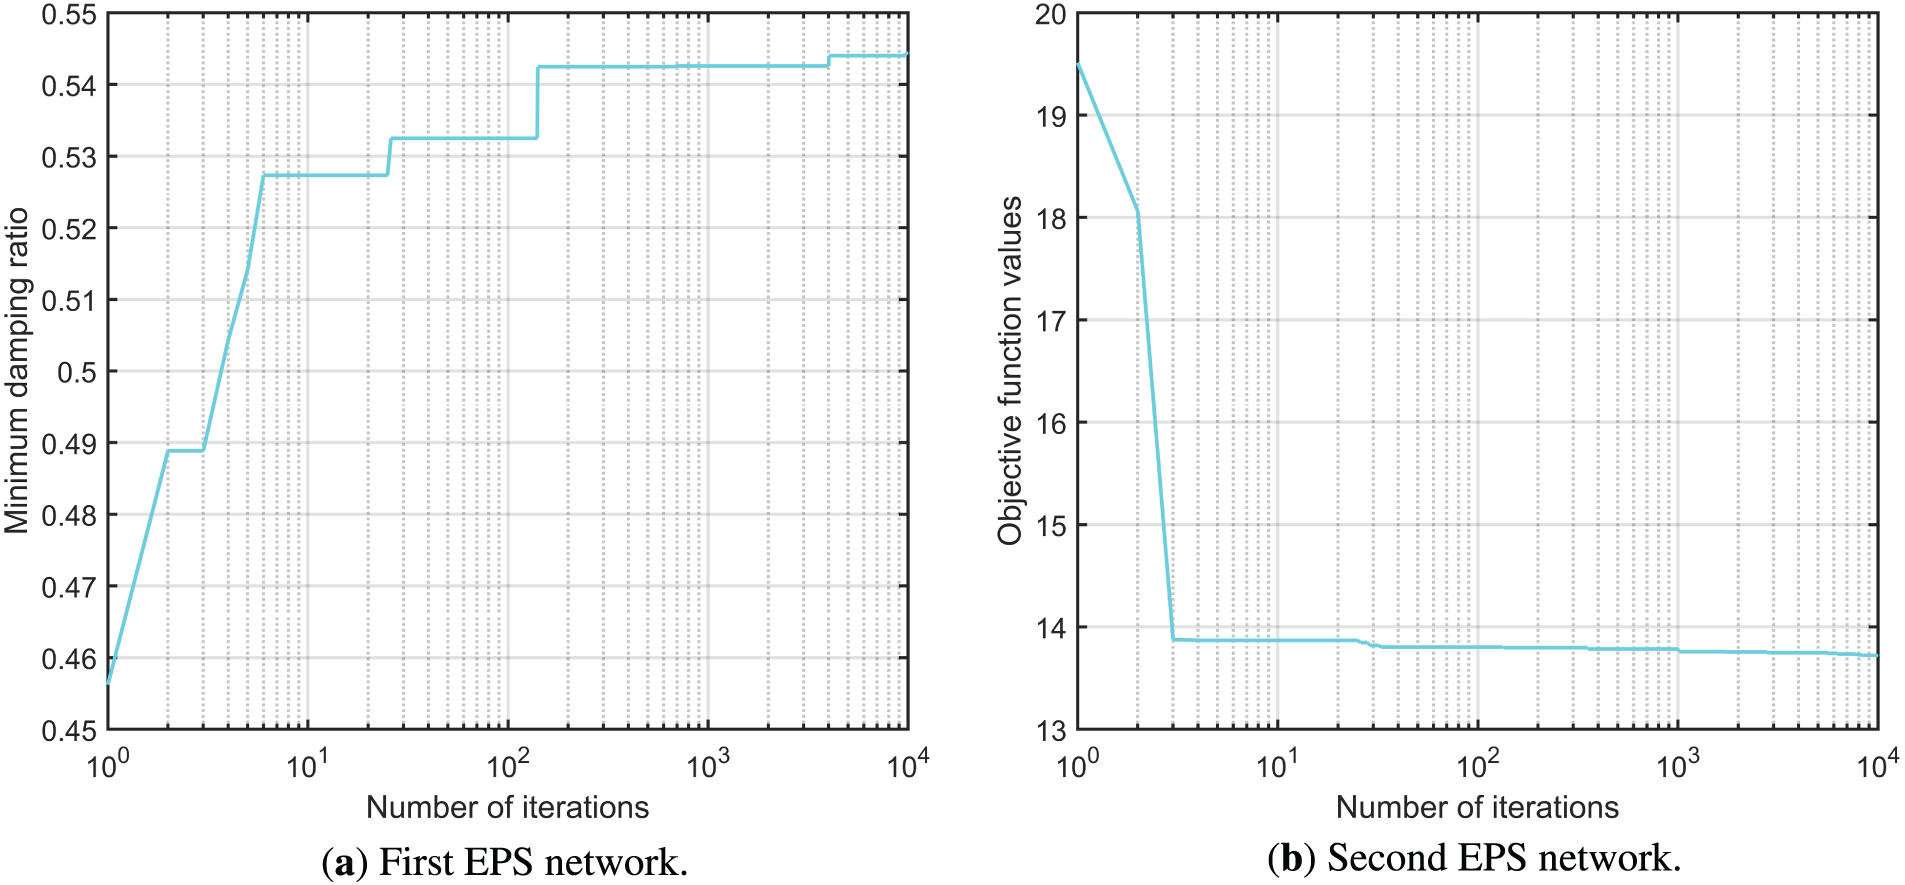
Figure 7: Objective functions convergence curves against an arbitrarily generated loading condition.
4.2 Data Clustering Using the Fuzzy k-Means Approach
Before the development of the ML models (GMDH and LSTM), the offline-generated training data, which comprises 70% of the total operating conditions, was clustered using a fuzzy k-means approach. This data clustering was conducted to partition the dataset into k clusters, where k is the number of gravity points. During the clustering process, the similar loading points to a particular gravity point were clustered together, and the network was trained on the objects in the corresponding cluster. In this research, the number of clusters/partitions was evaluated using the silhouette plots and values. For both EPS networks, the training datasets were partitioned into two clusters, yielding the highest silhouette values and ensuring that many objects in each cluster had higher silhouette values, as illustrated in Figs. 8 and 9.
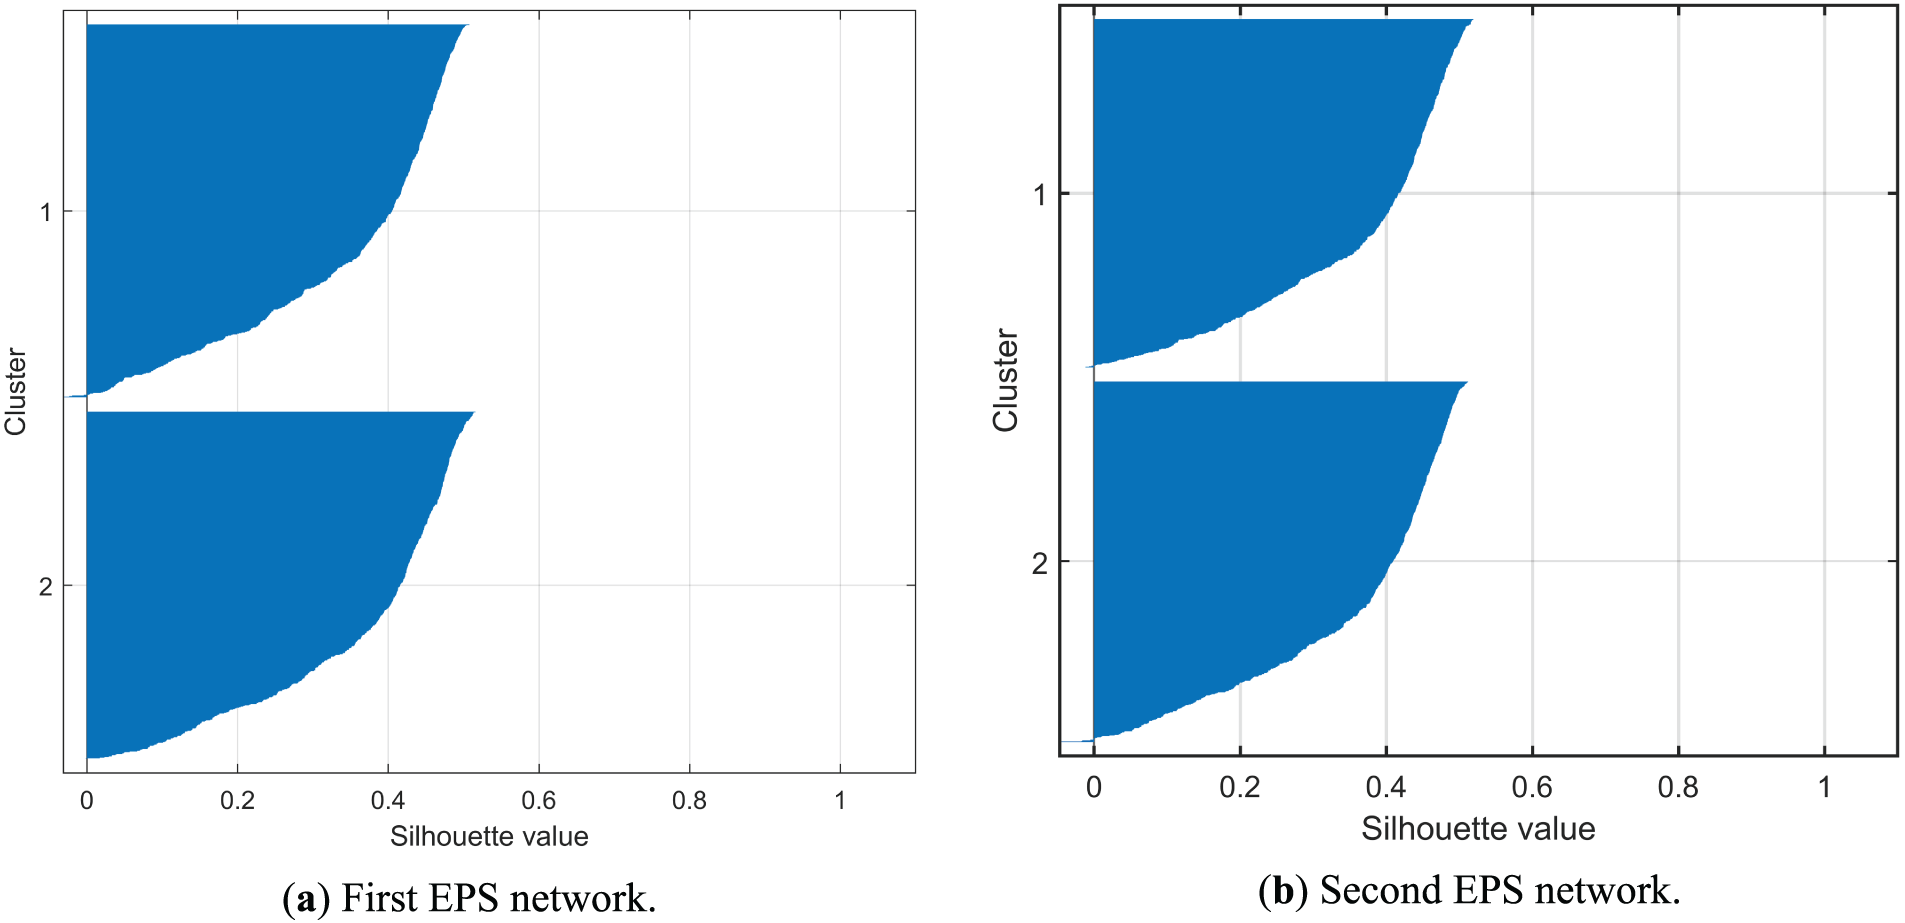
Figure 8: Silhouette plot of two clusters.
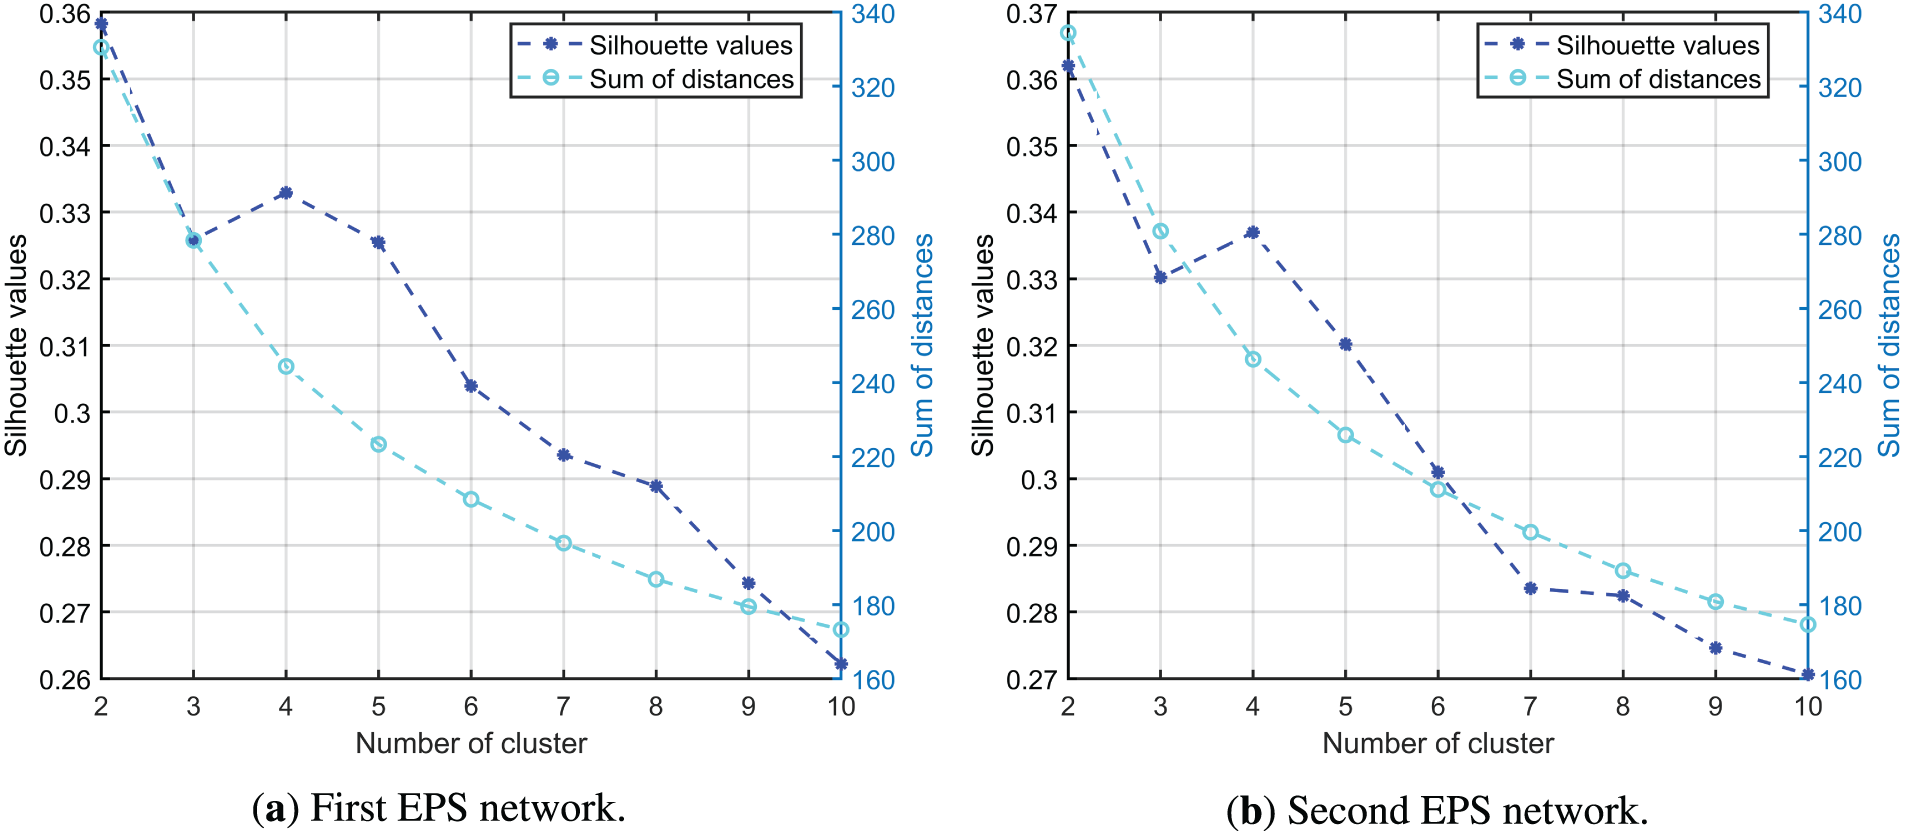
Figure 9: Plot of Silhouette values for different numbers of clusters.
Fig. 8 shows that a large number of observations in both clusters of both electric networks maintain high silhouette values, except for a few observations that were misclustered, indicated by negative silhouette values. Additionally, two clusters for the training datasets of both electric networks have the highest silhouette values among the successive higher number of clusters, as illustrated in Fig. 9a (first EPS network) and Fig. 9b (second EPS network).
4.3 Machine Learning Framework Development
The GMDH and LSTM are members of the machine learning family and are very efficient at mapping highly nonlinear, unstructured, and complex systems for input-output relations. The general flow structure for training and testing of the FKM-based GMDH and LSTM techniques is illustrated in Fig. 5. Both ML models were trained by minimizing various statistical performance indices (SPIs), namely mean absolute error (MAE), root mean squared error (RMSE), coefficient of determination (R2), and Nash–Sutcliffe model efficiency coefficient (NSc), using the training dataset as input-target pairs. In this case, the loading conditions (
The training dataset for each cluster was used to develop the ML models; thus, we have two LSTM and two GMDH models for each EPS network, as the FKM separated the datasets into two clusters. After developing the ML models, the testing datasets for both EPS networks were fetched into them, and the selected SPI values were evaluated. During this process, the ML models predicted the targeted PSS key parameters using available inputs (loading conditions), and the testing data points were automatically assigned to cluster-based machines based on the cluster gravity points and the positions of the data points in the space. Then, the evaluated SPI values were compared to assess the superiority of the developed FKM-based ML models over GMDH models without clustering. Figs. 10 and 11 compare the evaluated SPI values for the mentioned models for the first and the second EPS networks, respectively. To improve the machine learning model accuracy in predicting PSS key parameters, SPI values for MAE and RMSE were minimized. In contrast, the unity values for the coefficient of determination (R2) and Nash–Sutcliffe Coefficient (NSc) metrics indicate a perfect correlation between the estimated and actual targets. In this research, all measured SPI values for the FKM clustering-based ML models on the test datasets were either competitive or better than those of other employed models and literature-reported models, as illustrated in Figs. 10 and 11 for the first and second EPS networks, respectively. Again, the robustness of the FKM clustering-based ML models (GMDH and LSTM) for the selected two electric networks was investigated for the prediction of key PSS parameters, using regression-based scatter plots comparing ML model estimates and GWO-based, offline-optimized PSS parameters (time constant and gain).
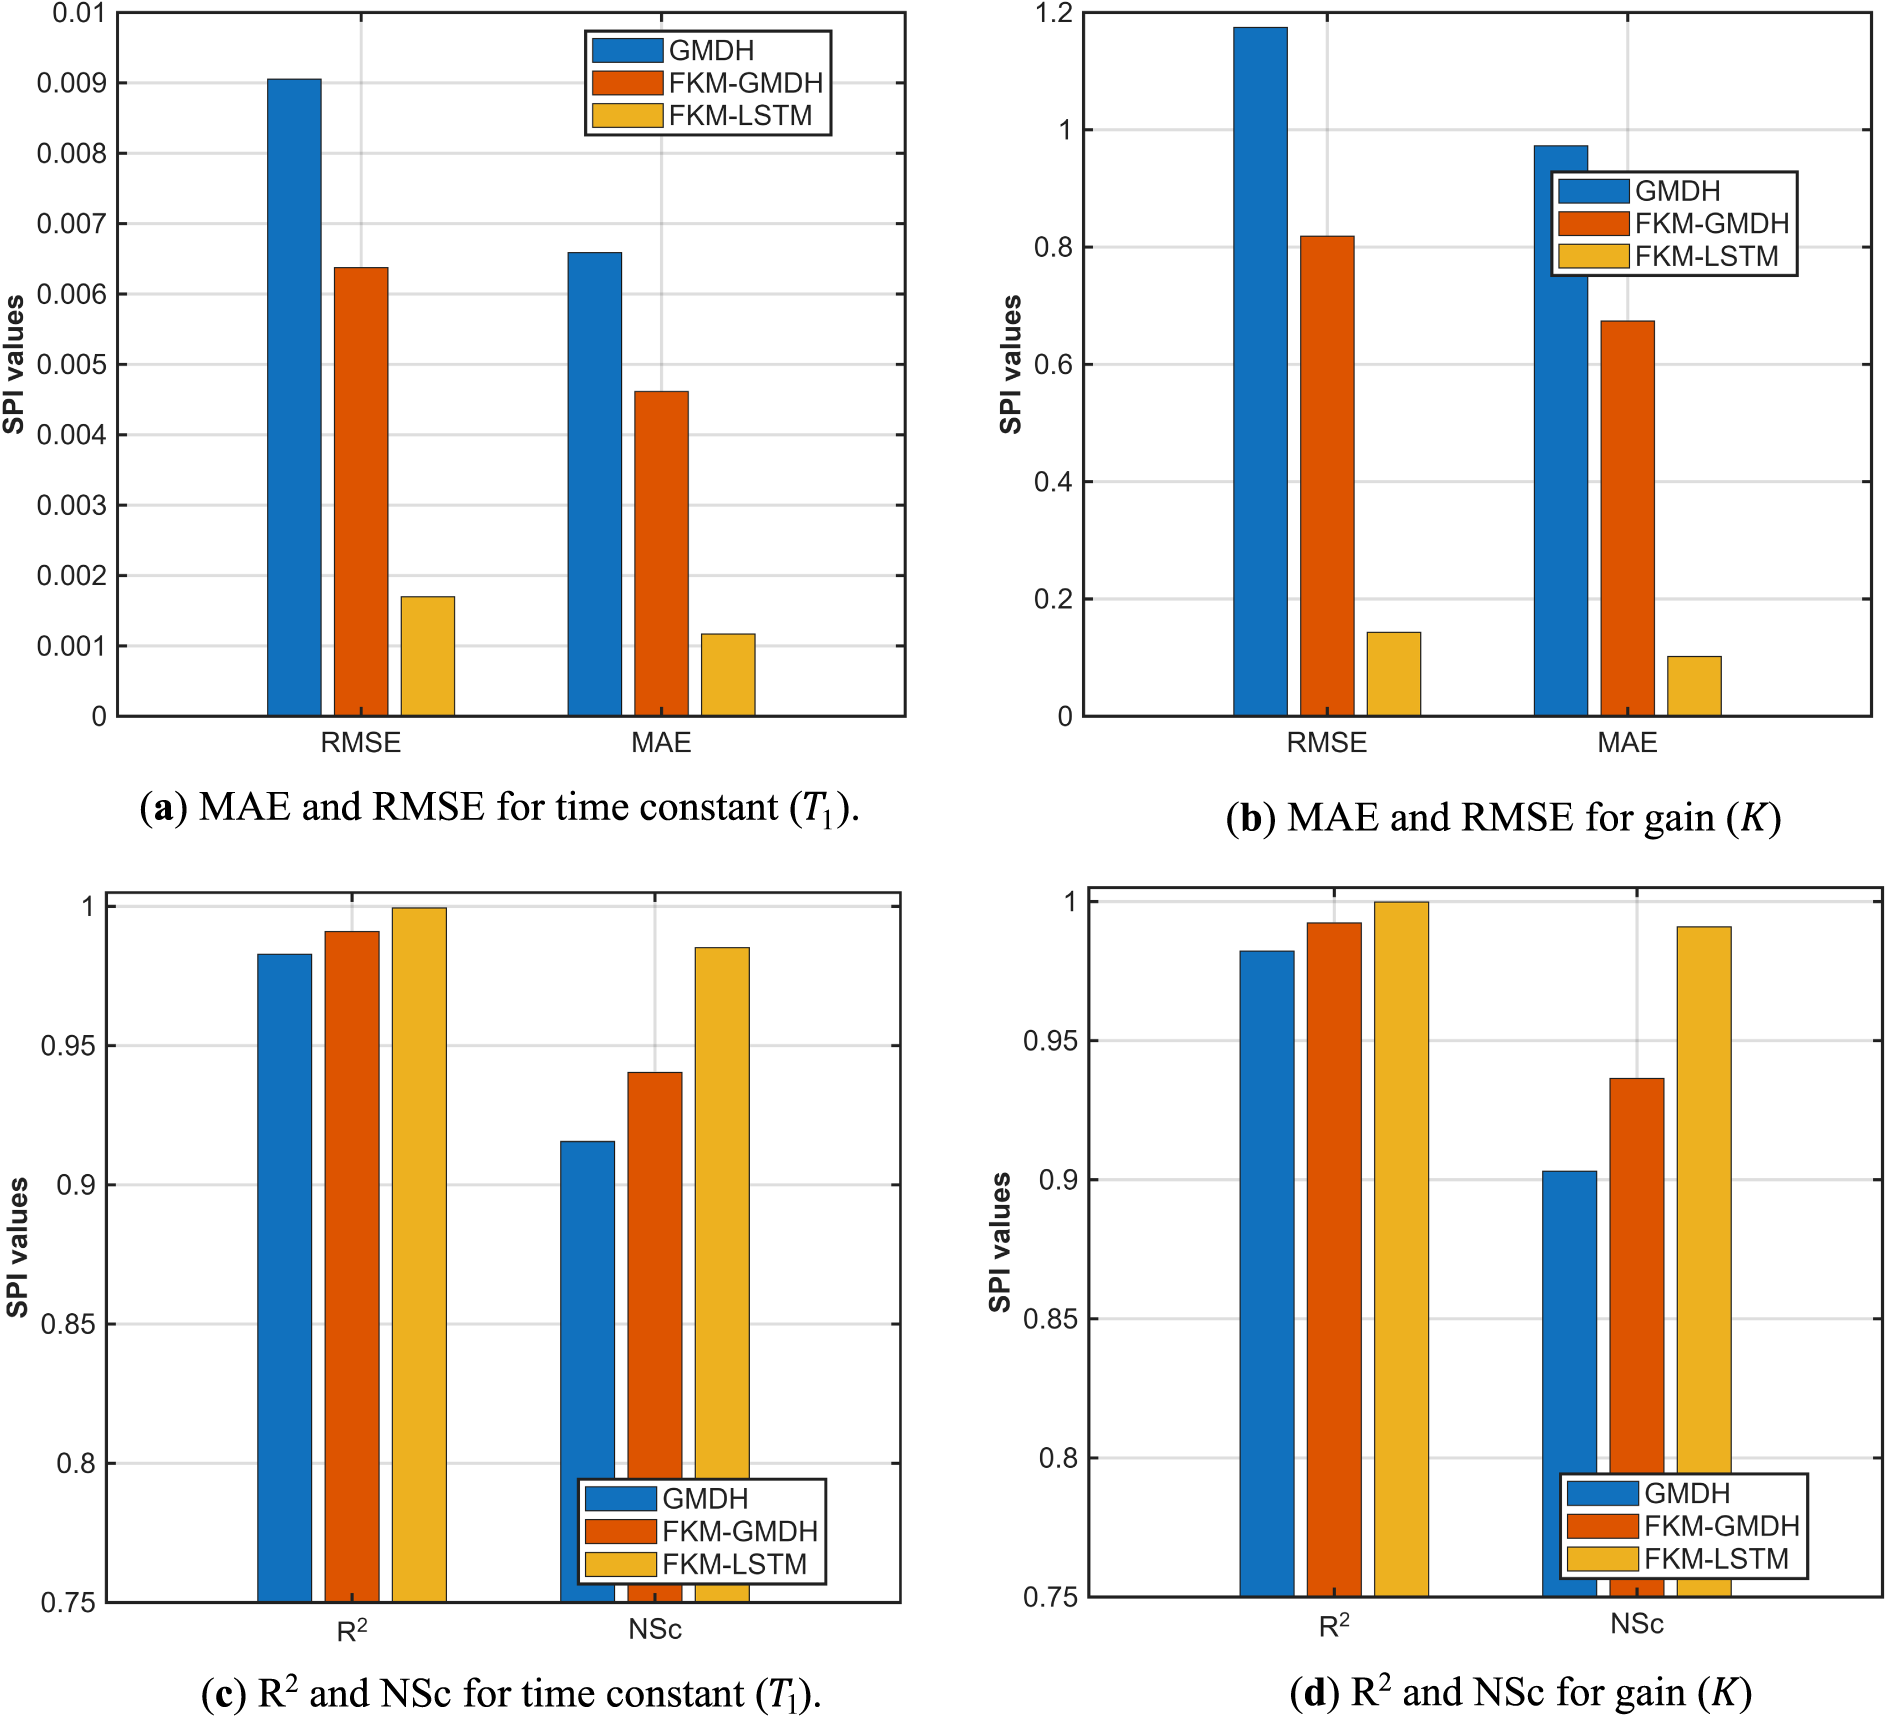
Figure 10: Bar chart representation of the selected SPI values for the first EPS network (test dataset).
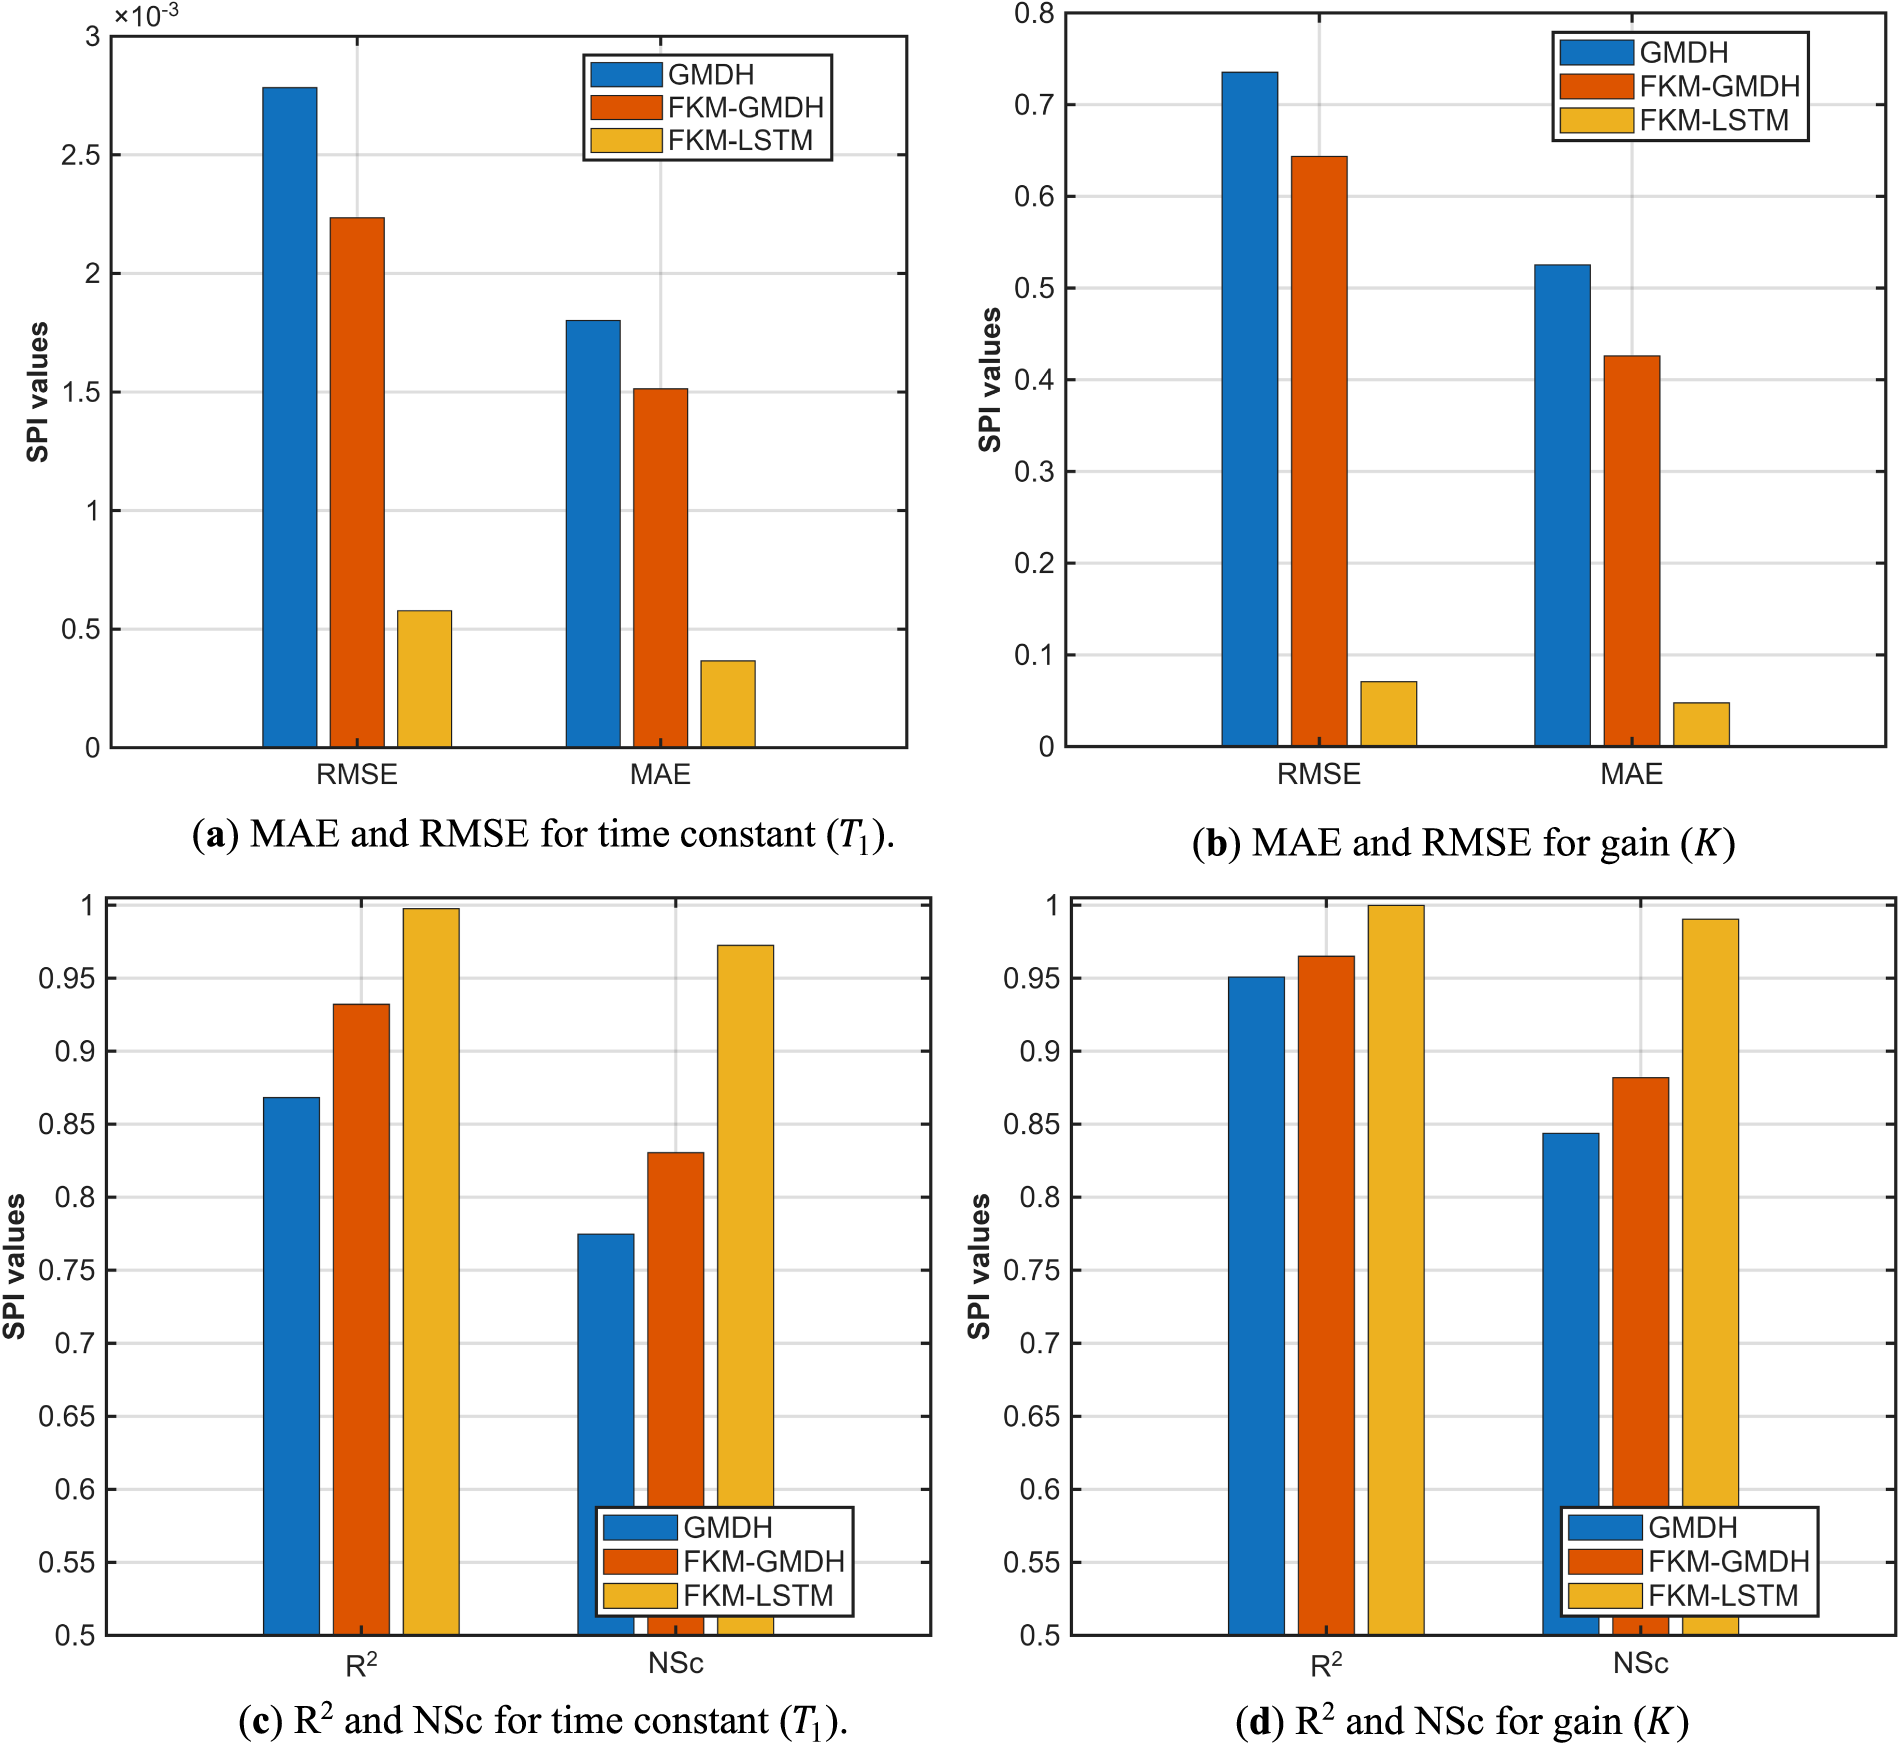
Figure 11: Bar chart representation of the selected SPI values for the second EPS network (test dataset).
The scattered plots for the test datasets are shown in Figs. 12 and 13 for the selected power system networks. In contrast, Figs. 14 and 15 depict a closer view of ML model-predicted and offline tuned PSS key parameters (
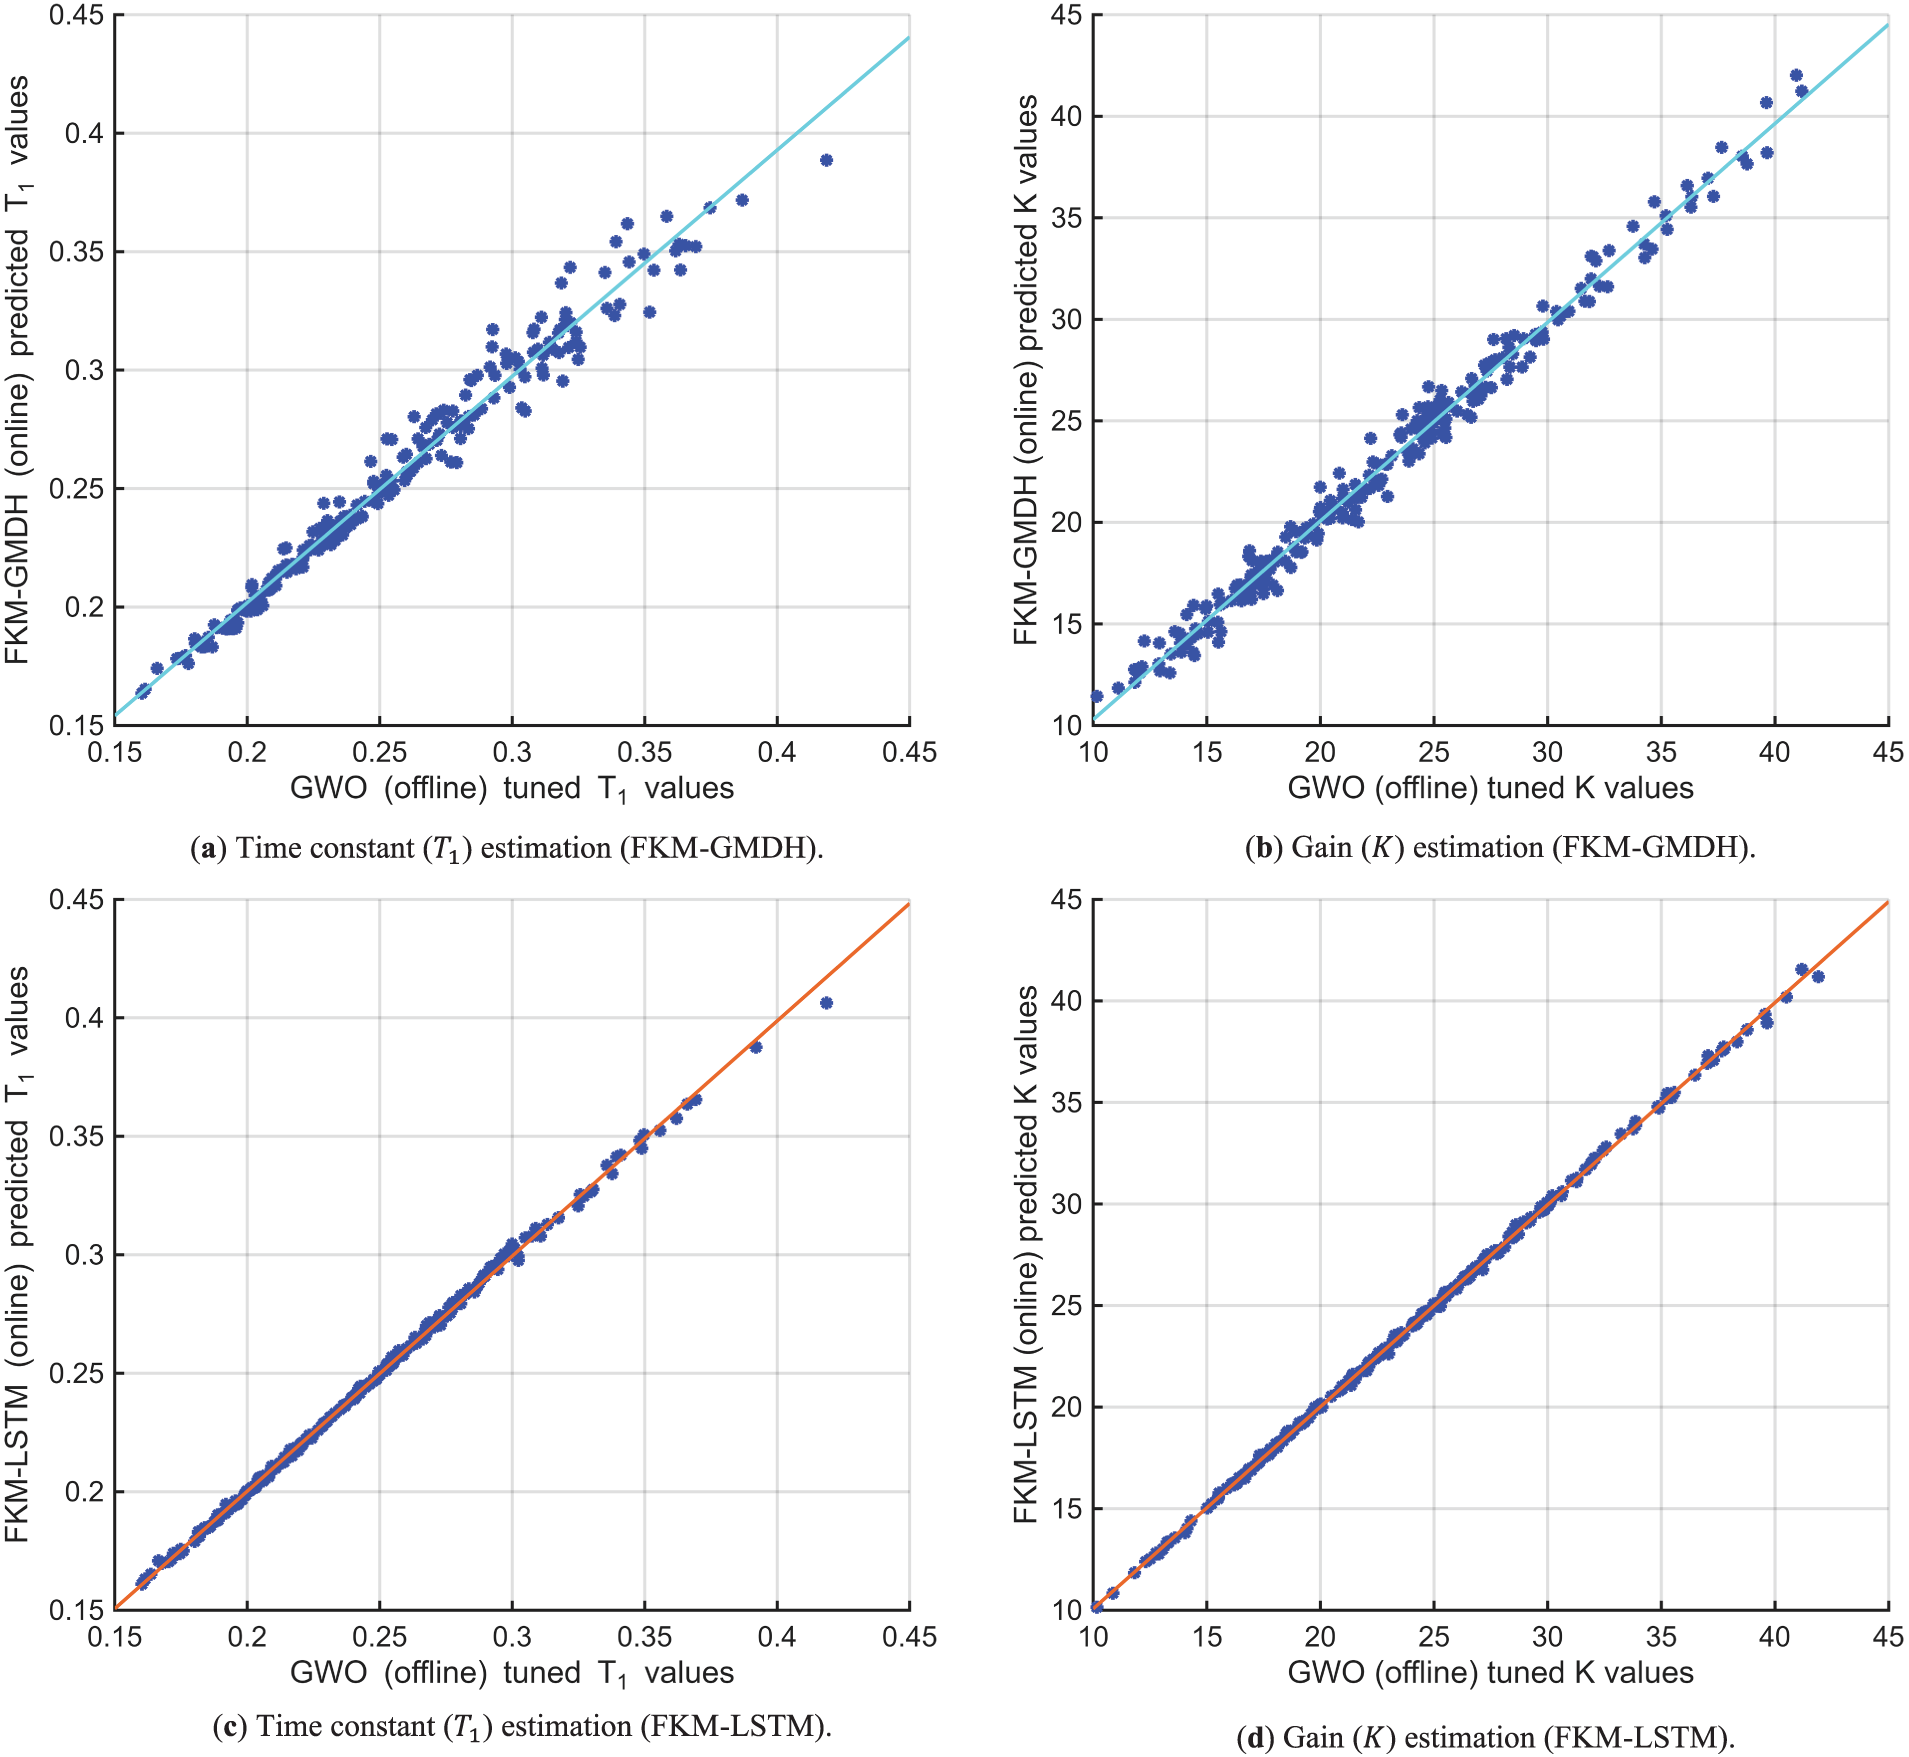
Figure 12: Scatter plots for the first EPS network’s key PSS parameter estimation (test dataset).
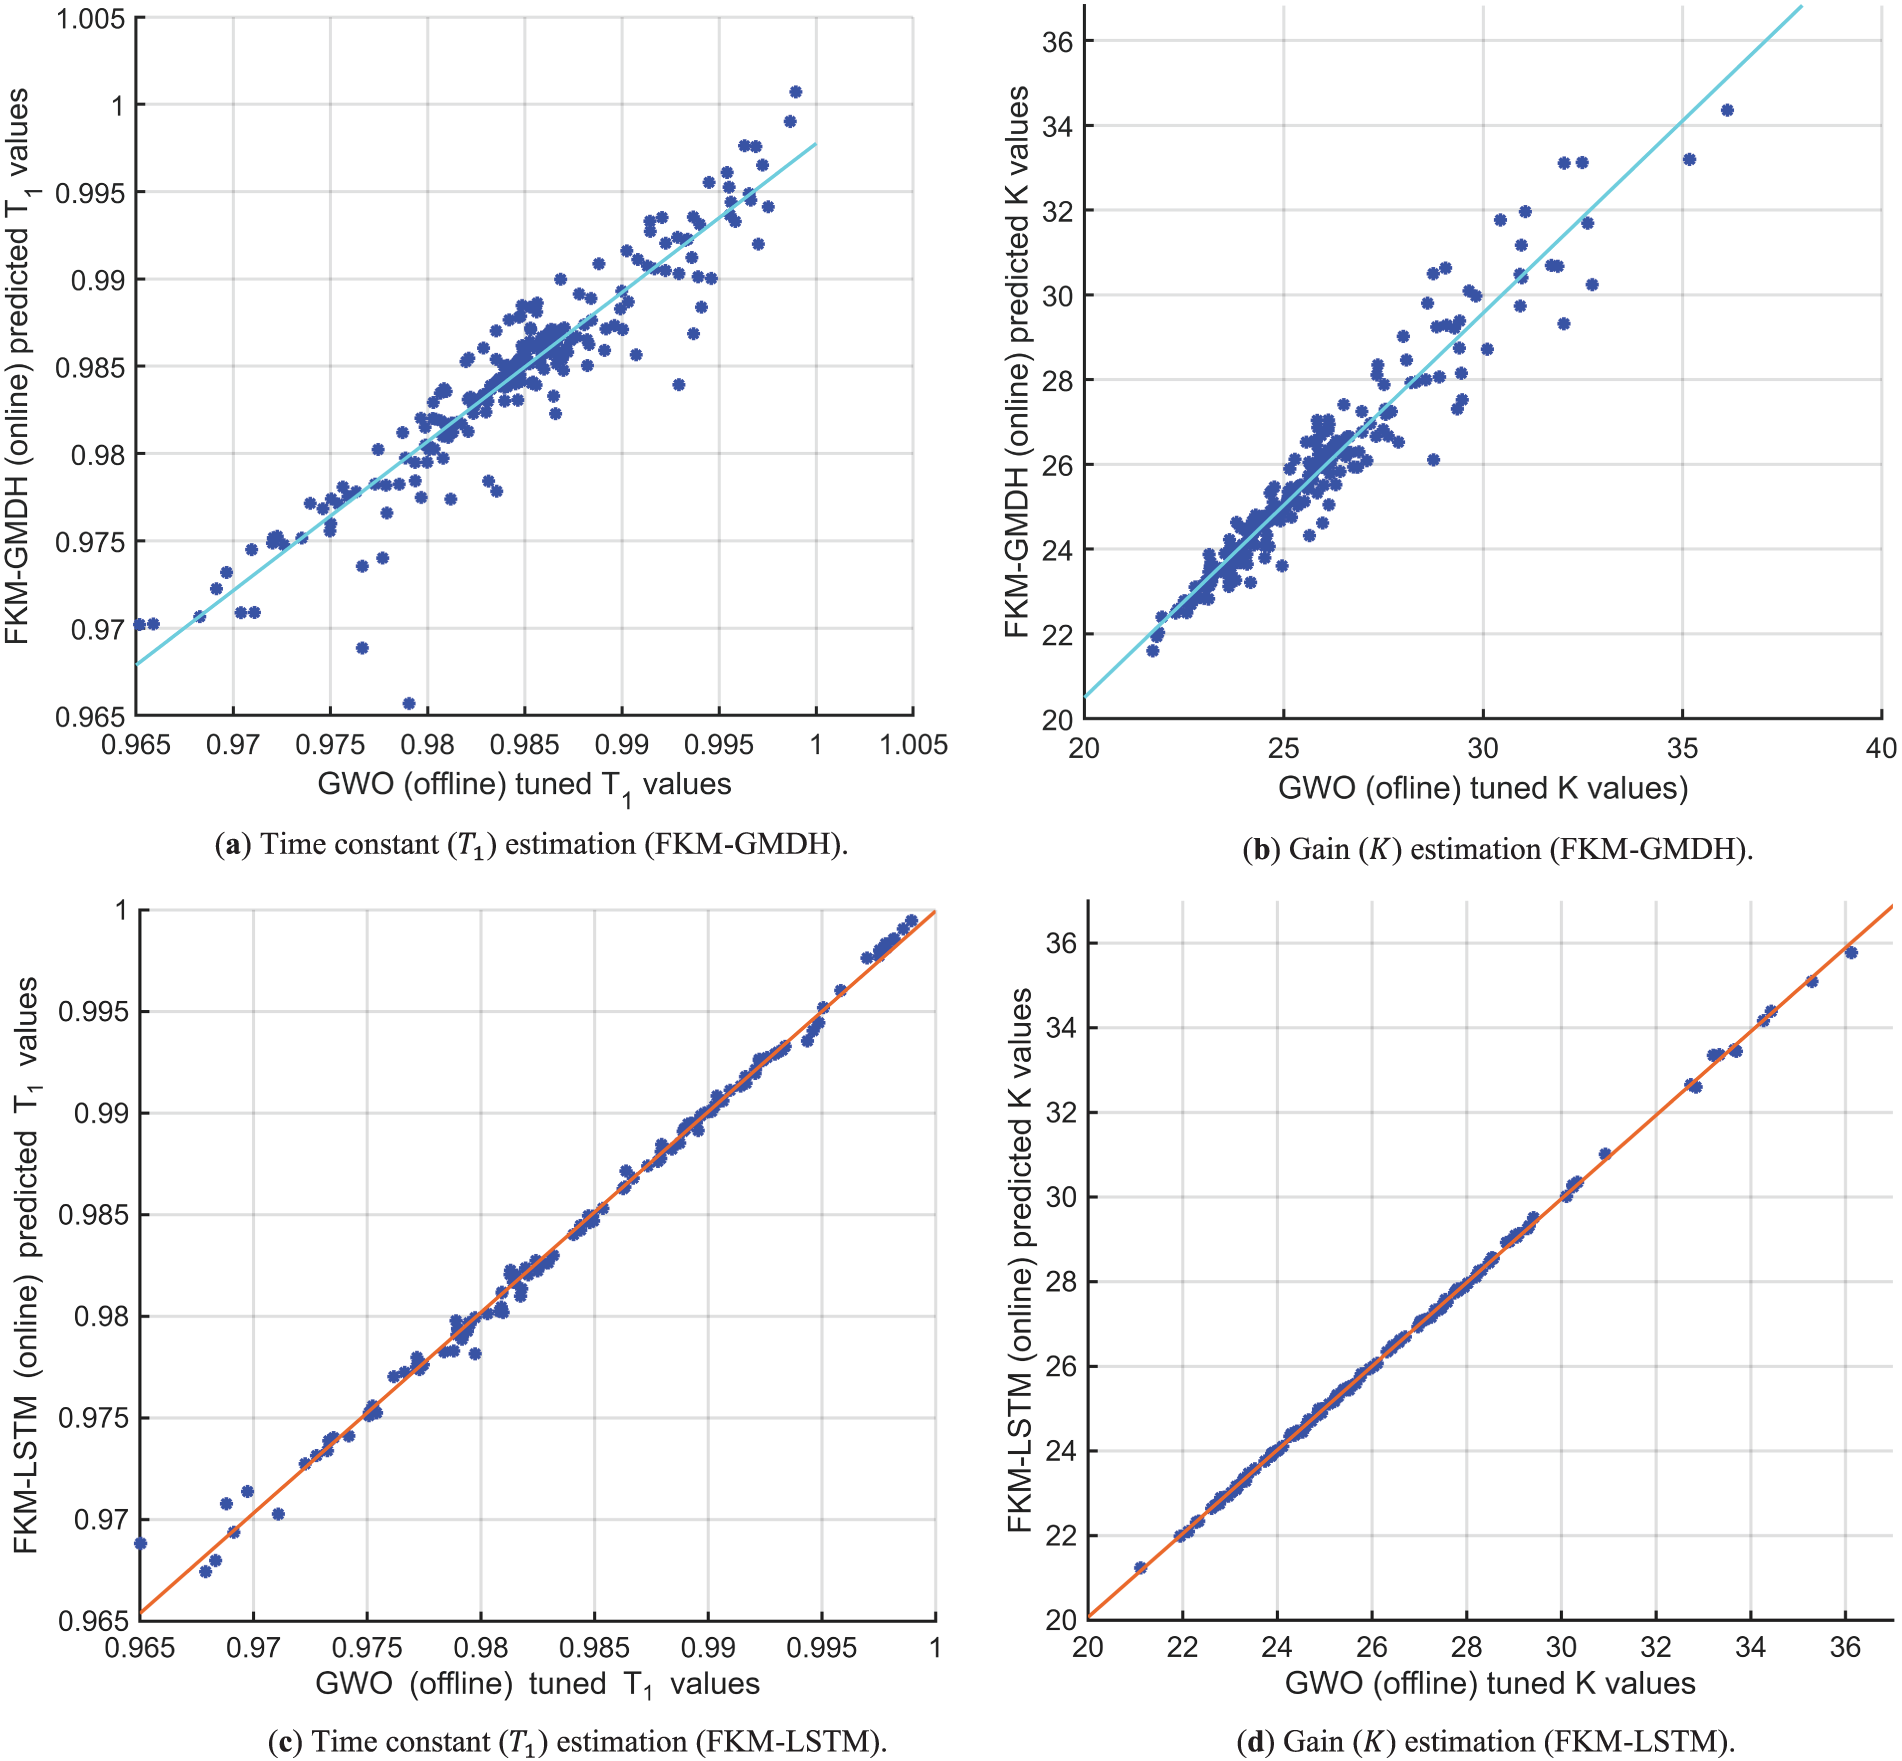
Figure 13: Scatter plots for the second EPS network’s key PSS parameter estimation (test dataset).
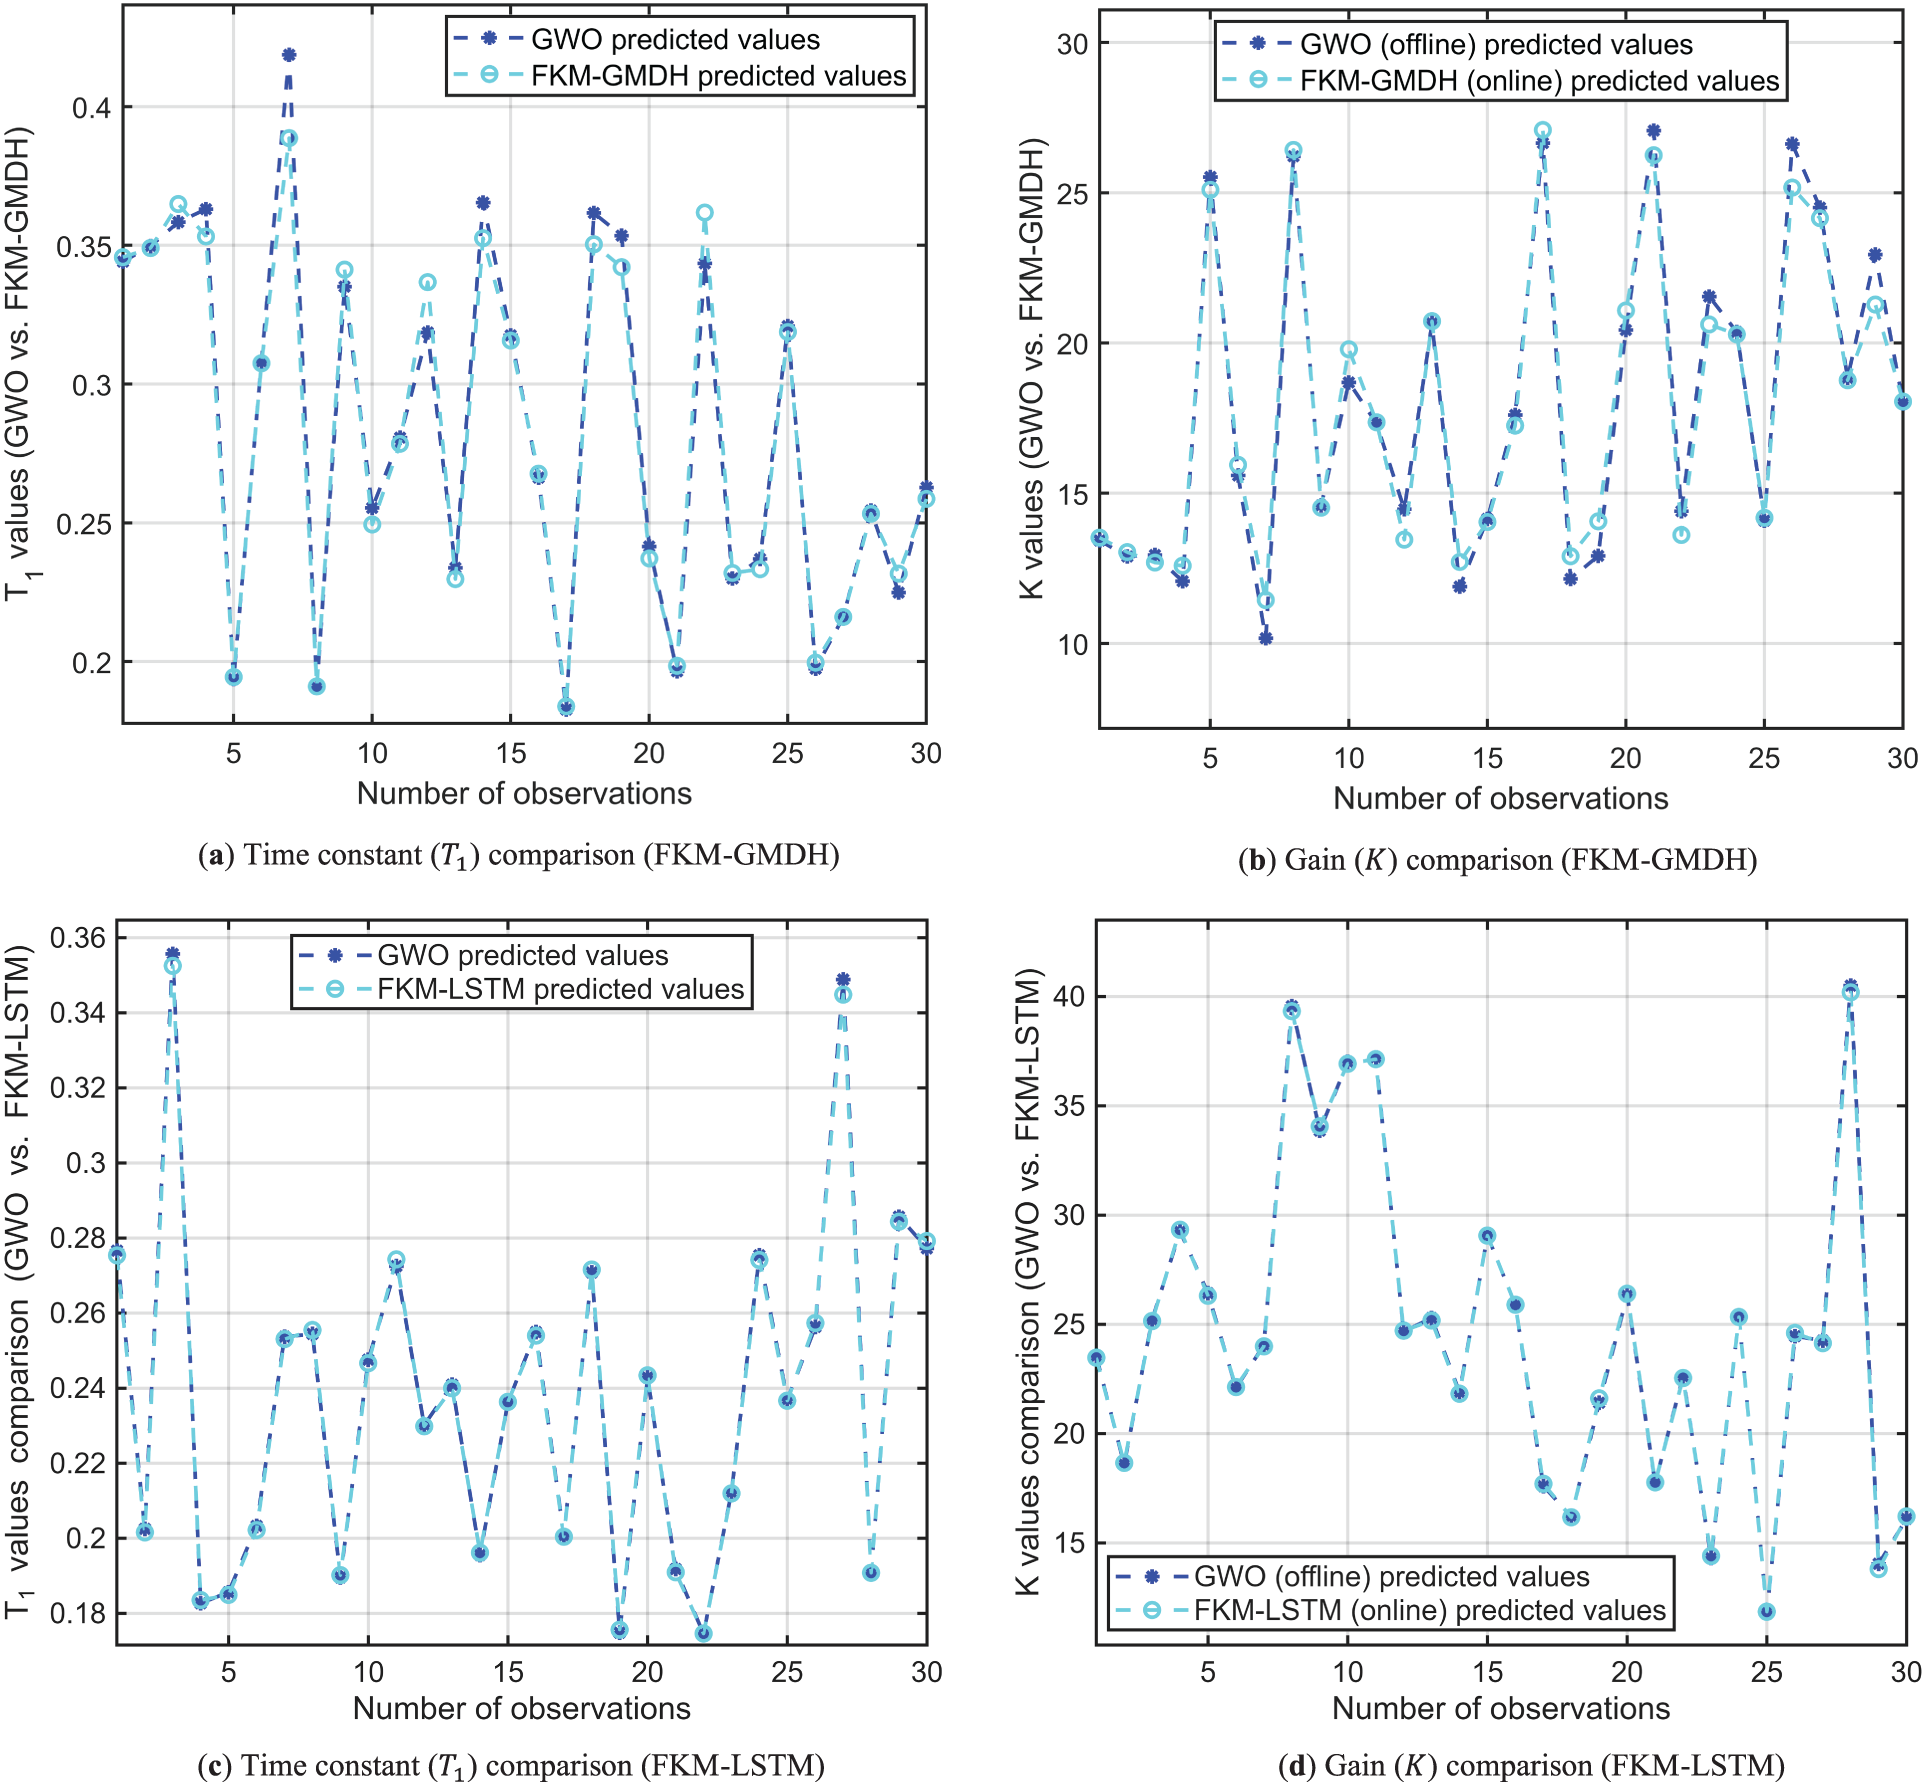
Figure 14: Comparison of 30 random samples from the first EPS network (test dataset).
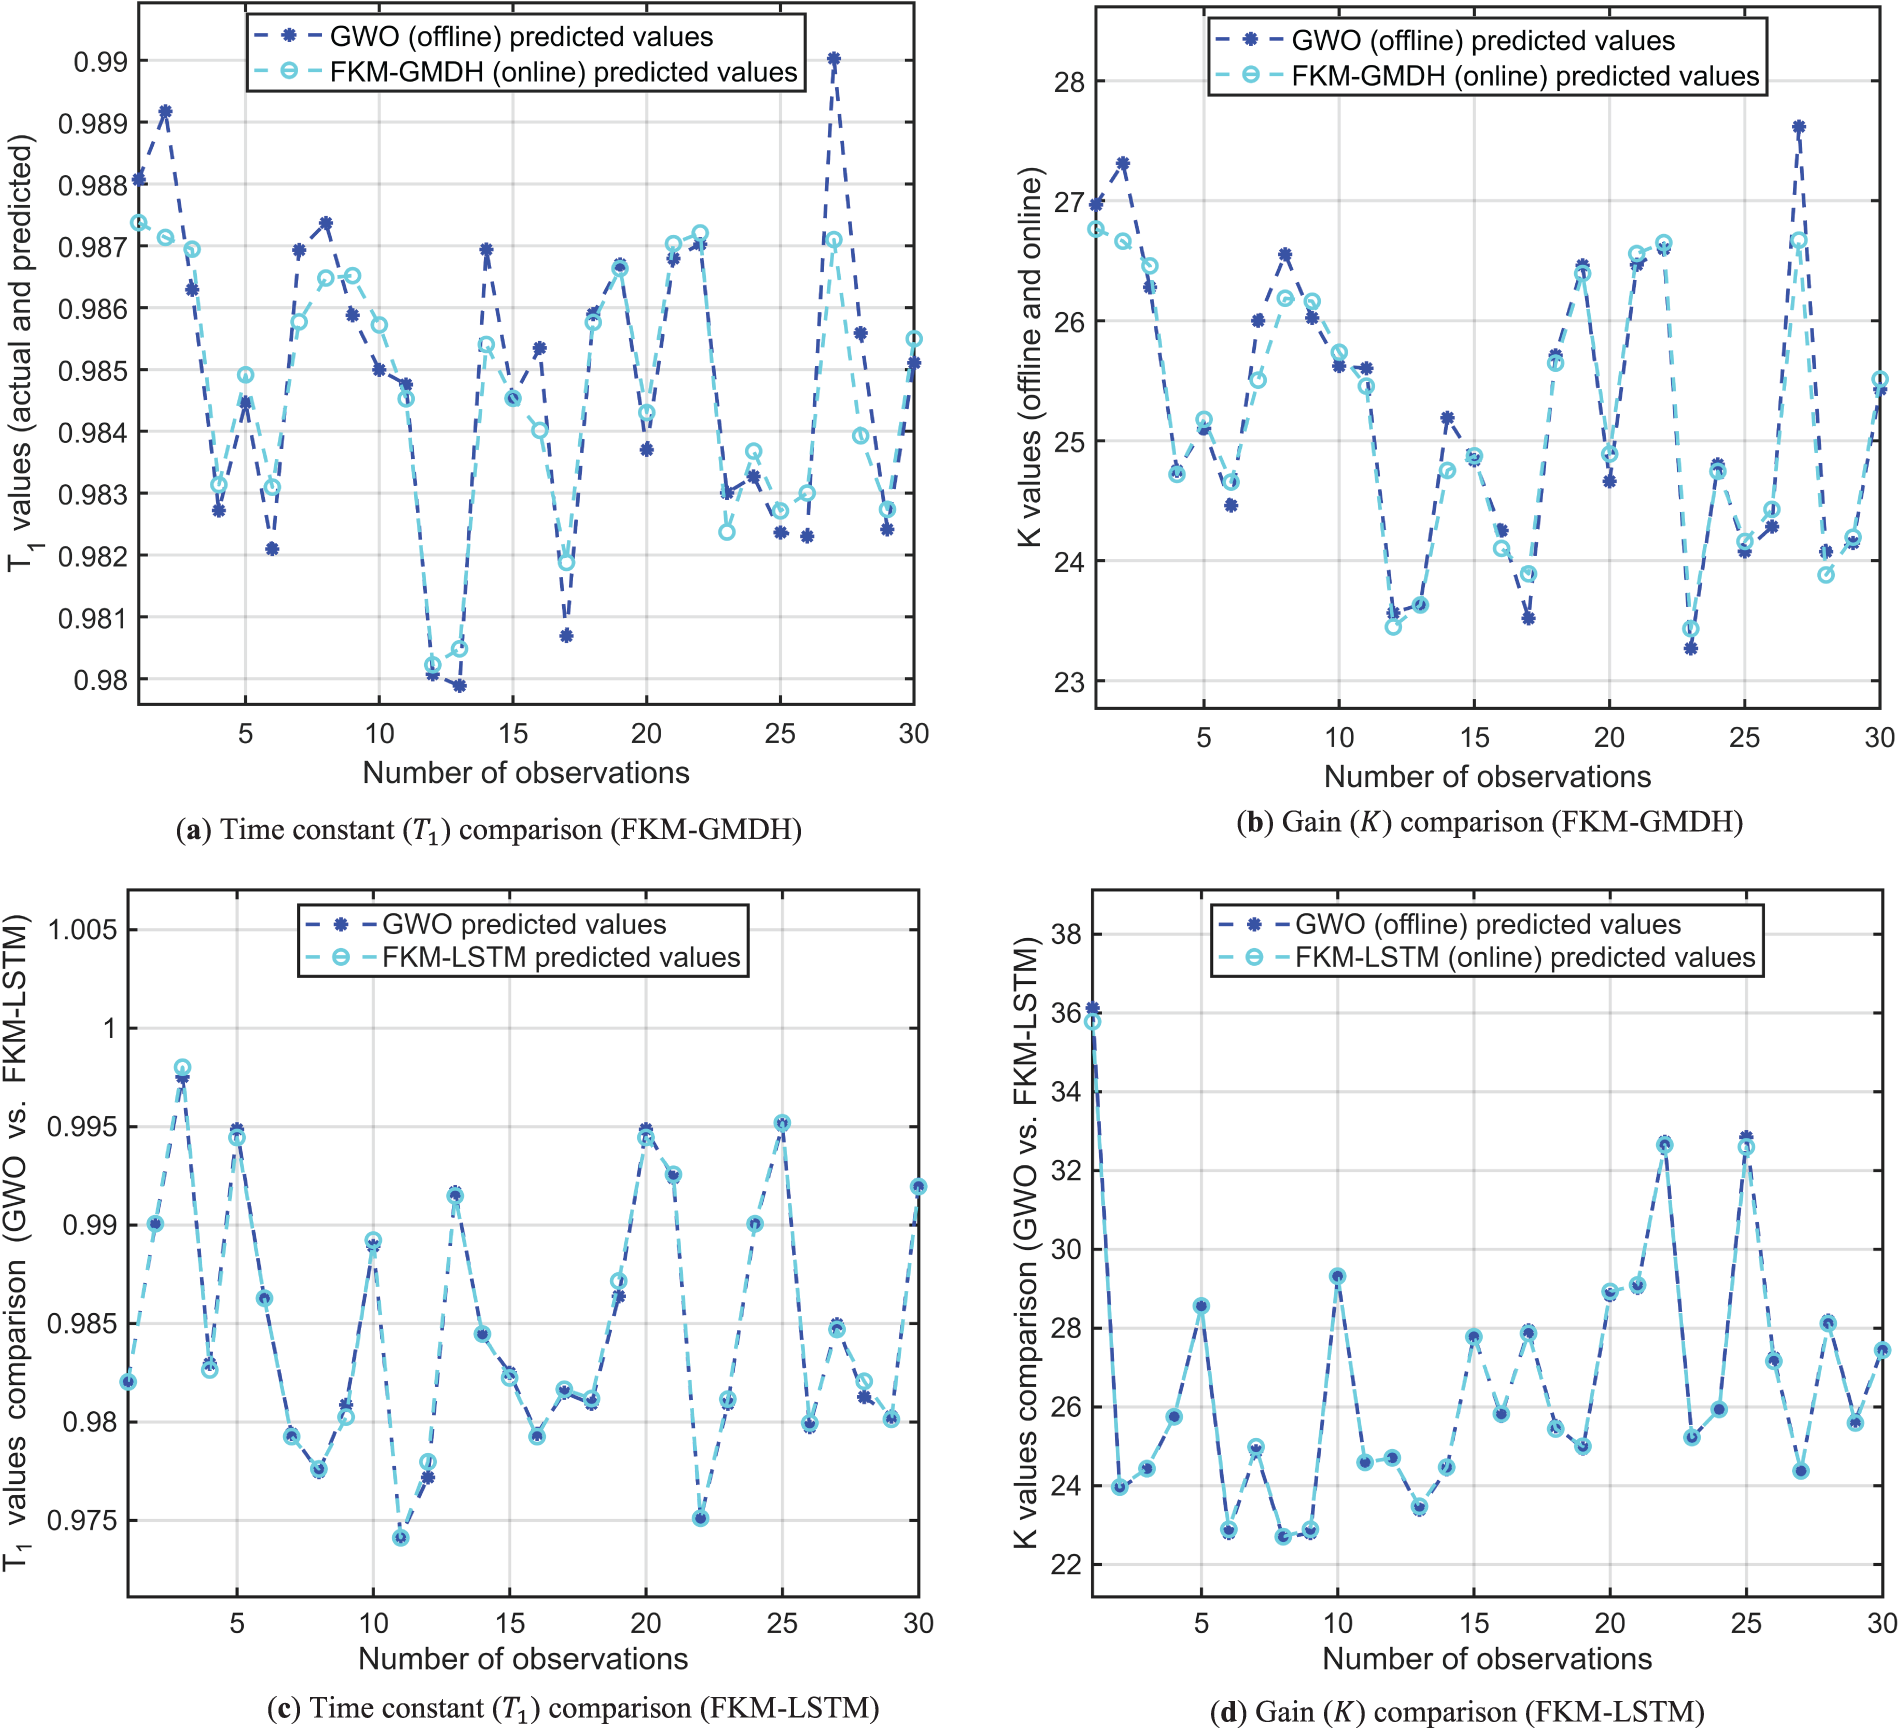
Figure 15: Comparison of 30 random samples from the second EPS network (test dataset).
In this work, fuzzy k-means clustering-based machine learning models were developed and applied to two different EPS networks for online (real-time) prediction of key PSS parameters to enhance overall system stability profiles. The following section evaluated the effectiveness of the FKM-based ML models by assessing the eigenvalues and the minimum damping ratio (MDR) for both networks. In addition, the effectiveness of the developed models was evaluated for real-time applicability via time-domain simulations under disturbances.
5.1 Eigenvalues and Minimum Damping Ratio Comparison
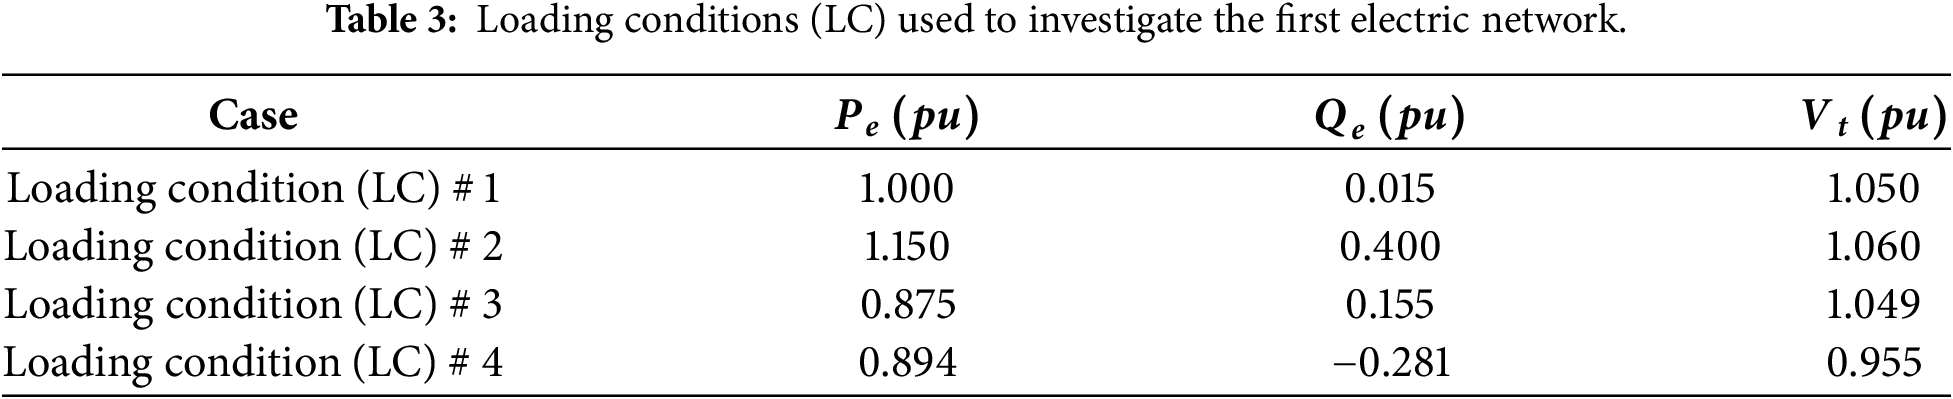
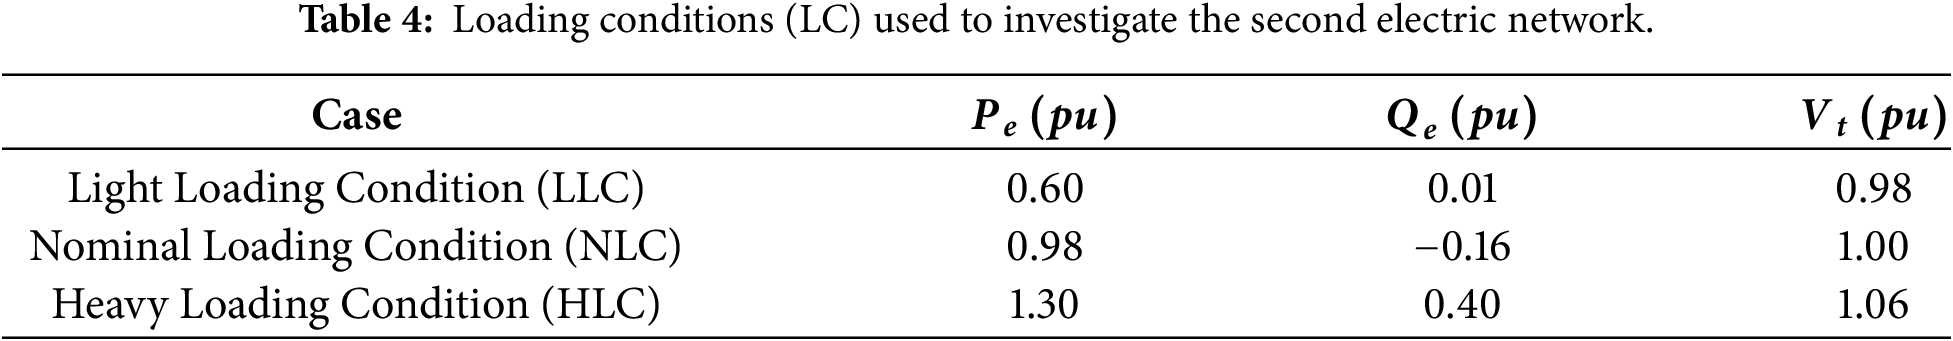
As mentioned earlier, placing any eigenvalues (characteristic roots) of a state matrix for any dynamic system on the right side of the imaginary axis will lead the system toward instability. The positivity of the eigenvalues indicates instability in the system during operation. To analyze the eigenvalue impact in the selected EPS networks, we randomly considered four different loading conditions (
Additionally, minimum damping ratios were measured across all chosen operating conditions to assess the efficacy of the proposed FKM-based ML models for real-time tuning of PSS key parameters. Tables 3 and 4 present the chosen loading situations for the first and second EPS networks, respectively.
Tables 5–8 present the eigenvalues, estimated PSS parameters (
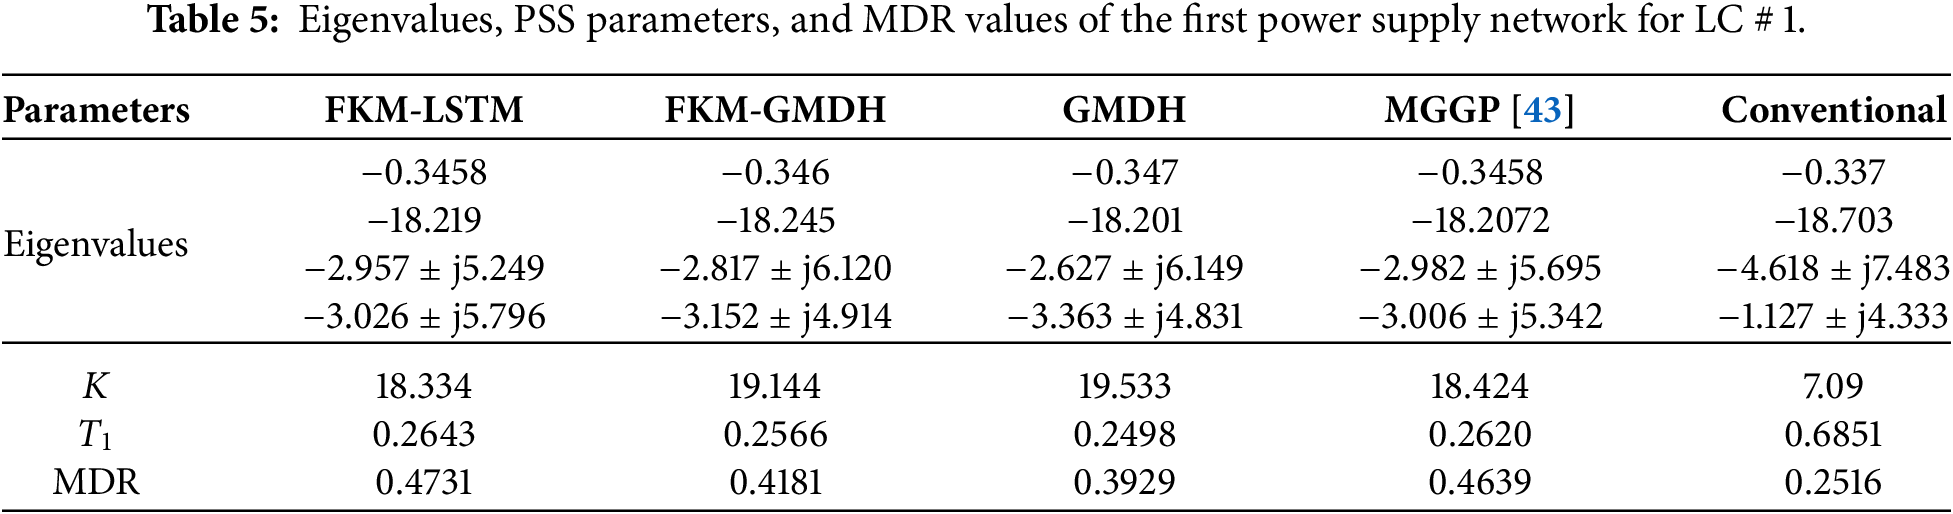
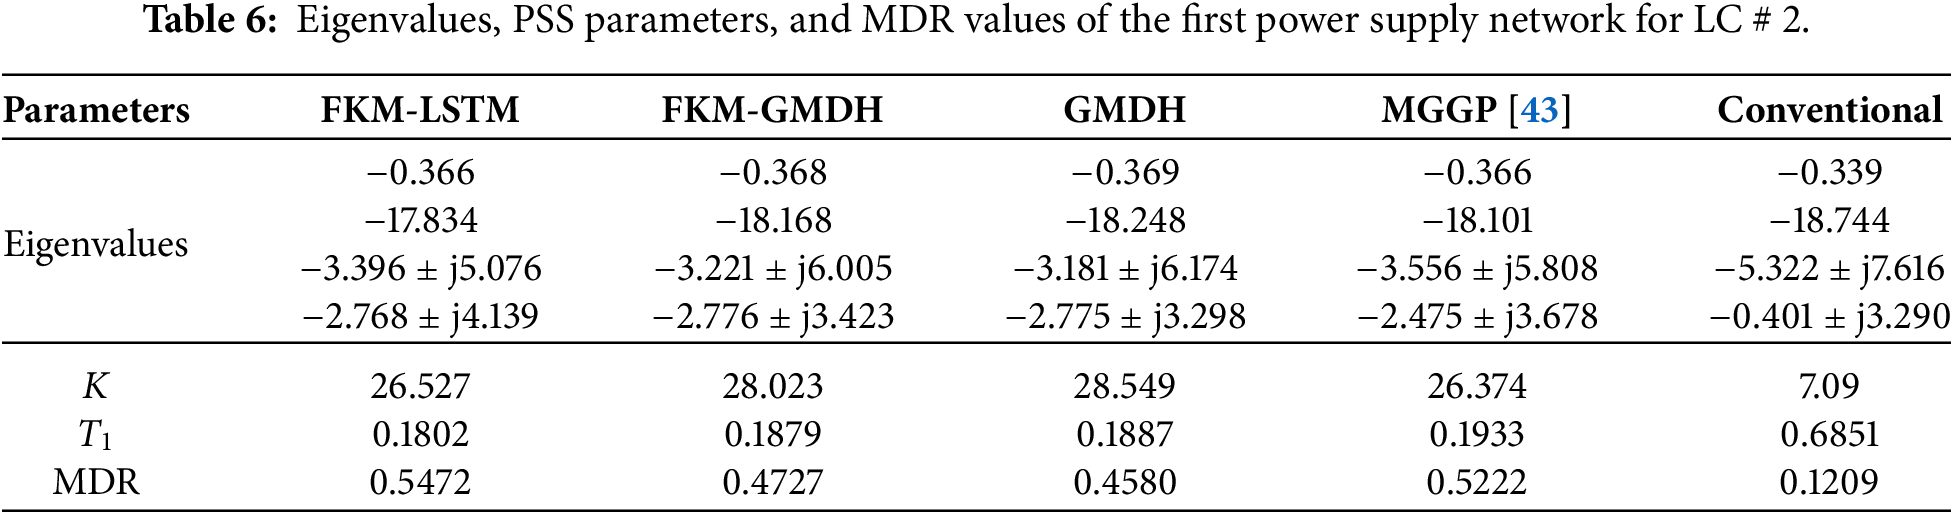
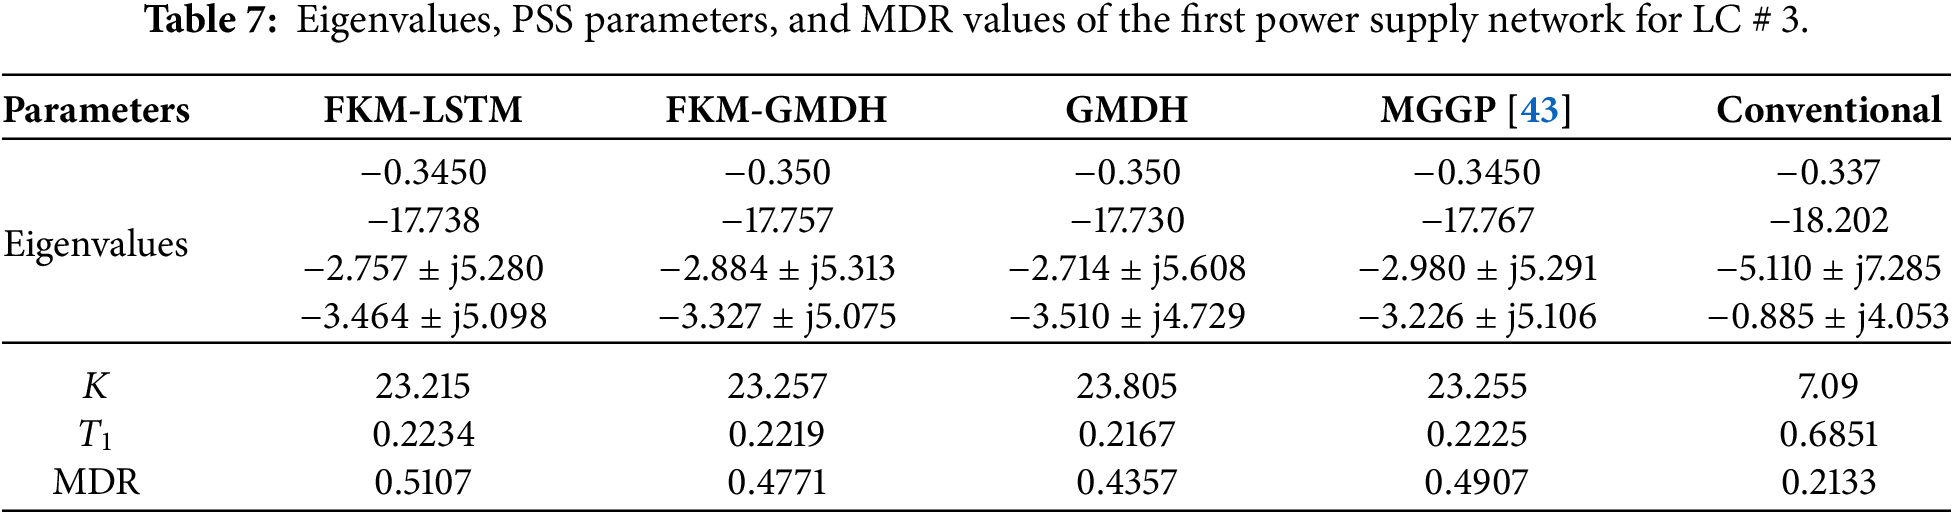
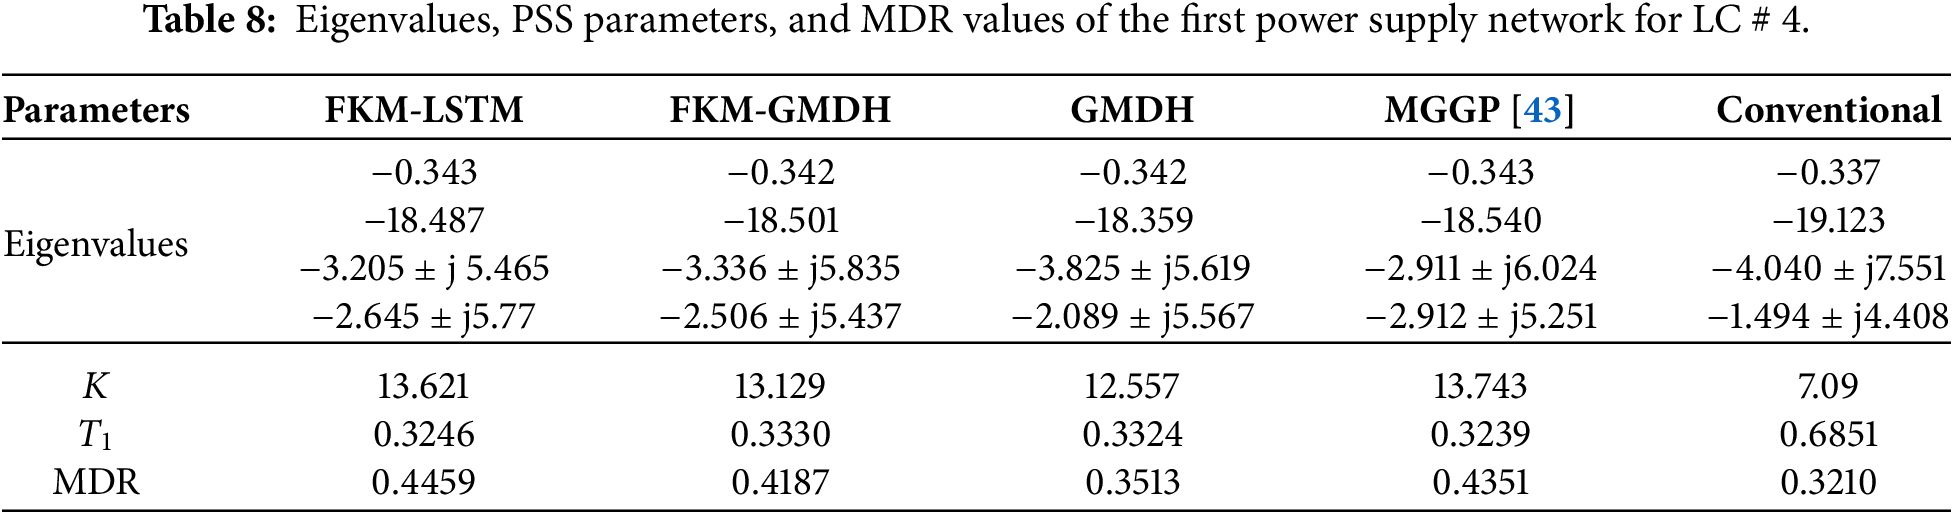
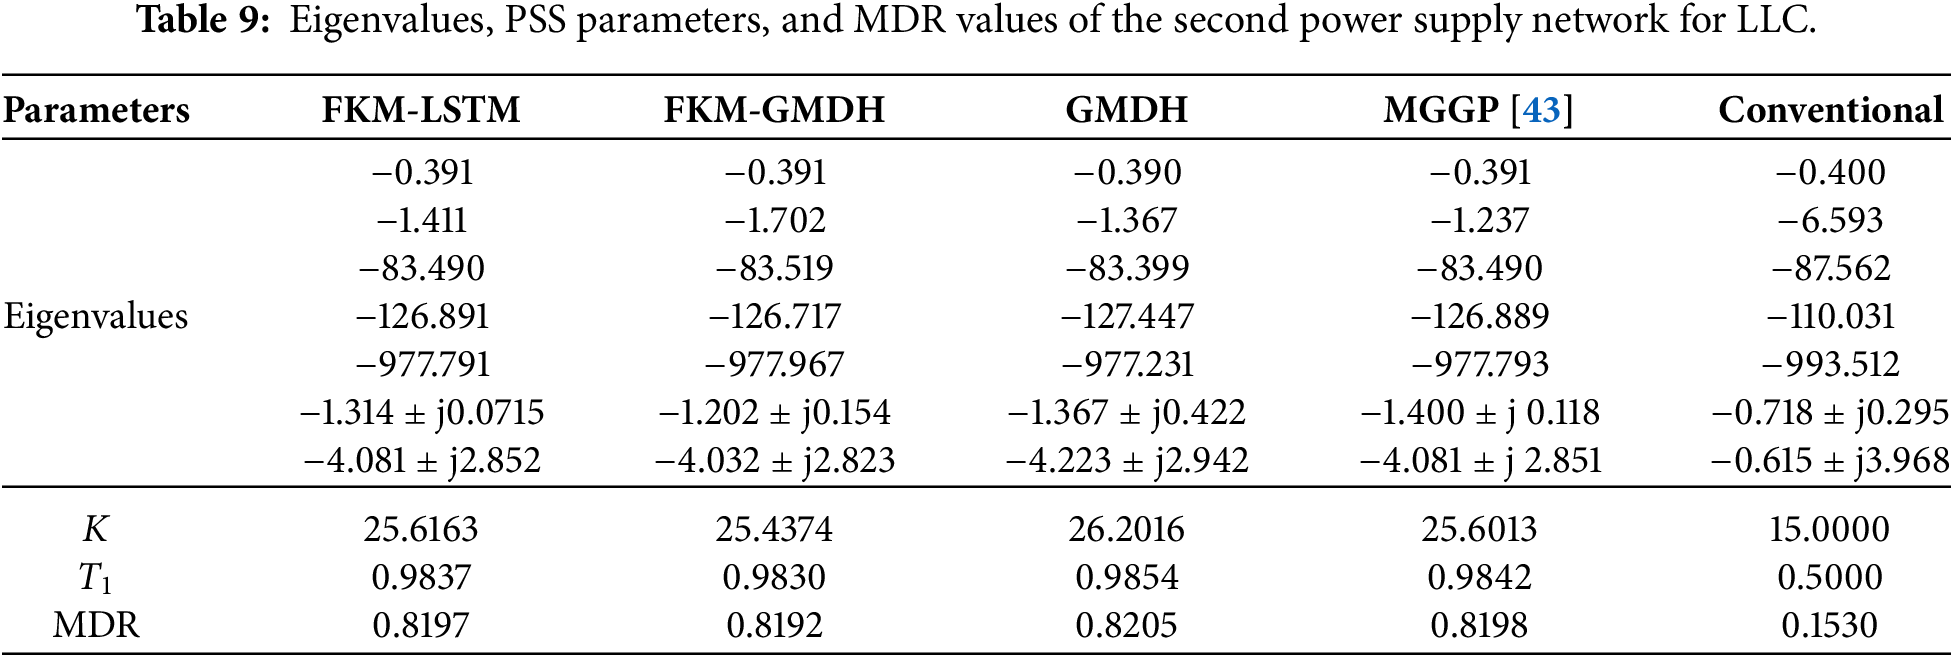
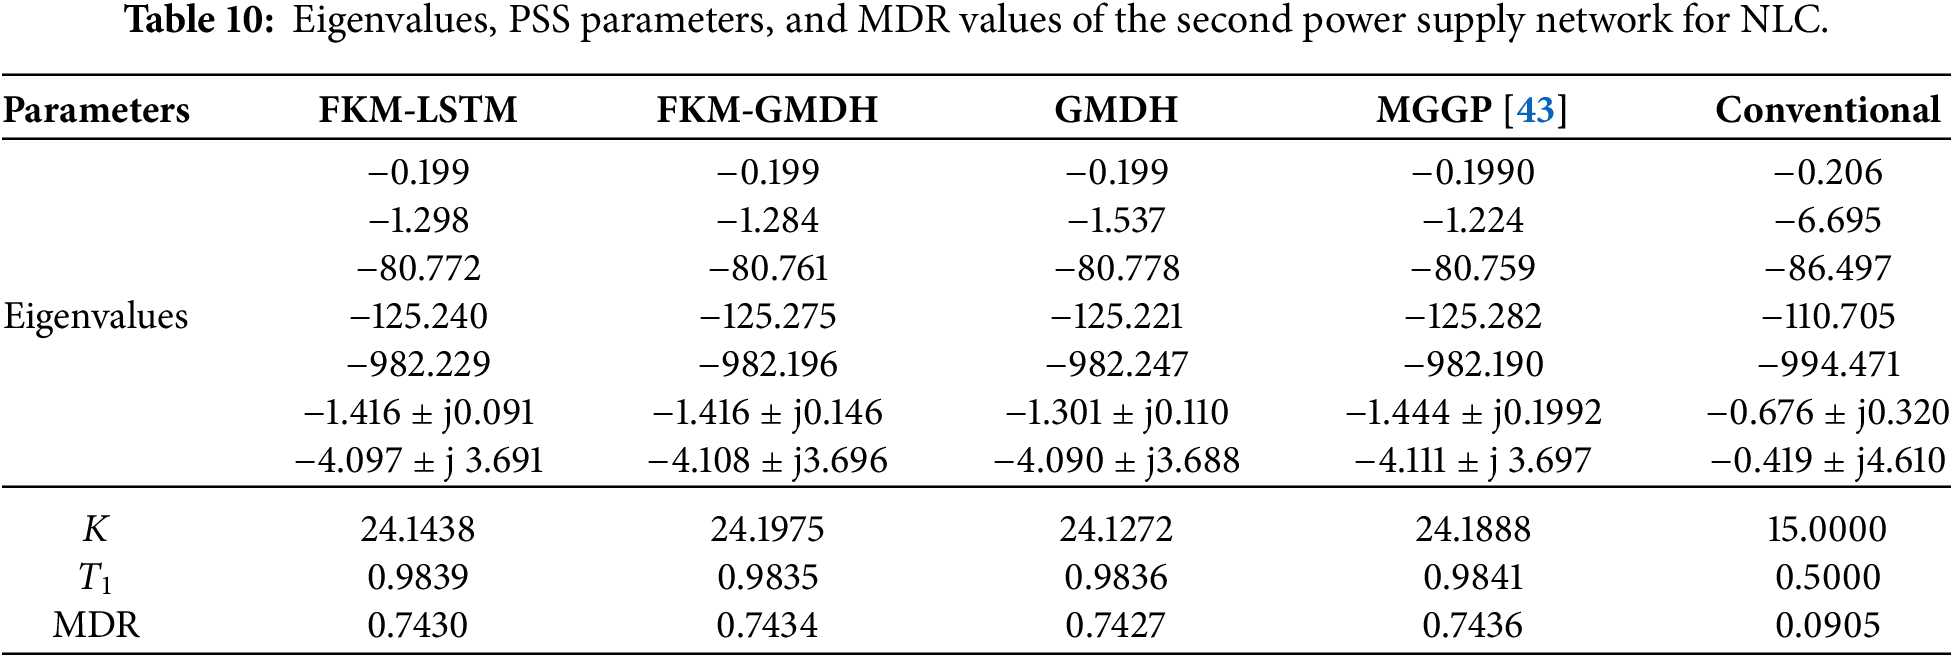
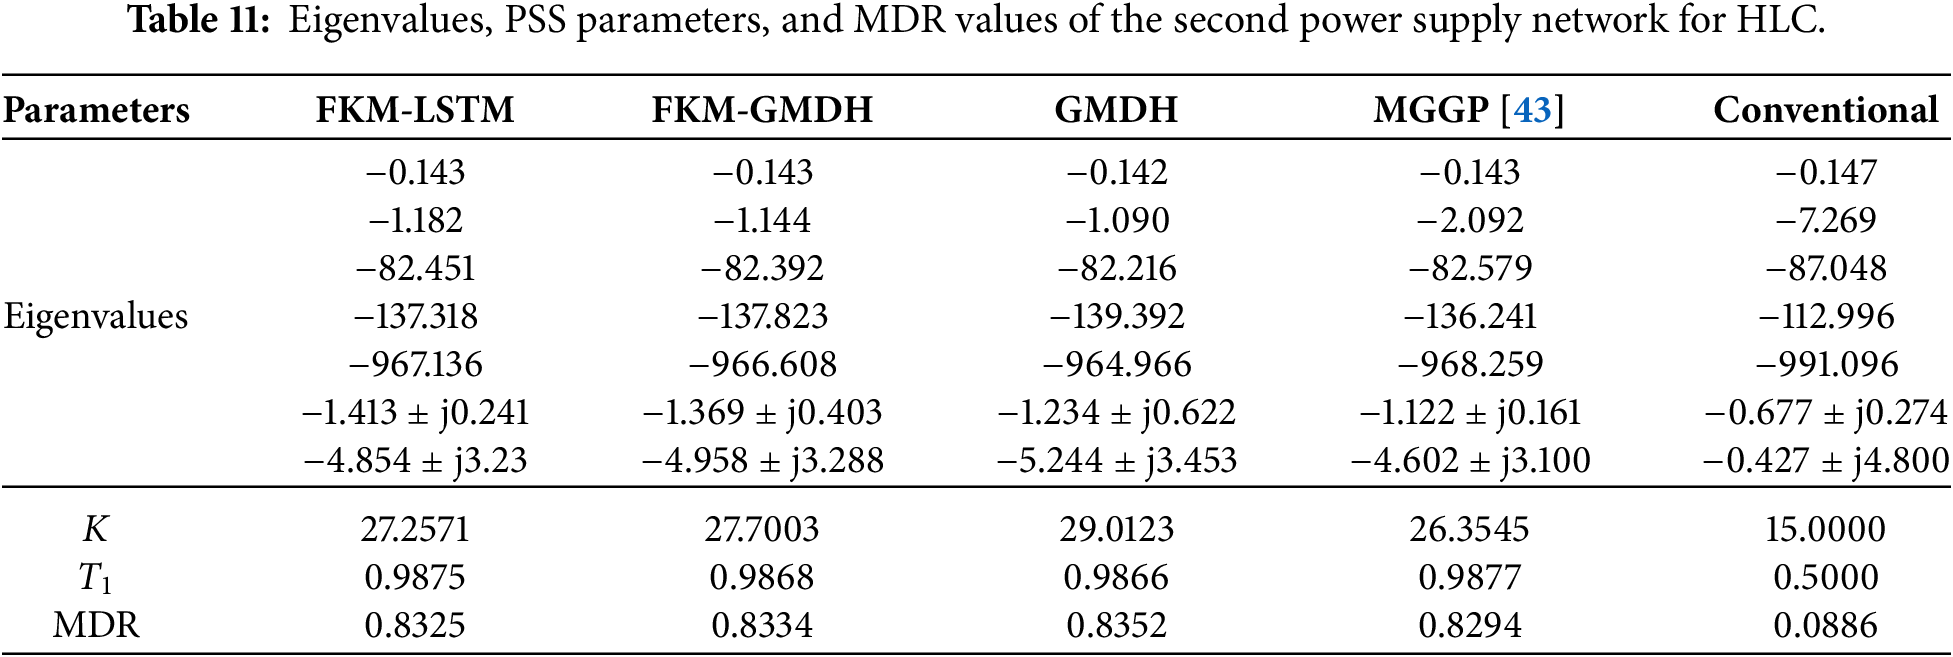
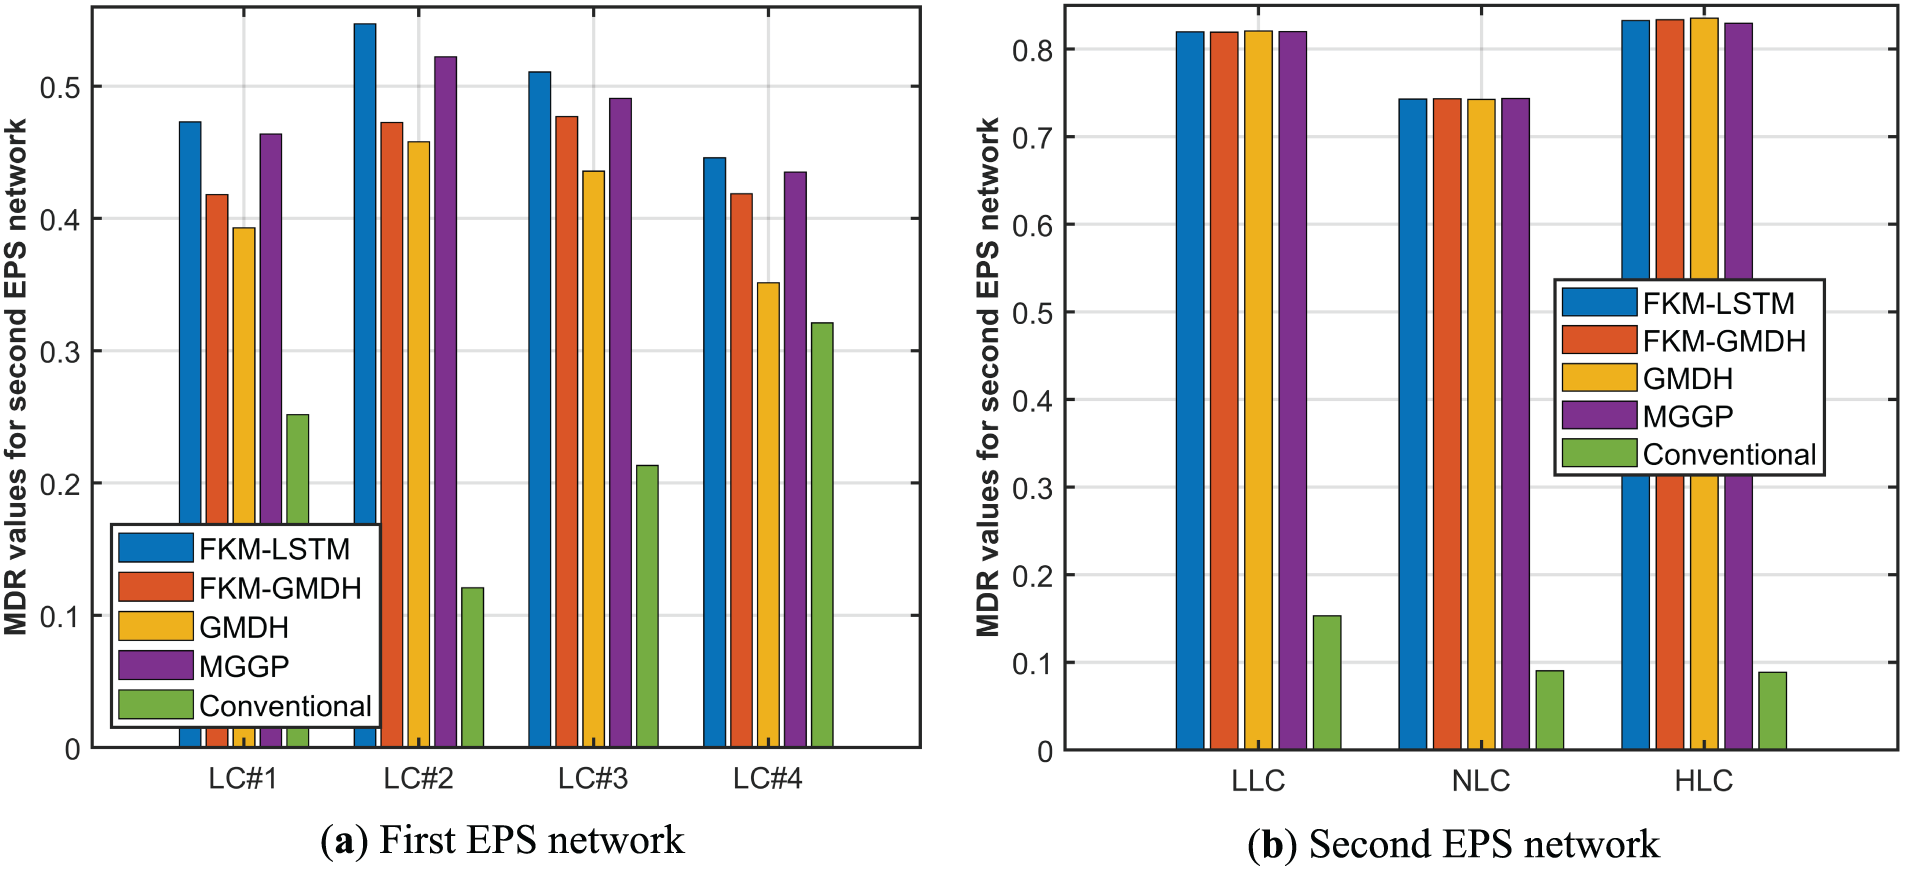
Figure 16: MDR comparison under various loading conditions for the selected models.
From Tables 5–11 and Fig. 16, it is noticeable that although all the eigenvalues of both electric networks obtained for all the compared methods are placed in the left-side of the complex plane, there is a significant improvement in MDR values for the FKM-LSTM and FKM-GMDH models compared to the other models (conventional and the non-clustered GMDH) for the selected networks. In addition, the chosen metrics are comparable to or superior to those reported in the literature. It is worth noting that higher MDR values lead to faster damping of LFOs under external disturbances, and this is achieved more effectively with the FKM-LSTM and FKM-GMDH approaches than with conventional methods in both networks. Additionally, the eigenvalues for the traditional approach were located at better-optimized positions within the left half-plane when estimating PSS variables to damp out the LFOs, compared to the other models. Moreover, the MDR values are higher for the FKM-LSTM and the FKM-GMDH models across all four loading conditions than for the vanilla GMDH model, as shown in Fig. 16. Therefore, it can be concluded that the FKM-based ML models exhibit superior performance for online tuning of the key PSS parameters, thereby improving EPS stability by damping unwanted LFOs.
5.2 Time-Domain Simulation Results Comparison
To investigate LFO damping in the time domain after external disturbances, the rotor angles and rotor angular frequencies of synchronous machines are considered for both networks, along with DC-link voltage changes in the second EPS network. In this regard, fuzzy k-means clustering-based ML models (LSTM and GMDH) and conventional models are employed for estimating key PSS parameters (
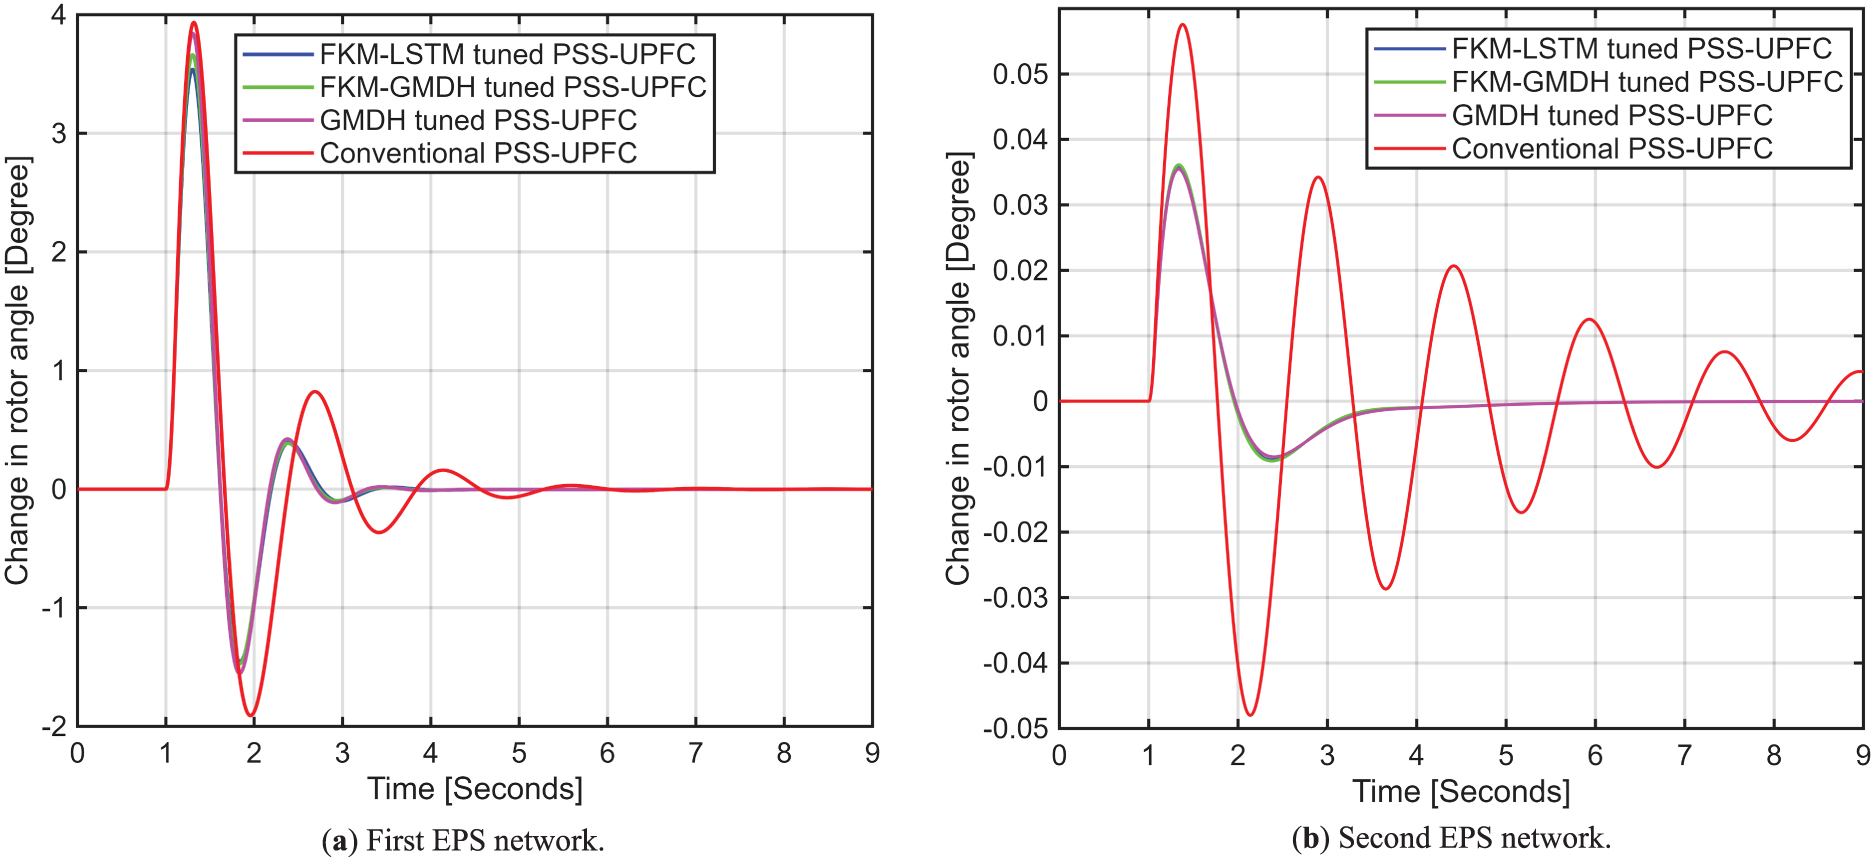
Figure 17: Change in rotor angle after introducing external disturbances.
As shown in Fig. 17, the FKM-GMDH and FKM-LSTM models exhibited faster responses and stabilized both systems within around 3.3 s by suppressing LFOs. In contrast, although the conventional PSS mitigated the LFOs, it took more than 6 s for both networks. Similar to the investigation of rotor angle changes under disturbances, angular-frequency changes were measured and plotted in Fig. 18. It is evident that the developed FKM-LSTM and FKM-GMDH models demonstrated faster responses by imposing appropriate PSS actions through proper tuning of the PSS parameters, and took slightly more than 3.0 s to stabilize the tested EPS networks by suppressing LFOs. On the contrary, although the traditional PSS suppressed the LFOs for both networks, it took more than 6.0 s.
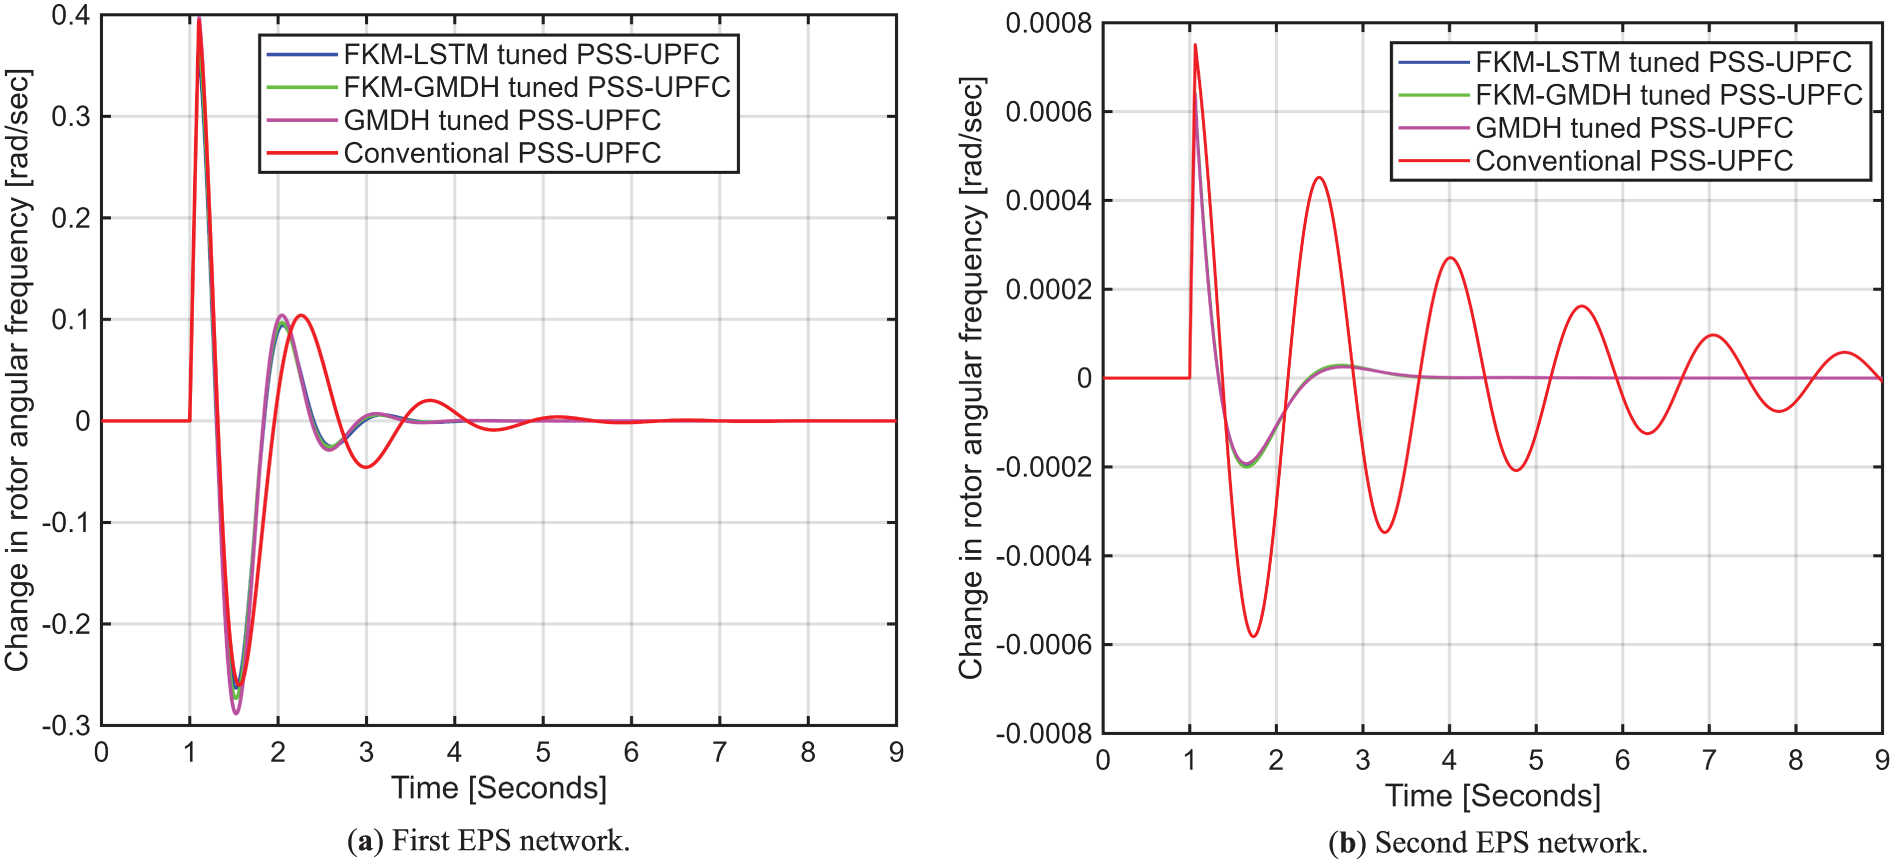
Figure 18: Change in rotor angular frequency after introducing external disturbances: (a) the first EPS network, and (b) the second EPS network.
Similar to the change in rotor angle and angular frequency, we also investigated the time-domain response of the DC-link voltage under external disturbances for the second EPS network. The measured time-domain responses for the proposed and conventional approaches are shown in Fig. 19. As shown, the developed FKM-based ML models stabilized the DC-link voltage within 6 s. In contrast, the traditional model could not stabilize it within the chosen time frame of 0 to 9 s, exhibiting poor damping of LFOs and limited improvement in stability. Therefore, we can conclude from the time-domain illustrations in Figs. 17–19 that the FKM-based ML models (GMDH and LSTM) demonstrated superior performance in damping out the LFOs by effectively tuning key PSS parameters and improving operational stability under external disturbances.
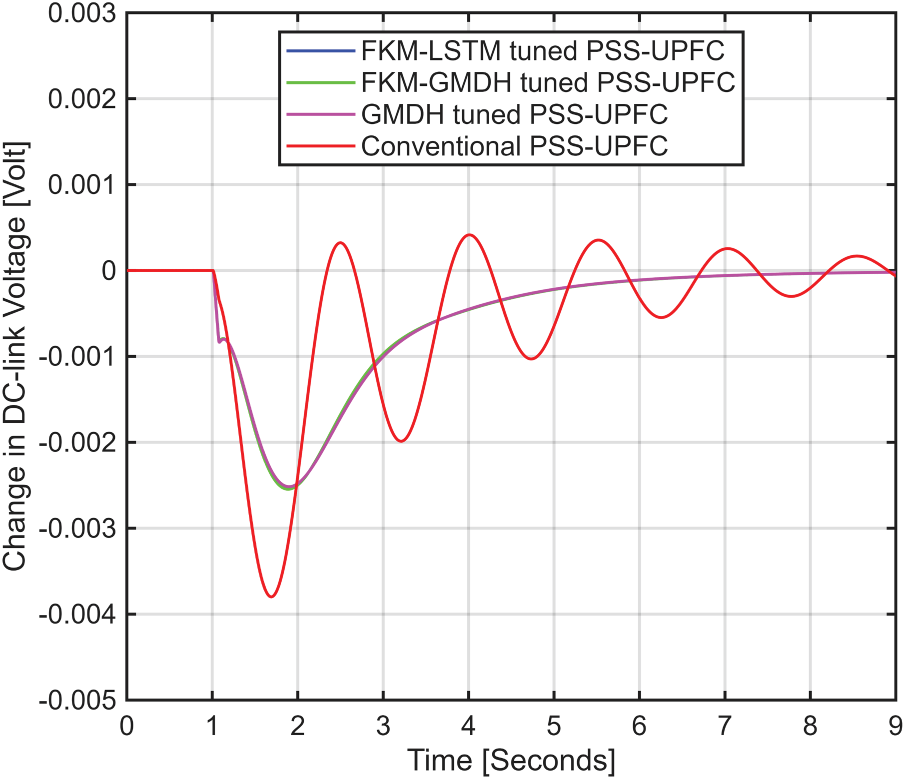
Figure 19: Change in DC-link voltage after introducing external disturbances to the second EPS network.
To increase stability by dampening low-frequency oscillations in real time, this research proposed FKM-based ML models, namely GMDH and LSTM, for two electric power system networks. The efficacy and robustness of the developed FKM-GMDH and FKM-LSTM models in tuning PSS key parameters under various loading conditions for both EPS networks. A comparison with the conventionally adjusted PSS and the GMDH models was also explored to illustrate the competitiveness and the superiority of the FKM-based ML models in terms of eigenvalues and minimum damping ratios. It was observed from the results that the developed models outperformed the conventional PSS and vanilla GMDH models, while they were competitive against the literature-reported approaches. Additionally, the simulated results in the time domain demonstrated the efficacy of the FKM-based ML models, as they stabilize the systems more quickly than the other models. In addition, acceptable values for statistical performance indices, such as MAE, RMSE, R2, and NSc, for the tuning of the PSS parameters for both networks established the effectiveness of the developed ML models with the FKM clustered datasets.
However, to ensure greater robustness and build trust in the developed models, they can be tested in multimachine power system networks and real power system networks. The hardware implementation of the developed methods can also be investigated to ensure their viability. Furthermore, they can also be tested in power system networks with diversified resources, such as renewable generation systems (solar and wind).
Acknowledgement: The author would like to acknowledge the research support provided by the King Fahd University of Petroleum & Minerals (KFUPM), Dhahran, 31261, Saudi Arabia.
Funding Statement: This work was supported by the Deanship of Research at the King Fahd University of Petroleum & Minerals, Dhahran, 31261, Saudi Arabia, under Project No. EC241001.
Availability of Data and Materials: The data and materials that support the findings of this study are available from the author, Md Shafiullah, upon reasonable request.
Ethics Approval: Not applicable.
Conflicts of Interest: The author declares no conflicts of interest.
References
1. Renhai F, Khan W, Aziz A, Yousaf MZ, Zhang W, Cai Z, et al. A deep recurrent neural network-based droop control strategy for frequency stabilization in low-inertia power systems with high renewable energy penetration. Results Eng. 2025;28(1):107443. doi:10.1016/j.rineng.2025.107443. [Google Scholar] [CrossRef]
2. Pathan MI, Al-Muhaini M, Djokic SZ. Optimal reconfiguration and supply restoration of distribution networks with hybrid microgrids. Electr Power Syst Res. 2020;187(3):106458. doi:10.1016/j.epsr.2020.106458. [Google Scholar] [CrossRef]
3. Choi H, Elliott R, Trudnowski D, Venkat D. Transient stability quantification of power systems with inverter-based resources via Koopman operator based machine learning approach. Electr Power Syst Res. 2024;237(6):111035. doi:10.1016/j.epsr.2024.111035. [Google Scholar] [CrossRef]
4. Du W, Su G, Wang H, Ji Y. Dynamic instability of a power system caused by aggregation of induction motor loads. IEEE Trans Power Syst. 2019;34(6):4361–9. doi:10.1109/TPWRS.2019.2920370. [Google Scholar] [CrossRef]
5. Kundur P, Balu EJ, Lauby MG. Power system stability and control. New York, NY, USA: McGraw-Hill; 1994. [Google Scholar]
6. Arowolo O, Stiasny J, Cremer J. Exploring extrapolation of machine learning models for power system time domain simulation. Sustain Energy Grids Netw. 2025;43(5):101908. doi:10.1016/j.segan.2025.101908. [Google Scholar] [CrossRef]
7. Robandi I, Yang NC, Prakasa MA, Muzaki KI, Muchyiddin MI, Djalal MR, et al. Stability improvement of the large-scaled JAMALI power electricity system of Indonesia by using power system stabilizer based on electric Eel foraging optimization. Results Eng. 2025;27(6):105727. doi:10.1016/j.rineng.2025.105727. [Google Scholar] [CrossRef]
8. Ćosić S, Vokony I. Advancements in AI-driven approaches for grid stability monitoring. In: Proceedings of the 2025 10th International Youth Conference on Energy (IYCE); 2025 Aug 5–9; Budapest, Hungary. doi:10.1109/IYCE66046.2025.11155020. [Google Scholar] [CrossRef]
9. Heffron WG, Phillips RA. Effect of a modern amplidyne voltage regulator on underexcited operation of large turbine generators [includes discussion]. Trans Am Inst Electr Eng Part III Power Appar Syst. 1952;71(3):692–7. doi:10.1109/AIEEPAS.1952.4498530. [Google Scholar] [CrossRef]
10. Dandeno PL, Karas AN, McClymont KR, Watson W. Effect of high-speed rectifier excitation systems on generator stability limits. IEEE Trans Power Appar Syst. 1968;PAS-87(1):190–201. doi:10.1109/TPAS.1968.292271. [Google Scholar] [CrossRef]
11. Demello FP, Concordia C. Concepts of synchronous machine stability as affected by excitation control. IEEE Trans Power Appar Syst. 1969;PAS-88(4):316–29. doi:10.1109/TPAS.1969.292452. [Google Scholar] [CrossRef]
12. Shafiullah M. The FCM-guided deep learning model for low-frequency oscillation damping for electric power networks. Neural Comput Appl. 2025;37(1):105–21. doi:10.1007/s00521-024-10377-x. [Google Scholar] [CrossRef]
13. Prasad D, Mukherjee V. A novel symbiotic organisms search algorithm for optimal power flow of power system with FACTS devices. Eng Sci Technol Int J. 2016;19(1):79–89. doi:10.1016/j.jestch.2015.06.005. [Google Scholar] [CrossRef]
14. Yu Y, Grijalva S, Thomas JJ, Xiong L, Ju P, Min Y. Oscillation energy analysis of inter-area low-frequency oscillations in power systems. IEEE Trans Power Syst. 2016;31(2):1195–203. doi:10.1109/TPWRS.2015.2414175. [Google Scholar] [CrossRef]
15. do Nascimento S, Gouvêa MM. Voltage stability enhancement in power systems with automatic facts device allocation. Energy Proc. 2017;107(7):60–7. doi:10.1016/j.egypro.2016.12.129. [Google Scholar] [CrossRef]
16. Ingole DA, Gohokar PDVN. Voltage stability improvement in multi-bus system using static synchronous series compensator. Energy Proc. 2017;117(1):999–1006. doi:10.1016/j.egypro.2017.05.221. [Google Scholar] [CrossRef]
17. Ranjan S, Latif A, Das DC, Sinha N, Suhail Hussain SM, Ustun TS, et al. Simultaneous analysis of frequency and voltage control of the interconnected hybrid power system in presence of FACTS devices and demand response scheme. Energy Rep. 2021;7(2):7445–59. doi:10.1016/j.egyr.2021.10.100. [Google Scholar] [CrossRef]
18. Yakout AH, Sabry W, Abdelaziz AY, Hasanien HM, AboRas KM, Kotb H. Enhancement of frequency stability of power systems integrated with wind energy using marine predator algorithm based PIDA controlled STATCOM. Alex Eng J. 2022;61(8):5851–67. doi:10.1016/j.aej.2021.11.011. [Google Scholar] [CrossRef]
19. Rudnik VE, Ufa RA, Malkova YY. Analysis of low-frequency oscillation in power system with renewable energy sources. Energy Rep. 2022;8(6):394–405. doi:10.1016/j.egyr.2022.07.022. [Google Scholar] [CrossRef]
20. Elgamal ME, Lotfy A, Ali GEM. Voltage profile enhancement by fuzzy controlled MLI UPFC. Int J Electr Power Energy Syst. 2012;34(1):10–8. doi:10.1016/j.ijepes.2011.08.001. [Google Scholar] [CrossRef]
21. Wartana IM, Agustini NP. Optimal placement of UPFC for maximizing system loadability and minimizing active power losses in system stability margins by NSGA-II. In: Proceedings of the 2011 International Conference on Electrical Engineering and Informatics; 2011 Jul 17–19; Bandung, Indonesia. doi:10.1109/ICEEI.2011.6021665. [Google Scholar] [CrossRef]
22. Hassan LH, Moghavvemi M, Almurib HAF. Modeling UPFC into multi-machine power systems. Arab J Sci Eng. 2012;37(6):1613–24. doi:10.1007/s13369-012-0273-7. [Google Scholar] [CrossRef]
23. Khodabakhshian A, Esmaili MR, Bornapour M. Optimal coordinated design of UPFC and PSS for improving power system performance by using multi-objective water cycle algorithm. Int J Electr Power Energy Syst. 2016;83:124–33. doi:10.1016/j.ijepes.2016.03.052. [Google Scholar] [CrossRef]
24. Hassan LH, Moghavvemi M, Almurib HAF, Muttaqi KM. A coordinated design of PSSs and UPFC-based stabilizer using genetic algorithm. IEEE Trans Ind Appl. 2014;50(5):2957–66. doi:10.1109/TIA.2014.2305797. [Google Scholar] [CrossRef]
25. Shafiullah M, Rana MJ, Coelho LS, Abido MA. Power system stability enhancement by designing optimal PSS employing backtracking search algorithm. In: Proceedings of the 2017 6th International Conference on Clean Electrical Power (ICCEP); 2017 Jun 27–29; Santa Margherita Ligure, Italy. p. 712–9. doi:10.1109/ICCEP.2017.8004769. [Google Scholar] [CrossRef]
26. Shahriar MS, Shafiullah M, Asif MA, Hasan MM, Rafiuzzaman M. Design of multi-objective UPFC employing backtracking search algorithm for enhancement of power system stability. In: Proceedings of the 2015 18th International Conference on Computer and Information Technology (ICCIT); 2015 Dec 21–23; Dhaka, Bangladesh. p. 323–8. doi:10.1109/ICCITechn.2015.7488090. [Google Scholar] [CrossRef]
27. Abido MA, Al-awami AT, Abdel-magid YL. Analysis and design of UPFC damping stabilizers for power system stability enhancement. In: Proceedings of the 2006 IEEE International Symposium on Industrial Electronics; 2006 Jul 9–13; Montreal, QC, Canada. p. 2040–5. doi:10.1109/ISIE.2006.295887. [Google Scholar] [CrossRef]
28. Vanitila R, Sudhakaran M. Differential evolution algorithm based weighted additive FGA approach for optimal power flow using muti-type FACTS devices. In: Proceedings of the 2012 International Conference on Emerging Trends in Electrical Engineering and Energy Management (ICETEEEM); 2012 Dec 13–15; Chennai, India. p. 198–204. doi:10.1109/ICETEEEM.2012.6494459. [Google Scholar] [CrossRef]
29. Abd-Elazim SM, Ali ES. Power system stability enhancement via bacteria foraging optimization algorithm. Arab J Sci Eng. 2013;38(3):599–611. doi:10.1007/s13369-012-0423-y. [Google Scholar] [CrossRef]
30. Theja BS, Rajasekhar A, Kothari DP, Das S. Design of PID controller based power system stabilizer using modified Philip-Heffron’s model: an artificial bee colony approach. In: Proceedings of the 2013 IEEE Symposium on Swarm Intelligence (SIS); 2013 Apr 16–19; Singapore. p. 228–34. doi:10.1109/SIS.2013.6615183. [Google Scholar] [CrossRef]
31. Sambariya DK, Prasad R. Design of robust PID power system stabilizer for multimachine power system using HS algorithm. Am J Electr Electron Eng. 2015;3(3):75–82. doi:10.12691/ajeee-3-3-3. [Google Scholar] [CrossRef]
32. Sambariya DK, Prasad R. Design of optimal proportional integral derivative based power system stabilizer using bat algorithm. Appl Comput Intell Soft Comput. 2016;2016(3):8546108. doi:10.1155/2016/8546108. [Google Scholar] [CrossRef]
33. Bayu ES, Khan B, Ali ZM, Alaas ZM, Mahela OP. Mitigation of low-frequency oscillation in power systems through optimal design of power system stabilizer employing ALO. Energies. 2022;15(10):3809. doi:10.3390/en15103809. [Google Scholar] [CrossRef]
34. Usman J, Mustafa MW, Aliyu G, Musa BU. Coordinated AVR-PSS for transient stability using modified particle swarm optimization. J Teknologi. 2014;67(3):9–16. doi:10.11113/jt.v67.2758. [Google Scholar] [CrossRef]
35. Sambariya DK, Prasad R. Robust tuning of power system stabilizer for small signal stability enhancement using metaheuristic bat algorithm. Int J Electr Power Energy Syst. 2014;61:229–38. doi:10.1016/j.ijepes.2014.03.050. [Google Scholar] [CrossRef]
36. Sabo A, Wahab NIA, Othman ML, Mohd Jaffar MZAB, Acikgoz H, Nafisi H, et al. Artificial intelligence-based power system stabilizers for frequency stability enhancement in multi-machine power systems. IEEE Access. 2021;9:166095–116. doi:10.1109/ACCESS.2021.3133285. [Google Scholar] [CrossRef]
37. Shahriar MS, Shafiullah M, Pathan MIH, Sha’aban YA, Bouchekara HREH, Ramli MAM, et al. Stability improvement of the PSS-connected power system network with ensemble machine learning tool. Energy Rep. 2022;8(1):11122–38. doi:10.1016/j.egyr.2022.08.225. [Google Scholar] [CrossRef]
38. Wang Y, Ma J, Gao N, Wen Q, Sun L, Guo H. Federated fuzzy k-means for privacy-preserving behavior analysis in smart grids. Appl Energy. 2023;331(2):120396. doi:10.1016/j.apenergy.2022.120396. [Google Scholar] [CrossRef]
39. Zhao X, Nie F, Wang R, Li X. Robust fuzzy K-means clustering with shrunk patterns learning. IEEE Trans Knowl Data Eng. 2023;35(3):3001–13. doi:10.1109/TKDE.2021.3116257. [Google Scholar] [CrossRef]
40. Shafiullah M, Rana MJ, Shahriar MS, Al-Sulaiman FA, Ahmed SD, Ali A. Extreme learning machine for real-time damping of LFO in power system networks. Electr Eng. 2021;103(1):279–92. doi:10.1007/s00202-020-01075-7. [Google Scholar] [CrossRef]
41. Rana MJ, Shahriar MS, Shafiullah M. Levenberg-Marquardt neural network to estimate UPFC-coordinated PSS parameters to enhance power system stability. Neural Comput Appl. 2019;31(4):1237–48. doi:10.1007/s00521-017-3156-8. [Google Scholar] [CrossRef]
42. Shahriar MS, Shafiullah M, Rana MJ, Ali A, Ahmed A, Rahman SM. Neurogenetic approach for real-time damping of low-frequency oscillations in electric networks. Comput Electr Eng. 2020;83:106600. doi:10.1016/j.compeleceng.2020.106600. [Google Scholar] [CrossRef]
43. Shafiullah M, Rana MJ, Shahriar MS, Zahir MH. Low-frequency oscillation damping in the electric network through the optimal design of UPFC coordinated PSS employing MGGP. Measurement. 2019;138:118–31. doi:10.1016/j.measurement.2019.02.026. [Google Scholar] [CrossRef]
44. Pathan MIH, Rana MJ, Shahriar MS, Shafiullah M, Zahir MH, Ali A. Real-time LFO damping enhancement in electric networks employing PSO optimized ANFIS. Inventions. 2020;5(4):61. doi:10.3390/inventions5040061. [Google Scholar] [CrossRef]
45. Mirjalili S, Mirjalili SM, Lewis A. Grey wolf optimizer. Adv Eng Softw. 2014;69:46–61. doi:10.1016/j.advengsoft.2013.12.007. [Google Scholar] [CrossRef]
46. Škrlj B, Kralj J, Lavrač N. Embedding-based silhouette community detection. Mach Learn. 2020;109(11):2161–93. doi:10.1007/s10994-020-05882-8. [Google Scholar] [PubMed] [CrossRef]
47. Okereke GE, Bali MC, Okwueze CN, Ukekwe EC, Echezona SC, Ugwu CI. K-means clustering of electricity consumers using time-domain features from smart meter data. J Electr Syst Inf Technol. 2023;10(1):2. doi:10.1186/s43067-023-00068-3. [Google Scholar] [CrossRef]
48. Grigoras G, Livadariu B, Neagu BC. Data clustering-driven fuzzy inference system-based optimal power flow analysis in electric networks integrating wind energy. Processes. 2025;13(3):676. doi:10.3390/pr13030676. [Google Scholar] [CrossRef]
49. Chintalapati NL, Kapavarapu YS, Akasapu YR, Kokku OP, Gampa SR, Boni RK, et al. K-means algorithm and fuzzy genetic algorithm based methodology for distribution system planning with distributed generations and shunt capacitors. In: Proceedings of the 2024 IEEE International Conference on Smart Power Control and Renewable Energy (ICSPCRE); 2024 Jul 19–21; Rourkela, India. doi:10.1109/ICSPCRE62303.2024.10675186. [Google Scholar] [CrossRef]
50. Lithio A, Maitra R. An efficient k-means-type algorithm for clustering datasets with incomplete records. Stat Anal Data Min ASA Data Sci J. 2018;11(6):296–311. doi:10.1002/sam.11392. [Google Scholar] [CrossRef]
51. Madhavan S, Jones MT. Deep learning architectures: The rise of artificial intelligence. Armonk, NY, USA: IBM Developer. 2024 [cited 2025 Jan 1]. Available from: https://developer.ibm.com/articles/cc-machine-learning-deep-learning-architectures/. [Google Scholar]
52. Al-Selwi SM, Hassan MF, Abdulkadir SJ, Muneer A, Sumiea EH, Alqushaibi A, et al. RNN-LSTM: from applications to modeling techniques and beyond—systematic review. J King Saud Univ Comput Inf Sci. 2024;36(5):102068. doi:10.1016/j.jksuci.2024.102068. [Google Scholar] [CrossRef]
53. Shah SM, Selvamani M, Ramakrishna MT, Khan SB, Basheer S, Al Malwi W, et al. Bidirectional LSTM-based energy consumption forecasting: advancing AI-driven cloud integration for cognitive city energy management. Comput Mater Contin. 2025;83(2):2907–26. doi:10.32604/cmc.2025.063809. [Google Scholar] [CrossRef]
54. Gers FA, Schraudolph NN, Schmidhuber J. Learning precise timing with LSTM recurrent networks. J Mach Learn Res. 2002;3(5):115–43. doi:10.1162/153244303768966139. [Google Scholar] [CrossRef]
55. Duch W, Kacprzyk J, Oja E, Zadrożny S. Artificial neural networks: formal models and their applications—ICANN 2005. Berlin/Heidelberg, Germany: Springer; 2005. doi:10.1007/11550907. [Google Scholar] [CrossRef]
56. Abbass MJ, Lis R, Rebizant W. A predictive model using long short-time memory (LSTM) technique for power system voltage stability. Appl Sci. 2024;14(16):7279. doi:10.3390/app14167279. [Google Scholar] [CrossRef]
57. Tulensalo J, Seppänen J, Ilin A. An LSTM model for power grid loss prediction. Electr Power Syst Res. 2020;189(Feb):106823. doi:10.1016/j.epsr.2020.106823. [Google Scholar] [CrossRef]
58. Shao Z, Wang Q, Cao Y, Cai D, You Y, Lu R. A novel data-driven LSTM-SAF model for power systems transient stability assessment. IEEE Trans Ind Inform. 2024;20(7):9083–97. doi:10.1109/TII.2024.3379629. [Google Scholar] [CrossRef]
59. Wang Y, Zhu S, Li C. Research on multistep time series prediction based on LSTM. In: Proceedings of the 2019 3rd International Conference on Electronic Information Technology and Computer Engineering (EITCE); 2019 Oct 18–20; Xiamen, China. p. 1155–9. doi:10.1109/EITCE47263.2019.9095044. [Google Scholar] [CrossRef]
60. Farlow SJ. The GMDH algorithm of ivakhnenko. Am Stat. 1981;35(4):210–5. doi:10.1080/00031305.1981.10479358. [Google Scholar] [CrossRef]
61. Ivakhnenko AG. Self-organizing methods in modelling and clustering: GMDH type algorithms. In: Systems analysis and simulation I. New York, NY, USA: Springer US; 1988. p. 86–8. doi:10.1007/978-1-4684-6389-7_15. [Google Scholar] [CrossRef]
62. Amiri M, Soleimani S. ML-based group method of data handling: an improvement on the conventional GMDH. Complex Intell Syst. 2021;7(6):2949–60. doi:10.1007/s40747-021-00480-0. [Google Scholar] [CrossRef]
63. Najafzadeh M, Barani GA, Hessami-Kermani MR. Evaluation of GMDH networks for prediction of local scour depth at bridge abutments in coarse sediments with thinly armored beds. Ocean Eng. 2015;104(10):387–96. doi:10.1016/j.oceaneng.2015.05.016. [Google Scholar] [CrossRef]
Cite This Article
 Copyright © 2026 The Author(s). Published by Tech Science Press.
This work is licensed under a Creative Commons Attribution 4.0 International License , which permits unrestricted use, distribution, and reproduction in any medium, provided the original work is properly cited.
 Downloads
 Citation Tools