
 Submit a Paper
 Propose a Special lssue
 Open Access
ARTICLE

Anomaly-Aware Peripheral Blood Smear Analysis via Hybrid Detection and One-Class Learning
School of Computer Science and Engineering, Department of Analytics, Vellore Institute of Technology, Vellore, Tamil Nadu, India
* Corresponding Author: Rajakumar Krishnan. Email:
(This article belongs to the Special Issue: Advanced Image Segmentation and Object Detection: Innovations, Challenges, and Applications)
Computer Modeling in Engineering & Sciences 2026, 147(3), 42 https://doi.org/10.32604/cmes.2026.079104
Received 14 January 2026; Accepted 18 March 2026; Issue published 30 June 2026
 View Full Text
 Download PDF
Abstract
Background: Examining peripheral blood smears is a vital diagnostic tool in hematology. Although deep learning-based automated systems have improved the accuracy of blood cell detection, most current methods depend on fully supervised learning and need extensive annotations to identify unusual cell shapes. Clinical practice often lacks these complete annotations, limiting the ability to generalize to rare or unseen abnormalities. To address this issue of incomplete annotated data, this paper introduces a hybrid framework that recognizes anomalies for reliable and clear analysis of peripheral blood smears. Methods: The proposed framework combines supervised blood cell detection with unsupervised one-class anomaly detection. We use a YOLOv8 detector to accurately identify and categorize red blood cells, white blood cells, and platelets in peripheral blood smear images. The detected blood cells are then assessed further using a lightweight Cell Reconstruction Autoencoder, which is trained only on normal-looking cells. To enhance sensitivity to minor variations in the model’s construction, we also introduce a Wasserstein-based method for latent distribution regularization. This method scores anomalies based on how well the reconstruction matches and the deviation in the latent space, without needing any abnormal training samples. Results: We evaluate detection performance on the TXL-PBC dataset and validate it externally with pathological samples from the ASH Image Bank. The results show high accuracy in detecting abnormalities and in distinguishing normal from abnormal cells (F1-Score/Anomaly = 0.926; AUC = 0.963). Our experiments and statistics confirm that using the hybrid approach with Wasserstein regularization significantly improves sensitivity and robustness compared to individual or reconstruction model-based detection methods. Conclusions: The hybrid YOLOv8-Cell Reconstruction Autoencoder framework accurately identifies cells and detects previously unseen morphological abnormalities within a one-class learning framework. This approach combines efficiency with anomaly awareness and clear clinical interpretation, making it suitable for practical and scalable analysis of peripheral blood smears in clinical settings.Graphic Abstract
Keywords
The analysis of a peripheral blood smear (PBS) is a crucial diagnostic technique for assessing and evaluating hematological conditions, infections, and cell morphology. However, the conventional approach to PBS analysis is a labor-intensive and time-consuming process that relies on microscopic examination. Moreover, it also suffers from several limitations and inaccuracies that result from variations in lighting conditions and the expertise of the person performing the task [1,2].
The advent of artificial intelligence (AI) techniques and their integration into the field of PBS analysis have been extremely beneficial. The use of deep learning techniques and models, particularly Convolutional neural networks (CNNs) and transformer-based models, has been found to be extremely effective in the detection and classification of blood cells from microscopic images [3,4]. Single-stage object detectors from the YOLO family have emerged as the dominant candidates among these methods due to their combination of real-time inference capability and high localization accuracy, making them eligible for deployment in clinics [5,6].
Nevertheless, most current PBS analysis systems are built around the concept of fully supervised learning, and not only do they need large, comprehensively annotated datasets that include various pathological morphologies, but also are highly dependent on such datasets for their clinical performance [7]. In reality, it is very hard to collect such datasets in clinical settings, especially for rare or previously unidentified abnormalities. Thus, it is not uncommon for supervised detectors to have poor generalization capability beyond the morphologies presented in the training data [8–10].
Unsupervised anomaly detection provides a different approach by first modeling normal cell morphology and then spotting abnormality without giving them explicit labels. Autoencoder-based techniques are one of the most potent in representing normal cells in an encoded form and then identifying the anomalies based on the reconstruction error [11,12]. However, it is observed that the application of AI models and techniques to the field of PBS analysis does not result in accurate spatial localization.
To overcome these limitations, this study proposes a hybrid framework to analyze PBS, which incorporates both supervised blood cell detection and unsupervised one-class anomaly detection. The study uses a YOLOv8 algorithm to identify and classify red blood cells, white blood cells, and platelets. The study also incorporates a lightweight cell reconstruction autoencoder to identify abnormal cell patterns. To improve the sensitivity to slight and unseen variations in cell morphology without compromising training stability and efficiency, a Wasserstein-based latent distribution regularization method is incorporated. The main contributions of this study lie in its ability to go beyond the combination of existing components and to formulate a hybrid learning objective to guide unsupervised one-class anomaly screening in PBS. The contributions of this study are:
(i) The formal definition of a joint anomaly scoring function that combines reconstruction and Mahalanobis distance-based latent space deviation under Wasserstein regularization-based embedding constraints;
(ii) The formulation of a validation-based three-sigma thresholding technique that minimizes false positives during anomaly screening in PBS;
(iii) The development of a localization anomaly consistency (LAC) metric that aims to capture the relationship between supervised localization and unsupervised anomaly detection.
Unlike previous studies that integrated detection and reconstruction-based components sequentially and in a modular fashion, the proposed formulation considers the distribution compactness in the latent space and incorporates it into the final decision function.
The automated analysis of peripheral blood smear (PBS) has been heavily researched to meet the future requirements for hematological diagnostics that are scalable, objective, and high-throughput. The existing studies can be generally classified into three types: supervised detection of blood cells, unsupervised anomaly detection, and the new hybrid of detection-anomaly frameworks.
2.1 Supervised Blood Cell Detection
Automatic blood smear (PBS) was initially done by manually defining the features and using conventional classifiers, which greatly affected their robustness and generalization. A new era of deep learning opened the door for end-to-end learning of features, which consequently led to a major boost in detection accuracy and reliability [1–3]. In the current object detection frameworks, the YOLO-based family of architectures has emerged as the most popular ones because of their ability to perform real-time inference and strong localization performance [5,6,13]. These detectors have already been used in white blood cell counting [8], microscopy with smartphone-assisted [10,14], and blood cell detection and related localization tasks [9,15–17].
The latest modifications of the system that made use of attention mechanisms and transformer-based modules again produced better morphological discrimination and classification robustness [18–20]. The supervised detectors, nevertheless, are always going to be limited by the size and the variety of annotated abnormal samples. As a result, their power to generalize to the rare or new morphological abnormalities is thus very restricted [21–23].
2.2 Unsupervised Anomaly Detection
Methods for unsupervised anomaly detection have turned out to be a good option in cases where abnormal samples are scarce or simply not available. Models based on autoencoders learn normal cell morphologies in a compact way and identify deviations by means of reconstruction error, that is, they follow a one-class learning paradigm. In blood cell imaging, convolutional autoencoders have been applied to find abnormal white blood cells and leukemias related to the latter [11,24] as well as to support hybrid diagnostic processes [12].
Apart from PBS analysis, reconstruction-based anomaly detection has proved to be successful in different medical and industrial fields where anomalies are rare or extremely variable [25]. There are even more methods devoted to the augmentation of representation robustness, such as synthetic data generation and contrastive representation learning. Nevertheless, most of the unsupervised methods are implemented on cropped cell images or coarse patches and do not provide reliable spatial localization when applied to full-resolution PBS images, which in turn restricts their clinical interpretability.
2.3 Hybrid Detection–Anomaly Frameworks
The gap between accurate spatial localization and reliable abnormality detection has motivated the development of hybrid frameworks that integrate supervised object detection with unsupervised representation learning. These hybrid models are able to detect unusual patterns as well as identify important structures simultaneously. They have shown their effectiveness in medical image analysis and industrial inspection tasks [26,27]. For example, YOLO-based detector-hybrid models with autoencoder-based anomaly models have been explored in multimodal disease diagnosis and understanding dynamic scenes [28]. The hybrid models have shown their effectiveness in microscopy and microbiological tasks, particularly in tasks that require efficiency, speed, and ease of use [29].
Despite the significant advancements in object detection tasks, there is still a significant gap in the analysis of PBS (peripheral blood smear) images. Most of the models that have been proposed in this area are either supervised or unsupervised. The supervised models require annotations for all cell types, whereas the unsupervised models lack precise cell localization.
In addition, segmentation-based approaches have gained popularity for accurately capturing the morphology of individual cells by explicitly modeling their boundaries at the pixel level [26,29]. In this regard, various encoder-decoder models have shown promising results in densely populated smear images and in the presence of overlapping cells while accurately refining the boundary representation of individual cells. However, these approaches often require extensive annotation of individual cells and may also have high computational overheads [29].
In this context, the proposed YOLOv8-CRA framework does not intend to replace existing approaches that focus on segmentation and boundary representation but rather aims to accurately perform the initial screening and localization of individual cells while being efficient and also being able to accurately identify anomalies within these cells while providing reliable results that can later be further analyzed using segmentation-based approaches in subsequent stages of the analysis pipeline.
2.4 Research Gaps and Objectives of the Proposed System
A look into the currently available literature reveals that there are several issues that need to be addressed in the field of automated PBS analysis. They include:
• Limited Generalization: Supervised learning-based detection models face difficulties in recognizing rare abnormal shapes that have not been previously encountered.
• Lack of Localization in Anomaly Detection: Unsupervised learning-based models that utilize autoencoders do not allow precise localization of abnormalities in whole images of smears.
• Fragmented Pipelines: The hybrid models that have been developed in recent times do not have a comprehensive framework that is optimized to perform in real-time.
• Clinical Interpretability and Efficiency: The majority of models are unable to provide the diagnostic interpretability together with the computational efficiency that laboratory workflows require.
The proposed YOLOv8–CRA framework’s objectives are motivated by these gaps:
• To combine real-time blood cell detection and high precision which can localize RBCs, WBCs, and platelets in PBS images using a lightweight YOLOv8 architecture.
• To create a one-class Cell Reconstruction Autoencoder trained only on morphologically normal cells that can effectively detect unseen and rare abnormalities.
• To apply Wasserstein-based latent distribution regularization to improve anomaly sensitivity while having stable and efficient training.
• To establish a single, anomaly-aware PBS analysis pipeline that offers cell-level localization, abnormality detection, and clinical interpretability.
The objectives will fulfil the identified research gaps and create a basis for the new hybrid framework proposed later on.
The TXL-PBC dataset [23] is used for training and evaluating the proposed hybrid framework. TXL-PBC is a curated and re-annotated peripheral blood cell dataset formed by integrating four public resources (BCCD, BDDC, PBC, and Raabin-WBC). It contains 1260 microscopy images with 18,143 annotated bounding boxes across three cell categories: red blood cells (RBCs), white blood cells (WBCs), and platelets (PLs), provided in YOLO annotation format. Following the official TXL-PBC split protocol, we use 1008 images for training, 144 for validation, and 108 for testing (Table 1). The official TXL-PBC split protocol is adopted to ensure comparability with prior studies using this dataset; cross-validation was not employed to preserve a held-out test set for unbiased evaluation.

Each microscopy image is depicted as a tensor
where
To improve robustness, data augmentation (horizontal/vertical flips, rotation, and color jitter) is applied only to the training set during YOLOv8 training. The TXL-PBC train/validation/test splits, denoted as
Fig. 1 demonstrates examples of TXL-PBC with annotated bounding boxes; Table 1 shows statistics on the TXL-PBC dataset.

Figure 1: Representative TXL-PBC samples annotated with bounding boxes depicting RBCs, WBCs, and platelets.
The annotated TXL-PBC samples are used to train YOLOv8 for the supervised detection and classification of normal blood cells, while the Cell Reconstruction Autoencoder (CRA) model is used for unsupervised detection of abnormal cell types. The model for the Cell Reconstruction Autoencoder (CRA) is trained solely on the cropped regions of normal blood cells that were detected during training. The set of instances of these cropped normal blood cells will be denoted as
where
Since TXL-PBC does not provide abnormal-cell annotations, abnormality detection is evaluated without abnormal training samples. During inference, anomalies are identified as deviations from the learned reconstruction of normal cells.
To evaluate the performance of the aforementioned method, 158 pathological images were obtained from the ASH Image Bank [30] (comprised of 52 red blood cell (RBC), 63 white blood cell (WBC) and 43 platelet abnormalities). Only high-quality (
The selected pathological image samples (ASH Image Bank) were reviewed independently by two pathologists and confirmed by a senior laboratory technician to verify the presence and type of visible abnormalities. Ground-truth anomaly labels for external validation are defined at the cell level based on expert confirmation of visible abnormal morphology in the cropped instances. This expert review was performed only on publicly available, de-identified images, and no patient-identifiable information, private clinical records, or direct patient data were accessed. Inter-reviewer agreement was calculated using Cohen’s Kappa method, with a result of
It is acknowledged that TXL-PBC and ASH Image Bank samples originate from different sources and may exhibit variations in staining protocols, imaging equipment, and acquisition conditions. However, this cross-dataset evaluation is intentionally adopted to assess the robustness of the proposed one-class anomaly detection framework under realistic deployment conditions, where test-time samples often differ from training distributions. Importantly, no ASH samples are used during training, parameter tuning, or threshold estimation, thereby preventing any form of data leakage. All anomaly decisions are made exclusively based on deviations from the learned normal-cell manifold derived from TXL-PBC.
4 Proposed Anomaly-Aware Learning Framework
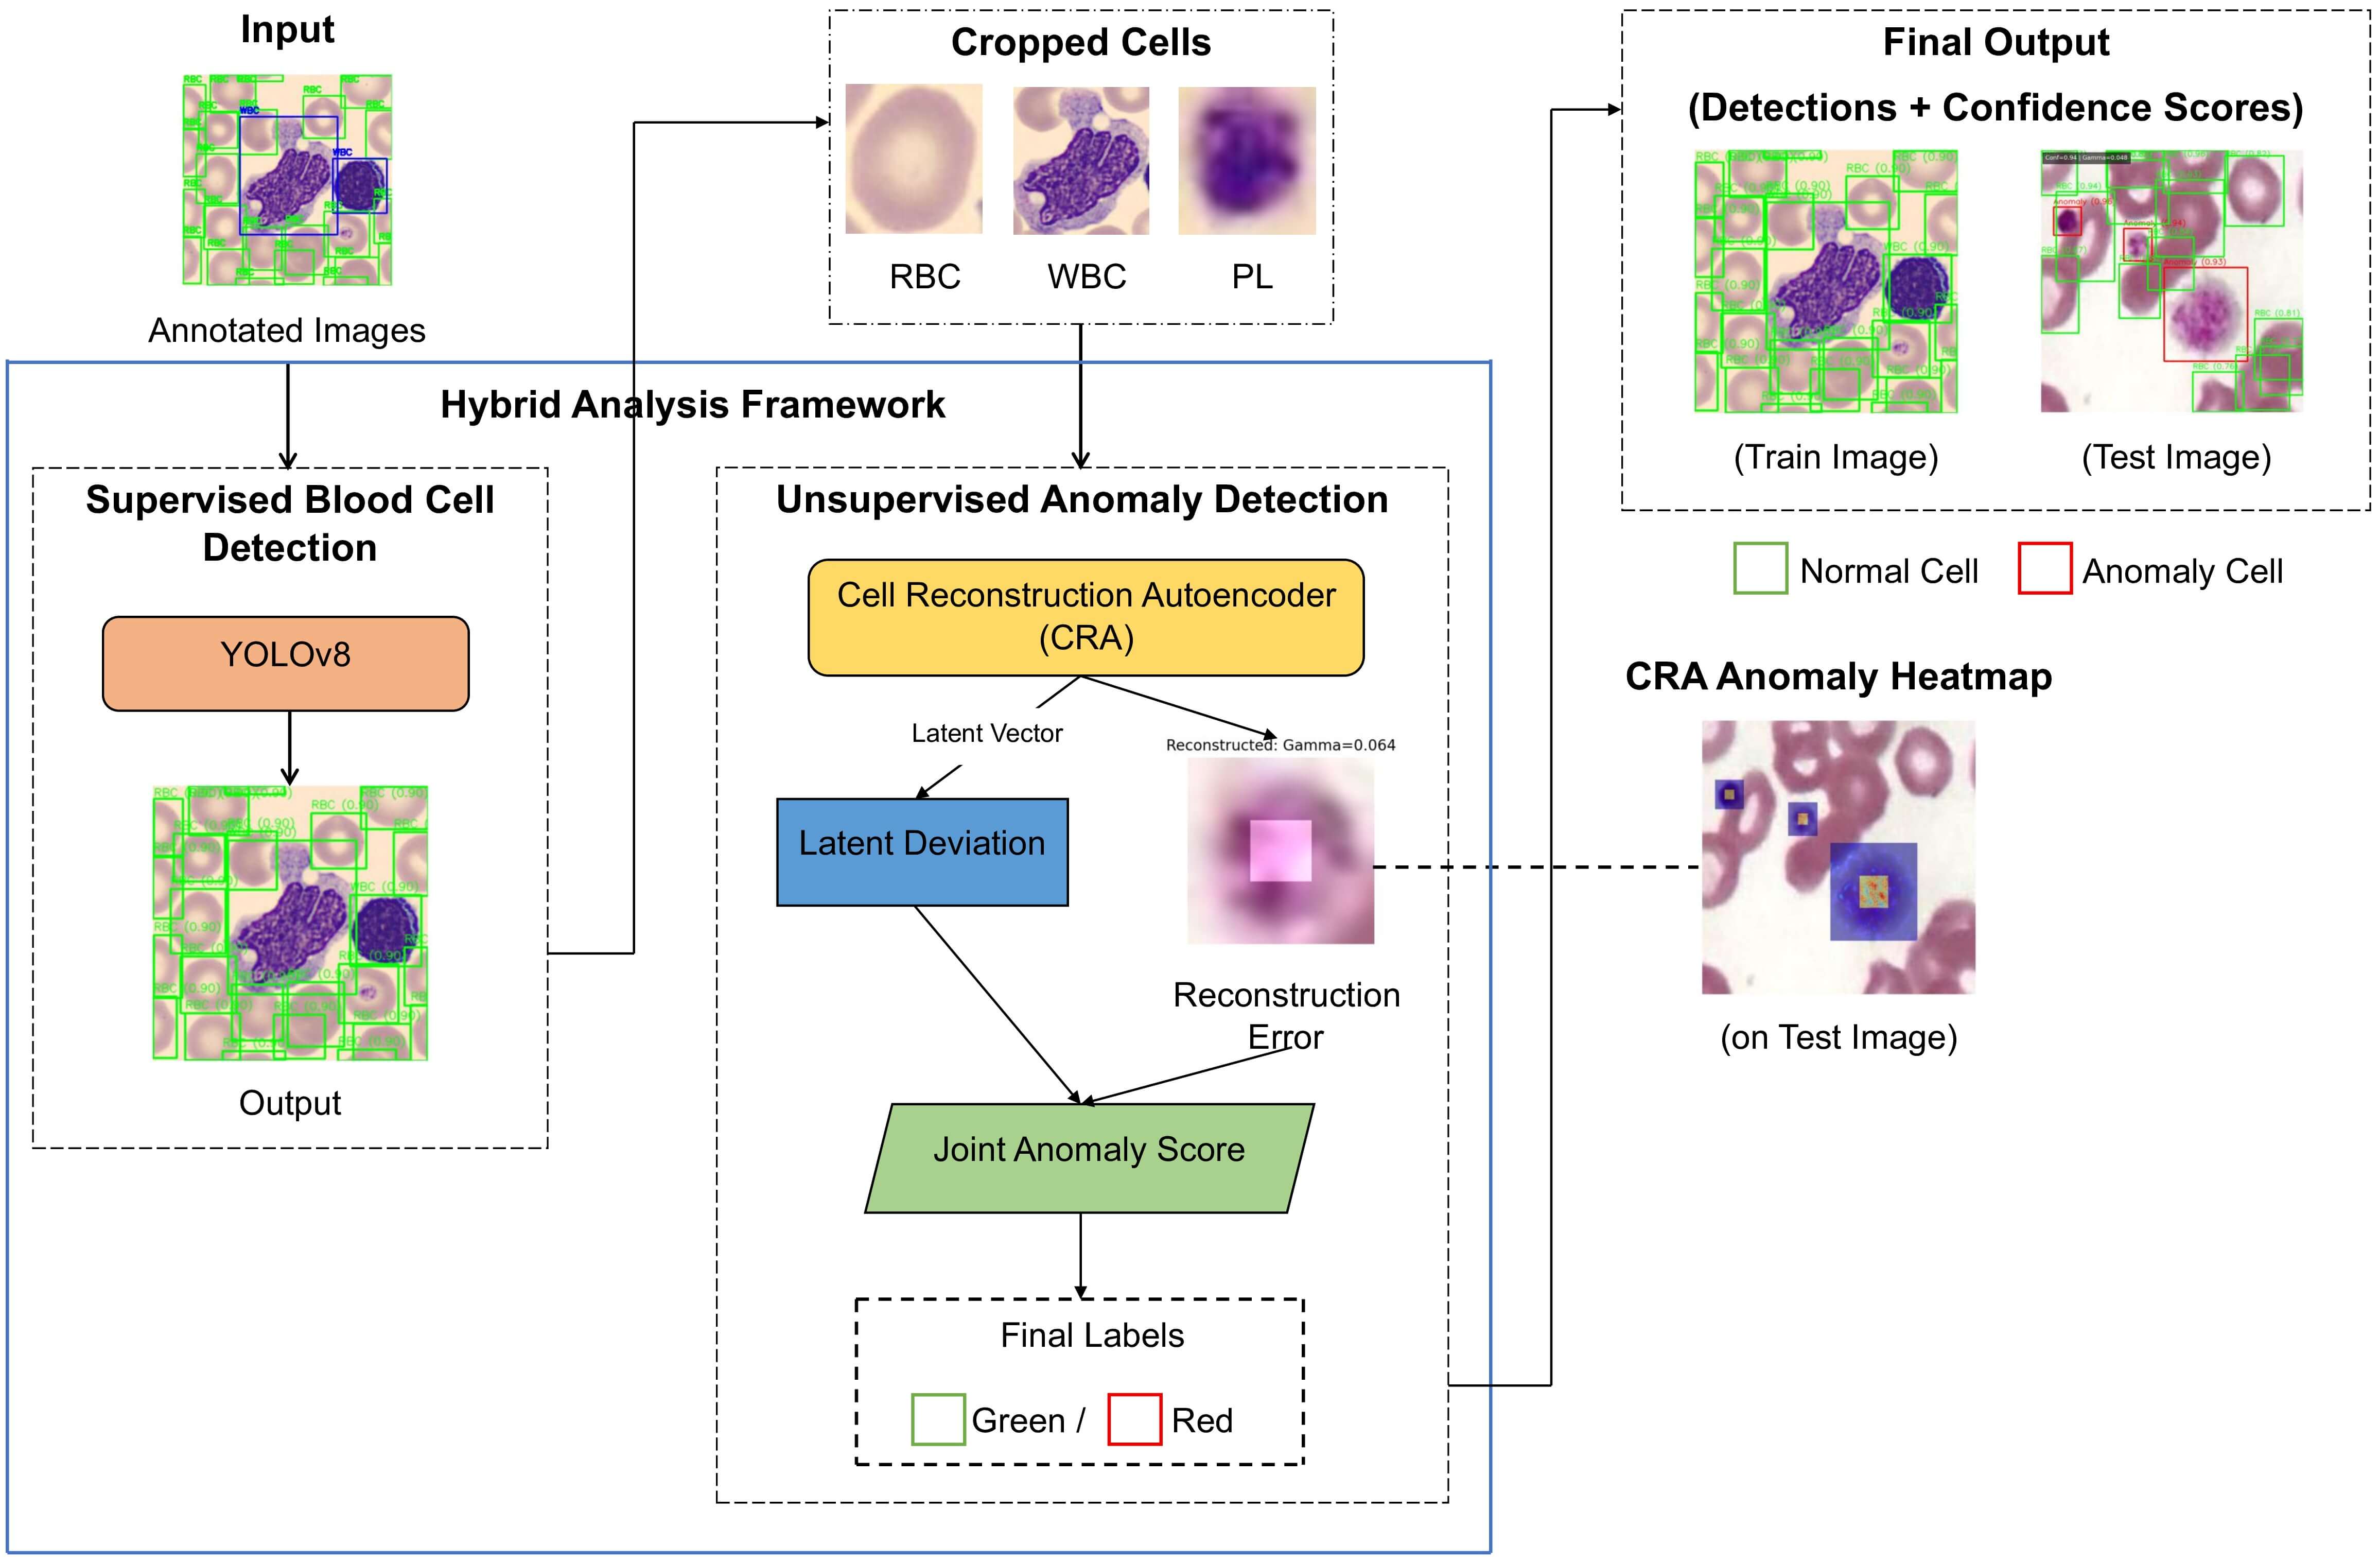
The proposed method combines supervised methods for detecting blood cells and unsupervised methods for recognizing anomalies, to enable complete analysis of a PBS using a single, unified pipeline, where known blood cell types can be accurately localized, but, at the same time, morphologically abnormal or previously unseen types of cells can be found reliably. A schematic overview of the whole process from detection to reconstruction to the final analysis can be seen in Fig. 2.

Figure 2: General architecture of anomaly-aware YOLOv8–CRA framework suggested for the peripheral blood smear analysis.
4.1 Hybrid Detection and Anomaly Pipeline
Let
where,
For every blood cell detected, the region around that cell is cropped to create an image patch (
The computation of Reconstruction Error is:
where the first term of the equation captures pixel-level deviations while enforcing variance within a structure.
To improve sensitivity beyond reconstruction fidelity, we apply a distribution-level latent regularization that aligns the aggregated posterior of encoded normal cells with a unit Gaussian prior. Specifically, for a mini-batch of latent codes
The final anomaly score for each detected cell is computed as:
where
The latent deviation
An anomaly threshold
4.2 YOLOv8-Based Blood Cell Detection
To accurately identify and classify RBC, WBC, and platelets, we use the framework that utilizes the YOLOv8 object detection network as a detection strategy. The YOLOv8 Object Detection Network uses a CSPDarknet Backbone Network with several Feature Extraction Modules called C2f modules, a path aggregation network-feature pyramid networks (PAN-FPN)-which combines multi-scales of feature sets, and a decoupled (anchor-free) detection head. The overall architecture used for YOLOv8 is depicted in Fig. 3.

Figure 3: YOLOv8 architecture for blood cell detection implementation.
4.3 Cell Reconstruction Autoencoder
The Cell Reconstruction Autoencoder (CRA) is designed under a one-class learning paradigm and is trained exclusively on morphologically normal blood cell instances. Its objective is to learn a compact and distribution-aware representation of normal cellular morphology, such that deviations from this learned manifold can be reliably identified as anomalies.
Each detected blood cell is cropped and resized to
4.3.1 Architecture Specification
The CRA-proposed model has an architecture that is simple and symmetric in terms of depth in both its encoder and decoder networks. The model has been thoroughly described to allow reproducibility. The overall framework of this model is shown in Fig. 4.

Figure 4: Wasserstein-regularized cell reconstruction autoencoder architecture.
Encoder: The model has an encoder that has been designed with four blocks of convolutional layers with depth that is progressively increased in each subsequent block:
• Block 1:
• Block 2:
• Block 3:
• Block 4:
The global average pooling layer processes the final feature map, followed by a dense layer that outputs the latent embedding
Decoder: The decoder has an identical architecture to that of the encoder. Take the latent vector
4.3.2 Latent Space Design and Regularization
The dimensionality of the latent space
To increase the sensitivity to small variations in morphology, a regularization of the aggregated posterior distribution in the latent space is performed via a Wasserstein regularization. The aggregated posterior distribution
The CRA is optimized using the composite loss:
where the Wasserstein term is computed using batch-wise Gaussian statistics:
Let the empirical mean and covariance of the latent representations for normal cell crops be
The choice of using Wasserstein distance rather than other options like Kullback-Leibler divergence, Jensen-Shannon divergence, and maximum mean discrepancy is motivated by stability and sensitivity. Unlike KL-based methods, which can be ill-defined or overly sensitive when the latent distributions have low overlap, the Wasserstein distance is more stable and can provide more meaningful gradients even when there is a distribution mismatch, which is important when modeling one-class medical image data. Although more computationally expensive due to the matrix square root, the low latent dimensionality (
4.3.3 Latent Space Dimensionality Analysis
The latent dimensionality
As shown in Table 2, the lower dimension (

The YOLOv8 and CRA models were trained in a controlled environment. The parameters were selected using manual tuning on the validation set using a grid search. Early stopping was used to prevent overfitting. A summary of the training parameters used in both models is presented in Table 3.

The experiments were conducted using Python version 3.10.12, PyTorch version 2.2.2, CUDA version 11.8, on an NVIDIA GPU with an RTX 3060 (12 GB VRAM).
4.5 Morphology-Aware Feature Representation Analysis
Even though our framework does not utilize handcrafted morphological features or feature selection mechanisms, the latent space of CRA indirectly learns discriminative structural characteristics, including irregularity in texture, variation in chromatin density, homogeneity of cytoplasm, and asymmetry of contours.
In order to better understand the discriminative capability of the latent space, we carried out a post-hoc sensitivity analysis to investigate the impact of individual dimensions on the joint anomaly score through the gradient. The experimental results demonstrate that the most sensitive dimensions to anomalies correspond to the irregularities of texture and deformation patterns, which are clinically related to atypical cell morphology.
It should be noted that the proposed approach differs from the conventional ensemble feature ranking methods, such as Random Forest or XGBoost feature importance, as the proposed method focuses on the compactness and deviation modeling of the distribution rather than the explicit feature pruning. This facilitates the generalization capability for unseen morphological anomalies rather than relying on specific feature subsets.
In the future, we can incorporate domain-specific morphological features (e.g., nucleus-to-cytoplasm ratio, compactness of the cell contour, entropy of intensity) along with the proposed learned features to investigate the effectiveness of the feature combination on improving the discrimination capability of the proposed method when abnormal instances are limited.
4.6 Ensemble Modeling Considerations
The proposed method integrates supervised localization and distribution-aware anomaly modeling into a unified framework, rather than relying on the ensemble of multiple individual models.
These exploratory attempts to combine several variants of autoencoder models, varying parameters such as latent space size and regularization, merely averaged out the anomaly scores and did not significantly improve the results, increasing the F1-score of anomalies by less than 0.5%, while increasing computation time significantly. Thus, we continued with the single compact Wasserstein-regularized CRA.
Yet, some of these ideas of combining methods might prove fruitful in the future. Some possibilities are to stack the anomaly scores and use lightweight auxiliary classifiers on hard samples identified via pseudo-labeling, combine reconstruction and density methods, or use confidence-weighted fusion to reduce false positive rates when class imbalance is of concern.
The hybrid framework of YOLOv8 and CRA uses supervised learning for blood cell localization and unsupervised one-class learning for anomaly detection. To evaluate its performance, we use detection accuracy, discrimination of anomalies, cross-method consistency, and computation efficiency metrics [5,11].
5.1 Detection Performance Metrics
YOLOv8 predicts bounding boxes
Precision measures the accuracy of the YOLOv8 predictions by assessing how many of the predicted cells were correctly classified and localized:
Recall assesses how well YOLOv8 identifies all relevant blood cells in a peripheral blood smear image:
The F1 score provides a standard measurement of the ability of YOLOv8 to identify both precision and recall when determining detection accuracy:
5.1.4 Intersection over Union (IoU)
IoU measures the spatial similarity between the predicted bounding boxes and the true bounding boxes; thus, it is a measure of how accurately cells were localized:
5.1.5 Mean Average Precision (mAP)
mAP is a statistical measurement of detection accuracy across all blood cell types (RBCs, WBCs, and platelets): classes (RBC, WBC, and platelets):
Unless stated otherwise, mAP for YOLOv8 detection is measured using a minimum IoU threshold of 0.5 (mAP of 0.5).
5.2 Reconstruction-Based Anomaly Detection Metrics
The detected cells (
The reconstruction error is defined by Eq. (4), with lower reconstruction error representing normal cell morphology and higher reconstruction error representing abnormal morphology.
To improve sensitivity to subtle abnormalities, reconstruction error is combined with latent deviation as defined in Eq. (5), where
There are 2 thresholds used in this study: (1) Decision threshold (“
Decision thresholds are based on normal cell validation statistics and use mean and standard deviation (
with
A conservative thresholding strategy based on the three-sigma rule (
5.2.4 Anomaly Precision and Recall
Anomaly precision evaluates the correctness of anomaly predictions, while Anomaly recall measures sensitivity to true abnormal cells:
Receiver Operating Characteristic (ROC) analysis measures how well an anomaly can be distinguished across multiple thresholds. The Area Under The ROC Curve (AUC) gives a good idea of how effective a system is at detecting anomalies based on the performance for each threshold.
The hybrid framework assigns the final label to each detected cell based on the joint anomaly score:
Hybrid accuracy measures system-level correctness after applying the final decision rule (
5.3.2 Localization–Anomaly Consistency (LAC)
LAC evaluates whether correctly localized detections are also assigned the correct normal vs. anomalous decision. Let
For external ASH crops, a decision is correct when the crop is flagged anomalous.
The hybrid F1-score balances precision and recall at the system level:
5.4 Clinical Agreement and Acceptability Metrics
To assess clinical relevance beyond machine learning performance metrics, agreement between the proposed anomaly detection system and expert pathological assessment was quantified using Cohen’s Kappa coefficient. Let
Additionally, the false positive rate (FPR) on in-distribution normal samples is reported to evaluate clinical acceptability:
The above metrics can be used to determine whether or not anomaly alerts are reliable and can be used in actual diagnostic procedures.
5.5 Computational Efficiency Metrics
Inference time measures the total processing time per smear image:
where N is the number of cells detected.
Frames per Second (FPS) is used to describe the ability of a system to process data in real time. To calculate FPS, you measure inference latency using milliseconds (ms) and divide that by how long it takes for a system to perform inference on an image:
where
The complexity of a model can be a reflection of how many parameters a neural network is learning:
Together, the above metrics provide a concise, consistent, and methodologically aligned assessment of detection accuracy, anomaly detection sensitivity, hybrid consistency, and computational efficiency for the proposed system.
This section reports the performance of the proposed hybrid YOLOv8–CRA framework. Detection performance is evaluated on the TXL-PBC test split (108 images), which contains in-distribution (morphologically normal) samples annotated for RBC, WBC, and platelets. Because TXL-PBC does not provide labeled abnormal morphologies, anomaly detection performance is evaluated using an external abnormal set collected from the ASH Image Bank.
6.1 Statistical Significance Analysis
To quantify the statistical significance of the perceived improvements in accuracy, a paired t-test was performed to compare the YOLO only baseline against the proposed hybrid framework’s results, as shown in Table 4 with respect to the same test data (

Normality assumptions for the paired t-test were verified using the Shapiro–Wilk test.
Agreement analysis between CRA-based anomaly predictions and expert pathological labels on the external ASH Image Bank achieved a Cohen’s Kappa coefficient of
There are statistically significant differences for each of these metrics (
Both YOLOv8 and CRA reach stable convergence while training (refer to Figs. 5 and 6). YOLOv8 shows rapid increases in performance at the beginning of training, followed by a gradual flattening out, while CRA shows consistent declines in loss rates during the entirety of training. This implies that CRA is successfully learning to identify normal features in the data set.

Figure 5: YOLOv8 model training curves over 200 epochs.

Figure 6: Reconstruction loss curves for CRA over 150 epochs.
6.3 Computational Complexity and Runtime
To report computational cost in an engineering-relevant manner, Table 5 provides the number of learnable parameters, Floating-point Operations Per Second (FLOPs) per forward pass, and measured inference latency/FPS on the RTX 3060 (12 GB).

FPS is computed from the measured latency:
6.4 YOLOv8 Detection Performance
The strong performance of YOLOv8 in terms of detection over the course of its training can be seen by the amount of convergence that occurred at 175–200 training epochs (Table 6). The results from this analysis provide the final class-wise detection rates for the TXL-PBC Test Set, which are reported in Table 7.


YOLOv8 has high precision and recall for both RBCs and WBCs, although the detection of platelets poses a greater challenge due to their small size and low contrast with other classes. However, as indicated by the confusion matrix in Fig. 7 and qualitative observations in Fig. 8, YOLOv8 does provide consistently balanced performance over each class.

Figure 7: The confusion matrix of YOLOv8 for RBC, WBC, and platelet identification.

Figure 8: Qualitative results of YOLOv8 detection on TXL-PBC test images.
6.5 CRA Reconstruction Behaviour
According to Fig. 9, the CRA accurately reconstructs the morphology of normal cells in the in-distribution space, and maintains learned structural characteristics (e.g., cytoplasmic boundaries) from training with only normal cell images. Cell reconstructions of normal cells are visually very similar to the actual morphology of normal cells, whereas those of morphologically atypical (abnormal) samples appear much less similar visually, particularly with respect to the morphology of nuclei and texture of chromatin, and are representative of a deviation from the learned manifold of normal cell morphology.

Figure 9: Examples of CRA reconstruction for cropped blood cell instances.
To provide quantification of visual differences in reconstructions, statistical analyses of reconstruction error distributions were conducted (Fig. 10). Normal samples show a much more closely clustered and lower variance error distribution for the complete set of normal samples (

Figure 10: CRA reconstruction error distribution for anomalous and normal cells.
In contrast, abnormal samples from the ASH Image Bank showed a much greater level of reconstruction error (
The t-test indicates a statistically significant difference between the normal and external abnormal samples,

Figure 11: CRA joint anomaly scores distribution that combines reconstruction error and latent distribution deviation.
For quantifying this latent behaviour, we computed the statistical properties of the latent deviation values

As presented in Table 8, the normal samples have tightly clustered latent deviations that are centered around a value of 1, whereas for the abnormal samples, the Mahalanobis distances are substantially higher, indicating that the distributions of the two groups in latent space are displaced relative to each other.
The results of the heat map visualizations (Fig. 12) show where the anomalies are located spatially, which supports the latent deviation quantitative results.


Figure 12: CRA anomaly heatmaps for the internal TXL-PBC samples and the external ASH Image Bank samples.
In addition to the latent deviation analysis, the numerical distribution of the joint anomaly scores

The data from Table 9 confirms that ASH-normal control samples have joint anomaly score statistics similar to TXL-PBC normal cells, meaning most of them are below threshold
Using the derived threshold
6.6 Anomaly Detection Performance
The CRA has very high levels of anomaly detection capability as indicated by the metrics of precision, recall or AUC presented in Table 10. As illustrated in Fig. 13, the ROC curve exhibits good discrimination at different thresholds.


Figure 13: ROC curve for the CRA-based anomaly detection.
The external abnormal validation is imbalanced as there are many more normal training samples compared to abnormal samples; thus while the reported anomaly metrics suggest a highly discriminative performance, the frequency of abnormalities in the world at large is far surpassed by the frequency of normal findings. In order to reduce the effects of imbalanced bias, threshold-independent metrics such as area under the curve (AUC) and precision-recall analysis have been applied. Additionally, cell-level anomaly detection allows for stratified evaluation by cell type in cases where sufficient abnormal samples exist. Future work will involve the use of larger, more diverse abnormal cohorts, which will help examine performance in cases of extreme imbalance and aid in per-class sensitivity analysis.
6.7 Hybrid YOLOv8–CRA Performance
The hybrid system employs YOLOv8 for localization and CRA for scoring anomalies to improve end-to-end accuracy and reliability, as presented in Table 11.

Fig. 14: Example images of the hybrid framework demonstrating both localization of normal cells and detection of previously unseen abnormal cells.

Figure 14: Results of the Hybrid YOLOv8–CRA detection and anomaly identification.
An ablation analysis was performed to quantitatively determine the impact of the individual and cumulative functional contributions of the different elements of the proposed hybrid framework. Four arrangements were analyzed: (i) YOLOv8, a stand-alone supervised detector, (ii) CRA trained with reconstruction (MSE + SSIM), (iii) CRA trained with Wasserstein Regularization (W-CRA), (iv) the fully integrated YOLOv8 - CRA hybrid system.
The Summary of the quantitative findings of the study is shown in Table 12. YOLOv8 on its own produces a good quality of results as well as a good level of accuracy. However, it does not provide the ability to detect anomalies. The CRA models successfully identify anomalous cells but do not provide the spatial location of those cells. The added latent regularization using Wasserstein distance provides a higher level of anomaly detection as they promote a compact set of latent variables for normal cells, resulting in enhancements to both the F1 score for anomaly detection and the AUC of the model relative to the CRA based only on reconstruction.

The hybrid framework (YOLOv8+CRA) outperforms all individual configurations in terms of both detection accuracy and anomaly sensitivity while incurring a small model size. Thus, the strengths of supervised localization and unsupervised anomaly modeling complement each other such that accurate and reliable cell-level detection is enabled, as well as the identification of newly discovered abnormal morphologies.
The box-and-whisker plot in Fig. 15 illustrates the ablation configuration comparisons whereby the hybrid framework demonstrates the highest median performance and lowest variance—the improved robustness and stability relative to the YOLO-only and CRA-only configurations is apparent.

Figure 15: A box-and-whisker plot that shows the stability of performance across ablation configurations.
6.9 Comparison with State-of-the-Art (SOTA)
Most current state-of-the-art approaches to blood smear analysis focus on supervised cell localization and classification only. While this method achieves high detection accuracy, it does not provide for any cell morphology that has not been seen previously because it does not account for the respective unstated or anomalous morphology; it limits the ability to interpret the abnormal morphology as part of a one-class learning paradigm.
The Table 13 presents results comparing YOLO-based models to SOTA methods (Table 1). YOLO-based detectors, including SDE-YOLO, DWS-YOLO, and YOLO-FMS, achieved strong average precision (AP) values without explicitly modelling (a) morphologically abnormal, or (b) unseen cellular categories. YOLOv8-only model achieves competitive AP and was only a supervised model. The YOLOv8–CRA architecture was not only the highest performing detection model and supports anomaly-aware inference, but is only marginally larger than the YOLOv8-only model.

Approximate parameter counts for the models used in comparisons are from publicly available architectures for which the actual configuration was not disclosed. All models used the same preprocessing and the same images to create evaluation sets. The expert reviewers who validated ASH Image Bank abnormalities were blinded to the model predictions to provide unbiased evaluations. Although results are presented based on single-run trials, future work will report multi-seed evaluations and their confidence intervals, as well as release the evaluation code used for repeatable benchmarking.
Fig. 16 illustrates an example of a qualitative comparison utilizing a sample of giant platelets in the external ASH Image Bank. The supervised-only detectors successfully locate the cell (platelet) and identify it as a normal category; however, this results from the morphological similarity of the giant platelet to normal platelets. Conversely, the hybrid framework achieves accurate localization and correctly identifies the cell as abnormal, thereby indicating an improvement in generalization from the training distribution.

Figure 16: A qualitative comparison of the SOTA detectors and the proposed framework conducted on an external ASH Image Bank sample.
6.10 Comparison with Unsupervised Anomaly Detection Methods
To further contextualize the proposed CRA’s performance, we compared its anomaly detection capability to three representative unsupervised anomaly detection algorithms adapted for use with medical images (PatchCore, SPADE, and DeepSVDD) using the same external ASH Image Bank abnormal sample.
In terms of reconstruction fidelity and Wasserstein regularized latent distribution modeling, the proposed CRA exhibited greater performance than the aforementioned methods by providing a greater sensitivity to subtle morphological discrepancies while simultaneously offering improved computational efficiency, as shown in Table 14.

In addition to demonstrating superior image-based anomaly detection results through the CRA methodology, hybrid classification frameworks in molecular and biological sequence analyses have also illustrated that the integration of structured feature extraction and the use of ensemble learning can lead to increased robustness when dealing with examples with an imbalanced distribution of classes. Although these paradigms rely upon physicochemical or sequence-derived characteristics rather than visual morphology, they nonetheless demonstrate the value of feature representation methods, as well as the utility of the ensemble reasoning approach, in the development of biomedical anomaly models.
The CRA framework proposed in this research is a novel approach for performing cellular image analysis, allowing for the modeling of distributional compactness within a visual latent manifold that has been learned through data. This framework does not require the use of predefined handcrafted features; however, it is likely that methodological developments from structured hybrid systems will inform future implementations where there is explicit feature augmentation or ensemble fusion in cellular image analysis.
6.11 Inter-Dataset Robustness and Domain Shift Considerations
An important consideration when analyzing the results of the proposed CRA framework for identifying abnormal samples sourced from an external dataset is how the proposed CRA framework responds to morphological differences due to either true morphology abnormalities or to the differences inherent within the datasets, such as staining intensity or differences in imaging conditions. To reduce this risk, all cell crops in the analysis will be resized, undergo intensity normalization, and will all be processed through the same detection and reconstruction pipeline. Further, the determination of whether an abnormal result indicates an active abnormality will continue to be made based on a joint score that includes both reconstruction fidelity and the deviation from the latent distribution, rather than purely a comparison of raw pixel images. The clear separation of normal TXL-PBC samples, confirmed by an expert, from abnormal ASH samples, in conjunction with a very low false positive rate for in-distribution normal cells, suggests that the CRA framework can detect true abnormal morphology rather than trivial domain artifacts. Future work will further investigate the use of domain adaptive normalization and stain invariant representations to increase the robustness of results across datasets.
6.12 Controlled Domain Bias Assessment
To test whether the morphological anomalies detected by the CRA are actually morphological anomalies and not simply imaging differences due to differences in the datasets, a new control experiment was performed.
This experiment used cropped images of morphologically normal cells (expert–confirmed) from the ASH Image Bank that were processed through the CRA without retraining. If the majority of the detected anomalies were due to imaging differences only, we would expect to have many morphologically normal ASH cells with high anomaly scores that are similar to abnormal cells.
The results showed that the joint anomaly score statistics of the ASH-normal samples were similar to the normal distributions of TXL-PBC samples (
In contrast, the joint anomaly scores of expert-confirmed abnormal ASH samples were significantly higher than those of the ASH-normal and TXL-normal samples (see Table 9). A one-way ANOVA was performed on the three groups (TXL-normal, ASH-normal, and ASH-abnormal), resulting in
The results of the study show that the method we are using is predominantly giving us information about morphology-induced latent distribution shifts of a sample rather than just the domain shift (the approximate difference between datasets).
6.13 Graph-Based Contextual Modeling Perspective
Anomalies are calculated based on the individual cells from the current approach, under the assumption that the detection of the anomaly for each cell is independent. There are numerous examples of hematologic disorders that occur through spatial clustering or other types of relational patterns from cells that are adjacent to one another.
Using an expanded representation, the detected cells could all be treated as nodes of a graph, with edges used to represent the proximity of the cells to one another, their similarities in morphology, or the similarity of their classes. In this architecture, higher-order contextual embeddings that characterize the structure of the cells over many cells would be learned by the use of Graph Neural Networks [32–34].
The current study does not utilize the proposed graph-based contextual model for the purpose of identifying abnormalities based on clustering. However, given the potential of the proposed approach, there remains much potential benefit for identifying abnormalities based on clustering and environmental factors associated with contiguous cells. Models that can integrate topology-aware reasoning into the evaluation of single-cell anomalies will continue to provide researchers with improved interpretability, and clinics to enhance reliability.
6.14 Sequential and Multi-Field Modeling Extension
The study used an approach that sequentially evaluated how adjacent fields of view were evaluated through the analysis of each field separately. In the case of a laboratory-based workflow for examining peripheral blood smears, the traditional method employed was evaluating adjacent fields of view sequentially.
At the time of examination, an analysis of the adjacent fields of view would provide a model of how the cells are distributed and/or how the morphology of the cells was changing. A recurrent architecture (e.g., LSTM or GRU) that processed the ordered cell embeddings would provide the model an opportunity to identify contextual patterns of anomalies in different fields of view, rather than as isolated cell types.
Adding a hybrid framework with sequential or multiple fields that provide contextual models may increase the sensitivity of detecting anomalies in smear evaluations in the actual world, and thus should be a focus for future research.
Most of the failure cases that occur are located within densely grouped regions of smears, as well as within cells that display borderline or ambiguous morphology (see Fig. 17). In addition, the further the overlap of cells, the more performance degradation will occur as the misidentified location of a cell will contribute to the incorrect or contaminated cropping of cells for evaluating the anomaly, which in turn, lowers the fidelity of CRA reconstructions. For example, subtle characteristics of abnormal morphology that more closely resemble normal morphology may also produce insufficient latent deviation from the baseline to exceed the anomaly threshold; this has also affected the overall image quality when calculating fault detection metrics. Some factors that have affected the overall image quality when calculating fault detection metrics include blurriness of the image, lack of uniformity in stains used, and artificial lighting errors that can contribute noise back into the reconstructed image.

Figure 17: A failure case showing the misclassification of Abnormal WBC as Abnormal RBC and a missed detection in a highly dense smear region.
Because of these observations, future research may address issues of detecting overlapping cells, developing better cropping techniques, and incorporating uncertainty into the reconstruction model or segmentation refining/calibration.
6.16 Application-Level Demonstration
The proposed framework has been demonstrated to work in a live environment by utilizing tissue specimens that were pathological, and healthy, examples of which are displayed in Figs. 18 and 19, Anomalies were detected during the evaluation of specimen only; thereby resulting in no potential false positives or negatives occurring in the evaluation specimens that were determined to be potentially useful clinically.

Figure 18: The application output on an external ASH image bank sample.

Figure 19: The application output on a TXL-PBC test sample.
6.17 Limitations of Abnormal Data Coverage
Although external validation was performed on expert-validated abnormal tissue samples from the ASH Image Bank, the limitations of the data are mainly in regards to the lack of extensive abnormal analysis. Overall, current efforts are primarily focused on isolated abnormal morphology found in red blood cells, white blood cells, and platelets, and fail to put the isolated morphological abnormalities into context with the complexity of clinical presentation (i.e., co-existent multi-cell abnormalities, rare hematological disorders, fragmented cells, and significantly dysplastic morphology).
This deficiency of information exists primarily due to the lack of publicly available large datasets of peripherals with expert annotated abnormal morphological features at the cellular level. However, the goal of this study is to explore the nature of being anomaly aware in terms of one-class learning rather than exhaustive categorical pathological classification.
Also, the current system identifies an abnormality at the cellular level, but does not identify or classify specific pathological subtypes (e.g., dysplastic leukocytes, parasitized erythrocytes, and reactive platelets). Extending this framework into fine-grained classifications of abnormalities would require curated and expert annotated datasets of abnormal cellular morphology which are still limited in the public domain. However, the proposed anomaly-aware framework serves as a modular basis for integrating any supervised/semi-supervised abnormal sub-classification modules in future efforts.
The combination of two approaches has enabled the integration of supervised detection into unsupervised anomaly modeling. In this case, YOLOv8 provides the precise location of an abnormality while regularizing latent learning using a Wasserstein distance to provide improved sensitivity to very subtle anomalies. Overall, this combination of methods is more effective than using either alone, and it enables both anomaly detection and analysis on an anomaly-unaware dataset during training.
From a clinical standpoint, the design of the proposed framework is deliberately as a screening system for anomalous morphology and a decision support system, rather than as a more precise pathological classifier based on subtypes. Routine hematology workflows involve screening for abnormality before conducting subtype classification in detail. The goal of the system is therefore to reliably flag morphologically atypical cells, given the limited annotations available for the data being assessed, thereby allowing for early review of the flagged cells by an expert.
It should be noted that the current framework is not intended to supplant subtype-specific pathological classifications; it is merely intended to provide an alert system for morphologically abnormal findings that do not conform to any pre-defined abnormal subclass. This has clear utility in cases where rare, emergent, or previously unrecognised abnormal findings are present, and therefore where supervised multi-class systems may fail because of too few labelled abnormal cases.
Future work may incorporate supervised subclassification modules once sufficiently curated abnormal datasets become available.
6.19 Clinical Positioning of the Proposed Framework
This proposed hybrid framework should be viewed as a morphology-based anomaly-detection program rather than a complete pathological diagnostic program. This program categorizes the three major groups of hematological cells but only identifies differences in morphology against what it has learned as normal. The framework does not classify the pathological subtypes of abnormal blood cells, such as dysplastic leukocytes, parasitized erythrocytes, and activated platelets.
The choice of design was made because of the limited availability of publicly available data that has had an expert assessment of anomalies and compatibility with the workflows typically followed for screening anomalies in the clinical setting. In the clinical setting, an anomaly detection system would identify anomalies as triggers for expert review. The high sensitivity to distributional deviations makes this hybrid framework ideal for identifying infrequent or unobserved anomalies that may be missed by supervised subtype classification.
Thus, this framework will be clinically useful as an anomaly-detection pre-screening process, where it will be complementary to, but not a replacement for, more detailed supervised diagnostic processes.
This research details the development of a hybrid deep learning approach consisting of a supervised, YOLOv8-based detection algorithm to identify blood cells and an unsupervised, distribution-aware anomaly detection algorithm based on a Wasserstein-regularized Cell Reconstruction Autoencoder (CRA) used to perform comprehensive analysis of peripheral blood smears. The proposed approach has shown substantially enhanced localization accuracy for the normal blood cell categories and also provides reliable identification of previously unseen or morphologically abnormal blood cells in a one-class learning environment. Multiple quantitative metrics assessments, statistical significance tests, and qualitative assessments collectively demonstrate that the proposed hybrid approach enhances the stability and susceptibility to anomalies of the detection process without the need for providing abnormal annotations during training. The hybrid anomaly detection approach allows for identifying morphologically non-typical instances of blood cells through modeling the morphology of typical blood cells and identifying deviations from the distribution of the modeled morphology; thus, the proposed approach provides a reliable and clinically relevant method of flagging morphologically atypical cells and supports anomaly-aware screening within the standard workflow of routine laboratory procedures.
The primary contribution of this study is in formally establishing a distribution-aware hybrid anomaly detection paradigm specifically designed for peripheral blood smear analysis. Rather than introducing a new and independent architecture, the study develops a systematic approach that integrates supervised localization with a Wasserstein-regularized latent model and statistically supported thresholding to provide a comprehensive solution. With the addition of latent compactness constraints, joint anomaly scoring, and localization-anomaly consistency analysis, the framework is raised from a simple modular pipeline to a reproducible anomaly-aware detection formulation.
Although the above-mentioned attributes lend to the strength of this work; there are limitations to the current study. An evaluation of the anomaly detection module has been made with a limited number of externally sourced pathological specimens, and there is currently no fine-scale classification of clinically relevant abnormal morphologies; furthermore, most of the performance validation has been done using high-performance GPU hardware and not on resource-constrained clinical devices.
Future research will continue to refine the anomaly module by providing finer granular classifications of pathological anomalies, therefore allowing for clinically relevant contextual categories, such as parasitized erythrocytes, dysplastic leukocytes, or abnormal platelets to associate with detected anomalies. Methods within Explainable AI, like attention-based visualizations or the Reconstruct Attribution Method, will enhance interpretability and clinician confidence in the detection of pathological anomalies. Likewise, a semi-supervised or domain-adaptive approach used during training will yield a model that generalizes better across a variety of clinical laboratories, regardless of differences in imaging conditions or staining techniques. This framework will be configured for use with Edge-AI deployment and lightweight inference as a means of providing automated operation of both point-of-care and microscopy processes to ultimately achieve system scalability in a diagnostic setting.
Acknowledgement: The authors acknowledge Dr. K. V. Arulalan, M.D. (Pediatrics), of AA Child Care Clinic, Vellore, Tamil Nadu, for his excellent guidance in developing the research question and providing helpful feedback during the course of this project. The authors also thank Dr. Radhika, M.D. (Pathologist), Government Medical College, Vellore, and Dr. Mubeen, M.D. (Pathologist), Rainbow Hospital, Hyderabad, for expert clinical validation and for expert review and clinical confirmation of abnormalities in publicly available, de-identified peripheral blood smear images, which significantly enhanced the clinical reliability of this study. Finally, the authors acknowledge B. Raghava, Senior Laboratory Technician, Yashoda Hospitals, Hyderabad, for verifying annotated samples used in the external validation experiments.
Funding Statement: The authors received no specific funding for this study.
Author Contributions: The authors confirm contribution to the paper as follows: Conceptualization, Rajakumar Krishnan; methodology, Issac Neha Margret and Rajakumar Krishnan; software and implementation, Issac Neha Margret; validation, Rajakumar Krishnan; formal analysis, Issac Neha Margret; investigation, Issac Neha Margret; data curation, Issac Neha Margret; writing—original draft preparation, Issac Neha Margret; writing—review and editing, Rajakumar Krishnan; supervision, Rajakumar Krishnan. All authors reviewed and approved the final version of the manuscript.
Availability of Data and Materials: The data that support the findings of this study are openly available in public repositories. The TXL-PBC dataset is available at https://github.com/lugan113/TXL-PBC_Dataset, and external validation samples were obtained from the ASH Image Bank, available at https://imagebank.hematology.org/. All external validation images were accessed in publicly available, de-identified form, and no patient-identifiable information or private clinical metadata was collected or used.
Ethics Approval: Not applicable. This study did not involve human participants, animal experiments, prospective data collection, or access to identifiable patient information. All experiments and expert review were conducted exclusively on publicly available, de-identified image datasets (TXL-PBC and ASH Image Bank); no private clinical records or patient metadata were accessed.
Conflicts of Interest: The authors declare no conflicts of interest.
References
1. Ferreira FR, do Couto LM. Using deep learning on microscopic images for white blood cell detection and segmentation to assist in leukemia diagnosis. J Supercomput. 2025;81(2):410. doi:10.1007/s11227-024-06903-2. [Google Scholar] [CrossRef]
2. Reghunandanan K, Lakshmi VS, Raj R, Viswanath K, Davis C, Chandramohanadas R. A convolutional neural network-based deep learning to detect reticulocytes from human peripheral blood. Intell Based Med. 2024;10(1):100175. doi:10.1016/j.ibmed.2024.100175. [Google Scholar] [CrossRef]
3. Fu L, Chen J, Zhang Y, Huang X, Sun L. CNN and Transformer-based deep learning models for automated white blood cell detection. Image Vis Comput. 2025;161(12):105631. doi:10.1016/j.imavis.2025.105631. [Google Scholar] [CrossRef]
4. Tanwar V, Sharma B, Yadav DP, Dwivedi AD. Enhancing blood cell diagnosis using hybrid residual and dual block transformer network. Bioengineering. 2025;12(2):98. doi:10.3390/bioengineering12020098. [Google Scholar] [PubMed] [CrossRef]
5. Wang Y, Pan L, Shu X. YOLO-FMS: a lightweight and efficient model for medical microscopic smear detection. IEEE Access. 2024;12:125253–65. doi:10.1109/ACCESS.2024.3455555. [Google Scholar] [CrossRef]
6. Wu Y, Gao D, Fang Y, Xu X, Gao H, Ju Z. SDE-YOLO: a novel method for blood cell detection. Biomimetics. 2023;8(5):404. doi:10.3390/biomimetics8050404. [Google Scholar] [PubMed] [CrossRef]
7. Margret IN, Rajakumar K. Deep learning techniques for analyzing peripheral blood smears: a meta-analysis. Neural Comput Appl. 2025;37(22):18039–65. doi:10.1007/s00521-025-11401-4. [Google Scholar] [CrossRef]
8. Escobar FI, Alipo-on JR, Novia JL, Tan MJ, Karim HA, AlDahoul N. Automated counting of white blood cells in thin blood smear images. Comput Electr Eng. 2023;108(1):108710. doi:10.1016/j.compeleceng.2023.108710. [Google Scholar] [CrossRef]
9. He Y. Automatic blood cell detection based on advanced YOLOv5s network. IEEE Access. 2024;12:17639–50. doi:10.1109/ACCESS.2024.3360142. [Google Scholar] [CrossRef]
10. Kasamsumran N, Ittichaiwong P, Chinudomporn C, Veerakanjana K, Karoopongse E, Pora W. AI-assisted web application for leukocyte abnormality counting with YOLOv11 and smartphone microscopy. IEEE Access. 2025;13:89079–107. doi:10.1109/ACCESS.2025.3569767. [Google Scholar] [CrossRef]
11. Elhassan TA, Mohd Rahim MS, Siti Zaiton MH, Swee TT, Alhaj TA, Ali A, et al. Classification of atypical white blood cells in acute myeloid leukemia using a two-stage hybrid model based on deep convolutional autoencoder and deep convolutional neural network. Diagnostics. 2023;13(2):196. doi:10.3390/diagnostics13020196. [Google Scholar] [PubMed] [CrossRef]
12. Kanimozhi N, Nayak S, Kumar K, Manjramkar V, Kumar R, Suganthi D. Blood cancer detection and classification using auto encoder and regularized extreme learning machine. In: Proceedings of the 2023 8th International Conference on Communication and Electronics Systems (ICCES); 2023 Jun 1–3; Coimbatore, India. p. 1122–7. doi:10.1109/ICCES57224.2023.10192852. [Google Scholar] [CrossRef]
13. Mao Y, Zhang H, Wu W, Gao X, Lin Z, Lin J. DWS-YOLO: a lightweight detector for blood cell detection. Appl Artif Intell. 2024;38(1):2318673. doi:10.1080/08839514.2024.2318673. [Google Scholar] [CrossRef]
14. Pfeil J, Nechyporenko A, Frohme M, Hufert FT, Schulze K. Examination of blood samples using deep learning and mobile microscopy. BMC Bioinform. 2022;23(1):65. doi:10.1186/s12859-022-04602-4. [Google Scholar] [PubMed] [CrossRef]
15. Bhimavarapu J, Kota B, Rao DR, Varla A. Blood cell detection and counting using deep learning. In: Proceedings of the 2024 2nd World Conference on Communication & Computing (WCONF); 2024 Jul 12–14; Raipur, India. p. 1–5. doi:10.1109/WCONF61366.2024.10692308. [Google Scholar] [CrossRef]
16. Le Trac T, Pham Thi Phuong N, Nguyen Phan Minh T, Le Van V. ESQ-YOLO: an efficient method for blood cell detection based on improved YOLOv8. In: international conference on intelligent systems and data science. Singapore: Springer; 2025. p. 162–74. doi:10.1007/978-981-95-3355-8_12. [Google Scholar] [CrossRef]
17. Ma S, Sengupta S, Lee Y, Gu B, Chen X, Wang X, et al. Automatic classification of circulating blood cell clusters based on multi-channel flow cytometry imaging. Eng Appl Artif Intell. 2026;165(5):113401. doi:10.1016/j.engappai.2025.113401. [Google Scholar] [CrossRef]
18. Hasen AE, Shangming Y, Ukwuoma CC, Gashaw B, Yutra AZ. ABCD: automatic blood cell detection via attention-guided improved YOLOX. arXiv:2507.19296. 2025. doi:10.48550/arXiv.2507.19296. [Google Scholar] [CrossRef]
19. Tarimo SA, Jang MA, Ngasa EE, Shin HB, Shin H, Woo J. WBC YOLO-ViT: 2 Way-2 stage white blood cell detection and classification with a combination of YOLOv5 and vision transformer. Comput Biol Med. 2024;169(4):107875. doi:10.1016/j.compbiomed.2023.107875. [Google Scholar] [PubMed] [CrossRef]
20. Hameed IM, Al-Mukhtar M, Al-Zubaidi AS. MCNet: mask cell of multi class deep network for blood cells detection and classification. Int J Intell Eng Syst. 2025;18(1):321–34. doi:10.22266/ijies2025.0229.23. [Google Scholar] [CrossRef]
21. Haghshenas Z, Shokri Garjan H, Moghassem A, Vahedi P, Tabatabavakili Y, Hosseinzadeh D, et al. The role of artificial intelligence in shaping the future of hematological diagnosis and treatment. Iran J Blood Cancer. 2025;17(3):46–61. doi:10.61882/ijbc.17.3.46. [Google Scholar] [CrossRef]
22. Lateef AS, Al-Zuhairi AJ, Kamil MY. Classification and prediction of human blood cells using artificial intelligence and advanced image processing techniques. [cited 2026 Jan 1]. Available from: http://148.72.244.84/xmlui/handle/xmlui/16750. [Google Scholar]
23. Gan L, Li X, Wang X. A curated and re-annotated peripheral blood cell dataset integrating four public resources. Sci Data. 2025;12(1):1694. doi:10.1038/s41597-025-05980-z. [Google Scholar] [PubMed] [CrossRef]
24. Elhassan T, Osman AH, Rahim MS, Hashim SZ, Ali A, Elhassan E, et al. CAE-ResVGG FusionNet: a feature extraction framework integrating convolutional autoencoders and transfer learning for immature white blood cells in acute myeloid leukemia. Heliyon. 2024;10(19):e37745. [Google Scholar] [PubMed]
25. Fu R, Zheng X, Zhou H, Ji C, Xiang S, Yue G, et al. Contrastive representation learning for cross-domain blood cell image classification with denoising mechanism. IEEE J Biomed Health Inform. 2025;30(2):1392–403. doi:10.1109/JBHI.2025.3585548. [Google Scholar] [PubMed] [CrossRef]
26. Angmanee B, Wanram S, Thedsakhulwong A. A hybrid framework for red blood cell labeling using elliptical fitting, autoencoding, and data augmentation. J Imaging. 2025;11(9):309. doi:10.3390/jimaging11090309. [Google Scholar] [PubMed] [CrossRef]
27. Başaran E, Çelik G, Toğaçar M. Regionally focused neural-coder model designed for the diagnosis of acute lymphoblastic leukemia disease. Measurement. 2025;256:118176. doi:10.1016/j.measurement.2025.118176. [Google Scholar] [CrossRef]
28. Nguyen TD, Ho VL, Nguyen VD. Multimodal approach for canine dermatological and ophthalmological disease diagnosis using YOLOv11 with data augmentation and autoencoder techniques. In: international conference on computational science and its applications. Berlin/Heidelberg, Germany: Springer; 2025. p. 361–74. doi:10.1007/978-3-031-97000-9_23. [Google Scholar] [CrossRef]
29. Ramirez-Quintana JA, Salazar-Gonzalez EA, Chacon-Murguia MI, Arzate-Quintana C. Novel extreme-lightweight fully convolutional network for low computational cost in microbiological and cell analysis: detection, quantification, and segmentation. Big Data Cogn Comput. 2025;9(2):36. doi:10.3390/bdcc9020036. [Google Scholar] [CrossRef]
30. American Society of Hematology. ASH image bank. Washington, DC, USA: American Society of Hematology; 2025. [Google Scholar]
31. Margret IN, Rajakumar K. Adaptive elastic GAN for high-fidelity blood cell image hallucination and classification. IEEE Access. 2025;13(4):84897–910. doi:10.1109/ACCESS.2025.3568539. [Google Scholar] [CrossRef]
32. Dad I, He JF, Baloch Z. Graph-based analysis of histopathological images for lung cancer classification using GLCM features and enhanced graph. Front Oncol. 2025;15:1546635. doi:10.3389/fonc.2025.1546635. [Google Scholar] [PubMed] [CrossRef]
33. Bai Y, Mi Y, Su Y, Zhang B, Zhang Z, Wu J, et al. A scalable graph-based framework for multi-organ histology image classification. IEEE J Biomed Health Inform. 2022;26(11):5506–17. doi:10.1109/JBHI.2022.3199110. [Google Scholar] [CrossRef]
34. Zheng Y, Gindra RH, Green EJ, Burks EJ, Betke M, Beane JE, et al. A graph-transformer for whole slide image classification. IEEE Trans Med Imaging. 2022;41(11):3003–15. doi:10.1109/TMI.2022.3176598. [Google Scholar] [PubMed] [CrossRef]
Cite This Article
 Copyright © 2026 The Author(s). Published by Tech Science Press.
This work is licensed under a Creative Commons Attribution 4.0 International License , which permits unrestricted use, distribution, and reproduction in any medium, provided the original work is properly cited.
 Downloads
 Citation Tools