
 Submit a Paper
 Propose a Special lssue
 Open Access
ARTICLE

FBAM: A Frequency-Based Attention Mechanism for Enhanced Image-Based Malware Detection
1 Department of Computer Science, Faculty of Computing, Universiti Teknologi Malaysia, Johor Bahru, Johor, Malaysia
2 Department of Computer Science, College of Computing, Birmingham City University, Birmingham, UK
3 Computer Science Department, College of Computer and Information Sciences, Imam Mohammad Ibn Saud Islamic University (IMSIU), Riyadh, Saudi Arabia
* Corresponding Author: Sultan Noman Qasem. Email:
(This article belongs to the Special Issue: Emerging Technologies in Information Security: Modeling, Algorithms, and Applications)
Computer Modeling in Engineering & Sciences 2026, 147(3), 49 https://doi.org/10.32604/cmes.2026.080862
Received 17 February 2026; Accepted 14 May 2026; Issue published 30 June 2026
 View Full Text
 Download PDF
Abstract
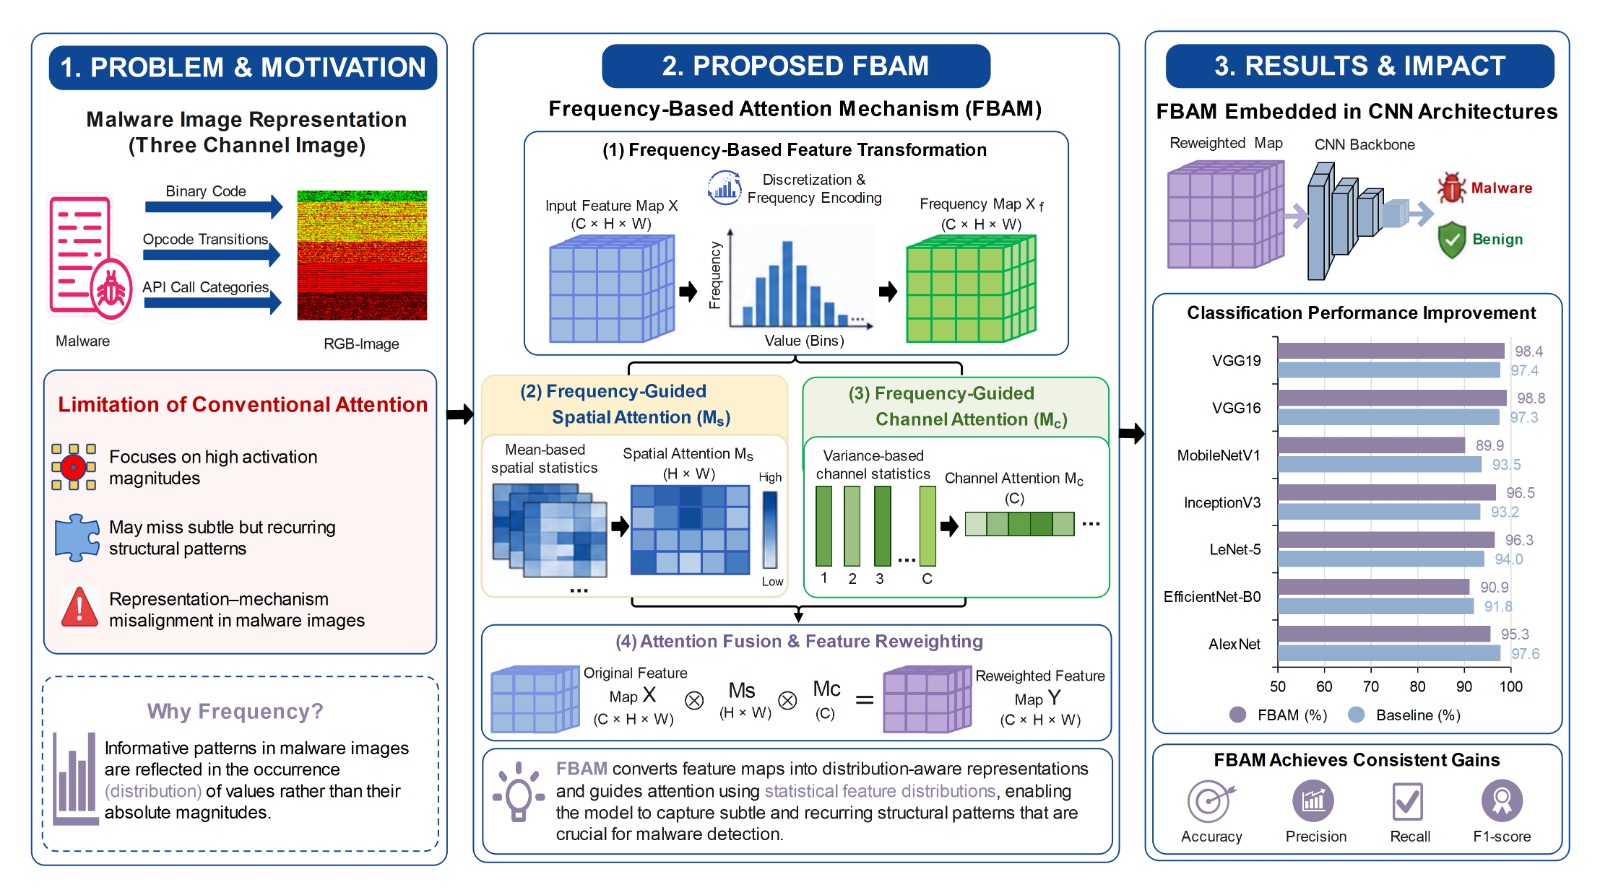
The rapid growth and increasing sophistication of malware pose significant challenges to traditional detection methods. Convolutional neural network (CNN)-based malware image classification methods have emerged as a promising approach by transforming binary files into visual representations and enabling automated feature extraction. To enhance discriminative learning, recent studies have incorporated attention mechanisms originally developed for natural image and natural language processing tasks. However, these mechanisms embed inductive biases that assume spatial coherence and visually salient semantics, assumptions that do not necessarily hold in malware image representations, where informative patterns may be subtle, structurally encoded, and globally distributed. To address this representation–mechanism misalignment, this study proposes a Frequency-Based Attention Mechanism (FBAM), a domain-aware module that introduces a frequency-based feature transformation prior to attention computation. By converting feature maps into distribution-aware representations, FBAM enables spatial and channel attention to be guided by statistical feature distributions rather than raw activation magnitudes, allowing more effective capture of malware-specific patterns. FBAM was embedded into seven CNN architectures and evaluated on a dataset comprising 18,060 Windows Portable Executable (PE) files, including both malware and benign samples. Comprehensive experiments were conducted against general-purpose attention modules, including SE, CBAM, and CA, as well as the domain-specific SACNN model. Results show improved performance across accuracy, precision, recall, and F1-score, with statistical analysis indicating significant gains in most cases. VGG16 and VGG19 augmented with FBAM achieved accuracies of 98.82% and 98.38%, respectively, outperforming baseline architectures and competing attention mechanisms. These findings provide strong empirical evidence that incorporating distribution-aware frequency information into attention design enhances discriminative feature learning in image-based malware detection.Graphic Abstract
Keywords
The global malware landscape is expanding at an alarming rate. According to the AV-TEST Institute [1], over 450,000 new malicious programs and potentially unwanted applications are registered daily, indicating a massive and continuous rise in threats that place growing pressure on conventional detection approaches. However, the challenge is not merely quantitative. The growing sophistication of malware, which is driven by automation and advanced evasion techniques, is diminishing the effectiveness of traditional static and dynamic analysis methods. Recent surveys highlight that modern malware frequently employs strategies such as packing, code obfuscation, and behavior obfuscation to bypass conventional detection mechanisms [2]. These advancements have rendered manual feature engineering increasingly inadequate, thereby motivating the shift toward automated, learning-based detection approaches.
To address this challenge, recent research has explored deep learning–based approaches that automate feature extraction and pattern recognition from malware samples. Image-based malware detection has emerged as a powerful direction, where malware binaries or features are converted into image representations that convolutional neural networks (CNNs) can process. This direction is motivated by the observation that many malware variants are created through automation or by reusing components from existing codebases [3,4]. As a result, related malwarevariants often preserve similar binary structures, opcode arrangements, and data ordering patterns despite the application of obfuscation techniques [5,6]. Several studies have shown that these structural similarities can still be captured effectively in visual representation of malware [7,8]. When converted into images, these similarities yield distinct spatial and statistical patterns that CNNs can effectively learn, enabling accurate classification with minimal manual feature engineering [9–12]. However, while CNNs inherently exhibit an inductive bias toward capturing local spatial patterns, they do not explicitly model the statistical distribution of feature values, which plays an important role in representing recurring structural patterns in malware data.
While image-based malware detection has demonstrated promising results, its success depends largely on the model’s ability to extract discriminative features from complex, non-natural image representations. To enhance this capability, recent studies have applied attention mechanisms to image-based malware detection, aiming to improve deep learning models’ focus on informative features, as also observed in [5,12]. These mechanisms are typically designed for natural images, where dominant features include textures, edges, and object boundaries. In contrast, malware images encode structural and behavioral patterns derived from binary analysis, which do not conform to these assumptions.
As a result, general-purpose attention modules may not effectively capture the domain-specific characteristics required for robust malware classification. This limitation highlights a representation–mechanism misalignment, where attention models designed for natural images are applied to fundamentally different data structures. To address this issue, this study proposes a domain-aware attention mechanism that explicitly incorporates statistical feature distributions into the attention process.
Specifically, the proposed Frequency-Based Attention Mechanism (FBAM) introduces a frequency-based feature transformation that converts feature maps into a distribution-aware representation prior to attention computation. This enables attention weights to be derived from statistical feature distributions rather than raw activation magnitudes, allowing more effective modelling of recurring structural and behavioural patterns in malware image representations. This is particularly relevant in malware image representations, where encoded feature values reflect structural elements, whose discriminative power lies in their occurrence patterns rather than their absolute magnitudes. Unlike conventional attention mechanisms such as SE, CBAM, and CA, which derive attention weights from activation magnitude or pooled features, FBAM operates on distribution-aware representations, enables attention to be guided by statistical feature distributions, providing a domain-aligned alternative for malware image analysis. The contributions of this study are summarized as follows:
• A frequency-aware attention mechanism called FBAM has been designed and developed. FBM introduces a frequency-based feature transformation to enable distribution-aware spatial and channel attention for image-based malware detection.
• FBAM has been integrated into seven CNN architectures including AlexNet, LeNet-5, VGG16, VGG19, Inception-V3, EfficientNet-B0, and MobileNetV1 to represent a diverse range of network depth and computational complexity.
• Experimental results show that the proposed FBAM consistently improves classification performance compared with general-purpose attention mechanisms (SE, CBAM, and CA) and a domain-specific model (SACNN), achieving significant gains across multiple evaluation metrics.
Malware detection has evolved considerably in recent years, shifting from traditional feature-engineering–based methods toward deep learning models capable of learning directly from raw or transformed data. In this section, we review prior works under three major categories: feature-driven approaches, image-based representations, and attention mechanisms for image-based malware detection.
Conventional malware detection methods are typically classified into static, dynamic, and hybrid analysis. Static analysis examines samples without executing them, extracting structural features such as opcodes, byte sequences, and Portable Executable (PE) headers. While this approach is efficient and safe, it is susceptible to packing and code obfuscation methods [13,14]. Dynamic analysis executes malware samples in sandboxed environments to observe behaviors like API call sequences, registry modifications, or network communication patterns. This approach offers greater resilience to static obfuscation but can be circumvented through behavior obfuscation [15,16]. Hybrid analysis combines structural features from static analysis with behavioral traces from dynamic analysis to improve detection robustness. However, these methods often depend on high-dimensional handcrafted feature sets, which require substantial preprocessing and domain expertise, and can be computationally expensive [12,17,18].
2.2 Image-Based Representations
To reduce reliance on manual feature engineering, researchers have increasingly transformed malware samples into visual representations that can be processed by convolutional neural networks (CNNs) [8,19]. Early approaches, such as [20], converted malware binaries into grayscale images to exploit texture patterns characteristic of malware families. These images were further processed using handcrafted texture descriptors including GIST, Local Binary Patterns, and Gray-Level Co-occurrence Matrices and classified by algorithms like SVM and k-NN [21–24]. While effective in certain contexts, such single-channel grayscale techniques offer limited semantic depth and remain prone to evasion, as they rely heavily on a single feature aspect that is vulnerable to obfuscation [4,25].
To enrich malware visual representations beyond single-channel grayscale images, several studies have proposed multi-channel (RGB) image encoding schemes that integrate complementary features from malware samples. Vu et al. [26] developed a framework that converts malware binaries into three-channel RGB images by mapping semantic information into one channel and two types of entropy-based features into the other channels. This composite representation was classified using machine learning and deep learning models, resulting in enhanced accuracy. Similarly, Catak et al. [27] converted malware binaries into three-channel images where the red channel encodes byte values, the green channel captures entropy, and the blue channel is zero-padded; their system employs CNNs for classification.
Researchers in [28], proposed a multi-channel visualization method for malware classification that combines byte-level and assembly-level information into a unified RGB-like image. The first channel encodes the binary file as a grayscale matrix, the second channel uses Word2Vec embeddings of byte values, and the third channel applies Word2Vec embeddings to the opcodes of assembly instructions. These three channels are combined into an RGB image, which is classified using a modified LeNet-5 model. Evaluated on the BIG 2015 dataset, the method achieved an average accuracy of 98.76%. The MC-ISA method by [19] further advanced this concept by combining binary bytes (blue channel), assembly instructions (green), and a first-order Markov transition matrix from the binary (red) into a three-channel image. Various CNN backbones including ResNet50 and Inception variants were trained on these images, yielding accuracies exceeding 99%. Lastly, the MCTVD framework [8] extracts opcode sequences from assembly code to construct three Markov matrices representing opcode transition probabilities, which are encoded as RGB channels. These images were classified with architectures such as AlexNet and VGG variants, achieving accuracies above 99%.
While these RGB-based techniques leverage diverse feature modalities and CNN architectures effectively, their success depends on the model’s capacity to identify and emphasize informative patterns across channels, motivating the integration of attention mechanisms for more robust feature selection.
2.3 Attention Mechanisms in Image-Based Malware Detection
Attention mechanisms have recently been integrated into image-based malware detection frameworks to enhance the model’s ability to focus on the most informative spatial regions or feature channels.
Ganesan et al. [29] applied the Residual Attention Network architecture, originally developed for natural image classification, to grayscale malware image analysis. Their framework integrates attention units composed of a Trunk branch for residual feature extraction and a Mask branch for adaptive feature reweighting. Evaluated on a balanced dataset of approximately 6000 malware and benign samples, the model achieved 99.25% accuracy, demonstrating the potential of attention-based architectures in improving image-based malware detection.
Awan et al. [12] proposed SACNN, a Spatial Attention and Convolutional Neural Network framework that integrates a spatial attention module into a pre-trained VGG19 backbone for malware image classification. Their approach employs dynamic spatial convolution combined with global average pooling to generate attention maps that reweigh spatial feature responses. Evaluated on the Malimg dataset comprising 25 malware families, SACNN achieved 97.62% accuracy, demonstrating the effectiveness of spatial attention in enhancing image-based malware detection.
He et al. [30] introduced ResNeXt+, a ResNeXt-based malware detection and classification framework augmented with plug-and-play attention mechanisms. In their design, attention modules are inserted within the residual transformation blocks of ResNeXt, allowing attention functions to reweigh aggregated feature transformations before residual addition. Five established attention mechanisms—Squeeze-and-Excitation (SE), Efficient Channel Attention (ECA), Convolutional Block Attention Module (CBAM), Coordinate Attention (CA), and SimAM—were systematically evaluated within this unified architecture. By converting malware binaries into RGB images, the model captures both spatial and channel dependencies. Extensive experiments across seven benchmark datasets, including cross-dataset and adversarial evaluations, demonstrated improved generalization and robustness compared to baseline CNN models.
Ranjani and Chinnadurai [31] proposed a malware detection framework that converts API call sequences into grayscale images and employs a multi-stage deep learning architecture. Feature extraction is performed using Ef-DeSMob2, an integrated backbone combining DenseNet, MobileNetV2, and Squeeze-and-Excitation (SE) blocks for channel recalibration. For classification, the authors introduced SA:ResPyDSC, which integrates sparse attention, residual connections, and pyramidal depthwise separable convolutions to enhance multi-scale feature learning. Experimental results on a cloud malware dataset reported 98.06% accuracy, outperforming baseline CNN, ResNet, and recurrent models.
Tang et al. [6] proposed an Android malware detection method that transforms application bytecode into grayscale and Markov images, which are fused using transfer probabilities to create a texture feature space. They utilized an improved ResNet integrated with CBAM attention to enhance feature extraction and classification. Evaluated on Drebin and CICMalDroid 2020 datasets, the approach achieved up to 98.67% accuracy in binary classification and 98.14% in malware family classification, demonstrating competitive performance compared to traditional static/dynamic approaches and other image-based methods.
The reviewed studies illustrate the increasing integration of spatial, channel, and hybrid attention mechanisms into image-based malware detection frameworks. To provide a structured comparison of their methodological characteristics, Table 1 summarizes the key attention strategies employed in recent works.

Collectively, these studies demonstrate that attention-based mechanisms enhance discriminative feature learning in image-based malware detection. As summarized in Table 1, existing approaches primarily employ activation-magnitude-based spatial and/or channel weighting strategies, many of which are adapted from architectures originally developed for natural image analysis.
In addition to image-based frameworks, recent studies such as MAD-ANET [32] and DCA-DBiLSTM [33] further demonstrate the effectiveness of attention mechanisms across different malware representation paradigms. These approaches reinforce the importance of adaptive feature weighting for improving malware detection performance.
However, existing attention mechanisms, including those applied in both image-based and alternative representations, primarily derive importance weights from aggregated feature activations and do not explicitly incorporate distribution-aware statistical modeling tailored to the structural characteristics of malware representations.
Malware images often encode repetitive structural elements, such as opcode sequences and API call patterns, whose frequency distributions provide informative signals for distinguishing malicious from benign samples. In such representations, feature values are derived from encoding schemes that map program elements into numerical ranges (e.g., 0–255), where the absolute value itself is less informative than the frequency of occurrence. This highlights the importance of modeling distributional characteristics rather than relying solely on activation magnitudes.
To address this limitation, we propose FBAM, which introduces a frequency-based feature transformation that converts feature maps into distribution-aware representations prior to attention computation. By incorporating statistical frequency information directly into both spatial and channel attention, FBAM enables statistically informed and domain-aligned feature reweighting for image-based malware detection.
FBAM is designed to enhance feature reweighting by incorporating distribution-aware statistical information into the attention process.
3.1 Design Motivation for Frequency-Based Attention
Conventional attention mechanisms typically estimate feature importance based on activation magnitude, if highly activated regions correspond to informative features. While this assumption is effective for natural image analysis, it does not fully apply to image representations derived from program analysis. Unlike natural images, these representations do not contain semantically interpretable objects. Instead, they encode structural, semantic, and behavioural characteristics extracted from executable data. Informative patterns in such representations often appear as recurring structural arrangements or consistent value distributions rather than isolated high-activation responses.
This limitation becomes more evident in multi-channel image representations, where each channel encodes a different type of observable characteristic. Due to variations in feature availability and extraction reliability, these channels may exhibit uneven informativeness and distributional inconsistency. As a result, some channels contain stable and informative patterns, while others may be incomplete, noisy, or less discriminative. Under these conditions, relying solely on activation magnitude may lead to suboptimal feature weighting, as important patterns may not correspond to high activation values. This highlights the need for a mechanism that can explicitly capture statistical properties of feature distributions.
Importantly, this limitation reflects a fundamental mismatch between the inductive bias of convolutional neural networks and the distributional nature of malware representations. CNNs are inherently biased toward capturing local spatial patterns through activation magnitude, and attention mechanisms built upon these activations inherit this bias. However, informative patterns in malware data are often characterized by their statistical occurrence and distribution rather than their absolute magnitude. In malware image representations, feature values are obtained through encoding schemes that map structural elements, such as opcodes or API calls, into numerical ranges (e.g., 0–255), where the numerical value itself does not convey semantic importance. Instead, the frequency with which specific values occur reflects underlying structural and behavioral patterns. Consequently, attention mechanisms operating on raw activation values may overlook recurring patterns with low activation magnitude, while frequency-based representations make these patterns more distinguishable. Therefore, modeling the statistical distribution of feature values provides a more appropriate basis for identifying informative patterns in malware data.
To address this issue, we incorporate frequency-based analysis into the attention mechanism. By analysing the distribution of feature values, it becomes possible to identify recurring and statistically consistent patterns across channels. Specifically, the proposed FBAM introduces a frequency-based feature transformation that converts feature maps into a distribution-aware representation prior to attention computation. This enables both spatial and channel attention mechanisms to operate on statistical feature distributions rather than raw activation values.
Based on this design, FBAM integrates frequency-based statistical information into both spatial and channel attention, enabling domain-aligned feature weighting for multi-channel image representations.
FBAM performs feature reweighting using a frequency-aware representation of intermediate feature maps. The mechanism follows a two-stage design consisting of:
(1) a frequency-based feature transformation, and
(2) an attention computation on the transformed feature space.
Given an intermediate feature map
• Frequency-based feature transformation
• Spatial attention computation
• Channel attention computation
• Attention fusion
The overall process is illustrated in Fig. 1.

Figure 1: Architecture of the proposed frequency-based attention mechanism (FBAM).
As shown in Fig. 1, the input feature map is first transformed into a frequency-aware representation, after which spatial and channel attention are computed and combined to reweight the original feature map.
Step 1: Frequency-Based Feature Transformation
To incorporate distributional information into the feature representation, the input feature map X is transformed by normalizing and discretizing feature values into a finite set of bins, followed by computing the occurrence frequency of each discretized value. Each value is then replaced by its corresponding normalized frequency, producing the frequency-transformed feature map
where
Step 2: Frequency-Guided Spatial Attention
Given the frequency-transformed feature map
and the spatial attention weights are then obtained by applying a sigmoid function:
where
Step 3: Frequency-Guided Channel Attention
Given, the channel attention map
where
and the channel attention weights are then obtained as:
The formulation in Eq. (4) corresponds to the variance of the frequency-transformed feature map for each channel. Since
Step 4: Attention Fusion
To combine spatial and channel attention, the fused attention tensor F is obtained by element-wise multiplication of
where
Step 5: Reweighted Output
To obtain the final output, the input feature map X is reweighted using the fused attention tensor F as:
This reweighting enables the network to focus on structurally relevant, high-frequency patterns while suppressing low-information or noise-dominated regions.
This section describes the dataset, model architecture, attention integration strategy, training setup, evaluation metrics, and the experimental analyses conducted to assess the proposed FBAM. The evaluation is structured as follows:
1. Assessing whether integrating FBAM into deep learning models improves malware classification performance in terms of accuracy, precision, recall, and F1-score.
2. Comparing FBAM with established attention mechanisms (SE, CBAM, CA) to determine its relative effectiveness.
3. Benchmarking FBAM against a domain-specific attention-based malware detection model (SACNN) to assess its competitiveness.
4. Performing a component-wise analysis to examine the contribution of frequency-based information in spatial and channel attention.
5. Providing qualitative analysis through Grad-CAM visualization and feature distribution analysis.
6. Evaluating computational complexity in terms of parameters, FLOPs, and inference time.
The dataset comprised 18,060 Windows Portable Executable (PE) files, of which 9015 were malware and 9045 were benign samples. Samples were provided in .exe and .dll formats. Malware samples were collected from VirusShare (August–November 2024). Benign samples were obtained from trusted repositories [34,35] and clean installations of Windows 7, 10, and 11. All samples were validated via VirusTotal [36]. A file was labeled as malicious if flagged by at least four antivirus engines; benign samples were accepted only if no engine flagged them as malicious.
The dataset construction in this study follows commonly adopted practices in malware analysis research, including the use of VirusShare for malware collection and VirusTotal for consensus-based labeling. Similar data preparation approaches have been used in prior image-based malware detection studies [4,19,26], which may support its suitability for benchmarking and comparative evaluation. This consistency can also help facilitate comparison with existing methods while providing a representative view of malware characteristics.
Each PE file was converted to a 224 × 224 RGB image by encoding three complementary observable characteristics into separate channels. All preprocessing steps are deterministic and applied consistently across all samples:
1. Red channel: Structural features (binary code). The raw byte sequence of each PE file was extracted using the Ghidra reverse-engineering framework [37]. Each byte is represented as an integer in the range 0–255. The sequence was reshaped into a 224 × 224 matrix. Sequences shorter than the target size are zero-padded, while longer sequences are truncated.
2. Green channel: Semantic features (opcode transitions). Opcode sequences are extracted via Ghidra disassembly, retaining only opcode mnemonics. To define the semantic encoding space, opcode frequency analysis was performed prior to image generation on the malware and benign subsets separately. This analysis showed that both subsets shared the same 16 most frequently occurring opcodes. Based on this result, a fixed set of 16 opcodes was selected and used consistently for all samples throughout the dataset. A 16 × 16 lookup matrix was then constructed to encode consecutive opcode pairs into values within the range 0–255. This mapping was kept fixed for all samples to ensure consistent encoding of opcode transitions across the dataset. The encoded sequence was reshaped into a 224 × 224 matrix using padding or truncation.
3. Blue channel: Behavioral features (API call categories). Dynamic analysis is performed using the Cuckoo Sandbox environment [38]. API calls observed during execution were grouped into predefined functional categories provided by the Cuckoo Sandbox. In this study, 18 distinct API categories are observed across the dataset, each corresponding to a specific type of system operation (e.g., file system, network, process management). Each category was assigned a unique value in the range 0–255, and the resulting sequence is mapped to numerical values and reshaped into a 224 × 224 matrix using the same padding and truncation strategy.
The three matrices were then combined into a single RGB image of size 224 × 224 × 3, integrating structural, semantic, and behavioral characteristics into a unified representation for deep learning–based classification.
While transforming PE binaries into fixed-size image representations enables the use of CNNs, it introduces practical considerations related to sequence resizing and mapping. Specifically, shorter sequences are padded with zeros, while longer sequences are truncated to ensure consistent input dimensions. Prior studies have noted that such operations, as well as the mapping of one-dimensional sequences into two-dimensional image space, may influence how fine-grained features are represented [19,26].
In this work, a consistent and deterministic preprocessing strategy is applied across all samples to ensure stable and comparable feature representations. Despite these considerations, prior studies have demonstrated that image-based representations can effectively capture structural and statistical patterns in malware, supporting their use for classification tasks [4,7,8]. However, a detailed analysis of how representation choices affect classification reliability is beyond the scope of this study and remains an important direction for future work.
4.2 Model Configuration and Attention Integration
Seven deep learning architectures were employed in this study: AlexNet, EfficientNet-B0, LeNet-5, Inception-v3, MobileNetV1, VGG16, and VGG19. All models accepted an input of size 224 × 224 × 3. Each architecture preserves its original convolutional backbone to maintain the standard feature extraction process. To ensure comparability, each backbone was appended with an identical classification head consisting of a flattening layer followed by three fully connected layers with 512, 256, and 128 units, respectively, each employing ReLU activation. The final dense layer contains two units with a SoftMax activation to enable binary classification.
Each architecture was evaluated under five configurations: a baseline version without attention, and four variants incorporating the proposed FBAM, Squeeze-and-Excitation (SE) [39], Convolutional Block Attention Module (CBAM) [40], and Coordinate Attention (CA) [41].
Attention mechanisms are integrated into the feature extraction stage of each network at predefined locations. For architectures with sequential convolutional structures (LeNet-5, AlexNet, VGG16, and VGG19), attention is applied after the first convolutional block. For MobileNetV1, attention is inserted after the first depthwise separable convolution unit (conv_pw_1_relu). For EfficientNet-B0, attention is applied after the first MBConv block (block1a_project_bn).
For InceptionV3, due to its multi-branch architecture, attention is applied after the convolutional backbone and before the classification head to preserve the original computational structure.
For fair comparison, all attention mechanisms are integrated at the same corresponding locations within each architecture, and no architecture-specific tuning is applied. All models, including baseline and attention-based variants, are trained under identical preprocessing pipelines, hyperparameters, and training schedules to ensure a fair and controlled comparison.
A 10-fold cross-validation procedure was applied. For each fold, nine parts were used for training and one for validation. All models were trained from scratch (no pre-trained weights) using the Adam optimizer (learning rate = 1 × 10⁻⁵, batch size = 16) for up to 20 epochs, with early stopping (patience = 3). Best-performing weights were restored based on validation performance. Sparse categorical cross-entropy was used as the loss function.
All models are trained under identical settings across all configurations to ensure fair and consistent comparison between baseline and attention-based variants.
Model performance is evaluated using accuracy, precision, recall, F1-score, and confusion matrices. Metrics are computed for each fold and reported as mean ± standard deviation across all folds to obtain overall performance estimates.
• Accuracy: Overall proportion of correct predictions.
• Precision: Proportion of predicted malware that is truly malware.
• Recall: Proportion of actual malware correctly detected.
• F1-score: Harmonic mean of precision and recall, balancing both error types.
• Confusion matrix: Detailed breakdown of true positives, false positives, false negatives, and true negatives.
To assess statistical significance, paired t-tests (α = 0.05) are conducted on fold-wise results (n = 10), where each fold forms a paired observation. The test assumes that the differences between paired results are approximately normally distributed.
Statistical tests and effect size analysis (Cohen’s d) are specifically applied to the primary performance comparison experiment (Section 5.1) to evaluate the significance and magnitude of performance differences between baseline and FBAM-enhanced models.
For other experiments, results are reported descriptively using mean ± standard deviation to reflect performance trends and stability across folds.
Three experiments were conducted to evaluate the effectiveness, comparative performance, and competitiveness of FBAM in malware classification. Below is more detailed description of these experiments.
5.1 Impact of FBAM on Model Performance
The purpose of this experiment is to evaluate the effect of integrating FBAM into different CNN architectures and to determe whether it improves classification performance through enhanced feature reweighting. For each architecture, two configurations are evaluated: a baseline model without FBAM and a model with FBAM integrated, under identical experimental conditions. Performance metrics are computed for each fold and reported as mean ± standard deviation across all folds.
Seven deep learning architectures were used: AlexNet, EfficientNet-B0, LeNet-5, Inception-v3, MobileNetV1, VGG16, and VGG19. All models accepted an input of size 224 × 224 × 3. For each architecture, both configurations are trained using the same 10-fold cross-validation settings. Fig. 2 shows the comparative performance of baseline and FBAM-enhanced models across the four primary metrics (accuracy, precision, recall, and F1-score), averaged over 10 folds. Table 2 presents the statistical analysis, including paired t-test and effect sizes (Cohen’s d), used to assess the significance of performance differences.

Figure 2: Comparative performance of baseline and FBAM-enhanced models across four evaluation metrics, averaged over 10-fold cross-validation: (a) accuracy, (b) precision, (c) recall, and (d) F1-score.

The largest gains are observed in simpler architectures. For example, AlexNet shows an increase in mean accuracy from 95.33 ± 1.08 to 97.56 ± 0.64, while LeNet-5 improves from 94.04 ± 0.59 to 96.28 ± 0.65. These results indicate that FBAM is particularly effective in enhancing feature representations where baseline models have greater room for improvement. The reduced variability observed in several cases further suggests improved stability in model performance.
Modern lightweight and deep architectures also benefited. MobileNet improved from 89.92 ± 1.26 to 93.52 ± 4.14, while. InceptionV3 increased from 93.19 ± 2.00 to 96.54 ± 0.87. EfficientNet achieved smaller yet consistent gains, with accuracy improving from 90.91 ± 0.79 to 91.80 ± 0.66. These findings indicate that FBAM remains effective across architectures with different design characteristics.
Even high-performing deep networks showed measurable improvement. VGG16 increases from 97.28 ± 0.73 to 98.82 ± 0.43, and VGG19 from 97.42 ± 0.33 to 98.38 ± 0.57, demonstrating that FBAM provides consistent gains even when baseline performance is already strong. As expected, performance improvements in such architectures are relatively smaller, as these models operate closer to their performance limits, where further gains become inherently more constrained.
Statistical validation using paired t-tests (Table 2) confirms that all improvements were significant (p < 0.05). In particular, AlexNet (accuracy p = 0.0004) and LeNet5 (p = 0.0001 across all metrics) exhibited highly significant gains. InceptionV3 and MobileNet also achieved strong significance, with p-values below 0.022 for all metrics. EfficientNet recorded smaller effect sizes but remained statistically significant (p between 0.0118 and 0.0140), while VGG16 and VGG19 showed improvements with p < 0.001.
Overall, these results demonstrate the robustness of FBAM across architectures of varying depth and complexity. The improvements can be attributed to the ability of FBAM to incorporate frequency-based statistical information into the attention process, enabling distribution-aware feature reweighting. Gains in recall and F1-score are particularly important in malware detection, where minimizing false negatives is critical.
5.2 Comparison with Existing Attention Mechanisms
The purpose of this experiment is to compare FBAM with three widely used attention modules: SE, CBAM, and CA in terms of accuracy, precision, recall, and F1-score. For each model, four attention variants (FBAM, SE, CBAM, CA) were trained and evaluated under identical 10-fold cross-validation settings. Table 3 reports the results as mean ± standard deviation across folds, while Fig. 3 presents the fold-wise accuracy to illustrate performance stability. In addition, statistical significance analysis based on paired t-tests and effect size (Cohen’s d) is reported in Table 4.


Figure 3: Fold-wise accuracy for: (a) AlexNet, (b) EfficientNet, (c) LeNet-5, (d) InceptionV3, (e) MobileNet, (f) VGG16, and (g) VGG19.

The results in Table 3 show that FBAM achieved the highest mean performance in most evaluated cases compared to SE, CBAM, and CA across the tested CNN architectures. These improvements are consistently observed in both shallow architectures, such as AlexNet and LeNet-5, and deeper models, such as VGG16, VGG19, and EfficientNet-B0, indicating that FBAM generalizes well across different network depths and architectural designs.
In simpler architectures, the performance gains are more pronounced. For example, in AlexNet, FBAM achieves an accuracy of 97.56 ± 0.64, compared with 96.36 ± 0.55 for SE, 93.25 ± 3.87 for CBAM, and 96.39 ± 0.80 for CA. Similarly, in LeNet-5, FBAM records 96.28 ± 0.65, outperforming SE (94.55 ± 1.55), CBAM (93.59 ± 3.28), and CA (95.39 ± 0.95). These improvements are statistically significant, as confirmed by the results in Table 4.
In deeper and more advanced architectures, FBAM maintains its advantage, although the margins are smaller in some cases. In EfficientNet-B0, FBAM achieves 91.80 ± 0.66, slightly exceeding CA (91.78 ± 1.25), CBAM (91.36 ± 1.17), and SE (91.27 ± 1.21). In MobileNet, FBAM achieves 93.52 ± 4.14, remaining higher than SE (92.59 ± 5.60), CA (92.08 ± 5.40), and CBAM (92.02 ± 4.29). However, as indicated by Table 4, these differences are not always statistically significant. In InceptionV3, FBAM reaches 96.54 ± 0.87, compared with 95.21 ± 1.16 for CBAM, 95.09 ± 1.30 for CA, and 94.61 ± 1.14 for SE, with statistically significant improvements.
A similar trend is observed in the highest-performing architectures. In VGG16, FBAM achieves achieved 98.82 ± 0.43, compared with 97.67 ± 1.62 for CA, 97.56 ± 1.44 for CBAM, and 97.49 ± 0.87 for SE, with statistically significant gains. In VGG19, FBAM records 98.38 ± 0.57, outperforming CA (98.21 ± 0.44), SE (97.87 ± 0.37), and CBAM (96.17 ± 3.54), however, as indicated by Table 4, some of these differences are not statistically significant, likely due to the relatively small performance margins observed between methods, despite the overall high baseline performance.
Fig. 3 further illustrates the fold-wise accuracy of the compared attention mechanisms. FBAM shows stable behaviour across folds, whereas competing methods, particularly CBAM, exhibit larger fluctuations in several architectures, such as AlexNet, LeNet-5, and VGG19. This indicates that FBAM not only improves mean performance but also provides more robust behaviour across different data splits.
Overall, the results demonstrate that FBAM achieves both stronger average performance and competitive stability compared to SE, CBAM, and CA. The statistical analysis further confirms that these improvements are significant in most cases, while indicating that the performance differences are smaller in highly optimized architectures.
5.3 Comparison with Attention-Based Related Work (SACNN)
The purpose of this experiment is to benchmark FBAM against SACNN (Awan, Masood et al. 2021), an attention-based malware detection method. The comparison is conducted using VGG16 and VGG19 under identical 10-fold cross-validation settings to ensure fair evaluation.
Table 5 presents the average performance metrics (mean ± standard deviation), while Fig. 4 provides a visual comparison across accuracy, precision, recall, and F1-score. In addition, Fig. 5 illustrates the normalized confusion matrices for both models, offering further insight into classification behaviour.


Figure 4: Comparison of VGG16 and VGG19 performance with FBAM and SACNN across four metrics: (a) accuracy, (b) precision, (c) recall, and (d) F1-score.

Figure 5: Normalized confusion matrices of (a) VGG16 and (b) VGG19 (with FBAM and SACNN).
The results in Table 5 show that FBAM consistently outperforms SACNN across all evaluation metrics. For VGG16, FBAM achieves an accuracy of 98.82 ± 0.43, compared with 97.26 ± 1.24 for SACNN. Similar improvements are observed for precision, recall, and F1-score. For VGG19, FBAM attains 98.38 ± 0.57, exceeding the 97.65 ± 0.42 achieved by SACNN.
Although the average improvements across metrics range from approximately 0.6% to 0.8%, these gains are practically significant in malware detection, where even small reductions in misclassification rates can substantially improve system reliability and security.
Fig. 5a shows that integrating FBAM into VGG16 reduces the false positive rate for benign samples from 3% to 1% and the false negative rate for malware from 2% to 1%, thereby decreasing both unnecessary alerts and missed detections. Similarly, Fig. 5b demonstrates that, for VGG19, FBAM lowers the false negative rate for malware from 2% to 1% while keeping the false positive rate for benign samples unchanged at 2%.
These improvements indicate that FBAM enhances both detection accuracy and error consistency by reducing misclassifications in both classes. The observed gains in recall and F1-score further confirm the effectiveness of FBAM in minimizing false negatives, which is critical in malware detection scenarios.
Overall, the results demonstrate that FBAM provides more accurate and reliable performance than SACNN across both evaluated architectures, highlighting its effectiveness as a domain-aligned attention mechanism for malware detection.
5.4 Ablation Study of FBAM Components
To further investigate the contribution of individual components of the proposed FBAM, a component-wise analysis is performed using the AlexNet architecture as a representative model. The analysis evaluates the impact of spatial attention, channel attention, and frequency-based weighting on model performance. Specifically, the following variants were examined: (i) channel attention without frequency information, (ii) channel attention with frequency information, (iii) spatial attention without frequency information, (iv) spatial attention with frequency information, (v) full FBAM without frequency information, and (vi) full FBAM with frequency information. Table 6 presents the average classification performance (mean ± standard deviation) across 10-fold cross-validation.

The results in Table 6 demonstrate that incorporating frequency information consistently improves performance across all attention configurations.
For channel attention, the inclusion of frequency information increases accuracy from 93.71 ± 1.32 to 95.29 ± 0.77, with corresponding improvements in precision, recall, and F1-score. In addition to the performance gain, the standard deviation is reduced, indicating improved stability across folds.
A similar trend is observed in spatial attention, where accuracy improves from 94.29 ± 0.99 to 95.16 ± 0.73, along with consistent gains across all evaluation metrics and lower variability.
The most significant improvement is observed in the full FBAM configuration. Without frequency information, the model achieves an accuracy of 94.22 ± 1.01, whereas incorporating frequency information increases accuracy substantially to 97.56 ± 0.64. This improvement is reflected across precision, recall, and F1-score, with a clear reduction in variability.
These results indicate that frequency information plays a critical role in enhancing feature learning. The observed improvements can be attributed to the incorporation of distribution-aware representations into the feature learning process. In malware image representations, feature values are derived from encoding schemes (e.g., mapping structural elements such as opcodes into numerical ranges), where the absolute value is less informative than the frequency of occurrence. By modeling the distribution of feature values, FBAM captures recurring and statistically consistent patterns that are not explicitly emphasized by conventional attention mechanisms operating on raw activation values. This enables more effective discrimination between informative and less relevant features, leading to improved performance.
Overall, the findings confirm that the effectiveness of FBAM is strongly dependent on the incorporation of frequency-based information, which contributes not only to improved performance but also to more stable performance across folds, as reflected by reduced variability and supported by the statistical analysis.
5.5 Grad-CAM Visualization and Feature Distribution Analysis
For qualitative analysis, the AlexNet architecture is used as a representative model to illustrate the effect of FBAM. Grad-CAM [42] is employed to visualize the regions contributing to model predictions, as shown in Fig. 6. In addition, feature distribution analysis is performed by extracting feature maps from the same model before and after the FBAM layer and aggregating their activation values across multiple test samples, as presented in Fig. 7.

Figure 6: Grad-CAM visualization of baseline and FBAM models.

Figure 7: Feature distribution and statistical analysis before and after FBAM.
Fig. 6 shows a comparison between the baseline model and the FBAM-enhanced model. The baseline produces more scattered activations, while FBAM results in more focused and spatially coherent attention regions. This indicates that FBAM more effectively localizes discriminative features compared to the baseline.
Fig. 7 illustrates the distribution of feature values before and after applying FBAM. The results show that FBAM leads to a more concentrated distribution, with a noticeable reduction in variance (from 328.75 to 22.10), while entropy and sparsity remain largely unchanged. This indicates that FBAM reduces the spread of feature values while preserving entropy and sparsity, leading to more stable and discriminative feature representations.
Overall, these observations are consistent with the experimental results, indicating that FBAM improves both the discriminative quality and stability of the learned feature representations.
5.6 Computational Complexity Analysis
To evaluate the computational overhead introduced by the proposed FBAM, we compare the number of parameters, floating point operations (FLOPs), and inference time across different attention mechanisms, including SE, CBAM, CA, and FBAM. Table 7 presents the comparison results using the AlexNet architecture.

The results in Table 7 show that FBAM does not introduce additional parameters compared to the baseline model. Specifically, FBAM maintains the same number of parameters (7.1890 M), while SE, CBAM, and CA introduce slight increases.
In terms of computational cost, FBAM results in a small increase in FLOPs (1.9346 G, +0.021%), which is comparable to CBAM and slightly higher than SE and CA. This indicates that the proposed method does not significantly increase computational complexity.
Regarding inference latency, FBAM achieves an inference time of 13.656 ms. Although this is higher than the baseline (8.317 ms), it remains comparable to other attention mechanisms, such as CA (13.472 ms) and CBAM (14.339 ms).
Overall, the results indicate that FBAM improves classification performance while maintaining efficient computational characteristics, with only minor increases in computational cost.
In this study, the Frequency-Based Attention Mechanism (FBAM) has been proposed as a domain-aware attention module aligned with image-based malware detection. Unlike conventional attention mechanisms designed for natural images, FBAM leverages frequency-based statistical information to guide both spatial and channel attention. This design enables the model to capture distributional characteristics that are more aligned with the structural and behavioural properties of malware data.
Through extensive experiments on seven CNN architectures (AlexNet, LeNet5, MobileNetV1, EfficientNet-B0, InceptionV3, VGG16, and VGG19), FBAM consistently improved classification performance across all evaluation metrics, including accuracy, precision, recall, and F1-score. The most notable improvements were observed in relatively shallow architectures, where AlexNet improving from 95.33% to 97.56% and LeNet5 from 94.04% to 96.28%. Importantly, even deep architectures with strong baseline performance, such as VGG16 and VGG19, showed measurable gains, achieving 98.82% and 98.38% accuracy, respectively. Statistical analyses further confirmed that these improvements are significant (p < 0.05), indicating that FBAM’s effectiveness in enhancing features reweighting and reducing the influence of less informative features.
Comparative evaluations against widely used attention mechanisms, including SE, CBAM, and CA as well as the domain-specific SACNN approach, further validated the effectiveness of FBAM. Across all evaluated architectures, FBAM consistently achieved the highest mean accuracy while maintaining stable performance across cross-validation folds. Statistical analysis further indicates that these improvements are significant in most cases, while some differences are not statistically significant due to relatively small performance margins across folds. Additionally, reductions in both false positives and false negatives highlight its practical relevance for real-world malware detection systems.
The ablation study confirms the critical role of frequency information in the proposed design, showing that incorporating frequency-based weighting significantly improves performance compared to non-frequency variants. From a computational perspective, FBAM introduces no additional parameters and results in only minor increases in FLOPs and inference time, demonstrating that performance gains are achieved with minimal computational overhead.
The observed performance gains also suggest that computing frequency statistics from the feature tensor enables the model to capture meaningful distributional patterns. In the context of malware analysis, such patterns may reflect recurring structural patterns, reused code segments, or common behavioural characteristics within samples. By incorporating these distributional patterns into the attention mechanism, FBAM can emphasize features that are consistently informative, thereby improving discriminative performance.
Although the experimental evaluation is conducted on a single dataset of 18,060 Windows PE samples, the dataset is relatively large and constructed following widely adopted practices in malware research, including VirusShare-based collection and VirusTotal-based labeling. This ensures consistency with prior studies and supports reliable benchmarking and comparative evaluation. However, we acknowledge that evaluation on a single dataset may not fully capture the variability of real-world and evolving malware distributions. Therefore, while the dataset provides a reasonable basis for benchmarking and comparative evaluation, further evaluation is required to more comprehensively assess the generalization capability of the proposed approach.
Future work will focus on extending the evaluation to larger and more diverse datasets, including cross-family and cross-dataset scenarios, to better assess generalization under realistic conditions. Additional directions include exploring alternative frequency modelling strategies, such as estimating frequency statistics using localized regions within the feature map to enable more fine-grained distribution modelling, although such approaches may introduce additional computational overhead compared to the current frequency formulation. Future work may also focus on enhancing dynamic feature quality, particularly in cases where API traces are incomplete or unavailable, as improving this channel could strengthen the hybrid visual encoding. Another promising direction is extending the approach to other executable formats, such as Android APKs and Linux ELF files, to broaden applicability beyond Windows binaries. Finally, evaluating the proposed method under adversarial and evasion-driven conditions would provide further insight into its robustness against obfuscation and intentionally modified samples.
Acknowledgement: The authors extend their appreciation to the Deanship of Scientific Research at Imam Mohammad Ibn Saud Islamic University (IMSIU) for funding this work through grant number IMSIU-DDRSP2604.
Funding Statement: This work was supported and funded by the Deanship of Scientific Research at Imam Mohammad Ibn Saud Islamic University (IMSIU) (grant number IMSIU-DDRSP2604).
Author Contributions: The authors confirm contribution to the paper as follows: Conceptualization and study design, Anis Elgarduh, Anazida Zainal and Fuad A. Ghaleb; Development of the FBAM, Anis Elgarduh; Feature extraction pipeline, Anis Elgarduh and Faisal Saeed; Dataset preparation and quality verification, Anis Elgarduh, Faisal Saeed and Fuad A. Ghaleb; Implementation of comparative baselines, Anis Elgarduh and Fuad A. Ghaleb; Software implementation and experimental execution, Anis Elgarduh; Validation of experimental methodology, Anis Elgarduh, Anazida Zainal and Sultan Noman Qasem; Performance analysis and interpretation of results, Anis Elgarduh, Anazida Zainal and Abdullah M. Albarrak; Literature review and synthesis, Anis Elgarduh, Sultan Noman Qasem and Faisal Saeed; Manuscript—original drafting, Anis Elgarduh; Manuscript—critical review and intellectual revision, Anazida Zainal, Fuad A. Ghaleb, Abdullah M. Albarrak, Sultan Noman Qasem and Faisal Saeed; Visualization of figures and experimental outputs, Anis Elgarduh, Abdullah M. Albarrak and Faisal Saeed; Supervision and technical guidance, Anazida Zainal and Fuad A. Ghaleb; Project administration, Anazida Zainal, Abdullah M. Albarrak and Sultan Noman Qasem. All authors reviewed and approved the final version of the manuscript.
Availability of Data and Materials: The data that support the findings of this study are available from Anis Elgarduh, upon reasonable request.
Ethics Approval: Not applicable.
Conflicts of Interest: The authors declare no conflicts of interest.
References
1. AV-TEST-Institute. Malware statistics and trends report. Magdeburg, Germany: AV-TEST Institute; 2025[cited 2025 August 7]. Available from: https://www.av-test.org/en/statistics/malware/. [Google Scholar]
2. Geng J, Wang J, Fang Z, Zhou Y, Wu D, Ge W. A survey of strategy-driven evasion methods for PE malware: transformation, concealment, and attack. Comput Secur. 2024;137:103595. doi:10.1016/j.cose.2023.103595. [Google Scholar] [CrossRef]
3. Fu J, Xue J, Wang Y, Liu Z, Shan C. Malware visualization for fine-grained classification. IEEE Access. 2018;6:14510–23. doi:10.1109/ACCESS.2018.2805301. [Google Scholar] [CrossRef]
4. Jian Y, Kuang H, Ren C, Ma Z, Wang H. A novel framework for image-based malware detection with a deep neural network. Comput Secur. 2021;109(3):102400. doi:10.1016/j.cose.2021.102400. [Google Scholar] [CrossRef]
5. Van Dao T, Sato H, Kubo M. An attention mechanism for combination of CNN and VAE for image-based malware classification. IEEE Access. 2022;10(3):85127–36. doi:10.1109/ACCESS.2022.3198072. [Google Scholar] [CrossRef]
6. Tang J, Xu W, Peng T, Zhou S, Pi Q, He R, et al. Android malware detection based on a novel mixed bytecode image combined with attention mechanism. J Inf Secur Appl. 2024;82:103721. doi:10.1016/j.jisa.2024.103721. [Google Scholar] [CrossRef]
7. Verma V, Muttoo SK, Singh VB. Multiclass malware classification via first- and second-order texture statistics. Comput Secur. 2020;97(4):101895. doi:10.1016/j.cose.2020.101895. [Google Scholar] [CrossRef]
8. Deng H, Guo C, Shen G, Cui Y, Ping Y. MCTVD: a malware classification method based on three-channel visualization and deep learning. Comput Secur. 2023;126(7):103084. doi:10.1016/j.cose.2022.103084. [Google Scholar] [CrossRef]
9. Gibert D, Mateu C, Planes J. The rise of machine learning for detection and classification of malware: research developments, trends and challenges. J Netw Comput Appl. 2020;153(4):102526. doi:10.1016/j.jnca.2019.102526. [Google Scholar] [CrossRef]
10. Bijitha CV, Nath HV. On the effectiveness of image processing based malware detection techniques. Cybern Syst. 2022;53(7):615–40. doi:10.1080/01969722.2021.2020471. [Google Scholar] [CrossRef]
11. Xiao M, Guo C, Shen G, Cui Y, Jiang C. Image-based malware classification using section distribution information. Comput Secur. 2021;110(2):102420. doi:10.1016/j.cose.2021.102420. [Google Scholar] [CrossRef]
12. Awan MJ, Masood OA, Abed Mohammed M, Yasin A, Zain AM, Damaševičius R, et al. Image-based malware classification using VGG19 network and spatial convolutional attention. Electronics. 2021;10(19):2444. doi:10.3390/electronics10192444. [Google Scholar] [CrossRef]
13. Wang P, Tang Z, Wang J. A novel few-shot malware classification approach for unknown family recognition with multi-prototype modeling. Comput Secur. 2021;106:102273. doi:10.1016/j.cose.2021.102273. [Google Scholar] [CrossRef]
14. Zhu J, Jang-Jaccard J, Singh A, Welch I, AL-Sahaf H, Camtepe S. A few-shot meta-learning based siamese neural network using entropy features for ransomware classification. Comput Secur. 2022;117(7):102691. doi:10.1016/j.cose.2022.102691. [Google Scholar] [CrossRef]
15. Aslan Ö., Yilmaz AA. A new malware classification framework based on deep learning algorithms. IEEE Access. 2021;9:87936–51. doi:10.1109/ACCESS.2021.3089586. [Google Scholar] [CrossRef]
16. Tayyab UEH, Khan FB, Durad MH, Khan A, Lee YS. A survey of the recent trends in deep learning based malware detection. J Cybersecur Priv. 2022;2(4):800–29. doi:10.3390/jcp2040041. [Google Scholar] [CrossRef]
17. Manavi F, Hamzeh A. A new method for malware detection using opcode visualization. In: Proceedings of the 2017 Artificial Intelligence and Signal Processing Conference (AISP); 2017 Oct 25–27; Shiraz, Iran. p. 96–102. [Google Scholar]
18. Gibert D, Mateu C, Planes J. HYDRA: a multimodal deep learning framework for malware classification. Comput Secur. 2020;95(4):101873. doi:10.1016/j.cose.2020.101873. [Google Scholar] [CrossRef]
19. Qi X, Liu W, Lou R, Li Q, Jiang L, Tang Y. MC-ISA: a multi-channel code visualization method for malware detection. Electronics. 2023;12(10):2272. doi:10.3390/electronics12102272. [Google Scholar] [CrossRef]
20. Nataraj L, Karthikeyan S, Jacob G, Manjunath BS. Malware images: visualization and automatic classification. In: Proceedings of the 8th International Symposium on Visualization for Cyber Security; 2011 Jul 20; Pittsburgh, PA, USA. p. 1–7. [Google Scholar]
21. Naeem H, Guo B, Naeem MR, Ullah F, Aldabbas H, Javed MS. Identification of malicious code variants based on image visualization. Comput Electr Eng. 2019;76(1):225–37. doi:10.1016/j.compeleceng.2019.03.015. [Google Scholar] [CrossRef]
22. Iadarola G, Martinelli F, Mercaldo F, Santone A. Image-based malware family detection: an assessment between feature extraction and classification techniques. In: Proceedings of the 5th International Conference on Internet of Things, Big Data and Security; 2020 May 7–9; Online. p. 499–506. [Google Scholar]
23. Makandar A, Patrot A. Malware class recognition using image processing techniques. In: Proceedings of the 2017 International Conference on Data Management, Analytics and Innovation (ICDMAI); 2017 Feb 24–26; Pune, India. p. 76–80. [Google Scholar]
24. Luo JS, Lo DC. Binary malware image classification using machine learning with local binary pattern. In: Proceedings of the 2017 IEEE International Conference on Big Data (Big Data); 2017 Dec 11–14; Boston, MA, USA. p. 4664–7. [Google Scholar]
25. Zhao Z, Yang S, Zhao D. A new framework for visual classification of multi-channel malware based on transfer learning. Appl Sci. 2023;13(4):2484. [Google Scholar]
26. Vu DL, Nguyen TK, Nguyen TV, Nguyen TN, Massacci F, Phung PH. HIT4Mal: hybrid image transformation for malware classification. Trans Emerg Telecommun Technol. 2020;31(11):e3789. doi:10.1002/ett.3789. [Google Scholar] [CrossRef]
27. Catak FO, Ahmed J, Sahinbas K, Khand ZH. Data augmentation based malware detection using convolutional neural networks. arXiv:2010.01862. 2020. [Google Scholar]
28. Qiao Y, Jiang Q, Jiang Z, Gu L. A multi-channel visualization method for malware classification based on deep learning. In: Proceedings of the 2019 18th IEEE International Conference on Trust, Security and Privacy in Computing and Communications/13th IEEE International Conference on Big Data Science and Engineering (TrustCom/BigDataSE); 2019 Aug 5–8; Rotorua, New Zealand. p. 757–62. [Google Scholar]
29. Ganesan S, Ravi V, Krichen M, Sowmya V, Alroobaea R, Kp S. Robust malware detection using residual attention network. In: Proceedings of the 2021 IEEE International Conference on Consumer Electronics (ICCE); 2021 Jan 10–12; Las Vegas, NV, USA. p. 1–6. [Google Scholar]
30. He Y, Kang X, Yan Q, Li E. ResNeXt: attention mechanisms based on ResNeXt for malware detection and classification. IEEE Trans Inf Forensics Secur. 2024;19:1142–55. doi:10.1109/TIFS.2023.3328431. [Google Scholar] [CrossRef]
31. Ranjani B, Chinnadurai M. Sparse attention with residual pyramidal depthwise separable convolutional based malware detection with optimization mechanism. Sci Rep. 2024;14(1):24414. doi:10.1038/s41598-024-76193-4. [Google Scholar] [PubMed] [CrossRef]
32. Al-Ghanem WK, Qazi EUH, Zia T, Faheem MH, Imran M, Ahmad I. MAD-ANET: malware detection using attention-based deep neural networks. Comput Model Eng Sci. 2025;143(1):1009–27. doi:10.32604/cmes.2025.058352. [Google Scholar] [CrossRef]
33. Alassafi MO, Hasan SH. Dual-channel attention deep bidirectional long short term memory for enhanced malware detection and risk mitigation. Comput Model Eng Sci. 2025;144(2):2627–45. doi:10.32604/cmes.2025.064926. [Google Scholar] [CrossRef]
34. Chocolatey Software, Inc. Windows package manager. 2024 [cited 2025 Jan 1]. Available from: https://chocolatey.org. [Google Scholar]
35. CNET-Downloads. CNET, technology news and software download. 2024 [cited 2025 Jan 1]. Available from: https://www.cnet.com. [Google Scholar]
36. VirusTotal. VirusTotal, multi-engine malware scanning service. 2024 [cited 2025 Jan 1]. Available from: https://www.virustotal.com. [Google Scholar]
37. Ghidra. Software reverse engineering framework. 2024 [cited 2025 Jan 1]. Available from: https://ghidra-sre.org. [Google Scholar]
38. Cuckoo. Cuckoo Sandbox, automated malware analysis: cuckoo automated malware analysis. 2014 [cited 2025 Jan 1]. Available from: https://cuckoosandbox.org/. [Google Scholar]
39. Hu J, Shen L, Sun G. Squeeze-and-excitation networks. In: Proceedings of the 2018 IEEE/CVF Conference on Computer Vision and Pattern Recognition; 2018 Jun 18–23; Salt Lake City, UT, USA. p. 7132–41. [Google Scholar]
40. Woo S, Park J, Lee JY, Kweon IS. CBAM: convolutional block attention module. In: Proceedings of the European Conference on Computer Vision (ECCV); 2018 Sep 8–14; Munich, Germany. p. 3–19. [Google Scholar]
41. Hou Q, Zhou D, Feng J. Coordinate attention for efficient mobile network design. In: Proceedings of the 2021 IEEE/CVF Conference on Computer Vision and Pattern Recognition (CVPR); 2021 Jun 20–25; Nashville, TN, USA. p. 13708–17. [Google Scholar]
42. Selvaraju RR, Cogswell M, Das A, Vedantam R, Parikh D, Batra D. Grad-CAM: visual explanations from deep networks via gradient-based localization. Int J Comput Vis. 2020;128(2):336–59. doi:10.1007/s11263-019-01228-7. [Google Scholar] [CrossRef]
Cite This Article
 Copyright © 2026 The Author(s). Published by Tech Science Press.
This work is licensed under a Creative Commons Attribution 4.0 International License , which permits unrestricted use, distribution, and reproduction in any medium, provided the original work is properly cited.
 Downloads
 Citation Tools