
 Login
Login Register
 Submit a Paper
 Propose a Special lssue
 Open Access
ARTICLE

Dynamic Graph Multi-Scale Network for Breast Cancer Classification Using eXplainable Artificial Intelligence with Class Imbalance Mitigation in Medical and Healthcare Systems
1 Artificial Intelligence & Data Analytics Lab, College of Computer Science and Information System (CCIS), Prince Sultan University, Riyadh, Saudi Arabia
2 Department of Mathematical Sciences, College of Science, Princess Nourah Bint Abdulrahman University, Riyadh, Saudi Arabia
3 College of Sciences and Humanities (CSH), Prince Sultan University, Riyadh, Saudi Arabia
* Corresponding Author: Faten S. Alamri. Email:
(This article belongs to the Special Issue: Machine Learning and Deep Learning-Based Pattern Recognition, 2nd Edition)
Computer Modeling in Engineering & Sciences 2026, 148(1), 43 https://doi.org/10.32604/cmes.2026.084816
Received 29 April 2026; Accepted 11 June 2026; Issue published 27 July 2026
 View Full Text
 Download PDF
Abstract
In the era of artificial intelligence, pattern recognition techniques have become fundamental in advancing medical image processing, diagnosis, and automated disease classification systems. Among various clinical challenges, breast cancer is the second most dangerous leading cause of death in women worldwide. Early and accurate detection of breast cancer is crucial to develop advanced diagnostic methods to control further loss or reduce mortality rates. This study proposes a dynamic graph multi-scale network for breast cancer diagnosis, integrated with multi-scale convolutional feature extraction, a squeeze-and-excitation block, and a graph convolutional network to jointly model local spatial features and global contextual dependencies. To mitigate the limitations of the dataset, this work incorporated mammography-based augmentation techniques to enhance the datasets and also a synthetic minority oversampling technique to generate samples to balance the class and enhance model generalization. Several experiments are performed using large MIAS, INbreast, and DDSM mammogram datasets with an RTX-3080 GPU with hold-out split and cross-validation methods. Experimental results demonstrate that the proposed model achieves a 3.99% improvement compared to pretrained models, indicating its effectiveness in handling complex mammographic patterns. The approach achieves (0.9866–0.9943) accuracy with a confidence interval of 0.95 andGraphic Abstract
Keywords
Breast cancer is one of the most prevalent chronic diseases among women. Every year, the disease claims the lives of millions of individuals and diagnoses millions more with breast cancer [1]. In 2022, breast cancer resulted in 670,000 fatalities worldwide. Women account for nearly half of all breast cancer cases, with their age and gender being the only known risk factors for the disease. breast cancer was the most prevalent cancer type in 157 of the 185 countries that had a female population, and on a global scale, it affects individuals [2]. Even though the frequency of cancer-related fatalities has decreased as a result of routine mammography screening, early detection and therapy remain essential for reducing the number of such deaths [3,4]. Early detection and treatment of breast cancer can significantly reduce the mortality rate. Mammography is one of the most effective methods for early detection of breast cancer [5].
For breast cancer, gender is the most significant risk factor. However, only 0.5%–1% of men receive a diagnosis, while 99% of women receive it. Male breast cancer patients must follow the same treatment guidelines as females. Age, obesity, heavy alcohol use, radiation exposure history, personal or family history of breast cancer, reproductive history, cigarette smoking, and postmenopausal hormone therapy all contribute to cancer risk. Being female and over 40 are the only known cancer risk factors for women. These factors account for approximately 50% of cancer cases. Malignant small cancer without lymph nodes is more likely to respond to treatment. Breast cancer may spread to other organs and tissues, causing additional symptoms [6,7]. Researchers are specifically concentrating on biomedical imaging to aid proficient radiologists. Early identification of cancer is critical for cancer diagnosis and analysis. Researchers have used many biomedical imaging techniques to diagnose cancer. Radiologists have challenges in identifying regions of concern or malignancy among the multitude of images [8]. Therefore, radiologists want an automated solution that can effectively reduce their workload [9,10].
For medical professionals, the existing screening procedures for breast cancer are labor-intensive, expensive, and time-consuming as well. From an image processing standpoint, diagnosing cancer automatically and reliably is a challenging problem. Mammography visuals are large and complicated, which is an additional challenge. The following factors impact the development of therapies: the inability of deep learning models to generalize in complex, real-world medical datasets; the ethical and legal limitations on data sharing; the scarcity of labeled high-quality datasets; and emerging limits. Therefore, it is critical to diagnose cancer as soon as possible and to start an appropriate kind of therapy. The primary rationale for the necessity of a robust screening program and automation in cancer diagnosis is as follows: It may take many months to diagnose cancer manually, and even in its early stages, survival may not be feasible if the disease spreads beyond the designated region. This emphasizes how important it is to have a trustworthy automated method for detecting cancer.
The primary goal of this research endeavor is to persuade pathologists and medical professionals, who are experts in their respective fields, to use automatic methods for accurate breast cancer diagnosis and evaluation. Here are some of the contributions made to this research endeavor.
• This study proposes a dynamic graph multi-scale network for breast cancer that combines multi-scale convolution, squeeze-and-excitation, and a graph convolutional network to capture local and global features.
• This study introduces a graph-based representation of feature maps, treating spatial regions as nodes and learning their relationships via a similarity-based adjacency matrix for long-range interactions.
• This study utilized three breast mammography datasets, MIAS, INbreast, and DDSM, for robust experimentation, demonstrating strong generalization and consistent performance.
• A class imbalance-aware training strategy is employed using the synthetic minority over-sampling technique (SMOTE) and also incorporates a range of augmentation techniques to enhance the training data.
• The study incorporated a comprehensive evaluation strategy, including a holdout split and cross-validation experiments, to assess the generalization of the proposed mode.
• The comparative analysis with pretrained models and with the existing work was also incorporated to validate the proposed approach’s performance.
• An explainable AI (XAI) analysis is incorporated using Grad-CAM to generate class-discriminative localization maps, enabling visual interpretation of model decisions.
The rest of the paper is organized as follows; Section 2 presents the literature work for cancer detection, Section 3 describes the materials and methods, Section 4 discuss the experimental results and Section 5 concludes the study.
Several authors employed deep learning (DL) and machine learning (ML) models for the classification of breast cancer using mammography datasets. Jayandhi et al. [11] employed SVM to construct a deep learning architecture (DLA) capable of effectively identifying breast cancer. It integrates the concepts of DLA and SVM. In real-world applications, like medical image diagnosis, the visual geometry group (VGG) softmax layer assumes that the training samples were all from the same class. There was insufficient evidence to support this assumption. DLA often requires a large number of samples and also uses data augmentation. They build a VGG model with several SVM kernels to categorize mammograms. The findings show that the VGG-SVM model had outstanding potential for correctly classifying mammogram from the MIAS database. Gnanasekaran et al. [12] demonstrated the efficacy of convolutional neural network (CNN) in breast mass classification in medical image processing. The authors also compared the results to contemporary ML techniques, such as the k-nearest neighbors (kNN) algorithm. The investigations used three sets of data. The model applied for this proposal achieved accuracy scores of 91.44% for the MIAS dataset.
Karthiga et al. [13] presented two unique methods, the first method utilizes the transfer learning method and the second method includes creating neural networks and tuning the hyperparameters to get a better performance. The results show that the proposed method had successful results for MIAS (94.95%), DDSM (99.39%), INbreast (96.53%), and the consolidated datasets (92.27%). To demonstrate the effectiveness of the new method, compare the proposed method results to previously used methods. The authors employed mammograms to detect breast cancer using DL. The DL model was used to remove noise from mammography images and adaptive fuzzy-based median filtering (AFF) as a preprocessing method. The authors validated the diagnostic results of the method using the Mini-MIAS and DDSM datasets. On the Mini-MIAS dataset, the model had an overall good accuracy rate [14]. The main purpose of research [15] was to determine how well the DL architecture for mammography performs using the MIAS and DDSM datasets. The techniques outlined in this study could effectively separate the cancer zone in an abnormal mammography sample from other regions based on significant testing findings.
Yaqub et al. [16] had successfully developed and validated an accurate DL-based breast cancer detection system. For the compilation of the images, the architecture could be durable and efficient against benchmark dataset. Their methodology made significant improvements to create a novel design that integrates ResNet, UNet, and transformer blocks. Customized method was used to optimize the suggested technique and applied effective segmentation process. In another work presented by Zafar et al. [17], performed segmentation on breast cancer using encoder-decoder method leveraged with multi-cascade convolutional block attention module. The ensemble model was developed by the Das et al. [18] to detect the breast cancer utilizing gene expression data and breast histology. Three CNNs were used as main classifiers after data was decomposed using variation mode decomposition and an empirical wavelet transform. Hussain et al. [19] introduced a technique to distinguish between benign and malignant pre-segmented breast anomalies in mammography. Their accuracy rate reached 88%. In their study, Alkhaleefah et al. [20] shown that the overall performance and accuracy of pre-trained networks for breast cancer classification were improved by using a unique technique known as double-shot transfer learning.
Kanya Kumari and Naga Jagadesh [21] used feature selection strategies in order to improve the overall performance of classifiers. With regard to the identification of MiAS mammography images as either normal or abnormal, the XGBoost framework displayed greater performance when compared to alternative strategies for selecting features. Yemini et al. [22] discovered that the majority of deep neural networks trained on real images display similar characteristics. The initial characteristics don’t appear to rely on the specific data set. The suggested technique achieved a mean accuracy of 97.49% when using the DDSM, INbreast, and MiAS datasets. They developed a portable texture CNN methodology for classifying screening mammography, which outperforms earlier techniques [23]. The model exhibited outstanding performance in the detection task, with an accuracy rate of 93.0% and an area under the curve (AUC) of 98.6% in the study [24]. Jafari and Karami [25] utilized a unique model for accurate classification of breast cancer; their approach incorporated multiple pre-trained models for the extraction and selection of features. Then they applied ML models for classification and achieved impressive results.
Aldawsari et al. [26] presented dual hybrid framework for breast cancer classification, combined the swin transformer and dual-attention. They employed generative adversarial networks (GAN) based augmentation method to handle the class imbalance. Ahmed et al. [27] proposed a DL framework that used multi-scale vision transformer for feature extraction. Harris hawks optimization was employed for feature selection, and ML-based XGBoost was utilized for classification. Another work [28] developed a unique neighborhood attention transformer for analyzing masses for breast cancer classification through mammography and a shearlet transform to improve feature extraction. The authors combined the CNN and vision transformer in study [29] to improve breast cancer classification accuracy, and the images were enhanced using contrast limited adaptive histogram equalization. Alzamil et al. [30] presented a comprehensive analysis of breast cancer classification using multi-modal and explainable AI techniques for performance improvement. The segmentation-based approaches have also been widely explored in breast cancer analysis, as study [31] presented a multi-scale parallel feature calibration model for better performance against different modalities, including mammography. Literature review analysis and their limitations is illustrated in Table 1.

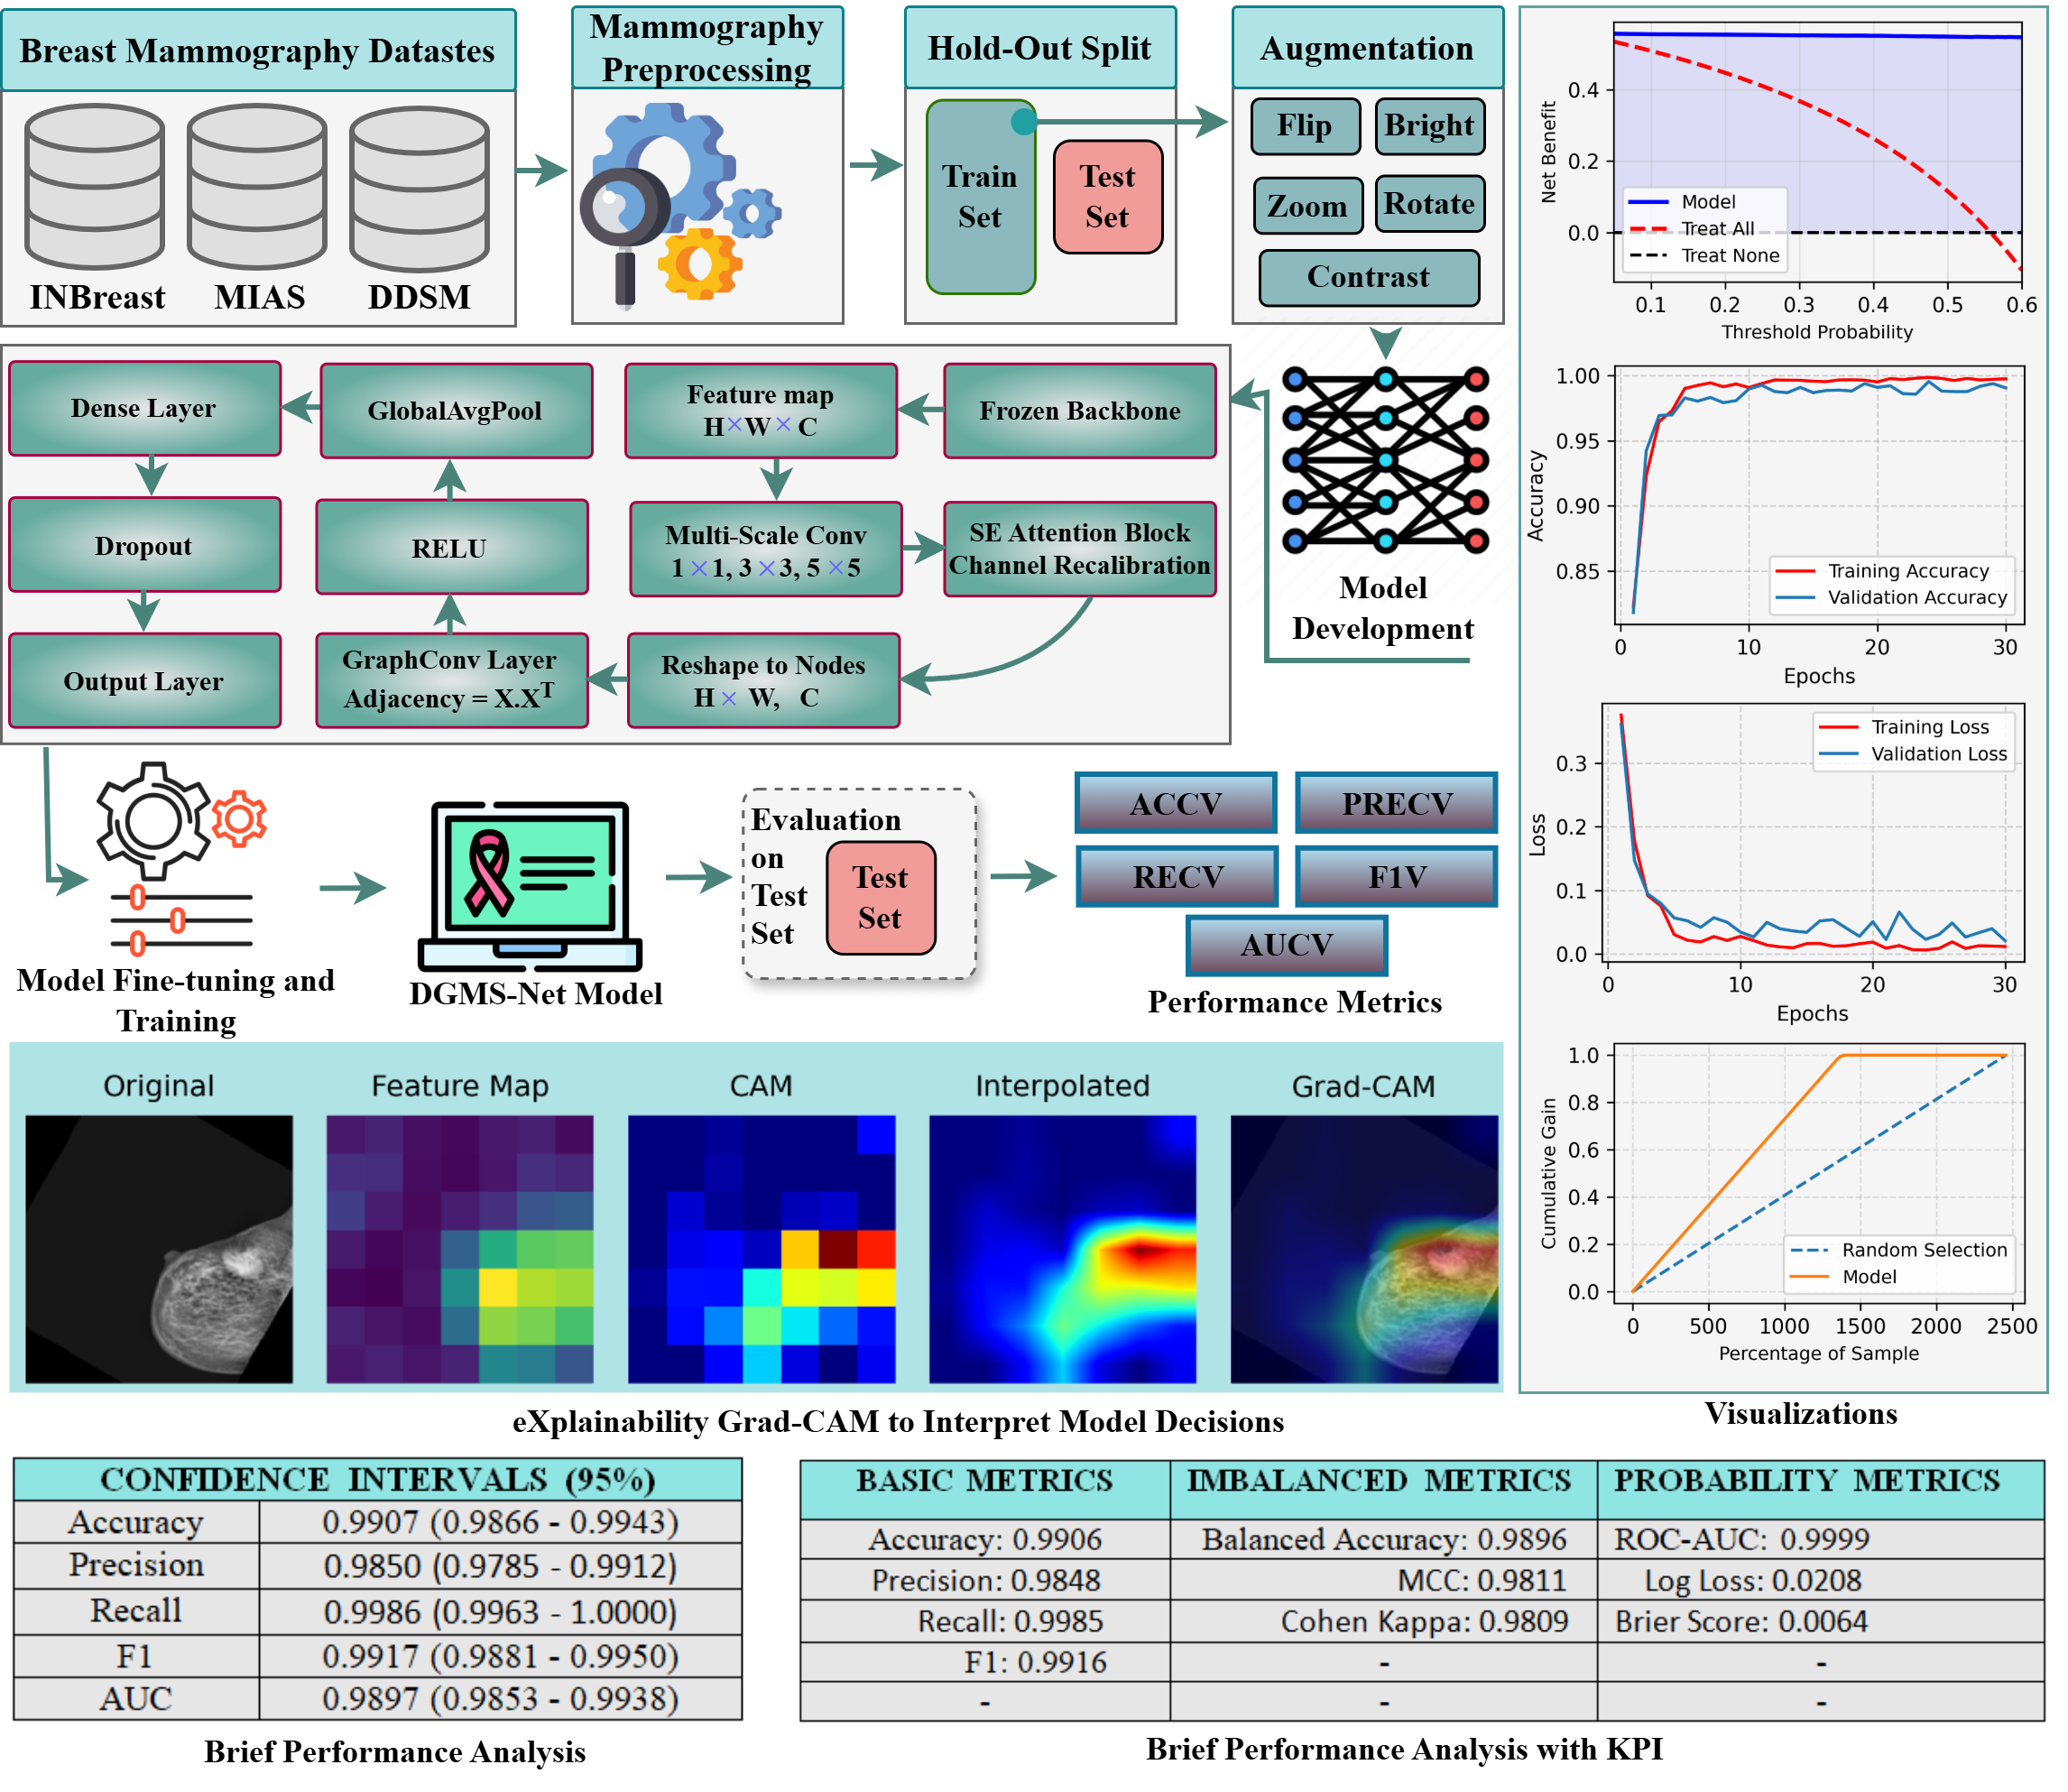
This section presents the overall framework for the proposed methodology that consists of three mammography breast image datasets, preprocessing for the effective model, hold-out split, performing augmentation on train data, and also using a synthetic method to generate samples to balance the train data, then developing the model for cancer classification. Next, different experiments are performed, and the model is evaluated with key performance metrics. Also, include the explainability of the proposed model with Grad-CAM. Fig. 1 represents the overall methodology.

Figure 1: Overall methodology framework for breast cancer classification using dynamic graph multi-scale network (DGMS-Net) architecture.
The work developed processing processes to enhance the quality of the data and its effectiveness through the use of various operations and adjustments. Preprocessing images to a uniform size is an aspect of both the computational and model implementation phases. We set all mammography dimensions to a fixed size, width, height, and number of channels.
Label encoding is also used to convert categorical labels into numeric form. The breast dataset has two classes, Benign and Malignant cases.
This study used hold-out strategy to divide the dataset into training and test sets. Initially, all images from the dataset are shuffled using random seeds to ensure reproducibility and eliminate bias. After shuffling, the dataset was divided into 90% training and 10% testing. Specifically, for each class, the 90% of the processed images are assigned to the training set, and the remaining 10% are assigned to the test set. The training set was used for model training, while the testing set was completely unused during training and only used for the final performance evaluation.
Medical image augmentation techniques are utilized in healthcare to increase the training data for more efficient model learning. We used image augmentor Python package to ensure balance between the Benign and Malignant mass images. This study used augmentation to easily enrich mass data. The system allows for rotation, zoom, flips, brightness, and random contrast augmentation methods. We applied these techniques to the class that has a small number of images. Image rotation is a typical method of rotating the samples. The images flip when they undergo horizontal or vertical transformation into the opposite orientation. We finally make use of the random contrast function.
The mammography datasets are also exhibit class imbalance, this work employed synthetic minority oversampling technique to the training data. The test data remained completely untouched throughout all experiments and were used only for performance evaluation. This generates synthetic samples for the minority class by interpolating between existing minority samples and their nearest neighbors.
For example,
DGMS-Net: Dynamic graph multi-scale network is designed with the hierarchical convolutional backbone VGG-16, set to include top to False; the classification head is removed and extracts spatial features from images. The framework froze the early layers during training while the final four layers were fine-tuned together with the newly added network components, also allowing the deeper layers. Next, we enhances extracted features, reshapes them into a graph structure, and processes them with a graph-based layer. DGMS-Net architecture is shown in Fig. 2. This lightweight approach specifically designed to enhance breast cancer detection performance, and robust features during the training procedure.

Figure 2: DGMS-Net architecture for breast cancer classification using mammography datasets.
After that, multi-scale block and squeeze-and-excitation blocks are used in the design. Multi-scale block employed parallel convolutions and
Here,
The squeeze-and-excitation block then recalibrate channel importance by learning which feature maps are more relevant. It compresses spatial information using global pooling, passes it through small dense layers, and produces weights that scale each channel. This helps the network focus on meaningful features while suppressing less useful ones. For the multi-scale module, we used 128 filters per branch, ReLU activation, and the same padding. For the squeeze-and-excitation(SE) block, the reduction ratio is 8 for the first dense with ReLU and the second dense with a sigmoid function.
The next approach is to convert convolutional feature maps into a graph-like representation. The batch, height, width, channels are reshaped into (batch, nodes, features), where each spatial location becomes a node.
The GraphConv layer then builds relationships between these nodes by computing a similarity-based adjacency matrix using dot products and applying a softmax normalization. Matrix is computed as:
This effectively creates a fully connected graph where each node can influence every other node. The graph convolution aggregates information across nodes, allowing the model to capture long-range dependencies that standard CNNs may miss. This is especially useful when spatial relationships across distant regions matter. Graph convolution is then applied as:
After graph neural network processing, global average pooling layer is sued that reduced the node dimensions. After that, vector is passed through dense layer (128 units), with ReLU activation to act nonlinear feature transformations. This layer follow by dropout 0.5 to minimize the chances of overfitting. Then used final classification layer to output probabilities for the two classes.
The design of architectural components and hyperparameters was based on the experimental evaluation and empirical data used in previous works about medical imaging. The different kernel sizes were chosen to ensure that different types of lesions can be observed simultaneously. The use of a reduction ratio of 8 in the squeeze-and-excitation block provides an effective balance between model capacity and computational efficiency for channel attention learning. The learning rate is maintained during the fine-tuning process of the backbone. Overall, these design choices were optimized to maintain computational efficiency while maximizing discriminative feature learning capability.
The proposed methodology is structured into two algorithms that described the mammography image augmentation pipeline and comprehensive framework for the methodology. Image Augmentation pipeline for Mammography dataset (only for training) is shown in Algorithm 1. Several augmentation techniques are used with minimal probability

Algorithm 2 introduce dynamic graph multi-scale network for breast cancer classification, combines convolutional feature extraction with graph-based representation learning for mammograms. The SMOTE is applied only on the training set to avoid data leakage and the test set remains untouched.
This section elaborates on breast mammography datasets, splitting, cross-validation, training details, and evaluation metrics.
The proposed methodology is evaluated employing three frequently used datasets of mammography images [32]. The datasets are obtained from the Breast Imaging MIAS, DDSM and INbreast. The mammography image collection includes both benign and malignant cancers. The images were obtained from the MIAS dataset, which had 53 images of masses, and the INbreast dataset, which contained 106 images of masses, 2188 masses from the DDSM dataset were initially extracted. MIAS is an ideal choice for identifying breast cancer since it primarily focuses on patients with alarming lesions. This work combined the MIAS, DDSM, and INbreast datasets and applied augmentation techniques to the training data; after that, 27,136 images were utilized for the experiments.
Several statistical metrics, such as F-score, precision, AUC, and accuracy, are used to assess the proposed model. The data set was divided into two sets: one for training and one for testing. We assign 90% of images to be used as training set by means of hold-out selection procedure while keeping 10% aside for testing only.
The proposed approach was implemented using python libraries. The training was done on NVIDIA GeForce RTX-3080 GPU with 10,067 MB VRAM in the system. Trials were carried out using Keras GPU framework. Adam optimizer with learning rate 1e

Figure 3: Overview of implementation details for the proposed approach.

In this section, several experiments are conducted with augmented data, synthetic data, a hold-out split, and cross validation, including multiple key metrics and comparison with the existing framework.
4.1 Experiment 1: Performance of Proposed DGMS-Net Model with Hold-Out Split Method
Table 2 represents the proposed model performance for augmented train data and SMOTE-based, synthetically generated balanced data. The experiments are performed on enhanced training data as well as for balanced data. The proposed model achieved 99.06% accuracy on enhanced data and 99.84% accuracy on balanced data with SMOTE. The model achieved a 99.06% weighted average recall score, 99.17% F1 for malignant cases, and 99.81% precision for benign cases. The proposed model works exceptionally well for the mammography breast cancer classification.

Error analysis based on confusion matrix is presented in Fig. 4. We plotted un-normalized and normalized matrix to compute correct and wrong predictions of proposed DGMS-Net model. Fig. 4a shows 1066 correct, and 21 wrong predictions for benign, 1369 correct and 2 wrong for malignant, Fig. 4b shows normalized values, Fig. 4c shows 1086 correct predictions, 1 wrong for benign, and 1368 correct and 3 wrong predictions for malignant, Fig. 4d shows normalized values using balanced data.

Figure 4: Error analysis based on confusion matrix, (a) represents matrix for enhanced data, (b) same matrix but normalized for enhanced data, (c) matrix for balanced data, (d) normalized matrix for enhanced data.
Learning curves for the proposed model is illustrated in Fig. 5. Training & validation accuracy is shown in Fig. 5a, Training & validation loss is shown in Fig. 5b using the enhanced data with augmentation. Also, Fig. 5c represents the accuracy and Fig. 5d represents the loss for enhanced data with SMOTE.

Figure 5: Proposed DGMS-Net model learning training and validation curves (accuracy & loss); (a,b) for augmented enhanced data and (c,d) SMOTE balanced data.
4.2 Experiment 2: Cross Validation (CV) Results with K = 5
In this experiment, cross-validation results of the proposed model with 5 folds are presented in Table 3. Each fold’s key performance metrics are computed to validate the proposed model. At Fold1, the model achieved 98.54% and 99.82%; for Fold2, 98.70% and 99.90%; for Fold3, 98.23% and 99.88%; for Fold4, 98.78% and 99.94%; and for Fold5, 97.64% and 99.72% accuracy and AUC score, respectively. The validation approach illustrates that the proposed model accurately classified the mammograms into benign and malignant cases.

In addition, performance of proposed model with 95% bootStrap CI is shown in Table 4. CI is a statistical technique employed to estimate the uncertainty of model metrics. Multiple BootStrap samples are generated by repeatedly sampling the data with replacement. For example, (0.9881–0.9950) indicates that the model is 95% confident the true performance lies within this range. For bootstrap analysis, 1000 resampling iterations with replacement were performed assuming independent and identically distributed test samples.

4.3 Experiment 3: Comparative Analysis
Comparative analysis of the proposed model with pretrained learning classifiers provides a significant advantage by reducing the occurrence of overfitting problems often seen in deep learning algorithms when assessed on a smaller image dataset. We performed training and validation on each model to classify breast cancer. According to the data shown in Table 5, which offers detailed information on the outcomes of several models for classifying breast cancer. We used recall, f-measure, accuracy, and precision as evaluation criteria to evaluate and analyze the pretrained models. Only three models out of seven pretrained reached 91.37%, 95.07%, and 94.06%: CNN, ResNet50, and EfficientNetB0, respectively. When compared to the proposed, it achieved a 3.99% improvement. The proposed model achieved the best performance, overall, in terms of key performance metrics.

Comparative analysis of proposed DGMS-Net model with existing work is also conducted in this work to demonstrate the suitability of the method. In Table 6, breast cancer compared the findings of their study with other work. To clarify, each study relies on deep learning and uses the same dataset for evaluation. Gnanasekara et al. [12] performed a research using the CNN method and reached an accuracy of 91.47%. Karthiga et al. [13] also employed the same MiAS and INbreast datasets and achieved accuracies of 94.95% and 96.53%, respectively. López-Cabrera et al. [33] used InceptionV3 and attained an accuracy of 86%, as reported in their research. In a separate investigation [34], ResNet50 was implemented and yielded only a marginal improvement of 3% over the findings obtained in study [33]. Another research [25] also achieved poor performance on the same datasets. The proposed model achieved outclasses performance as compared to the existing work.

XAI Grad-CAM is very important in medical image analysis to visualize model decisions. Therefore, this section presents the explainable AI visualization for the proposed model. Fig. 6 illustrates Grad-CAM that highlights important spatial regions by computing gradients of the predicted class with respect to feature maps; Score-CAM evaluates the importance of each feature map by masking it onto the input and measuring the model’s output score, then combining the most influential maps; SmoothGrad improves robustness by adding small random noise to the input multiple times and averaging the resulting gradients to reduce visual noise. The highlighted regions in breast mammograms primarily correspond to clinically important breast anomalies, and regions with irregular intensity patterns that are associated with malignant and benign cases. Such visual explanations can improve interpretability by highlighting the regions that influence the final classification decision. Clinically, these heatmaps can help radiologists diagnose breast cancer by assisting with lesion localization, drawing attention to subtle anomalies, and providing visual confirmation of model predictions.

Figure 6: Interpretability of the proposed model using heatmaps (original image, Grad-CAM, Score-CAM, SmoothGrad, Fusion and Overlay).
Also, Fig. 7 visualized the XAI techniques for the proposed model. This represents the original image, the feature map extracted from the convolutional layer, the class activation map, the interpolated map (up-sampling using resizing is applied to scale it to the original image size so it can be properly aligned for visualization), and finally the Grad-CAM. In breast cancer imaging, it is useful because it helps ensure whether the model is focusing on clinically relevant regions instead of irrelevant background.

Figure 7: XAI Grad-CAM visualization with feature map.
Fig. 8 displayed the accuracy and AUC scores for the proposed model with five folds at left side of the chart. There are slight variations of AUC for each folds. The accuracy and AUC comparison for pretrained and proposed model also illustrated in Fig. 8. CNN (M1), MobileNetV2 (M2), ResNet50 (M3), EfficientNetB0 (M4), DenseNet121 (M5), NASNetMobile (M6) and proposed (M7) are illustrated in the right side of chart. Overall, in terms of all criteria, the model performed exceptionally and achieved outstanding results.

Figure 8: Complementary views of model performance using bar-chart: left-side shows cross-validation folds, right-side shows pretrained models vs. proposed approach.
We also conducted statistical significance test to evaluate the model performance with other pretrained models as shown in Table 7. In experimental analysis, the most commonly used methods for different purposes are the paired t-test and the Friedman test. The paired t-test is a parametric test used to compare the means of two connected groups. In this experiment, it is typically used when comparing two samples using the same measurement or fold. This test assumes that the differences between paired observations have a normal distribution. If the resulting p-value is less than 0.05, the difference between two samples is considered statistically significant. If the Friedman test is significant (p

Fig. 9 represents the feature visualization of the proposed DGMS-Net model using t-distributed stochastic neighbor embedding (t-SNE) to better learned representations from breast cancer images with scatter plot. Two different representations (input layer and penultimate layer) are extracted from the trained DGMS-Net model. The penultimate layer represents deep learned features before the classification.

Figure 9: Feature visualization of proposed model using t-SNE for input feature space and deep feature space. The dark purple color denotes Benign cases, and yellow denotes Malignant cases in the input and deep feature space.
Table 8 presents the computational complexity of the proposed DGMS-Net model on the enhanced mammogram dataset. This provides a comprehensive view of model efficiency in terms of trainable parameters, GFLOPs, training time per epoch, and inference time. The proposed approach is computationally feasible for practical deployment while achieving improved classification performance. The proposed approach has 9.4 M trainable parameters, 8.75 GFLOPs, processes per epoch in approximately 79 s, and 1.129 ms/sample inference time.

Table 9 presents the results of the ablation study. In this section, the contribution of each component that contributes to the model development is illustrated with important performance metrics. The backbone without any fine-tuning strategy achieved moderate results; the backbone with a fine-tuned strategy achieved 98% performance. When incorporating a multi-scale network and SE block in the model, it achieved 98.65% accuracy, while the final model with fine-tuning, multi-scale and SE networks, and a graph network achieved a superior 99% accuracy.

Also, this study performed independent testing on a combined mammogram dataset using different train, test, and validation sets. As Table 10 illustrates, the results with 70:10:20 (train:test:val) sets for the proposed approach.

This study proposed the DGMS-Net for breast cancer classification, an innovative and captivating field of study that has the potential to improve prognoses by increasing the frequency of early detection. Early detection of breast cancer and timely medical intervention have the potential to reduce the mortality rate associated with cancer. The framework comprises a preprocessing pipeline, handles imbalanced data, enhances training data, splits methods, and designs the graph-based model. The research results demonstrate that the proposed model attained an overall accuracy of 99.06% for enhanced and 99.84% for balanced data. Regarding class-wise performance, the model achieved a precision of 98.49% and a recall of 99.85% for malignant cases for enhanced data with augmentations. Also, the model achieved a precision of 99.93% and a recall of 99.78% for malignant cases for balanced data with SMOTE. The proposed approach attained a 99.99% AUC, 98.09% kappa score, 0.0208 log loss, and 0.0119 training loss with the merged three datasets. Additionally, the model achieved an AUC of
The proposed approach achieved promising results, but this study has some limitations. First, this study applied SMOTE on raw image pixels, which may not fully preserve the spatial structure and semantic consistency of medical images. Second, the dataset splitting was performed at the image level without patient identifiers, which may introduce a potential risk of subject-level data leakage. Third, the XAI analysis provide qualitative visual explanation for the proposed approach and did not provide quantitative clinical interpretability.
In the future, the proposed approach will evaluate explicit patient-level annotation datasets to ensure subject-wise splitting and more robust evaluation. For more advanced imbalance handling techniques other than SMOTE or augmentation, we may use generative AI models or augmentation methods in feature space. The expert validation or quantitative metric will be incorporated to strengthen the interpretability analysis. Also, will include external validation and more diverse patient populations to better assess the model’s generalizability. In addition, to improve computational efficiency and minimize error rates, the intent will be to perform experiments with transformer-based model diagnostic tests while employing advanced feature extraction techniques.
Acknowledgement: The authors want to acknowledge the support of Princess Nourah bint Abdulrahman University Researchers Supporting Project, Princess Nourah bint Abdulrahman University, Riyadh, Saudi Arabia. The authors would also like to acknowledge the support of AIDA Lab CCIS Prince Sultan University, Riyadh Saudi Arabia for APC of this publication.
Funding Statement: This research was funded by Princess Nourah bint Abdulrahman University Researchers Supporting Project number (PNURSP2026R346), Princess Nourah bint Abdulrahman University, Riyadh, Saudi Arabia.
Author Contributions: Conceptualization, Tanzila Saba and Muhamamd Mujahid; methodology, Tanzila Saba and Muhammad Mujahid; software, Tanzila Saba; validation, Faten S. Alamri and Roaa Khalil Mohamed Ali Abed; formal analysis and investigation, Roaa Khalil Mohamed Ali Abed and Faten S. Alamri; resources, Tanzila Saba; data curation, Faten S. Alamri; writing—original draft preparation, Muhammad Mujahid and Tanzila Saba; writing—review and editing, Tanzila Saba and Roaa Khalil Mohamed Ali Abed; visualization, Muhammad Mujahid; supervision, Tanzila Saba; project administration, Tanzila Saba; funding acquisition, Tanzila Saba. All authors reviewed and approved the final version of the manuscript.
Availability of Data and Materials: The datasets are available at: Lin, Ting-Yu; Huang, Mei-Ling (2020), “Dataset of Breast mammography images with Masses”, Mendeley Data, V5, doi: https://doi.org/10.17632/ywsbh3ndr8.5, Also at Kaggle: https://www.kaggle.com/datasets/diegotovias/dataset-of-breast-mammography-images-with-masses.
Ethics Approval: Not applicable.
Conflicts of Interest: The authors declare no conflicts of interest.
References
1. Arnold M, Morgan E, Rumgay H, Mafra A, Singh D, Laversanne M, et al. Current and future burden of breast cancer: global statistics for 2020 and 2040. Breast. 2022;66:15–23. [Google Scholar] [PubMed]
2. World Health Organization. Breast cancer. 2024 [cited 2024 May 13]. Available from: https://www.who.int/news-room/fact-sheets/detail/breast-cancer. [Google Scholar]
3. Basu P, Zhang L, Hariprasad R, Carvalho AL, Barchuk A. A pragmatic approach to tackle the rising burden of breast cancer through prevention & early detection in countries ‘in transition’. Indian J Med Res. 2020;152(4):343–55. [Google Scholar]
4. Elkorany AS, Marey M, Almustafa KM, Elsharkawy ZF. Breast cancer diagnosis using support vector machines optimized by whale optimization and dragonfly algorithms. IEEE Access. 2022;10:69688–99. [Google Scholar]
5. Sun YS, Zhao Z, Yang ZN, Xu F, Lu HJ, Zhu ZY, et al. Risk factors and preventions of breast cancer. Int J Biol Sci. 2017;13(11):1387–97. [Google Scholar] [PubMed]
6. Cuthrell KM, Tzenios N. Breast cancer: updated and deep in-sights. Int Res J Oncol. 2023;6(1):104–18. [cited 2026 Feb 21]. Available from: https://www.researchgate.net/publication/371069531. [Google Scholar]
7. Abd Alkareem TA, Hassan SA, Abdalhadi SM. Breast cancer: symptoms, causes, and treatment by metal complexes: a review. Adv J Chem Sect B Nat Prod Med Chem. 2023;5(4):220–33. doi:10.48309/ajcb.2023.398122.1174. [Google Scholar] [CrossRef]
8. Sadad T, Munir A, Saba T, Hussain A. Fuzzy C-means and region growing based classification of tumor from mammograms using hybrid texture feature. J Comput Sci. 2018;29:34–45. [Google Scholar]
9. Punitha S, Al-Turjman F, Stephan T. An automated breast cancer diagnosis using feature selection and parameter optimization in ANN. Comput Electr Eng. 2021;90:106958. [Google Scholar]
10. Al Reshan MS, Amin S, Ali Zeb M, Sulaiman A, Alshahrani H, Azar AT, et al. Enhancing breast cancer detection and classification using advanced multi-model features and ensemble machine learning techniques. Life. 2023;13(10):2093. [Google Scholar]
11. Jayandhi G, Leena Jasmine JS, Joans SM. Mammogram learning system for breast cancer diagnosis using deep learning SVM. Comput Syst Sci Eng. 2022;40(2):491–503. [Google Scholar]
12. Gnanasekaran VS, Joypaul S, Meenakshi Sundaram P, Chairman DD. Deep learning algorithm for breast masses classification in mammograms. IET Image Process. 2020;14(12):2860–8. [Google Scholar]
13. Karthiga R, Narasimhan K, Amirtharajan R. Diagnosis of breast cancer for modern mammography using artificial intelligence. Math Comput Simul. 2022;202:316–30. [Google Scholar]
14. Kavitha T, Mathai PP, Karthikeyan C, Ashok M, Kohar R, Avanija J, et al. Deep learning based capsule neural network model for breast cancer diagnosis using mammogram images. Interdiscip Sci Comput Life Sci. 2022;14(1):113–29. [Google Scholar]
15. Raaj RS. Breast cancer detection and diagnosis using hybrid deep learning architecture. Biomed Signal Process Control. 2023;82:104558. [Google Scholar]
16. Yaqub M, Feng J, Aijaz N, Ahmed S, Mehmood A, Hao J, et al. Intelligent breast cancer diagnosis with two-stage using mammogram images. Sci Rep. 2024;14(1):16672. [Google Scholar] [PubMed]
17. Zafar M, Amin J, Sharif M, Alnfiai MM. Hybrid loss-driven attention residual U-Net with multiscale cascaded CBAM for breast cancer segmentation. Cogn Comput. 2026;18(1):27. doi:10.1007/s12559-026-10554-1. [Google Scholar] [CrossRef]
18. Das A, Narayan Mohanty M, Kumar Mallick P, Tiwari P, Muhammad K, Zhu H. Breast cancer detection using an ensemble deep learning method. Biomed Signal Process Control. 2021;70:103009. [Google Scholar]
19. Hussain Z, Gimenez F, Yi D, Rubin D. Differential data augmentation techniques for medical imaging classification tasks. AMIA Annu Symp Proc. 2017;2017:979–84. [cited 2026 Jan 27]. Available from: https://pmc.ncbi.nlm.nih.gov/articles/PMC5977656/. [Google Scholar] [PubMed]
20. Alkhaleefah M, Ma SC, Chang YL, Huang B, Chittem PK, Achhannagari VP. Double-shot transfer learning for breast cancer classification from X-ray images. Appl Sci. 2020;10(11):3999. doi:10.3390/app10113999. [Google Scholar] [CrossRef]
21. Kanya Kumari L, Naga Jagadesh B. An adaptive teaching learning based optimization technique for feature selection to classify mammogram medical images in breast cancer detection. Int J Syst Assur Eng Manag. 2024;15(1):35–48. [Google Scholar]
22. Yemini M, Zigel Y, Lederman D. Detecting masses in mammograms using convolutional neural networks and transfer learning. In: Proceedings of the 2018 IEEE International Conference on the Science of Electrical Engineering in Israel (ICSEE); 2018 Dec 12–14; Eilat, Israel. New York, NY, USA: IEEE; 2018. p. 1–4. [Google Scholar]
23. Maqsood S, Damaševičius R, Maskeliūnas R. TTCNN: a breast cancer detection and classification towards computer-aided diagnosis using digital mammography in early stages. Appl Sci. 2022;12(7):3273. doi:10.3390/app12073273. [Google Scholar] [CrossRef]
24. Rahman MM, Jahangir MZB, Rahman A, Akter M, Nasim MDAA, Gupta KD, et al. Breast cancer detection and localizing the mass area using deep learning. Big Data Cogn Comput. 2024;8(7):80. [Google Scholar]
25. Jafari Z, Karami E. Breast cancer detection in mammography images: a CNN-based approach with feature selection. Information. 2023;14(7):410. doi:10.3390/info14070410. [Google Scholar] [CrossRef]
26. Aldawsari MA, Aldosari SJ, Ismail A, Emam MM. A deep learning framework for breast cancer diagnosis using swin transformer and dual-attention multi-scale fusion network. Sci Rep. 2026;16(1):8941. doi:10.1038/s41598-026-37969-y. [Google Scholar] [PubMed] [CrossRef]
27. Ahmed S, Elazab N, El-Gayar MM, Elmogy M, Fouda YM. Multi-scale vision transformer with optimized feature fusion for mammographic breast cancer classification. Diagnostics. 2025;15(11):1361. doi:10.3390/diagnostics15111361. [Google Scholar] [PubMed] [CrossRef]
28. Firouzbakht M, Amirmazlaghani M. Breast cancer detection in mammography images using neighborhood attention transformer and shearlet transform. Comput Biol Med. 2025;198(1):111239. doi:10.1016/j.compbiomed.2025.111239. [Google Scholar] [PubMed] [CrossRef]
29. Patheda VR, Laxmisai G, Gokulnath BV, Siddique Ibrahim SP, Kumar SS. A robust hybrid CNN+ViT framework for breast cancer classification using mammogram images. IEEE Access. 2025;13:77187–95. doi:10.1109/ACCESS.2025.3563218. [Google Scholar] [CrossRef]
30. Alzamil D, Alkhamees B, Hassan MM. A systematic review of multimodal fusion and explainable AI applications in breast cancer diagnosis. Comput Model Eng Sci. 2025;145(3):2971–3027. doi:10.32604/cmes.2025.070867. [Google Scholar] [CrossRef]
31. Zafar M, Sharif M, Majid A. A multi-scale attention-based parallel feature calibration framework for segmentation of multi-modality breast cancer images. Egypt Inform J. 2026;34:100984. doi:10.1016/j.eij.2026.100984. [Google Scholar] [CrossRef]
32. Lin TY, Huang ML. Dataset of breast mammography images with masses. Mendeley Data. 2020;5(5). doi:10.17632/ywsbh3ndr8.5. [Google Scholar] [CrossRef]
33. López-Cabrera JD, López Ríguez LA, Pérez-Díaz M. Classification of breast cancer from digital mammography using deep learning. Intel Artif. 2020;23(65):56–66. doi:10.4114/intartif.vol23iss65pp56-66. [Google Scholar] [CrossRef]
34. Alruwaili M, Gouda W. Automated breast cancer detection models based on transfer learning. Sensors. 2022;22(3):876. doi:10.3390/s22030876. [Google Scholar] [PubMed] [CrossRef]
Cite This Article
 Copyright © 2026 The Author(s). Published by Tech Science Press.
This work is licensed under a Creative Commons Attribution 4.0 International License , which permits unrestricted use, distribution, and reproduction in any medium, provided the original work is properly cited.
 Downloads
 Citation Tools
