
 Login
Login Register
 Submit a Paper
 Propose a Special lssue
 Open Access
ARTICLE
Binary Data Augmentation Selection using WSO for Diabetic Retinopathy Classification
1 Autonomous Systems Department, Faculty of Artificial Intelligence, Al-Balqa Applied University, Salt, Jordan
2 Center for Artificial Intelligence Technology (CAIT), Faculty of Information Science and Technology, Universiti Kebangsaan Malaysia (UKM), Bangi, Selangor, Malaysia
3 Computer Science Department, Al-Ahliyya Amman University, Amman, Jordan
4 Computer Science Department, Prince Abdullah Bin Ghazi Faculty of Information and Communication Technology, Al-Balqa Applied University, Salt, Jordan
* Corresponding Authors: Nedaa Almansour. Email: ,
,
; Shahnorbanun Sahran. Email:
Computer Modeling in Engineering & Sciences 2026, 148(3), 41 https://doi.org/10.32604/cmes.2026.086450
Received 30 May 2026; Accepted 05 August 2026; Issue published 28 September 2026
 View Full Text
 Download PDF
Abstract
Data augmentation (DA) techniques are widely used in convolutional neural networks (CNNs) to artificially expand the size of training datasets. This is particularly true for medical imaging tasks, such as Diabetic Retinopathy (DR) image classification, where the training data are often limited and imbalanced. Various DA techniques are utilized in CNN models, including horizontal and vertical flipping, rotation, and zoom. Combining distinct methods increases the diversity of the produced images and allows the CNNs to handle the complex details in the images. Manually designed or heuristically selected augmentation combinations may generate redundant or highly similar training samples, which can negatively affect model generalization and classification performance. To analyze the effect of DA combinations on DR classification, the selection of the augmentation subset is formulated as a binary combinatorial optimization problem, in which the recent metaheuristic White Shark Optimizer (WSO) is employed to identify the optimal augmentation subset. Since the original WSO was designed for continuous optimization, the proposed Binary WSO (BWSO) adapts the WSO to binary search spaces through a sigmoid-based binary transfer mechanism. In each iteration of the WSO, candidate augmentation subsets are evaluated using the validation performance of three pre-trained CNN architectures (VGG16, DenseNet121, and MobileNetV2) to identify augmentation combinations that improve classification robustness and generalization. The proposed Adaptive Metaheuristic Data Augmentation–White Shark Optimizer (AMDA-WSO) framework was evaluated on the APTOS 2019 dataset containing 3662 retinal fundus images in five severity grades of DR and compared with Particle Swarm Optimization (PSO) and the Bees Algorithm (BA). Experimental results demonstrated that the AMDA-WSO-guided MobileNetV2 achieved the best performance, reaching 92.08% accuracy and 81.48% sensitivity. These findings confirm the effectiveness of BWSO for automated binary augmentation subset selection in DR image classification.Keywords
DA is a critical part of deep learning (DL) models, especially in medical imaging where labelled data are scarce and hard to acquire [1]. In medical applications, high data collection costs, privacy concerns, and the scarcity of some medical conditions (e.g., early-stage diabetic retinopathy) limit the availability of large and well-balanced datasets [2,3]. To overcome these limitations, DA is commonly used to artificially boost the diversity of the dataset through transformations including rotation, flipping, cropping, and adding noise to the images [4,5]. This approach can enhance model performance and prevent overfitting when training DL models with small sample sizes [6,7].
Although effective, traditional DA methods are difficult to apply in medical imaging. Common medical images are characterized by complex anatomical structures and subtle pathologies, and inappropriate augmentation can modify important properties of the image or fail to record the image variability [8]. In the case of skin cancer classification, for instance, over-augmentation may alter important attributes, leading to a decrease in the model’s accuracy [9]. Similarly, for DR diagnosis, geometric transformations such as rotation or shearing may alter the appearance of microaneurysms or exudates, making important features hard to detect [10,11]. Consequently, simple DA techniques may not be sufficient to capture the complexity and diversity of medical imaging problems.
There are three types of DA techniques. The first type are generic image transformations such as geometric (cropping, flipping, rotating, shearing, zooming) and color/contrast transformations (brightness, saturation, noise) [12,13]. These are quick and are often employed to increase data diversity. However, they are based primarily on local invariance or color space assumptions, and do not take into account the feature distribution of the data [14]. The second category is meta-learning techniques [15] that use a variety of generic transformations to train optimal augmentation policies. These methods have been shown to perform well on few-shot datasets, but they are essentially a set of transformations that are pre-defined and do not necessarily improve the distribution of features in the dataset. The third class are deep neural network (DNN) based approaches like Generative Adversarial Networks (GANs) and Variational Autoencoders (VAEs) which can generate new samples, using the distribution of features in the original sample set. However, DNN-based methods are challenging to apply in few-shot scenarios because they require large-scale datasets for effective training.
However, current augmentation techniques are still mainly based on pre-defined transformations or fixed augmentation policies which lack flexibility and do not achieve optimal generalization [13,16]. These limitations motivate the development of an adaptive optimization system that can automatically determine the combinations of augmentation based on the characteristics of the data.
To address this need, automated hyperparameter optimization using metaheuristic algorithms, which have been shown to be effective in solving complex optimization problems, is a promising solution [17]. Among the various metaheuristic algorithms, the WSO has recently emerged as a highly effective bio-inspired technique for solving complex optimization problems. Proposed by [18], WSO mathematically models the exceptional foraging behavior of great white sharks, including their keen senses of hearing and smell, as well as their predatory motion patterns when navigating and hunting in deep oceans. These behaviors are translated into search mechanisms that strike a compelling balance between exploration (searching new areas of the solution space) and exploitation (refining known promising solutions), enabling search agents to converge toward optimal outcomes.
WSO has been successfully applied to various fields since its inception. In medical imaging, a binary variant of WSO was developed to improve the classification performance in 24 medical datasets, with a significant reduction in dimension of features [19,20]. Recent medical applications include optimizing hyperparameters for skin cancer classification using an ensemble deep learning model on dermoscopy images [21]. Additionally, WSO has been successfully integrated with K-means clustering for brain tumor segmentation in magnetic resonance imaging (MRI) images, overcoming the initialization sensitivity of conventional clustering approaches. Other applications include cervical cancer diagnosis, where WSO was combined with ensemble learning [22]. These applications show that WSO transfers are effective to binary selection problems defined over medical data, which is the problem class solved in this study.
WSO was selected as the main optimizer in this study because its search capabilities are similar to the binary augmentation subset selection problem, which a discrete combinatorial optimization problem that needs a balance between the global exploration and local exploitation [19]. WSO also provides a fish-schooling search strategy that can be used for efficient search operation using a relatively small number of control parameters [23]. It also has an adaptive movement, which is also efficient [23]. Furthermore, a number of binary versions of WSO have shown good performance in discrete optimization problems, e.g., feature selection, which have similar problem attributes to augmentation subset selection. Therefore, in this study, WSO was the main optimizer and the other two algorithms (PSO and BA) were used in experimental conditions that were identical to those of WSO for a comparative evaluation.
Although it is well known to be capable, there are some limitations of WSO that need to be recognized. It has been demonstrated that WSO can sometimes experience slow convergence and low solution accuracy, especially in multi-peak optimization problems [19,24,25]. It also struggles with the trade-off between exploration and exploitation, potentially resulting in premature convergence and falling into local optima [24]. These restrictions have spurred efforts towards creating improved variants of WSO, such as binary WSO for discrete optimization [19,23]. Although there has been a significant improvement in the DA approaches, there is still a significant gap in the literature related to the systematic optimization of the combination of augmentations for DR classification using a metaheuristic optimization framework with binary variables. Existing approaches either rely on manually designed pipelines that lack adaptability, or employ computationally expensive deep generative models that are impractical in low-data clinical settings. Furthermore, the selection of augmentation combinations has not been formulated as a discrete binary optimization problem, leaving the search space of
Accordingly, each transformation is encoded by a bit in a binary vector (e.g., [0, 1, 0, 1, 1]
The primary objective of this study is to develop an adaptive optimization model employing the WSO to automatically identify the most effective augmentation combinations for improving the performance of pre-trained CNN models. The main contributions of this study are summarized as follows:
1. Automated augmentation selection via binary optimization: This work casts the problem of selecting combinations of data augmentation strategies as a binary optimization problem, encoding each augmentation strategy as a six-bit binary vector. This representation allows a search over
2. Development of the AMDA-WSO framework: The AMDA-WSO framework is developed, which integrates a binary version of WSO with pre-trained CNN models for automated selection of augmentation. The framework uses a sigmoid transfer function to convert continuous positions into binary augmentation subsets, and leverages the fish schooling mechanism of WSO to prevent population stagnation and premature convergence in the combinatorial search.
3. Experimental results and benchmarking: The AMDA-WSO framework is tested on the APTOS 2019 dataset using three CNN architectures (VGG16, DenseNet121, and MobileNetV2), showing statistically significant improvements compared to manual augmentation and other optimizers (PSO and BA) with best accuracy of 92.08% and sensitivity of 81.48% confirmed by Wilcoxon signed-rank tests with Bonferroni correction.
The paper follows a logical sequence of reasoning to support its claims. The theoretical underpinnings of the research are presented in Section 2 of the paper. This section also discusses the research conducted on DA and optimization techniques used to support medical image classification. Section 3 of the paper outlines the proposed framework and its application of metaheuristic optimization techniques such as WSO, BA, and PSO to perform DA on CNN models to classify DR images. The experiment conducted on the proposed framework is presented in Section 4.5 of the paper.
DA has been used in a variety of applications such as image processing, natural language processing, speech recognition, and object detection [29–31]. But for medical diagnosis, finding effective augmentation techniques remains a big challenge due to the scarcity, class imbalance and variation of clinical images. The current research has investigated different augmentation techniques including geometric augmentation, color augmentation and synthetic image generation to improve the classification performance of DR. This section summarizes the most pertinent research on DR classification and DA, detailing the primary contributions, benefits, and limitations of existing studies, and pointing to future research gaps to be filled.
2.1 Deep Learning Models for Diabetic Retinopathy Classification
Transfer learning (TL) has been shown to be a widely adopted strategy in DR classification, with pre-trained CNNs including VGG16, ResNet, MobileNet and DenseNet121 successfully fine-tuned on retinal imaging datasets to achieve excellent classification accuracy, even in the face of limited data. In [32], they presented an automatic prediction framework for DR, which is based on deformable registration combined with DL. They also used B-spline deformable registration to preprocess the image such that the entire retina was contained within the image with noise reduction. The four pre-trained CNNs (DenseNet-121, ResNet-50, InceptionV3 and Xception) were fine-tuned on the APTOS 2019 dataset and ensemble voting was used to obtain the final decision. Test accuracy made by proposed method was 85.28%, which was better than those for individual CNN models. In contrast, study [33] introduced a classification framework based on DR, which involved using CNN architectures like VGG16, ResNet34, InceptionV3, and EfficientNet with CLAHE pre-processing to obtain the highest accuracy of 91%, 84%, 95%, and 97%, respectively. These improvements, however, were not uniform on all models, some models did better without the CLAHE improvement.
In another study, reference [34] suggested a transfer learning-based ensemble approach for DR grading that is computationally efficient. The approach has been tested on the EyePACS, APTOS 2019 and Messidor-2 datasets. The pre-processing stage includes CLAHE, Gaussian blur and normalization. The ensemble strategy involved running predictions from model checkpoints of the EfficientNet model at various points of the training process. The proposed approach obtained quadratic weighted kappa scores of 0.901, 0.967, and 0.944 on the EyePACS, APTOS 2019, and Messidor-2 datasets, respectively. On the other hand, the paper [35] proposed a lightweight CNN for early DR detection and pre-processing was added to the shallow architecture to reduce the number of computations while achieving high accuracy. In its testing on standard retinal datasets, the model performed similarly to deeper CNNs, and has potential clinical applications in real time. However, the diversity of data is limited and generalization is somewhat dubious, so future studies are encouraged to try to broaden the data and to use more complex optimization processes. Although these advances have been made, many studies are still not well designed to solve these important challenges such as overfitting, class imbalance and lack of diversity in the data. These gaps suggest that more sophisticated optimization-driven DR classification methods are needed to improve classification accuracy and generalization.
Transformer-based models and self-supervised learning methods are emerging as potential approaches for DR classification in recent years. Vision Transformers (ViTs) are proposed to provide more efficient global contextual modelling, for instance, study [36] produced a task specific ViT for the DR severity grading in resource-limited environments. In addition, local feature extraction and long-range dependency modeling are integrated in hybrid CNN–Transformer architectures, which also boost classification accuracy as reported by [37] in the case of an ensemble of fine-tuned CNN and transformer backbones, which achieved 93.10% accuracy on the APTOS 2019. At the same time, self-supervised learning (SSL) has also been shown to train discriminative retinal representations from unlabeled fundus images, without requiring large, annotated datasets, such as DR-MAE [38] outperforming robust supervised backbones like ConvNeXt, ViT and Swin Transformer on APTOS 2019.
2.2 Approaches to Data Augmentation in Diabetic Retinopathy Classification
DA techniques have gained increased attention in DR classification due to their abilities to mitigate significant limitations such as dataset size limitation, class imbalance, as well as overfitting [39,40]. By synthetically generating diversely various training samples, augmentation has the capacity to enhance the ability for generalization in DL models. Complementing the relevant preprocessing techniques, these approaches are significant in the improvement in the quality level in fundus retinae images as well as in achieving sound grading and detection of DR. For instance, study [41] presented a revised VGG-19 architecture, incorporating DA techniques such as
On the other side, study [44] proposed an explainable DR classification model with SHapley Additive exPlanations (SHAP) to detect lesion-related regions in fundus images. Through the combination of CNN-based feature extraction with interpretability, the model achieved 94.64% accuracy on APTOS 2019 and 84.23% on DDR, demonstrating robustness together with clinical interpretability. Study [45] addressed class imbalance in grading severity in DR through class-balanced augmentation plus transfer learning from APTOS 2019, where every class was expanded to 20,000 samples. Fine-tuned ResNet and EfficientNet achieved durable multi-class performance (84.6% accuracy, 94.1% Area Under the Curve (AUC)), while the research noted that synthetic augmentation was unable to encompass all the diversity of the real world, therefore limiting generalization. In line with this, study [46] fine-tuned the APTOS 2019 dataset using Inception V3 model. They experimented a series of augmentation techniques upon to help enable class distribution balance. The optimal configuration, utilizing stochastic gradient descent with momentum as optimizer and dense classification head, recorded an accuracy level of 82.7% as well as F1 level of 0.825, outperforming non-augmented retraining as well as past variants of the model. However, the fact that a single dataset is used and the model is not externally validated raises a certain concern about the generalizability of the model. Elsewhere, a multistage DL architecture was suggested by [47] and relies on transfer learning and massive DA. The most accurate models of the tested models were InceptionResNetV2 and DenseNet121 with the highest accuracy of 96.61 and 94.20 percent respectively. Though the results were promising, the model was limited in a number of ways that limited its generalizability such as small size of data, image resolution, no large scale validation and high computational cost. While these studies achieved noticeable gains, most augmentation choices are still made manually and seldom tested on multiple datasets, which points to the need for more adaptive and optimization-based augmentation techniques.
2.3 Metaheuristic Approaches for Hyperparameter Optimization in DR Classification
Optimization methods [48,49] have transformed medical image processing by processing huge datasets at reduced diagnostic error. For DR, detection at early points and accuracy relies considerably on optimizing techniques that can efficiently overcome problems of image noise, non-uniform lighting, and low-contrast lesion [50]. Under DL, optimization is crucial in improving the performance of models, particularly with hyperparameter optimization seeking to limit training error or optimize predictive accuracy. Transfer learning is also aided by optimization by fine-tuning pre-learned models of related medical tasks and improving generalization. Moreover, the authors in [51] introduced a self-adaptive Gray Wolf Optimization (SA-GWO) framework of DR classification based on segmentation, hand-crafted feature extraction along with neural networks. It tuned network weights and feature selection using the metaheuristic technique and achieved 84.65% accuracy with the aid of DIARETDB1. It was, however, limited by the use of conventional neural networks and a single small dataset and therefore failed to generalize like modern CNN-based works. In contrast, study [52] developed a Genetic Algorithm (GA)-motivated system for optimization of CNN hyperparameters of convolution layers, pooling layers, and kernel parameters and ended with classification based on an Support Vector Machine (SVM) and Radial Basis Function (RBF) kernel. This system improved DR classification accuracy, although performance was constrained by limitations of input image and batch size due to available computation.
Study [53] proposed a recent evolution algorithm-based framework of hyperparameter optimization of 1D-CNNs used in predicting diabetes mellitus. It optimized the size of the kernel of the convolutional layer, numbers of filters, and learning parameters to achieve higher accuracy than manual tuning. Despite this, the work was limited by the scarcity of data and lacked general validation of findings on diverse populations. Another research by [54] proposed an Improved GWO-CNN system for DR detection using a GA generating diversified initial solutions optimized by IGWO for feature selection. Optimized parameters enhanced CNN classification with 98.33% accuracy using EyePACS and surpassed GA-CNN, GWO-CNN, and other new methods. Even though successful, it is a limitation that only one dataset was utilized and suggests that more validation is required using different populations.
2.4 Optimization-Based Data Augmentation for DR Classification
Although traditional DA techniques have strengthened the performance of DR classification models, they still depend largely on manually selected transformations and fixed parameter settings [15]. Such manual choices often make it difficult to balance variation and data integrity, which in turn leads to unstable generalization across different datasets [14]. In response, several studies have turned to intelligent optimization frameworks that automate the selection and combination of augmentation techniques. Instead of depending on trial-and-error, these frameworks employ optimization algorithms particularly metaheuristic methods such as PSO, WSO, and BA to adaptively search for effective augmentation transformations and parameter configurations [55,56]. This adaptive search process allows the model to benefit from more effective and clinically realistic augmented images.
Recently, there have been some studies on optimization-based methods to improve the design of DA strategies. A typical example of this is AutoAugment [15], which relied on reinforcement learning to perform an automatic search for DA strategies that could potentially lead to improved model generalization. However, RandAugment [57] improved the process by removing the need to perform a separate policy search stage, allowing a set of random transformations with fixed scales to be applied. To speed up the process, Fast AutoAugment [58] was presented to perform a density-matching method to significantly reduce the computational overhead. More recently, SmartAugment [59] presented a gradient-free optimization method to strike a balance between speed and accuracy. Interestingly, TrivialAugment [60] also proved that even a simple single-parameter configuration can perform competitively, indicating that good DA does not necessarily have to be complex.
As can be seen from Table 1, the majority of the previous studies on the classification of DR employed a traditional DA technique that was manually crafted, along with a limited number of optimization techniques. Such a traditional method often limits the flexibility of models to adapt and generalize well to new data. In many studies, the data transformations that were applied were fixed a priori, which limits the use of any adaptive mechanisms that can automatically determine the optimal values for the transformations. To address this gap, a new optimization technique for the classification of DR is presented in this study. The technique has a two-phase optimization process that is specifically tailored for the classification task. In the first phase, a focus is placed on the establishment of a good baseline by exploring the use of a number of different CNN architectures that were pre-trained while varying the conditions for DA. In the second phase, a new optimization technique that employs a combination of metaheuristics, including WSO, BA, and PSO, is employed to automatically determine the optimal combinations for DA transformations instead of relying on a fixed set of values that were determined a priori. A unique advantage that the optimization technique presented in this paper possesses over the traditional method for DA in the classification task for DR is that instead of relying on a fixed set of values that were determined a priori, the technique employs a feedback mechanism that dynamically adapts the values for DA depending on the performance of the model. A second advantage that the optimization technique possesses over the traditional method for DA in the classification task for DR is that instead of relying on a fixed set of values that were determined a priori, the technique employs a comparative mechanism that maintains a balance between exploration and exploitation. To the best knowledge of the authors, no study has explicitly employed a metaheuristic optimization technique for the selection of DA in the classification task for DR. Therefore, this study presents a new optimization technique that markedly improves the robustness of models for the classification task for DR.
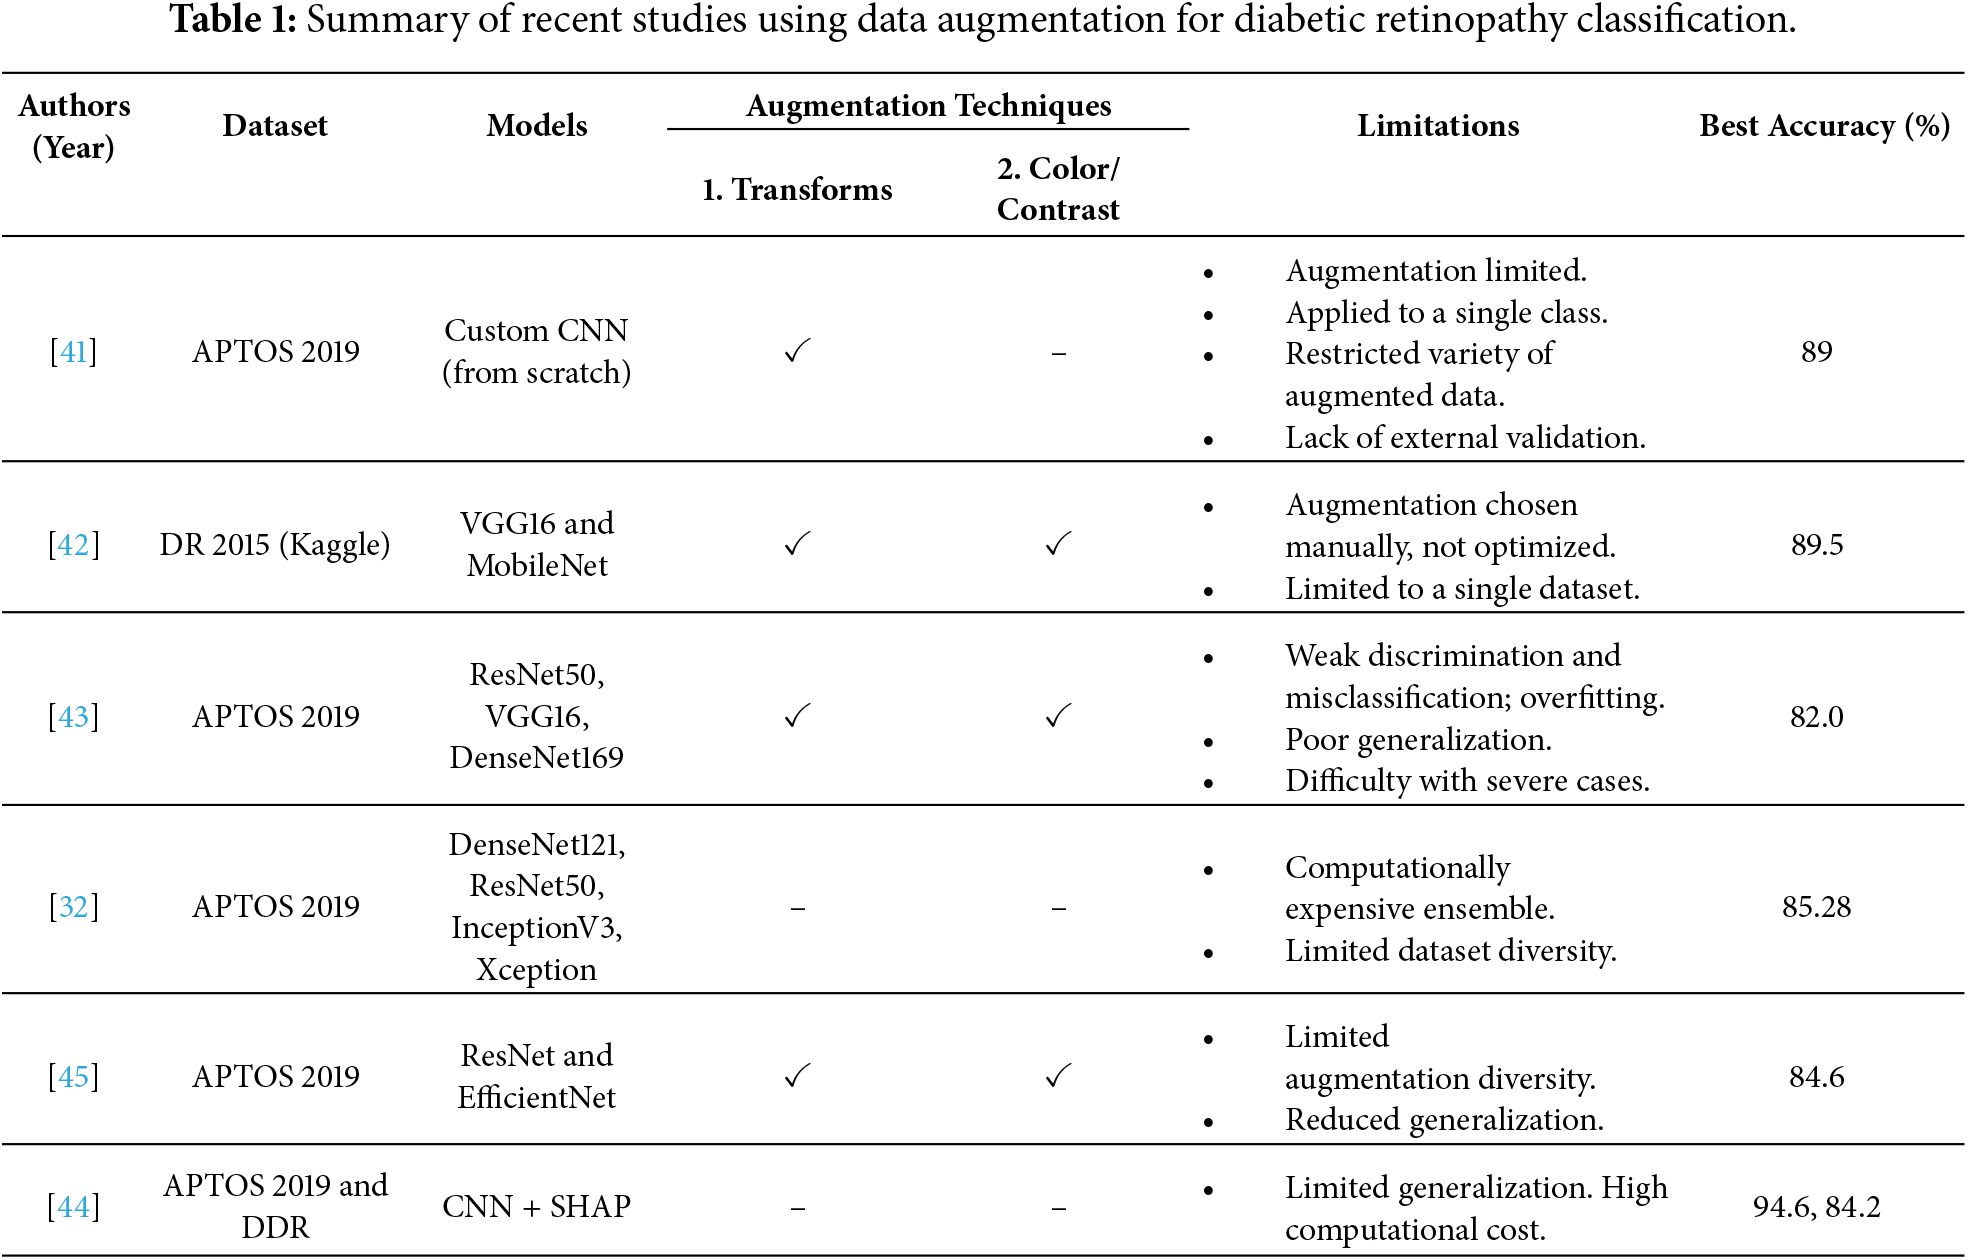
Based on the reviewed literature, three major research gaps are identified: the absence of metaheuristic-based augmentation selection for DR classification [41,43,45], poor cross-dataset generalization due to manual augmentation [43,44], and a lack of adaptive feedback mechanisms in traditional augmentation strategies [46,47]. The present work aims to fill these gaps by formulating the augmentation subset selection problem as a binary optimization problem solved by the the WSO and comparing its performance with BA and PSO [42,45], and by proposing a dynamic feedback-driven augmentation strategy that adapts to the model performance [43,46]. As far as we are aware, this is the first explicit formulation of the augmentation subset selection problem as a binary optimization problem for DR classification.
The growing body of literature on metaheuristic-driven optimization in medical imaging [61–65] confirms that bio-inspired algorithms including Manta Ray Foraging Optimization (MRFO), PSO, GWO, and WSO can effectively navigate complex hyperparameter spaces while maintaining computational efficiency. Yet, a critical area that remains: those studies are mainly optimized for either model architecture or training parameters, but not for the composition of the augmentation pipeline itself. While there are a few studies that have addressed the problem of augmentation subset selection across medical imaging fields, such as DR classification [61,62,65] and ophthalmology, a gap that the present work directly addresses for DR classification.
This study introduces a two-stage DR classification approach based on baseline pre-trained CNNs, DA strategies, and metaheuristic optimization techniques. Phase 1 (as shown in Fig. 1) establishes baselines by training CNN backbones under three scenarios: first, without augmentation; second, using standard augmentation techniques, and third, with separate individual augmentation techniques. This arrangement establishes an unbiased benchmark and allows assessment of each transformation’s distinct effect. As depicted in Fig. 1, Phase 2 treats augmentation selection as a binary combinatorial optimization task, and a WSO-based search is employed to automatically identify effective augmentation combinations, thereby overcoming the limitations of manual, heuristic choices. Finally, the WSO-selected models are aggregated through soft voting (i.e., averaging their class-probability vectors) to derive the final prediction on the held-out test set, thereby enhancing robustness and reliability.
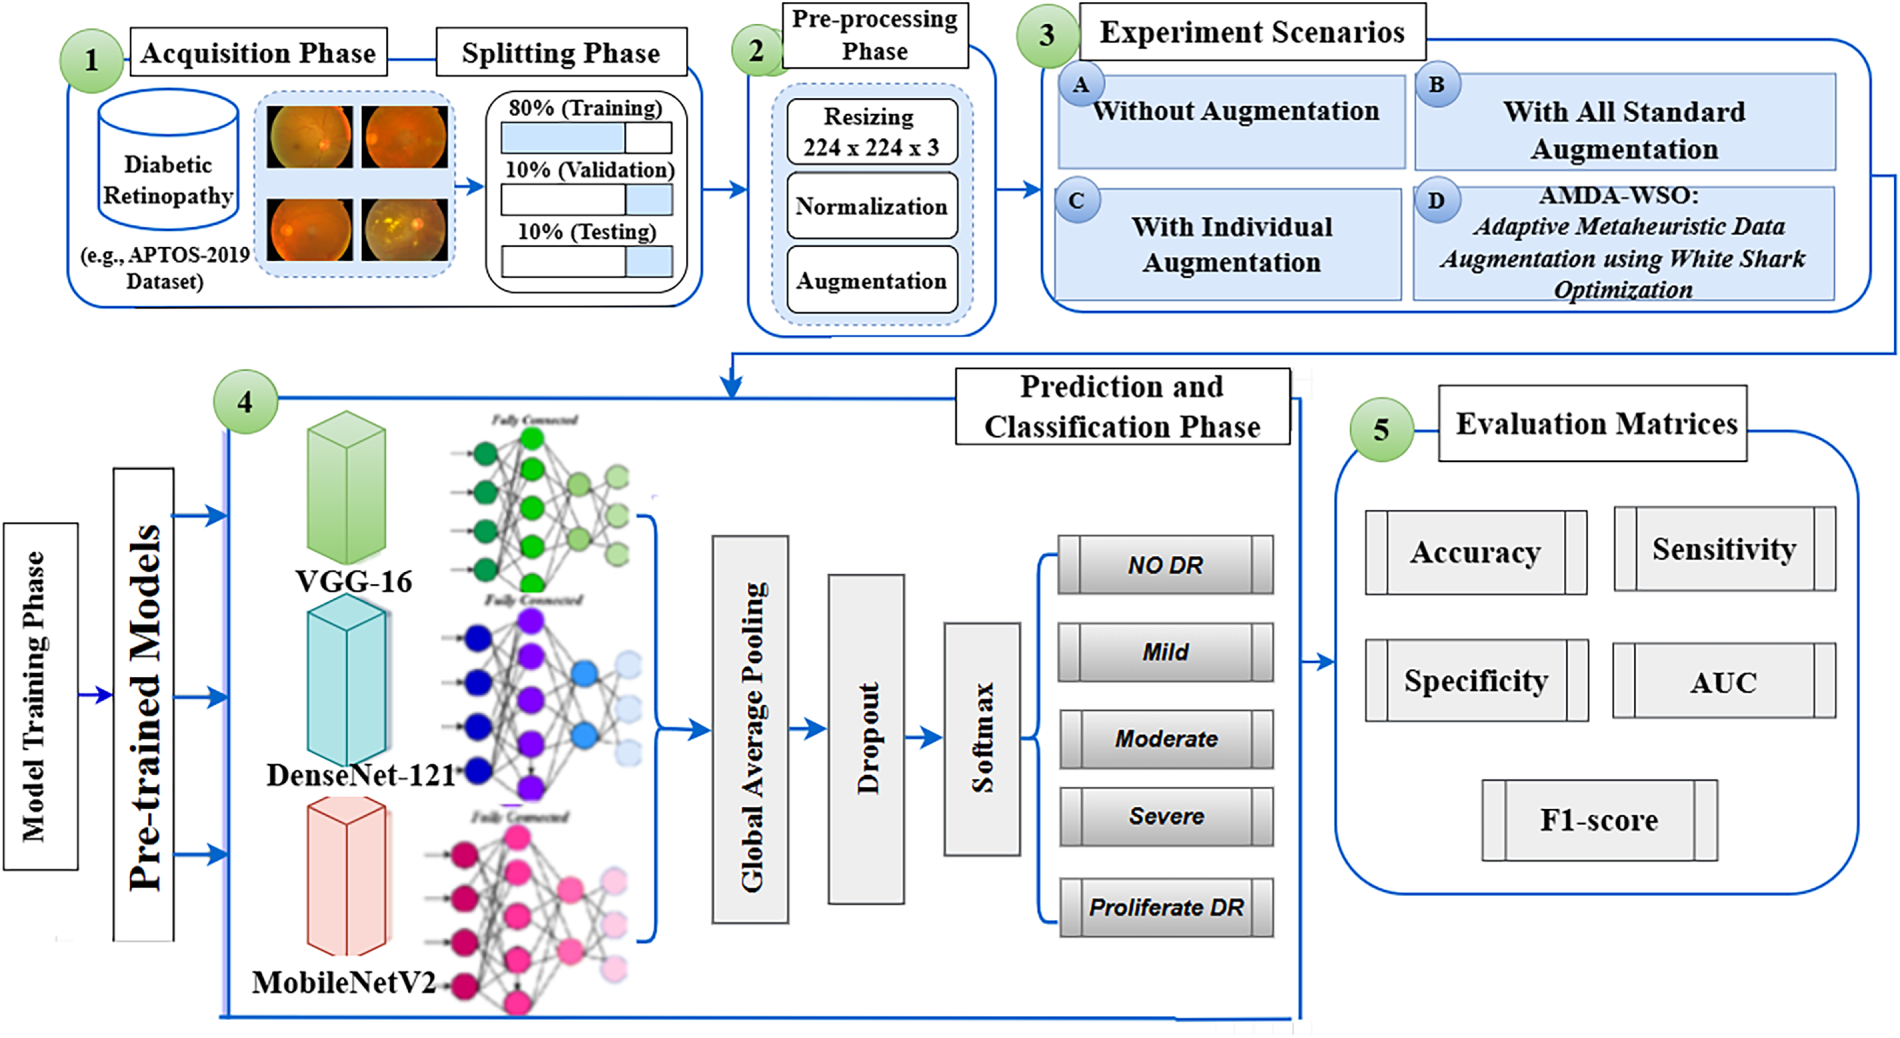
Figure 1: The proposed framework for diabetic retinopathy classification using pre-trained CNN models (VGG16, DenseNet121, and MobileNet) under three scenarios: without augmentation, with standard augmentation, and with individual augmentation.
This two-stage architecture therefore constitutes both baseline evaluation and adaptive optimization to enhance the overall generalizability of DR classification based on CNN. With the baseline determined and augmentation scenarios being applied, the stage II adaptively chooses the optimum combination of augmentation schemes based on the WSO. The major working principle of the WSO algorithm is briefly described as below.
3.1 Pre-Trained Deep Learning Approaches
TL has become an effective strategy for medical image classification, especially in DR detection were obtaining large, annotated datasets is often difficult. Rather than building a CNN from the ground up, TL makes use of models already trained on large image repositories such as ImageNet. Because pre-trained models already capture common visual features from large datasets, they can be adapted to new tasks with less training effort. This helps shorten training time and reduce the demand for high computational power. Still, TL is not always reliable; when the new dataset is very different from the original one, the transferred knowledge may fail to help and can even reduce performance. In CNNs, this adaptation happens through convolutional, pooling, and fully connected layers that gradually extract and combine features before making the final classification. Building on this foundation, the present study applies transfer learning with three widely recognized CNN architectures (VGG16, DenseNet121, MobileNetV2) to classify retinal fundus images. Furthermore, to address the problem of data scarcity and reduce overfitting, metaheuristic algorithms are employed to automatically select the best combination of DA techniques (e.g., horizontal and vertical flipping, rotation, and scaling). This strategy enhances generalization and improves the accuracy of DR diagnosis.
VGG16, proposed by [66], is a deep CNN that consists of 16 layers and nearly 138 million parameters. The network is built with 13 convolutional layers and three fully connected layers, each using Rectified Linear Unit (ReLU) activation functions. Instead of using large kernels, the VGG16 structure uses numerous small-sized 3
Another popular CNN architecture is DenseNet proposed by [68] which connects each layer directly to all the succeeding layers. This design makes it easier to flow information, makes it easier to re-use features and decreases redundancy. A popular version is DenseNet-121, which features 4 dense blocks of 6, 12, 24, and 16 layers. Each block uses 1
MobileNet is a DL model created by Google [70]. It is a compact DL model for mobile devices and embedded systems. The main advantage of MobileNet is that it is computationally efficient and compact in size. MobileNet is capable of achieving competitive accuracy with a small number of hyperparameters [30]. The main idea behind MobileNet is depthwise separable convolution, which reduces the computation requirement of the model significantly compared to a normal CNN. The MobileNetV2 architecture is based on 32 initial convolutional filters, followed by 19 bottleneck layers. Normally, a 2D CNN works on all the channels of the input feature map as a whole. Depthwise CNNs split the input feature map into individual channels and apply a convolutional layer on each channel separately. The outputs of individual channels are combined using a 1
3.1.4 Enhanced CNN Architecture
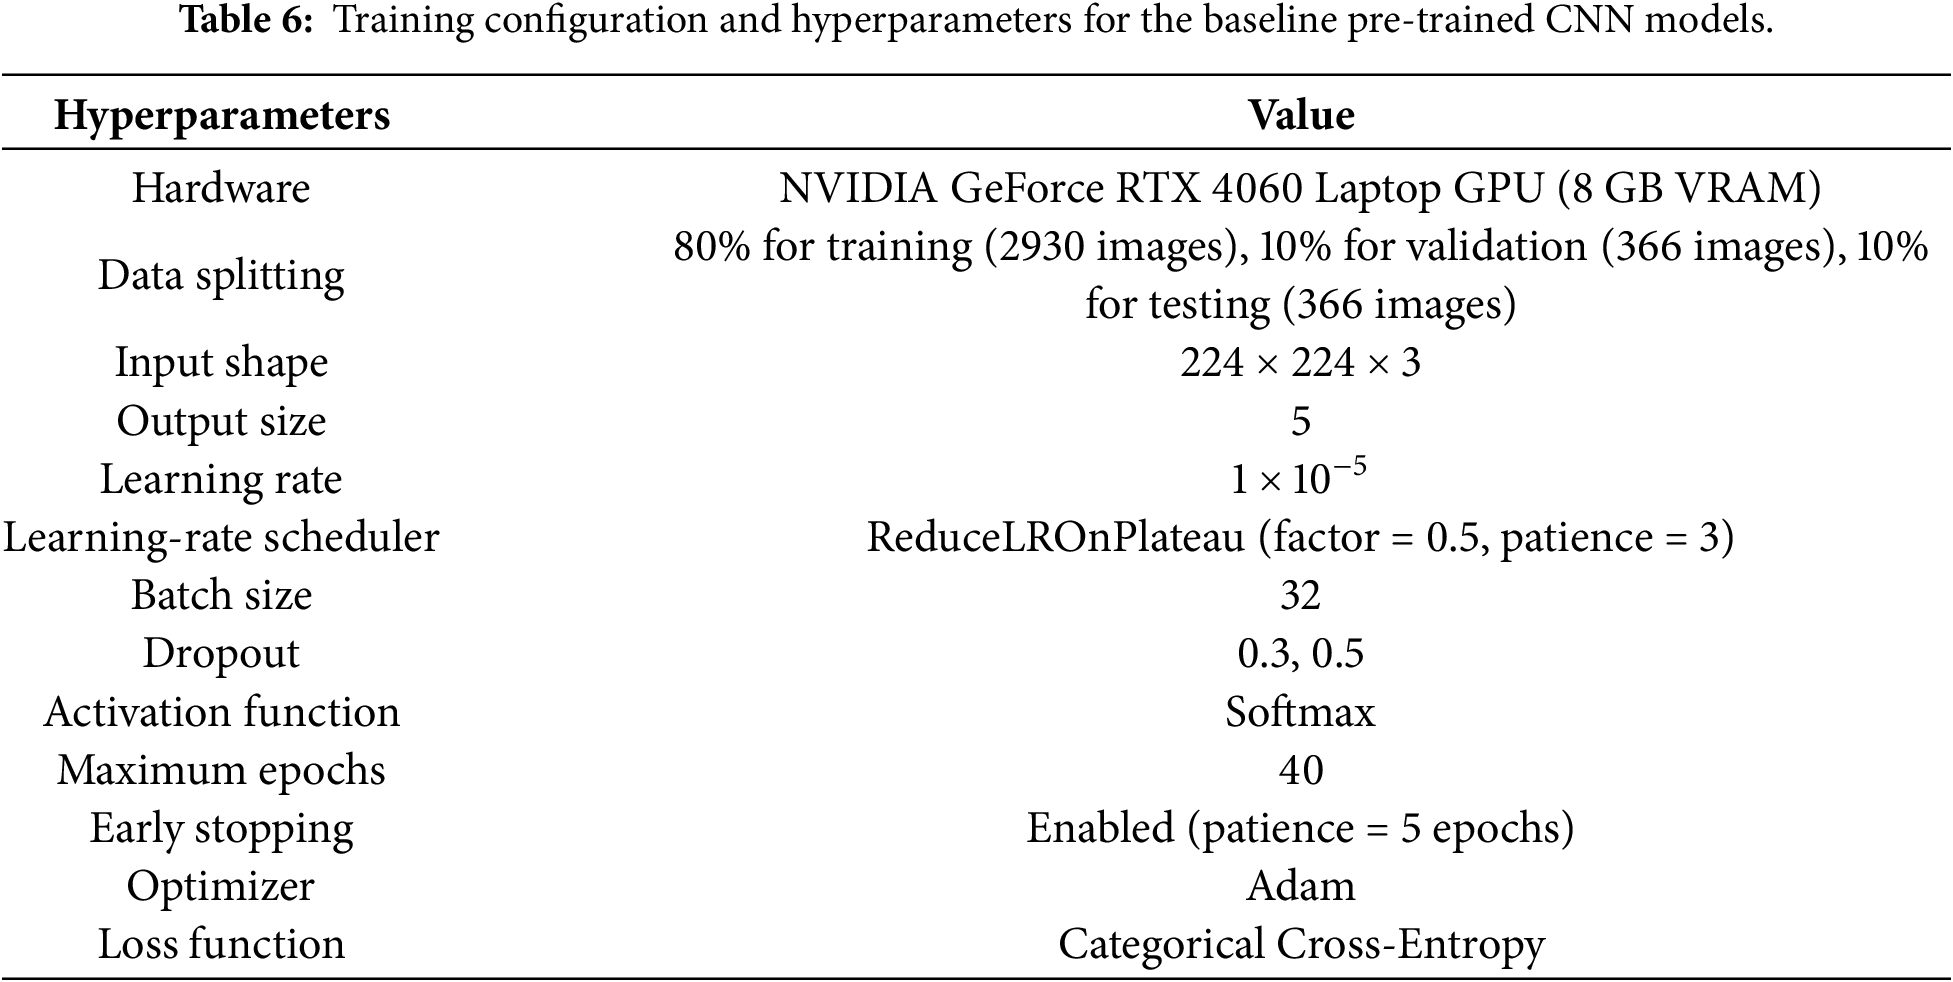
In this study, pre-trained convolutional neural networks (CNN) models VGG16, DenseNet121, and MobileNetV2 were used as a backbone neural network for DR classification using the APTOS 2019 dataset, as shown in Fig. 1. The pre-trained CNN models were originally trained on the ImageNet dataset; hence, their convolutional layers were frozen and used as feature extractors, followed by additional layers for five-class DR detection. The modification of pre-trained models was initiated by adding a Global Average Pooling (GAP) layer to reduce the dimension of the feature map obtained from the final convolutional layer of the pre-trained models. The GAP layer reduces the dimension of the feature map to a collection of one-dimensional vectors. This helped to keep a reduced number of trainable parameters while still retaining the spatial information that is necessary for efficient classification. Additionally, a dropout layer with a 0.5 rate and a dense layer with 2048 ReLU units and no dropout layer was added to capture complex feature representations; to further increase the generalization capability and avoid potential overfitting, a dropout layer with rate 0.5 was added. Another dropout layer of 0.3 rate was included to further stabilize training prior to entering into a final dense output layer of five neurons that implements a Softmax activation function to provide class probabilities indicating DR levels: no-DR, mild, moderate, severe, and Proliferative Diabetic Retinopathy (PDR).
The models were trained with Adam optimizer, starting from a learning rate of
Both learned weights and corresponding outputs of the predictions were stored for each of the trained CNN models. The weights aided in loading the pre-trained networks without having to retrain the models initially, and the output files stored the class-probability vectors evaluated for each image and augmentation. Such output thus stored was then utilized within the WSO-based selection and the ensemble module, with ease of computational efficiency and reproducibility.
One of the main difficulties in training DL models for medical image analysis is the lack of enough varied and balanced data. These models contain many parameters that need a large and diverse dataset to perform well. When the data are limited or not representative, the model easily memorizes the training samples and fails to work properly with new images. In medical imaging, this problem is common because collecting large and well-balanced datasets is often restricted by privacy issues, the high cost of data collection, and the unequal occurrence of diseases. Therefore, the model has a tendency to overestimate the majority classes, and it is difficult to identify the minority classes. In order to overcome the limitations of the model, DA was used to increase the amount and variety of the training images. This was done by creating new images from the original images, but modifying them by a few operations, including flipping, rotation, zooming, shifting and scaling. This will enable the model to view the same image from a different perspective so that the model will be more adaptable and less sensitive to changes between images. This helps the model to be more stable, resulting in better overall outcomes.
The method described has been adopted and improved by using the APTOS 2019 data for the purpose of this study. This particular dataset was highly imbalanced with many of the images being of the majority classes. This has made it difficult for the model to be able to learn from the minority classes. To address the limitations, several DA techniques have been employed which increase the size of the data but do not affect the medical truth and integrity of the images. For this specific example, shearing, width/height shifting, zooming, rotating and flipping were performed. These transformations simulate realistic changes that are typically experienced in a camera’s orientation, size or location when taking a image. Flipping helps the model avoid directional bias, rotation improves tolerance to misalignment, zoom adjusts for scale variations, and shear and shifts enhance robustness to positional changes of retinal features. Altogether, these methods expanded the training data, reduced overfitting, and made the model more stable and reliable. Table 2 summarizes the augmentation techniques adopted in this study together with their intended contributions to classification robustness.
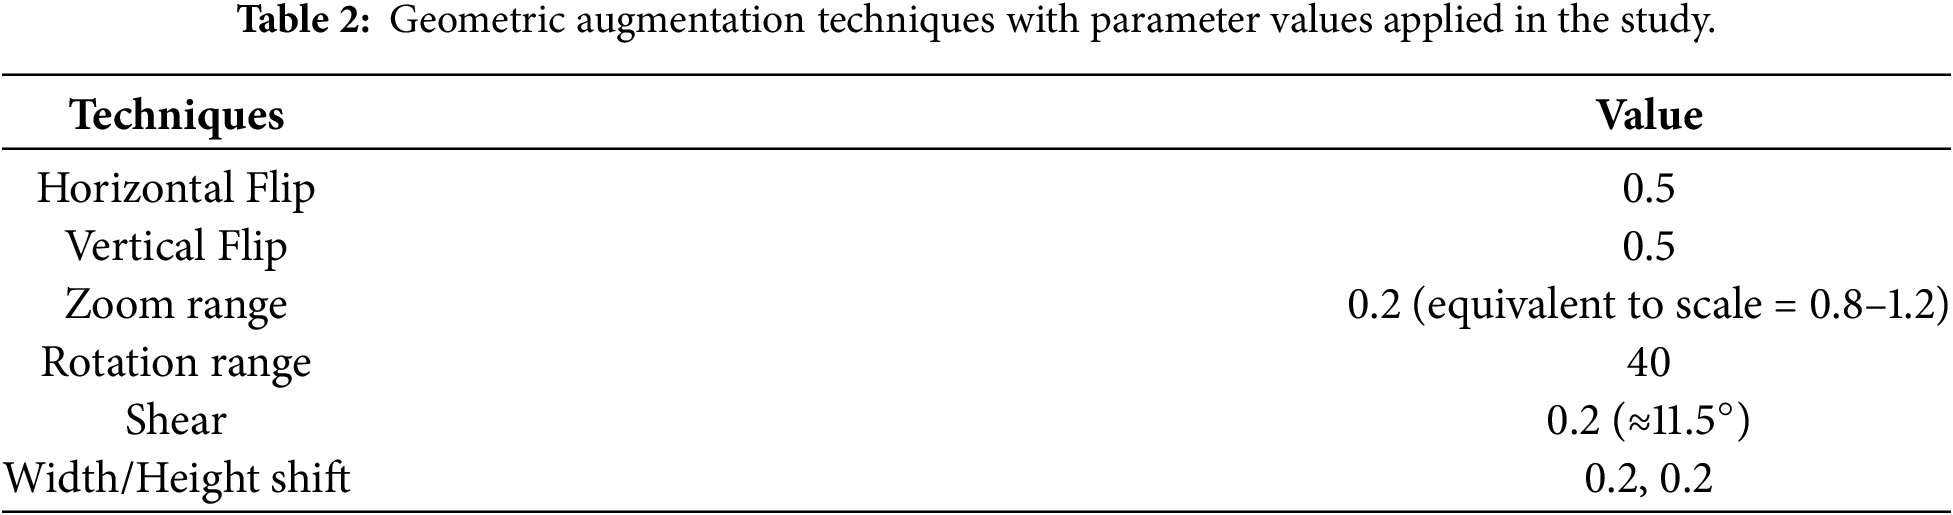
While DA is a common approach to enhance the generalization of a model, its overuse or inappropriate use of augmentation techniques can lead to unrealistic variations in the images and even to overfitting on artificial patterns. The proposed AMDA-WSO framework overcomes this problem by only using the most effective augmentation subset for validation based on the performance of the validation, rather than using all the available transformations at once. The framework enables to expand data diversity while keeping clinically relevant retinal characteristics. Furthermore, early stopping, dropout and validation-based fitness evaluation further decreases the risk of overfitting and enhance model generalization.
Each augmentation operation contributes to the robustness of the model in its own unique way, but not equally across all datasets. Some transformations may add complementary information while others may add redundant or less useful variations. Hence, the proposed AMDA-WSO framework can automatically select the optimal augmentation subset that maximizes the validation performance, thereby keeping informative augmentation operations and discarding redundant and less influential augmentation operations.
3.3 White Shark Optimization Algorithm
The WSO is a population-based metaheuristic inspired by the hunting behavior of great white sharks. For WSO, the individual search agent acts as a candidate solution in the optimization space, with the initial population of sharks being randomly allocated throughout the search domain at the commencement of the algorithm. Movement and update mechanisms are modeled after sharks’ exceptional senses of hearing and smell, which enable both global exploration and local exploitation of the search space.
3.3.1 Movement Speed Towards Prey
As WSO is a population-based algorithm, it commences by randomly generating a set of initial solutions when initiating the optimization process. A population of
where
where
The fitness of each initial solution, as represented in Eq. (1), is then evaluated to determine its quality. Whenever a newly generated position proves superior to a previous one, it replaces the older solution during the updating stage. This search mechanism is further guided by the predatory behavior of great white sharks: after sensing prey through wave frequencies, a shark adjusts its trajectory toward the target in oscillatory motions. This adaptive movement is mathematically expressed as:
where
where
3.3.2 Movement Towards Optimal Prey
When white sharks are stimulated by an olfactory or a sound signal, they tend to swim towards the prey. If the prey is not captured, they leave behind a trail of scent which leads the shark, and the shark then switches to random exploratory movements, a strategy for hunting for food. This behavior is mathematically described in the following position update scheme in Eq. (5):
The update position vector of the
3.3.3 Movement Towards the Best White Shark
White sharks adjust their positions by approaching the best-performing member of the group, usually the one nearest to the prey. This behavior is mathematically represented as follows Eq. (6):
The updated position
The behavior of the fish school in WSO is simulated as a function of the current position of each white shark and updated position of each white shark as described in Eq. (7):
Here,
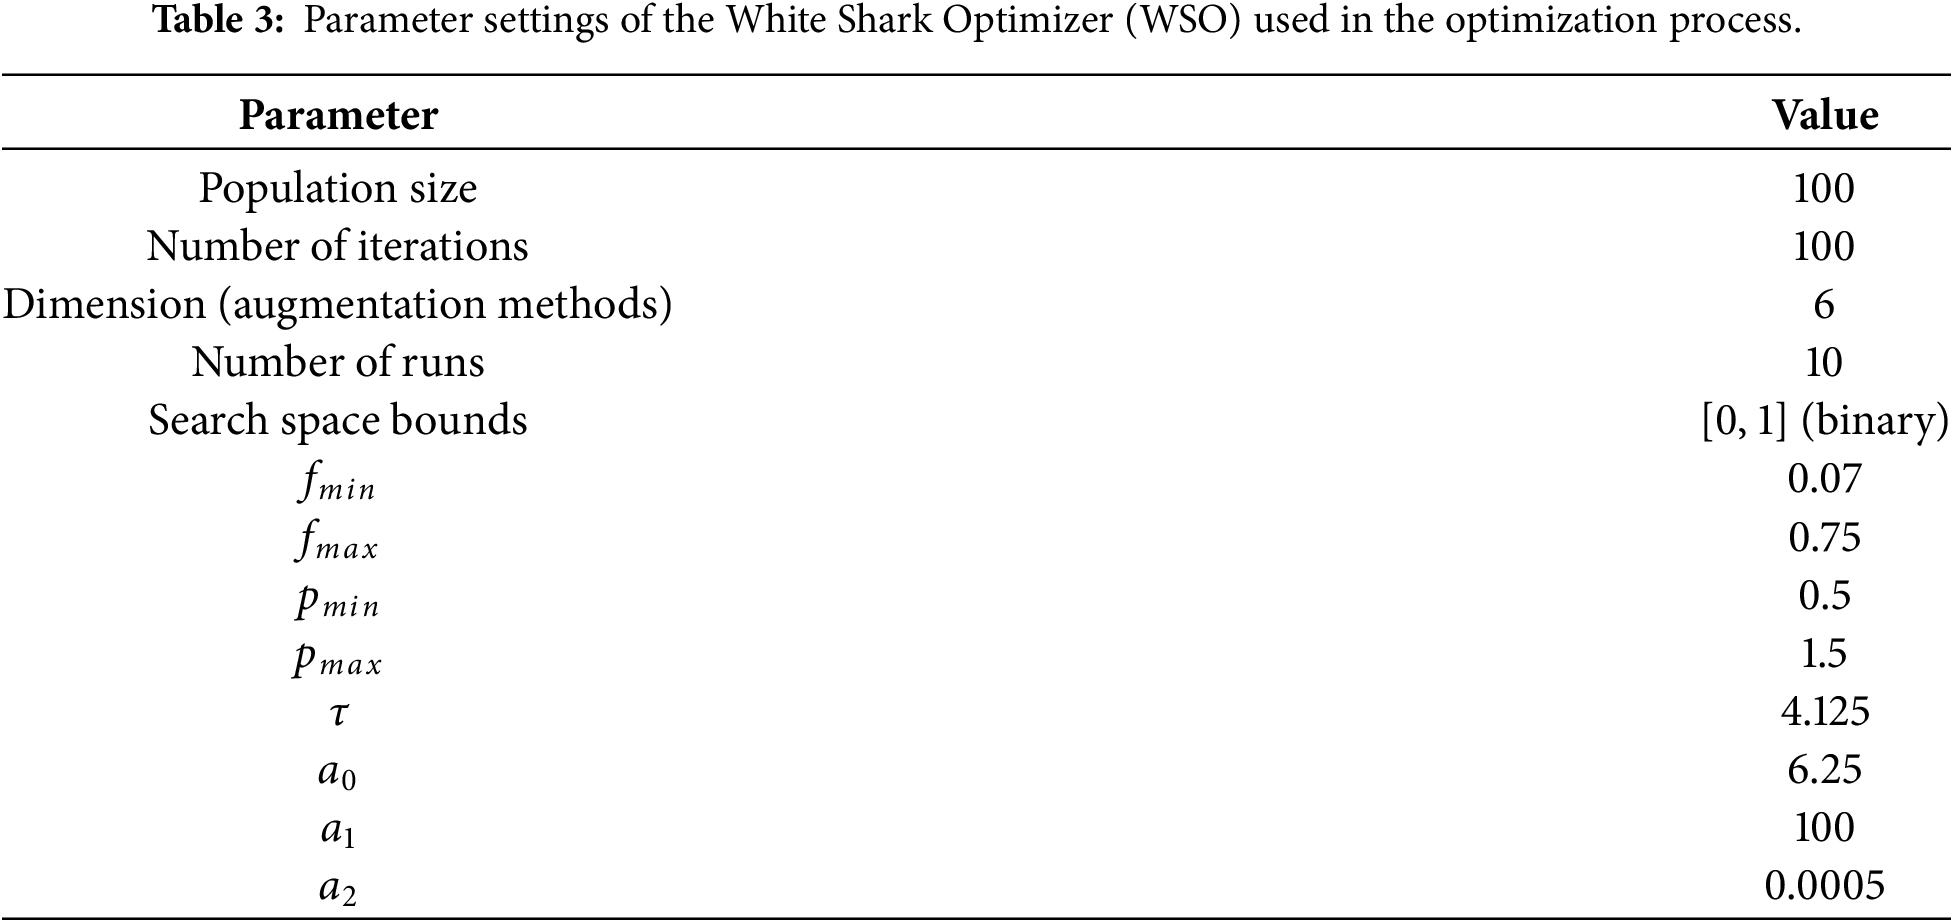
In WSO, the parameters
3.4 The Proposed AMDA-WSO Framework for Automated Data Augmentation Selection
The proposed AMDA-WSO framework integrates a binary variant of WSO with pre-trained CNN models to automatically select the optimal combination of augmentation-specific CNN models for DR classification. DA is important for building robust pre-trained CNN models. Its role becomes even more critical when only small medical imaging datasets are available. Nevertheless, conventional methods that rely on fixed or manually designed augmentations often lack adaptability and fail to generalize across different datasets and tasks. To overcome this limitation, WSO is integrated with pre-trained CNN models to adaptively select combinations of augmentation techniques for DR classification. Additionally, WSO frames augmentation as a binary optimization task, where each candidate solution corresponds to a binary selection of augmentation-specific CNN models, each trained using a different augmentation technique. Inspired by the hunting behavior of white sharks, the algorithm balances exploration and exploitation to search the augmentation space effectively. This balance helps avoid premature convergence and increases the likelihood of discovering stronger sets of transformations. As shown in Fig. 2, the algorithm iteratively improves the positions of the sharks and tests the candidate augmentation strategies, which are optimized based on the model’s performance rather than pre-defined or manually chosen strategies. This minimizes the risk of overfitting, allowing for better robustness and generality for CNN-based DR classification.
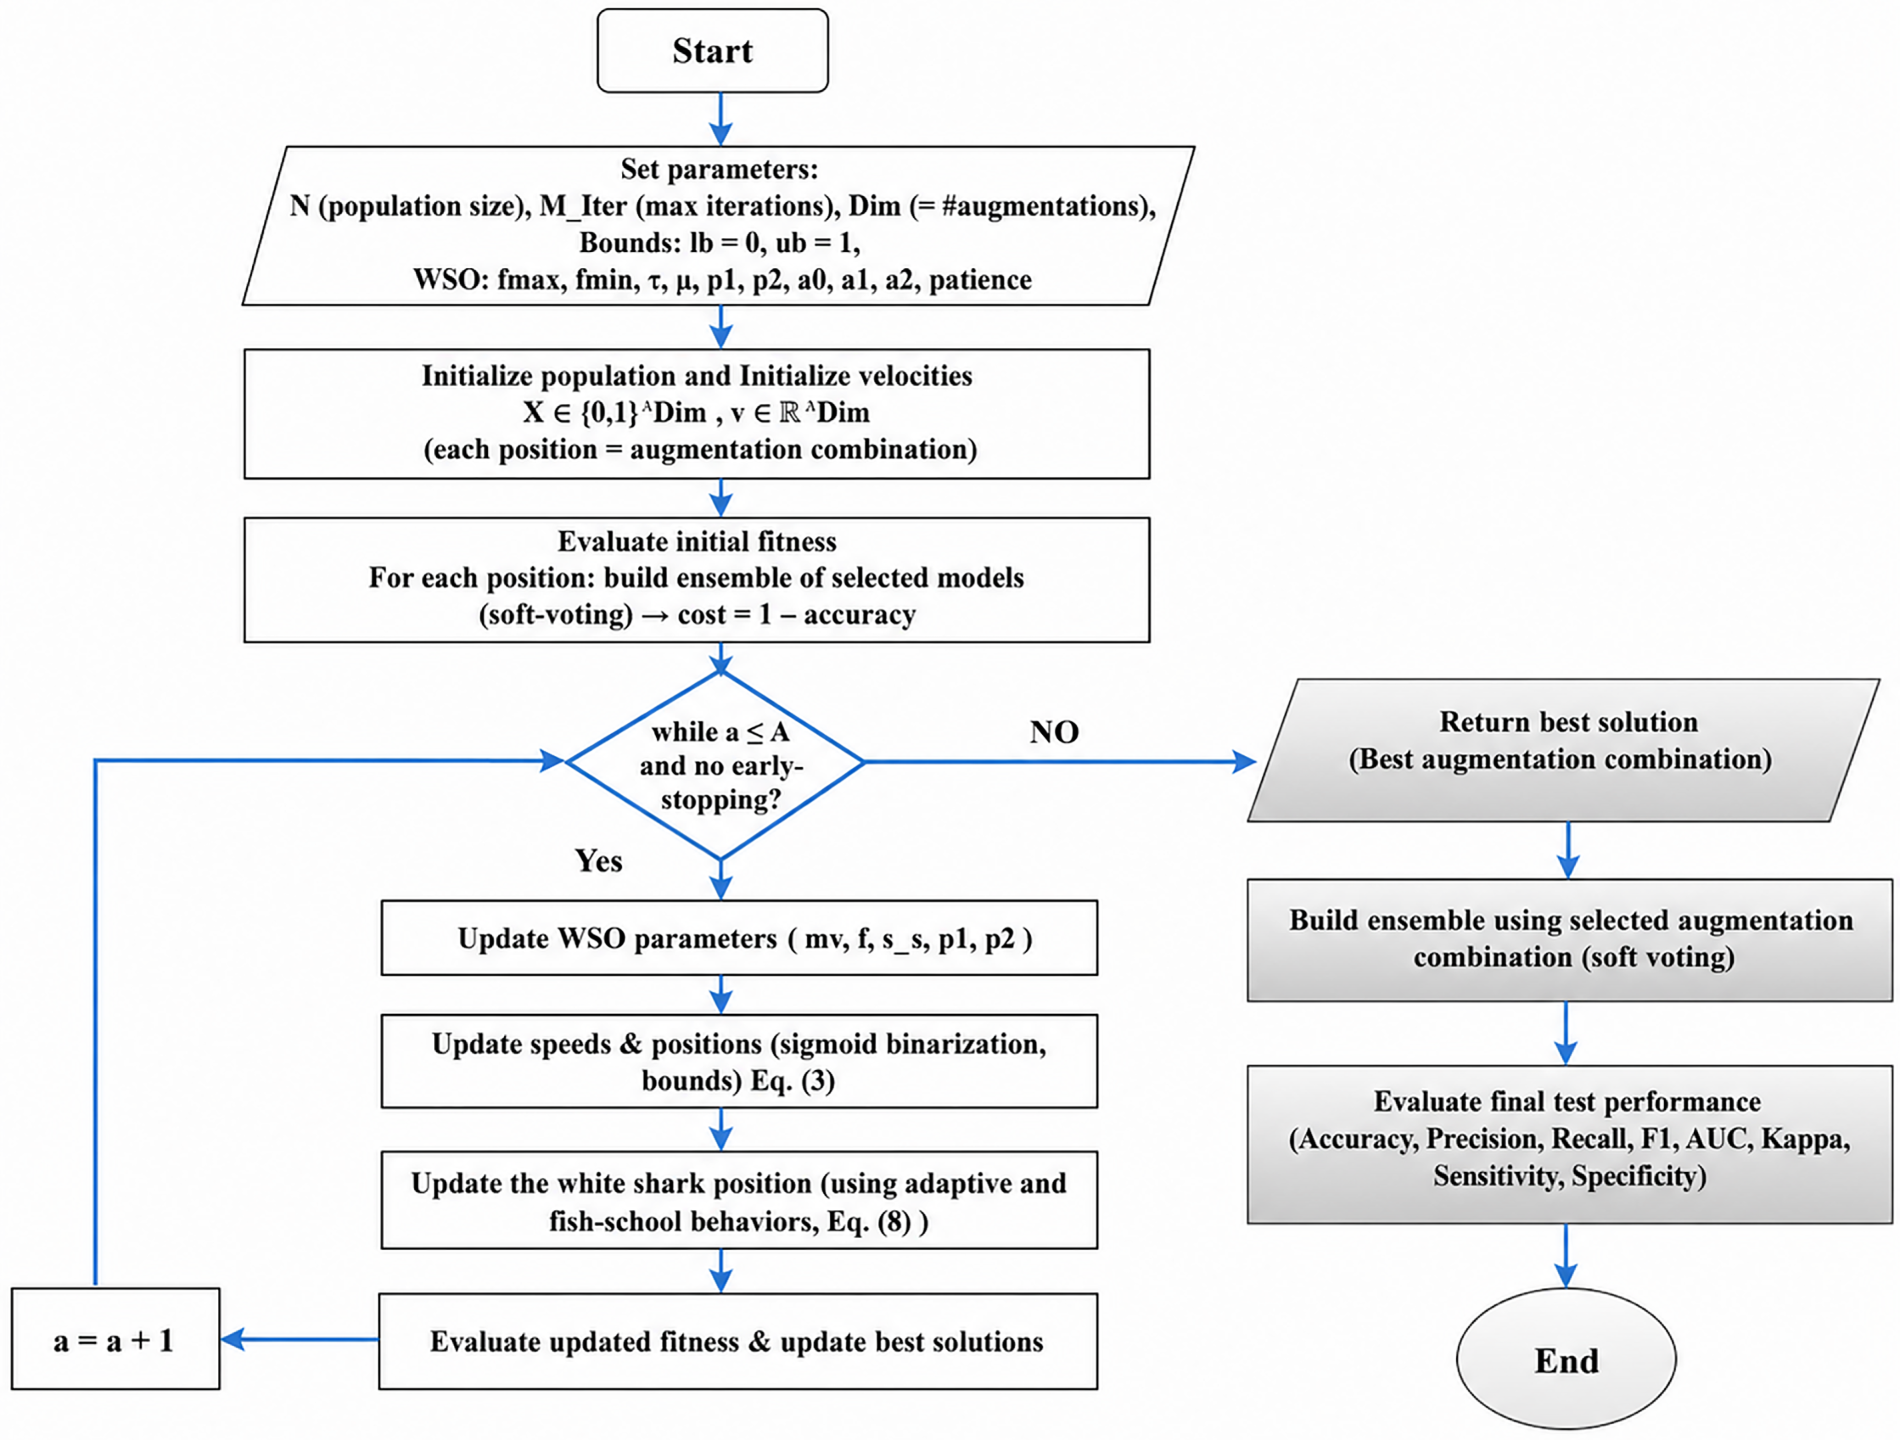
Figure 2: Flowchart of the proposed AMDA-WSO framework for binary augmentation combination selection in diabetic retinopathy classification.
It is worth to note that the binary optimization process is a selection process of the best subset of CNN models independently trained for each augmentation. Instead of retraining a single CNN with multiple augmentation operations simultaneously, the selected models are combined using average soft voting to get the final prediction.
• Representation of candidate solutions
In the WSO algorithm, the candidate for the augmentation strategy is presented as a binary vector, with each bit representing one particular operation included in the candidate solution. If the value of the particular bit is equal to 1, the corresponding operation is included, while a value equal to 0 means that the particular operation is excluded. Continuing with the example, if the candidate solution includes six operations for the DR image enhancement (horizontal flip, vertical flip, rotation, zoom, shift, and shear), the candidate solution can be presented as follows:
• Initialization of Population
In this stage, a population of shark agents is generated, where each candidate solution is represented as a binary vector
The obtained probability values are converted into binary decisions according to the following thresholding rule in Eq. (9):
where
This probabilistic transformation enables the continuous search dynamics of WSO to effectively operate in binary augmentation selection spaces.
The map from continuous position to the probability of choosing augmentation operations, as specified by the sigmoid transfer function, causes candidate solutions to be slowly transitioned between the binary states rather than deterministically transitioning from one state to another. For instance, operations with higher sigmoid probabilities are more likely to be selected while operations with lower probabilities are more likely to be excluded. This type of probabilistic mapping preserves diversity of the population during the initial stages of the search and gradually matures into good augmentation subsets. As velocity magnitudes increase, output of the sigmoid are approaching 0 or 1 during the optimization process, resulting in more stable binary decisions and a better balance between global exploration and local exploitation.
• Velocity and Position Update
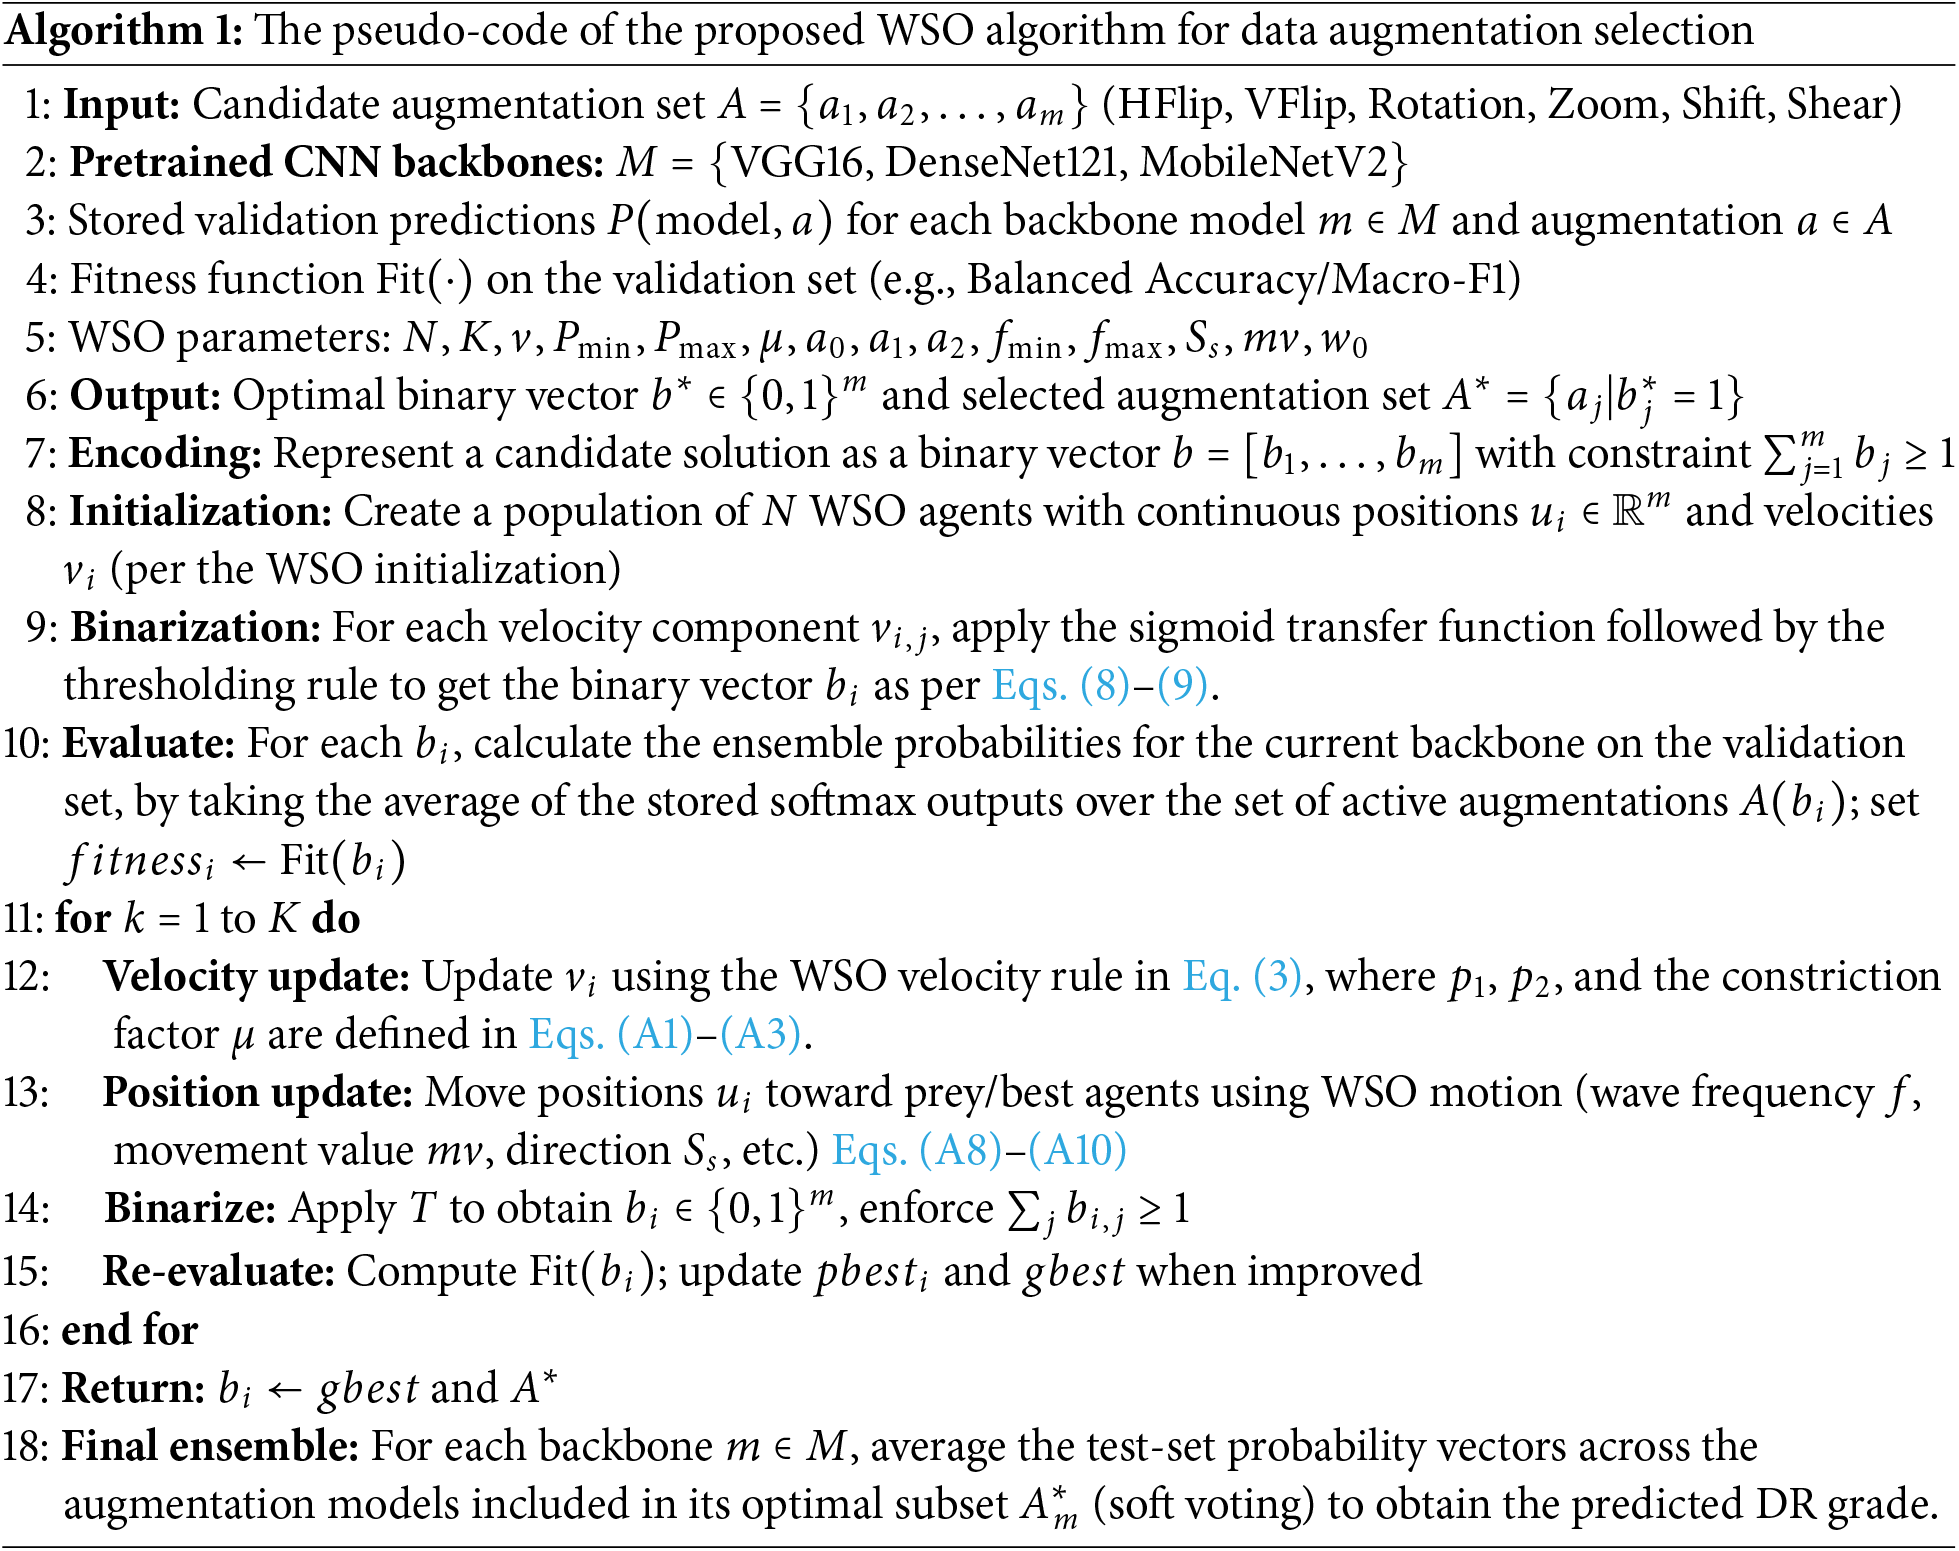
In calculating the fitness, each shark adjusts its speed and location based on the WSO adaptation equations (Eqs. (3), (5)–(7), along with auxiliary formulations provided in Eqs. (A1)–(A10). These equations are a simulation of the white shark hunting strategy and promote exploration (new augmentation subsets) and exploitation. In practice, this is the velocity step of Algorithm 1 (Line 13), and the position step of Algorithm 1 (Line 14) which update the movements of the shark agents in the search space. The optimization process is an iterative process, which enables the progressive approach to more efficient augmentation strategies without premature convergence.
• Iterative Optimization
The evaluation and update steps are repeated for a given number of iterations
• Final Ensemble Prediction
In this stage, the ensemble integrates the predictions of a single backbone (VGG16, DenseNet121, or MobileNetV2) trained under different augmentation subsets selected by WSO. Each augmentation variant produces a probability distribution over the DR grades, and these probabilities are averaged using a soft-voting rule to obtain the final decision (step 4 in Fig. 3 and Algorithm 1, Line 19). In this way, the model capitalizes on the diverse strengths of several augmentations and improves prediction stability.
where

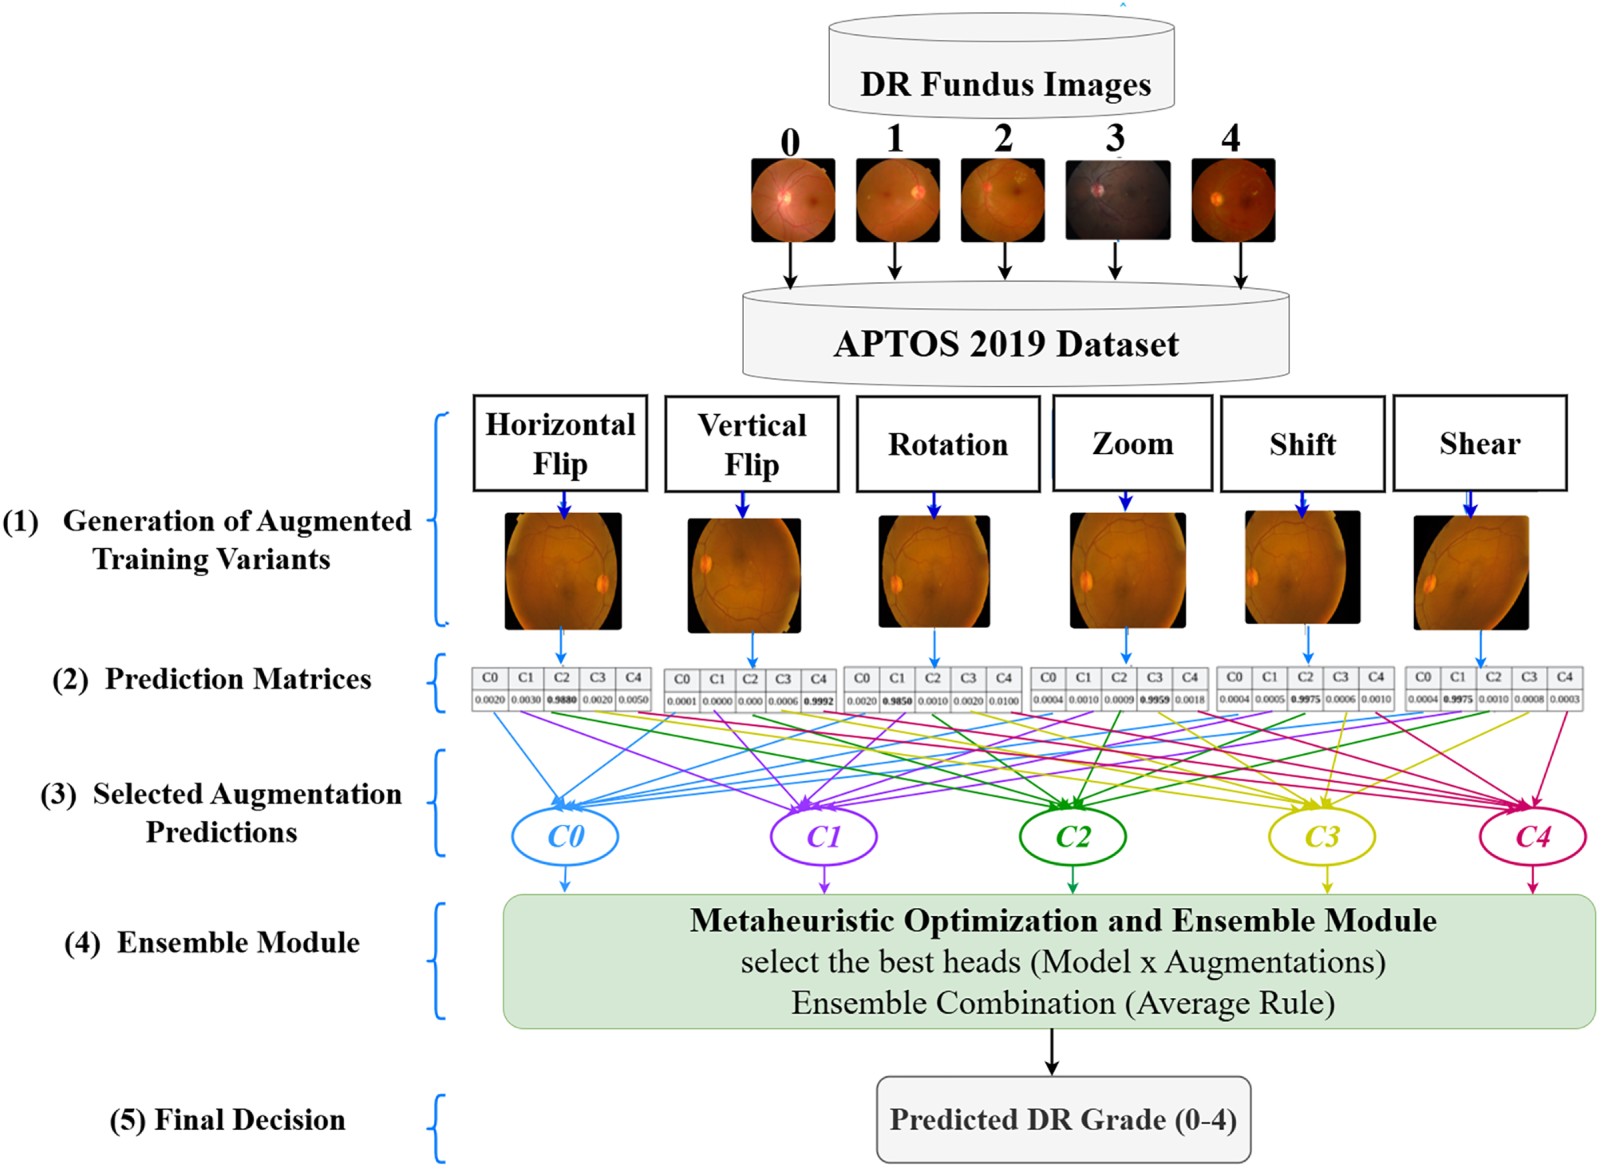
Figure 3: The proposed AMDA-WSO framework for six augmentation combination selection.
3.5 Analysis of Metaheuristic-Based Selection of Optimal Data Augmentation Combinations
In this section, the manner in which the proposed framework leverages metaheuristic optimization techniques, namely WSO, PSO, and BA, to automatically determine the most effective augmentation subsets for pre-trained CNN models is presented. In the process, these optimization methods seek to investigate the augmentation space defined by six augmentation methods: Horizontal Flip, Rotation, Shear, Vertical Flip, Width/Height Shift, and Zoom. The optimization goal, defined by the equations in Eqs. (1)–(7), is to maximize validation accuracy through adaptive activation and deactivation of augmentation methods defined by these equations. In this context, these optimization methods develop unique approaches to balance exploration, exploitation, and convergence to arrive at the optimal augmentation subsets that result in the most impactful transformations.
In the context of the proposed WSO optimization algorithm, the shark agents aim to optimize the augmentation space defined by a binary vector
For instance, for the VGG16 model, the WSO technique identified the optimal augmentation set
Furthermore, the PSO technique views DA selection as a social process of decision-making, where each particle carries a binary vector that represents a certain DA combination, and its movement is guided by individual and social knowledge. The velocity update rule, as defined in Eq. (11), is a function of three components:
where
For DenseNet121, PSO found the best augmentation subset to be [1, 0, 1, 0, 1, 1] which means horizontal flip, shear, width/height, and zoom. The social element of the swarm promoted alignments with the dominant transformations in the world, such as horizontal flips, which always seemed to be present in high performing configurations, and the cognitive part refined complementary augmentations like shear and zoom based on each particle’s local learning experience. This collaborative approach led to a well-rounded and meaningful selection mechanism for augmentations that enhanced DenseNet121’s representational power and mitigated overfitting.
Unlike WSO and PSO, which rely on velocity and swarm dynamics, the BA takes inspiration from the natural foraging behavior of bees to find the best augmentation combinations. Each bee represents a possible set of augmentations encoded as a binary vector, where “1” means that a transformation is applied and “0” means it is skipped. The search begins with scout bees that explore different regions of the space, generating a wide range of candidate augmentation strategies. The most promising combinations those that lead to higher validation accuracy are treated as elite sites. Around these elite sites, other bees perform small local searches by slightly changing the augmentation bits to test nearby possibilities.
With the search, BA automatically enhances augmentations that increase model performance and eliminates those that introduce noise or redundancy. In the case of the MobileNetV2 model, the algorithm converged to the subset of
In essence, BA is an approach where the interplay between exploration and refinement is utilized in an adaptive manner to choose the most important augmentations in an optimal manner. This synergy allows the algorithm to automatically discover an optimal yet interpretable set of transformations that match the characteristics of the MobileNetV2 model, thereby improving the learning of effective features while avoiding overfitting.
By reviewing the optimization methods, it is evident that each of the optimization methods, WSO, PSO, and BA utilizes its unique search strategy in the determination of the optimal data transformations. For the WSO, the movement and velocities of the swarm are the focus, where the transformations that have the greatest impact on the model’s performance are quickly discovered. For the PSO, the shared experiences of the swarm are utilized, where each particle learns from its individual experiences as well as the shared experiences of neighboring particles in the swarm. Lastly, the Bees Algorithm is unique in its approach, where the search strategy is an attempt at emulating the search strategy of real bees, where the swarm disperses initially, then converges on the optimal transformations that have the greatest impact.
Although each algorithm’s search strategy is unique, the ultimate goal is the same to find the optimal yet concise set of transformations that have the greatest impact on the model’s performance, thereby improving accuracy. Through the application of each of the optimization methods, the results demonstrate that the selection mechanisms are effective in discovering the optimal set of transformations that have the greatest impact on model accuracy. The following section provides an overview of the experimental results that support the effectiveness of the selection mechanisms.
4 Experiments Results and Discussion
4.1 Dataset Collection and Description
This study employs the APTOS 2019 DR dataset, which is publicly available on Kaggle (https://www.kaggle.com/c/aptos2019-blindness-detection/data). It consists of 3662 retinal images collected from ophthalmology centers in India, primarily at Aravind Eye Hospital, using fundus imaging techniques under varied photographic conditions. This dataset groups the images in five different classes: no DR (class 0), mild DR (class 1), moderate DR (class 2), severe DR (class 3), and proliferative DR (class 4). Table 5 reports a noteworthy uneven distribution of the above classes present in the APTOS dataset; of the images 49% are labeled as no DR, 8% for proliferative retinopathy class, and 5% for severe disease. Fig. 4 illustrates a few example images selected from the APTOS 2019 blindness dataset.
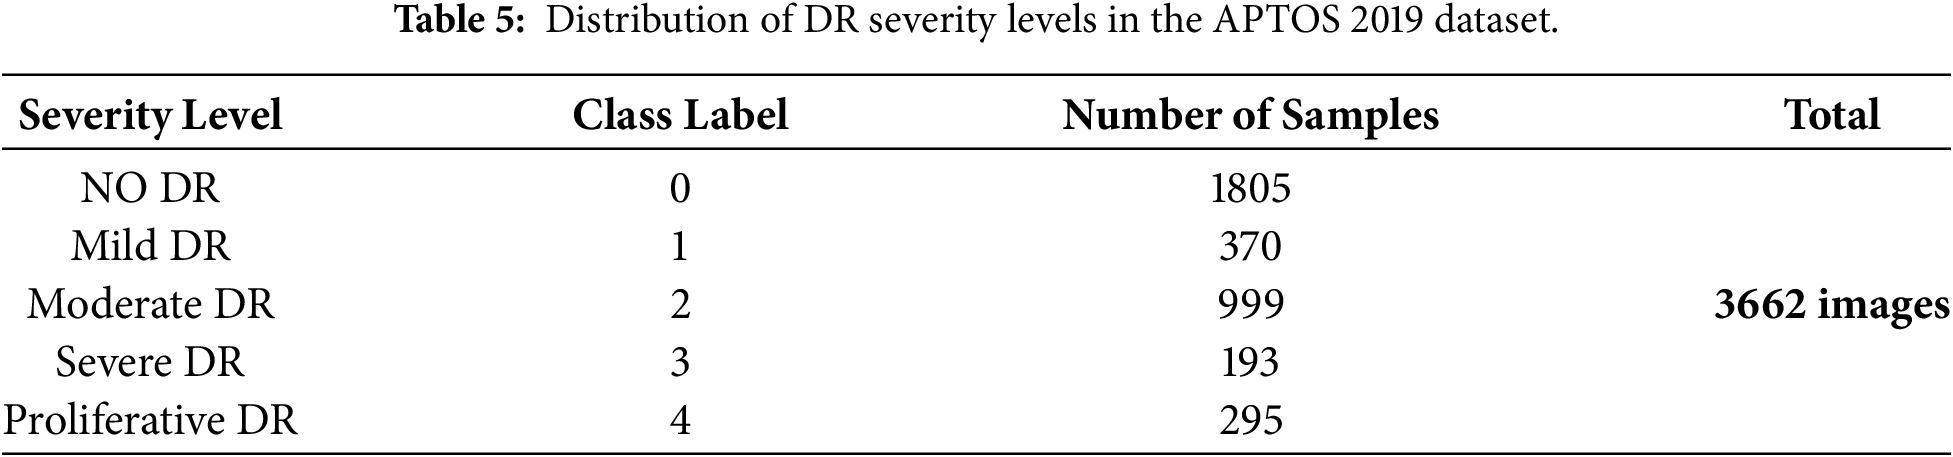
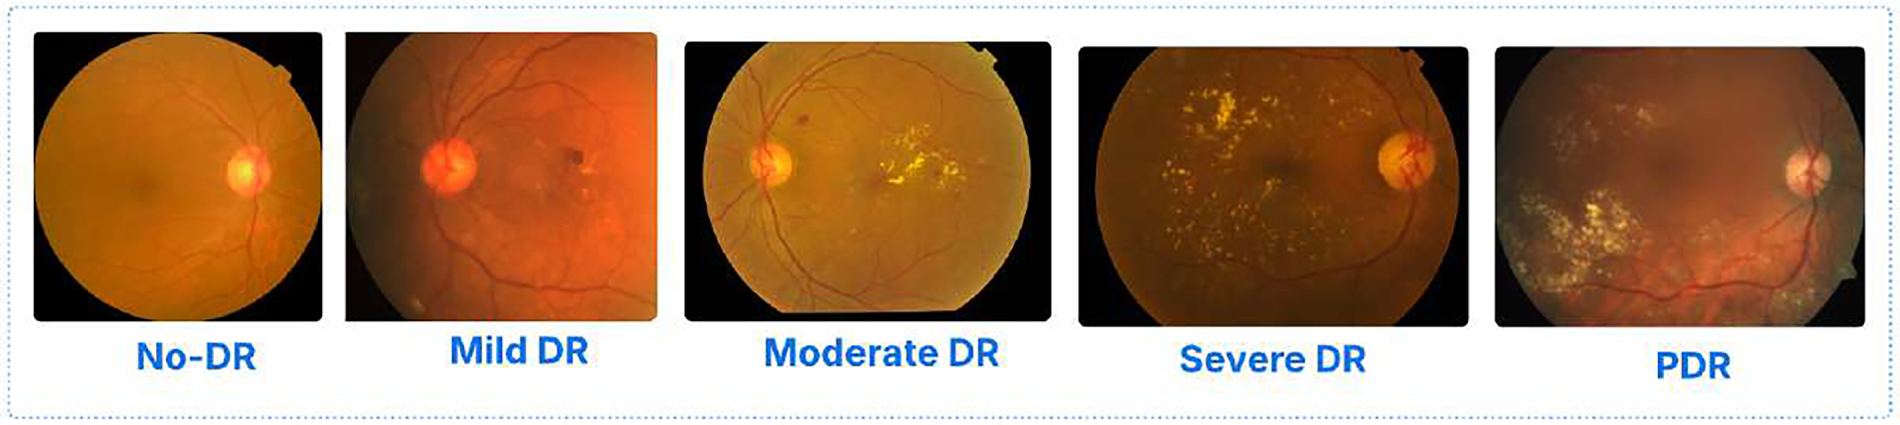
Figure 4: Sample fundus images from each grade of the APTOS 2019 DR dataset.
Table 5 shows that, although the dataset contains five classes, the sample distribution across classes is highly imbalanced. Previous studies [75] reported that such imbalance increases misclassification rates and reduces performance. To overcome this issue, DA was adopted. The techniques included horizontal and vertical flipping, zooming, rotation, shearing, and width/height shifting [43]. These transformations produced an augmented version of the APTOS dataset.
After the class distribution in Table 5, all images were preprocessed using the pre-processing pipeline described in Section 4.2, which involves resizing, normalization and DA (where applicable) depending on the experiment scenario.
Data preparation represents a fundamental step in the DL pipeline, as it directly improves data quality and supports more accurate and dependable model predictions [76]. The main purpose of this stage is to address issues such as noise removal, control of lighting variations, adjustment of image resolution, and elimination of unnecessary background information. Preprocessing refines the image data before it is provided to the neural network, ensuring that the models work with well-conditioned inputs, which enhances both performance and robustness [54]. In this study, resizing and normalization were consistently applied in all scenarios to maintain uniform input. DA was applied only in Scenario 2, where six augmentation techniques were used simultaneously, and in Scenario 3, where the contribution of each individual augmentation technique was examined separately.
• Image resizing
The first stage of preprocessing consists of changing the size of the images in the dataset. Images are resized to achieve uniform dimensions of
where
• Image normalization
After the resizing step, images are subjected to normalization to maintain consistency among all inputs. This step scales pixel values to a standard range, usually between
where
All the experiments were performed by utilizing the PyTorch library version 2.7.1 with CUDA 12.6 enabled. The experiments were performed on a machine that had an NVIDIA GeForce RTX 4060 Laptop Graphics Processing Unit (GPU) with 8 GB of memory installed. For better performance and efficiency, cuDNN Benchmark mode, TF32 Precision, and Mixed Precision Training were enabled. These three features combined allowed for the efficient execution of computationally intensive DL models based on CNNs. For better comparison of the models’ performance, the baseline pre-trained models (VGG16, DenseNet121, and MobileNetV2) were fine-tuned with the same set of hyperparameters. The images used for the models’ input were of size
For the performance analysis of the models developed for the prediction of DR, a set of performance metrics was used to assess the models’ performance comprehensively and objectively. The performance metrics used to assess the models’ performance include accuracy, which represented the percentage of instances classified correctly by the models. The models’ ability to detect cases of DR was represented by the sensitivity of the models (Recall metric). The specificity metric represented the ability of the models to detect non-DR cases correctly. The performance of the models was represented by Cohen’s Kappa metric, which represented the reliability of the models’ performance. The discriminative ability of the models was represented by the AUC metric. Additionally, the confusion matrix provided an in-depth analysis of the performance of the models by analyzing true and false classifications performed by the models for instances belonging to different classes.
In the interest of explaining the measures applied, the following notations are used: True Positive (TP) denotes the number of cases correctly predicted as positive, whereas True Negative (TN) represents the number of cases correctly predicted as negative. False Positive (FP) refers to negative cases incorrectly classified as positive, while False Negative (FN) indicates positive cases incorrectly classified as negative. Those four measures are the foundation for the calculation of the accuracy, sensitivity, the specificity, Cohen’s Kappa as well as the AUC computation, as well as for the plot of the confusion matrix. These scales are calculated using Eqs. (14)–(18), as follows:
In this section, the results of the study are reported in two phases. The first phase focuses on three baseline scenarios that were used to test the performance of the pre-trained CNN models. The second phase uses the WSO algorithm to select the best DA combination and compares the outcomes with the baselines.
4.5.1 Baseline Evaluation of Pre-Trained CNN Models under Different Augmentation Settings
In this phase, the pre-trained CNN models are first evaluated to form a baseline reference before applying any optimization. Three experimental scenarios were designed to assess how the absence or inclusion of DA influences the generalization ability of the models. Tables 7–10 and Figs. 5–7 summarize the outcomes of the baseline CNN models examined under three scenarios: without augmentation, with six combined augmentations, and with each augmentation applied individually. These comparisons provide a clear view of how different augmentation strategies influence the ability of VGG16, DenseNet121, and MobileNetV2 to recognize various stages of DR in the APTOS-2019 dataset.
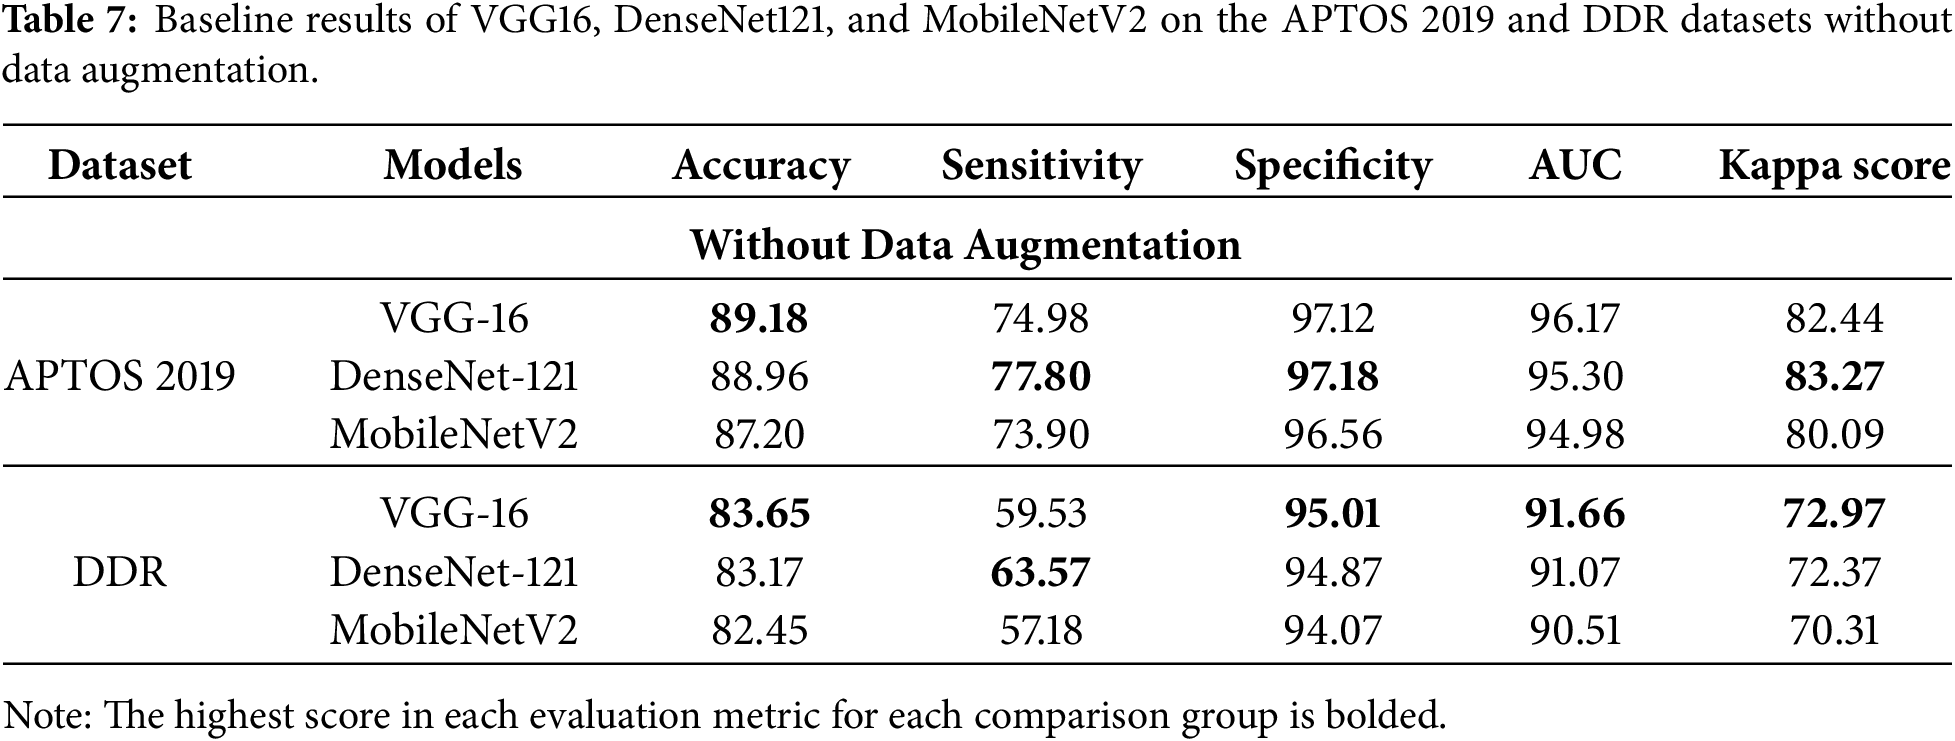
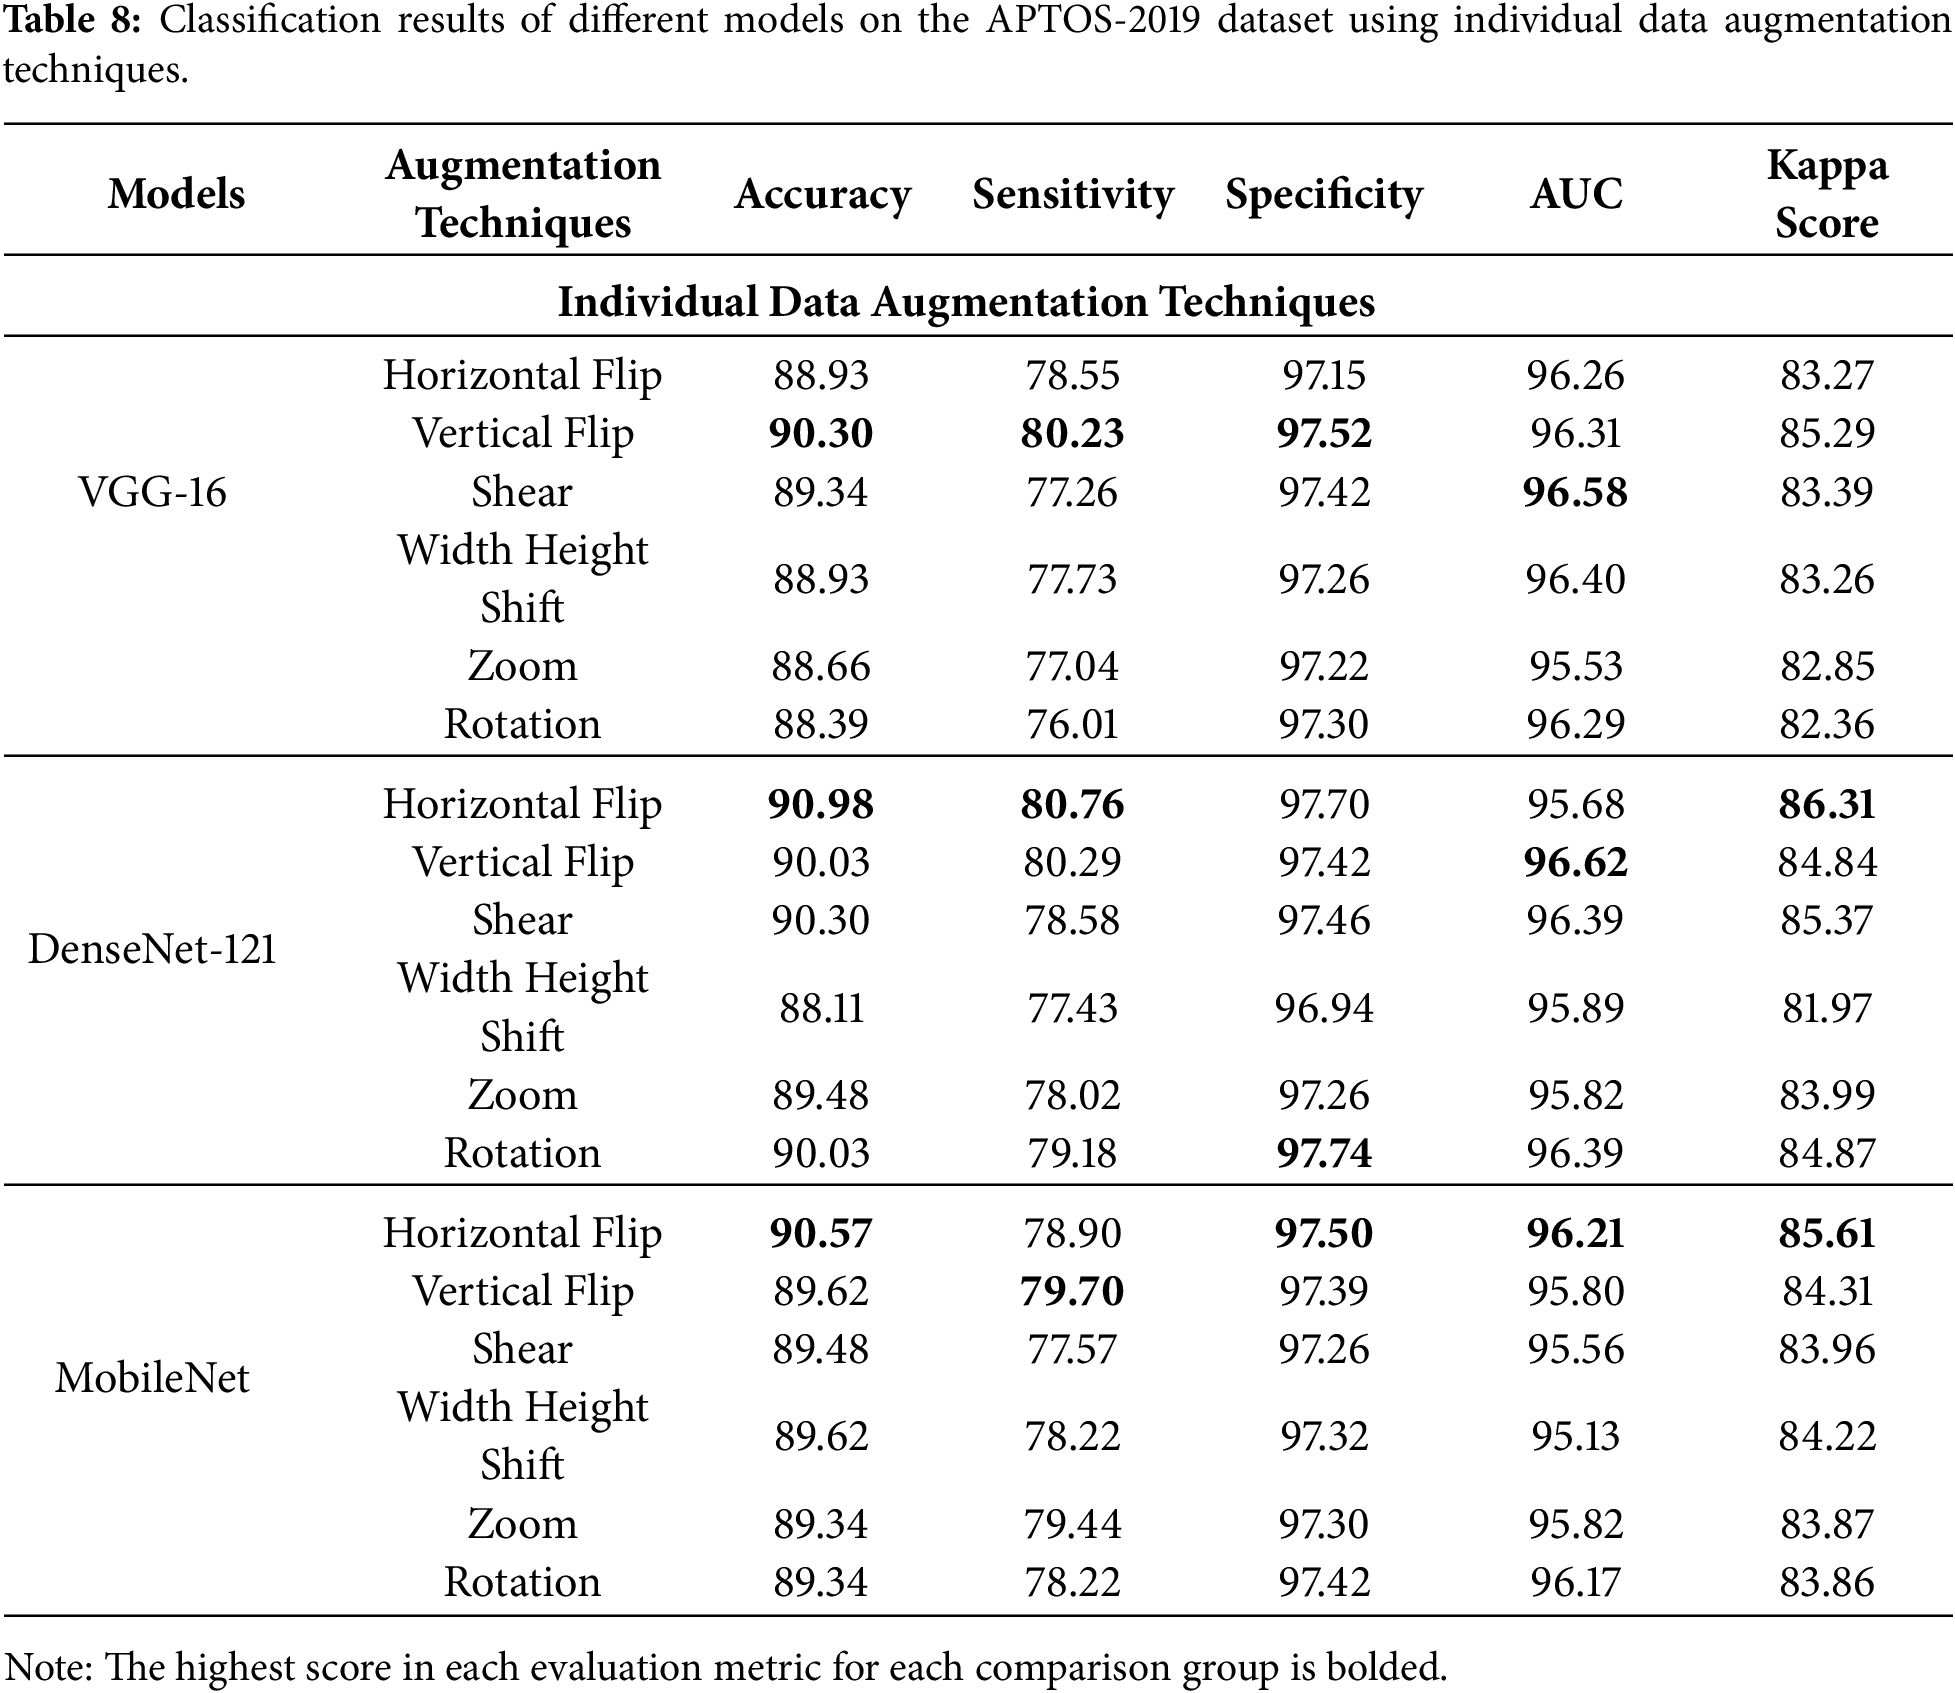
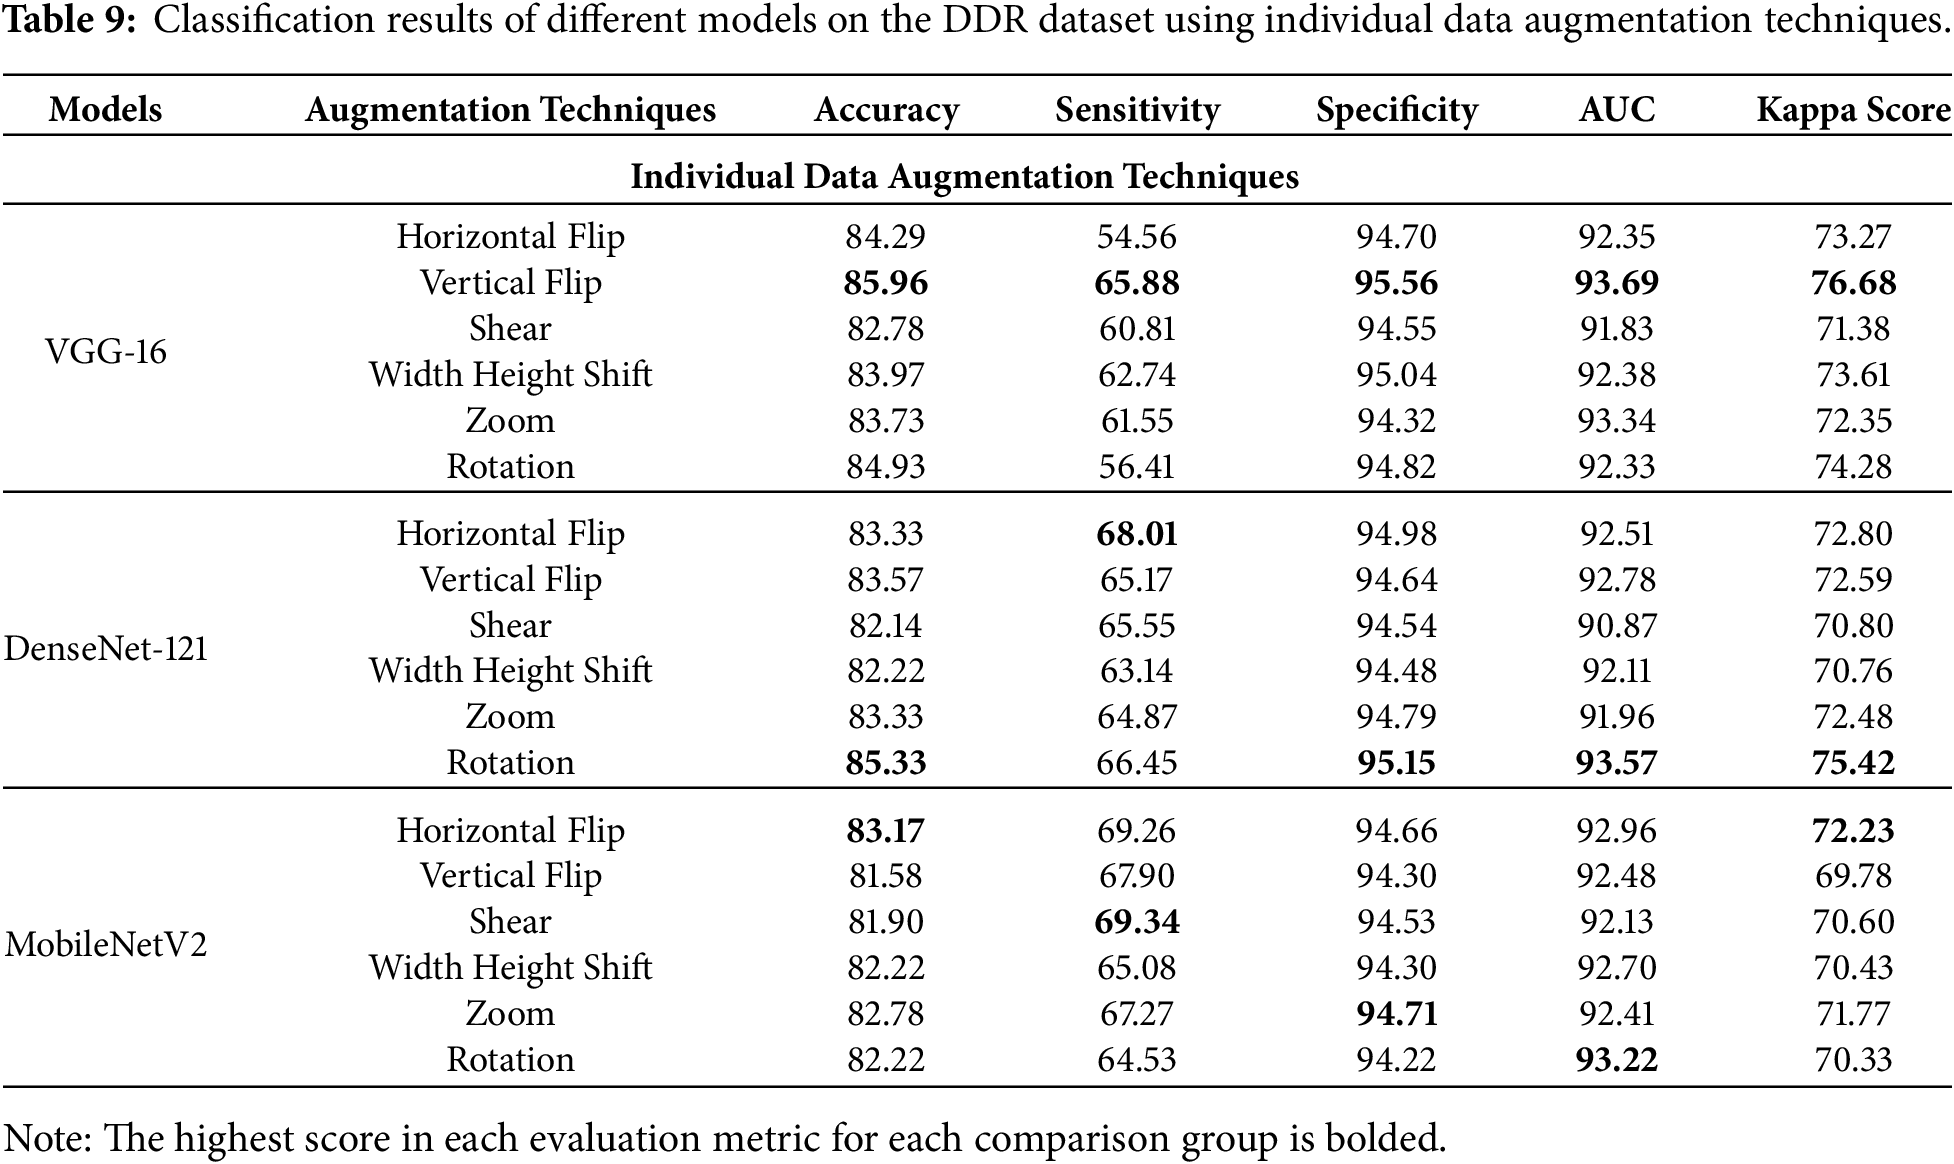
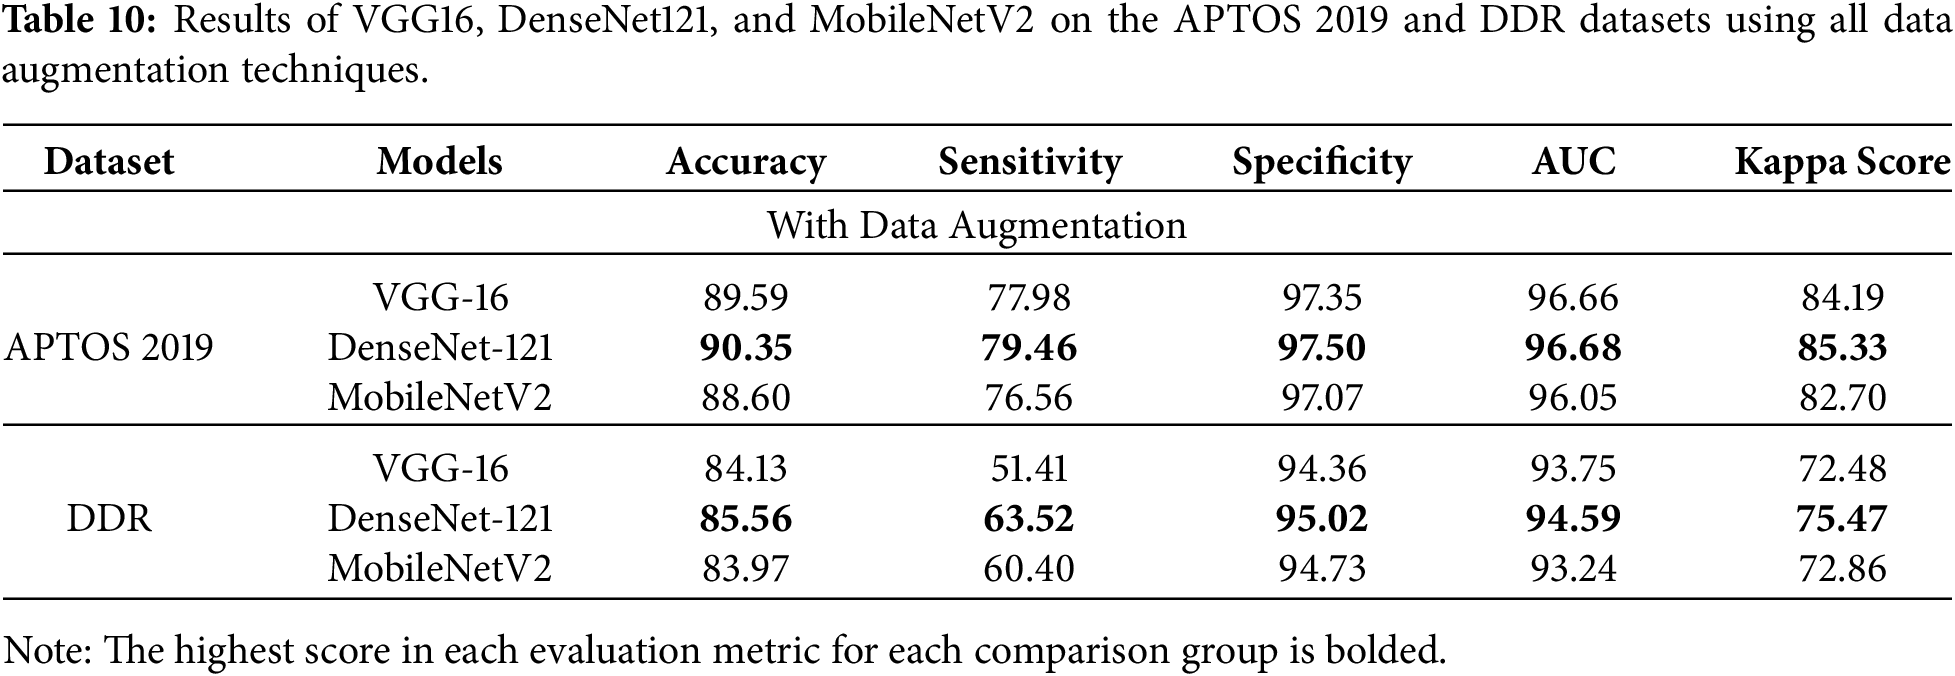
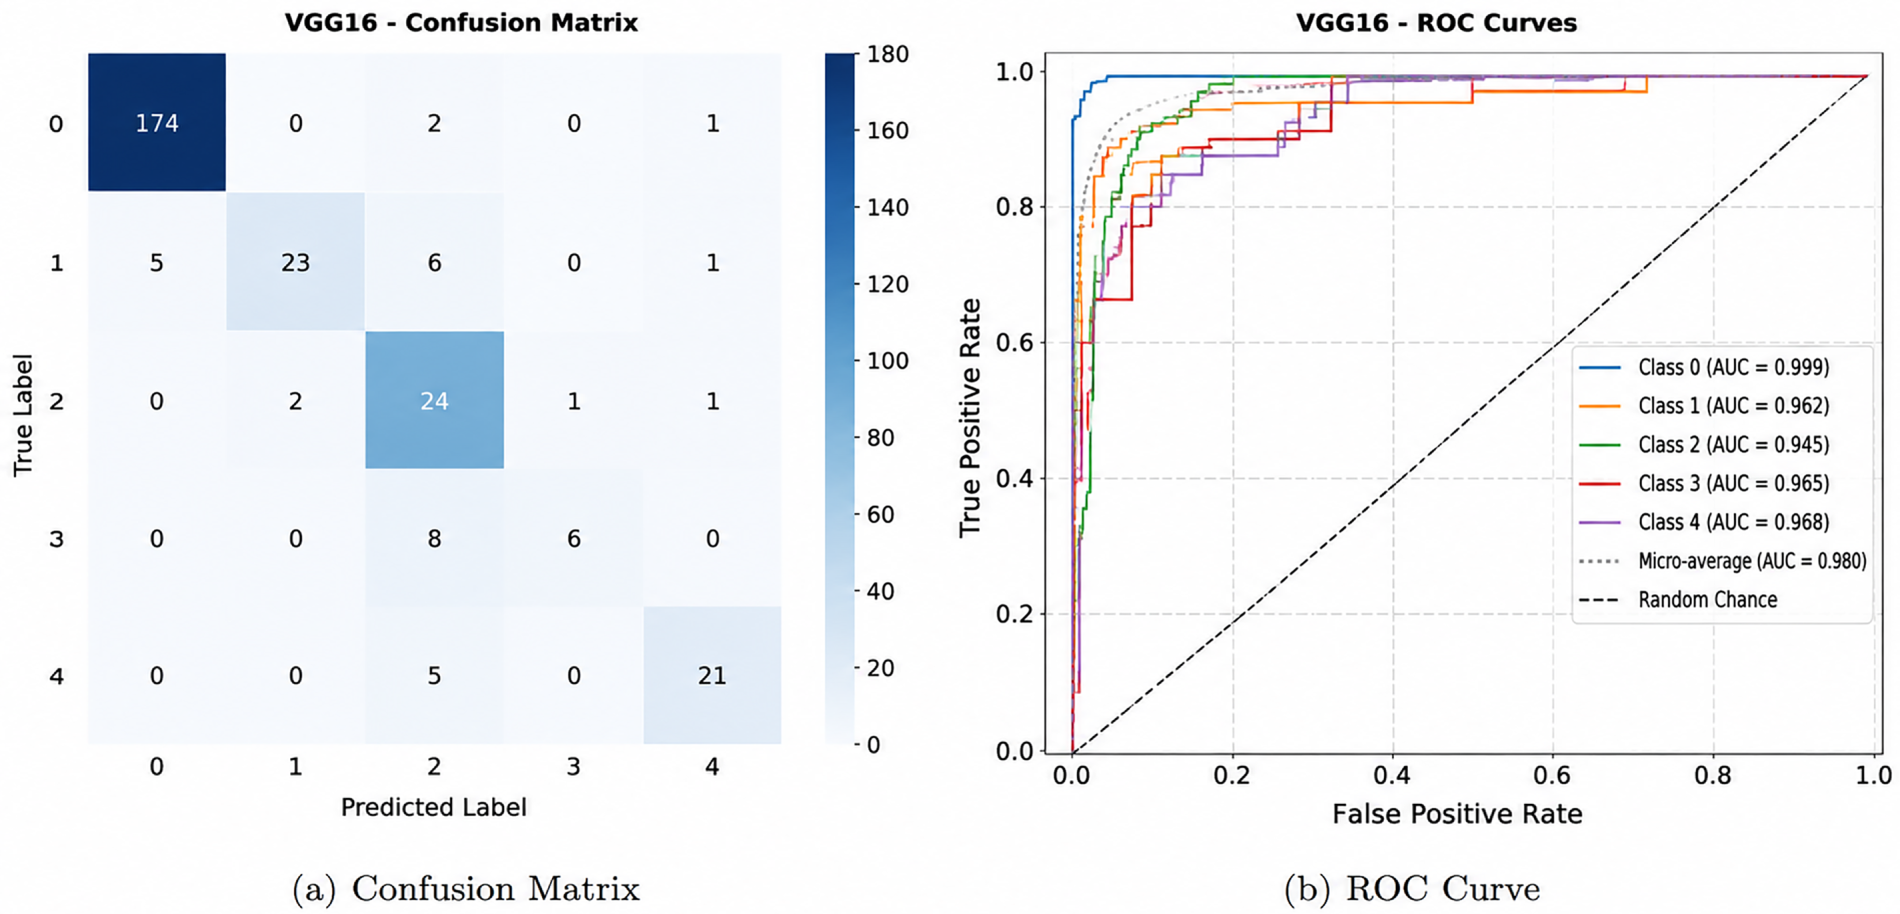
Figure 5: VGG-16 model: (a) confusion matrix; (b) ROC curve on the testing set.
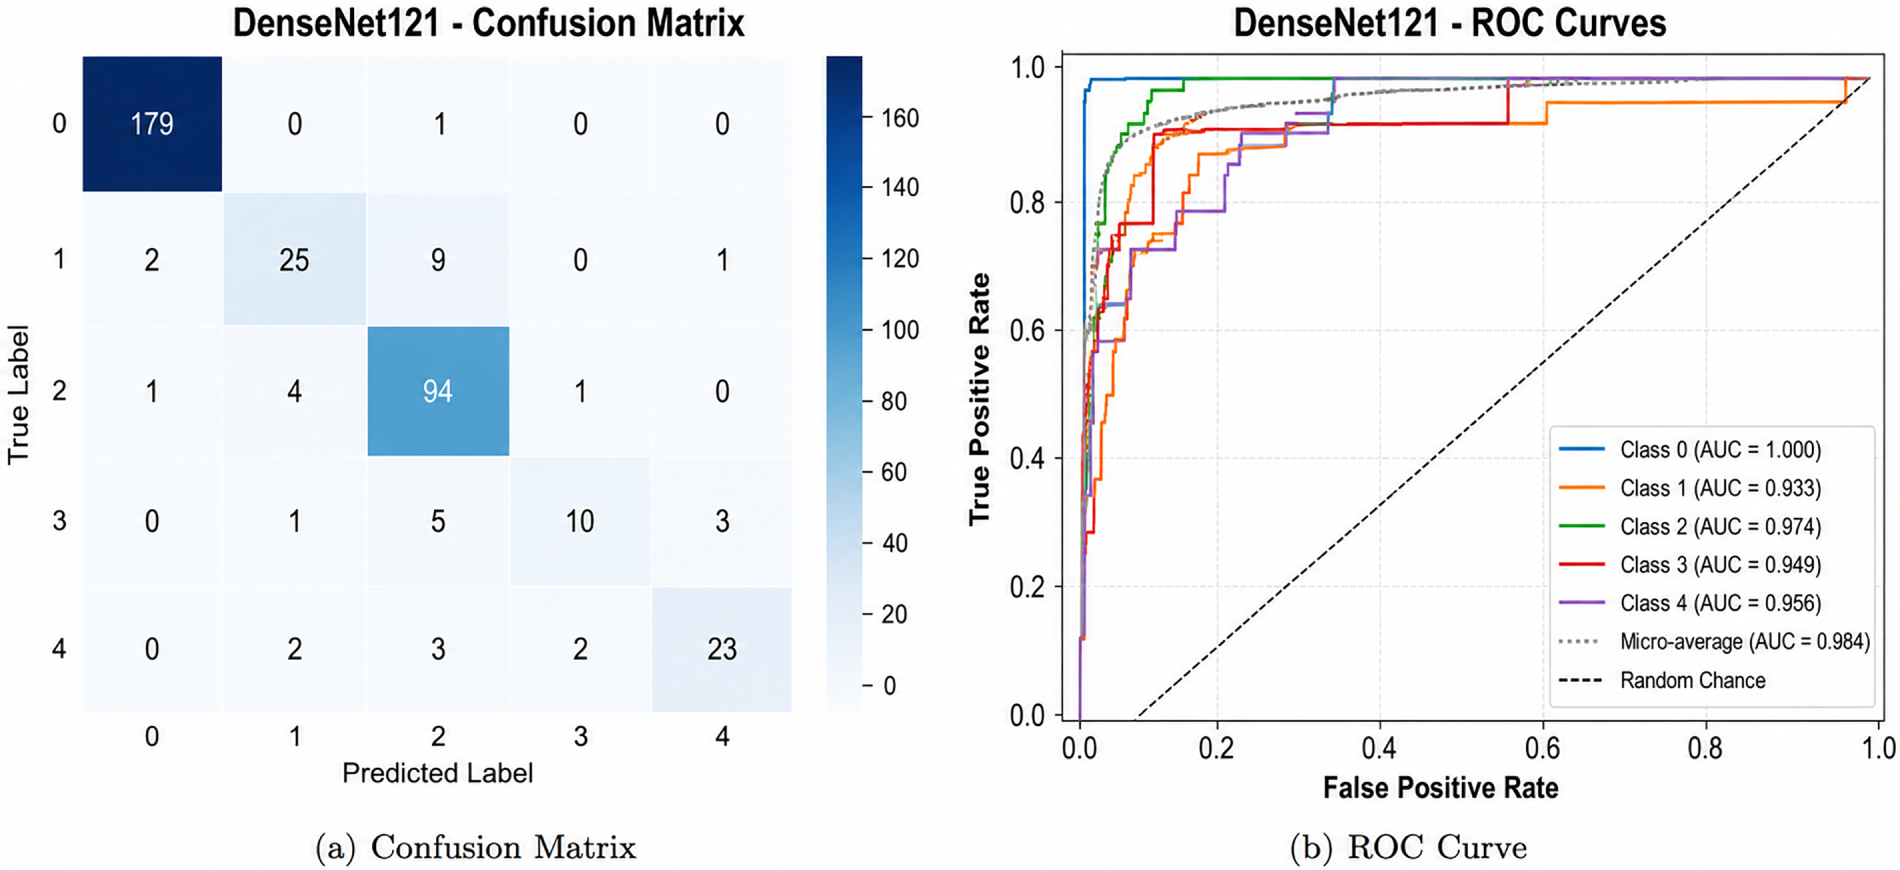
Figure 6: DenseNet-121 model: (a) confusion matrix; (b) ROC curve on the testing set.
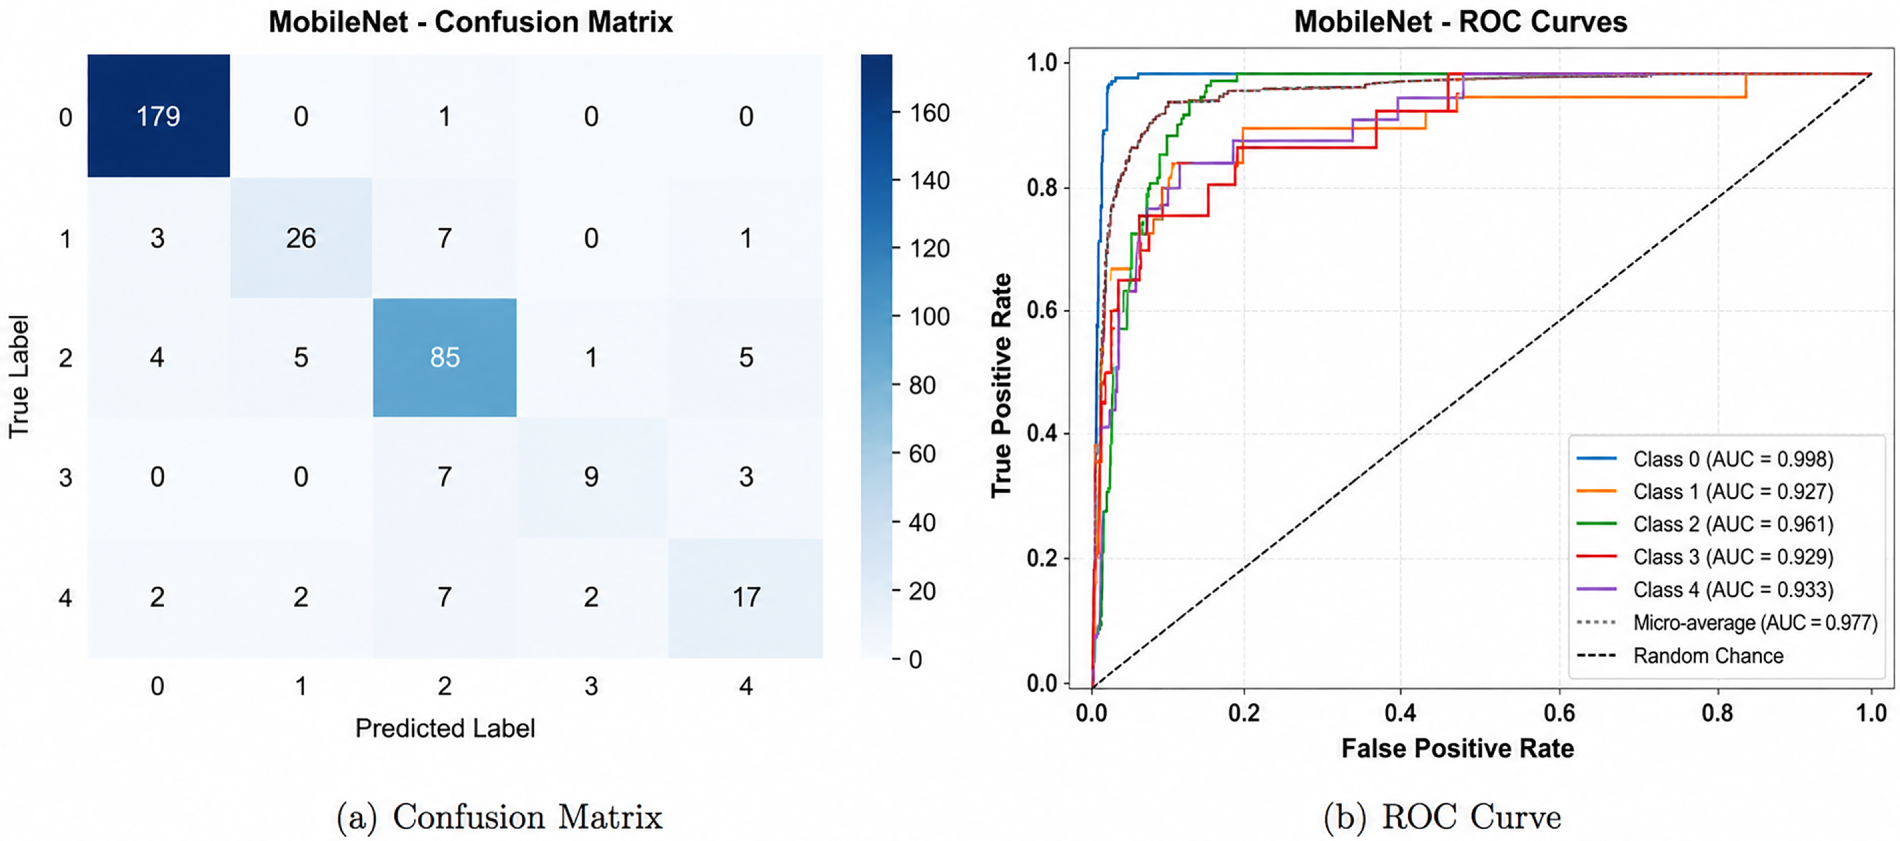
Figure 7: MobileNetV2 model: (a) confusion matrix; (b) ROC curve on the testing set.
As indicated in Table 7 in the absence of any augmentation technique, the highest accuracy (89.18%) and specificity (97.12%) were obtained by the VGG16 model, indicating its high capability for differentiation between normal (non-DR) cases. However, its sensitivity (74.98%) was relatively lower, indicating that some diabetic cases were not detected by the model. This can be explained by the observation that most misclassification cases were between mild and moderate DR cases, as indicated by the confusion matrix in Fig. 5, This may be due to the similarity between the patterns obtained from these classes, as the areas corresponding to the classes may overlap. On the other hand, DenseNet121 showed more stable performance, as indicated in Table 7, by showing the highest sensitivity (77.80%) and the highest Kappa score (83.27%). This indicates that DenseNet121 can better identify positive cases compared to the other models. MobileNetV2 showed relatively lower performance, as indicated by its accuracy (87.20%) and Kappa score (80.09%). In the same way, VGG16 had the highest accuracy (83.65%), specificity (95.01%), AUC (91.66%) and Kappa score (72.97%) on the DDR dataset, which shows that it has a good overall classification ability. DenseNet121 had the highest sensitivity (63.57%), indicating its ability to detect DR cases better, whereas MobileNetV2 performed competitively in all the evaluation metrics. The results show that the performance trends observed in the baseline data set APTOS 2019 are generally preserved in the DDR data set, further supporting the generalizability of the framework to various retinal image data sets.
As can be seen from the results of the APTOS-2019 presented in Table 8, a careful observation of the results shows that each model was differently affected by the different augmentation techniques. For the VGG16 model, vertical flipping showed the highest accuracy (90.30%) and Kappa score (85.29%), while the highest AUC (96.58%) was obtained by the shear transformation technique. This indicates that the model was more adaptable due to the use of geometric transformations. For DenseNet121, the highest accuracy (90.98%) and Kappa score (86.31%) were obtained by the horizontal flipping technique, indicating that the model can identify mirrored vessel patterns. For MobileNetV2, horizontal flipping showed the highest accuracy (90.57%) and Kappa score (85.61%), indicating that the model can better handle some geometric transformations due to its shallow depth. The results on the DDR dataset demonstrate the dependency of the effect of the individual augmentation techniques on the backbone and the applied transformation. Some of the techniques helped to enhance the baseline performance, but some configurations performed worse than the baseline in terms of accuracy or sensitivity. VGG16 with Vertical Flip augmentation performed best overall with an accuracy of 85.96%, specificity of 95.56%, an AUC of 93.69% and a Kappa of 76.68%. DenseNet121 with the Horizontal Flip, on the other hand, obtained the highest sensitivity (68.01%) indicating that it has the best performance in the detection of DR cases.
Table 10 indicates that the use of six techniques improved the performance of all models. The highest final performance was obtained with DenseNet121 with an accuracy of 90.35% and a Cohen’s kappa score of 85.33%. But the biggest absolute improvement was for MobileNetV2, which improved by 1.40 percentage points in accuracy and 2.61 points in Cohen’s kappa. VGG16 also had improved performance, with sensitivity increasing by almost 3%. This improves the model’s ability to identify DR cases without compromising specificity. The effects of the six augmentation techniques applied to the DDR dataset were found to be different for various models and metrics. For VGG16, accuracy increased from 83.65% to 84.13% and AUC increased from 91.66% to 93.75%. However, sensitivity decreased from 59.53% to 51.41%, specificity decreased from 95.01% to 94.36%, and Cohen’s kappa decreased from 72.97% to 72.48%. So, the overall augmentation setting was not able to enhance all the evaluation metrics for all the models. DenseNet121 had the highest overall accuracy of 85.56% and Kappa score of 75.47% on this dataset, which indicates its better generalization capability.
4.6 Results of AMDA-WSO Optimization for Data Augmentation Selection
The second phase evaluates the performance of the proposed AMDA-WSO framework in autonomously selecting the best combinations of DA techniques for DR image classification. This phase extends the performance of the baseline model with the integration of the metaheuristic algorithm, aiming to achieve better generalization performance compared to the conventional manually defined approaches.
The performance of WSO, BA and PSO is compared in Table 11 for the VGG16, DenseNet121 and MobileNetV2 backbones. The accuracy and other reported metrics were the same for the three metaheuristic algorithms for each backbone. Regardless of the optimizer used, VGG16 had an accuracy of 90.71%, DenseNet121 had an accuracy of 91.15%, and the highest backbone-level accuracy was 92.08% for MobileNetV2. Thus, the findings suggest that there is no significant difference between the final predictive performance of WSO, BA, and PSO, but rather a similar performance of all the optimizers. The performance of the BA algorithm resulted in the achievement of the same accuracy as the WSO algorithm, with the area under the receiver operating characteristic (AUROC) value of 97.07% ± 0.00. However, the performance of the BA algorithm is slightly less stable compared to the performance of the WSO algorithm. In the case of the DenseNet121 model, the performance of the WSO algorithm resulted in the achievement of the highest accuracy of 91.15% ± 0.0013, with the highest Kappa value of 86.52% ± 0.0020. This indicates that the model is capable of achieving the highest Kappa value, thereby achieving the highest representative features. In the case of the MobileNetV2 model, the performance of the WSO algorithm resulted in the achievement of the highest accuracy of 92.08% ± 0.00, with the highest sensitivity of 81.48% ± 0.00, the highest specificity of 97.95% ± 0.00, and the highest Kappa value of 87.94% ± 0.00.
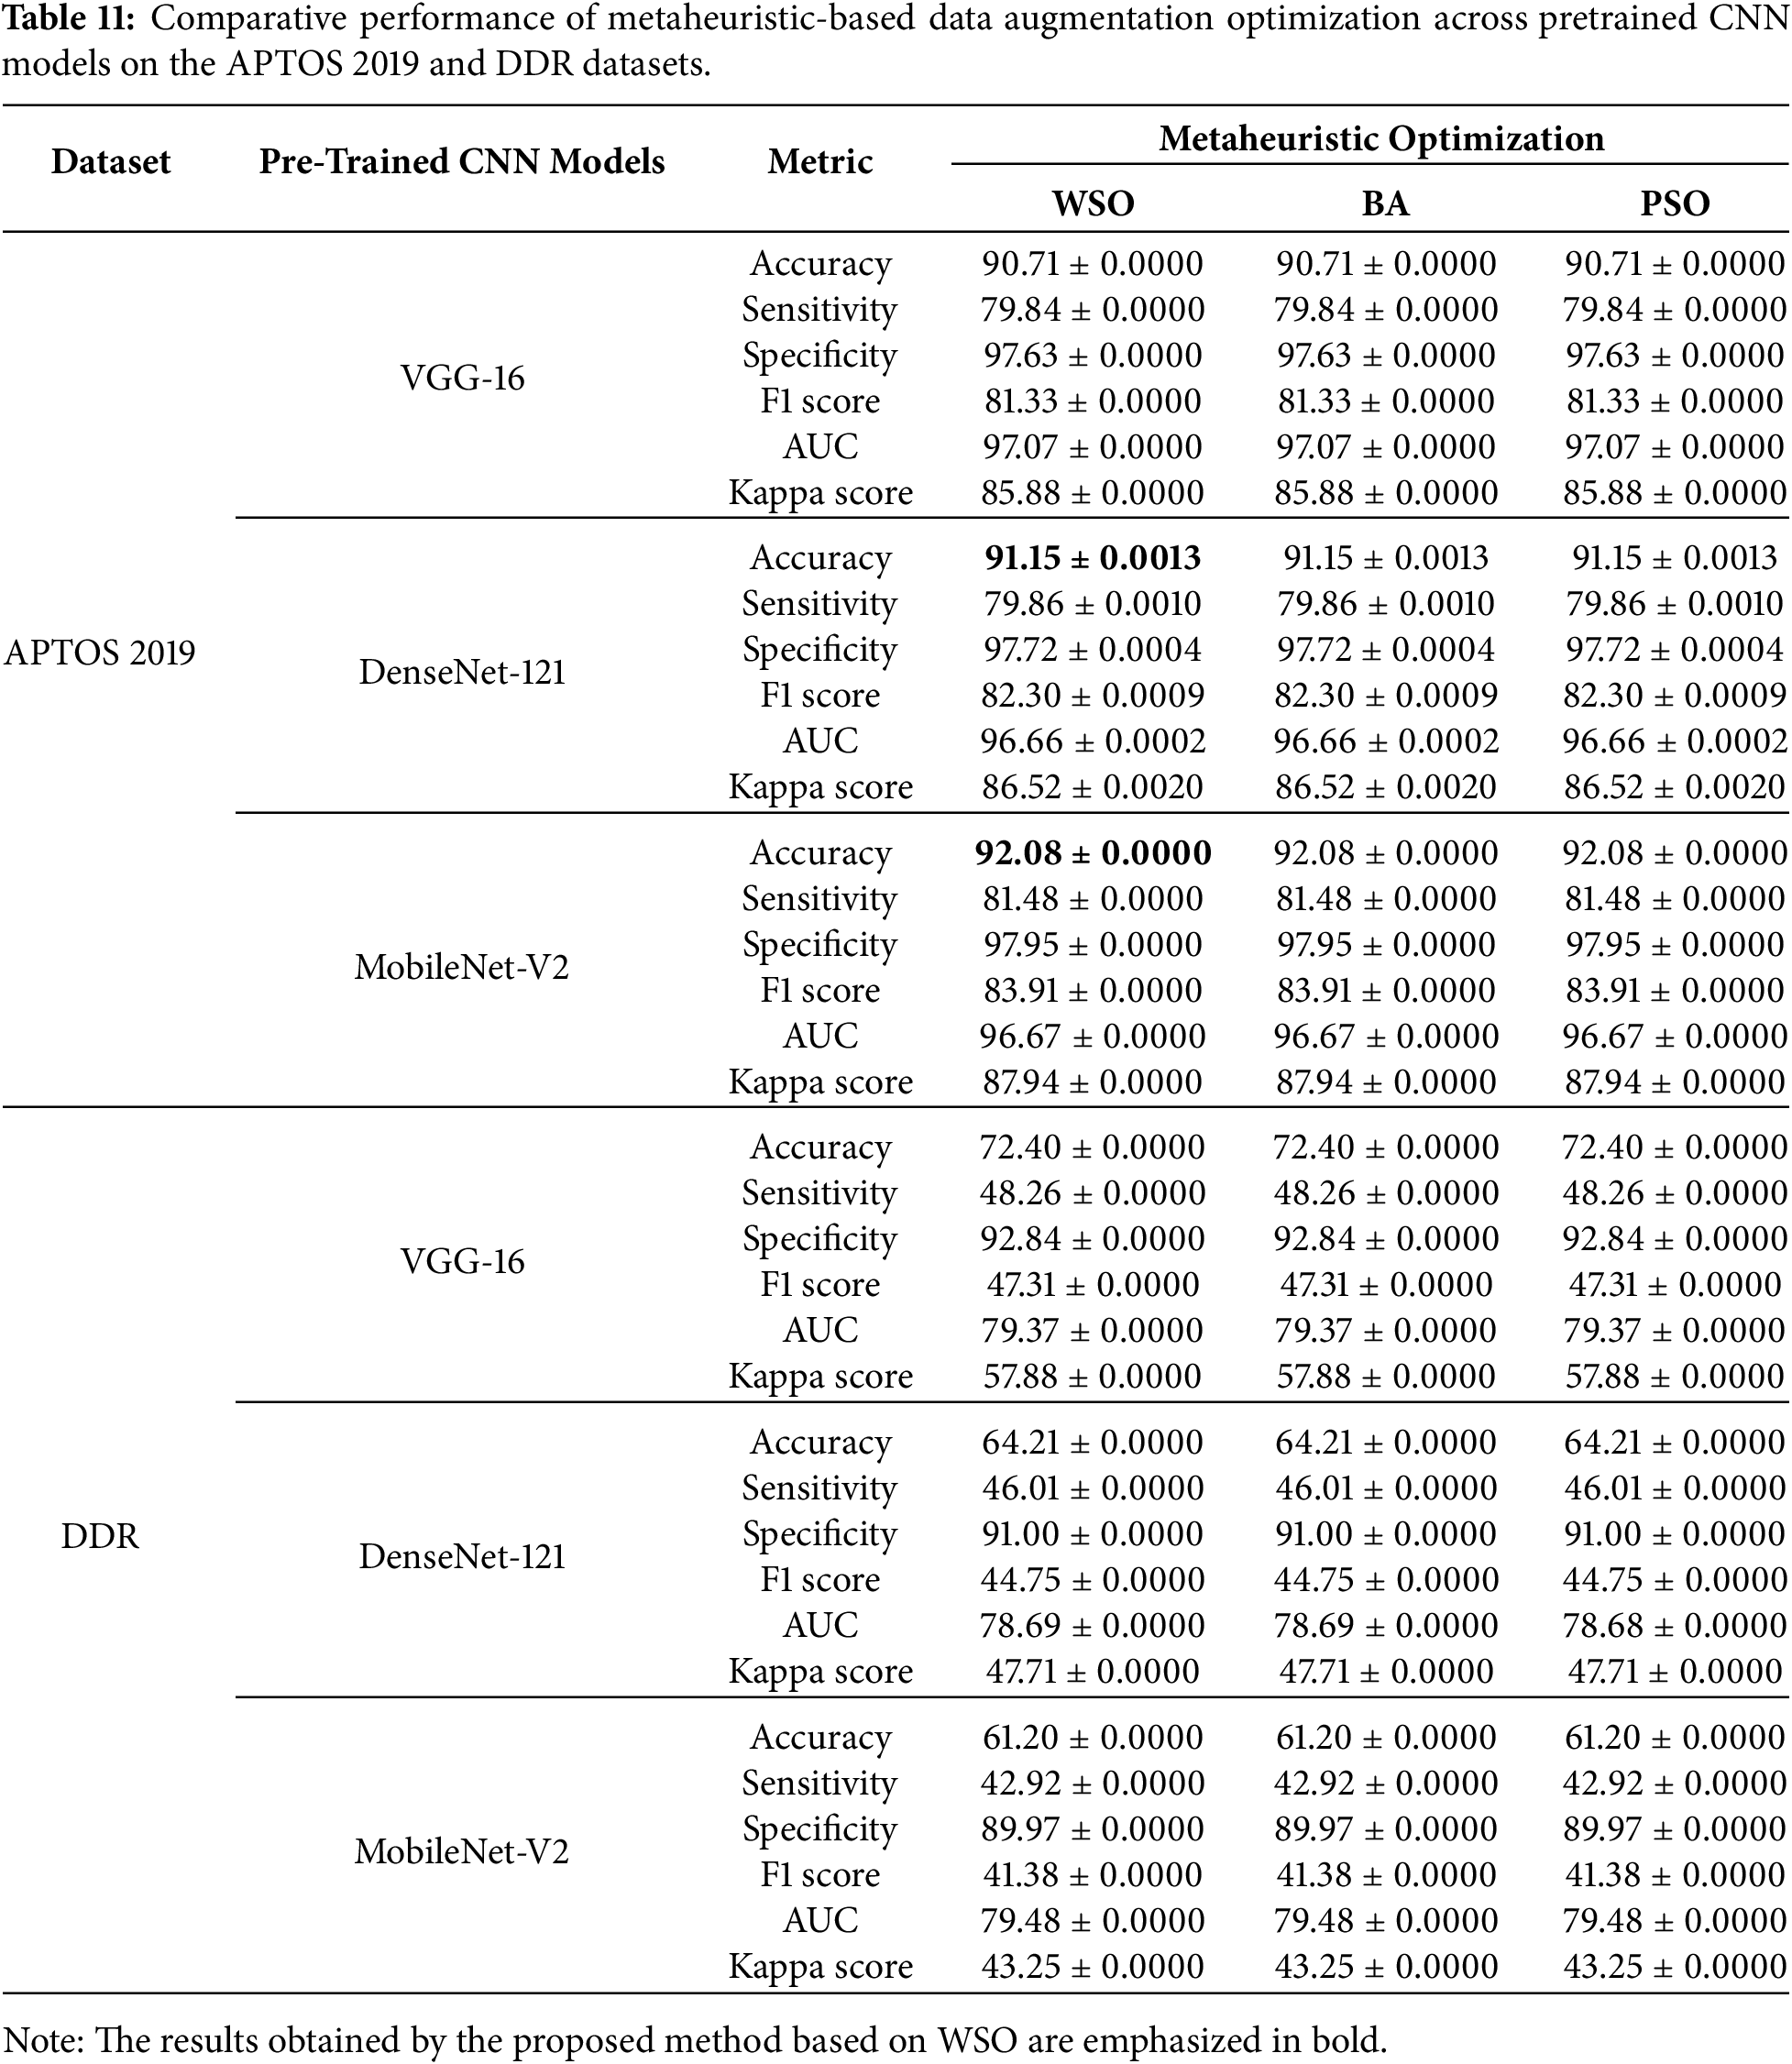
Ten independent runs were performed for each optimizer, with different random seeds. In both cases, the stochastic search trajectories were different, but the deterministic fitness evaluation over the small binary search space of
The proposed framework was further evaluated on the publicly available DDR dataset. The performance was worse than the results from APTOS 2019, as the dataset is more complex and varies more, but the proposed framework remained consistent in its ability to optimise the results across the tested models. The best accuracy (72.40%) and kappa score (57.88%) were achieved by VGG-16, and the highest AUC (79.48%) was obtained by MobileNet-V2. Furthermore, the results obtained over two independent public retinal image sets offer further proof of the robustness and generalization ability of the proposed AMDA-WSO framework.
The optimization phase is deterministic, as the prediction-probability vectors are pre-computed and then used for optimization. With a small search space of 26 = 64 possible augmentation subsets, the three optimizers reached the same subset or equivalent subsets in terms of the final predictions and evaluation metrics. This is because the same outcome was achieved by WSO, BA and PSO.
The optimization algorithms showed different behaviors when it comes to determining the optimal augmentation subsets for the evaluated CNN architectures. As shown in Table 12, the selected augmentation combinations were different for each CNN architecture, meaning that there is no single augmentation strategy is universally optimal. Instead, the proposed AMDA-WSO framework identifies the optimal augmentation combination to enhance the robustness of each CNN architecture to realistic variations commonly observed in retinal image acquisition, including image orientation, scale, and positioning. Clinically, this adaptive selection improves robustness to realistic image acquisition variability without sacrificing clinically relevant retinal image characteristics required for DR grading, while avoiding redundant augmentation transformations that do not improve validation performance.
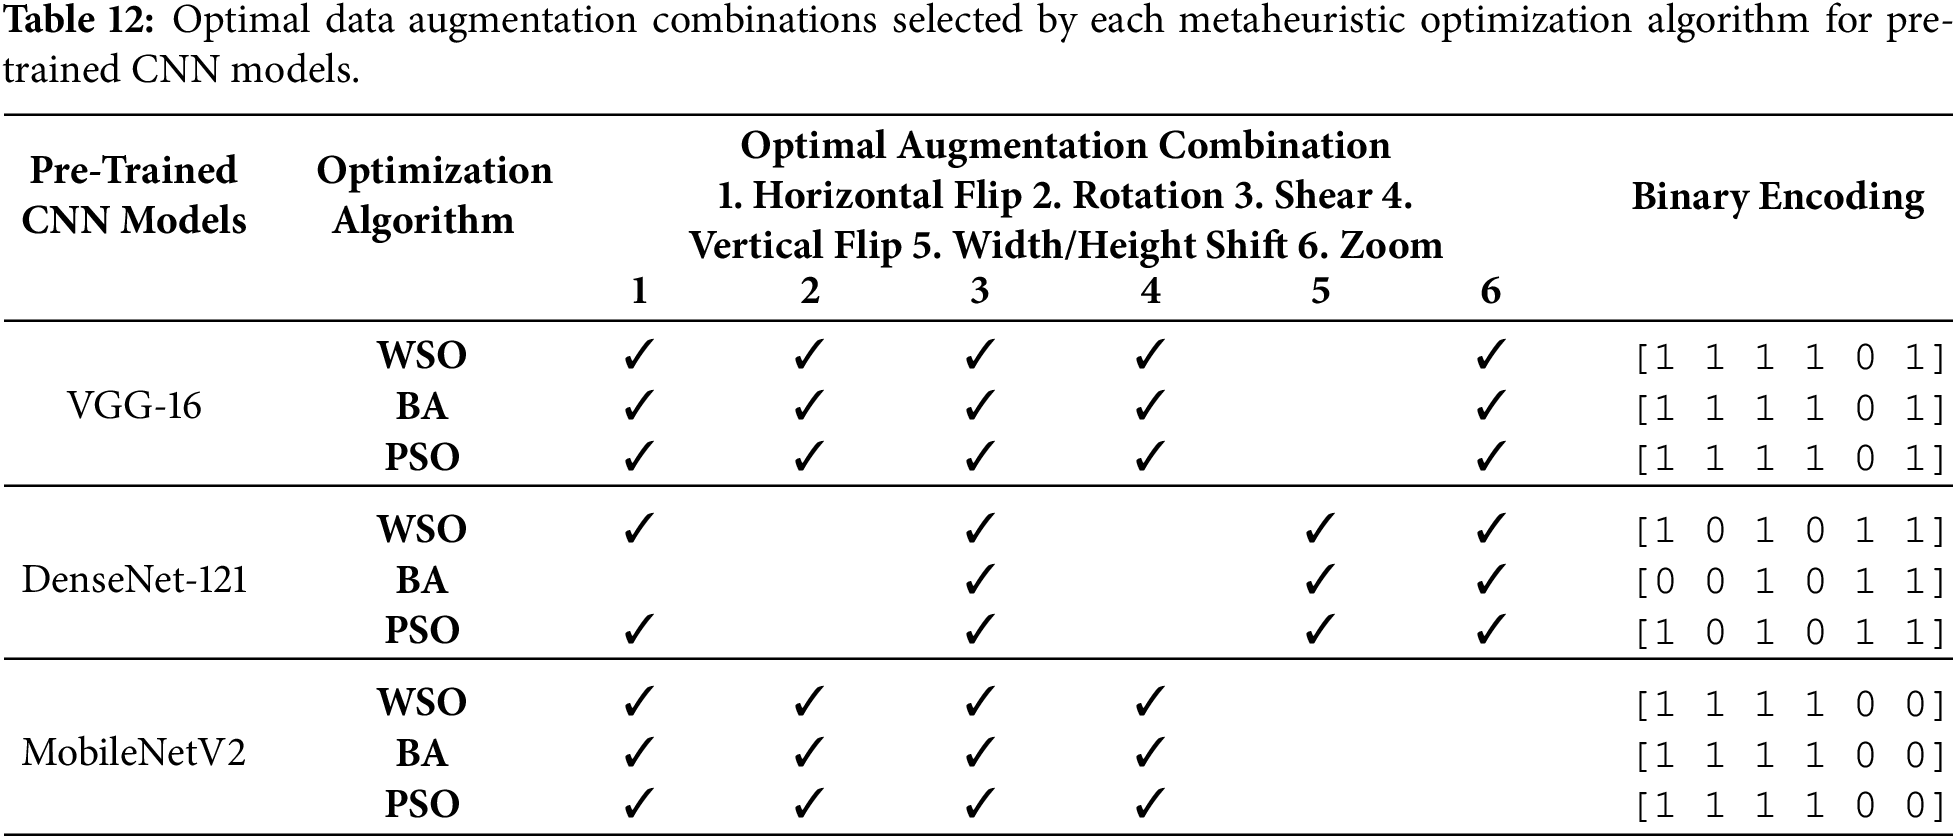
For DenseNet121 and MobileNetV2, the WSO chose fewer transformations but still maintained strong results, suggesting that it effectively judged when additional augmentations were unnecessary. This finding aligns with earlier observations of its consistent accuracy without overfitting. Moreover, MobileNetV2, being smaller and computationally efficient, benefited from broader transformations, while DenseNet121 exhibited better stability with a more focused set. Overall, the findings demonstrate that WSO did not randomly combine augmentations but rather adapted its search based on model and data characteristics, selecting transformations that genuinely enhanced learning stability across different runs.
It is worth mentioning that the identical augmentation combinations observed for some models, such as VGG16, are not coincidental. All algorithms were initialized using the same model weights and prediction files (.pth and .npy), which ensured that the optimization process started from the same baseline performance and data distribution. Because of this controlled setup, each optimizer received identical validation feedback, allowing them to converge on the same optimal augmentation configuration. This outcome reflects the stability and consistency of the search process rather than a limitation of the algorithms, confirming that the selected transformation set was indeed the most effective for that model and dataset.
Fig. 8 provides a clear representation of the performance of the optimized model, VGG16, based on the application of the WSO algorithm on the APTOS 2019 test dataset, where a confusion matrix on the left indicates that the model’s discriminative power is excellent for all five stages of DR. The model correctly classified a majority of images for each of the classes, with a very high accuracy for No DR and Moderate DR classes, where all 179 and 93 images, respectively, were correctly classified. The model also correctly classified a majority of images for all classes, including No DR, Minor DR, Moderate DR, Severe DR, and Proliferative DR, where a small number of misclassifications occurred between adjacent classes, such as mild and moderate DR, which is a natural overlap between classes rather than a failure on the model’s part. The ROC curve on the right also confirms the robustness of the model’s performance, where all classes show AUC values greater than 0.94, indicating excellent model performance. The No DR class had a perfect AUC of 1.000, while the Moderate DR had an AUC of 0.979, showing a very good trade-off between sensitivity and specificity. The micro-average AUC of all classes is very high, at 0.988, which indicates a very stable and reliable performance of the optimized model, VGG16, on the dataset, which confirms that the adaptive augmentation strategy is effective, enabling the model to capture patterns more accurately and make more precise distinctions between different stages of DR.
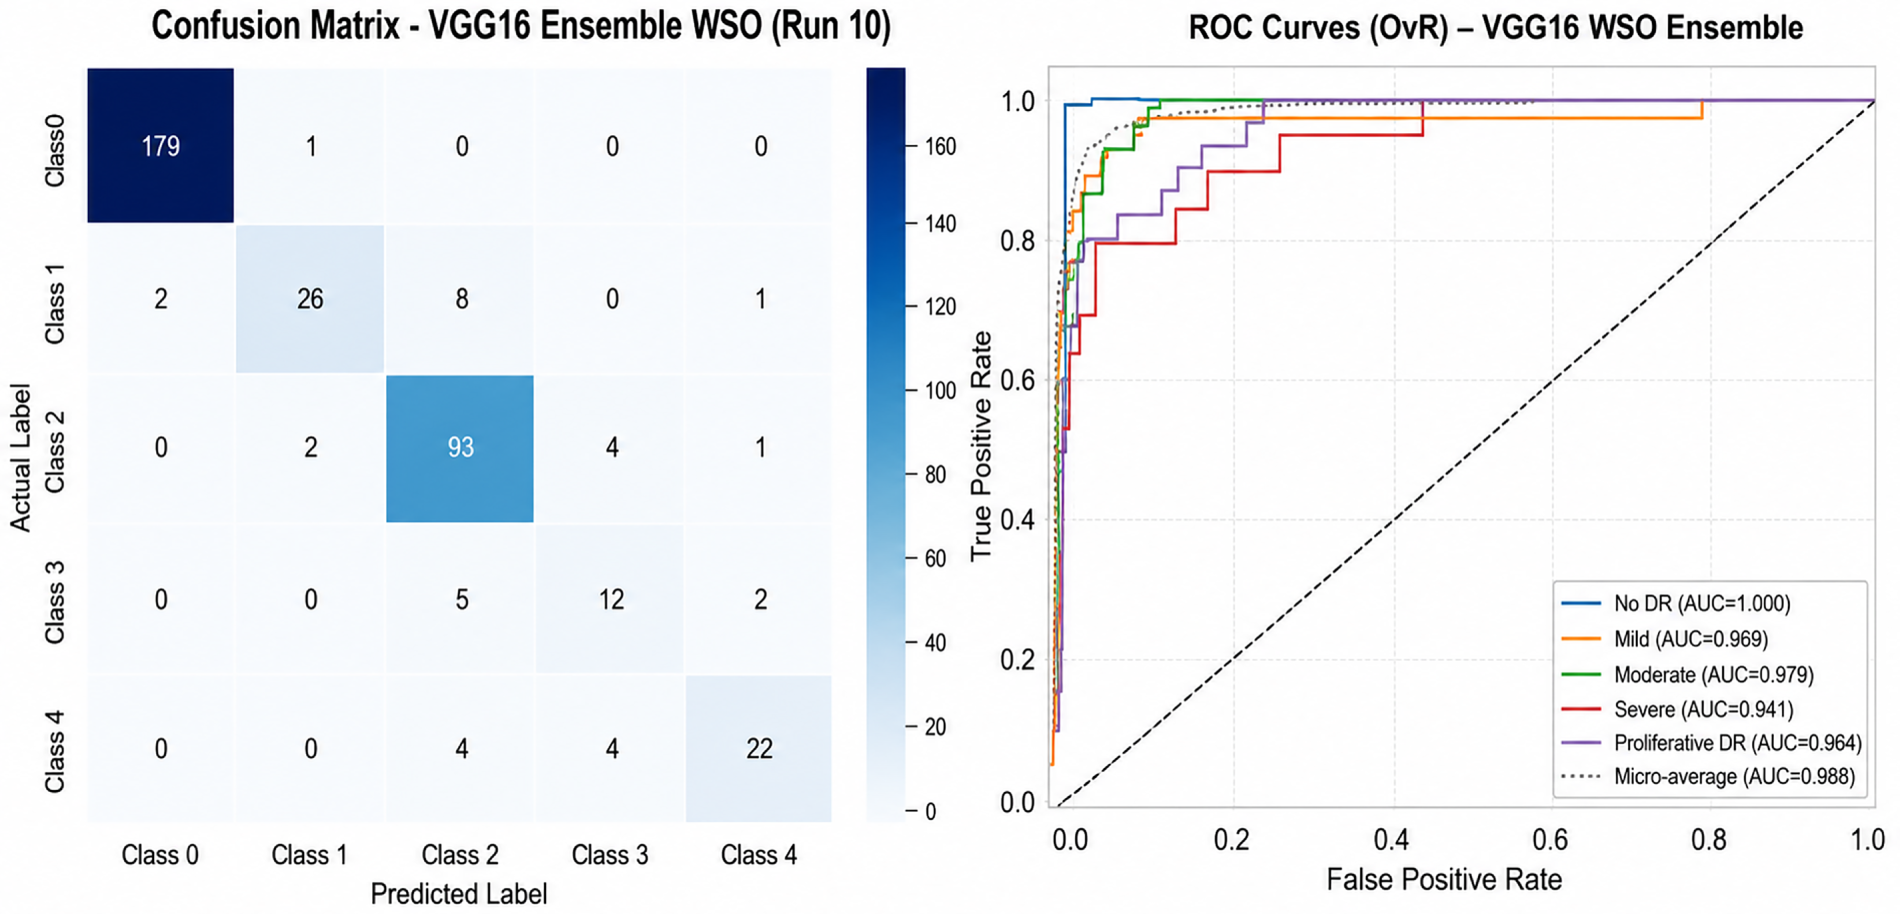
Figure 8: VGG16 + WSO ensemble performance: confusion matrix (left) and ROC curves (OvR) for each DR severity grade (right).
As can be observed from Fig. 9, the model optimized by the DenseNet121 model with the WSO ensemble algorithm has high accuracy in all five stages of DR. The model classified the data correctly, especially for the No DR category with 179 instances and Moderate DR with 94 instances. This shows that the model can differentiate between healthy eyes and those with DR. There were some misclassifications between Mild DR and Moderate DR, which can be justified given the similarity between these two classes. This is also supported by the ROC curves presented in Fig. 9, where all classes have AUC values above 0.93. The AUC value for the No DR class was found to be 1.000, while Moderate DR and Severe DR classes were found to have AUC values of 0.976 and 0.937, respectively. This shows that the model used here is very effective in the classification of the different stages of DR.
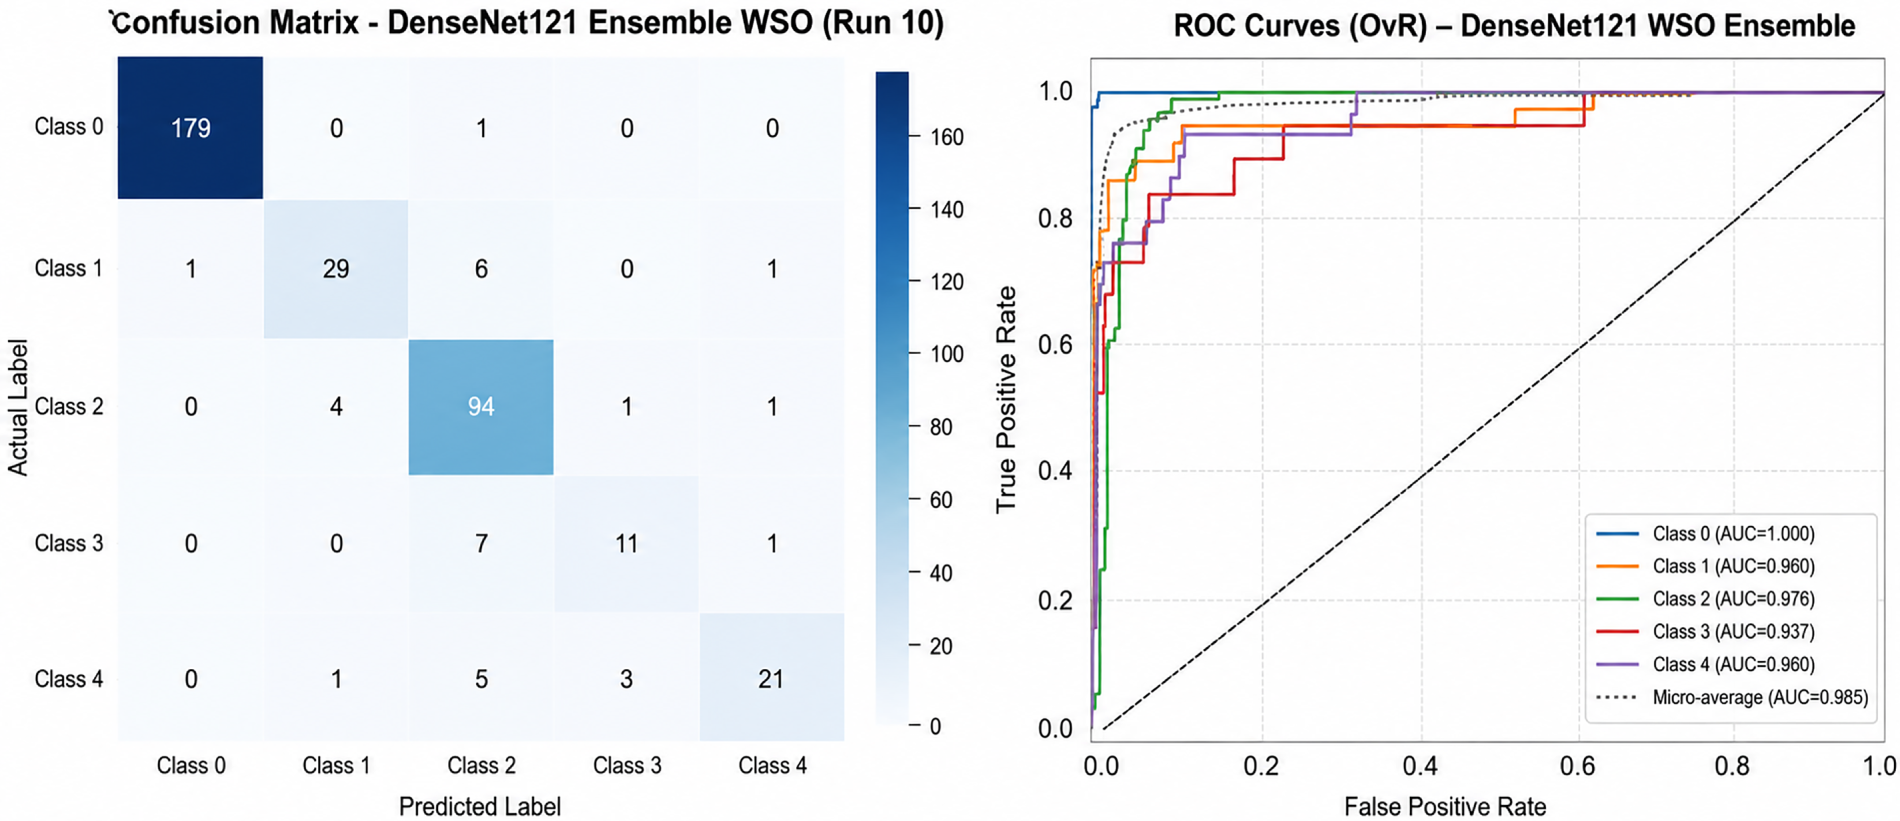
Figure 9: DenseNet121 + WSO ensemble performance: confusion matrix (left) and ROC curves (OvR) for each DR severity grade (right).
Fig. 10 shows the confusion matrix for the MobileNetV2 model with the WSO ensemble algorithm, which also shows high effectiveness in the classification of the five stages of DR. The model classified the data correctly for the No DR category with 179 instances and Moderate DR with 95 instances. This shows that the model can differentiate between healthy eyes and those with DR. There were some misclassifications between Mild DR and Moderate DR, which can be justified given the similarity between these two classes. This can also be supported by the ROC curves presented in Fig. 10, where all classes have AUC values above 0.94. The AUC value for the No DR class was found to be 1.000, while Moderate DR and Severe DR classes were found to have AUC values of 0.974 and 0.969, respectively.
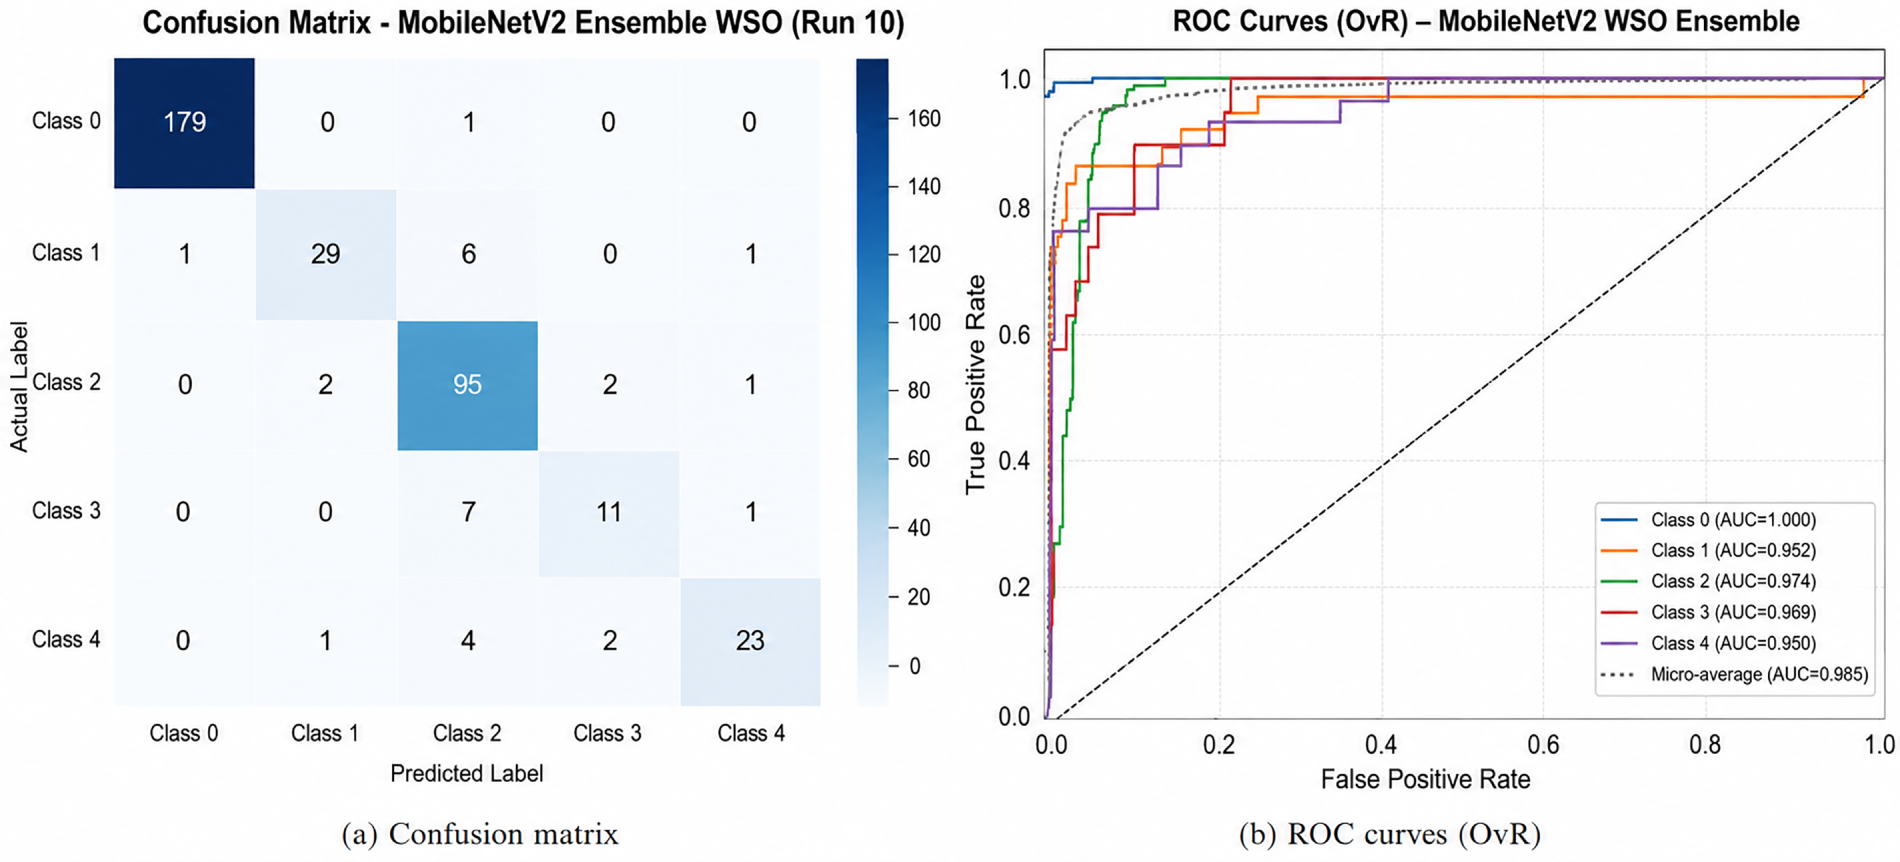
Figure 10: MobileNetV2 + WSO ensemble performance: (a) confusion matrix; (b) ROC curves for each severity grade.
The results of WSO, BA and PSO on the three CNN backbones are compared in terms of accuracy in Fig. 11. There was no difference between the three optimizers with respect to accuracy on each backbone. The backbone-level accuracy of MobileNetV2 was found to be 92.08%, which is the highest among all the models, followed by DenseNet121 with 91.15%, and VGG16 with 90.71%.
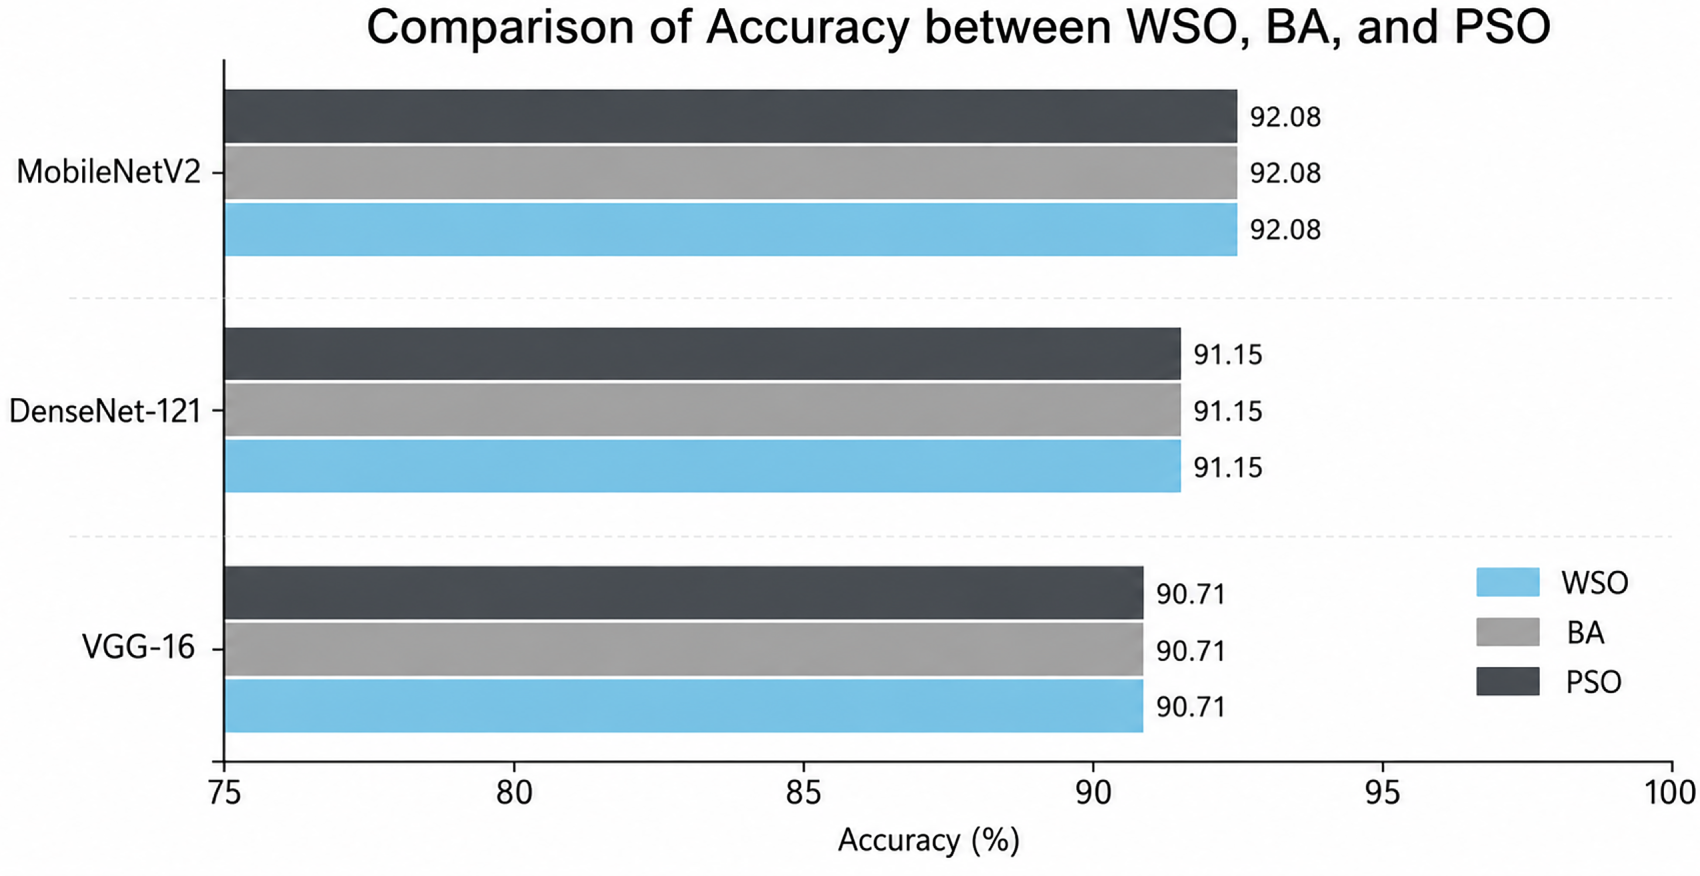
Figure 11: Comparison of model accuracy between WSO, BA, and PSO across different CNN models.
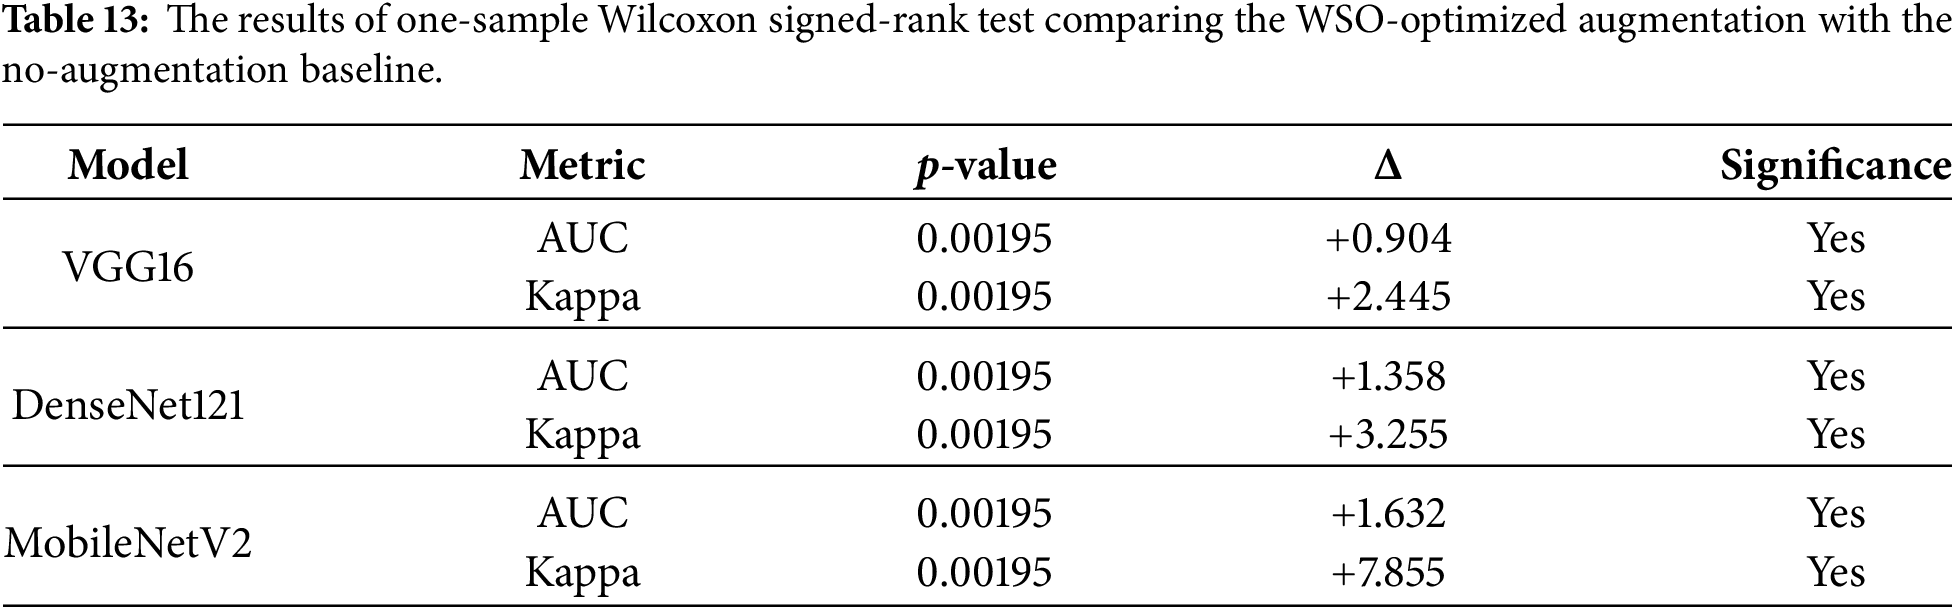
Table 13 reports the results of a one-sample Wilcoxon signed-rank test with Bonferroni correction, comparing WSO-optimized augmentation against the no-augmentation baseline across all pretrained CNN models. The adjusted significance threshold was set to
4.7 Convergence Analysis of Metaheuristic Algorithms
In this experiment, all three metaheuristic algorithms WSO, BA, and PSO achieved identical accuracy values for VGG-16, DenseNet-121, and MobileNetV2 on both the APTOS 2019 and DDR datasets, as shown in Fig. 11 and Table 11. The WSO convergence curve is presented in Fig. 12 which indicates that the global optimum was reached early as the optimum fitness value does not fluctuate during the iterations. This at first sight seems bizarre but is actually the consequence of the way the evaluation was planned. The pretrained CNN models and their validation prediction were generated one time and used repeatedly in the optimization process. That setup ensured the fitness values remained constant from iteration to iteration, eliminating the small variations in fitness that typically occur in metaheuristic searches. It is not surprising that the three algorithms converged to the same global optimum because the search space was also quite constrained (
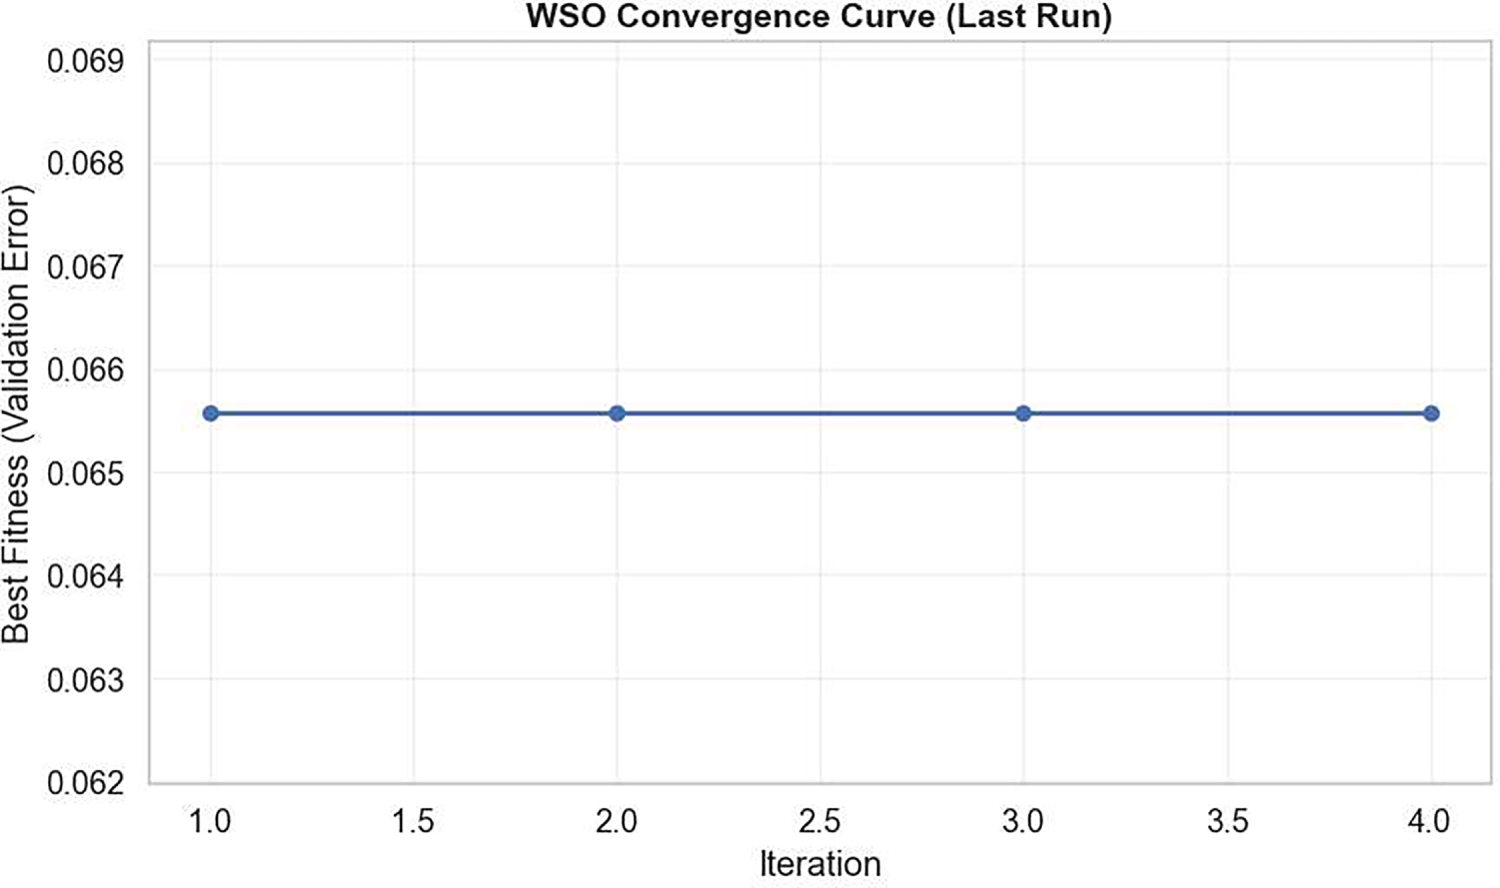
Figure 12: Convergence curve of the WSO algorithm during the optimization of augmentation combinations for MobileNetV2.
Implications: The same results indicate that within this tiny search space, the best combination of augmentations is evident and is strong. The benefit of one algorithm over another is very limited in such a low dimensional deterministic setting. Nevertheless, automation is still advantageous: It is time-saving, ensures uniformity, and eliminates the possibility of manual selection bias.
Efficiency and Scalability: Although the final results were the same, WSO reached the optimum solution more quickly, with better convergence efficiency compared to BA and PSO. For simplicity, the current six-dimensional configuration is used as a proof of concept; however, in larger and continuous search spaces—like optimizing 15–20 augmentations or hyperparameters—it is assumed that WSO will demonstrate more benefits than simple search mechanisms.
Table 14 presents a comparison between the proposed framework and previous studies that used the APTOS 2019 dataset. Previous works reported accuracies that generally ranged between 79% and 89%, depending on the model architecture and training setup. Study [41] achieved 89% using a conventional CNN. Other studies, such as [43], reported lower results between 79% and 82% when using ResNet50, VGG16, and DenseNet169. Similarly, studies [32] and [45] obtained accuracies of 85.28% and 84.6% with various deep architectures.
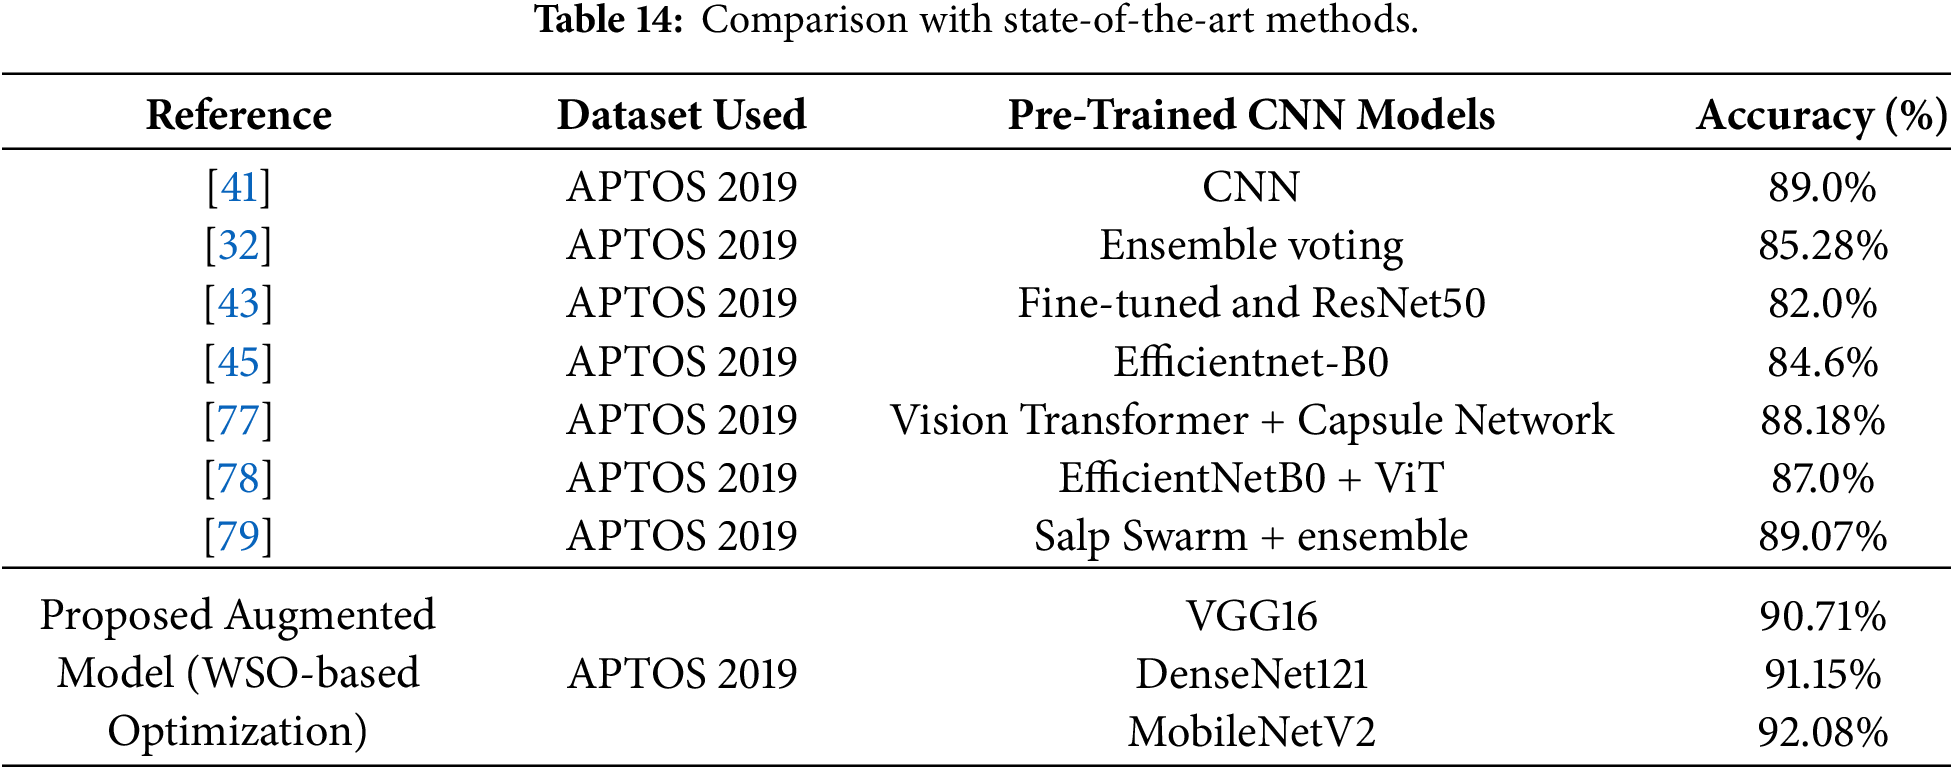
The proposed AMDA-WSO framework shows competitive performance when compared with the recent state-of-the-art (SOTA) DR models such as the hybrid Vision Transformer–Capsule Network framework, which reports accuracies in the range of 87%–88% [77], and the more recent CNN–ViT hybrid architectures that achieve around 87.0% [78].
In contrast, the proposed WSO-based optimization model achieved higher and more stable performance, reaching 90.71% for VGG16, 91.15% for DenseNet121, and 92.08% for MobileNetV2. The improvement reflects the strength of using metaheuristic optimization to adaptively select DA combinations, which helped the models capture more discriminative retinal features while maintaining generalization. These findings confirm that the proposed WSO framework offers a robust and practical advancement for DR classification compared with existing state-of-the-art methods.
Compared to the related metaheuristic-based optimization, the proposed WSO framework has a better convergence behavior and more stable exploration/exploitation balance. As an example, the original WSO was proposed by [18] as a new bio-inspired metaheuristic algorithm, showing its powerful ability to search globally and high convergence rates on various optimization problems. Based on this, study [19] used WSO to enhance the diagnostic accuracy and computational efficiency of medical diagnosis through a dynamic feature selection process on several biomedical datasets. These findings verify that WSO can be successfully applied to different medical imaging and diagnostic fields, which is consistent with the results of the present study where WSO was highly stable and accurate in the DR classification. The presented framework can be extended to multi-dataset validation and hybrid optimization methods such as WSO-GA or WSO-PSO providing a more flexible search dynamics and the robustness to different datasets and imaging conditions.
The findings of this study can have important implications in the actual practice of medicine. This suggested framework for augmentations based on WSO can be integrated in the current CAD system in ophthalmology clinic without any problem. It optimizes dynamically the DA strategies, making the framework robust and consistent to different image qualities and acquisition devices, typical in real-life clinical settings. The flexibility of this means that more precise screening of DR is possible, particularly at the early stages of the disease, where manual diagnosis can be difficult and time-consuming. This optimization-based pipeline might be used in further applications to assist ophthalmologists as an aid diagnostic device to enhance the efficiency of screening and encourage early diagnosis to avoid vision impairment.
4.8 Computational Complexity Analysis
The suggested AMDA-WSO model is executed in two stages with different computational expenses. During Phase 1, the three CNN backbones are trained once on the APTOS 2019 data at a one-time cost of O(E
In Phase 2, the WSO searches over
In addition, the proposed framework is efficient in computation as the prediction probabilities of the pre-trained CNN models are computed and stored once during the initial training phase. In the optimization process, the augmentation sets of candidates are evaluated by utilizing these stored predictions, which substantially decreases the computational cost of the fitness evaluation without compromising the consistency of the comparisons between different candidate solutions, since the CNN models are not repeatedly executed. As illustrated in Fig. 12, the fitness value for WSO is not oscillating and converging to a stable value in the first few iterations. This quick and consistent convergence is primarily due to the relatively small binary search space (64 possible augmentation combinations) that provides the optimizer with a mechanism to quickly determine the optimal augmentation subset.
4.9 Limitations and Future Work
The effectiveness and reliability of the proposed framework based on the WSO approach in improving the classification of images related to DR are well presented in the study. The main focus of the study was to optimize the DA process through the implementation of metaheuristic algorithms to ensure the generalization of the model and prevent overfitting of the model to the training data. Although the proposed approach was effective in improving the classification of images related to DR, several limitations of the study should be acknowledged and considered in future studies. Firstly, the proposed framework is validated on two publicly available datasets namely APTOS 2019 and DDR, but needs to be tested further on other publicly available datasets like EyePACS to test the robustness, adaptability and generalization of the proposed framework on different distributions of retinal images. In addition, several class imbalances were observed in the data used to evaluate the proposed framework, where some of the severity levels of the disease were not adequately represented in the data used to train the model. Although the optimization process was effective in addressing this problem to a certain extent, the proposed framework needs to be evaluated on large datasets to confirm its stability and reliability in addressing this problem. Finally, the optimization and training process of the proposed framework was very expensive in terms of computation resources and time, especially when evaluating several CNN models.
In addition, the proposed framework was only evaluated on high-quality images, and its performance when applied to low-quality and blurry images needs to be determined in future studies. In addition, the proposed framework could be optimized through the implementation of hybrid optimization approaches and the incorporation of explainable AI tools to determine their efficiency in improving the performance of the proposed framework and addressing the limitations of the current approach.
Several research directions can be explored in future studies. Expanding the search space to include a broader set of augmentation types and continuous-valued parameters would require adaptation to mixed-variable optimization. In addition, the proposed AMDA-WSO framework will be tested on other medical imaging applications beyond DR including skin lesion analysis, chest X-ray, brain MRI, and histopathology, to further explore the generalizability of the framework across imaging modalities.Future research will also compare the proposed AMDA-WSO framework with learned augmentation techniques including AutoAugment, RandAugment and TrivialAugment.Furthermore, a sensitivity analysis will be carried out to investigate the impact of augmentation and optimization parameters on classification performance. Adopting rigorous statistical validation, such as 5
To evaluate how each augmentation method affects the final performance, an ablation experiment was carried out using MobileNetV2 on the APTOS 2019 dataset. As reported in Table 15, the baseline model, trained without any augmentation, achieved 87.20% accuracy with a Kappa score of 80.09%, and an AUC of 94.98%. Introducing the augmentations individually led to consistent improvements across all metrics. The highest accuracy (90.57%), Kappa (85.61%), and AUC (96.21%) were obtained when horizontal flip was applied. For the other cases, the accuracy and AUC of width/height shift and vertical flip were boosted by similar magnitudes, with accuracy of 89.62% and AUC of 95.13% and 95.80%, respectively. The success rates for zoom and rotation were also significant, at 89.34%, and AUC values of 95.82% and 96.17%, respectively, and the shear operation had an AUC of 95.56% with a success rate of 89.48%.
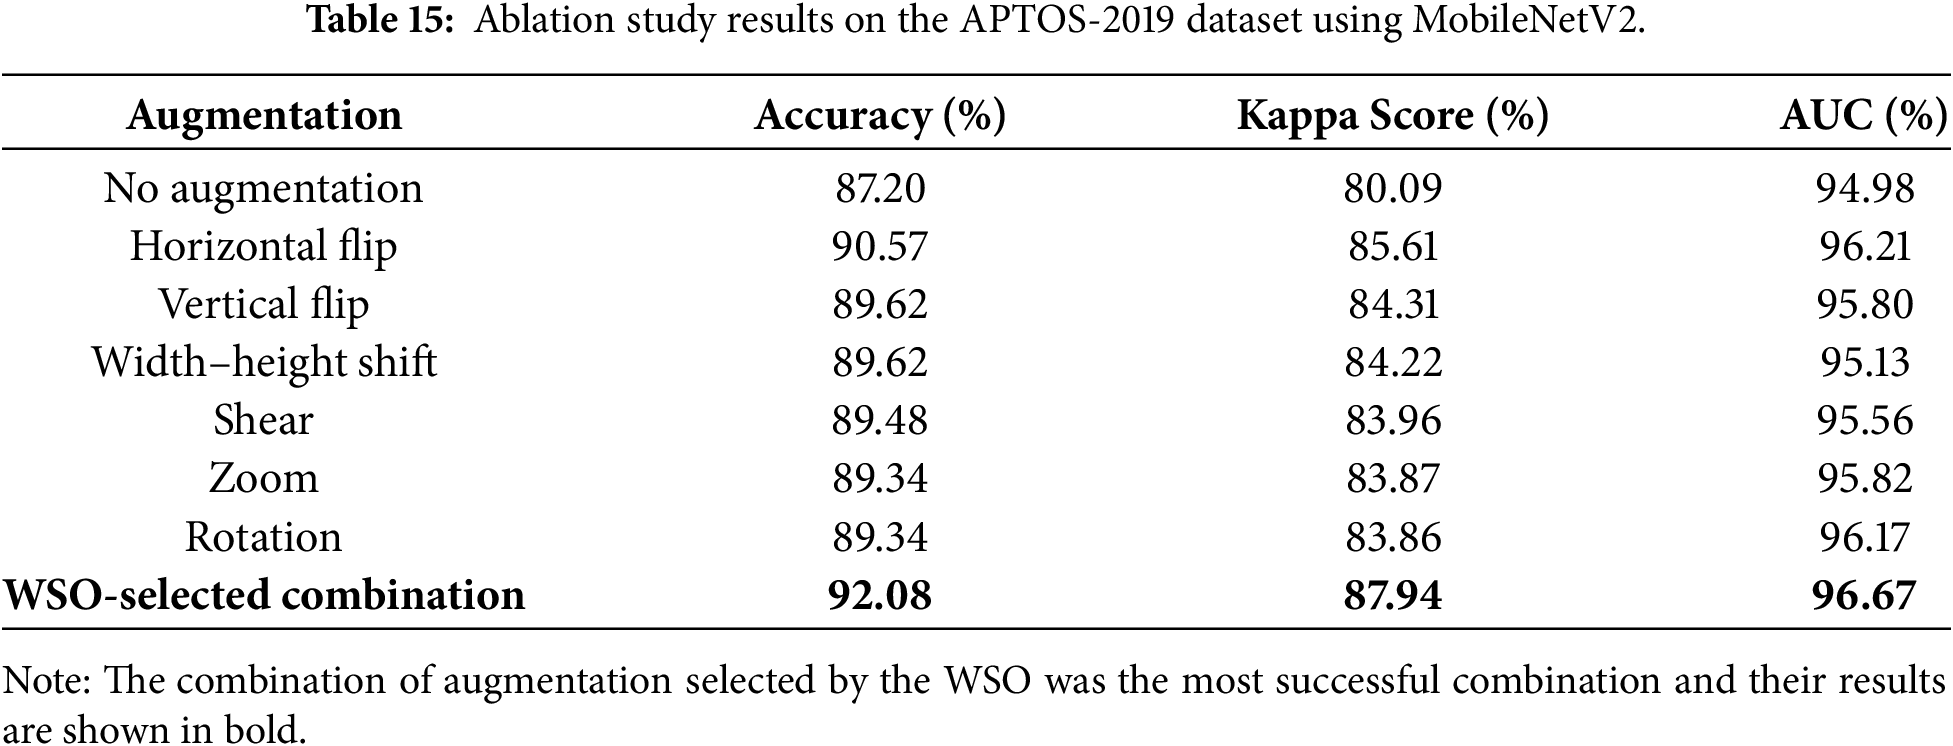
The best performance was obtained by the ensemble of the independently trained Horizontal Flip, Rotation, Shear and Vertical Flip models, selected by the WSO and averaged by soft voting. This ensemble achieved an accuracy of 92.08%, a Kappa score of 87.94%, and an AUC of 96.67%. These results are improvements over the no-augmentation baseline of 4.88% in accuracy, 7.85 points in Kappa score, and 1.69 points in AUC, compared to baseline. The small, but distinct improvement over the best single augmentation (the horizontal flip) indicates that these transformations complement each other nicely, offering a wider and more helpful range of variations than any individual operation could provide.
There is a noticeable effect caused by horizontal and vertical flips, which can be explained because both of the transformations affect the orientation of the image without disturbing the key retinal patterns like microaneurysms and exudates. The operations zoom and width–height did not make it into the final WSO subset, indicating that they added variations that were less useful for this task. Overall, the results show that each augmentation has different effects on the model, and that the set of augmentations chosen by the WSO provides a stable and balanced set of transformations that enhances the robustness of the classification across all the evaluation metrics.
The WSO-selected combination shown in Table 15 is an ensemble-based evaluation and not a newly trained MobileNetV2 model. In particular, six different MobileNetV2 models were trained independently, each using a different augmentation technique (e.g., Horizontal Flip, Rotation, Shear, Vertical Flip, Width–Height Shift, and Zoom). Binary WSO was then employed to identify the optimal subset of these augmentation-specific models, where a value of 1 indicates that the corresponding model is included in the ensemble, whereas 0 indicates that it is excluded. Finally, the average soft voting method was used to combine the prediction probabilities of the selected models and obtain the final classification result.
In this paper, we proposed AMDA-WSO, a binary optimization framework based on the WSO, for automated selection of data augmentation combinations in DR classification. Unlike manually designed or heuristic-based augmentation pipelines, the proposed method formulates augmentation selection as a discrete binary optimization problem, enabling a systematic search over the
Experimental results demonstrated that the augmentation combinations selected by WSO consistently improved classification performance compared to baseline augmentation scenarios. MobileNetV2 combined with WSO-guided augmentation achieved the highest accuracy of 92.08% and sensitivity (81.48%), while DenseNet121 with WSO maintained balanced performance across multiple evaluation metrics. In comparison with PSO and the BA, The experimental results demonstrate the effectiveness of the proposed AMDA-WSO framework for automated augmentation subset selection in DR classification. Statistical comparison among optimizers (WSO, PSO, BA) was not directly performed due to the limited number of independent runs; nevertheless, the superiority of WSO over the no-augmentation baseline was statistically validated using one-sample Wilcoxon signed-rank tests with Bonferroni correction
Nevertheless, the findings should be interpreted within the study’s limitations. The search space was confined to 64 predefined geometric transformations, excluding augmentation types such as color jitter, elastic deformations, or noise-based operations. Additionally, the APTOS 2019 dataset represents a single-source retinal image collection; results may vary across different imaging devices, patient demographics, and clinical grading protocols, which limits generalizability to broader screening scenarios. This may allow for more consistency of model performance of the model in clinical imaging scenarios and thus aid in the implementation of large-scale DR screening programs.
From a practical perspective, the proposed AMDA-WSO framework provides an automated augmentation selection mechanism with the potential to be incorporated into clinical CAD pipelines for DR screening, pending validation on multi-source datasets. Its optimizer-driven nature reduces reliance on manual heuristic tuning, which is particularly relevant in clinical settings where domain expertise for augmentation design is limited and annotation costs are high.
Acknowledgement: The authors would like to express their gratitude for the support received under TÜBİTAK–MIGHT Collaboration 2 programme (Project Code: TT-2024-002). The authors also would like to express their gratitude to Universiti Kebangsaan Malaysia (UKM) for the facilities and the continuous support given during this research.
Funding Statement: This work was supported by the TÜBİTAK–MIGHT Collaboration 2 Programme under Project Code TT-2024-002.
Author Contributions: The authors confirm their contributions to this paper as follows: Nedaa Almansour conceived and designed the study, implemented the proposed framework, performed the experiments, analyzed the data, prepared the figures and tables, and wrote the original draft of the manuscript. Azizi Abdullah, Dheeb Albashish, and Shahnorbanun Sahran contributed to the study design, supervised the research, reviewed the methodology and results, critically revised the manuscript for important intellectual content, and approved the final manuscript. All authors reviewed and approved the final version of the manuscript.
Availability of Data and Materials: The dataset used in this study APTOS 2019 is publicly avaliable at: https://www.kaggle.com/competitions/aptos2019-blindness-detection. The dataset for the DDR was made available in Kaggle at https://www.kaggle.com/datasets/mariaherrerot/ddrdataset/data.
Ethics Approval: Not applicable.
Conflicts of Interest: The authors declare no conflicts of interest.
List of Abbreviations
| AMDA-WSO | Adaptive Metaheuristic Data Augmentation–White Shark Optimizer |
| AUC | Area Under the Curve |
| BA | Bees Algorithm |
| BWSO | Binary White Shark Optimizer |
| CAD | Computer-Aided Diagnosis |
| CLAHE | Contrast Limited Adaptive Histogram Equalization |
| CNN | Convolutional Neural Network |
| DA | Data Augmentation |
| DenseNet121 | Densely Connected Convolutional Network (121 layers) |
| DL | Deep Learning |
| DNN | Deep Neural Network |
| DR | Diabetic Retinopathy |
| F1 | F1-Score (Harmonic Mean of Precision and Recall) |
| FN | False Negative |
| FP | False Positive |
| GAN | Generative Adversarial Network |
| GAP | Global Average Pooling |
| GPU | Graphics Processing Unit |
| GWO | Gray Wolf Optimization |
| IGWO | Improved Gray Wolf Optimization |
| IoT | Internet of Things |
| MobileNetV2 | Mobile Neural Network Version 2 |
| MRI | Magnetic Resonance Imaging |
| MRFO | Manta Ray Foraging Optimization |
| mRMR | Minimum Redundancy Maximum Relevance |
| PDR | Proliferative Diabetic Retinopathy |
| PSO | Particle Swarm Optimization |
| RBF | Radial Basis Function |
| ReLU | Rectified Linear Unit |
| ROC | Receiver Operating Characteristic |
| SHAP | SHapley Additive exPlanations |
| SMOTE | Synthetic Minority Oversampling Technique |
| Softmax | Softmax Function |
| SOTA | State-of-the-Art |
| SVM | Support Vector Machine |
| TL | Transfer Learning |
| TN | True Negative |
| TP | True Positive |
| VAE | Variational Autoencoder |
| VGG16 | Visual Geometry Group 16-layer CNN |
| ViT | Vision Transformer |
| WSO | White Shark Optimizer |
The detailed formulations of
where
where
Binary vectors
The operation symbol
where
Constants
Lower values of
The first term of Eq. (5) applies when
The distance between the shark and the prey is represented by
The parameter
References
1. Piffer S, Ubaldi L, Tangaro S, Retico A, Talamonti C. Tackling the small data problem in medical image classification with artificial intelligence: A systematic review. Prog Biomed Eng. 2024;6(3):032001. doi:10.1088/2516-1091/ad525b. [Google Scholar] [CrossRef]
2. Inamullah, Hassan S, Belhaouari SB, Amin I. Deciphering the impact of diversity in CNN-based ensembles on overcoming data imbalance and scarcity in medical datasets: A case study on diabetic retinopathy. Inform Med Unlocked. 2024;49:101557. doi:10.1016/j.imu.2024.101557. [Google Scholar] [CrossRef]
3. Kebaili A, Lapuyade-Lahorgue J, Ruan S. Deep learning approaches for data augmentation in medical imaging: A review. J Imaging. 2023;9(4):81. doi:10.3390/jimaging9040081. [Google Scholar] [CrossRef]
4. Raja DSS, Kumarganesh S, Sagayam KM, Dang H. Diabetic retinopathy detection and grading system using deep learning approach. Digit Health. 2026;12:20552076251410982. doi:10.1177/20552076251410982. [Google Scholar] [CrossRef]
5. Wubineh BZ, Rusiecki A, Halawa K. A systematic review of effective data augmentation in cervical cancer detection. Int J Electron Telecommun. 2025;71:369–77. doi:10.24425/ijet.2025.153582. [Google Scholar] [CrossRef]
6. Chłopowiec AB, Chłopowiec AR, Galus K, Cebula W, Tabakov M. Local lesion generation is effective for capsule endoscopy image data augmentation in a limited data setting. arXiv:2411.03098. 2024. [Google Scholar]
7. Gao Y, Tang Z, Zhou M, Metaxas D. Enabling data diversity: efficient automatic augmentation via regularized adversarial training. In: Information Processing in Medical Imaging. Cham, Switzerland: Springer International Publishing; 2021. p. 85–97. doi:10.1007/978-3-030-78191-0_7. [Google Scholar] [CrossRef]
8. Malibari AA, Alzahrani JS, Eltahir MM, Malik V, Obayya M, Al Duhayyim M, et al. Optimal deep neural network-driven computer aided diagnosis model for skin cancer. Comput Electr Eng. 2022;103(1):108318. doi:10.1016/j.compeleceng.2022.108318. [Google Scholar] [CrossRef]
9. Patil A, Mehto A, Nalband S. Enhancing skin lesion diagnosis with data augmentation techniques: a review of the state-of-the-art. Multimed Tools Appl. 2025;84(22):25325–64. doi:10.1007/s11042-024-20145-7. [Google Scholar] [CrossRef]
10. Mathews MR, Anzar SM. A comprehensive review on automated systems for severity grading of diabetic retinopathy and macular edema. Int J Imaging Syst Tech. 2021;31(4):2093–122. doi:10.1002/ima.22574. [Google Scholar] [CrossRef]
11. Aldrees A, Min H, Dutta AK, Daradkeh YI, Anjum M. Improving fundus detection precision in diabetic retinopathy using derivative-based deep neural networks. Comput Model Eng Sci. 2025;142(3):2487–511. doi:10.32604/cmes.2025.061103. [Google Scholar] [CrossRef]
12. Mikołajczyk A, Grochowski M. Data augmentation for improving deep learning in image classification problem. In: Proceedings of the 2018 International Interdisciplinary PhD Workshop (IIPhDW); 2018 May 9–12; Swinoujscie, Poland. p. 117–22. doi:10.1109/IIPHDW.2018.8388338. [Google Scholar] [CrossRef]
13. Shorten C, Khoshgoftaar TM. A survey on image data augmentation for deep learning. J Big Data. 2019;6(1):60. doi:10.1186/s40537-019-0197-0. [Google Scholar] [CrossRef]
14. Chlap P, Min H, Vandenberg N, Dowling J, Holloway L, Haworth A. A review of medical image data augmentation techniques for deep learning applications. J Med Imag Radiat Oncol. 2021;65(5):545–63. doi:10.1111/1754-9485.13261. [Google Scholar] [CrossRef]
15. Cubuk ED, Zoph B, Mane D, Vasudevan Le QV. Autoaugment: Learning augmentation policies from data. In: Proceedings of the IEEE/CVF Conference on Computer Vision and Pattern Recognition; 2019 Jun 15–20; Long Beach, CA, USA. p. 113–23. [Google Scholar]
16. Ribas LC, Casaca W, Fares RT. Conditional generative adversarial networks and deep learning data augmentation: a multi-perspective data-driven survey across multiple application fields and classification architectures. Ai. 2025;6(2):32. doi:10.3390/ai6020032. [Google Scholar] [CrossRef]
17. Rehan R, Sahran S, Alyasseri ZAA, Sani NS, Al-Betar MA. Hyperparameters optimization of evolving spiking neural network using artificial bee colony for unsupervised anomaly detection. J Intell Syst. 2025;34(1):20240235. doi:10.1515/jisys-2024-0235. [Google Scholar] [CrossRef]
18. Braik M, Hammouri A, Atwan J, Al-Betar MA, Awadallah MA. White shark optimizer: a novel bio-inspired meta-heuristic algorithm for global optimization problems. Knowl Based Syst. 2022;243(7):108457. doi:10.1016/j.knosys.2022.108457. [Google Scholar] [CrossRef]
19. Braik MS, Awadallah MA, Dorgham O, Al-Hiary H, Al-Betar MA. Applications of dynamic feature selection based on augmented white shark optimizer for medical diagnosis. Expert Syst Appl. 2024;257(14):124973. doi:10.1016/j.eswa.2024.124973. [Google Scholar] [CrossRef]
20. Braik M, Al-Hiary H, Al-Betar MA. Brain tumor segmentation of MRI images based on K-means and white shark optimizer. In: Proceedings of the 2023 24th International Arab Conference on Information Technology (ACIT); 2023 Dec 6–8; Ajman, United Arab Emirates. p. 1–8. doi:10.1109/ACIT58888.2023.10453855. [Google Scholar] [CrossRef]
21. Arumugam RV, Saravanan S. Automated multi-class skin cancer classification using white shark optimizer with ensemble learning classifier on dermoscopy images. Multimed Tools Appl. 2025;84(8):4857–79. doi:10.1007/s11042-024-18973-8. [Google Scholar] [CrossRef]
22. Alshdaifat EH, Sindiani AM, Alhatamleh S, Abu Mhanna HY, Madain R, Amin M, et al. Enhancing cervical cancer diagnosis with ensemble learning and shark optimization algorithm: Comparative study of CT and MRI in cervical cancer diagnosis. Front Oncol. 2025;15:1608386. doi:10.3389/fonc.2025.1608386. [Google Scholar] [CrossRef]
23. Pathak VK. A comprehensive review on the white shark optimizer, its variants, statistical analysis and performance evaluation. Comput Sci Rev. 2026;59(2):100848. doi:10.1016/j.cosrev.2025.100848. [Google Scholar] [CrossRef]
24. Hammouri AI, Braik MS, Al-hiary HH, Abdeen RA. A binary hybrid sine cosine white shark optimizer for feature selection. Clust Comput. 2024;27(6):7825–67. doi:10.1007/s10586-024-04361-2. [Google Scholar] [CrossRef]
25. Masadeh R, Almomani O, Zaqebah A, Masadeh S, Alshqurat K, Sharieh A, et al. Narwhal optimizer: A nature-inspired optimization algorithm for solving complex optimization problems. Comput Mater Continua. 2025;85(2):3709–37. doi:10.32604/cmc.2025.066797. [Google Scholar] [CrossRef]
26. Alawad NA, Abed-alguni BH, Al-Betar MA, Jaradat A. Binary improved white shark algorithm for intrusion detection systems. Neural Comput Appl. 2023;35(26):19427–51. doi:10.1007/s00521-023-08772-x. [Google Scholar] [CrossRef]
27. Pham DT, Castellani M. The Bees Algorithm: modelling foraging behaviour to solve continuous optimization problems. Proc Inst Mech Eng Part C J Mech Eng Sci. 2009;223(12):2919–38. doi:10.1243/09544062jmes1494. [Google Scholar] [CrossRef]
28. Qasem A, Sheikh Abdullah SNH, Sahran S, Albashish D, Goudarzi S, Arasaratnam S. An improved ensemble pruning for mammogram classification using modified Bees algorithm. Neural Comput Appl. 2022;34(12):10093–116. doi:10.1007/s00521-022-06995-y. [Google Scholar] [CrossRef]
29. Li B, Hou Y, Che W. Data augmentation approaches in natural language processing: A survey. AI Open. 2022;3(140):71–90. doi:10.1016/j.aiopen.2022.03.001. [Google Scholar] [CrossRef]
30. Wang H, Jin Z, Geng M, Hu S, Li G, Wang T, et al. Enhancing pre-trained ASR system fine-tuning for dysarthric speech recognition using adversarial data augmentation. In: Proceedings of the ICASSP 2024–2024 IEEE International Conference on Acoustics, Speech and Signal Processing (ICASSP); 2024 Apr 14–19; Seoul, Republic of Korea. pp. 12311–5. doi:10.1109/ICASSP48485.2024.10447702. [Google Scholar] [CrossRef]
31. Palaniappan D, Tak TK, Vijayan K, Maram B, Kshirsagar PR, Ahmad N. Enhancement of medical imaging technique for diabetic retinopathy: Realistic synthetic image generation using GenAI. Comput Model Eng Sci. 2025;145(3):4107–27. doi:10.32604/cmes.2025.073387. [Google Scholar] [CrossRef]
32. Oulhadj M, Riffi J, Chaimae K, Mahraz AM, Ahmed B, Yahyaouy A, et al. Diabetic retinopathy prediction based on deep learning and deformable registration. Multimed Tools Appl. 2022;81(20):28709–27. doi:10.1007/s11042-022-12968-z. [Google Scholar] [CrossRef]
33. Hayati M, Muchtar K, Roslidar, Maulina N, Syamsuddin I, Elwirehardja GN, et al. Impact of CLAHE-based image enhancement for diabetic retinopathy classification through deep learning. Procedia Comput Sci. 2023;216(1):57–66. doi:10.1016/j.procs.2022.12.111. [Google Scholar] [CrossRef]
34. Chilukoti S, Shan L, Tida V, Maida A, Hei X. A reliable diabetic retinopathy grading via transfer learning and ensemble learning with quadratic weighted kappa metric. BMC Med Inform Decis Mak. 2024;24(1):37. doi:10.1186/s12911-024-02446-x. [Google Scholar] [CrossRef]
35. Chakraborty A, Wilson G, Luca C. A lightweight classification system for the early detection of diabetic retinopathy. Inform Med Unlocked. 2025;57(1):101655. doi:10.1016/j.imu.2025.101655. [Google Scholar] [CrossRef]
36. Bhoopalan R, Sekar P, Nagaprasad N, Mamo TR, Krishnaraj R. Task optimized vision transformer for diabetic retinopathy detection and classification in resource constrained early diagnosis settings. Sci Rep. 2025;15(1):39047. doi:10.1038/s41598-025-25399-1. [Google Scholar] [CrossRef]
37. Maaod Y, Abuhmed T, Amer E, El-Sappagh S. Hybrid deep ensemble architecture for robust diabetic retinopathy classification: leveraging transfer learning and CNN-transformer synergy. Sci Rep. 2026. doi:10.1038/s41598-026-55085-9. [Google Scholar] [CrossRef]
38. Ren Y, Shao D, Yi S. DR-MAE: self-supervised learning for diabetic retinopathy grading based on masked autoencoder. J King Saud Univ Comput Inf Sci. 2025;37(8):217. doi:10.1007/s44443-025-00159-3. [Google Scholar] [CrossRef]
39. Alomar K, Aysel HI, Cai X. Data augmentation in classification and segmentation: A survey and new strategies. J Imaging. 2023;9(2):46. doi:10.3390/jimaging9020046. [Google Scholar] [CrossRef]
40. Alsaidi M, Jan MT, Altaher A, Zhuang H, Zhu X. Tackling the class imbalanced dermoscopic image classification using data augmentation and GAN. Multimed Tools Appl. 2024;83(16):49121–47. doi:10.1007/s11042-023-17067-1. [Google Scholar] [CrossRef]
41. Shaban M, Ogur Z, Mahmoud A, Switala A, Shalaby A, Abu Khalifeh H, et al. A convolutional neural network for the screening and staging of diabetic retinopathy. PLoS One. 2020;15(6):e0233514. doi:10.1371/journal.pone.0233514. [Google Scholar] [CrossRef]
42. Patel S. Diabetic retinopathy detection and classification using pre-trained convolutional neural networks. Int J Emerg Technol. 2020;11(3):1082–7. [Google Scholar]
43. Mungloo-Dilmohamud Z, Heenaye-Mamode Khan M, Jhumka K, Beedassy BN, Mungloo NZ, Peña-Reyes C. Balancing data through data augmentation improves the generality of transfer learning for diabetic retinopathy classification. Appl Sci. 2022;12(11):5363. doi:10.3390/app12115363. [Google Scholar] [CrossRef]
44. Herrero-Tudela M, Romero-Oraá R, Hornero R, Gutiérrez Tobal GC, López MI, García M. An explainable deep-learning model reveals clinical clues in diabetic retinopathy through SHAP. Biomed Signal Process Control. 2025;102(1):107328. doi:10.1016/j.bspc.2024.107328. [Google Scholar] [CrossRef]
45. Ahmed F. Addressing high class imbalance in multi-class diabetic retinopathy severity grading with augmentation and transfer learning. arXiv:2507.17121. 2025. [Google Scholar]
46. Minarno AE, Bagaskara AD, Bimantoro F, Suharso W. Classification of diabetic retinopathy based on fundus image using InceptionV3. JOIV: Int J Inform Visualization. 2025;9(1):23. doi:10.62527/joiv.9.1.2155. [Google Scholar] [CrossRef]
47. Guefrachi S, Echtioui A, Hamam H. Diabetic retinopathy detection using deep learning multistage training method. Arab J Sci Eng. 2025;50(2):1079–96. doi:10.1007/s13369-024-09137-9. [Google Scholar] [CrossRef]
48. Zulaikha Beevi S. Multi-Level severity classification for diabetic retinopathy based on hybrid optimization enabled deep learning. Biomed Signal Process Control. 2023;84(3):104736. doi:10.1016/j.bspc.2023.104736. [Google Scholar] [CrossRef]
49. Gundluru N, Rajput DS, Lakshmanna K, Kaluri R, Shorfuzzaman M, Uddin M, et al. Enhancement of detection of diabetic retinopathy using Harris Hawks optimization with deep learning model. Comput Intell Neurosci. 2022;2022(24):8512469. doi:10.1155/2022/8512469. [Google Scholar] [CrossRef]
50. Nazir A, Hussain A, Singh M, Assad A. Deep learning in medicine: advancing healthcare with intelligent solutions and the future of holography imaging in early diagnosis. Multimed Tools Appl. 2025;84(17):17677–740. doi:10.1007/s11042-024-19694-8. [Google Scholar] [CrossRef]
51. Randive SN, Senapati RK, Rahulkar AD. A self-adaptive optimisation for diabetic retinopathy detection with neural classification. Int J Nano Biomater. 2019;8(3/4):204. doi:10.1504/ijnbm.2019.104935. [Google Scholar] [CrossRef]
52. Das S, Saha SK. Diabetic retinopathy detection and classification using CNN tuned by genetic algorithm. Multimed Tools Appl. 2022;81(6):8007–20. doi:10.1007/s11042-021-11824-w. [Google Scholar] [CrossRef]
53. El-Hassani FZ, Belhabib F, Joudar NE, Haddouch K. Evolutionary algorithm-based hyperparameter tuning of one-dimensional CNNs for diabetes mellitus prediction. Evol Intell. 2024;17(5):3655–74. doi:10.1007/s12065-024-00950-7. [Google Scholar] [CrossRef]
54. Bilal A, Sun G, Mazhar S, Imran A. Improved grey wolf optimization-based feature selection and classification using CNN for diabetic retinopathy detection. In: Evolutionary computing and mobile sustainable networks. Singapore: Springer; 2022. p. 1–14. doi:10.1007/978-981-16-9605-3_1. [Google Scholar] [CrossRef]
55. Almansour N, Sahran S, Abdullah A, Albashish D, Hamzah JC. Hyperparameter optimization of convolutional neural networks using particle swarm optimization for diabetic retinopathy detection. Peerj Comput Sci. 2025;11(10):e3273. doi:10.7717/peerj-cs.3273. [Google Scholar] [CrossRef]
56. Almansour N, Albashish D, Sahran S, Abdullah A, Nasruddin MF, Xu X. Metaheuristic-based hyperparameter tuning for pretrained deep learning model: application to the skin cancer identification. In: Proceedings of the 2025 1st International Conference on Computational Intelligence Approaches and Applications (ICCIAA); 2025 Apr 28–30; Amman, Jordan. p. 1–8. doi:10.1109/ICCIAA65327.2025.11013496. [Google Scholar] [CrossRef]
57. Cubuk ED, Zoph B, Shlens J, Le QV. Randaugment: practical automated data augmentation with a reduced search space. In: Proceedings of the 2020 IEEE/CVF Conference on Computer Vision and Pattern Recognition Workshops (CVPRW); 2020 Jun 14–19; Seattle, WA, USA. p. 3008–17. doi:10.1109/cvprw50498.2020.00359. [Google Scholar] [CrossRef]
58. Lim S, Kim I, Kim T, Kim C, Kim S. Fast autoaugment. In: Proceedings of the 33rd International Conference on Neural Information Processing Systems; 2019 Dec 8–14; Vancouver, BC, Canada. p. 6665–75. [Google Scholar]
59. Negassi M, Wagner D, Reiterer A. Smart(sampling)augment: optimal and efficient data augmentation for semantic segmentation. Algorithms. 2022;15(5):165. doi:10.3390/a15050165. [Google Scholar] [CrossRef]
60. Müller SG, Hutter F. TrivialAugment: tuning-free yet state-of-the-art data augmentation. In: Proceedings of the 2021 IEEE/CVF International Conference on Computer Vision (ICCV); 2021 Oct 10–17; Montreal, QC, Canada. p. 754–62. doi:10.1109/ICCV48922.2021.00081. [Google Scholar] [CrossRef]
61. Adamu S, Alhussian H, Aziz N, Abdulkadir SJ, Alwadin A, Abdullahi M, et al. Unleashing the power of Manta Rays Foraging Optimizer: A novel approach for hyper-parameter optimization in skin cancer classification. Biomed Signal Process Control. 2025;99(3):106855. doi:10.1016/j.bspc.2024.106855. [Google Scholar] [CrossRef]
62. Majhi B, Kashyap A, Mohanty SS, Dash S, Mallik S, Li A, et al. An improved method for diagnosis of Parkinson’s disease using deep learning models enhanced with metaheuristic algorithm. BMC Med Imag. 2024;24(1):156. doi:10.1186/s12880-024-01335-z. [Google Scholar] [CrossRef]
63. Aljohani M, Bahgat WM, Balaha HM, AbdulAzeem Y, El-Abd M, Badawy M, et al. An automated metaheuristic-optimized approach for diagnosing and classifying brain tumors based on a convolutional neural network. Results Eng. 2024;23(1):102459. doi:10.1016/j.rineng.2024.102459. [Google Scholar] [CrossRef]
64. Ashwini A, Chirchi V, Balasubramaniam S, Shah MA. Bio inspired optimization techniques for disease detection in deep learning systems. Sci Rep. 2025;15(1):18202. doi:10.1038/s41598-025-02846-7. [Google Scholar] [CrossRef]
65. Adamu S, Alhussian H, Abdulkadir SJ, Alwadin A, Khairy SO, Mamman H, et al. Adaptive hybrid hyperparameter optimization with MRFO and Lévy flight for accurate melanoma classification. J King Saud Univ Comput Inf Sci. 2025;37(4):64. doi:10.1007/s44443-025-00078-3. [Google Scholar] [CrossRef]
66. Simonyan K, Zisserman A. Very deep convolutional networks for large-scale image recognition. arXiv:1409.1556. 2014. [Google Scholar]
67. Azam A, Janardhan V, B.S. V, A. A, Yadav SK. Diabetic retinopathy detection using VGG16 and grad-CAM. In: Proceedings of the 2026 IEEE International Conference on AI Engineering and Innovations (AIEI); 2026 Mar 26–28; NIT Jamshedpur, India. p. 1–6. doi:10.1109/AIEI69164.2026.11496936. [Google Scholar] [CrossRef]
68. Huang G, Liu Z, Van Der Maaten L, Weinberger KQ. Densely connected convolutional networks. In: Proceedings of the 2017 IEEE Conference on Computer Vision and Pattern Recognition (CVPR); 2017 Jul 21–26; Honolulu, HI, USA p. 2261–9. doi:10.1109/CVPR.2017.243. [Google Scholar] [CrossRef]
69. Sivasamy GM, Sreedevi DPBN, Muthuraj DS, Sugumaran GD. Diabetic retinopathy detection and classification using DENSENET-121. AIP Conf Proc. 2025;3258:020011. doi:10.1063/5.0262104. [Google Scholar] [CrossRef]
70. Sandler M, Howard A, Zhu M, Zhmoginov A, Chen LC. MobileNetV2: inverted residuals and linear bottlenecks. In: Proceedings of the 2018 IEEE/CVF Conference on Computer Vision and Pattern Recognition; 2018 Jun 18–23; Salt Lake City, UT, USA. p. 4510–20. doi:10.1109/CVPR.2018.00474. [Google Scholar] [CrossRef]
71. Dereich S, Jentzen A. Convergence rates for the Adam optimizer. arXiv:2407.21078. 2024. [Google Scholar]
72. Défossez A, Bottou L, Bach F, Usunier N. A simple convergence proof of Adam and adagrad. arXiv:2003.02395. 2020. [Google Scholar]
73. Vij R, Arora S. A novel deep transfer learning based computerized diagnostic Systems for Multi-class imbalanced diabetic retinopathy severity classification. Multimed Tools Appl. 2023;82(22):34847–84. doi:10.1007/s11042-023-14963-4. [Google Scholar] [CrossRef]
74. Mehta N, Lorraine J, Masson S, Arunachalam R, Bhat ZP, Lucas J, et al. Improving hyperparameter optimization with checkpointed model weights. In: Computer Vision–ECCV 2024 Workshops. Cham, Switzerland: Springer Nature; 2025. p. 75–96. doi:10.1007/978-3-031-91979-4_8. [Google Scholar] [CrossRef]
75. Saini M, Susan S. Diabetic retinopathy screening using deep learning for multi-class imbalanced datasets. Comput Biol Med. 2022;149(2):105989. doi:10.1016/j.compbiomed.2022.105989. [Google Scholar] [CrossRef]
76. İncir R, Bozkurt F. A study on effective data preprocessing and augmentation method in diabetic retinopathy classification using pre-trained deep learning approaches. Multimed Tools Appl. 2024;83(4):12185–208. doi:10.1007/s11042-023-15754-7. [Google Scholar] [CrossRef]
77. Oulhadj M, Riffi J, Khodriss C, Mahraz AM, Yahyaouy A, Abdellaoui M, et al. Diabetic retinopathy prediction based on vision transformer and modified capsule network. Comput Biol Med. 2024;175(suppl_1):108523. doi:10.1016/j.compbiomed.2024.108523. [Google Scholar] [CrossRef]
78. Tewari Y, Parihar NS, Rautela K, Kaundal N, Diwakar M, Pandey NK. Diabetic retinopathy detection and analysis with convolutional neural networks and vision transformer. Biomed Inform Smart Healthcare. 2025;1(1):18–26. doi:10.62762/bish.2025.724307. [Google Scholar] [CrossRef]
79. Khan SUR, Asim MN, Vollmer S, Dengel A. AI-driven diabetic retinopathy diagnosis enhancement through image processing and salp swarm algorithm-optimized ensemble network. arXiv:2503.14209. 2025. [Google Scholar]
Cite This Article
 Copyright © 2026 The Author(s). Published by Tech Science Press.
This work is licensed under a Creative Commons Attribution 4.0 International License , which permits unrestricted use, distribution, and reproduction in any medium, provided the original work is properly cited.
 Downloads
 Citation Tools
