
 Login
Login Register
 Submit a Paper
 Propose a Special lssue
 Open Access
ARTICLE
Combined Effects of Carbonation and Fly Ash on the Sulfate Resistance of Recycled Aggregate Concrete: Compressive Strength Evolution and CNN-LSTM Prediction
1 School of Civil and Hydraulic Engineering, Chongqing University of Science and Technology, Chongqing, China
2 School of Civil and Environmental Engineering, University of New South Wales, Sydney, Australia
* Corresponding Authors: Jiehong Li. Email: ; Yang Yu. Email:
Computer Modeling in Engineering & Sciences 2026, 148(3), 11 https://doi.org/10.32604/cmes.2026.089217
Received 16 July 2026; Accepted 08 September 2026; Issue published 28 September 2026
 View Full Text
 Download PDF
Abstract
Recycled aggregate concrete (RAC) enables construction waste reuse, but surface micro-cracks on recycled aggregates (RA) and multiple ITZs from old adhered mortar create extra sulfate transport paths, undermining RAC’s sulfate resistance. Current studies largely examine single modification methods’ effects on durability, yet lack sufficient predictive power for how such modifications influence final material properties. This study evaluated nine concrete mixtures comprising 297 cube specimens and employed sulfate wet-dry cycling experiments combined with XRD and SEM microscopic characterization to investigate the coupled influence of carbonation-treated RA and fly ash addition on the compressive strength development and resistance of RAC to sulfate-induced deterioration. Subsequently, a convolutional neural network–long short-term memory (CNN-LSTM) hybrid model was utilized for performance prediction. SHAP (SHapley Additive exPlanations) analysis was applied to examine the contribution of each factor to the prediction outcomes, thereby enhancing the model’s interpretability. The results showed that, under standard curing, carbonation at 0.5 MPa provided the greatest strength improvement among the carbonation pressures investigated. After 120 d of continued curing, concrete incorporating RA carbonated at 0.5 MPa (CRAC-0.5) reached a compressive strength of 47.5 MPa, equivalent to 95.6% of that of natural aggregate concrete (NAC) and 13.9% higher than that of untreated RAC. Among the combined modification levels tested, the mixture incorporating RA carbonated at 0.5 MPa and 20% fly ash (FCRAC-20%) exhibited the best overall performance. After 120 sulfate wet-dry cycles, it retained a compressive strength of 25.6 MPa, corresponding to 82.8% of its baseline strength and comparable to the strength retention of NAC. By contrast, untreated RAC retained only 1.0 MPa, or approximately 3.0% of its baseline strength. Carbonation generated CaCO3 that filled old mortar cracks, while fly ash improved the new paste via filling and pozzolanic reaction; together, they mitigated sulfate ion ingress, thus reducing gypsum and ettringite formation. X-ray diffraction (XRD) phase analysis further showed weaker gypsum and ettringite reflections in FCRAC-20%, consistent with reduced sulfate reaction product accumulation. Moreover, the CNN-LSTM model (R2 values of 0.94 and 0.93 on the training and test sets) accurately predicted strength under various modifications and erosion stages. SHAP ranked wet-dry cycles as the top influencing factor, followed by carbonation pressure, highlighting carbonation’s crucial role in strength and sulfate resistance. These findings identify FCRAC-20% as the combination with the best performance among those tested, aid durability assessment and mix design for carbonated RAC in sulfate-rich environments, and provide a comparative laboratory basis for future validation at full scale.Keywords
With the rapid urban renewal and construction, massive amounts of construction waste are generated. Relying solely on landfill disposal occupies valuable land resources and causes environmental issues such as dust pollution and carbon emissions [1]. Crushing, screening, and processing waste concrete into recycled aggregate (RA) to partially replace natural aggregate in concrete production offers a key solution. This approach recycles construction waste, reduces the demand for natural aggregate mining, and promotes low-carbon development [2,3]. However, compared to natural aggregate (NA), RA usually retains adhered old mortar and presents a more complex internal structure. They suffer from defects such as higher porosity, high water absorption, and micro-cracks. Consequently, the strength, impermeability, and durability of recycled aggregate concrete (RAC) are generally inferior to those of conventional concrete [4–6]. In saline soil, coastal areas, or regions with high sulfate concentrations, sulfate attack is a primary cause of reduced concrete durability. When external sulfates penetrate cement-based materials, they react with hydration products, leading to cracking, spalling, and loss of strength [7]. For RAC, the micro-cracks in the adhered old mortar on the RA surface and the additional interfacial transition zones (ITZs) introduced by the RA provide more paths for ion transport. Consequently, RAC is highly vulnerable to internal damage and strength degradation under dry-wet sulfate cycles [8–10]. Therefore, modifying RA to enhance the sulfate resistance of RAC has become a major focus of current research.
Modification methods for RA include physical, chemical, biological, and composite techniques [11]. Physical modification removes adhered old mortar, while chemical methods strengthen it and improve ITZs. Combining efficiency, cost, and environmental value, accelerated carbonation (a chemical approach) is highly sustainable and effective. It can not only improve properties of RA but also sequester CO2 [11]. Studies show carbonation reduced ion transport and enhanced concrete durability [12]. Specifically, Zhan et al. [13] and Wu et al. [14] confirmed that the carbonation of RA effectively improved compactness of RA. Consequently, carbonation treatment of RA can effectively block sulfate ion pathways in RAC, significantly improving its sulfate resistance [15–17].
Additionally, fly ash can improve RAC durability by reacting with Ca(OH)2 to form C-S-H gel, which refines the pore structure and blocks sulfate intrusion [17,18]. Therefore, combining RA carbonation with fly ash incorporation has the potential to maximize the sulfate resistance of RAC. However, systematic research on their combined effects under dry-wet sulfate cycles within a single, unified experimental system remains limited [19–21]. Existing studies show inconsistent results due to variations in materials and testing conditions, and often lack microstructural evidence to support macroscopic observations. Furthermore, traditional experimental methods are too time-consuming and costly to efficiently analyze the complex variable combinations in diverse concrete mixes [22,23]. Therefore, it is highly valuable to efficiently evaluate and predict strength degradation in carbonated RAC (CRAC) under sulfate attack using a unified system, while clarifying the underlying mechanisms through microstructural analysis.
The strength evolution of RAC in sulfate environments is driven by the coupling of multiple factors, including aggregate substitution rate, carbonation degree, fly ash content, and exposure time, et al. Although traditional testing methods provide reliable macroscopic and microscopic evidence, they are limited by sample size and variable combinations, making it difficult to efficiently reveal these complex nonlinear patterns over a short period [24,25]. With the rapid development of data-driven techniques, machine learning has become an effective tool for estimating concrete properties [26]. Feng et al. [27] noted that machine learning can accurately model the nonlinear relationships between mix parameters and compressive strength. Similarly, Liu et al. [24] applied ensemble learning to predict the sulfate resistance of RAC, proving that data-driven methods provide an effective supplement for durability evaluation [28]. Commonly used predictive approaches include linear regression, support vector regression (SVR), random forest (RF), gradient boosting methods such as XGBoost, artificial neural networks or multilayer perceptrons (ANN/MLP), CNN, and LSTM. These methods provide complementary strategies for modeling relationships between concrete input variables and target properties, and their relative performance depends on the dataset, preprocessing, hyperparameter tuning, and validation protocol [29,30]. Pearson product–moment correlation was used as a preliminary descriptive screen for pairwise linear collinearity among the six numerical inputs. It was selected over rank-based or nonlinear-dependence measures because the immediate objective was to identify first-order linear redundancy between predictors rather than to rank their predictive importance. Variables showing weak pairwise correlations were retained because each represented a distinct and physically meaningful material, treatment, or exposure factor, and weak linear correlation does not exclude nonlinear, conditional, or interaction effects. Their model-specific contributions were subsequently examined using SHAP. The CNN-LSTM model integrates local feature extraction with sequential dependency modeling. The CNN component extracts local features, identifies correlations among multidimensional input variables, and reduces data dimensionality, thereby limiting redundant information and noise interference [31]. Meanwhile, the LSTM component uses memory cells and gating mechanisms to retain critical information across different stages [32]. This integrated architecture supports the characterization of compressive strength evolution as curing age increases and sulfate wet-dry cycles progress [33–36], enabling the model to capture complex responses associated with material parameters, environmental exposure, and time history within the experimental scope of this study.
In summary, although prior research has shown that carbonation-treated RA combined with fly ash addition can enhance the resistance of RAC to deterioration caused by sulfate attack, the combined action of these two modification approaches has not yet been systematically clarified, especially regarding the integration of macroscopic testing, microstructural characterization, and data-driven analysis within a unified framework. This study investigated the strength evolution and resistance mechanisms of CRAC under dry-wet sulfate cycles using consistent material sources, carbonation conditions, and testing procedures. Standard curing and dry-wet sulfate cycle tests were conducted to reveal strength development and degradation laws, while microstructural analysis clarified how carbonation and fly ash regulate transport pathways and structural density. On this basis, a CNN-LSTM model was developed using carbonation time, carbonation pressure, recycled aggregate replacement ratio, fly ash content, number of sulfate wet-dry cycles, and curing age as input variables to establish an interpretable, within-domain nonlinear mapping with compressive strength. Within a consistent experimental framework, the combined response of carbonation-treated RA and fly ash addition was evaluated across macroscopic, microstructural, and predictive scales, thereby providing a rigorous and interpretable approach to inform the optimization of the sulfate resistance design of RAC.
2 Raw Materials and Experimental Methods
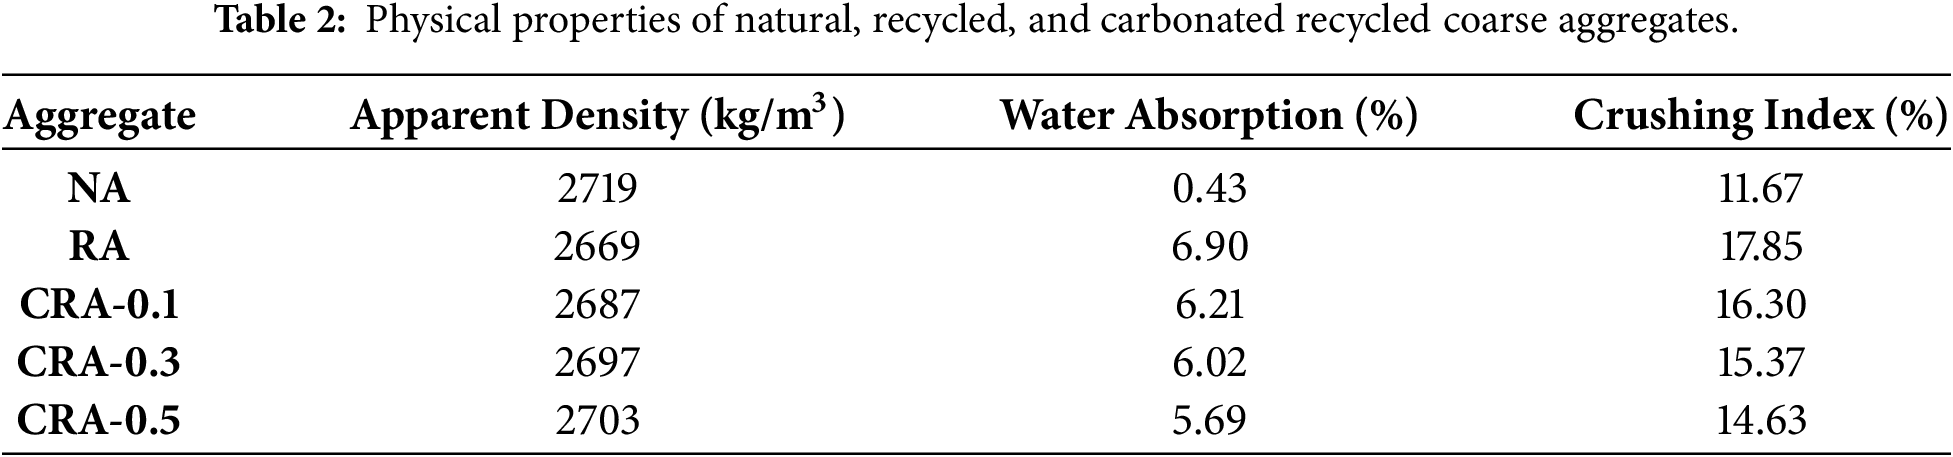
The binder system consisted of P·O 42.5R ordinary Portland cement and fly ash, while river sand, natural aggregate (NA), recycled aggregate (RA), and tap water were used as the remaining constituents. The RA was produced from laboratory-cast parent concrete with a design strength class of C30, comprising P·O 42.5R ordinary Portland cement, natural coarse aggregate, river sand, and tap water; after 28 d of standard curing at 20 ± 2°C and >95% relative humidity, without prior service exposure, the parent concrete was pre-crushed using a compression testing machine, manually fragmented, further crushed using a jaw crusher, and sieved into 5–10, 10–15, and 15–20 mm fractions. To ensure the comparability of the experimental results, both NA and RA were graded using the same particle-size range and grading composition. The three particle-size fractions of 5–10, 10–15, and 15–20 mm were blended at a mass ratio of 3:5:1. The chemical composition of the fly ash is listed in Table 1; its main components are SiO2 and Al2O3, along with minor amounts of CaO and SO3. The high contents of SiO2 and Al2O3 provide the basis for subsequent pozzolanic reactions. The basic physical properties of NA, RA, and carbonated recycled aggregate (CRA), including apparent density, water absorption, and crushing index, are summarized in Table 2.

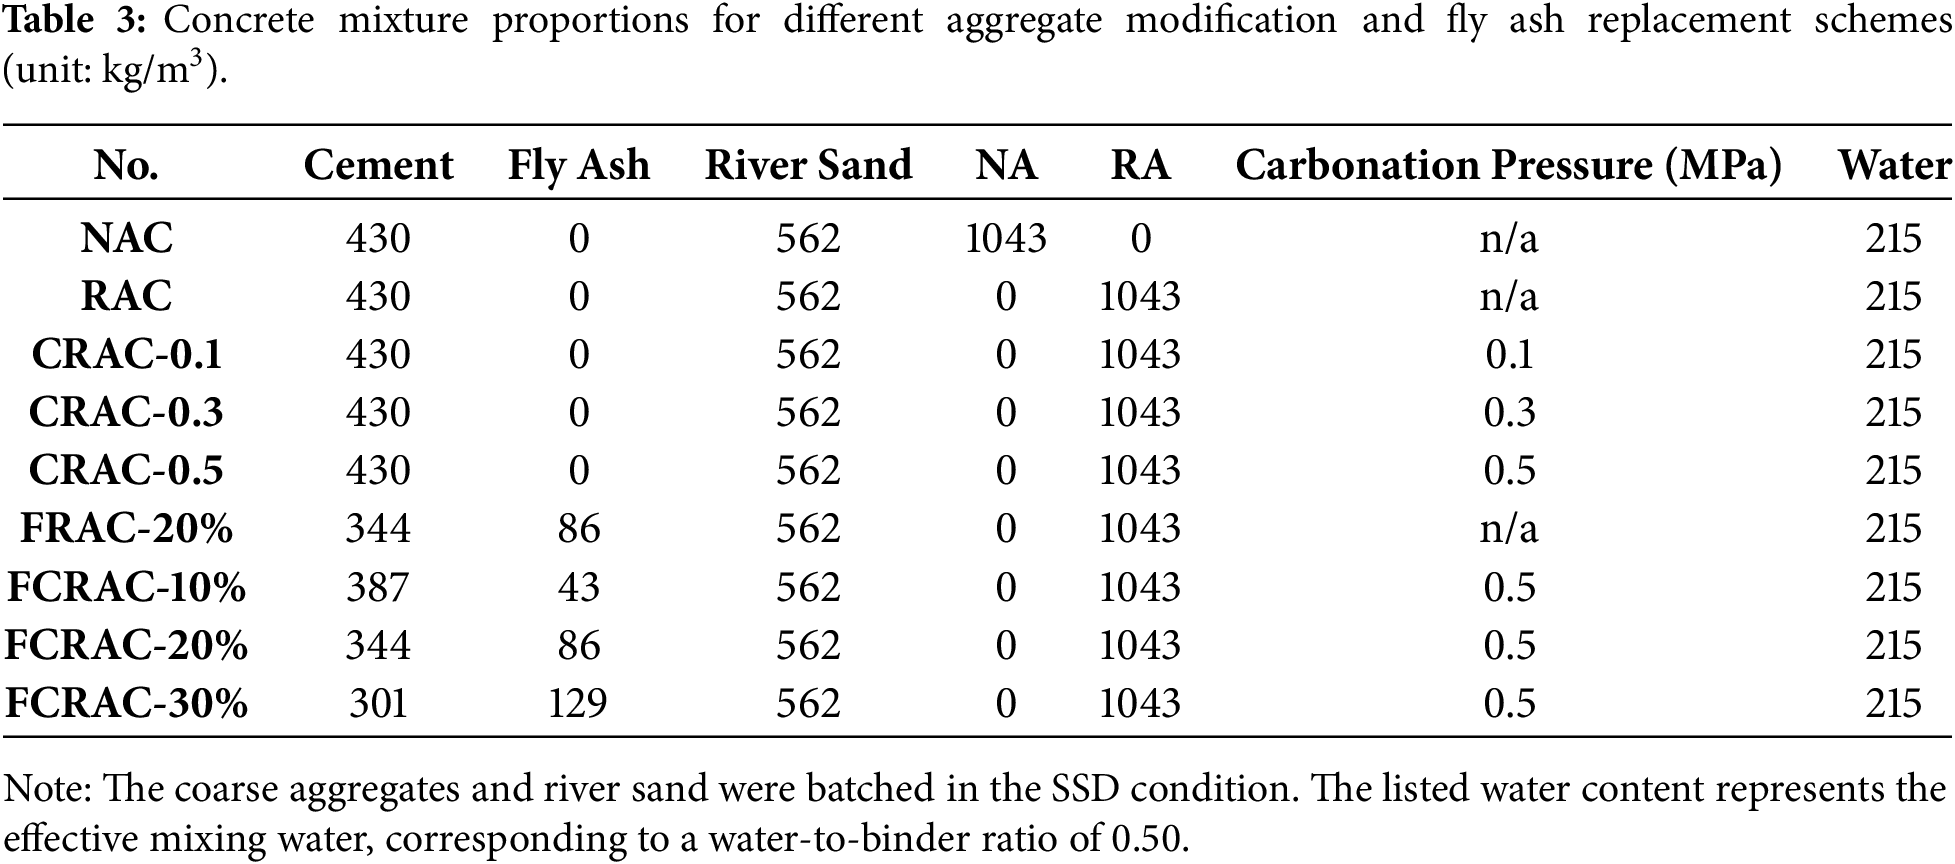
The experiment involves 9 groups of concrete with a total of 297 cube specimens measuring 100 mm × 100 mm × 100 mm. After casting, the specimens were demolded after 24 h and placed in a standard curing room. The NAC group, made with NA, served as the reference group. The RAC group was the unmodified baseline group with 100% RA substitution. The CRAC groups used RA treated under different carbonation pressures, while the ash recycled aggregate concrete (FRAC) groups were modified by incorporating fly ash. The FCRAC groups combined both carbonation and fly ash to investigate whether the dual modification could provide a more stable improvement in durability. The detailed concrete mixture proportions are listed in Table 3. In this study, the stated fly ash percentages represent the mass fraction of fly ash in the total binder, calculated as
The RA was dried under ambient laboratory conditions before being placed inside a sealed high-pressure carbonation reactor, as shown in Fig. 1, for accelerated carbonation treatment. The reactor had an internal diameter of 500 mm, a height of 500 mm, a wall thickness of 8 mm, an approximate internal volume of 100 L, and a maximum operating pressure of 0.54 MPa. It was equipped with a temperature–humidity monitor and layered racks containing perforated circular trays, on which the RA was uniformly spread to avoid bulk stacking. The nominal processing capacity of the reactor was up to 30 kg per batch. During carbonation, the temperature and relative humidity inside the reactor were maintained at 20°C and 50%, respectively. After airtightness was confirmed, the reactor was evacuated to approximately −0.1 MPa. High-pressure CO2 with a nominal purity of 99.5% was subsequently introduced through a pressure-reducing valve until the selected pressure of 0.1, 0.3, or 0.5 MPa was reached. The target pressure was maintained for 24 h, after which the CO2 was completely vented and the carbonated recycled aggregate was removed. Before concrete batching, the carbonated aggregate was conditioned to the SSD state following the procedure described in Section 2.2. By maintaining the carbonation time, temperature, relative humidity, and aggregate-loading arrangement constant, the graded-pressure design enabled the influence of carbonation pressure on aggregate modification and sulfate resistance to be comparatively evaluated.
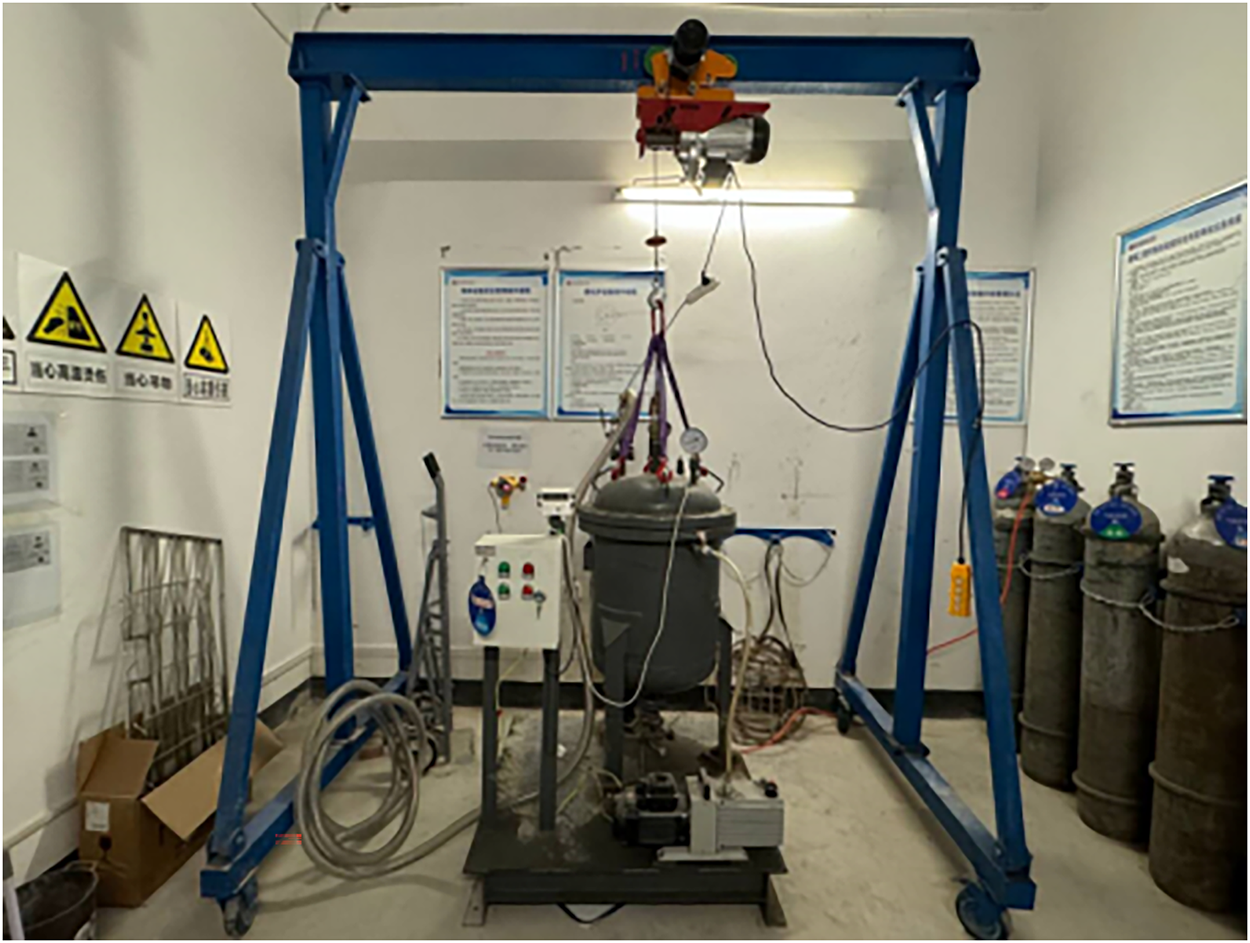
Figure 1: High-pressure carbonation reactor.
Compressive strength was determined in accordance with GB/T 50081-2019 using 100 mm cubic specimens, and loading was applied with a DYE-2000B hydraulic compression testing machine. Three parallel specimens were tested for each group, and the arithmetic mean of their compressive strengths was taken as the final result. Because the specimens were non-standard 100 mm cubes, the test results were multiplied by a size conversion factor of 0.95 to obtain the equivalent standard compressive strength values.
2.5 Sulfate Dry-Wet Cycle Test
To simulate the erosion process of concrete components in practical environments, such as water-level fluctuation zones and alternating wet and dry conditions in sulfate environments, sulfate dry-wet cycle tests were performed with a fully automatic sulfate cycling apparatus (HC-LSB), as shown in Fig. 2. The test followed GB/T 50082-2009. The exposure medium was a 5% Na2SO4 solution by mass. The pH of the Na2SO4 solution was measured after every 15 cycles and maintained within the range of 6–8. When the measured pH fell outside this range, the solution was replaced with a freshly prepared 5% Na2SO4 solution. A covered, salt-resistant specimen container with a capacity of 27 L was used, and the exposure solution was prepared using chemically pure anhydrous Na2SO4. The specimens were 100 mm × 100 mm × 100 mm cubes, with at least three specimens prepared for each group. In addition to the exposed specimens, standard-cured reference specimens of the same age were prepared and maintained to comprehensively evaluate the strength changes and erosion resistance of the attacked specimens. Two days before reaching the age of 28 d, the specimens were removed from the standard curing room, wiped to remove surface moisture, dried in an oven at 80 ± 5°C for 48 h, and subsequently cooled to room temperature in a dry environment. After cooling, the sulfate dry-wet cycle tests were started. The specimen arrangement is shown in Fig. 3. The specimens were arranged with a minimum clear spacing of 20 mm between adjacent cubes and at least 20 mm between each cube and the side walls of the exposure chamber. One complete dry-wet cycle lasted 24 h, consisting of soaking (15 h, 25°C–30°C), draining and air drying (1 h, 25°C–30°C), oven drying (6 h, 80°C), and cooling (2 h, 25°C–30°C). Considering that RAC might suffer significant damage during the process, the maximum number of cycles was set to 120, and compressive strength tests were performed at intervals of 15, 30, 60, 90, and 120 cycles. It should be noted that the 0-cycle reference specimens were tested immediately after 28 days of standard curing and were not subjected to the 80°C thermal pre-conditioning, serving as a pure hydration baseline.
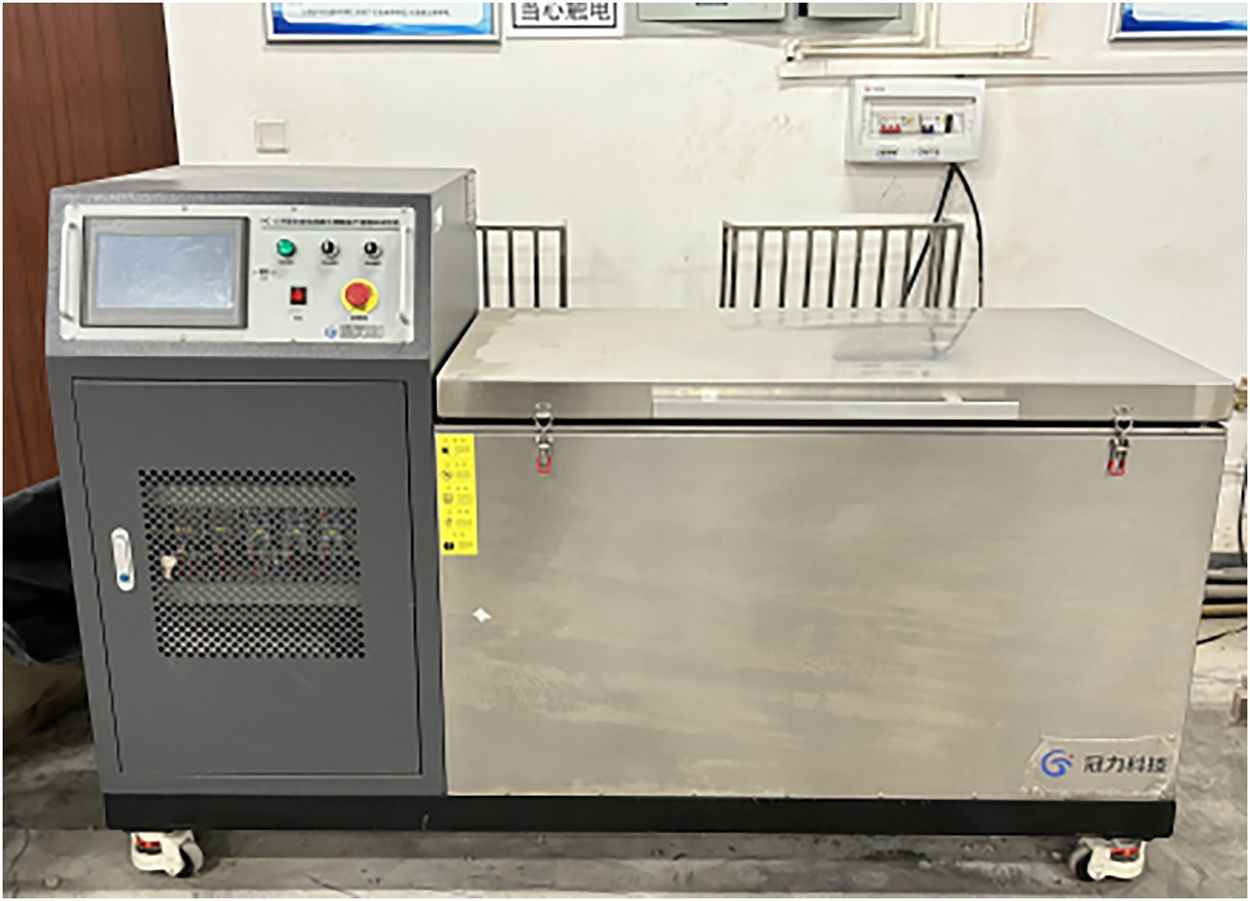
Figure 2: Experimental setup for sulfate wet–dry cycling of concrete specimens.
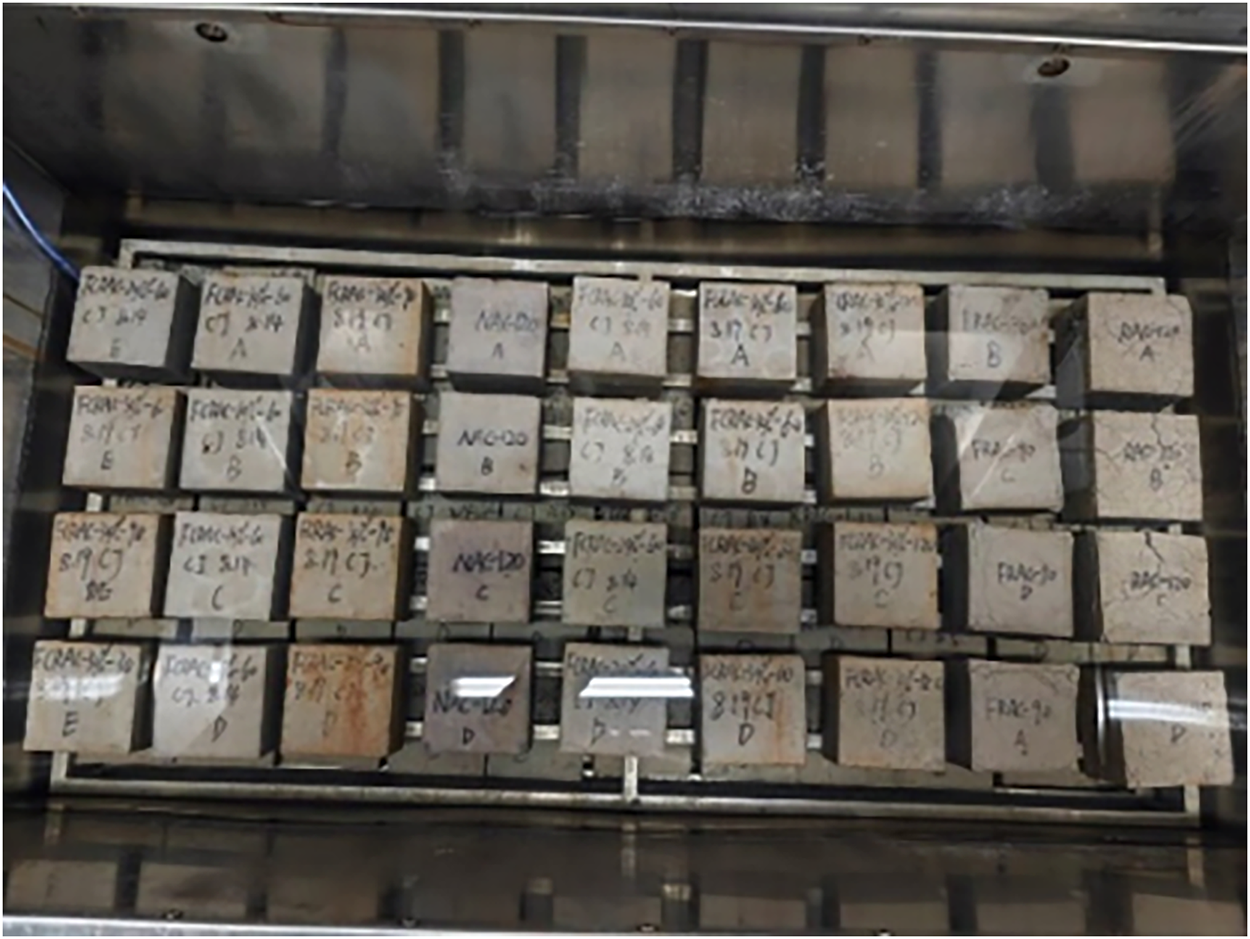
Figure 3: Placement of specimens and solution filling.
XRD analysis was conducted on RAC, FRAC-20%, CRAC-0.5, and FCRAC-20% specimens before sulfate exposure and after 30 and 60 sulfate wetting and drying cycles. Samples were collected from the bottom region of the 100 mm cubes, immersed in absolute ethanol for 48 h to stop hydration, dried at 105°C to constant mass, ground in a ceramic mortar, and passed through a 200 mesh sieve. Phase analysis was performed using a Rigaku Ultima IV diffractometer.
2.7 Scanning Electron Microscopy (SEM)
SEM characterization was conducted on selected specimens using a ZEISS Sigma 360 SEM to clarify the microstructural evolution and sulfate-induced deterioration characteristics of RAC modified through different approaches during repeated wet–dry sulfate cycles. Based on the macroscopic compressive strength test results, RAC, CRAC-0.5, and FCRAC-20% were selected as representative samples. The observation intervals were set after 0 sulfate dry-wet cycles, after 30 cycles, and after 60 cycles.
3 Machine Learning Methodology
3.1 Experimental Dataset and Input Variables
To establish a compressive strength prediction model that matches the experimental system of this study, a machine learning dataset was constructed entirely based on the aforementioned experimental results. A total of 99 samples were obtained after organization, including 54 samples under standard curing conditions and 45 samples under sulfate dry-wet cycle conditions. This study selected six variables as model inputs: carbonation time, carbonation pressure, RA replacement ratio, fly ash content, cycle number, and curing age. The output variable was compressive strength. The dataset uses two time-related variables. “Curing age” (0, 15, 30, 60, 90, 120 days) is measured from the start of exposure, which always follows a fixed 28-day standard cure; therefore the “0-day” point is the end of the 28-day cure and the true specimen age is (28 + curing age) days, i.e., 28–148 days. “Sulfate cycle number” encodes the wet–dry exposure, where one cycle equals one day. The encoding is: standard-curing observations have cycle number = 0 and curing age = 0–120 days; sulfate-exposure observations have cycle number = 15–120 and the days field equal to the cycle count. These input variables included both material composition and modification parameters, as well as environmental effects and time evolution information. Therefore, they could fully characterize the strength changes of RAC under standard curing and sulfate wetting-drying cycles.
Fig. 4 presents the correlation matrix between input parameters. Overall, the correlation coefficients between most variable pairs were low. This indicated that the input parameters had good statistical independence. Higher correlations mainly appear between carbonation time and carbonation pressure. This was related to the experimental design in this study, the carbonation specimens were uniformly carbonated for 24 h at different pressures. A correlation was observed between cycle number and curing age because these variables shared the same numerical observation points within the sulfate-exposed subset, with each cycle corresponding nominally to one day. By contrast, cycle number was fixed at 0 for all standard-curing observations. This relationship therefore arose from the experimental timing and temporal encoding adopted in the dataset. Except for the correlations caused by the experimental design mentioned above, there were no obvious strong linear correlations between other variables.
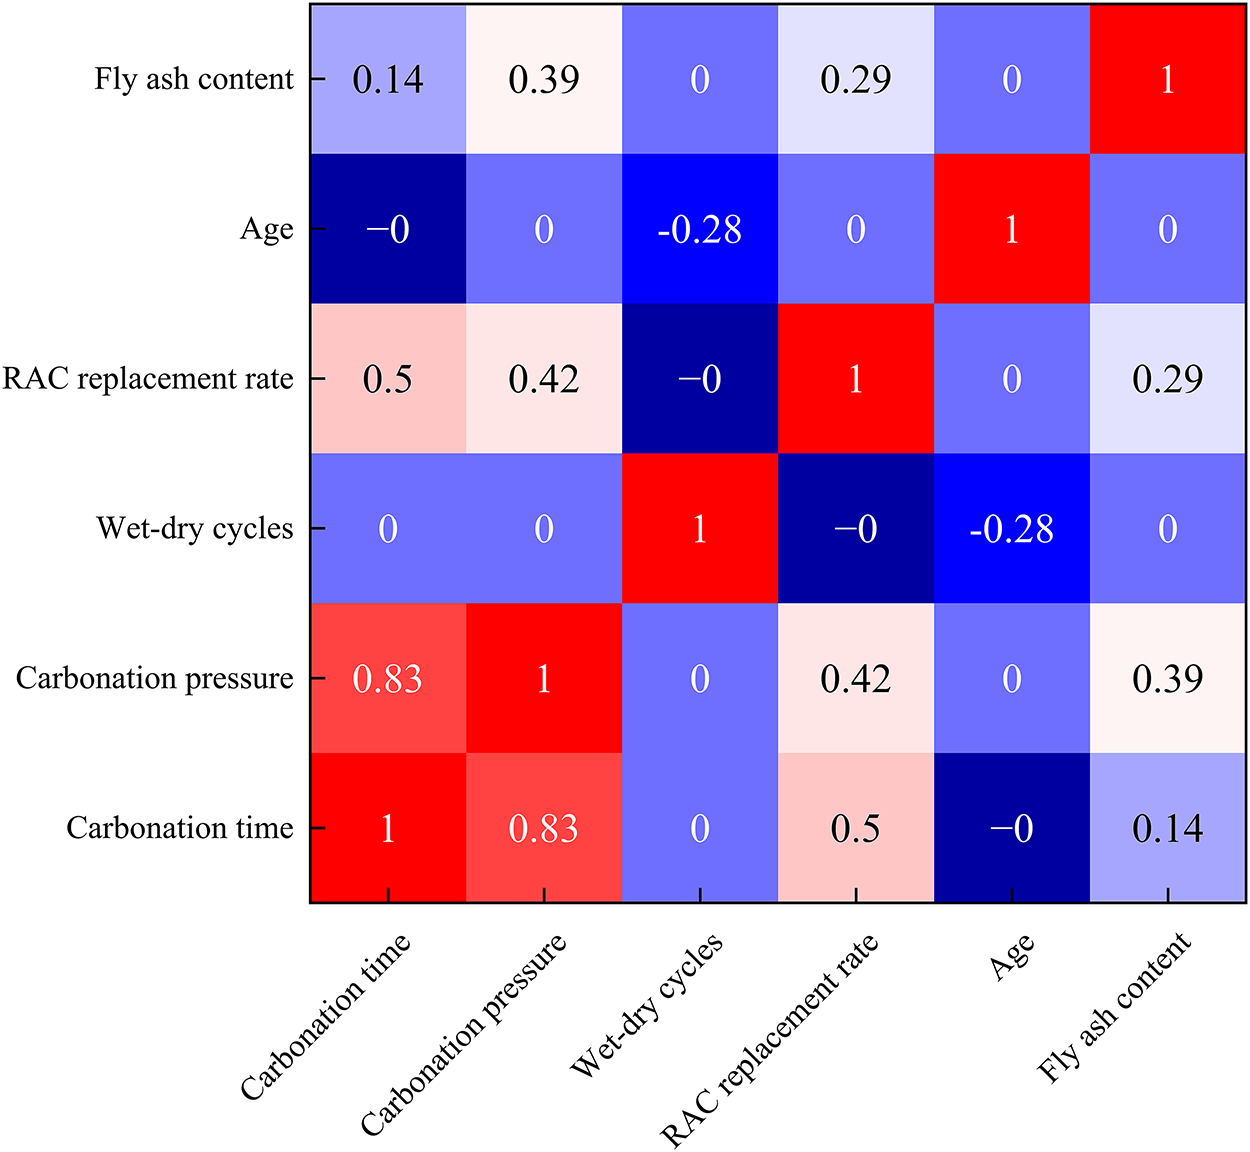
Figure 4: Correlation matrix among input parameters (0 and −0 indicate near-zero correlation coefficients after rounding, rather than exact zero correlations).
To effectively map the non-linear degradation and strength evolution of the concrete under varying environmental conditions, the machine learning framework utilises a combined CNN-LSTM architecture integrating convolutional and recurrent neural network components. The network ingests a 1D feature vector representing material composition, modification procedures, and environmental exposure duration. Specifically, the model incorporates six fundamental input variables to capture the testing environment: carbonation time, carbonation pressure, fly ash content, replacement rate of recycled coarse aggregate, sulfate wet-dry cycle number, and curing age. The singular target output variable predicted by the model is concrete specimen’s compressive strength.
The hybrid CNN-LSTM architecture leverages the spatial feature extraction capabilities of CNNs alongside the sequential pattern recognition strengths of LSTMs [37]. The initial phase of the model features a 1D-CNN layer that acts as a primary feature extractor. This layer filters the input vector to identify hidden local correlations amongst the diverse mix design variables and environmental parameters, transforming the raw input into higher-level, abstract feature maps. These abstracted feature maps are subsequently fed into the LSTM module. While LSTMs are traditionally utilised for sequential time-series data, in this modelling context, they excel at capturing the complex dependencies and non-linear interactions between the inherent material properties, such as carbonation and fly ash synergies, and the progressive deterioration induced by the wet-dry cycles. Finally, the output from the LSTM is flattened and fed into fully connected dense layers to carry out final regression task, mapping learned high-dimensional representations to the continuous compressive strength value.
Each sample is a length-six feature vector that is reshaped into an input tensor of shape (batch, 6, 1): six feature positions along the first axis and one channel. The network begins with a one-dimensional convolutional layer of 64 filters and kernel size 2 with ReLU activation and “same” padding, which slides along the feature axis to encode local interactions between adjacent input variables. A max-pooling layer then halves this axis. The pooled feature maps are passed to an LSTM layer of 50 units, followed by a fully connected layer of 32 neurons (ReLU) and a dropout layer with rate 0.2, and finally a single linear output neuron that regresses the compressive strength; predictions are constrained to the physically admissible range (0–55 MPa). We emphasise that this ordered axis is the feature axis, not physical time: the Conv1D–LSTM stack acts as a structured, parameter-sharing feature extractor over the input vector, while time information enters explicitly and correctly through the engineered variables “curing age” and “sulfate cycle number”. The network is compiled with the Adam optimiser at an initial learning rate of 0.001 and trained by minimising the mean squared error. As shown in Table 4, the model contains 24,857 trainable parameters; because this is large relative to the 69 training samples, over-fitting is controlled by dropout, early stopping on a held-out grouped inner-validation set, the bounded output, and by evaluating with mixture-aware cross-validation (Section 3.4).

3.3 Data Preprocessing and Dataset Partitioning
Prior to training, min–max normalisation was applied to scale all input features and the target compressive strength to the range [0, 1], preventing variables with large magnitudes (curing age and cycle number, up to 120) from dominating the gradient updates relative to small-valued variables (fly ash content, carbonation pressure). To avoid any information leakage, the scaler is fitted on the training partition of each cross-validation fold only and is then applied, unchanged, to the corresponding inner-validation and test data; no statistics of the test data enter the preprocessing step.
The 99 records originate from only nine mixtures, each evaluated at eleven curing/exposure stages, so a random row-wise split would place observations of the same mixture in both the training and test sets and overstate generalization. We therefore adopt mixture-aware cross-validation, using the mixture as the grouping unit so that all eleven observations of a mixture always fall within a single fold. Two protocols are used: leave-one-mixture-out (LOMO, nine folds), in which the model is trained on eight mixtures and tested on the entirely unseen ninth; and repeated three-fold grouped k-fold (six repeats) as a robustness check. Within each training partition, one further mixture was selected from the remaining outer-training mixtures, after exclusion of the outer test fold, as a grouped inner-validation set for early stopping and hyper-parameter selection; this fold-specific procedure ensured that the outer test mixture was never used during model selection and remained untouched until the final evaluation.
3.4 Hyperparameter Optimisation and Model Training Process
Hyper-parameters were selected by an exhaustive grid search over the number of convolution filters {32, 64}, LSTM units {32, 50}, dropout rate {0.1, 0.2}, and learning rate {1 × 10⁻³, 1 × 10⁻⁴} (16 configurations), with kernel size fixed at 2, dense width at 32, batch size at 8, the Adam optimiser, and a maximum of 200 epochs. Each configuration was scored by the root mean square error (RMSE) on the fold-specific grouped inner-validation set defined in Section 3.3, and the whole procedure used a fixed random seed of 42 with TensorFlow deterministic operations enabled.
The search confirmed that a learning rate of 1 × 10⁻³ is essential (all 1 × 10⁻⁴ configurations gave inner-validation RMSE ≈ 12–13 MPa vs. ≈ 6.5–8 MPa) and that the adopted configuration—64 filters, 50 LSTM units, dropout 0.2, learning rate 1 × 10⁻³—is statistically indistinguishable from the grid optimum. Software versions were Python 3.11, TensorFlow 2.21, scikit-learn 1.8, XGBoost 3.2 and SHAP 0.51, executed on CPU.
Training used mini-batches of eight samples for a maximum of 200 epochs. To guard against over-fitting, early stopping monitored the loss on the grouped inner-validation set and restored the best weights if no improvement occurred over 25 consecutive epochs. Because the inner-validation set consists of whole mixtures withheld from training, it is independent of both the training data and the outer test fold.
Model selection and early stopping therefore rely solely on the grouped inner-validation set, while the outer test fold is evaluated only once, after training is complete, and is never used for monitoring, tuning, or weight restoration. Generalization was quantified with the coefficient of determination (R2), mean absolute error (MAE) and mean absolute percentage error (MAPE), reported as distributions across the cross-validation folds rather than for a single split.
3.5 SHAP-Based Model Interpretation Method
SHAP values were used to quantify how the fitted CNN–LSTM attributed its predictions to carbonation time, carbonation pressure, RA replacement ratio, fly ash content, sulfate cycle number, and curing age. The attribution analysis was executed in MATLAB using a model agnostic Shapley value procedure. A representative background distribution was used to estimate the reference prediction, and feature attributions were calculated for the observations included in the interpretation analysis.
For feature j, the global attribution magnitude was calculated as follows:
where N denotes the number of interpreted observations and φij is the SHAP value assigned to feature j for observation i. The relative contribution percentage was then calculated as follows:
The resulting percentages describe the distribution of feature attribution within the fitted model. Their engineering interpretation was evaluated together with the independently obtained compressive strength results and SEM observations presented in Sections 4.2 and 4.4.
4.1 Compressive Strength Development under Standard Curing Condition
Fig. 5 and Table 5 show the compressive strength changes of each concrete group under continued curing conditions of 0, 15, 30, 60, 90, and 120 days after completing 28 days of standard curing. The 0-day group is the baseline after completing 28 days of standard curing. Overall, the strength of all specimens continuously increased with the increase in curing age. This indicates that continued hydration and later-stage densification were the dominant processes in this period. However, different modification methods had obvious differences in their effects on early strength, later-stage growth magnitude, and final strength levels.
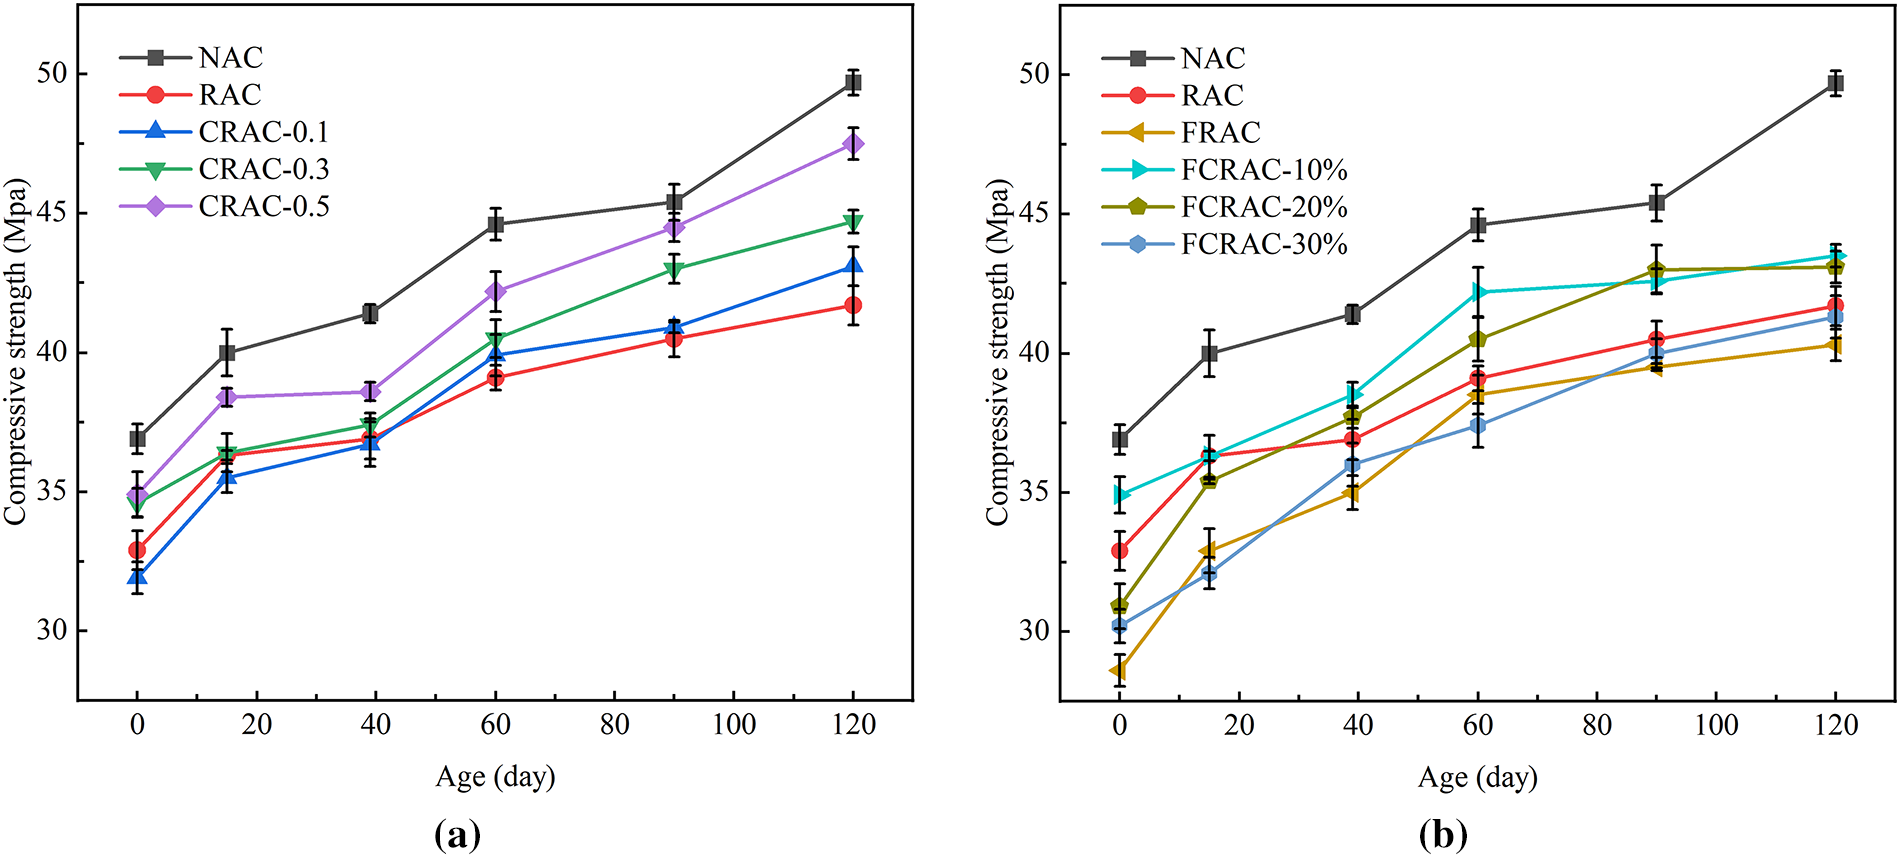
Figure 5: The compressive strength development under different curing ages (note: 0-day group is the baseline after completing 28 days of standard curing).
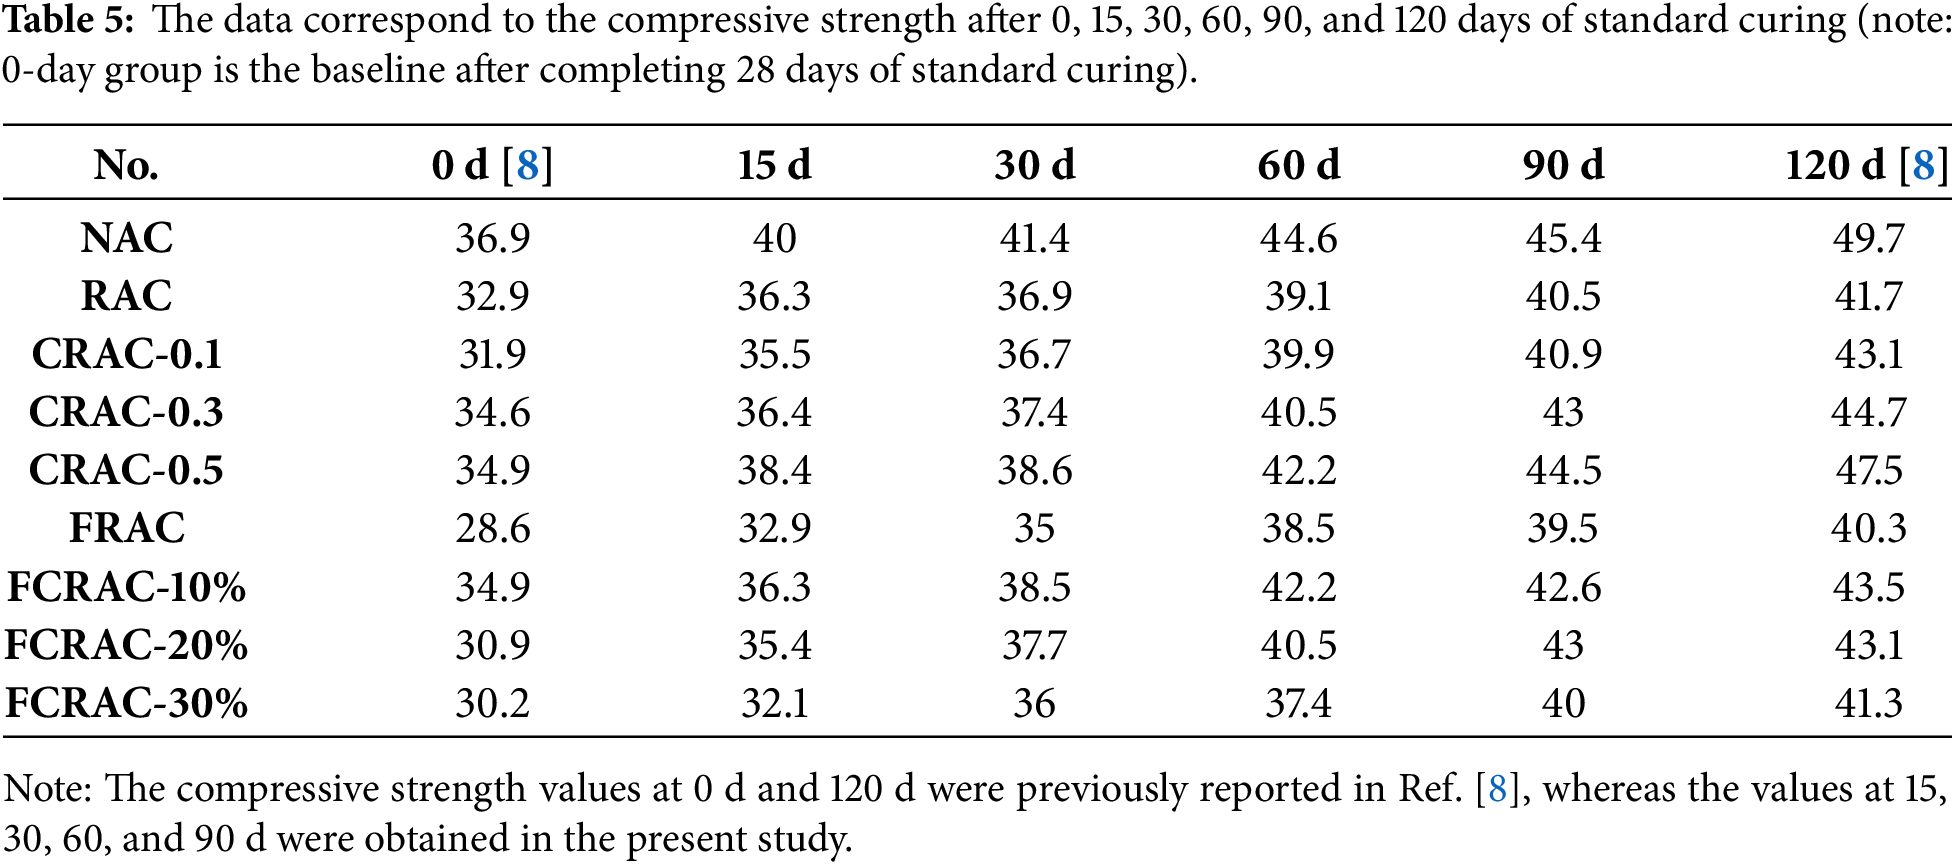
The natural aggregate concrete (NAC) group consistently maintained the highest strength level. Its 0-day, 60-day, and 120-day compressive strengths were 36.9, 44.6, and 49.7 MPa, respectively. The unmodified RAC group also showed a continuous increase in strength with curing age. However, the 0-day and 120-day strengths of RAC group were only 32.9 and 41.7 MPa, respectively, which decreased by approximately 10.8% and 16.1% compared with the NAC group. This indicates that the initial disadvantages from attached old mortar and interface defects on RA cannot be fully eliminated by conventional curing. After 120 days of curing, the groups treated at carbonation pressures of 0.1, 0.3, and 0.5 MPa reached compressive strengths of 43.1, 44.7, and 47.5 MPa, respectively. Among them, CRAC-0.5 differed from NAC by only 2.2 MPa (at 120 days). Its strength level reached approximately 95.6% of the NAC level. The enhanced mechanical properties of RAC should be attributed to the improved surface old mortar defects by high-pressure accelerated carbonation of RA.
The fly ash group FRAC showed the lowest early strength. Its 0-day strength was only 28.6 MPa. However, it increased to 40.3 MPa at 120 days. This shows that the latent reactivity of fly ash began to play a more significant role at middle and later ages. Among the combined-modification (fly ash + carbonation treatment) groups, FCRAC-10%, FCRAC-20%, and FCRAC-30% reached 43.5, 43.1, and 41.3 MPa at 120 days, respectively. These results indicate that under standard curing conditions, carbonation treatment had a more direct effect on strength improvement. The effect of fly ash was more stage-dependent: appropriate addition was beneficial for later stage structural refinement. However, excessive addition limited strength development due to insufficient early-stage hydration products. Therefore, among the modified RAC mixtures investigated, CRAC-0.5 achieved the highest compressive strength under standard curing.
4.2 Compressive Strength Evolution under Sulfate Dry-Wet Cycling
Fig. 6 and Table 6 illustrate the residual strength evolution of different concrete mixtures under sulfate wet–dry cycling. Unlike the continuous strength increase trend observed under standard curing conditions, the strength changes under sulfate wet-dry cycling showed obvious stage characteristics. During the 15 to 30 cycle stage, the strength decline in some groups was not significant. This was due to salt deposition within pores and local densification effects. Some specimens even showed slight strength recovery. However, after entering the 60-cycle stage, strength decay began to accelerate significantly. This was caused by crack propagation and the accumulation of expansive erosion products. Furthermore, the severity of the accelerated test protocol should be considered when interpreting these results. The repeated drying stages at 80°C prescribed by the standard promote the rapid precipitation of Na2SO4 and the associated crystallization pressure and may also generate thermal stresses. The resulting thermal fatigue may contribute to microcrack development, thereby facilitating sulfate ingress and accelerating overall deterioration.
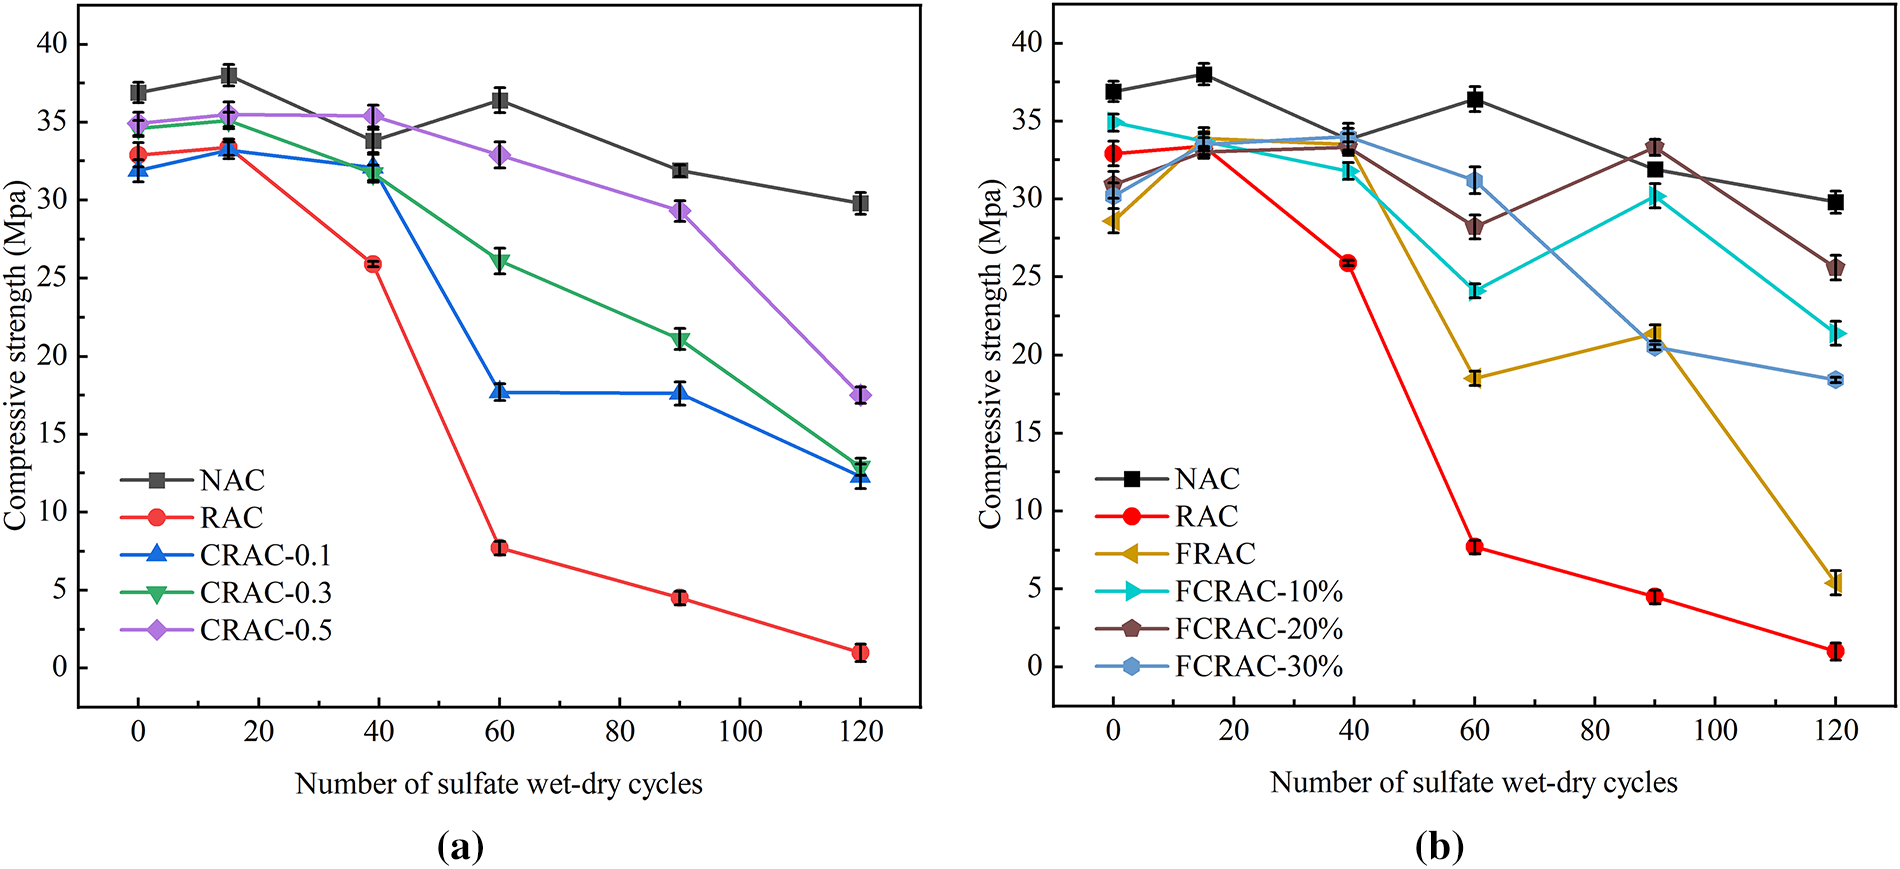
Figure 6: The compressive strength development under sulfate wet-dry cycles.
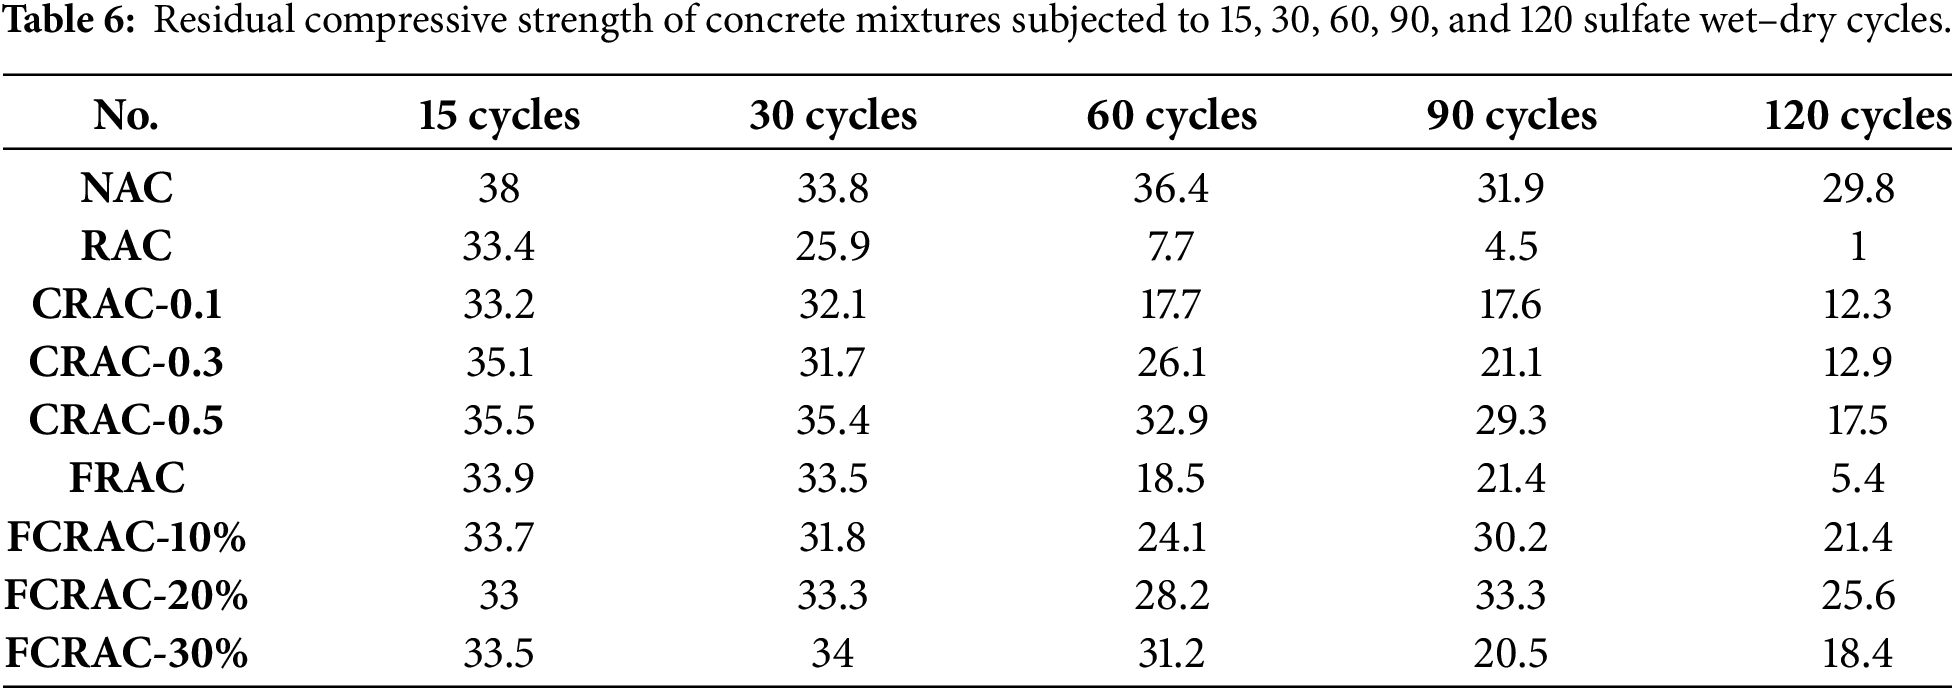
NAC maintained a strength of 29.8 MPa after 120 cycles. The strength retention rate was approximately 80.8%. This indicates that although the NAC also experienced sulfate attack, the overall structure remained relatively intact. Accordingly, NAC retained the highest compressive strength after 120 cycles among the mixtures investigated. In comparison, the strength of RAC rapidly decayed from 32.9 MPa at 0 cycles to 7.7 MPa after 60 cycles and to 1.0 MPa after 120 cycles. The specimen almost lost its effective load-bearing capacity. This shows that the high-porosity old mortar and weak interface in unmodified RAC provided efficient pathways for sulfate invasion and expansion damage.
Carbonation treatment noticeably improved this deterioration trend. Furthermore, the improvement effect generally increased with higher carbonation pressure. At the end of 120 sulfate wet–dry cycles, the carbonated aggregate groups retained compressive strengths of 12.3 MPa for CRAC-0.1, 12.9 MPa for CRAC-0.3, and 17.5 MPa for CRAC-0.5. Among them, CRAC-0.5 showed the highest measured strength among the tested groups. This indicates that more complete carbonation can more effectively densify old mortar and reduce ion transmission along paths containing old mortar. However, there is still a gap compared to NAC. In comparison, the fly ash single addition group FRAC maintained strengths of 33.9 and 33.5 MPa at 15 and 30 cycles, respectively. However, strength dropped to only 5.4 MPa after 120 cycles. This shows that relying solely on fly ash can delay early and middle-stage deterioration but cannot fundamentally compensate for the inherent defects of RA.
Within the investigated mixture matrix, the combined-treatment groups generally performed better than the single-treatment groups. After 120 cycles, FCRAC-10%, FCRAC-20%, and FCRAC-30% retained strengths of 21.4, 25.6, and 18.4 MPa, respectively. Among them, FCRAC-20% showed the highest strength at 120 cycles. Its strength retention rate reached 82.8%, which was even slightly higher than NAC’s 80.8%. Meanwhile, FCRAC-30% maintained 31.2 MPa at 60 cycles, while the strength dropped significantly after 90 cycles. This indicates that excessive fly ash content is not beneficial for long-term stability. Considering absolute strength, strength retention rate, and late stage decay stability, FCRAC-20% showed the most favorable overall response among the three combined modification levels investigated. This behavior can be attributed to the combined effects of carbonation treatment and fly ash incorporation on the old mortar and new paste zones. Accordingly, FCRAC-20% achieved the highest compressive strength retention among the investigated combined modification mixtures under the adopted accelerated sulfate wetting and drying protocol.
The durability assessment in this study focused primarily on compressive strength retention and degradation, supported by SEM observations. Although compressive strength directly reflects residual load-bearing capacity, complementary indicators, such as mass change, expansion, dynamic modulus, ultrasonic pulse velocity, visible damage rating, and sulfate penetration depth, should be incorporated in future studies to provide a more comprehensive characterization of the associated physical and chemical degradation processes.
4.3 X Ray Diffraction Phase Analysis
Fig. 7 presents the XRD patterns of the four representative mixtures. Before sulfate exposure, reflections assigned to quartz and portlandite were observed in all mixtures, while calcite reflections were more pronounced in CRAC-0.5 and FCRAC-20%, supporting the carbonation of the adhered old mortar. After 30 cycles, reflections assigned to gypsum and ettringite appeared and were most evident in RAC. Because calcium silicate hydrate is poorly crystalline, its development was assessed indirectly rather than assigned to a discrete XRD peak.
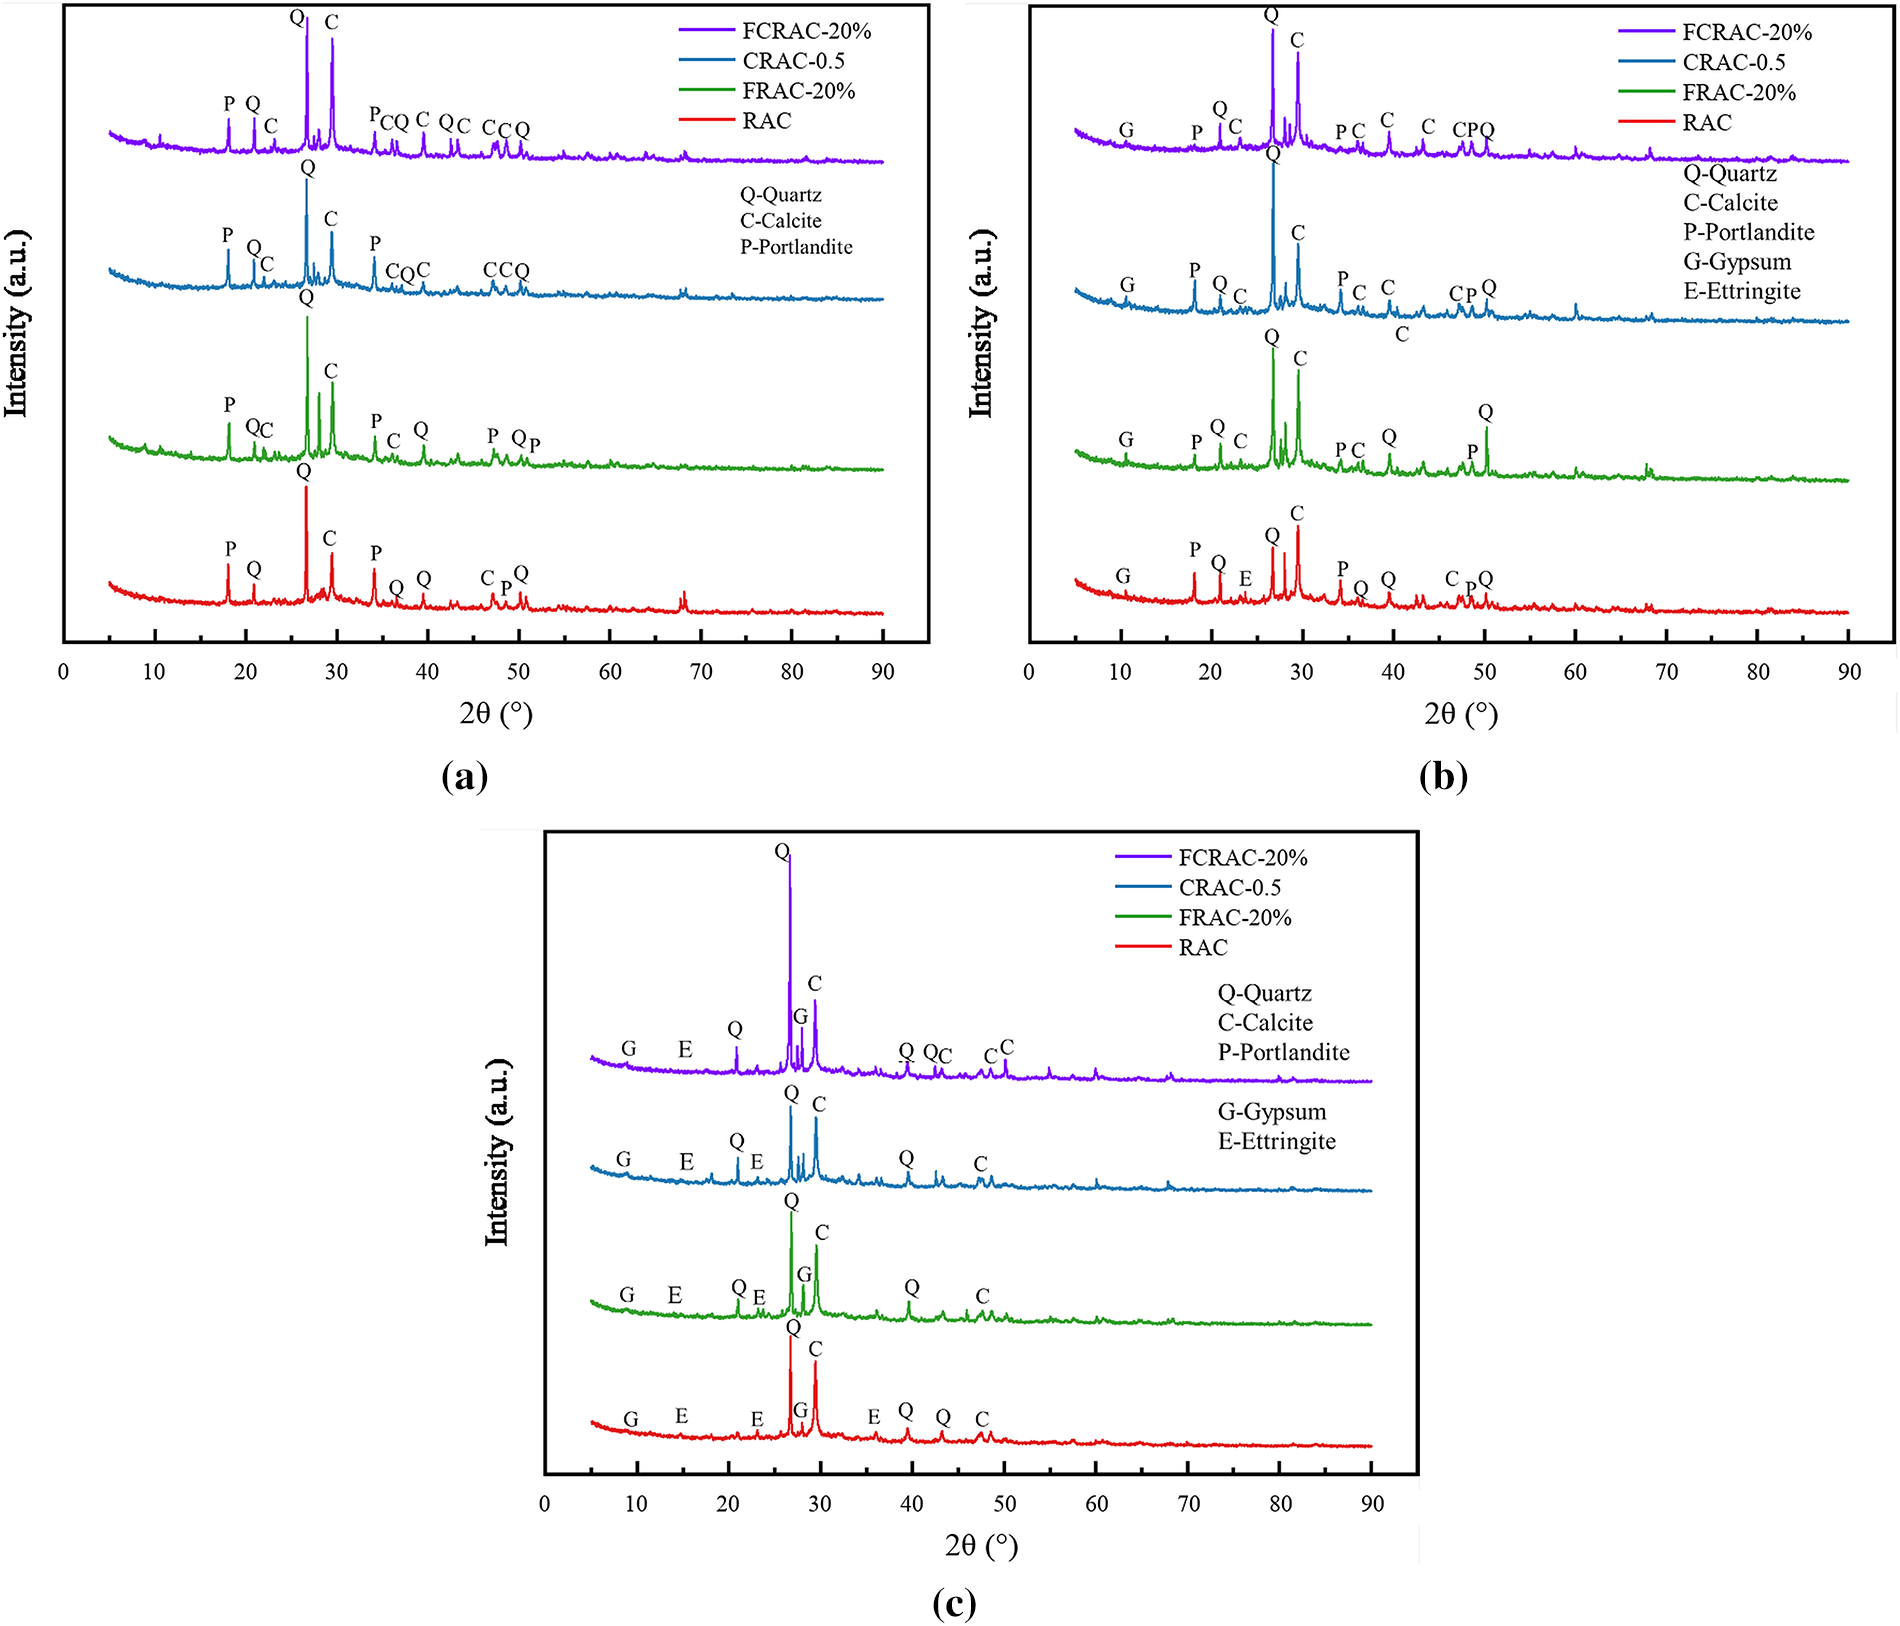
Figure 7: XRD patterns of RAC, FRAC-20%, CRAC-0.5, and FCRAC-20% at (a) 0, (b) 30, and (c) 60 sulfate wetting and drying cycles.
After 60 cycles, the reflections assigned to sulfate reaction products increased further, following the qualitative order RAC > FRAC-20% > CRAC-0.5 > FCRAC-20%. The weaker gypsum and ettringite reflections in FCRAC-20% were consistent with its higher compressive strength retention and denser SEM morphology, providing phase evidence for the combined effect of carbonation treatment and fly ash.
Imaging was performed in high vacuum using an SE2 secondary electron detector at an accelerating voltage of 3.00 kV and an aperture diameter of 30 μm. Micrographs were acquired at 1000× and 20,000×, with working distances ranging from 8.2 to 11.0 mm; the original calibrated scale bars were retained in all revised panels. For each selected mixture and exposure interval, at least five spatially separated fields were examined and recorded at 1000×, followed by examination of at least three distinct subregions at 20,000×. The panels presented in Fig. 8 were selected from the recorded images according to their relevance to the specified observation targets, including the interface condition, crack morphology, paste compactness, and sulfate reaction products.
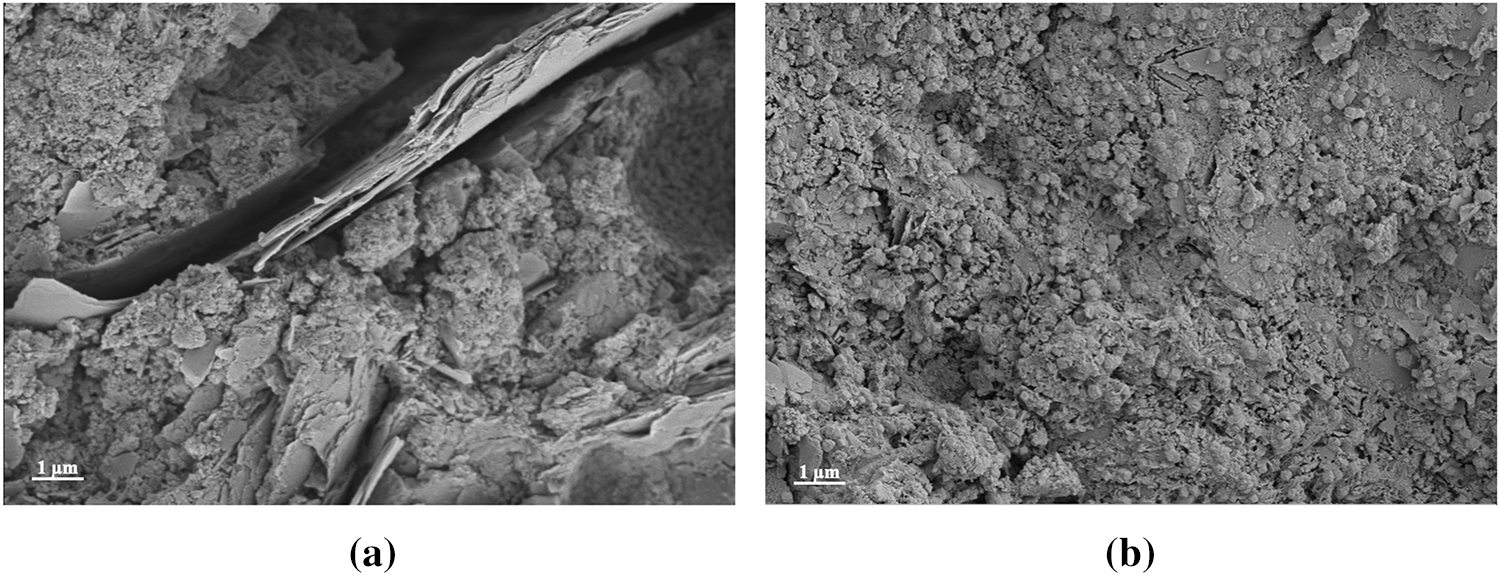
Figure 8: Surface microstructure of adhered mortar on recycled aggregates: (a) untreated recycled aggregate; (b) recycled aggregate after 0.5 MPa carbonation.
Fig. 8 presents the surface morphology of the adhered old mortar on recycled aggregates before carbonation and after treatment at 0.5 MPa, corresponding to RA and CRA-0.5, respectively. As shown in Fig. 8a, RA surfaces exhibited obvious through-going cracks and loose hydrated products. This is attributed to the crushing and sieving processes of the waste concrete. In CRA-0.5 specimens shown in Fig. 8b, local cracks were still observable, but the crack widths were narrower. Lots of CaCO3 particles were observed adhering to the edges of aggregate cracks. Compared to RA, the loose regions in CRA-0.5 decreased. The CaCO3 generated by carbonation deposition occurred near pores and cracks, partially filling micro-cracks, resulting in a more continuous aggregate surface and a denser overall morphology.
To further explain the macroscopic strength evolution patterns, RAC, CRAC-0.5, and FCRAC-20% were selected using a targeted approach informed by the compressive strength results. RAC represented the untreated reference, CRAC-0.5 represented the most effective carbonation only mixture among the carbonation pressures investigated, and FCRAC-20% represented the combined modification with the highest late stage strength retention among the combinations investigated. This targeted selection provided a clear comparison among the untreated, carbonation treated, and combined modification states. However, because it was informed by the macroscopic results and did not include all nine mixtures, it may introduce selection bias. Accordingly, the SEM observations are interpreted as qualitative mechanistic evidence supporting the measured strength trends rather than as a statistical representation of the complete mixture matrix. The SEM images are shown in Fig. 9.
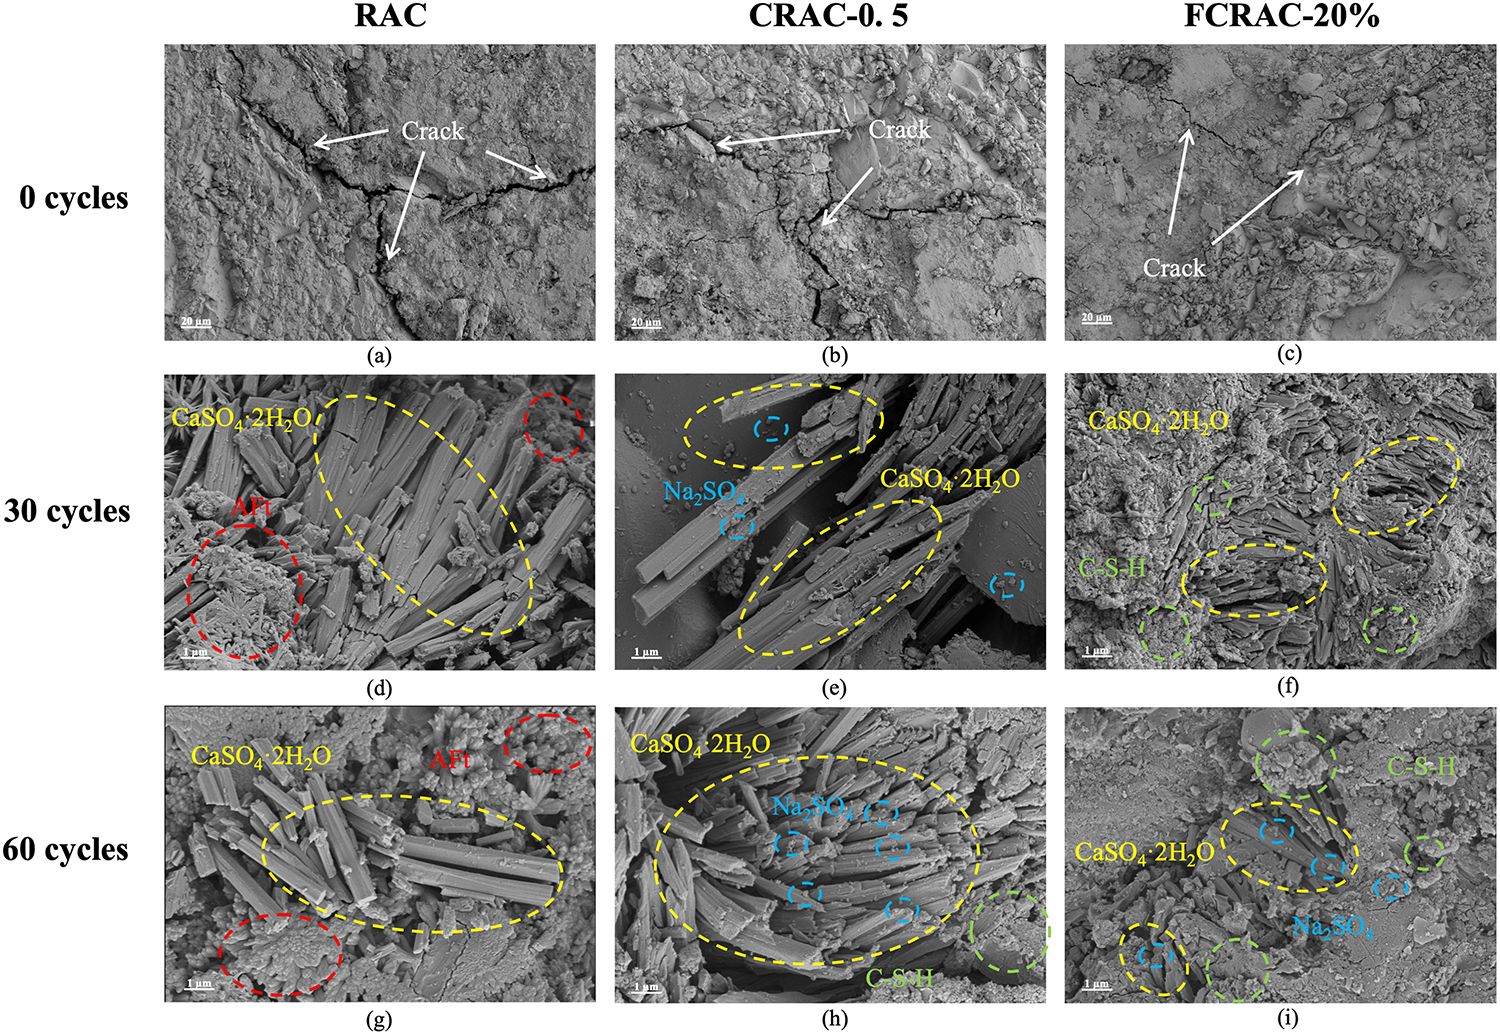
Figure 9: SEM morphology of RAC, CRAC-0.5, and FCRAC-20% before sulfate exposure and after 30 and 60 cycles: (a–c) 0 cycles at 1000×; (d–f) 30 cycles at 20,000×; and (g–i) 60 cycles at 20,000×.
Prior to wet-dry cycling, RAC surfaces exhibited the most obvious cracks, which were continuous and interconnected, with locally loose mortar matrix (Fig. 9a). In contrast, FCRAC-20% surfaces were denser with finer cracks, and inter-particle cement connections appeared more continuous (Fig. 9c).
After 30 wet-dry cycles, obvious needle-like or platelet-like prismatic erosion products were observed in all three specimen groups. Based on sulfate erosion mechanisms, these expansive products were identified primarily as gypsum. As clearly shown in Fig. 9d, RAC generated abundant columnar gypsum crystals, with needle-like Aft nucleating at crystal tips. The denser and coarser crystal bundles indicate that SO42− ions had rapidly penetrated into the interior along cracks and connected pores, reacting with reactive phases.
Although erosion products were also observed in CRAC-0.5, Fig. 9e revealed that abundant gypsum was still present, with ettringite not clearly detected. Na2SO4 crystals were adhered to the gypsum surfaces, and erosion products were distributed around local cracks and pores. However, the surrounding matrix remained largely intact, demonstrating certain sulfate resistance compared to RAC. In contrast, based on Fig. 9f, for FCRAC-20%, erosion products were interwoven with the matrix. The paste surrounding the products was denser, accompanied by C-S-H gel. Columnar gypsum crystals appeared more orderly, with no Na2SO4 crystals observed on their surfaces. Overall, the structure was denser than that of the other two groups. Considering the strength variations after 30 cycles, RAC exhibited a noticeable decline in compressive strength, whereas CRAC-0.5 and FCRAC-20% showed relatively gradual strength changes.
Based on Fig. 9g, after 60 cycles, large-sized needle-like prismatic crystals in RAC underwent further aggregation, with crystals growing in interlaced patterns. As clearly observed, the tops of abundant columnar gypsum crystals were covered with needle-like Aft. Pores and cracks became more obvious, and the microstructural degradation was consistent with the rapid strength decline following 60 cycles. For CRAC-0.5 specimens (Fig. 9h), a considerable amount of erosion products could still be observed. However, the overall matrix damage degree was lower than that of RAC, resulting in significantly better strength retention capability. For FCRAC-20% specimens after 60 cycles (Fig. 9i), columnar gypsum crystals remained relatively orderly. Although Na2SO4 crystals began to adhere to the surfaces, the overall structure remained denser than that of the other two groups. This corresponds to its superior strength and enhanced sulfate resistance performance.
Combined SEM with strength variation analyses indicate that RAC, characterized by abundant initial cracks and loose microstructure, readily generated extensive gypsum and needle-like ettringite following wet-dry cycling, leading to rapid strength deterioration. CRAC-0.5 exhibited relatively mitigated strength decline after sulfate exposure due to the filling effect of carbonation products. In FCRAC-20%, fly ash particles and hydration products collectively enhanced paste densification, enabling the retention of a more intact microstructure despite the formation of certain erosion products; consequently, it demonstrated superior sulfate resistance performance. These findings align with macroscopic strength test results from this study, which showed the most significant deterioration in RAC, moderate improvement in CRAC-0.5, and optimal overall performance in FCRAC-20%.
4.5.1 Prediction Accuracy and Experimental Consistency
Model generalization was evaluated primarily using leave one mixture out grouped cross validation. Fig. 10 presents the pooled out-of-fold predictions of the CNN–LSTM under this validation protocol. Based on the pooled out of fold predictions, the CNN–LSTM achieved an R2 of 0.76, an RMSE of 4.67 MPa, an MAE of 3.23 MPa, and a MAPE of 30.0%. Across the nine held out mixtures, the mean per mixture RMSE was 4.10 ± 2.23 MPa. For the eight recycled aggregate mixtures, the held out R2 values ranged from 0.43 to 0.98. NAC produced an R2 of −0.49 and represented the clearest extrapolation along the RA replacement dimension because its RA replacement ratio was 0%, whereas this feature was 100% for all mixtures available in its corresponding training fold.
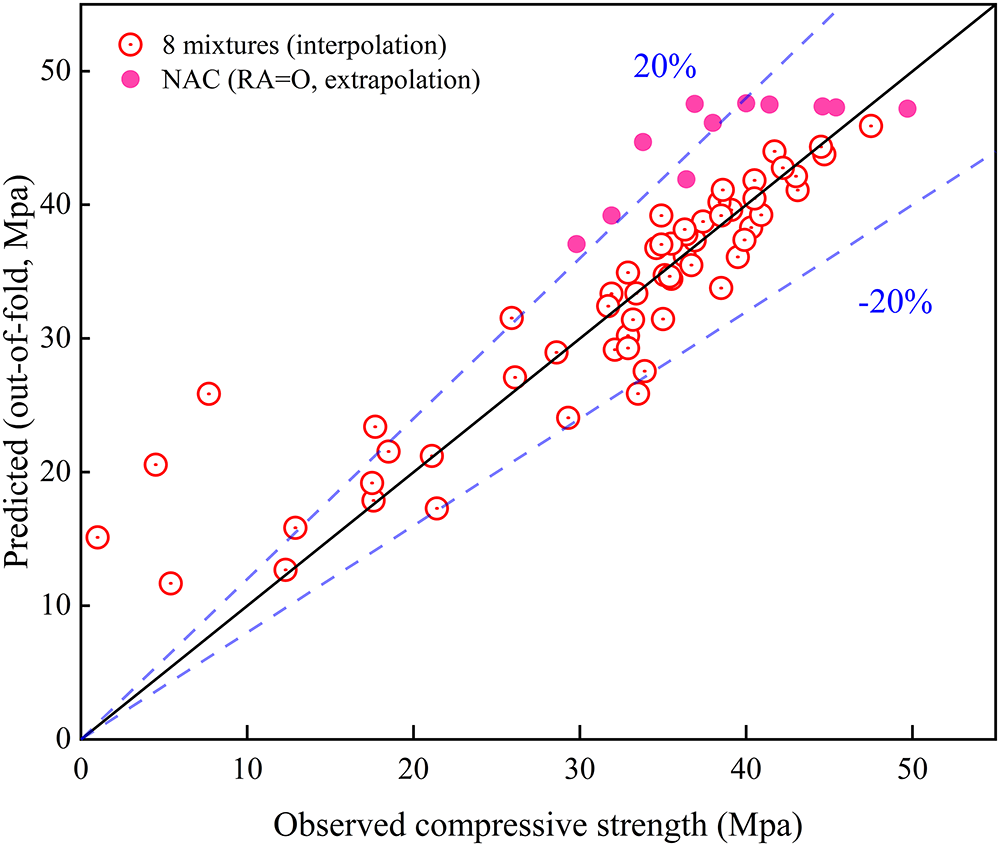
Figure 10: Out of fold predictions of the CNN–LSTM under leave one mixture out grouped cross validation. Blue markers represent the eight recycled aggregate mixtures, while red markers represent NAC, the clearest extrapolation along the RA replacement dimension. The solid line indicates y = x, and the shaded region represents the ±20% error band.
A benchmark against seven alternative models was conducted using the same grouped protocol and preprocessing procedure. As shown in Table 7 and Fig. 11, the CNN–LSTM achieved the highest R2 and the lowest RMSE and MAE among the eight models. It did not produce the lowest MAPE: XGBoost and random forest achieved MAPE values of 23.0% and 27.1%, respectively, compared with 30.0% for the CNN–LSTM. Because MAPE assigns greater weight to errors at low measured strengths, it was particularly sensitive to severely deteriorated specimens. The comparison was therefore based jointly on R2, RMSE, MAE, and MAPE. Within the investigated dataset, the CNN–LSTM provided the most favourable overall balance of explained variance and absolute error, while XGBoost showed the lowest relative percentage error.
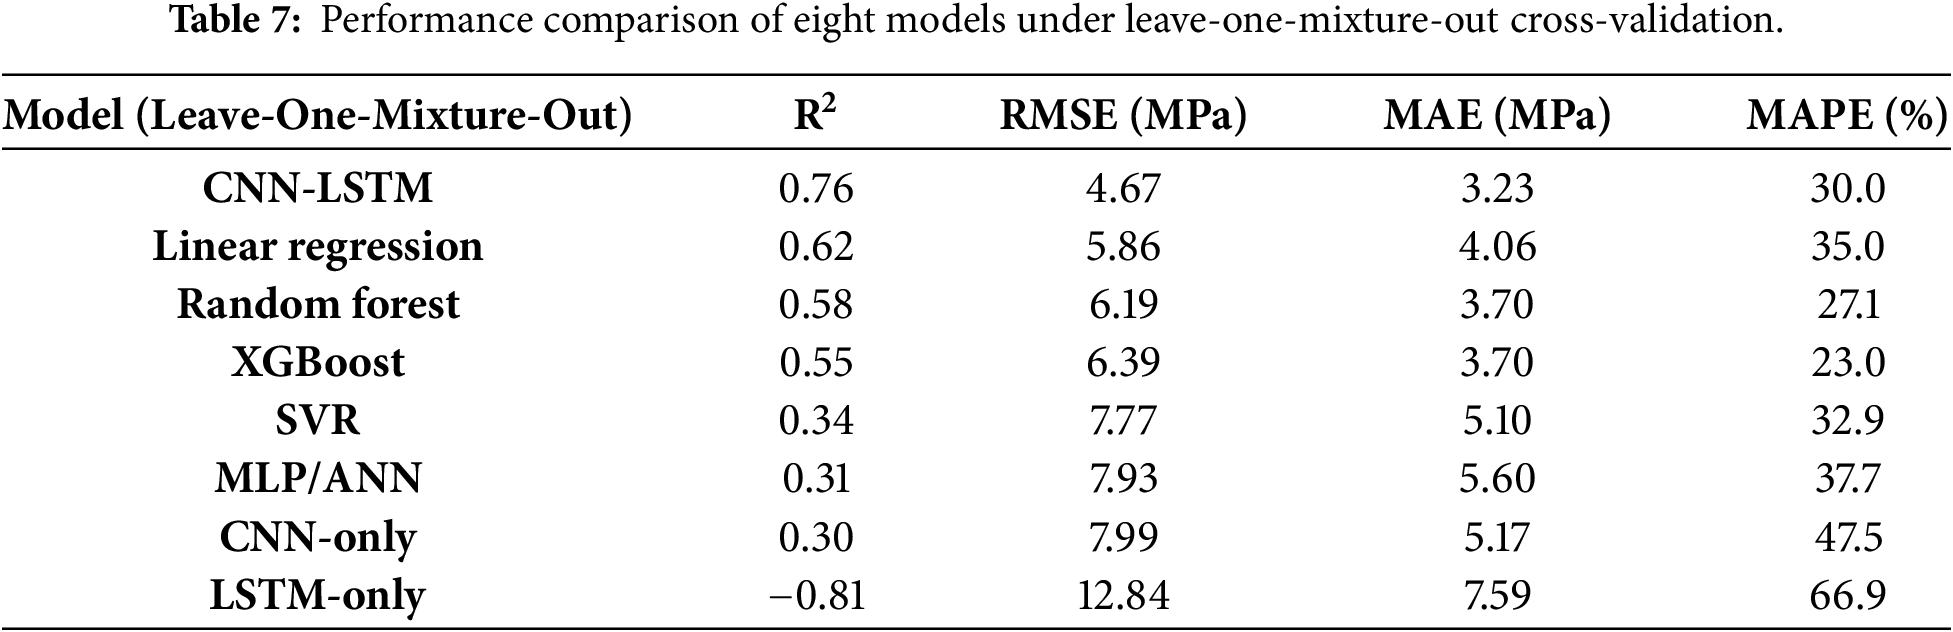
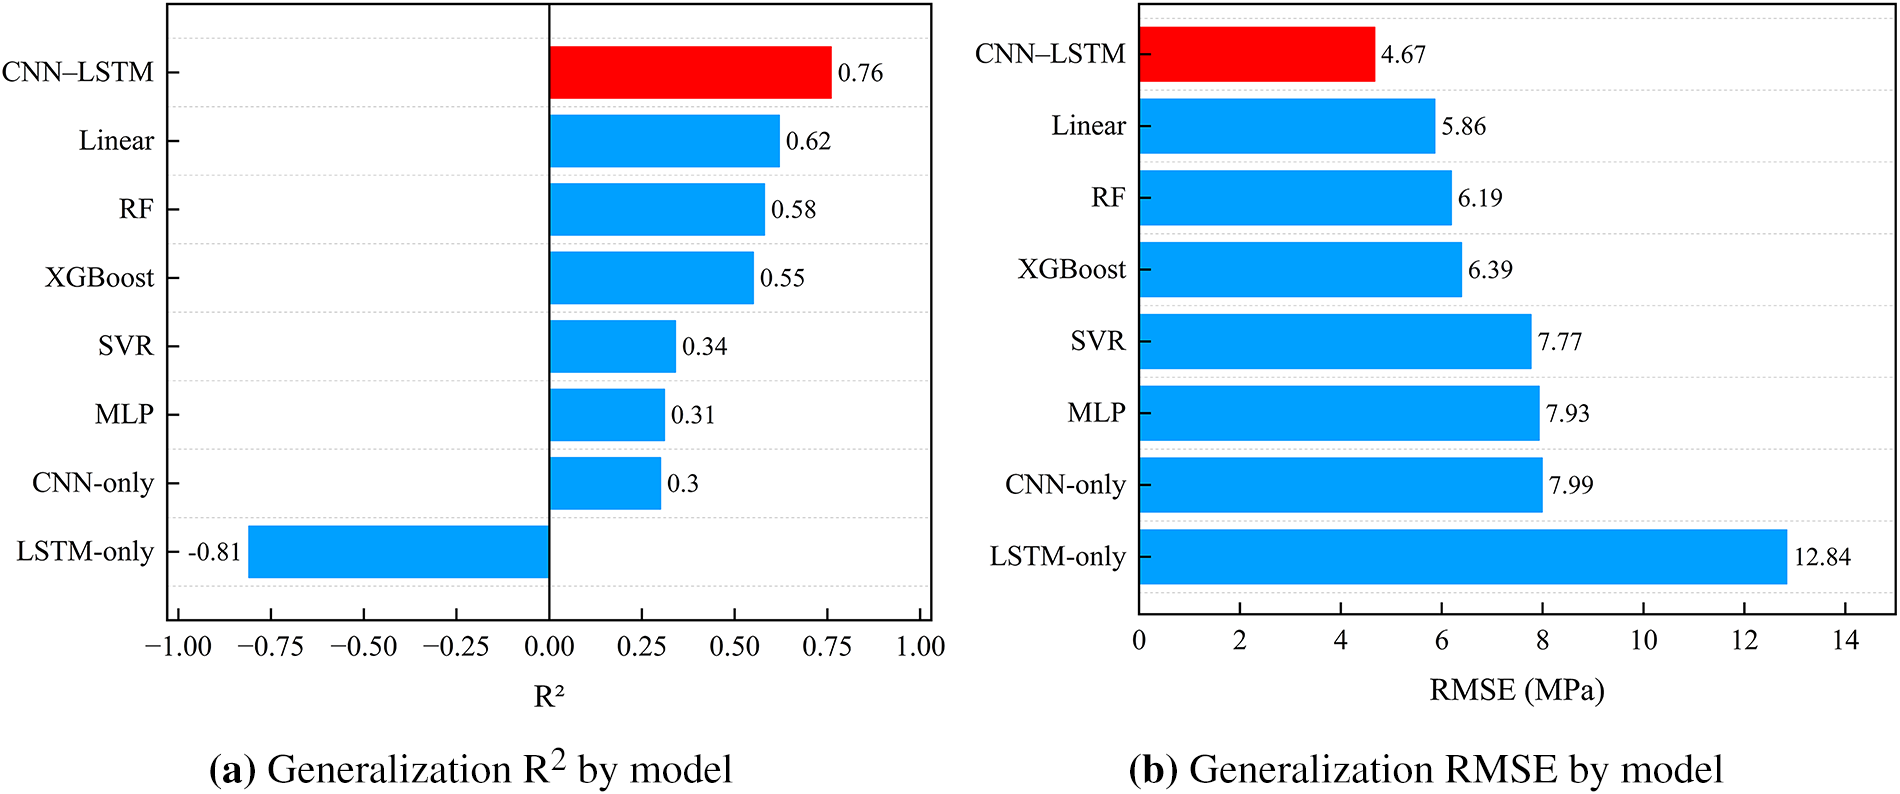
Figure 11: Generalization R2 and RMSE of the eight models under leave-one-mixture-out cross-validation.
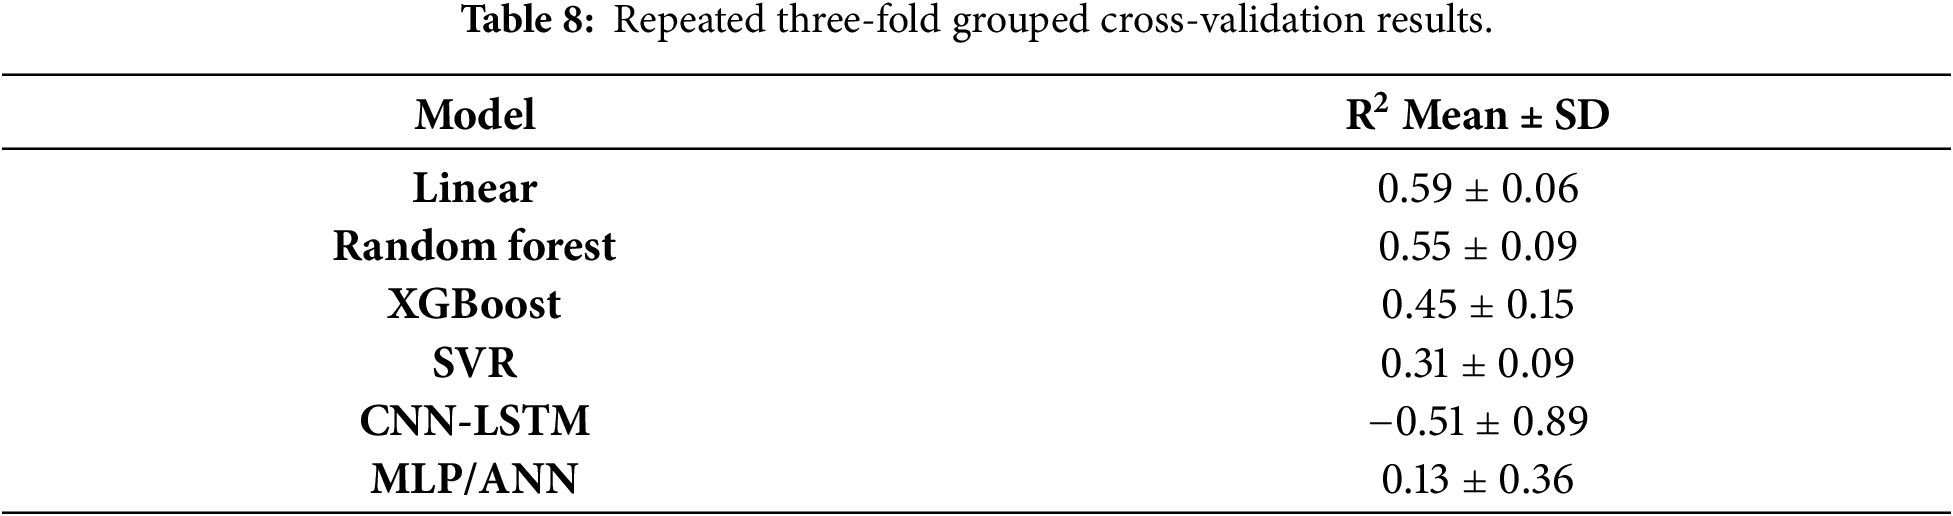
Robustness under reduced training support was further examined using repeated three-fold grouped cross validation with six repeats. Results were available for the six models listed in Table 8. Linear regression achieved the highest mean R2 of 0.59 ± 0.06, followed by random forest at 0.55 ± 0.09, XGBoost at 0.45 ± 0.15, SVR at 0.31 ± 0.09, and MLP/ANN at 0.13 ± 0.36. The CNN–LSTM produced a mean R2 of −0.51 ± 0.89 under this more restrictive protocol. With only six mixtures in each outer training pool, coverage of the experimental feature space was reduced and the CNN–LSTM became more sensitive to group allocation. These results support the use of LOMO as the primary assessment with maximum available mixture support, while the repeated grouped analysis provides a complementary stress test under more limited training coverage.
As shown in Table 9, the CNN-LSTM produced training R2, RMSE, MAE, and MAPE values of 0.940, 2.30 MPa, 1.59 MPa, and 7.01%, respectively, and corresponding testing values of 0.930, 2.60 MPa, 1.49 MPa, and 5.90%. The R2 values for both subsets remained above 0.93, indicating satisfactory fitting agreement within the sample range of this study. The comparable metrics between the two subsets indicate consistent fitting performance under this particular random split. The grouped leave one mixture out validation reported above is used as the primary assessment of model generalization.

Fig. 12 presents the distribution of measured values, predicted values, and their corresponding errors in both training and test sets. Overall, the predicted curve closely followed the measured curve in the test set. Particularly within the primary strength range of 30–45 MPa, the predicted values aligned well with the measured values, demonstrating that the model possessed strong predictive capability for the main distribution interval within the dataset.
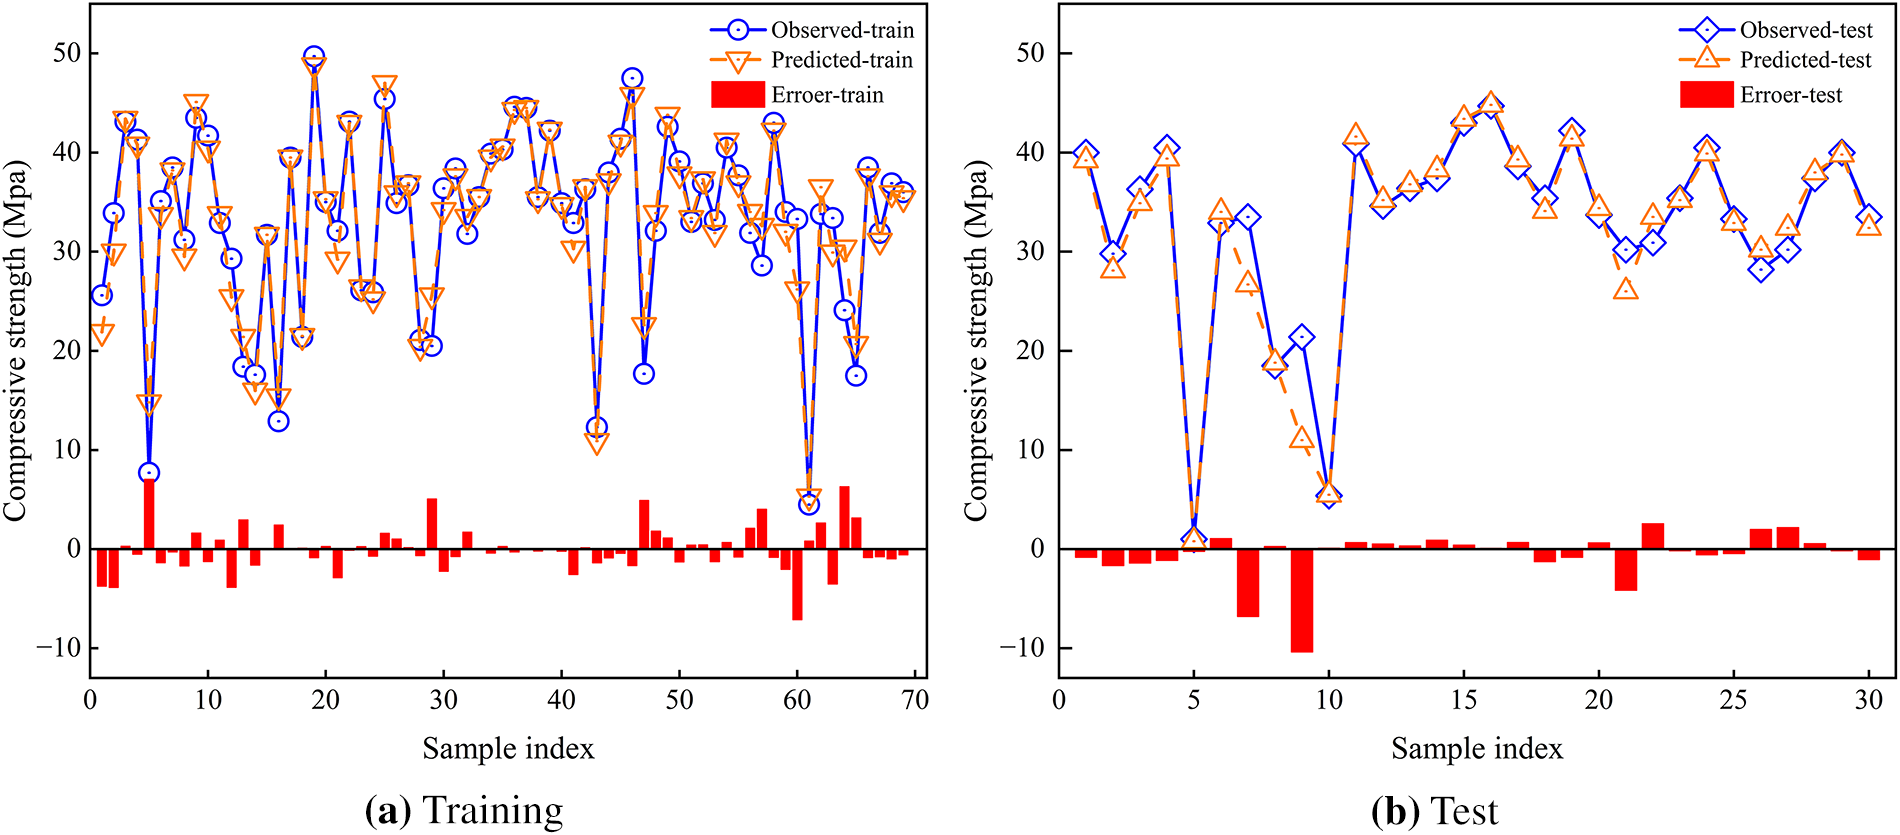
Figure 12: Comparison between observed and predicted compressive strength using CNN-LSTM model.
Fig. 13 illustrates the comparative relationship between observed and predicted values in the training and test sets. The majority of predicted points were concentrated in the vicinity of the y = x line, with most samples falling within the ±20% error band. This indicates that the model was capable of effectively capturing the variation trends of compressive strength under different mix proportions, curing and erosion stages, as well as modification conditions. The data points exhibiting relatively larger deviations primarily occurred in the low strength range, which could be attributed to sudden cracking, spalling, and nonlinear instability induced by sulfate attack in the later stages.
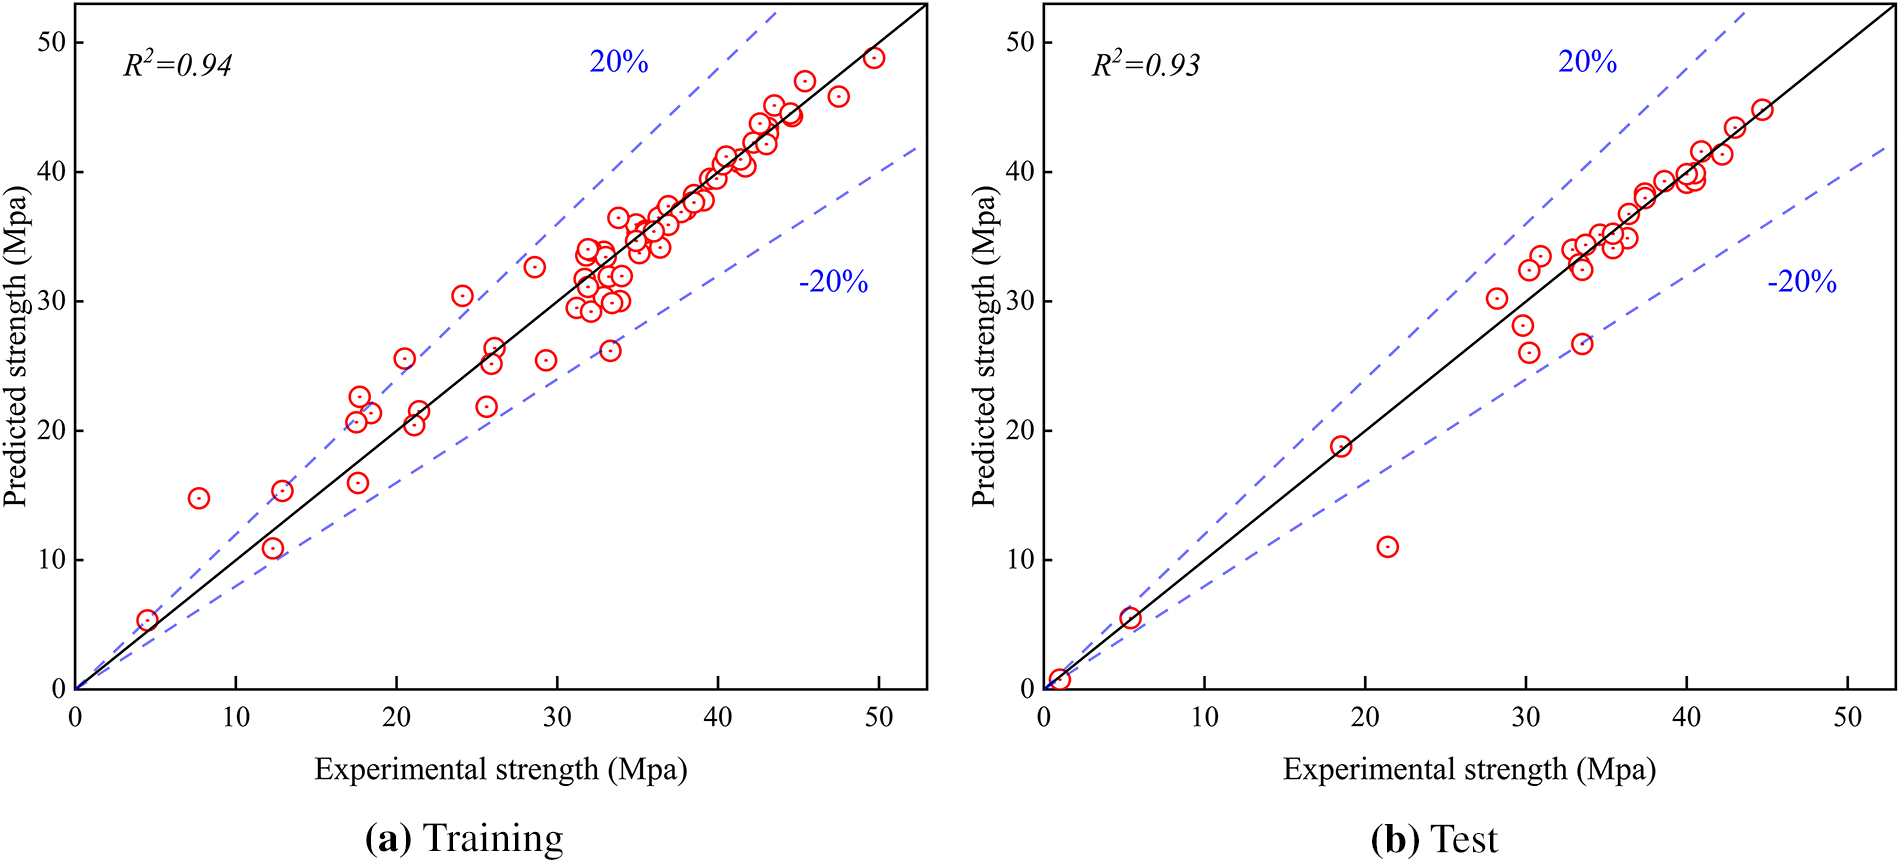
Figure 13: Regression performance of the CNN–LSTM model for RAC compressive strength prediction in the training and test datasets.
Fig. 14 presents the mean absolute SHAP contribution of each input variable. The sulfate cycle number exhibits the highest contribution (53.0%), confirming that the wet–dry exposure history dominates the strength response. Curing age (13.6%), RA replacement ratio (10.3%), carbonation pressure (9.9%), carbonation time (6.7%) and fly ash content (6.5%) follow, so that continuous hydration, the use of recycled aggregate and the degree of carbonation treatment constitute the secondary group of influential variables. This ranking is consistent with the earlier configuration in which the cycle number was likewise dominant.
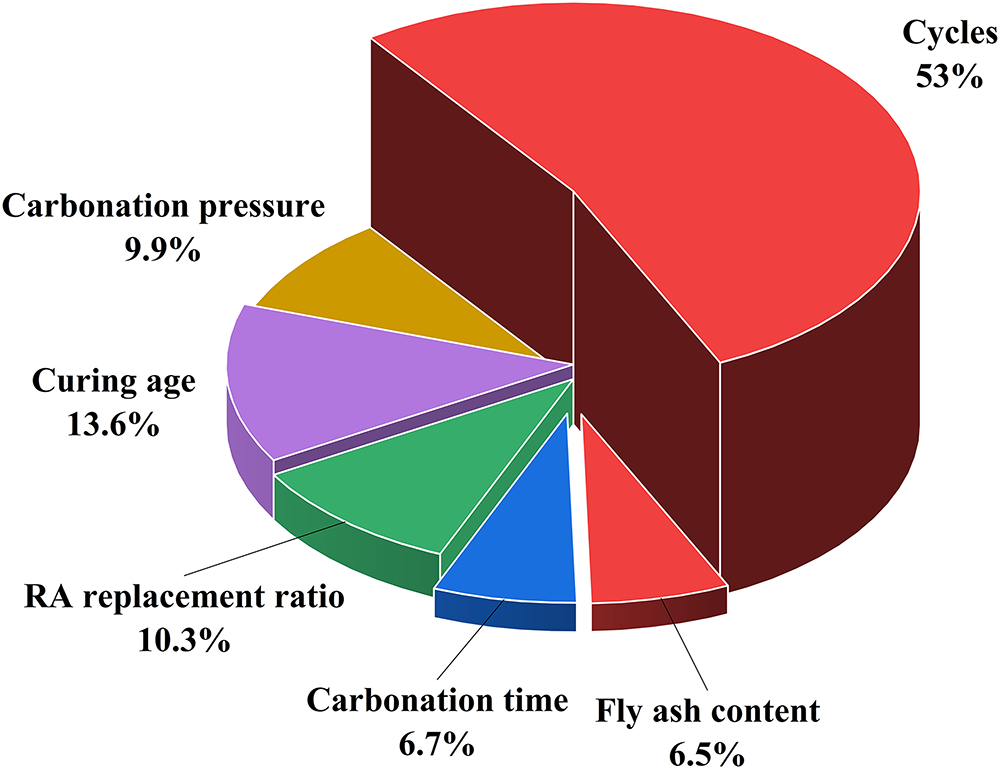
Figure 14: Relative contributions of input variables to compressive strength prediction based on SHAP analysis.
Fig. 15 further illustrates the directional impact and distribution characteristics of each input variable. Larger cycle numbers were typically associated with negative SHAP values, indicating that compressive strength diminished as sulfate wet-dry cycling progresses. Conversely, greater curing ages predominantly exhibited positive SHAP values, reflecting the enhancing effect of sustained hydration during the standard curing period on the strength. Higher carbonation pressures generally corresponded to positive contributions, which aligns with the higher strength retention performance observed in the CRAC-0.5 and FCRAC groups during experiments. When the RA replacement ratio increased from 0% to 100%, SHAP values predominantly shifted toward the negative domain, revealing the disadvantages conferred by the high-porosity adhered mortar and weak ITZs associated with RA. For fly ash, SHAP values spanned across zero and exhibit a discrete distribution pattern, indicating that its influence demonstrated significant stage-dependence and conditionality: moderate incorporation could improve fresh paste in later stages through filler effect and pozzolanic reaction, whereas excessive addition might reduce specimen strength due to insufficient early-stage hydration products.
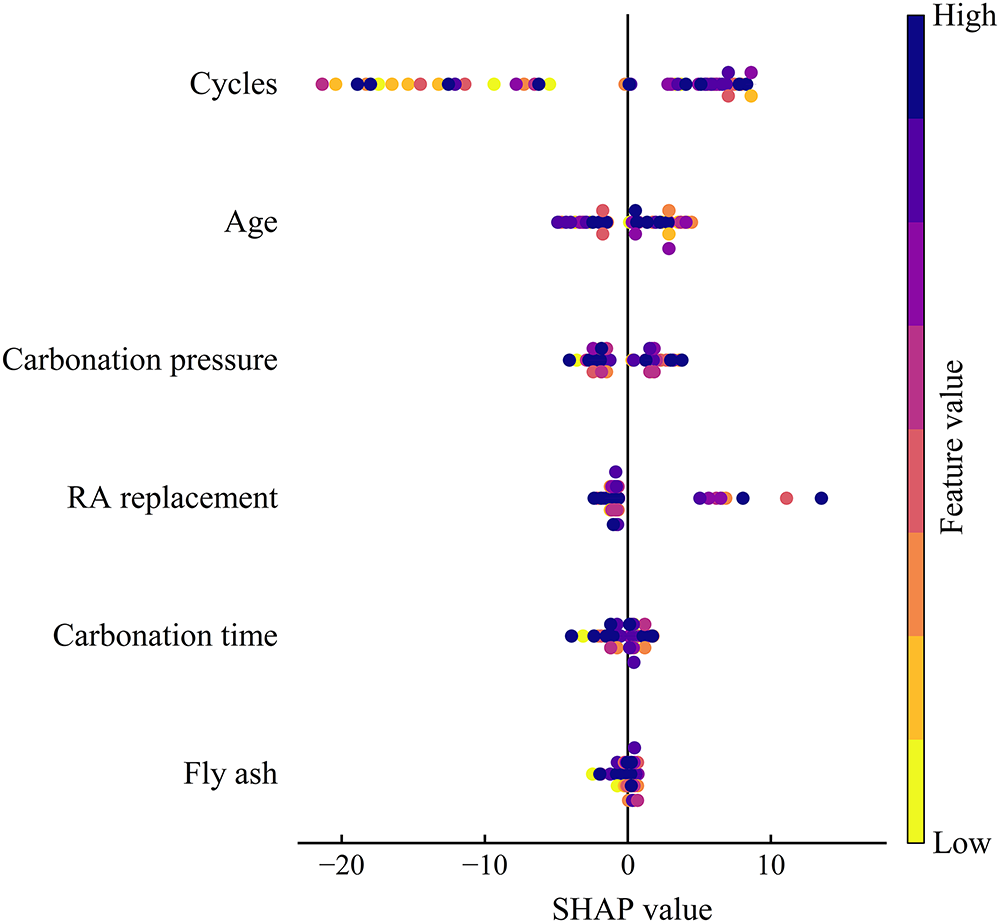
Figure 15: SHAP-based distribution of input-variable effects on CNN–LSTM compressive strength prediction.
Integrating the findings from Sections 4.2, 4.3 and 4.5 revealed that the variable contribution sequence elucidated by SHAP analysis exhibited intrinsic consistency with material damage mechanisms: the cycle number predominantly governed the sulfate erosion damage, while the contributions of carbonation pressure and duration reflected the influence of RA treatment degree on RAC strength. The model attribution associated with fly ash content was consistent with the experimental trends observed for the combined-treatment groups. This indicated that the CNN-LSTM model did not merely reconfigure experimental data in isolation, but rather identified to some extent the strength evolution patterns jointly determined by modification conditions and erosion processes.
This study conducted a systematic investigation into the compressive strength evolution of RAC subjected to sulfate wet-dry cycling conditions, with emphasis placed on how carbonation-treated recycled aggregates and fly ash incorporation regulate the mechanical and durability responses of the material. A deep learning method was employed to predict the experimental outcomes and corroborate the observed strength variation laws. Within the investigated material source, mixture matrix, and test protocol, the principal findings are as follows:
(1) Under standard curing, compressive strength increased progressively with age via sustained hydration. RA initially reduced strength, but carbonation treatment offset this effect, with CRAC-0.5 achieving the highest strength among the carbonation pressures investigated. Fly ash reduced early strength but enhanced later-stage development, evidencing stage-dependent behavior.
(2) Under sulfate wet-dry cycling conditions, specimen strength exhibited stage-dependent variation: early-stage deterioration was moderate or showed fluctuations, while mid-to-late stages experienced accelerated degradation due to crack propagation and accumulation of erosion products. RAC exhibited the most severe deterioration, with its strength declining to only 1.0 MPa after 120 cycles, a decline attributed to old mortar on RA surfaces, high porosity, and weak ITZs. Fly ash combined with carbonation modification demonstrated significant synergistic improvement, with 0.5 MPa carbonation +20% fly ash emerging as the most effective combination within the scope of our tested variables. FCRAC-20% achieved a strength of 25.6 MPa after 120 cycles, maintaining 82.8% retention—a value comparable to that of natural aggregate concrete—and representing the most effective combination within the scope of our tested variables for enhancing sulfate resistance.
(3) Macroscopic results aligned with XRD and with microscopic observations: inherent RAC cracks and loose old mortar on RA surfaces facilitated rapid sulfate ion ingress. Accumulated sulfate products caused matrix disintegration and rapid strength loss. Carbonation treatment filled old mortar pores/cracks with CaCO3, impeding sulfate migration. Fly ash contributed through filling effects and pozzolanic reactions generating C-S-H gel and refining the pore structure of the new paste. This combined modification strategy improved both pathways, enabling FCRAC-20% to achieve the highest compressive strength retention among the investigated combined modification mixtures under the adopted sulfate wetting and drying protocol. XRD results further showed lower sulfate reaction product reflections in FCRAC-20%, consistent with the strength and SEM observations.
(4) Within the scope of the present dataset, the CNN-LSTM captured compressive-strength variations across mix proportions, carbonation conditions, curing ages and wet–dry cycling histories, and under leakage-free leave-one-mixture-out cross-validation it achieved the best accuracy (R2 = 0.76) among eight models. It can therefore serve as an auxiliary tool for rapidly assessing strength trends across mix designs and stages of sulfate wet–dry deterioration. Its main limitations should, however, be recognized: the dataset is small (99 observations from nine mixtures), the model is data-limited and, as shown by the repeated grouped k-fold analysis, its accuracy degrades and becomes more variable when very few mixtures are available for training; moreover, generalization to genuinely new mixtures that occupy unseen regions of the input space (for example, a natural-aggregate control) cannot yet be guaranteed. Expanding the experimental matrix and incorporating additional durability indicators are needed before the model can be relied upon beyond the studied design space.
Overall, a key strength of this study is that the CNN–LSTM prediction was directly supported by controlled experimental data rather than synthetic inputs. The conclusions are most applicable to the investigated domain, which involved one RA source, selected carbonation–fly ash combinations, three specimens per condition, 100 mm cubes, and a specified accelerated 5% Na2SO4 wet–dry cycling protocol. Compressive strength tests and SEM observations provided complementary evidence at the macroscopic and microscopic levels, while the model captured nonlinear relationships using 99 experimentally derived mean values representing different test conditions. Future studies will consider multiple RA sources, factorial mixture designs, additional durability indicators, and full-scale or field exposure. Multi-source specimen-level datasets, group-wise external validation, and uncertainty quantification will also be introduced to further assess model transferability and support the engineering application of the proposed experimental–data-driven framework.
Acknowledgement: The authors would like to appreciate the financial support from the funding body.
Funding Statement: This research is supported by the Postgraduate Innovation Program of Chongqing University of Science and Technology (YKJCX2520714); Research Foundation of Chongqing University of Science and Technology (ckrc20241225); Chongqing Overseas Returnees’ Entrepreneurship and Innovation Support Program (cx2025065); Science and Technology Research Program of Chongqing Municipal Education Commission (KJQN20260157, KJQN202401510); Key Natural Science Foundation of Chongqing Municipal Science and Technology Bureau (CSTB2025NSCQ-LZX0114); the project of Natural Science Foundation of Chongqing municipality (CSTB2025NSCQ-GPX0216); the project of Chongqing Construction science and Technology Plan (2024 No. 3–4). The authors would like to appreciate the financial supports from the funding body.
Author Contributions: The authors confirm contribution to the paper as follows: conceptualization, Zhixi Chen and Jiehong Li; methodology, Yi Sun and Yang Yu; software, Sen Yang, Jie Zhong and Yang Yu; validation, Qingsong Li, Changming Bu and Mingtao Zhang; formal analysis, Zhixi Chen; investigation, Jie Zhong; resources, Qingsong Li; data curation, Jie Zhong and Qingsong Li; writing—original draft preparation, Zhixi Chen and Jiehong Li; writing—review and editing, Mingtao Zhang, Jiehong Li and Yang Yu; visualization, Jie Zhong and Qingsong Li; supervision, Yang Yu; project administration, Jiehong Li; funding acquisition, Yi Sun, Changming Bu and Jiehong Li. All authors reviewed and approved the final version of the manuscript.
Availability of Data and Materials: The datasets generated and analyzed during the current study are available from the corresponding authors on reasonable request.
Ethics Approval: Not applicable.
Conflicts of Interest: The authors declare no conflicts of interest.
References
1. Akhtar A, Sarmah AK. Construction and demolition waste generation and properties of recycled aggregate concrete: a global perspective. J Clean Prod. 2018;186:262–81. doi:10.1016/j.jclepro.2018.03.085. [Google Scholar] [CrossRef]
2. Silva RV, de Brito J, Dhir RK. Properties and composition of recycled aggregates from construction and demolition waste suitable for concrete production. Constr Build Mater. 2014;65(3):201–17. doi:10.1016/j.conbuildmat.2014.04.117. [Google Scholar] [CrossRef]
3. Tam VWY, Soomro M, Evangelista ACJ. A review of recycled aggregate in concrete applications (2000–2017). Constr Build Mater. 2018;172:272–92. doi:10.1016/j.conbuildmat.2018.03.240. [Google Scholar] [CrossRef]
4. Verian KP, Ashraf W, Cao Y. Properties of recycled concrete aggregate and their influence in new concrete production. Resour Conserv Recycl. 2018;133:30–49. doi:10.1016/j.resconrec.2018.02.005. [Google Scholar] [CrossRef]
5. Wang B, Yan L, Fu Q, Kasal B. A comprehensive review on recycled aggregate and recycled aggregate concrete. Resour Conserv Recycl. 2021;171(5):105565. doi:10.1016/j.resconrec.2021.105565. [Google Scholar] [CrossRef]
6. Shi C, Li Y, Zhang J, Li W, Chong L, Xie Z. Performance enhancement of recycled concrete aggregate—a review. J Clean Prod. 2016;112(2):466–72. doi:10.1016/j.jclepro.2015.08.057. [Google Scholar] [CrossRef]
7. Bulatović V, Melešev M, Radeka M, Radonjanin V, Lukić I. Evaluation of sulfate resistance of concrete with recycled and natural aggregates. Constr Build Mater. 2017;152(1):614–31. doi:10.1016/j.conbuildmat.2017.06.161. [Google Scholar] [CrossRef]
8. Li J, Chen J, Bu C, Zhang M, Yu J, Yu X, et al. Synergistic enhancement of sulfate resistance in recycled aggregate concrete through multi-pathway blocking via carbonation treatment and fly ash incorporation. Constr Build Mater. 2025;491(3):142685. doi:10.1016/j.conbuildmat.2025.142685. [Google Scholar] [CrossRef]
9. Zhang H, Ji T, Liu H. Performance evolution of the interfacial transition zone (ITZ) in recycled aggregate concrete under external sulfate attacks and dry-wet cycling. Constr Build Mater. 2019;229(5):116938. doi:10.1016/j.conbuildmat.2019.116938. [Google Scholar] [CrossRef]
10. Ikumi T, Segura I. Numerical assessment of external sulfate attack in concrete structures. A review. Cem Concr Res. 2019;121:91–105. doi:10.1016/j.cemconres.2019.04.010. [Google Scholar] [CrossRef]
11. Wu L, Sun Z, Cao Y. Modification of recycled aggregate and conservation and application of recycled aggregate concrete: a review. Constr Build Mater. 2024;431(3):136567. doi:10.1016/j.conbuildmat.2024.136567. [Google Scholar] [CrossRef]
12. Zhan BJ, Xuan DX, Zeng W, Poon CS. Carbonation treatment of recycled concrete aggregate: effect on transport properties and steel corrosion of recycled aggregate concrete. Cem Concr Compos. 2019;104:103360. doi:10.1016/j.cemconcomp.2019.103360. [Google Scholar] [CrossRef]
13. Zhan BJ, Xuan DX, Poon CS, Scrivener KL. Characterization of interfacial transition zone in concrete prepared with carbonated modeled recycled concrete aggregates. Cem Concr Res. 2020;136:106175. doi:10.1016/j.cemconres.2020.106175. [Google Scholar] [CrossRef]
14. Wu K, Luo S, Zheng J, Yan J, Xiao J. Influence of carbonation treatment on the properties of multiple interface transition zones and recycled aggregate concrete. Cem Concr Compos. 2022;127(4):104402. doi:10.1016/j.cemconcomp.2021.104402. [Google Scholar] [CrossRef]
15. Jin L, Wang Z, Wu T, Xie Z, Xue P. Damage-based ion transport in recycled aggregate concrete under external sulfate attack. Constr Build Mater. 2024;445:137944. doi:10.1016/j.conbuildmat.2024.137944. [Google Scholar] [CrossRef]
16. Gao Y, Jiang Y, Tao Y, Shen P, Poon CS. Accelerated carbonation of recycled concrete aggregate in semi-wet environments: a promising technique for CO2 utilization. Cem Concr Res. 2024;180:107486. doi:10.1016/j.cemconres.2024.107486. [Google Scholar] [CrossRef]
17. Wang J, Che Z, Zhang K, Fan Y, Niu D, Guan X. Performance of recycled aggregate concrete with supplementary cementitious materials (fly ash, GBFS, silica fume, and metakaolinmechanical properties, pore structure, and water absorption. Constr Build Mater. 2023;368(4):130455. doi:10.1016/j.conbuildmat.2023.130455. [Google Scholar] [CrossRef]
18. Kou SC, Poon CS. Long-term mechanical and durability properties of recycled aggregate concrete prepared with the incorporation of fly ash. Cem Concr Compos. 2013;37(5):12–9. doi:10.1016/j.cemconcomp.2012.12.011. [Google Scholar] [CrossRef]
19. Elahi MMA, Shearer CR, Naser Rashid Reza A, Saha AK, Khan MNN, Hossain MM, et al. Improving the sulfate attack resistance of concrete by using supplementary cementitious materials (SCMsa review. Constr Build Mater. 2021;281(2):122628. doi:10.1016/j.conbuildmat.2021.122628. [Google Scholar] [CrossRef]
20. Zhang Z, Angst U, Troian V, Guo B, Zeng Q. Durability performance of concrete incorporating carbonated recycled coarse aggregates: a review. npj Mater Sustain. 2025;3(1):27. doi:10.1038/s44296-025-00071-x. [Google Scholar] [CrossRef]
21. Zhang H, Ji T, Liu H. Performance evolution of recycled aggregate concrete (RAC) exposed to external sulfate attacks under full-soaking and dry-wet cycling conditions. Constr Build Mater. 2020;248(10):118675. doi:10.1016/j.conbuildmat.2020.118675. [Google Scholar] [CrossRef]
22. Kazmi SMS, Munir MJ, Wu YF, Patnaikuni I, Zhou Y, Xing F. Effect of different aggregate treatment techniques on the freeze-thaw and sulfate resistance of recycled aggregate concrete. Cold Reg Sci Technol. 2020;178(1):103126. doi:10.1016/j.coldregions.2020.103126. [Google Scholar] [CrossRef]
23. Gao S, Qin Z, Long W, Guo X, Ji Y, Zhang H, et al. The sulfate transfer characteristics in recycled aggregate concrete incorporated with fly ash under percolation theory. Case Stud Constr Mater. 2024;20(6):e02774. doi:10.1016/j.cscm.2023.e02774. [Google Scholar] [CrossRef]
24. Liu K, Dai Z, Zhang R, Zheng J, Zhu J, Yang X. Prediction of the sulfate resistance for recycled aggregate concrete based on ensemble learning algorithms. Constr Build Mater. 2022;317(7):125917. doi:10.1016/j.conbuildmat.2021.125917. [Google Scholar] [CrossRef]
25. Fan H, Yap SP, Zhang S, El-Shafie A. Bridging the gap in recycled aggregate concrete (RAC) prediction: state-of-the-art data-driven framework, model benchmarking, and future AI integration. Comput Model Eng Sci. 2025;145(1):17–65. doi:10.32604/cmes.2025.070880. [Google Scholar] [CrossRef]
26. Ben Chaabene W, Flah M, Nehdi ML. Machine learning prediction of mechanical properties of concrete: critical review. Constr Build Mater. 2020;260(7):119889. doi:10.1016/j.conbuildmat.2020.119889. [Google Scholar] [CrossRef]
27. Feng DC, Liu ZT, Wang XD, Chen Y, Chang JQ, Wei DF, et al. Machine learning-based compressive strength prediction for concrete: an adaptive boosting approach. Constr Build Mater. 2020;230(3):117000. doi:10.1016/j.conbuildmat.2019.117000. [Google Scholar] [CrossRef]
28. Sun B, Cui W, Liu G, Zhou B, Zhao W. A hybrid strategy of AutoML and SHAP for automated and explainable concrete strength prediction. Case Stud Constr Mater. 2023;19:e02405. doi:10.1016/j.cscm.2023.e02405. [Google Scholar] [CrossRef]
29. Santillán LR, Zega CJ, Irassar EF. Current knowledge and pending research on sulfate resistance of recycled aggregate concrete. Sustainability. 2024;16(3):1310. doi:10.3390/su16031310. [Google Scholar] [CrossRef]
30. Miao Q, Gao Z, Zhu K, Guo Z, Sun Q, Zhou L. Interpretable machine learning model for compressive strength prediction of self-compacting concrete with recycled concrete aggregates and SCMs. J Build Eng. 2025;108(1):112965. doi:10.1016/j.jobe.2025.112965. [Google Scholar] [CrossRef]
31. Kiranyaz S, Avci O, Abdeljaber O, Ince T, Gabbouj M, Inman DJ. 1D convolutional neural networks and applications: a survey. Mech Syst Signal Process. 2021;151:107398. doi:10.1016/j.ymssp.2020.107398. [Google Scholar] [CrossRef]
32. Greff K, Srivastava RK, Koutník J, Steunebrink BR, Schmidhuber J. LSTM: a search space odyssey. IEEE Trans Neural Netw Learn Syst. 2017;28(10):2222–32. doi:10.1109/TNNLS.2016.2582924. [Google Scholar] [CrossRef]
33. Yu Y, Jayathilakage R, Liu Y, Hajimohammadi A. Intelligent compressive strength prediction of sustainable rubberised concrete using an optimised interpretable deep CNN-LSTM model with attention mechanism. Appl Soft Comput. 2025;185:113993. doi:10.1016/j.asoc.2025.113993. [Google Scholar] [CrossRef]
34. Gholami S, Hu J, Kim YR. Assessment of bonding, durability, and low-temperature performance of cement-based rapid patching materials for pavement repair. Int J Pavement Eng. 2023;24(2):2120990. doi:10.1080/10298436.2022.2120990. [Google Scholar] [CrossRef]
35. Revilla-Cuesta V, Manso-Morato J, Hurtado-Alonso N, Santamaría A, San-José JT. Degradation under cyclic wet-dry aging of full-scale high-workability concrete maximizing sustainable raw materials. Case Stud Constr Mater. 2024;20(15):e03334. doi:10.1016/j.cscm.2024.e03334. [Google Scholar] [CrossRef]
36. Vélez W, Matta F, Ziehl P. Acoustic emission monitoring of early corrosion in prestressed concrete piles. Struct Control Heal Monit. 2015;22(5):873–87. doi:10.1002/stc.1723. [Google Scholar] [CrossRef]
37. Yu Y, Al-Damad IMA, Foster S, Nezhad AA, Hajimohammadi A. Compressive strength prediction of fly ash/slag-based geopolymer concrete using EBA-optimised chemistry-informed interpretable deep learning model. Dev Built Environ. 2025;23(1):100736. doi:10.1016/j.dibe.2025.100736. [Google Scholar] [CrossRef]
Cite This Article
 Copyright © 2026 The Author(s). Published by Tech Science Press.
This work is licensed under a Creative Commons Attribution 4.0 International License , which permits unrestricted use, distribution, and reproduction in any medium, provided the original work is properly cited.
 Downloads
 Citation Tools
