
 Submit a Paper
 Propose a Special lssue
 Open Access
ARTICLE
Identification of proteases associated with glioblastoma and their modulation by interferon-gamma signaling
1
Posgrado en Ciencias Genómicas, Universidad Autónoma de la Ciudad de México, CDMX, 03100, Mexico
2
Instituto de Fisiología Celular, Universidad Nacional Autónoma de México, CDMX, 04510, Mexico
* Corresponding Author: Angeles C Tecalco-Cruz,
European Cytokine Network 2025, 36(3), 38-51. https://doi.org/10.1684/ecn.2025.0503
Accepted 06 January 2026; Issue published 28 February 2026
 View Full Text
 Download PDF
Abstract
Background: Glioblastoma is a lethal primary brain tumor that is therapeutically challenging due to its rapid progression. Interferon-gamma (IFN-γ) signaling is altered in glioblastoma. Moreover, proteolytic enzymes, known as proteases, have been linked to the invasive growth of cancerous cells. In this study, we aimed to identify a glioblastoma-associated protease group and to determine its potential connection with IFN-γ signaling. Methods: Using cancer expression databases, we analyzed the differential expression of 35 proteases in glioblastoma and healthy brain tissue, and the relevance of their deregulation to patient survival. We also explored correlations between IFN-γ signaling element expression and upregulated proteases in glioblastoma. Additionally, we analyzed the effect of IFN-γ on the levels of these 35 proteases using a protein microarray and found that cathepsin L (CTSL) was upregulated by IFN-γ. Then, we analyzed the modulation of CTSL by IFN-γ in glioblastoma cells using dot blot, western blot, and immunofluorescence assays. Results: We identified 11 proteases (cathepsin B, Z, C, S (CTSB, CTSZ, CTSC, CTSS), matrix metalloproteinase 2, 7, 9 (MMP2, MMP7, MMP9), a disintegrin and metalloproteinase 9 (ADAM9), urokinase-type plasminogen activator (PLAU), presenilin 1 (PSEN1), and CTSL that were upregulated in glioblastoma tissue compared to healthy brain tissue. The expression of specific elements of the IFN-γ pathway correlated with the expression of some of these proteases in glioblastoma samples. Moreover, IFN-γ affected the intracellular and extracellular levels of proteases (four were upregulated and six were downregulated) in glioblastoma-derived cells. Hence, IFN-γ signaling may play a role in glioblastoma by regulating the expression of some proteases. The CTSL protease was upregulated by IFN-γ and was associated with poor glioblastoma prognoses. Conclusions: Thus, we revealed a protease profile (ADAM9, CTSB, MMP7, CTSC, CTSL, MMP9, and PLAU) associated with glioblastoma progression and further demonstrated that CTSL is regulated by IFN-γ in glioblastoma cells. These results establish a link between IFN-γ signaling and protease regulation in glioblastoma.Keywords
Glioblastoma is the most aggressive and prevalent malignant type of brain tumor in elderly adults, representing a cancer therapy challenge due to patients’ low median survival rate of 12 to 15 months, despite the available treatments [1–4]. In 2021, the World Health Organization (WHO) classified glioblastomas as adult-type diffuse gliomas with isocitrate dehydrogenase (IDH)-wild-type astrocytic features [5]. Several molecular pathways are deregulated in glioblastoma. For example, type I interferon (IFN-I) is known to suppress metastatic tumors [6]. Moreover, the main components of the interferon gamma (IFN-γ) signaling pathway are upregulated in glioblastoma and contribute to tumor progression [7]. IFN-γ signaling requires the formation of a heterotetrameric receptor complex composed of interferon gamma receptor 1 and 2 (IFNGR1/IFNGR2) associated with Janus kinase proteins JAK1 and JAK2, which are responsible for phosphorylation and subsequent activation of the transcription factor signal transducer and activator of transcription 1 (STAT1) [8]. The homodimer of phosphorylated STAT1 is translocated to the nucleus to regulate a wide variety of genes known as interferon-stimulated genes (ISGs) [8, 9].
IFN-γ plays a dual pro- and antitumoral role in cancer. Specifically, the upregulation of elements of the canonical IFN-γ pathway, including IFNGR1, IFNGR2, and STAT1, has been reported in glioblastoma tissue compared to healthy brain tissue [7]. Additionally, IFN-γ induces the expression of genes, e.g., programmed death-ligand 1 (PD-L1) and indoleamine 2,3-dioxygenase 1 (IDO-1), that are associated with tumor progression [10, 11]. Other proteins associated with a protumor response are proteases—a group of proteins characterized by their ability to carry out proteolytic cleavage—which are essential for homeostasis [12, 13]. Proteases are tightly controlled at multiple levels to maintain the balance of proteolytic networks, but their deregulation can promote the development of diverse diseases, including cancer [13]. Thus far, studies on the regulation of proteases by IFN-γ have been limited. Using the human astroglioma cell line CRT-MG, researchers have found that IFN-γ inhibits MMP-9 expression, decreasing its protein abundance and activity in a STAT1-dependent manner [14, 15]. IFN-γ also inhibits the synthesis and release of MMP-9 in monocytes [16]. Moreover, MMP-1 and MMP-3 are upregulated in human epidermal keratinocytes treated with IFN-γ [17]. In the case of MMP-7, IFN-γ exhibited increased expression in lung fibroblasts [18]. However, the effect of IFN-γ on the proteases expressed in glioblastoma is unknown.
This study aimed to investigate the differential expression of a group of proteases in glioblastoma and healthy tissue, their association with IFN-γ signaling, and their impact on survival in glioblastoma patients. We also determined whether IFN-γ modulates the levels of some cancer-associated proteases in glioblastoma-derived cells.
MATERIALS AND METHODS
We analyzed the expression of 35 proteases commonly associated with cancer (table S1). These proteases belong to protease families, including a disintegrin and metalloproteinases 8 and 9 (ADAM8 and ADAM9); a disintegrin and metalloproteinase with thrombospondin motifs 1 and 13 (ADAMTS1 and ADAMTS13); cathepsins A, B, C, D, E, L, S, V, and Z (CTSA, CTSB, CTSC, CTSD, CTSE, CTSL, CTSS, CTSV, and CTSZ); dipeptidyl peptidase 4 (DPP4); kallikrein-related peptidases 3, 5, 6, 7, 10, 11, and 13 (KLK3, KLK5, KLK6, KLK7, KLK10, KLK11, and KLK13); matrix metalloproteinases 1, 2, 3, 7, 8, 9, 10, 12, and 13 (MMP1, MMP2, MMP3, MMP7, MMP8, MMP9, MMP10, MMP12, and MMP13); neprilysin (MME); presenilin 1 (PSEN1); proprotein convertase subtilisin/kexin type 9 (PCSK9); proteinase 3 (PRTN3); and urokinase-type plasminogen activator (PLAU). A heat map based on the expression of these proteases was generated using Gene Expression Profiling Interactive Analysis (GEPIA, http://gepia.cancer-pku.cn/) [19], based on data from 163 glioblastoma and 207 normal brain tissue samples, The Cancer Genome Atlas (TCGA) and Genotype-Tissue Expression (GTEx). Additionally, the University of Alabama at Birmingham CANcer data analysis Portal (UALCAN, https://ualcan.path.uab.edu/) [20] was used to generate another heat map, using data from 156 glioblastoma and 5 normal brain tissue samples. The differential expression of proteases was then analyzed using GEPIA. Data were normalized as transcripts per million (TPM) and log2 (TPM + 1) transformed. The cutoffs were set at |log2Fold Change (FC)| ≥ 1 and p-value < 0.05 based on matched TCGA normal and GTEx data. Via UALCAN, the protein abundance of proteases was analyzed based on Clinical Proteomic Tumor Analysis Consortium (CPTAC, https://ualcan.path.uab.edu/analysis-prot.html) proteomic data, which comprised 99 glioblastoma and 10 normal brain tissue samples, using log2 transformation to normalize the intensity values. The glioblastoma and normal tissue samples were then compared. Additionally, the expression of proteases that showed significant changes in the Oncopression database (http://www.oncopression.com/) was analyzed [21]. The data were obtained from 25 healthy tissues and 28 glioblastoma tissue samples, and statistical analysis was performed using a Student’s t-test (significance at p-value < 0.05) and UPC- normalized expression. Oncopression database complemented the statistical analysis by allowing us to calculate the area under the curve (AUC) as an independent metric of the discriminative capacity of gene expression levels to separate normal and tumor samples.
The survival of patients with brain tumors was analyzed based on differentially expressed proteases using the Gene Expression database of Normal and Tumor tissues 2 (GENT2, http://gent2.appex.kr/gent2/) tool [22]. Patients were stratified into two groups, each comprising 25 patients, based on low and high expression levels. The samples were classified according to the WHO 2021 CNS tumor classification: 5 grade II, 13 grade III, and 32 grade IV tumors. Glioblastoma corresponds to WHO grade IV. GENT2 uses Cox proportional hazard models applied to gene expression and follow-up time data to facilitate evaluations of the impact of gene expression on patient survival. The tool also stratifies by tumor subtypes and meta-analysis across multiple datasets to consolidate evidence for associations between specific genes and survival outcomes. A survival analysis was performed using the Chinese Glioma Genome Atlas (CGGA, https://www.cgga.org.cn/) database [23], with 85 samples and selected proteases taken from glioblastoma patients. This database is based on log-rank tests. The associations of age, sex, and tumor purity with the survival of 287 patients with glioblastoma were analyzed using the TIMER3 database (https://compbio.cn/timer3/) [24].
An analysis was performed of the correlations between differentially expressed proteases and elements of the IFN-γ pathway, specifically STAT1, JAK1, JAK2, IFNGR1, and IFNGR2, in glioblastoma. The analysis was conducted using the GEPIA bioinformatics tool (http://gepia.cancer-pku.cn/), which employs RNA-seq data from the TCGA-GBM dataset. Gene expression values were processed in terms of log2-transformed TPM for visualization purposes. However, nonlogarithmic values were used for the correlation calculations. The correlations between genes were assessed using Pearson’s correlation coefficient, which provides a measure of the linear relationship between the expression of proteases and IFN-γ pathway components. The correlations between IFN-γ pathway elements, proteases, and tumor purity in 287 glioblastoma patients were analyzed using the TIMER3 database (https://compbio.cn/timer3/) [24]. Venn diagrams were constructed using the Venny 2.1.0 bioinformatics tool (https://bioinfogp.cnb.csic.es/tools/venny/) [25].
The glioblastoma-derived A172 cell line was cultured in Dulbecco’s Modified Eagle Medium (DMEM; Cat. #11965092, Gibco, Waltham, MA, USA) supplemented with 10% fetal bovine serum (FBS) and antibiotics (penicillin/streptomycin) at a concentration of 1%. The cells were incubated in an atmosphere of 5% CO2 at 37°C for 24 h with recombinant human IFN-γ (100 ng/mL; Cat. #285-IF-00; R&D Systems (Bio-Techne), Minneapolis, MN, USA). The control received no treatment. Subsequently, the cells were washed with cold PBS, and experiments were carried out as described in the following sections. We used a Proteome Profiler Human Protease Array Kit (Cat. #ARY021B; R&D Systems (Bio-Techne), Minneapolis, MN, USA) to measure the abundance of proteases under two conditions—with IFN-γ and without (control). The four membranes included in the kit were used to analyze the protein levels present in both the extracellular medium and total cell extracts taken from the glioblastoma A172 cell line, treated or untreated with IFN-γ, according to the manufacturer’s instructions. For the preparation of the cell protein extracts, a 0.5% TNTE lysis buffer (50 mM Tris-HCl, 150 mM NaCl, 5 mM EDTA, and 0.5% Triton X-100) was used, supplemented with protease and phosphatase inhibitors. Culture mediums were obtained from Invitrogen, cell lines from ATCC, and reagents were obtained from R&D Systems (Minneapolis, Minnesota, USA), AMRESCO-VWR (Solon, Ohio, USA), and Bio-Rad (Hercules, California, USA).
Human glioblastoma cell lines A172 (CRL-1620, ATCC, Manassas, VA, USA) and U373 (HTB-17, ATCC, Manassas, VA, USA) were seeded in12-well plates with DMEM, supplemented with 10% FBS and antibiotics (penicillin/streptomycin), and incubated at 37°C in a 5% CO2 atmosphere for 24 h without (control) or with 100 ng/mL recombinant human IFN-γ (Cat. #285-IF-00, R&D Systems, Minneapolis, MN, USA). Serum-free DMEM was used as the culture medium after cell attachment. The conditioned media (CM) were collected in a microtube, and the cells were lysed with 0.5% TNTE buffer (50 mM Tris-HCl, 150 mM NaCl, 5 mM EDTA, and 0.5% Triton X-100) containing protease and phosphatase inhibitors to obtain a total protein extract. Dot blotting was performed by loading 200 μL of CM and 20 μL of total protein extract onto the nitrocellulose membrane. The blots on the nitrocellulose membrane were blocked with 5% skim milk for 1 h at room temperature and then incubated overnight at 4°C with a specific primary CTSL antibody (cathepsin L, 33/2, sc-32320, Santa Cruz Biotechnology, Dallas, TX, USA) (1:1,000). Followed by incubation with goat anti-mouse secondary antibody and HRP-AffiniPure goat anti-mouse IgG secondary antibody (115-035-003, Jackson ImmunoResearch Laboratories, West Grove, PA, USA). The acquired signals were detected using a SuperSignal™ West Pico PLUS Chemiluminescent Substrate blotting system (Cat. #34580, Thermo Scientific, Waltham, MA, USA).
A172 cells were seeded into a 100-mm cell culture dish in DMEM supplemented with 10% FBS and antibiotics (penicillin/streptomycin). When the cell density was approximately 80%, the cells were stimulated with 100 ng/mL recombinant human IFN-γ for 25 h at 37 °C in a 5% CO2 atmosphere. Parental cells without stimuli were used as controls. The CM was collected in a microtube and centrifuged to separate the cellular rest. The cells were washed with 1x PBS and then lysed with TNTE buffer (50 mM Tris-HCl, 150 mM NaCl, 5 mM EDTA, and 0.5% Triton X-100) to obtain the total extracts. The total lysates and CM were separated using SDS-PAGE. Immunoblotting was performed using anti-CTSL (cathepsin L, 33/2, sc-32320, Santa Cruz Biotechnology, Dallas, TX, USA) (1:1,000) and anti-α-GAPDH (0411, sc-47724, Santa Cruz Biotechnology, Dallas, TX, USA), followed by incubation with goat anti-mouse secondary antibody and HRP-AffiniPure goat anti-mouse IgG secondary antibody (115-035-003, Jackson ImmunoResearch Laboratories, West Grove, PA, USA). Proteins were detected using a SuperSignal™ West Pico Chemiluminescent Substrate blotting system (Cat. #34580; Thermo Fisher Scientific, Waltham, MA, USA).
A172 cells were cultured on well plates containing poly-L-lysine–coated coverslips. Immunofluorescence staining was performed as follows: For mitochondrial staining, MitoTracker™ Red CMXRos (Cat. #9082; Cell Signaling Technology, Danvers, MA, USA) was added, and the cells were incubated for 1 h at 37 °C. To evaluate the effects of IFN-γ, cells were stimulated with 100 ng/mL of IFN-γ; others were cotreated with 100 ng/mL of IFN-γ (Cat. #285-IF-00, R&D Systems, Minneapolis, MN, USA) and 100 nM of Ruxolitinib phosphate (Cat. #sc-396768; lot B1025, ChemCruz, Santa Cruz Biotechnology, Dallas, TX, USA), as previously reported [26], and parental cells were used as controls.
The culture medium was then removed, and the cells were washed with PBS, fixed with 4% paraformaldehyde at room temperature for 20 min, washed three times with PBS, and permeabilized with 0.1% Triton X-100 for 8 min. Following three additional PBS washes, the samples were blocked with 1% bovine serum albumin (BSA) for 1 h.
The cells were subsequently incubated overnight at 4 °C with the following primary antibodies: anti-CTSL (cathepsin L, 33/2, sc-32320, Santa Cruz Biotechnology, Dallas, TX, USA), anti-KLK10 (kallikrein10, I-06 sc-10005, Santa Cruz Biotechnology, Dallas, TX, USA), and anti-pSTAT1 (p-STAT1 [Y701] [D4A7], 7649S, Cell Signaling Technology) (1:100). A secondary antibody – Alexa Fluor 488–conjugated anti-rabbit IgG (Cat. #ab15007; Abcam, Cambridge, UK; dilution 1:100) – was applied for 1.5 h in the dark. After three PBS washes, coverslips were mounted on glass slides using a mounting medium containing Hoechst for nuclear staining.
The subcellular localization of the CTSL and KLK10 proteins was predicted using a bioinformatic protein subcellular localization prediction tool (PSORT, https://www.genscript.com/psort.html) [27]. The CTSL and KLK10 protease amino acid sequences were retrieved from the UniProt database (https://www.uniprot.org/) (IDs P07711 and O43240, respectively).
All statistical analyses were performed using the built-in analytical and statistical tools implemented in the bioinformatic platforms and databases described above, including GEPIA, UALCAN, GENT2, TIMER3, CGGA, and Oncopression. No additional statistical tests beyond those provided by each platform were applied. A p-value <0.05 was considered statistically significant. For proteomic microarray experiments, the obtained values were first normalized to each reference protein spot of the microarray and subsequently to the control arrays, corresponding to conditions without IFN-γ stimulation. The normalized data were plotted in RStudio (version 4.5.0) using the pheatmap (version 1.0.13), RColorBrewer (version 1.1.3), ggplot2 (version 4.0.1), and dplyr (version 1.1.4) libraries. For Immunofluorescence analyses, the samples were analyzed using a laser scanning confocal microscope (Olympus FV10i Fluoview), and the acquired images were processed and quantified using Fiji software (ImageJ, version 2.14.0; National Institutes of Health, USA) [28].
RESULTS
Upregulation of nine proteases in glioblastoma is associated with poor survival
Since several proteases are typically associated with tumor progression, we evaluated the levels of 35 commonly studied proteases to explore their deregulation and relevance for different cancer types. However, this protease set has not been evaluated for glioblastoma (table S1). First, the gene expression of proteases in glioblastoma tissue was compared with that in healthy tissue using gene expression data from cancer databases. Changes in the expression of these 35 proteases in glioblastoma tissue compared to healthy brain tissue were determined using the GEPIA database, as well as through cross-validation using the UALCAN database (figure 1A,B). The results showed significant changes in the expression of 16 proteases (PSEN1, PLAU, MMP9, MMP7, CTSC, CTSB, CTSZ, ADAM9, CTSD, ADAMTS13, KLK5, KLK7, PRTN3, MMP2, CTSS, and CTSL) (figure 2) but not in the other 19 (figure S1). Using the Oncopression database, we also analyzed the expression of these 16 proteases, showing that 15 exhibited statistically significant differences in glioblastoma tissue compared to healthy tissue (figure S2).
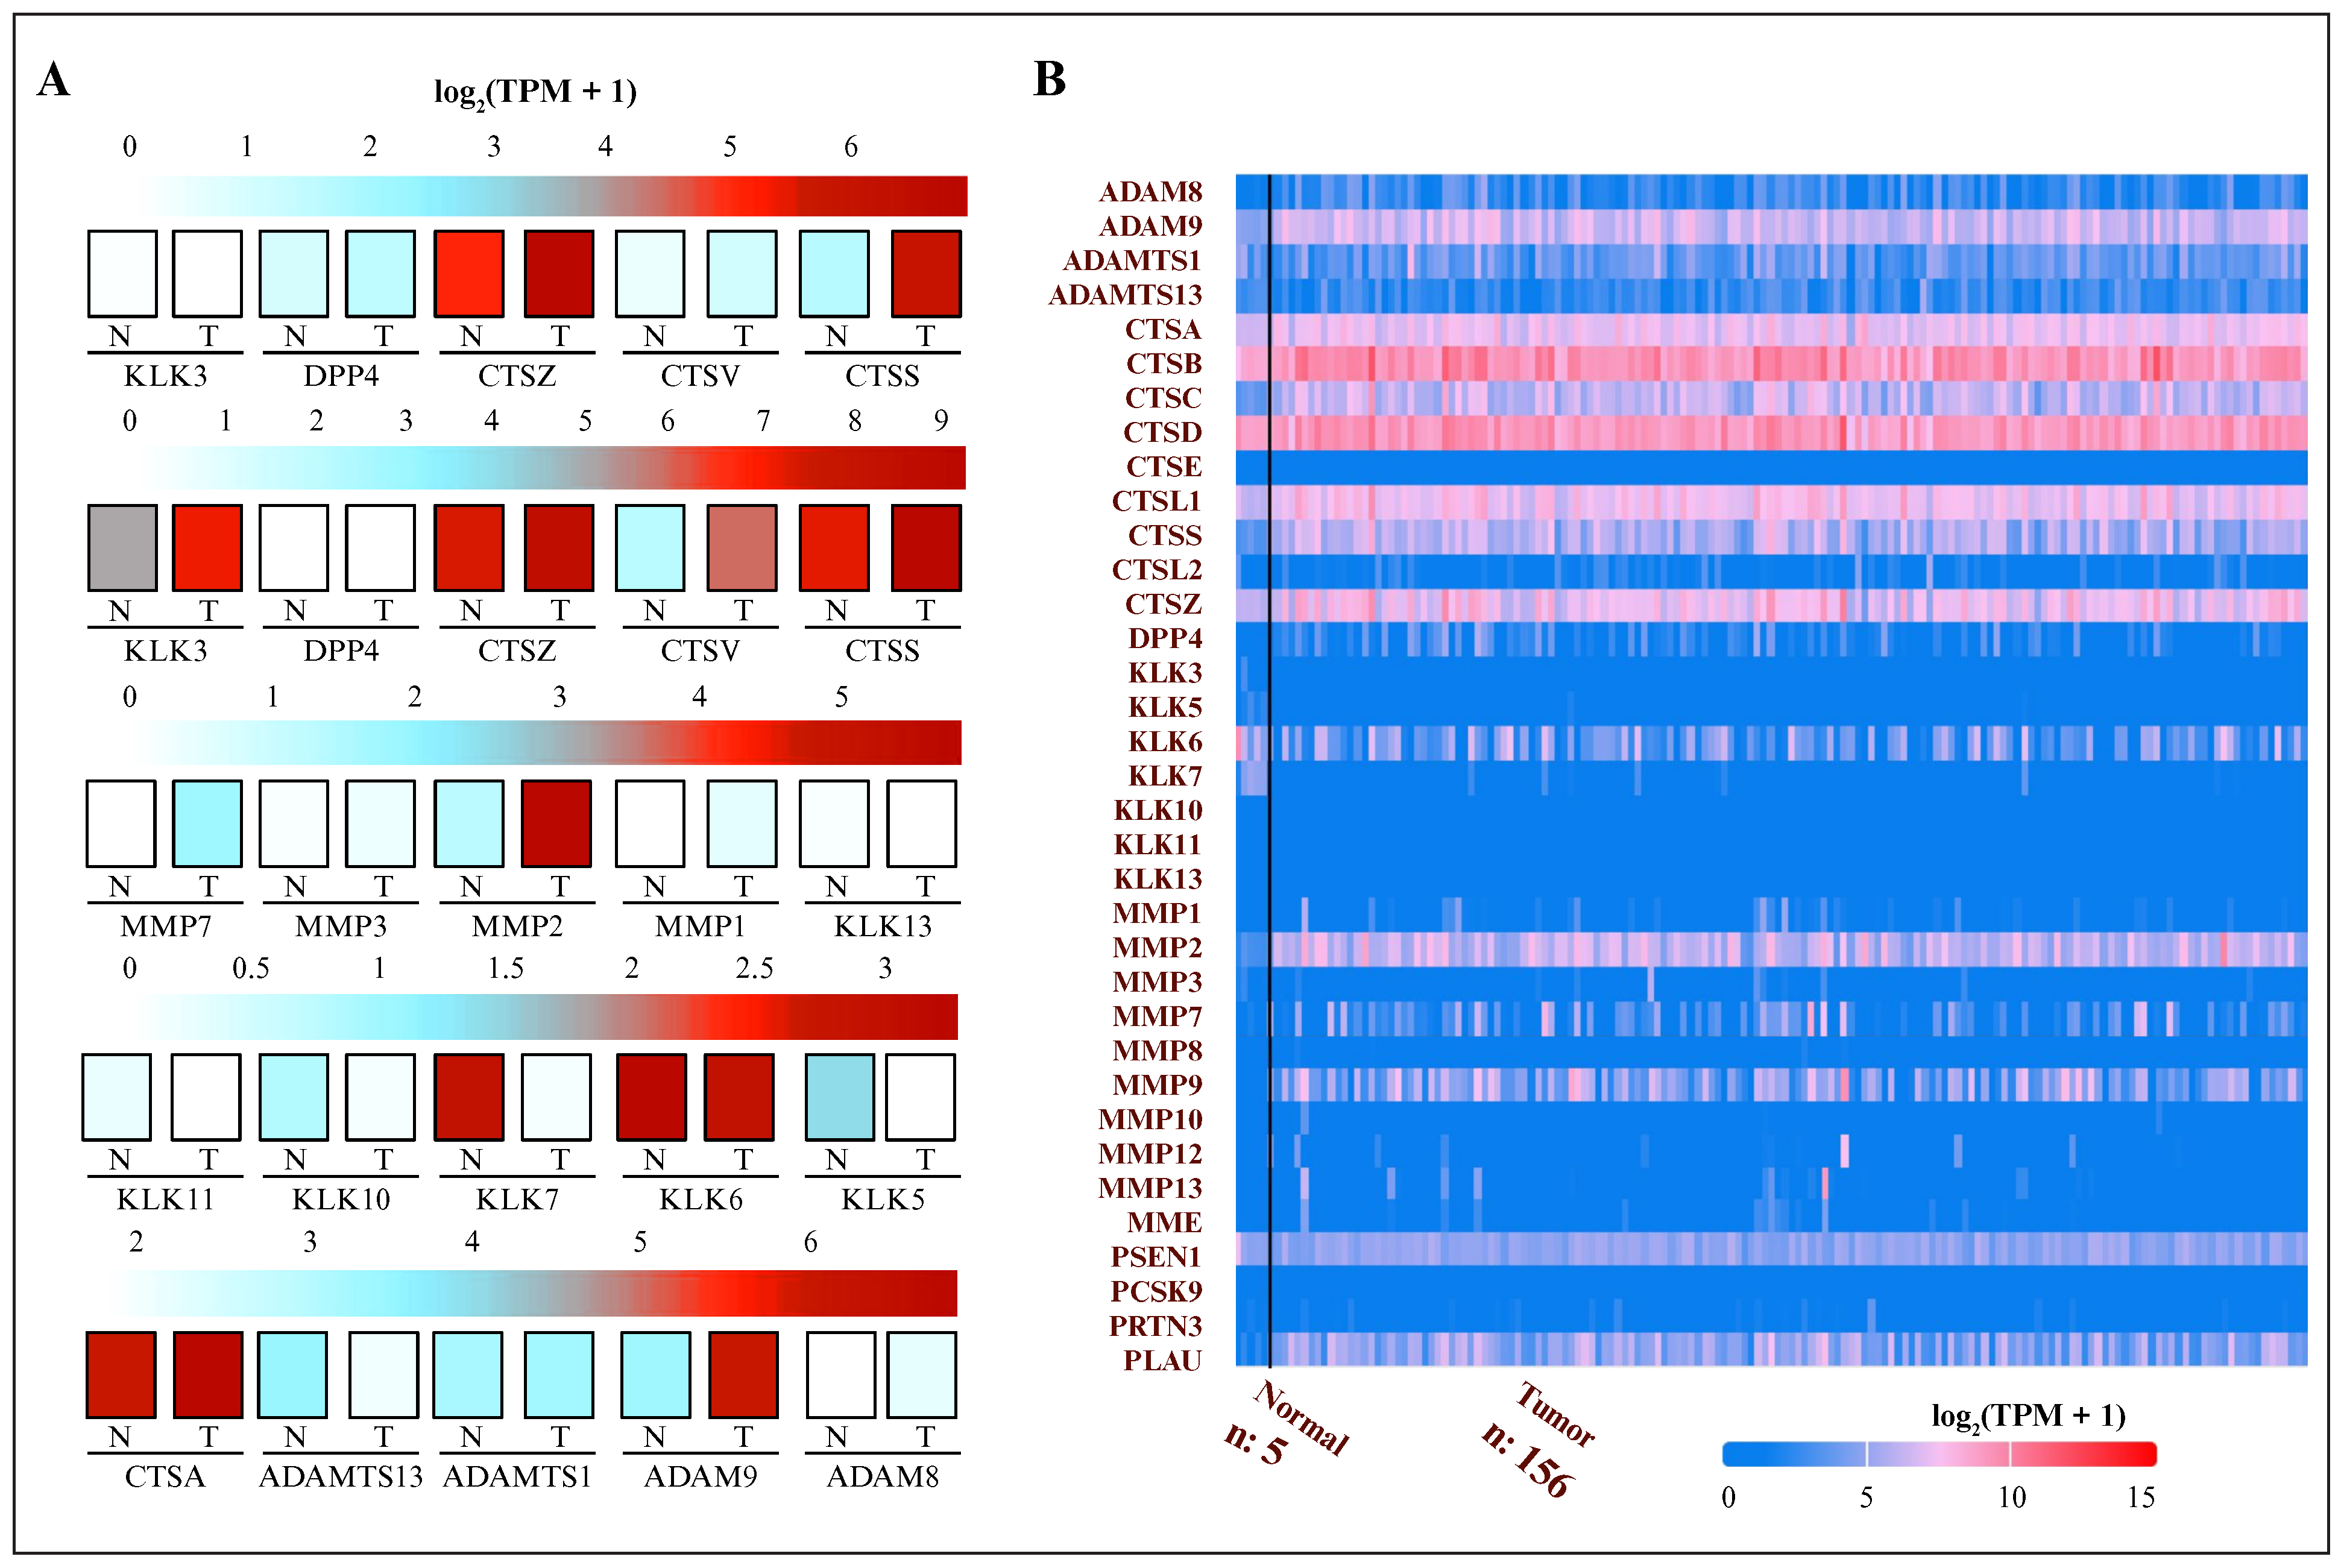
Figure 1.
Gene expression analysis of glioblastoma and normal brain tissue: (A) expression analysis of 35 proteases obtained from the GEPIA database (glioblastoma, n = 163; normal tissue, n = 207); (B) representation of the same analysis using the UALCAN database (glioblastoma, n = 156; normal tissue, n = 5). Expression values were log2 (TPM + 1) normalized. Red tones indicate overexpression in tumor tissue, whereas blue tones represent underexpression. GEPIA: Gene Expression Profiling Interactive Analysis; N: normal tissue; T: tumor tissue; TPM: transcripts per million; UALCAN: University of Alabama at Birmingham CANcer data analysis Portal; n: number of samples.
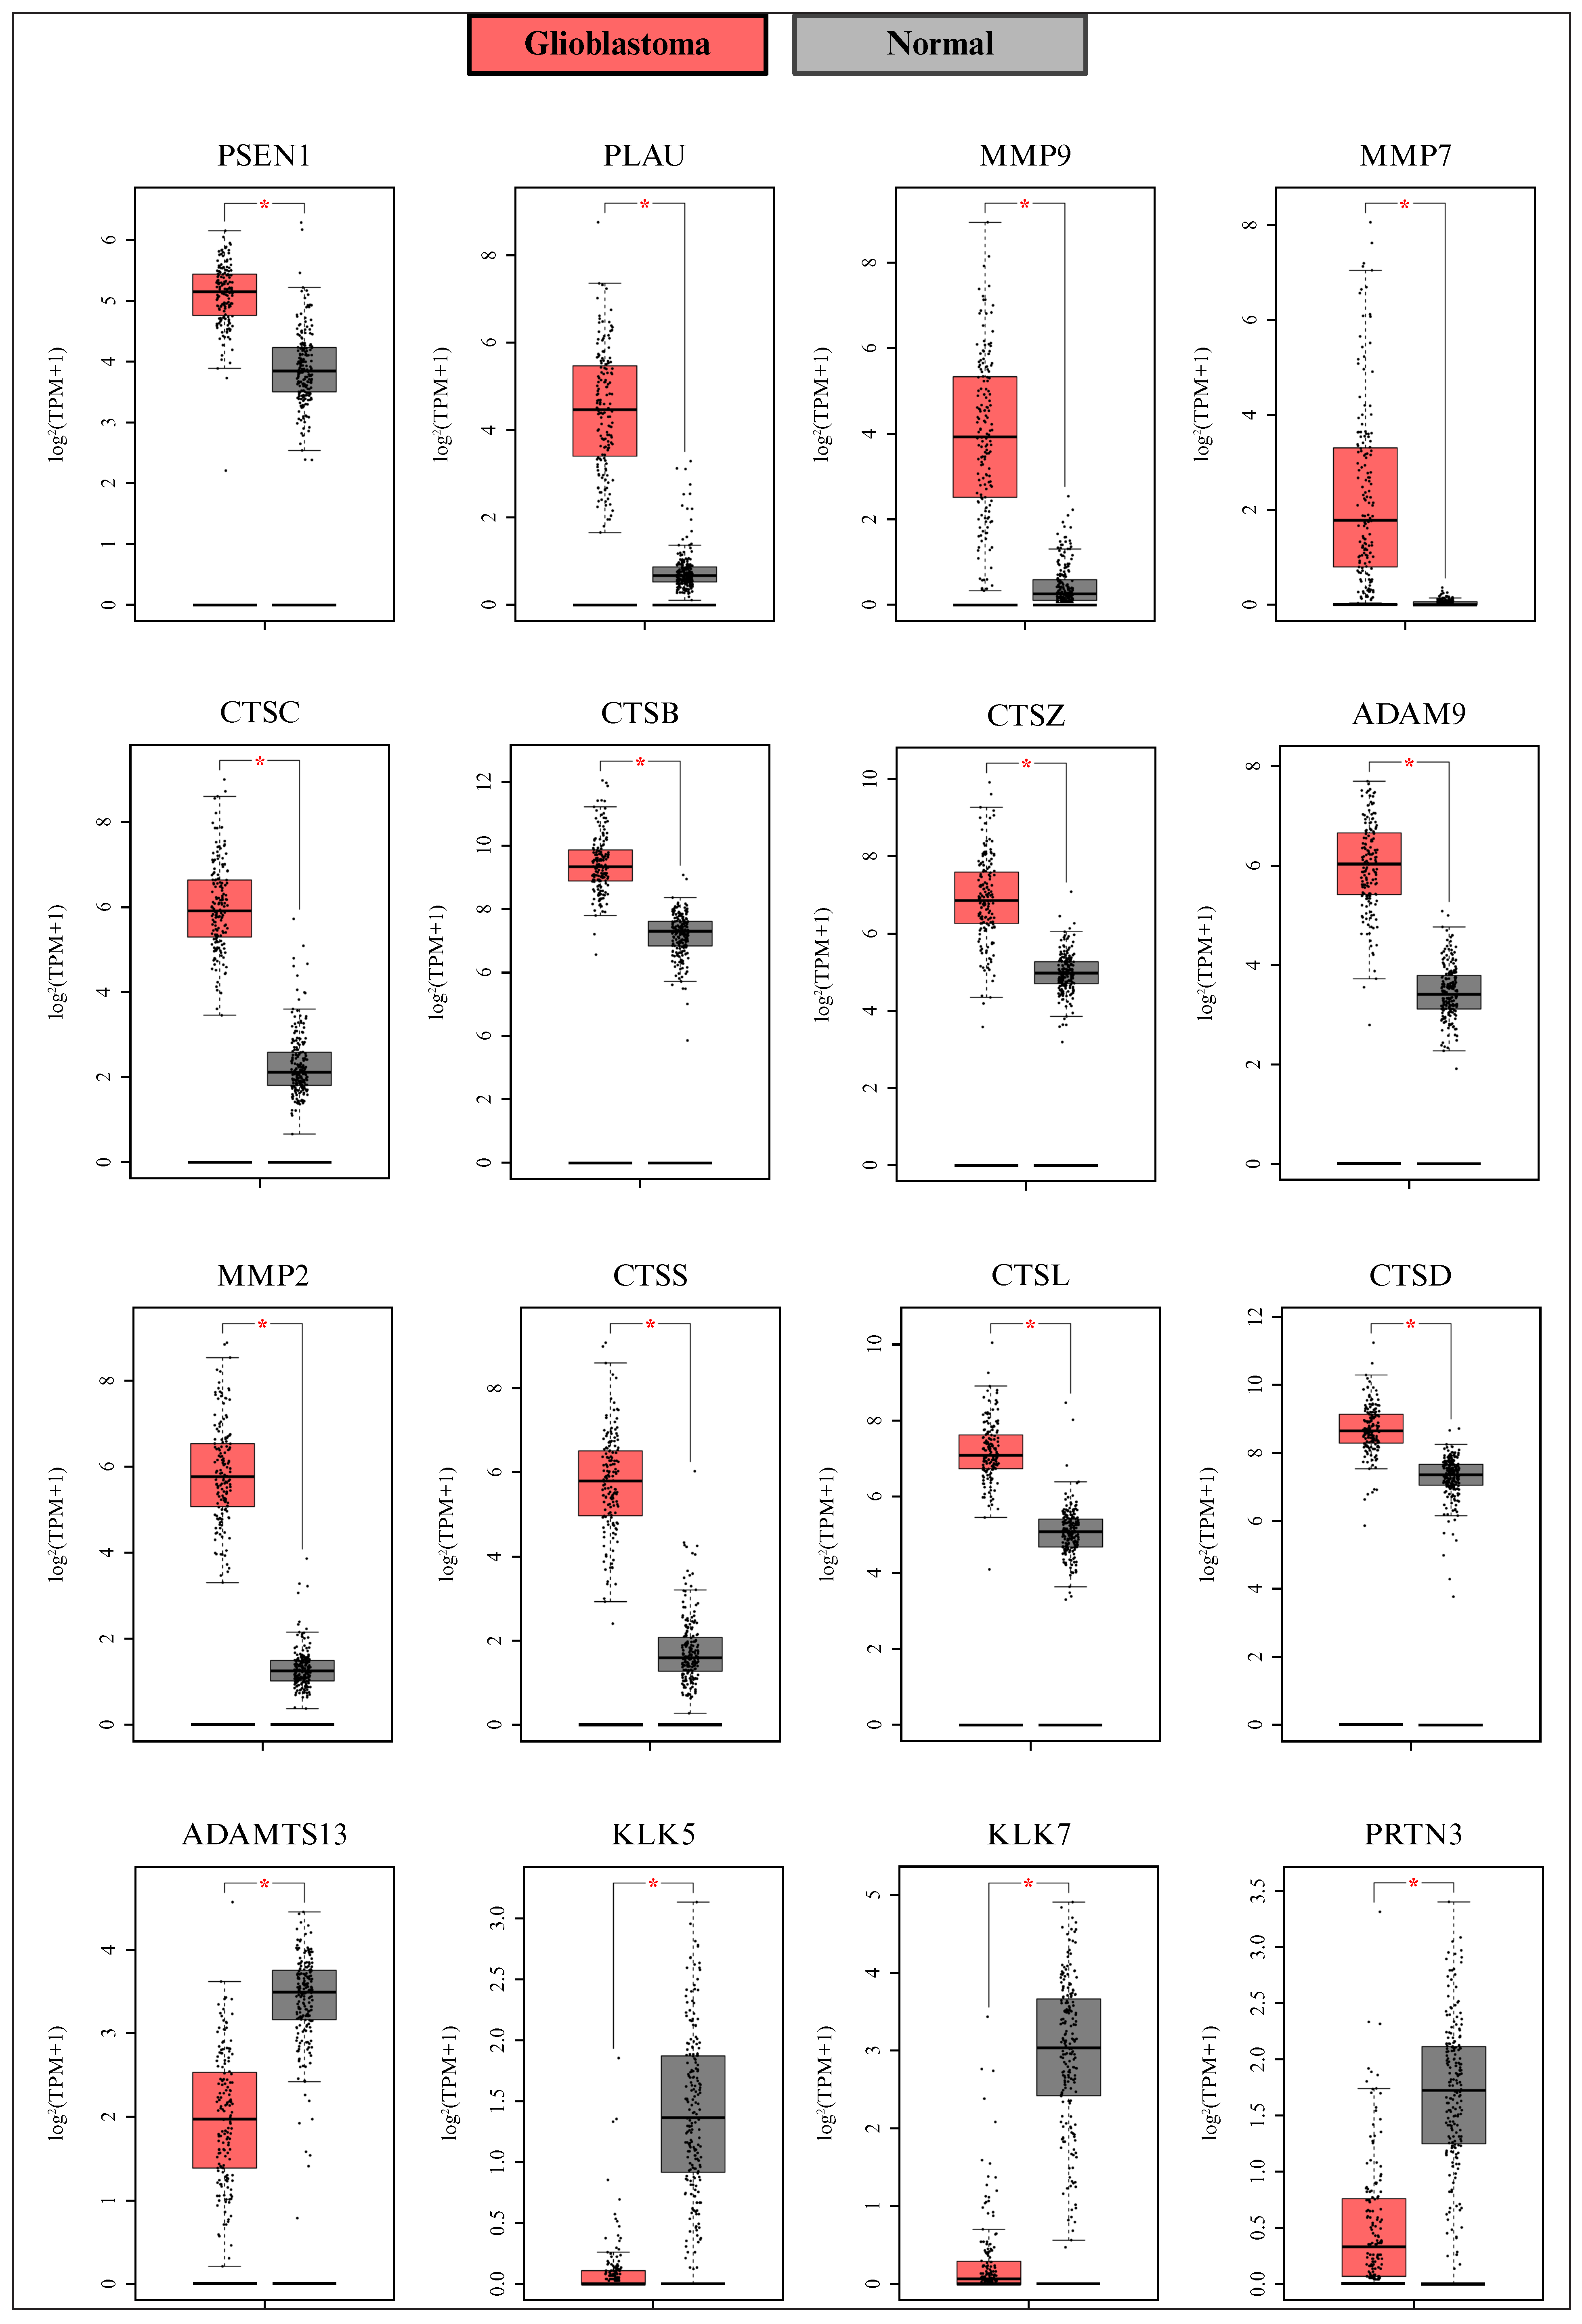
Figure 2.
Differentially expressed proteases in glioblastoma. Proteases showing differential expression between glioblastoma and normal brain tissue are presented. Data were obtained from the GEPIA database (glioblastoma, n = 163; normal tissue, n = 207). Expression values were log2 (TPM + 1) normalized. Statistical significance is indicated by *p <0.05. GEPIA: Gene Expression Profiling Interactive Analysis; n: number of samples; TPM: transcripts per million.
Deregulated proteases according to GEPIA/UALCAN. and Oncopression (16 and 15, respectively) were also analyzed at the protein level, 11 of which (CTSB, CTSZ, PLAU, CTSC, CTSS, ADAM9, MMP2, MMP7, MMP9, PSEN1, and CTSL) were significantly upregulated at the mRNA and protein levels in glioblastoma tissue compared to healthy brain tissue (figure 3), whereas PRTN3 expression was upregulated but did not show a significant change at the protein level (figure S3).
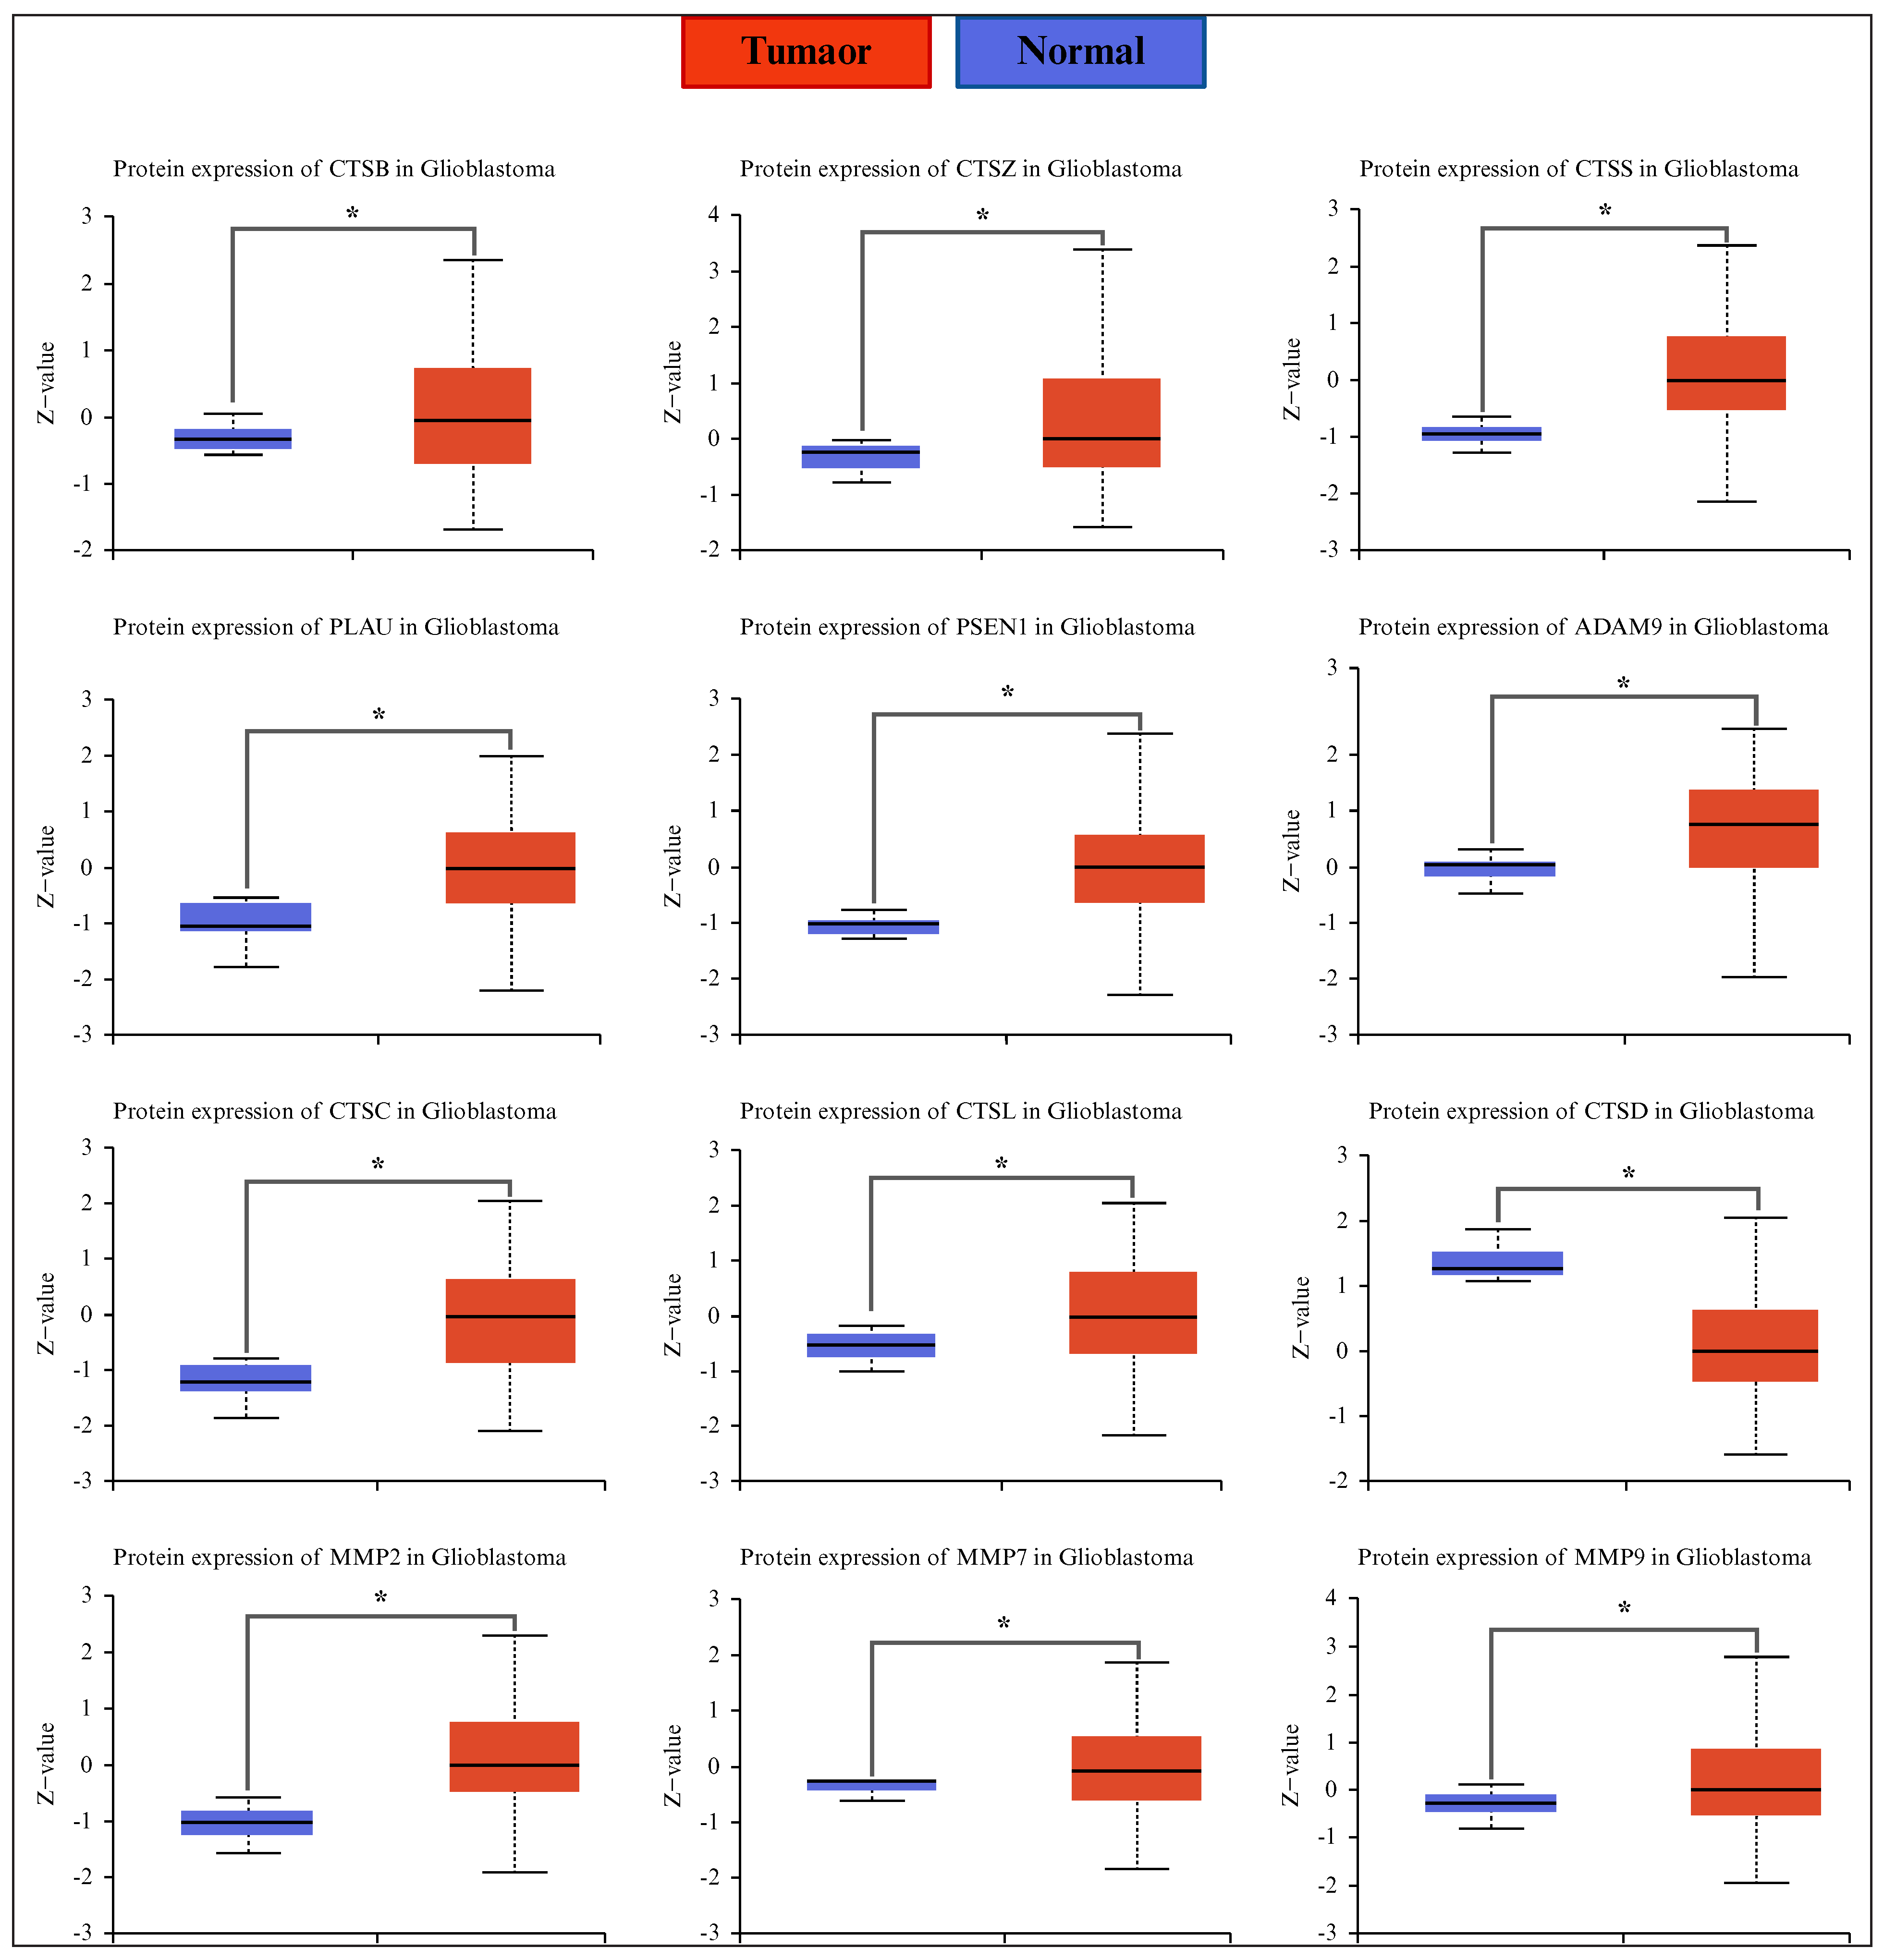
Figure 3.
Protease protein abundance was altered in glioblastoma. Proteases that showed significant changes in protein abundance are presented. Data were obtained from the CPTAC (UALCAN database) (glioblastoma, n = 99; normal tissue, n = 10). Expression values were normalized using the Z-score. Statistical significance is indicated by *p <0 .05. n: number of samples; CPTAC: Clinical Proteomic Tumor Analysis Consortium; UALCAN: University of ALabama at Birmingham CANcer data analysis Portal; Z-value: standardized score (Z-score).
A survival analysis using the GENT2 expression database showed that CTSS and MMP2 did not exhibit significant changes; high expression levels of ADAM9, CTSZ, CTSB, MMP7, CTSC, CTSL, MMP9, and PLAU were associated with poor survival in patients with different brain tumors. In contrast, low levels of PSEN1 were associated with poor survival (figure S4). We then used the CGGA database to analyze the survival of glioblastoma patients specifically. High levels of seven proteases (ADAM9, CTSB, MMP7, CTSC, CTSL, MMP9, and PLAU) were associated with the poor survival of the glioblastoma patients, whereas CTSZ and PSEN1 had no statistically significant effect on survival (figure 4). We also used a Cox proportional hazard model to assess the impact of variables such as age, sex, and tumor purity on survival. In this case, only MMP9 was significantly associated with poor survival (figure S5).
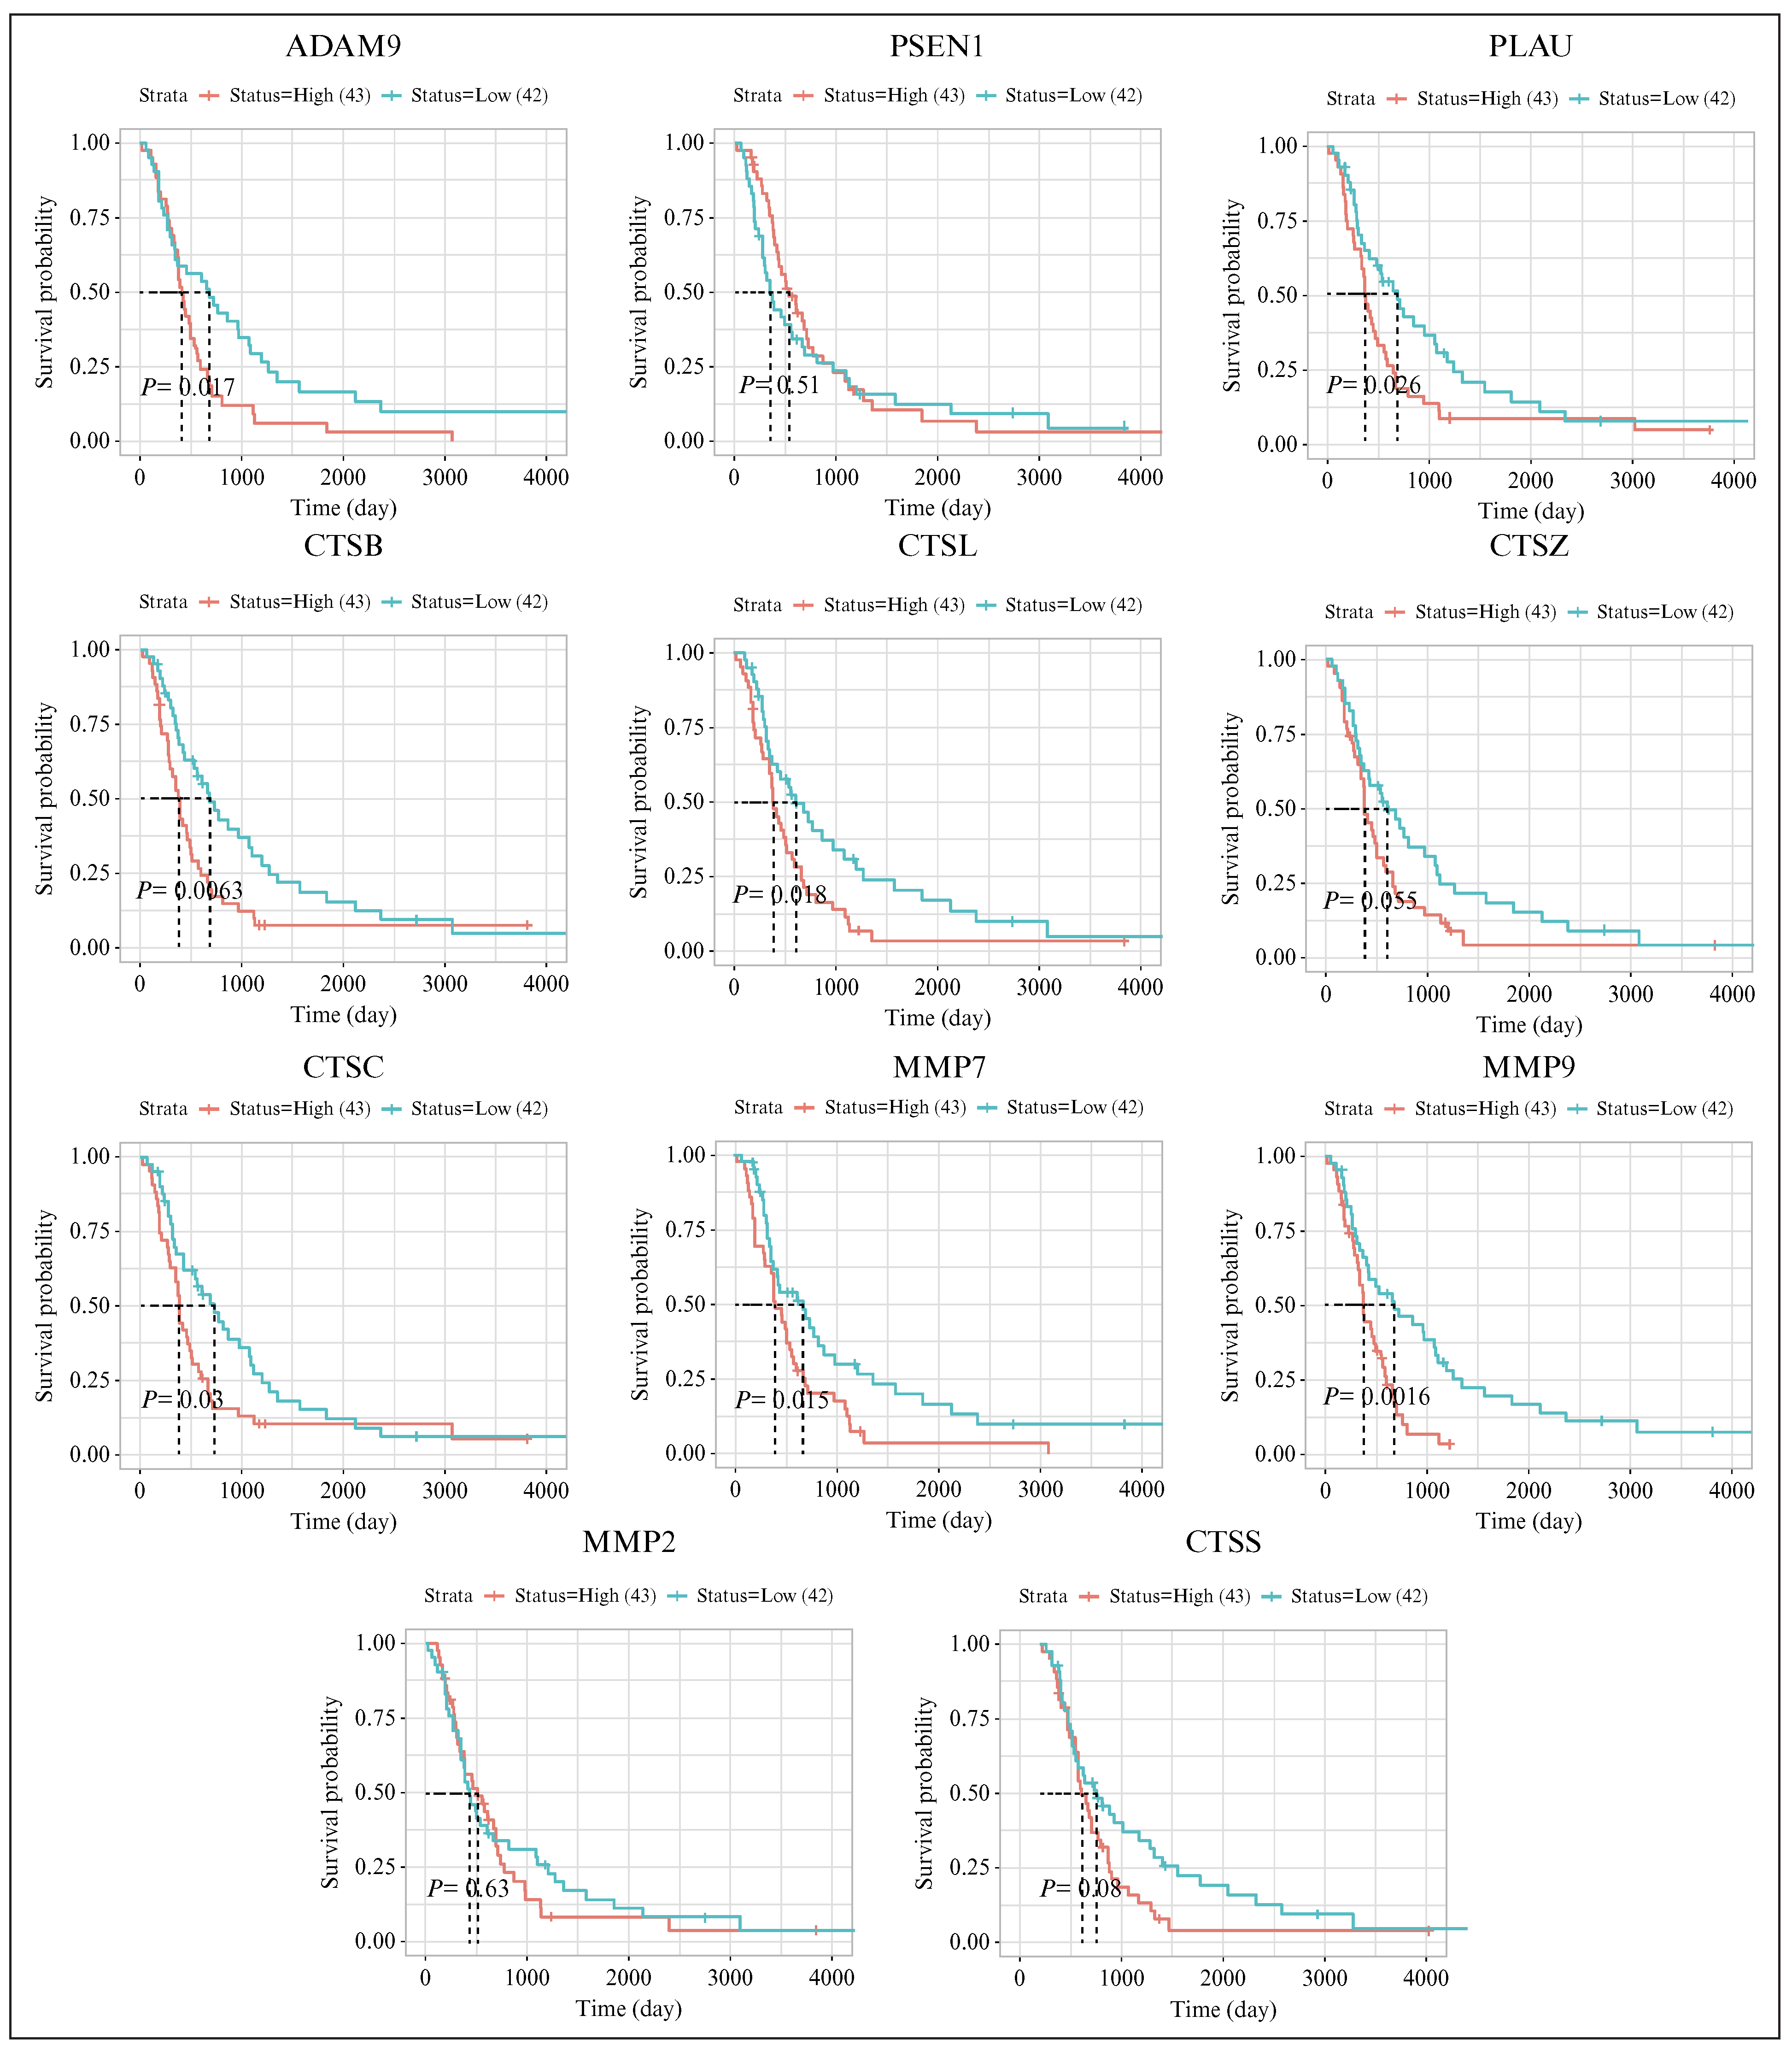
Figure 4.
Proteases with altered expression and potential impact on the survival of patients with glioblastoma. Data were obtained from the CGGA database to compare two groups of patients: 43 with high expression and 42 with low expression. Statistical significance is indicated by p < 0.05. CGGA: Chinese Glioma Genome Atlas.
Hence, the upregulation of some proteases in glioblastoma was concordant across different cancer gene expression databases (figure 5A), as was their association with the survival of patients with glioblastoma (figure 5B). A summary of these data is presented in a funnel chart (figure 5C), which displays a list of seven proteases (ADAM9, CTSB, MMP7, CTSC, CTSL, MMP9, and PLAU) and shows significant changes in gene expression and protein abundance associated with low patient survival rates.
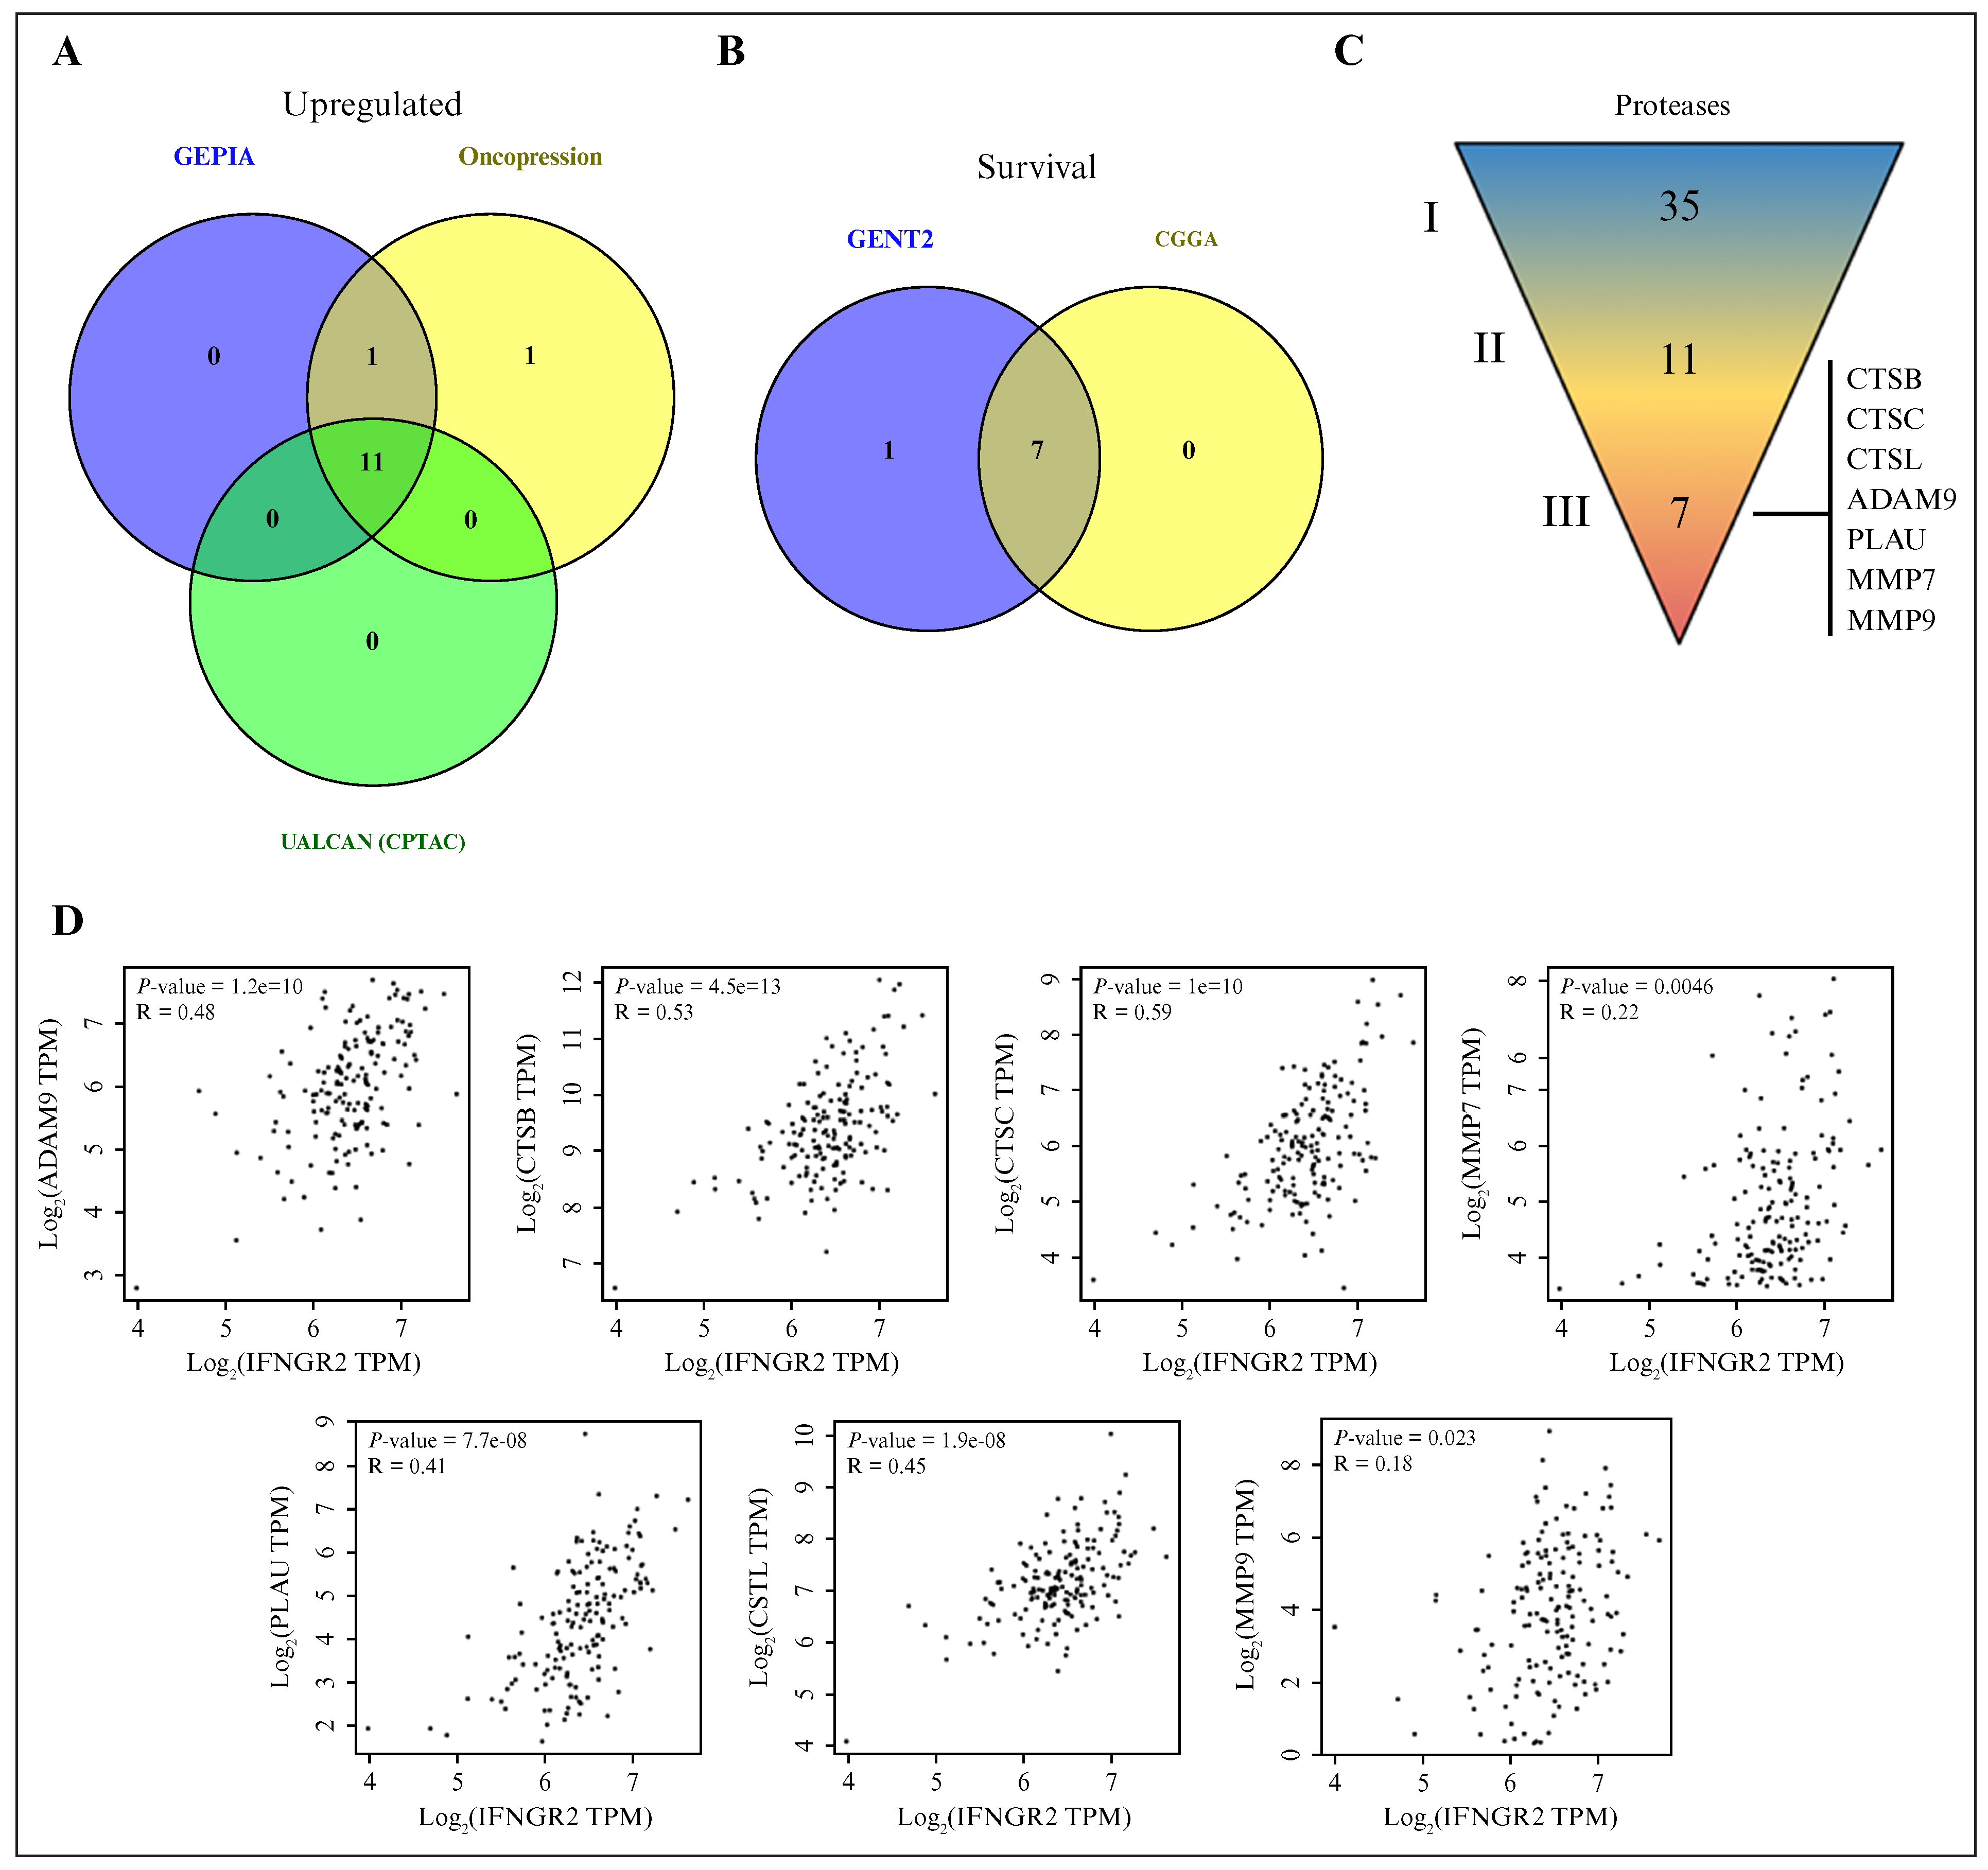
Figure 5.
The proteases involved in glioblastoma progression correlated with elements of the IFN-γ pathway in glioblastoma: (A) Venn diagram showing 11 proteases that exhibited increased expression at the mRNA level across two independent databases (Oncopression and GEPIA) and at the protein level (UALCAN/CPTAC); (B) overall survival analysis of glioblastoma patients, indicating a poorer prognosis when seven of these proteases were present at high expression levels; (C) expression and protein abundance were upregulated in (II) 11 of the (I) 35 proteases analyzed, and (II) 7 were associated with poor prognoses for glioblastoma patients; (D) significant correlations between the expression of proteases and IFN-γ pathway components in glioblastoma samples. Data were obtained from the GEPIA database (glioblastoma, n = 163). Expression values were log2 (TPM + 1) normalized. Statistical significance is indicated by p < .05. IFN-γ: interferon gamma; GEPIA: Gene Expression Profiling Interactive Analysis; UALCAN: University of Alabama at Birmingham CANcer data analysis Portal; CPTAC: Clinical Proteomic Tumor Analysis Consortium; n: number of samples; TPM: transcripts per million.
Significant correlations between the expression of some proteases and the IFN-γ signaling components in glioblastoma samples
The IFN-γ signaling pathway is deregulated in glioblastoma [7], but its interplay with protease expression has not been explored. Hence, a correlation analysis was performed to determine the expression of several components of the IFN-γ signaling pathway, including STAT1, IFNGR1, IFNGR2, JAK1, and JAK2. Scatterplots revealed that the strongest correlations were between the seven proteases and the elements of the IFN-γ signaling pathway (figure 5D and table S2). In addition, higher expression of the cathepsin group generally correlated with lower tumor purity (figure S6). The profile of purity-adjusted or partial correlations between protease expression and IFN-γ pathway elements (figure S7) was similar to the results shown in figure 5D and table S2.
IFN-γ induced an increase in the intracellular levels of some proteases in human glioblastoma cells
We decided to analyze whether IFN-γ could modulate the levels of cancer-associated proteases. We used a protein microarray containing 35 cancer-associated proteases corresponding to those previously investigated in samples taken from patients with glioblastoma. Therefore, the effects of IFN-γ on intracellular protease levels were evaluated for A172 glioblastoma cells, which were cultured for 24 h in the absence or presence of 100 ng/mL of IFN-γ. Total protein extracts from glioblastoma cells were obtained to analyze the intracellular protein levels of 35 cancer-associated proteases using a Proteome Profiler Human Protease Array Kit (Cat. #ARY021B; R&D Systems (Bio-Techne), Minneapolis, MN, USA). The glioblastoma cells treated with IFN-γ showed changes in intracellular levels of several proteases compared to untreated cells (figure 6A, short and long exposures).
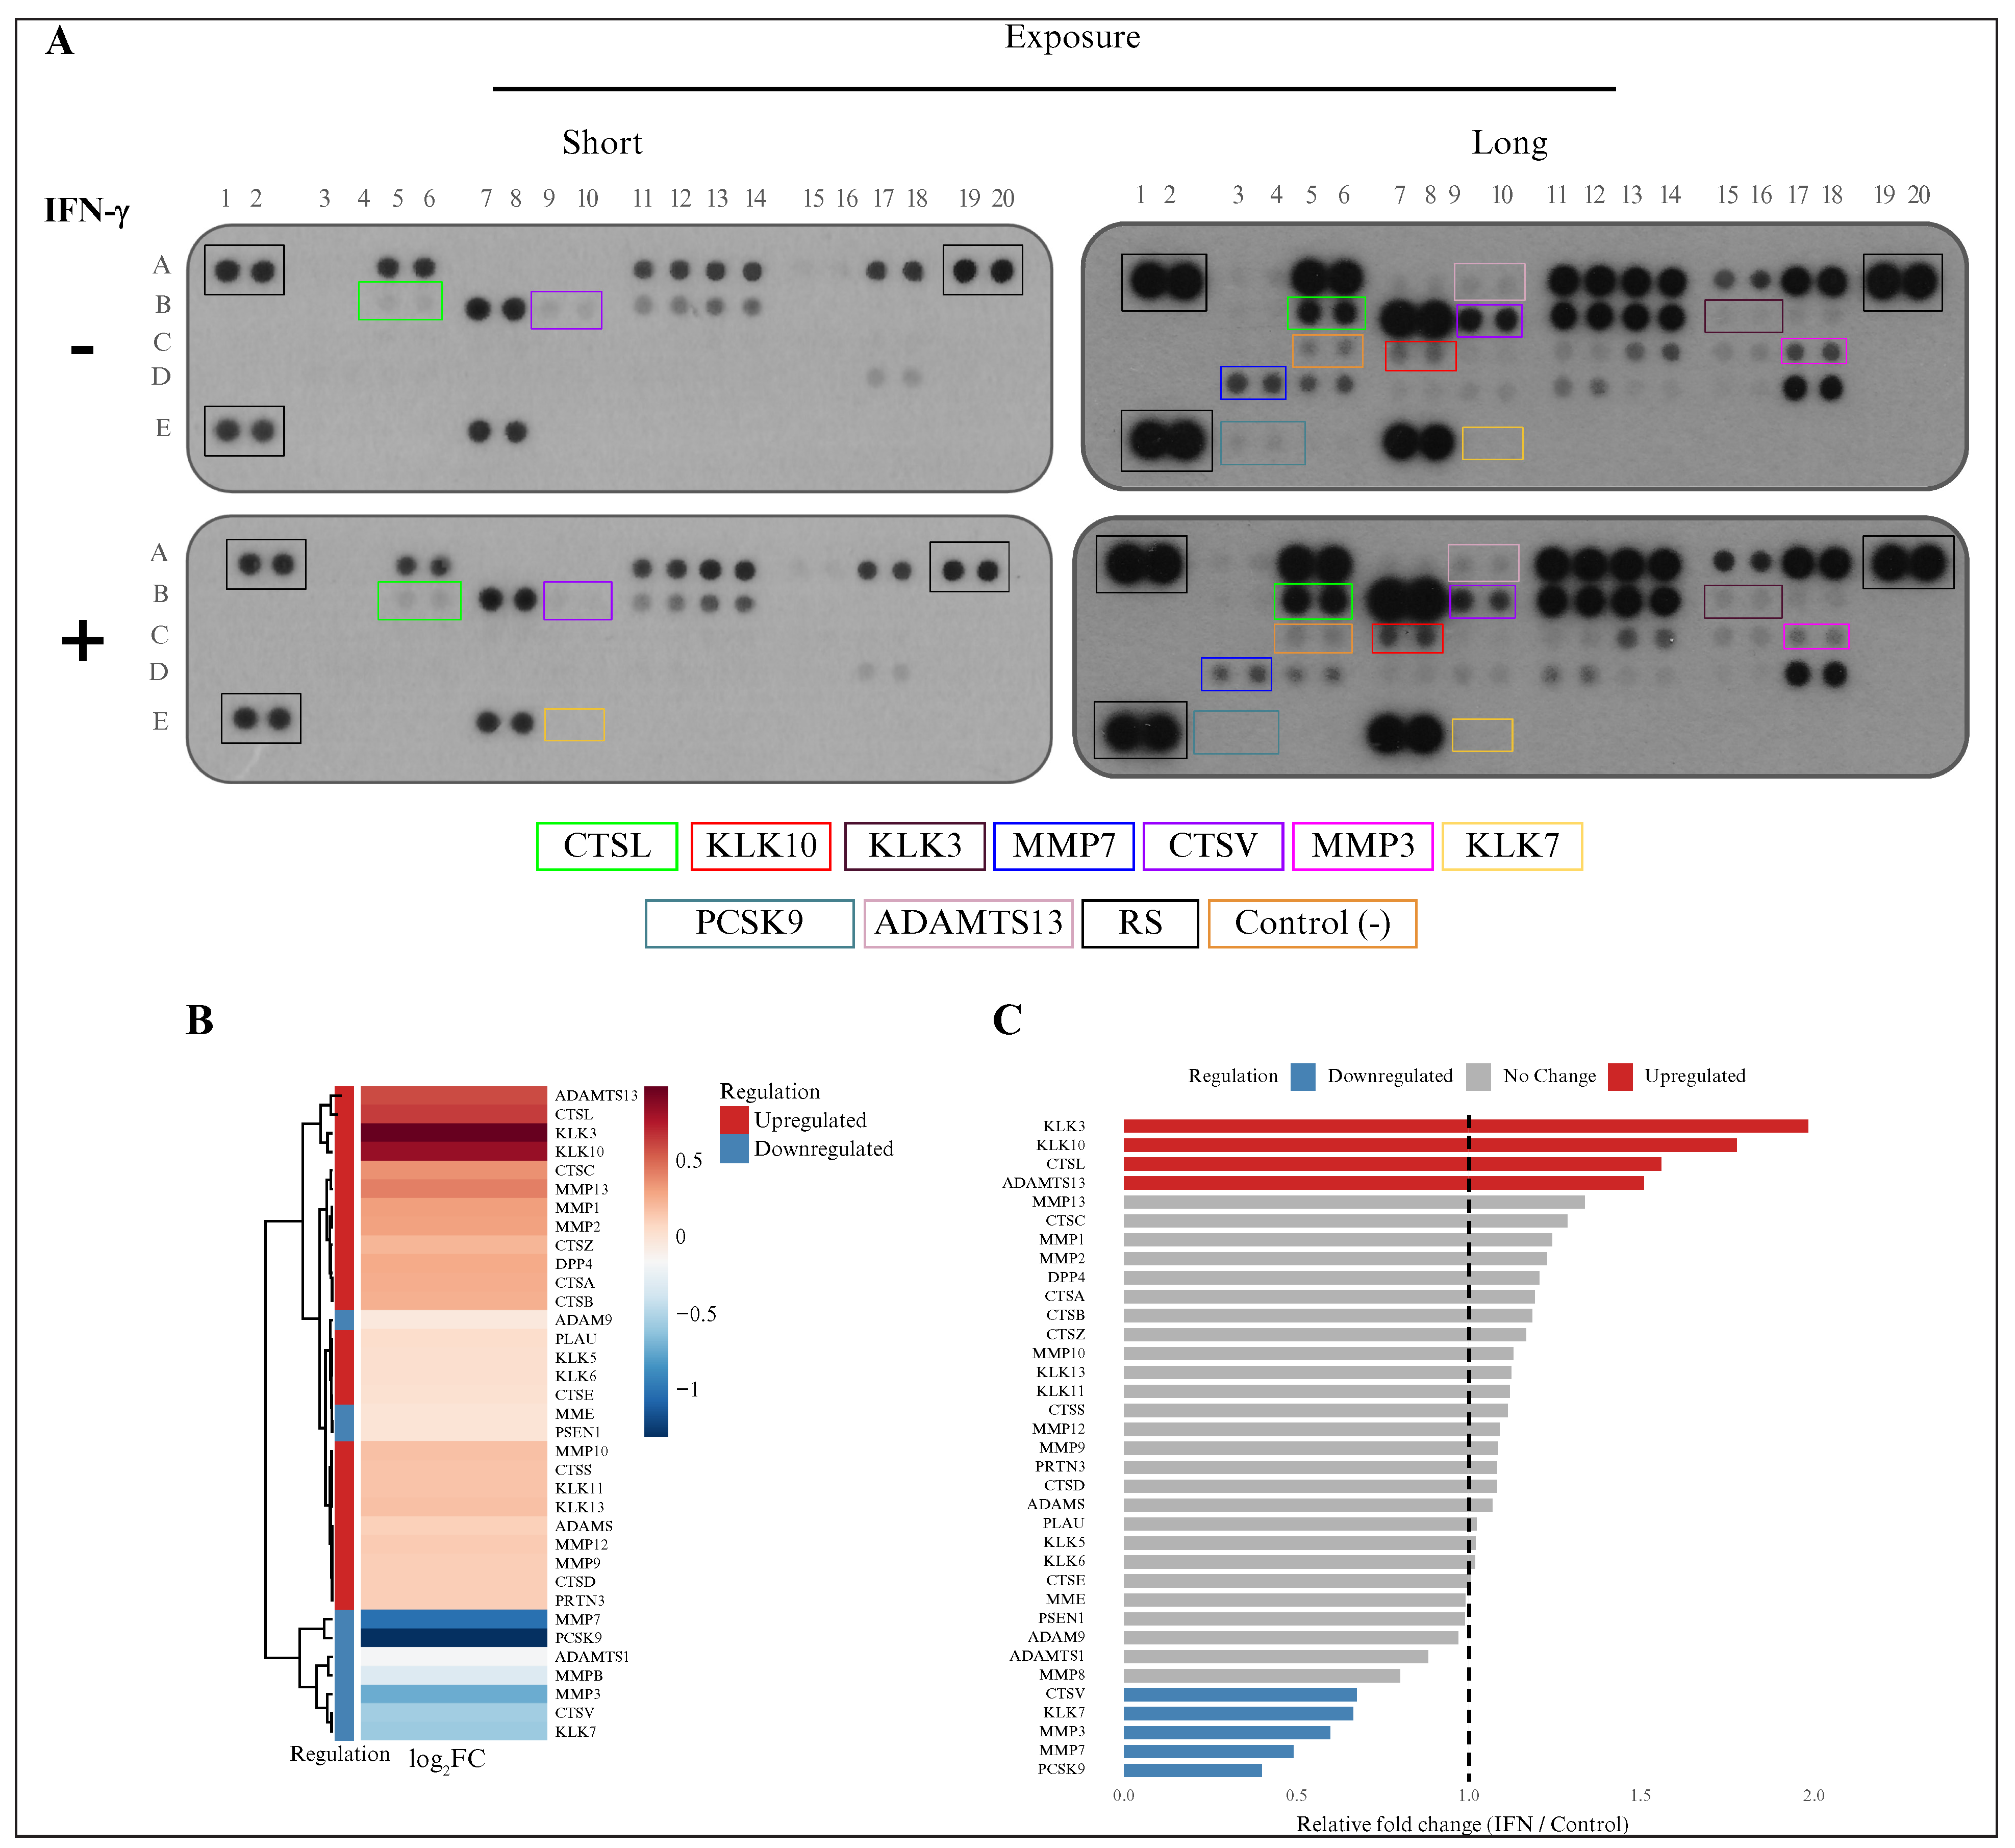
Figure 6.
IFN-γ modulated the abundance of intracellular proteases in glioblastoma cells: (A) protein microarrays comparing control and IFN-γ-treated (100 ng/mL) A172 glioblastoma cells at two exposure levels (high and low; proteases that showed altered abundance are highlighted with colored boxes and are listed below); (B) densitometric analysis represented as a heat map (log2FC), illustrating upregulated (red) and downregulated (blue) proteases following IFN-γ treatment; (C) bar plot showing the relative fold change (IFN-γ-treated vs. control) in protease abundance, categorized as upregulated, unchanged, or downregulated. IFN-γ: interferon gamma; FC: fold change.
The microarray results were used for semiquantitative analysis of protein abundance by densitometry, normalized to the microarray reference spots. The densitometry results for IFN-γ-stimulated cells were subsequently normalized to the control microarray spots. These results were visualized as heat maps (figure 6B) and bar plots (figure 6C), and they suggested that among the 35 evaluated proteases, only 9 showed increased protein levels in IFN-γ-treated cells compared to untreated cells. The protein levels of four proteases (CTSL, KLK10, KLK3, and ADAMTS13) were highest in IFN-γ-treated glioblastoma cells, while the abundance of five proteases (MMP3, MMP7, KLK7, CTSV, and PCSK9) was lower following IFN-γ stimulation.
IFN-γ increased the secretion of some proteases in human glioblastoma cells
The effect of IFN-γ on protease secretion from glioblastoma cells was determined in the CM of A172 cells treated with or without IFN-γ. The levels of proteases in the CM were also analyzed using a Proteome Profiler Human Protease Array Kit (figure 7A). Similarly, densitometry analysis was performed, and the results were visualized as a heat map (figure 7B) and a bar plot (figure 7C). The CTSL, KLK10, MMP3, and PRTN3 levels exhibited changes in the cells following IFN-γ stimulation. IFN-γ increased the secretion of CTSL and KLK10, while the levels of MMP3 and PRTN3 decreased in response to IFN-γ compared to the control.
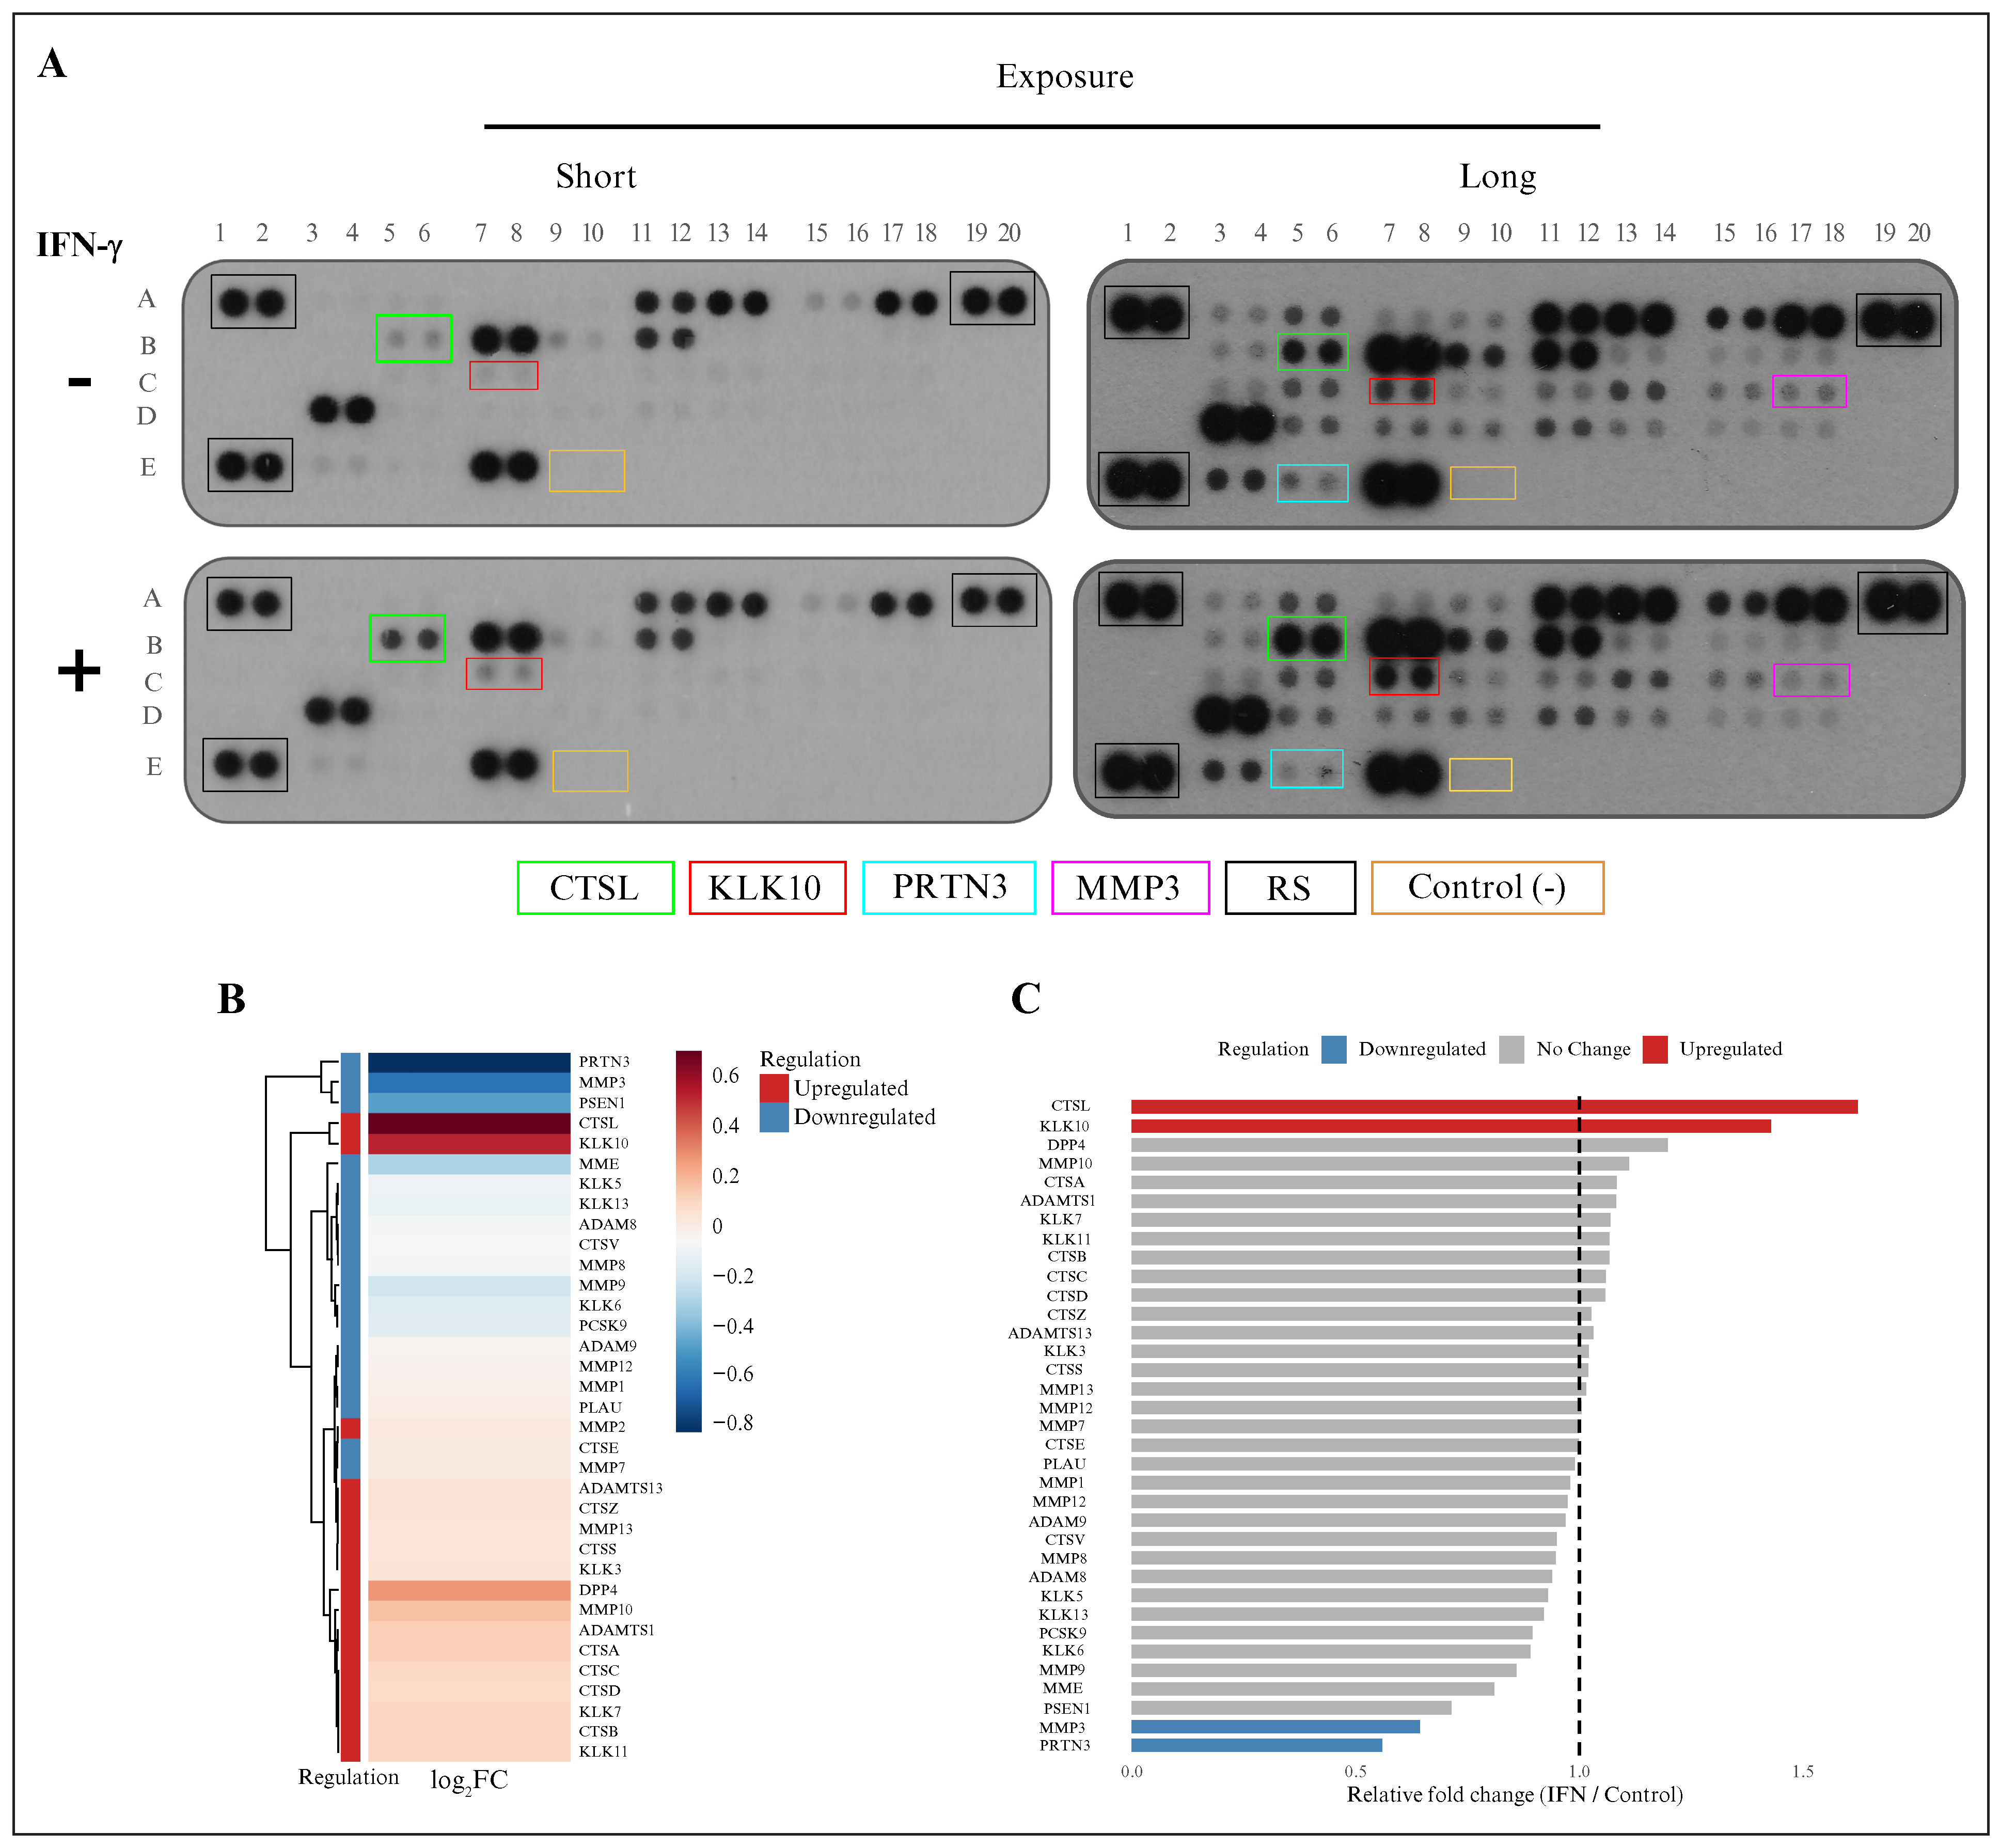
Figure 7.
IFN-γ modulated the abundance of extracellular proteases in glioblastoma cells: (A) protein microarrays comparing control and IFN-γ-treated (100 ng/mL) A172 glioblastoma cells at two exposure levels (high and low; proteases that showed altered abundance are highlighted with colored boxes and are listed below); (B) densitometric analysis represented as a heat map (log2FC), illustrating upregulated (red) and downregulated (blue) proteases following IFN-γ treatment; (C) bar plot showing the relative fold change (IFN-γ-treated vs. control) in protease abundance, categorized as upregulated, unchanged, or downregulated. IFN-γ interferon gamma; FC: fold change.
CTSL protease upregulated in glioblastoma cells and positively regulated by IFN-γ
We analyzed CTSL and its regulation at the protein level following IFN-γ treatment considering: 1) glioblastoma samples had higher CTSL expression associated with poor survival, and 2) the intra- and extracellular levels of CTSL were increased in glioblastoma cells treated with IFN-γ according to the microarray assay. Hence, we detected CTSL protein and its subcellular localization using dot blot/western blot, and IF assays for glioblastoma-derived cells A172 and U373, respectively. According to the results, the levels of CTSL increased intracellularly in response to IFN-γ, mainly in the extracellular medium (figure 8A-C). We also observed that CTSL was localized in both the cytoplasm and mitochondria, which was consistent with the prediction analysis indicating that CTSL could be predominantly localized in these cellular compartments (figure 8D). These results suggest that IFN-γ may induce an increase in the levels of some proteases, such as CTSL, to mediate their protumor actions in glioblastoma cells. Additionally, we corroborated that KLK10 was upregulated in response to IFN-γ (figure S8). The use of ruxolitinib—an inhibitor of JAK-STAT signaling—resulted in decreased detection of p-STAT1, CTSL, and KLK10 (figure S9), suggesting that the IFN-γ pathway is associated with the upregulation of these proteases.
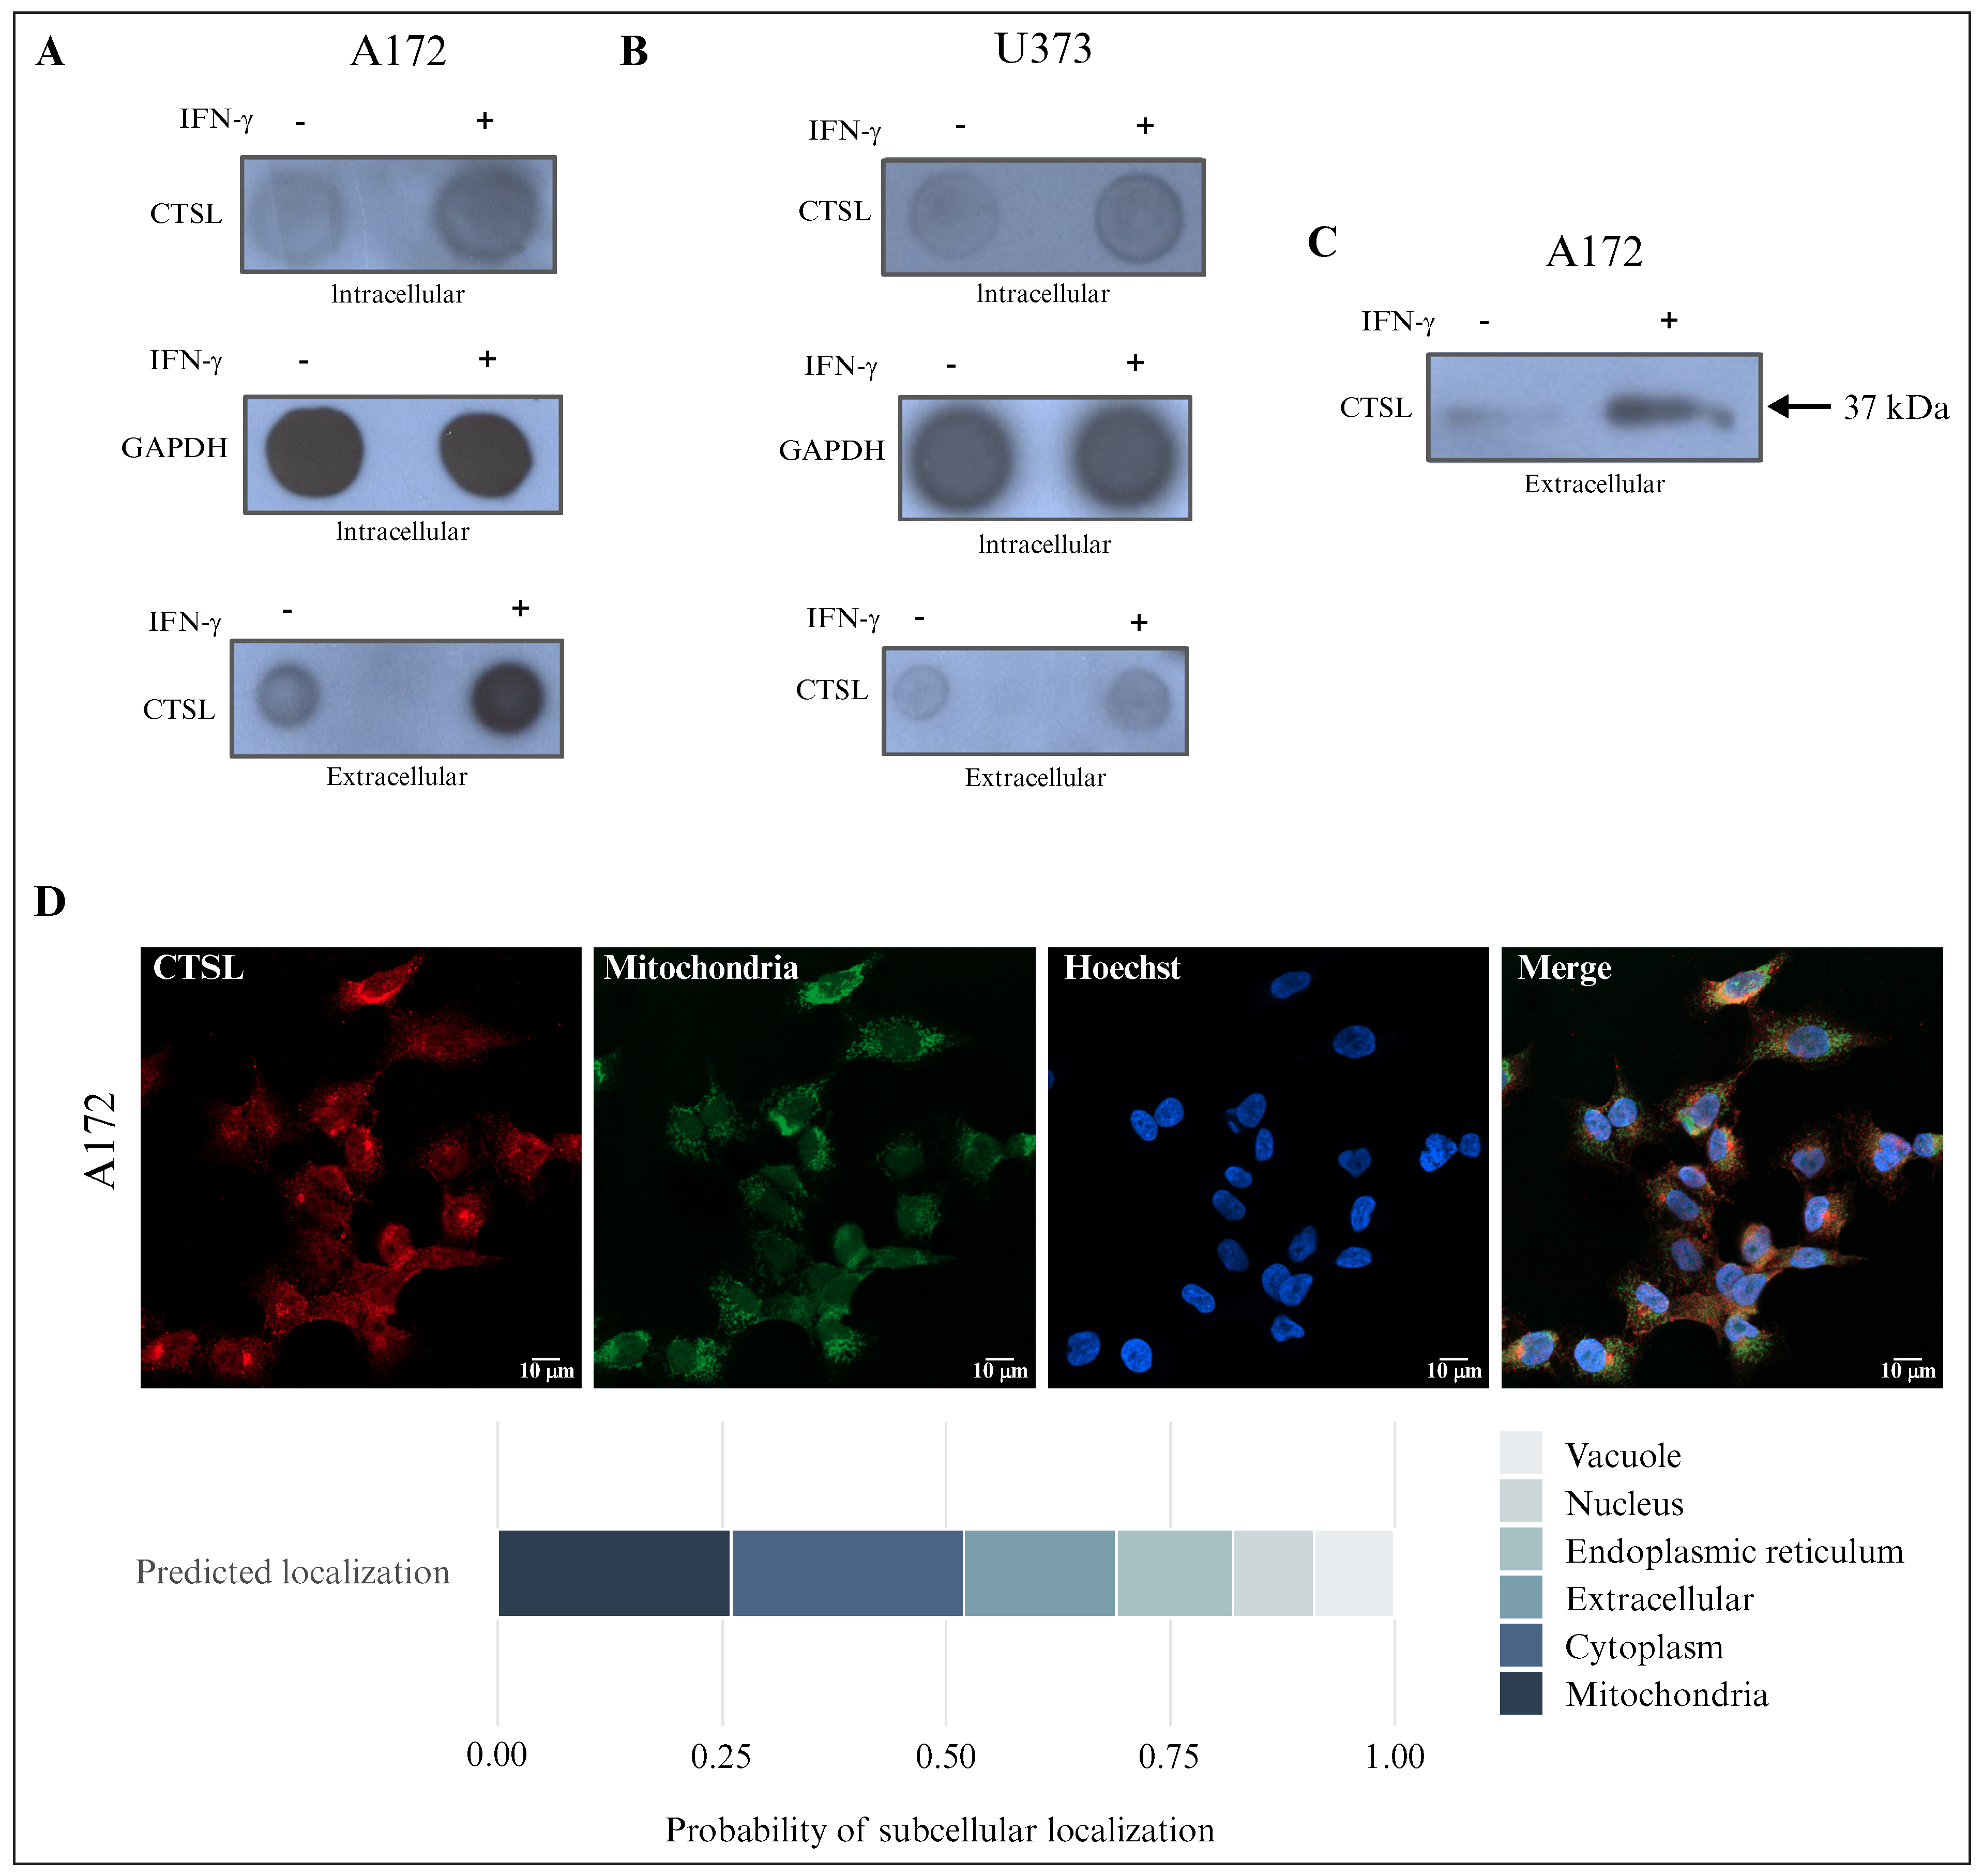
Figure 8.
IFN-γ modulated the intra- and extracellular abundance of CTSL in glioblastoma cells: (A) dot blot analysis of CTSL in A172 glioblastoma cells (n = 3); (B) dot blot analysis of CTSL in U373 glioblastoma cells (n = 3; intracellular and extracellular protein fractions were analyzed); (C) Western blot analysis of CTSL in A172 glioblastoma cells in a conditioned environment (two conditions: control and IFN-γ stimulation at 100 ng/mL, N = 3); (D) immunofluorescence of CTSL (red), mitochondria (green), and nuclei (Hoechst, blue) in A172 cells (n = 3). The bottom panel shows the predicted subcellular localization probabilities of CTSL based on bioinformatics analysis. IFN-γ: interferon gamma; CTSL: cathepsin L; n: number of independent experiments.
DISCUSSION
Proteases play crucial roles in both physiological and pathological processes [29–31], and the deregulation of their expression and function is associated with certain types of cancer. In this study, we analyzed 35 proteases that have frequently been used to demonstrate deregulation in several cancer types (table S1) but not in glioblastoma. Moreover, they are diverse proteases classified into five subfamilies (cysteine, serine, threonine, metallo, and aspartic proteases). Based on our analysis of gene expression via cancer databases, several proteases (16 according to GEPIA and 15 according to Oncopression) of the 35 analyzed were deregulated in human glioblastoma tissue compared to healthy tissue. Hence, most of these proteases—CTSB [32], MMP9 [33], MMP2 [34], CTSD, CTSS [35], ADAM9, CTSC [36], CTSL [37], CTSZ [38], PSEN1, PLAU [39], and MMP7—exhibited increased expression in glioblastoma tissue compared to normal tissue, but some—KLK5, KLK7, ADAMTS13, and PRTN3—exhibited decreased expression.
To analyze the association of these proteases with glioblastoma progression, we examined the relationship between patient survival and the expression of each protease. MMP2, CTSS, and PSEN1 were upregulated in glioblastoma, but their association with survival was not statistically significant in these patients. Nevertheless, the upregulation of seven proteases—ADAM9, CTSB, MMP7, CTSC, CTSL, MMP9, and PLAU—was associated with poor survival. In contrast, the downregulation of KLK5/7, ADAMTS13, and PRTN3 was associated with poor survival, suggesting antitumor action for these proteases in glioblastoma. However, because our study was limited to 35 cancer-related proteases, other proteases may also be deregulated in glioblastoma, thus opening up new opportunities for investigation.
We performed a correlation analysis to examine the interplay between glioblastoma-associated proteases and IFN-γ signaling, since the IFN-γ pathway is deregulated in glioblastoma, and plays a protumorigenic role [7, 40, 41]. The proteases upregulated in glioblastoma cells (ADAM9, CTSB, MMP7, CTSC, CTSL, MMP9, and PLAU) correlated with the upregulation of at least one IFN-γ signaling component, suggesting a regulatory axis between these proteases and IFN-γ signaling.
Our analysis of the protein array containing the 35 cancer-associated proteases showed that some proteases increased and others decreased in A172 glioblastoma cells following IFN-γ treatment. Interestingly, although IFN-γ treatment increased the levels of protumor proteases, it also increased the levels of some proteases reported to have antitumor activity in other cancer types, such as KLK10 [42]. Hence, our results suggest that IFN-γ may play a dual role in glioblastoma by modulating protease levels. The molecular mechanisms by which IFN-γ regulates pro- and antitumor proteases require further investigation, particularly the regulation of antitumor proteases by IFN-γ, which was shown for the first time in this study.
To validate our protease array results, we used assays to investigate the CTSL protease in glioblastoma-derived cell lines, such as A172 and U373, treated with IFN-γ. CTSL was selected because it is considered a protumorigenic protease in other cancer types, such as gastric cancer [43], breast cancer [44], and lung adenocarcinoma [45]. CTSL seems to be an oncoprotein in glioblastoma, but the mechanisms associated with its regulation are not well understood [46–48]. In addition, our analysis revealed that CTSL expression increased in glioblastoma cells and was associated with poor patient survival, showing a positive correlation with IFN-γ pathway elements, such as IFNGR1, IFNGR2, and JAK2, in this cancer tissue.
Based on these results, we studied the effects of IFN-γ on CTSL abundance and localization. CTSL levels increased in the extracellular medium of glioblastoma cells following IFN-γ treatment. Furthermore, CTSL was localized intracellularly in the mitochondria and cytoplasm of A172 cells, as predicted. The use of ruxolitinib—a JAK-STAT pathway inhibitor that blocks IFN-γ signaling—decreased the detection of pSTAT1 and CTSL in cells. All of these results suggest a potential axis between IFN-γ signaling and the CTSL protein, highlighting the role of IFN-γ signaling in upregulating this protease, which is associated with glioblastoma progression.
CTSL and its modulation by IFN-γ may be key drivers of therapies for glioblastoma, including immunotherapy. For example, CTSL has been identified as a driver of PD-L1-dependent immune evasion in HNSCC [49]. CTSL is also considered a biomarker for predicting immunotherapeutic responses in lung adenocarcinoma [45]. Immunosuppressive molecules, such as IDO1 and PD-L1, are induced by IFN-γ in glioblastoma cells [11]. Nevertheless, further studies are necessary to elucidate the molecular mechanisms by which IFN-γ increases CTSL protein levels and its implications for glioblastoma progression. Likewise, further investigations are required to determine whether the modulation of CTSL by IFN-γ is exclusive to brain tumors or is also associated with other neuropathologies.
It is important to note that we also confirmed the upregulation of KLK10 levels in response to IFN-γ treatment in glioblastoma cells (figure S8). The deep analysis of antitumorigenic proteases, such as KLK10, and their modulation by IFN-γ signaling requires evidence that they can act as suppressors of glioblastoma (rather than playing the typical oncoprotein role of some proteases).
Our investigation opens up novel areas of study. First, we identified seven proteases with protumor actions in glioblastoma and found that other proteases were downregulated and may be involved in antitumor actions. Second, we demonstrated that IFN-γ modulates (both increases and decreases) the levels of specific proteases. One of the IFN-γ-modulated proteases associated with glioblastoma is CTSL, but the underlying mechanisms require further exploration. Thus, we revealed a novel molecular mechanism triggered by IFN-γ that modulates specific proteases in glioblastoma, which may help identify potential biomarkers and therapeutic targets.
Despite our investigation providing novel insights into the dual effects of IFN-γ in glioblastoma by modulating protease levels, our study focused exclusively on 35 cancer-associated proteases. Therefore, other proteases may also be affected by IFN-γ signaling in this cancer. Hence, although IFN-γ may regulate the expression and abundance of several proteases, the molecular mechanisms underlying this modulation remain unclear. Further studies are needed to elucidate the molecular pathways induced by IFN-γ to modulate the protease abundance and their effects on glioblastoma progression.
CONCLUSION
The proteases ADAM9, CTSZ, CTSB, MMP7, CTSC, CTSL, and MMP9 were upregulated in glioblastoma cells and were associated with decreased patient survival. Of these, the CTSL protein was upregulated through IFN-γ signaling. This identified protease signature may be helpful in designing strategies for the detection and treatment of glioblastoma.
DISCLOSURE
Financial support: none. Conflict of interest: none.
Funding statement: This study was supported by Colegio de Ciencia y Tecnología de la Universidad Autónoma de la Ciudad de México (CCyT-UACM), No. CCyT-2025-CON-11 (to ACTC). Secretaría de Ciencia, Humanidades, Tecnología e Innovación (SECIHTI) awarded postgraduate fellowships to EGPS and EOM.
Authors’ contributions: Enrique Oropeza-Maetínez and Eva G Palacios-Serrato performed the experiments, conducted the bioinformatic analyses, and contributed to the preparation of the manuscript. Marina Macías-Silva participated in the manuscript revision. Angeles C Tecalco-Cruz supervised the project and participated in manuscript writing and revision. All authors read and approved the final version of the manuscript.
Availability of data and materials: The authors declare that all data supporting the results of this study are included in the article and its supplementary materials.
Ethics Approval and Informed Consent: The data analyzed in this study were obtained from publicly available repositories, and all patient information was anonymized. As a result, additional ethics approval and informed consent were not required.
Conflicts of interest: The authors declare no conflicts of interest.
Acknowledgement: We sincerely thank the Secretaría de Ciencia, Humanidades, Tecnología e Innovación (SECIHTI) for their support of Eva G Palacios-Serrato and Enrique Oropeza-Maetínez during their postgraduate studies. We thank Josué Ramirez Jarquín and Marcela Sosa for their technical support.
REFERENCES
1. Ostrom QT, Patil N, Cioffi G . CBTRUS statistical report: primary brain and other central nervous system tumors diagnosed in the United States in 2013–2017. Neuro Oncol 2020;22 Suppl 1:iv1-96. [Google Scholar]
2. Ostrom QT, Price M, Neff C . CBTRUS statistical report: primary brain and other central nervous system tumors diagnosed in the United States in 2015–2019. Neuro Oncol 2022;24 Suppl 5:v1-95. [Google Scholar]
3. Singh S, Dey D, Barik D . Glioblastoma at the crossroads: current understanding and future therapeutic horizons. Signal Transduct Target Ther 2025;10:213. [Google Scholar]
4. Sarkar P, Manna A, Bera S . Chitosan nanocarriers: a promising approach for glioblastoma therapy. Carbohydr Polym 2025;365:123823. [Google Scholar]
5. Fernandes RT, Teixeira GR, Mamere EC . The 2021 World Health Organization classification of gliomas: an imaging approach. Radiol Bras 2023;56:157-61. [Google Scholar]
6. Xu H, Wang C, Xiao B. Systemic IFN-I synergizes with topical TLR7/8 agonists to suppress metastatic tumors. Research 2025;8. [Google Scholar]
7. Zamora-Salas SX, Macías-Silva M, Tecalco-Cruz AC. Upregulation of the canonical signaling pathway of interferon-gamma is associated with glioblastoma progression. Mol Biol Rep 2024;51:64. [Google Scholar]
8. Ding H, Wang G, Yu Z . Role of interferon-gamma (IFN-γ) and IFN-γ receptor 1/2 in regulation of immunity, infection, and cancer development: IFN-γ-dependent or independent pathway. Biomed Pharmacother 2022;155:113683. [Google Scholar]
9. Liu X. The paradoxical role of IFN-γ in cancer: balancing immune activation and immune evasion. Pathol Res Pract 2025;272:156046. [Google Scholar]
10. Zhao T, Li Y, Zhang J . PD-L1 expression increased by IFN-γ via JAK2-STAT1 signaling and predicts poor survival in colorectal cancer. Oncol Lett 2020;20:1127-34. [Google Scholar]
11. Jung MY, Aibaidula A, Brown DA . Superinduction of immunosuppressive glioblastoma extracellular vesicles by IFN-γ through PD-L1 and IDO1. Neurooncol Adv 2022;4. [Google Scholar]
12. Vergnolle N. Protease inhibition as new therapeutic strategy for gastrointestinal diseases. Gut 2016;65:1215-24. [Google Scholar]
13. Habič A, Novak M, Majc B . Proteases regulate cancer stem cell properties and remodel their microenvironment. J Histochem Cytochem 2021;69:775-94. [Google Scholar]
14. Ma Z, Qin H, Benveniste EN. Transcriptional suppression of matrix metalloproteinase-9 gene expression by IFN-γ and IFN-β: critical role of STAT-1α. J Immunol 2001;167:5150-9. [Google Scholar]
15. Ma Z, Chang MJ, Shah RC . Interferon-γ-activated STAT-1α suppresses MMP-9 gene transcription by sequestration of the coactivators CBP/p300. J Leukoc Biol 2005;78:515-23. [Google Scholar]
16. Nguyen J, Knapnougel P, Lesavre P . Inhibition of matrix metalloproteinase-9 by interferons and TGF-β1 through distinct signalings accounts for reduced monocyte invasiveness. FEBS Lett 2005;579:5487-93. [Google Scholar]
17. Tamai K, Ishikawa H, Mauviel A . Interferon-γ coordinately upregulates matrix metalloprotease-1 and -3, but not tissue inhibitor of metalloproteases, expression in cultured keratinocytes. J Invest Dermatol 1995;104:384-90. [Google Scholar]
18. Vu TN, Chen X, Foda HD . Interferon-γ enhances the antifibrotic effects of pirfenidone by attenuating IPF lung fibroblast activation and differentiation. Respir Res 2019;20:206. [Google Scholar]
19. Tang Z, Li C, Kang B . GEPIA: a web server for cancer and normal gene expression profiling and interactive analyses. Nucleic Acids Res 2017;45:W98-102. [Google Scholar]
20. Chandrashekar DS, Bashel B, Balasubramanya SAH . UALCAN: a portal for facilitating tumor subgroup gene expression and survival analyses. Neoplasia 2017;19:649-58. [Google Scholar]
21. Lee J, Choi C. Oncopression: gene expression compendium for cancer with matched normal tissues. Bioinformatics 2017;33:2068-70. [Google Scholar]
22. Park SJ, Yoon BH, Kim SK . GENT2: an updated gene expression database for normal and tumor tissues. BMC Med Genomics 2019;12 Suppl 5:101. [Google Scholar]
23. Zhao Z, Zhang KN, Wang Q . Chinese Glioma Genome Atlas (CGGAa comprehensive resource with functional genomic data from Chinese glioma patients. Genomics Proteomics Bioinformatics 2021;19:1-12. [Google Scholar]
24. Cui H, Zhao G, Lu Y et al. TIMER3: an enhanced resource for tumor immune analysis. Nucleic Acids Res 2025;53:W534-41. [Google Scholar]
25. Oliveros JC. Venny: an interactive tool for comparing lists with Venn’s diagrams. BioinfoGP Serv Natl Cent Biotechnol (CNB CSIC) 2007. [Google Scholar]
26. Delen E, Doğanlar O. The dose dependent effects of ruxolitinib on the invasion and tumorigenesis in gliomas cells via inhibition of interferon gamma-depended JAK/STAT signaling pathway. J Korean Neurosurg Soc 2020;63:444-54. [Google Scholar]
27. Horton P, Park KJ, Obayashi T . WoLF PSORT: protein localization predictor. Nucleic Acids Res 2007;35:W585-7. [Google Scholar]
28. Schindelin J, Arganda-Carreras I, Frise E . Fiji: an open-source platform for biological-image analysis. Nat Methods 2012;9:676-82. [Google Scholar]
29. Tagirasa R, Yoo E. Role of serine proteases at the tumor-stroma interface. Front Immunol 2022;13. [Google Scholar]
30. Vizovisek M, Ristanovic D, Menghini S . The tumor proteolytic landscape: a challenging frontier in cancer diagnosis and therapy. Int J Mol Sci 2021;22:2514. [Google Scholar]
31. Kramer L, Turk D, Turk B. The future of cysteine cathepsins in disease management. Trends Pharmacol Sci 2017;38:873-98. [Google Scholar]
32. Rempel SA, Rosenblum ML, Mikkelsen T . Cathepsin B expression and localization in glioma progression and invasion. Cancer Res 1994;54:6027-31. [Google Scholar]
33. Wu Z, Yang Y, Chen M et al. Matrix metalloproteinase 9 expression and glioblastoma survival prediction using machine learning on digital pathological images. Sci Rep 2024;14:15065. [Google Scholar]
34. Du R, Petritsch C, Lu K . Matrix metalloproteinase-2 regulates vascular patterning and growth affecting tumor cell survival and invasion in GBM. Neuro Oncol 2008;10:254-64. [Google Scholar]
35. Flannery T, McQuaid S, McGoohan C . Cathepsin S expression: an independent prognostic factor in glioblastoma tumours—a pilot study. Int J Cancer 2006;119:854-60. [Google Scholar]
36. Cheng X, Ren Z, Liu Z . Cysteine cathepsin C: a novel potential biomarker for the diagnosis and prognosis of glioma. Cancer Cell Int 2022;22:53. [Google Scholar]
37. Zajc I, Hreljac I, Lah T. Cathepsin L affects apoptosis of glioblastoma cells: a potential implication in the design of cancer therapeutics. Anticancer Res 2006;26:3357-64. [Google Scholar]
38. Majc B, Habič A, Novak M . Upregulation of cathepsin X in glioblastoma: interplay with γ-enolase and the effects of selective cathepsin X inhibitors. Int J Mol Sci 2022;23:1784. [Google Scholar]
39. Gilder AS, Natali L, Van Dyk DM . The urokinase receptor induces a mesenchymal gene expression signature in glioblastoma cells and promotes tumor cell survival in neurospheres. Sci Rep 2018;8:2982. [Google Scholar]
40. Sørensen MD, Olsen RFS, Burton M . Microglia induce an interferon-stimulated gene expression profile in glioblastoma and increase glioblastoma resistance to temozolomide. Neuropathol Appl Neurobiol 2024;50. [Google Scholar]
41. Qian J, Wang C, Wang B . The IFN-γ/PD-L1 axis between T cells and tumor microenvironment: hints for glioma anti-PD-1/PD-L1 therapy. J Neuroinflammation 2018;15:290. [Google Scholar]
42. Hu J, Lei H, Fei X et al. NES1/KLK10 gene represses proliferation, enhances apoptosis and down-regulates glucose metabolism of PC3 prostate cancer cells. Sci Rep 2015;5:17426. [Google Scholar]
43. Xiao LX, Li XJ, Yu HY . Macrophage-derived cathepsin L promotes epithelial-mesenchymal transition and M2 polarization in gastric cancer. World J Gastroenterol 2024;30:5032-54. [Google Scholar]
44. Zhang L, Zhao Y, Yang J . CTSL, a prognostic marker of breast cancer, that promotes proliferation, migration, and invasion in cells in triple-negative breast cancer. Front Oncol 2023;13. [Google Scholar]
45. Lu J, Liang J, Xiao G . Cathepsin L in lung adenocarcinoma: prognostic significance and immunotherapy response through a multi omics perspective. Cancer Inform 2024;23. [Google Scholar]
46. Dong Q, Li Q, Duan L . Expressions and significances of CTSL, the target of COVID‐19 on GBM. J Cancer Res Clin Oncol 2022;148:599-608. [Google Scholar]
47. Xiong Y, Ji W, Fei Y . Cathepsin L is involved in X-ray-induced invasion and migration of human glioma U251 cells. Cell Signal 2017;29:181-91. [Google Scholar]
48. Ding X, Zhang C, Chen H . Cathepsins trigger cell death and regulate radioresistance in glioblastoma. Cells 2022;11:4108. [Google Scholar]
49. Ding Y, Zhang H, Wang X . Targeting lysosomal protease CTSL promotes anti-tumor immunity and sensitizes HNSCC to PD-1 blockade by stabilizing PDK1 and activating Akt–PD-L1 axis. Neoplasia 2025;69:101228. [Google Scholar]
50. Mohammed FH, Khajah MA, Yang M . Blockade of voltage-gated sodium channels inhibits invasion of endocrine-resistant breast cancer cells. Int J Oncol 2016;48:73-83. [Google Scholar]
51. Li S, Pritchard DM, Yu LG. Galectin-3 promotes secretion of proteases that decrease epithelium integrity in human colon cancer cells. Cell Death Dis 2023;14:268. [Google Scholar]
52. Ho H, Chen M, Lin C . Epiberberine suppresses the metastasis of head and neck squamous cell carcinoma cells by regulating the MMP-13 and JNK pathway. J Cell Mol Med 2023;27:3796-804. [Google Scholar]
53. Greenall SA, Donoghue J, Johns TG . Differential sensitivity of human hepatocellular carcinoma xenografts to an IGF-II neutralizing antibody may involve activated STAT3. Transl Oncol 2018;11:971-8. [Google Scholar]
54. Chuang YC, Hsieh MC, Lin CC . Pinosylvin inhibits migration and invasion of nasopharyngeal carcinoma cancer cells via regulation of epithelial mesenchymal transition and inhibition of MMP-2. Oncol Rep 2021;46:143. [Google Scholar]
55. Hsieh M, Lin C, Ho H . Pyrocurzerenone suppresses human oral cancer cell metastasis by inhibiting the expression of ERK1/2 and cathepsin S proteins. J Cell Mol Med 2024;28. [Google Scholar]
56. Ding YF, Ho KH, Lee WJ . Cyclic increase in the histamine receptor H1-ADAM9-Snail/Slug axis as a potential therapeutic target for EMT-mediated progression of oral squamous cell carcinoma. Cell Death Dis 2025;16:191. [Google Scholar]
57. Zhang X, Hwang Y. Cancer associated fibroblast stimulates cancer cell invasion in an interleukin 1 receptor dependent manner. Oncol Lett 2019. [Google Scholar]
58. Lee J, Nho YH, Yun SK . Anti-invasive and anti-tumor effects of Dryopteris crassirhizoma extract by disturbing actin polymerization. Integr Cancer Ther 2019;18. [Google Scholar]
59. Hsieh MJ, Lin CW, Chen MK . Inhibition of cathepsin S confers sensitivity to methyl protodioscin in oral cancer cells via activation of p38 MAPK/JNK signaling pathways. Sci Rep 2017;7:45039. [Google Scholar]
60. Gutierrez-Ruiz OL, Johnson KM, Krueger EW . Ectopic expression of DOCK8 regulates lysosome-mediated pancreatic tumor cell invasion. Cell Rep 2023;42:113042. [Google Scholar]
61. Candido JB, Maiques O, Boxberg M . Kallikrein-related peptidase 6 is associated with the tumour microenvironment of pancreatic ductal adenocarcinoma. Cancers (Basel) 2021;13:3969. [Google Scholar]
62. Saito K, Sakaguchi M, Maruyama S . Stromal mesenchymal stem cells facilitate pancreatic cancer progression by regulating specific secretory molecules through mutual cellular interaction. J Cancer 2018;9:2916-29. [Google Scholar]
Cite This Article
 Copyright © 2025 The Author(s). Published by Tech Science Press.
This work is licensed under a Creative Commons Attribution 4.0 International License , which permits unrestricted use, distribution, and reproduction in any medium, provided the original work is properly cited.
 Downloads
 Citation Tools