
 Submit a Paper
 Propose a Special lssue
 Open Access
ARTICLE
Study of interferon-stimulated gene 15 expression in the medulloblastoma context
1
Posgrado en Ciencias Genómicas, Universidad Autónoma de la Ciudad de México (UACM), CDMX, Apdo., 03100, México
2
Instituto de Fisiología Celular-Universidad Nacional Autónoma de México, CDMX, Apdo., 04510, México
* Corresponding Author: AC Tecalco-Cruz,
European Cytokine Network 2025, 36(4), 64-73. https://doi.org/10.1684/ecn.2025.0506
Accepted 23 January 2026; Issue published 28 February 2026
 View Full Text
 Download PDF
Abstract
Background: Interferon-stimulated gene 15 (ISG15) is a small ubiquitin-like protein that can be conjugated to its target proteins through an enzymatic cascade known as ISGylation, thereby altering their function. Elevated levels of free ISG15 (non-conjugated) and ISGylation are observed in several cancer types, including medulloblastoma (MB) a malignant pediatric cerebellar tumor categorized into four molecular subgroups: Wingless, Sonic Hedgehog, Subgroup 3 (G3), and Subgroup 4 (G4). However, ISG15 gene expression in MB remains unexplored. In this study, we evaluated the ISG15 protein levels, the expression of the ISG15 and ISGylation system, and interferon gamma signaling mediators in human MB samples to propose the role of ISG15 in this tumoral context. Methods: ISG15 expression in MB samples was comparatively analyzed against normal tissue using the Oncopression database. Expression levels were further assessed in various pediatric tumors within the Childhood Brain Tumor Tissue Consortium dataset via the University of Alabama at Birmingham Cancer Data Analysis Portal database. ISG15 protein abundance in MB samples was then evaluated via immunohistochemistry on a tumor tissue microarray. To broaden the analysis, ISG15 expression was profiled across multiple MB cell lines using the R2 Genomics Analysis and Visualization Platform. Finally, to determine clinical significance, the association between ISG15 expression and patient survival was assessed using Kaplan-Meier analysis. Results: ISG15 expression was significantly lower in MB samples than in other pediatric tumors (p < 0.05) and normal tissue (p < 0.0001). Immunohistochemical analysis further confirmed a marked reduction in ISG15 protein abundance in MB samples compared to healthy tissue (p < 0.001). Elevated ISG15 levels correlated with improved survival outcomes in the G3 and G4 subgroups (p < 0.05). Conclusion: ISG15 is downregulated in MB tissues compared to controls. High ISG15 expression within the G3/G4 MB subgroups correlates with prolonged survival, suggesting a potential tumor-suppressive function. These results collectively indicate that ISG15 may serve as a valuable prognostic biomarker for G3/G4 MB patients.Keywords
The interferon-stimulated gene 15 (ISG15) encodes a 15-kDa protein, which contains a conjugation motif in its C-terminal domain formed by the amino acid sequence LRLRGG that allows it to interact covalently with the lysine residues of its target proteins through an enzymatic sequential reaction system called ISGylation [1–4]. The enzymes involved in the ISGylation system are the E1 activating enzyme: E1-activating enzyme ubiquitin-proteasome system (UBA1L), the E2 conjugating enzyme: Ubiquitin/ISG15-conjugating enzyme E2 L6 (UBCH8/UBE2L6), and the E3 ligases for ISG15. The three E3 enzymes known are HECT and RLD domain enzymes containing E3 ubiquitin-protein ligase (HERC5), tripartite motif protein 25 (TRIM25), and Ariadne RBR E3 ubiquitin protein ligase 1 (ARIH1) [5–8]. ISGylation can modulate the localization, stability, or function of ISG15-target proteins [2]. However, this process is reversible through deISGylation, a process where ubiquitin-specific peptidase enzymes cleave the covalent bond, effectively removing ISG15 from its targets and increasing the pool of free, non-conjugated ISG15 [9–11].
While ISG15 can promote tumors in some contexts, it functions as a suppressor in certain cancers. For instance, in high-grade serous ovarian cancer, increased ISG15 levels inhibit cancer progression and correlate with better patient survival [12–14]. Similarly, in cervical cancer, ISGylation enhances the tumor-suppressive activity of the phosphoprotein 53 [15], and in leukemia and myeloma cells, the overexpression of ISG15 promotes apoptosis [16]. However, ISG15 expression is increased in most cancer types, and when its expression is reduced, proliferation decreases, suggesting that ISG15 functions as an oncoprotein [17, 18]. This demonstrates that ISG15 can play a dual role in cancer depending on the cancer type.
ISG15 expression is regulated by interferons (IFNs) [19]. In particular, it has been reported that IFN gamma (IFN-γ) can increase ISG15 levels in some cancer cells, such as breast cancer and glioblastoma [20–22]. However, its role has not been explored in other cancer types. The IFN-γ signaling pathway begins with the binding of IFN-γ to its heterotetrameric receptor complex, which is composed of 2 IFN-γ receptor subunit 1 (IFNGR1) and 2 IFN-γ receptor subunit 2 (IFNGR2) subunits. Receptor activation triggers the associated Janus kinase 1 (JAK1) and Janus kinase 2 (JAK2) enzymes. The activated JAKs phosphorylate the signal transducer and activator of transcription 1 (STAT1) proteins, resulting in the formation of pSTAT1 homodimer complexes, which then translocate to the nucleus. Once inside the nucleus, these complexes bind to gamma-activated sites in the promoters of ISGs, ultimately regulating gene expression [23, 24].
In breast cancer, IFN-γ increases ISG15 expression, ISGylation patterns, and free ISG15 levels, all of which correlate with an unfavorable prognosis [22]. Moreover, the IFN-γ/ISG15 signaling axis has been proposed to have a pro-tumor effect in glioblastoma, a malignant brain tumor that develops primarily in adults [21, 25]. However, in other central nervous system (CNS) cancers, the ISG15/ISGylation profile and its modulation by IFN-γ have not been explored.
Medulloblastoma (MB) is a malignant grade 4 tumor that develops in the cerebellum and is the most common brain cancer in children aged 0-14 years [26–28]. MB recurrence is frequent, and the primary route of metastasis is through the cerebrospinal fluid, significantly increasing patient mortality [29]. While histopathological classifications exist, the 2021 World Health Organization (WHO) emphasizes four molecular subgroups: Wingless (WNT), Sonic Hedgehog (SHH), Group 3 (G3), and Group 4 (G4) [30, 31]. These subgroups display significant heterogeneity and are characterized by the deregulation of different signaling and oncogenic pathways [31–34]. Almost 90% of WNT MB patients present with CTNNB1 mutations; this is the least common subgroup but carries the best prognosis. SHH MB is further classified into four subtypes (SHHα, β, γ, and δ) based on age and specific gene mutations involved [35]. The G3 group has the worst prognosis, with a 5-year survival rate of less than 50% [36, 37], and MYC status plays a relevant role in patient survival within this subgroup [38]. G4 is the most common MB tumor, accounting for nearly 40% of all MB patients, yet it remains the least explored and understood subgroup [36, 39, 40]. G3 is rare in adults, appearing frequently in infants and children between 3 and 5 years. Interestingly, some adults are diagnosed with G4 MB and have the worst prognosis among all MB subgroups [38]. It has also been suggested that an additional G3-G4 subgroup exists, displaying characteristics between G3 and G4 [41–43].
Standard MB treatment combines tumor resection, radiation therapy to the entire craniospinal axis, and age/risk-stratified chemotherapy [44]. However, chemotherapy faces toxicity and blood-brain barrier limitations, hindering its effectiveness. In other brain tumors, researchers have proposed the use of nanocarriers that allow drugs to penetrate the blood-brain barrier [45], targeted therapies that focus on the neurotrophic axis, neurotransmitters, and their receptors [46], as well as immunotherapy as an efficacious and safe alternative [47]. However, in the MB context, identifying protein targets and molecular markers that enable proper classification [39] and the development of effective therapies and novel disease models remains a challenge, particularly for G3 and G4 MBs, which currently lack faithful models [44]. In this study, we evaluated the ISG15 protein levels, the expression of the ISG15 and ISGylation system, and IFN-γ signaling mediators in human MB samples to propose the role of ISG15 in this tumoral context.
MATERIALS AND METHODS
Cancer-specific databases were analyzed using The Cancer Genome Atlas dataset via the University of Alabama at Birmingham Cancer Data Analysis Portal (UALCAN) (http://ualcan.path.uab.edu/) and the Childhood Brain Tumor Tissue Consortium (CBTTC) dataset (https://ualcan.path.uab.edu/analysis-cbttc.html) [48, 49]. To evaluate ISG15 expression in MB relative to healthy tissue, the Oncopression database (http://www.oncopression.com/) was utilized [50]. In addition, the R2 Genomics Analysis and Visualization Platform (https://hgserver1.amc.nl/) was used to analyze ISG15 expression across MB molecular subgroups and to perform the Kaplan-Meier graphic analysis [51].
Analysis of human cerebellar MB tissue microarray (TMA)
The TMA included triplicate cores of 20 MB cases (60 cores total) and 3 normal cerebellum tissue samples (3 cores), representing patients aged 4 to 47 years. The MB cases lacked detailed clinical data, specifically anatomical location, histological classification, and molecular subtype information. The TMA was purchased from Biomax (GL631: MB of cerebellum with cerebellum tissue array, U.S Biomax), now operating as TissueArray.com. The microarray is a human, paraffin-embedded tissue array previously baked for 2 h. According to the supplier, the tissues were fixed with formalin for less than 48 h, sectioned at 5 μm, and mounted on a SuperFrost Plus glass slide. All tissue was collected in accordance with Health Insurance Portability and Accountability Act-approved protocols, with fully informed donor consent. All samples tested negative for HIV and Hepatitis B and were approved for commercial product development (https://www.tissuearray.com/tissue-arrays).
ISG15 protein was detected by immunohistochemistry (IHC) using a specific anti-ISG15 monoclonal antibody (clone F-9, sc-166755, Santa Cruz Biotechnology, Dallas, Texas 75220, USA). The TMA section was deparaffinized and rehydrated through a series of xylol-ethanol solutions, followed by antigen retrieval with 0.01 M citrate buffer (pH 6/Tween 20) in the oven at 95°C for 10 min. Endogenous peroxidase activity was blocked with 3% hydrogen peroxide for 30 min, followed by sequential blocking with 2% albumin and permeabilization with 0.1% Triton X-100 (20 min each). The TMA was incubated overnight at 4 °C with the primary antibody (1:100 dilution). Detection was achieved using the MILLIPORE IHC Select Immunoperoxidase Secondary Detection System (DAB500 system; 28820 Single Oak Drive, Temecula, CA 92590, USA & Canada). First, the slide was incubated with a biotinylated goat anti-mouse IgG secondary antibody (1:100) for 10 min, followed by streptavidin HRP for 10 min and visualization with 3,3’ diaminobenzidine chromogen reagent for 10 min. Finally, the slide was counterstained with hematoxylin for 1 min. The TMA was dehydrated through a series of ethanol-xylol solutions, and mounting media was added to the slide.
Images were captured using an AxioScan.Z1 microscope equipped with an AxioCam MRc5 camera (Zeiss, Germany). Five photomicrographs at 40× magnification from each sample were obtained. Positive and negative controls (negative control: lacking the ISG15 antibody) were used. Semiquantitative analysis was performed using photomicrographs of five randomly selected fields taken from each representative tumor tissue on the microarray. The expression was categorized by the proportion of positive cells (0-3), with 0 indicating absence, 1 indicating 0%-10%, 2 indicating 11%-50%, and 3 indicating >50%. This established the immunoexpression score. The multipoint tool in ImageJ version 1.54D software (from U.S. National Institutes of Health) was used to determine the immunostaining intensity (optical units per micrometer squared [ou/μm2]) of positive cells for each image. Subsequently, the immunostaining intensity for positive cells was correlated with immunoexpression score using the formula x = (y - b)/m, where “x” is the immunoexpression score and “y” is the immunostaining intensity, based on previously reported methodology [52].
Each database includes analytical and statistical tools for analyzing the data it uses. In UALCAN-CBTTC, RNA-seq gene expression data were normalized to transcripts per million (TPM) and transformed using log2 (TPM + 1). Protein expression value was first log2 normalized, and the Z-value was subsequently calculated [49]. The Oncopression database uses public microarray data and compares gene expression in cancer and its matched healthy samples [50]. To compare expression between two conditions, UALCAN and Oncopression use the parametric t-test for statistical analysis, and Oncopression corrects the statistical test using the Area Under the Receiver Operating Characteristic Curve to reinforce the difference between the two groups and identify if the changes of expression that we observed are random or if there is no overlap of values between the two groups. The R2 platform uses the nonparametric log-rank test to compare survival between groups. These statistical analyses allowed us to identify whether the ISG15 gene expression and ISG15 protein levels have differential expression between MB and the normal condition or other pediatric tumors. Likewise, survival analysis allowed us to evaluate whether ISG15 expression levels correlate with patient survival times. With respect to the IHC statistical analysis, the Shapiro-Wilk test was performed to determine whether the IHC data have a normal distribution. The statistical differences between groups on IHC data were assessed using nonparametric test of the Mann-Whitney rank-sum test. GraphPad Prism software (v8.0.1) was used for statistical analyses. Results were considered significant when p < 0.05 (*), p < 0.01 (**), p < 0.001 (***), and p < 0.0001 (****).
RESULTS
ISG15 expression is deregulated in pediatric tumors and downregulated in MB patients
ISG15 expression was analyzed in pediatric CNS tumors, and the findings revealed that ISG15 expression in MB was statistically lower than in most pediatric CNS malignant tumors (figure 1A). Specifically, ISG15 expression was statistically significantly higher in high-grade and low-grade gliomas, teratoma, atypical teratoid rhabdoid tumor, chordoma, diffuse intrinsic pontine glioma, craniopharyngioma, schwannoma, dysembryoplastic neuroepithelial tumor, neurofibroma/plexiform, supratentorial or spinal cord primitive neuroectodermal tumor, and ependymoma than in MB. The ISG15 protein levels were also analyzed in several pediatric CNS tumors, and the findings revealed that ISG15 levels were decreased in MB tumors compared with high-grade and low-grade gliomas, atypical teratoid rhabdoid tumor, ependymoma, craniopharyngioma, and ganglioma (figure 1B). These results indicate that ISG15 is downregulated in patients with MB at both the mRNA and protein levels compared with other pediatric CNS tumors.
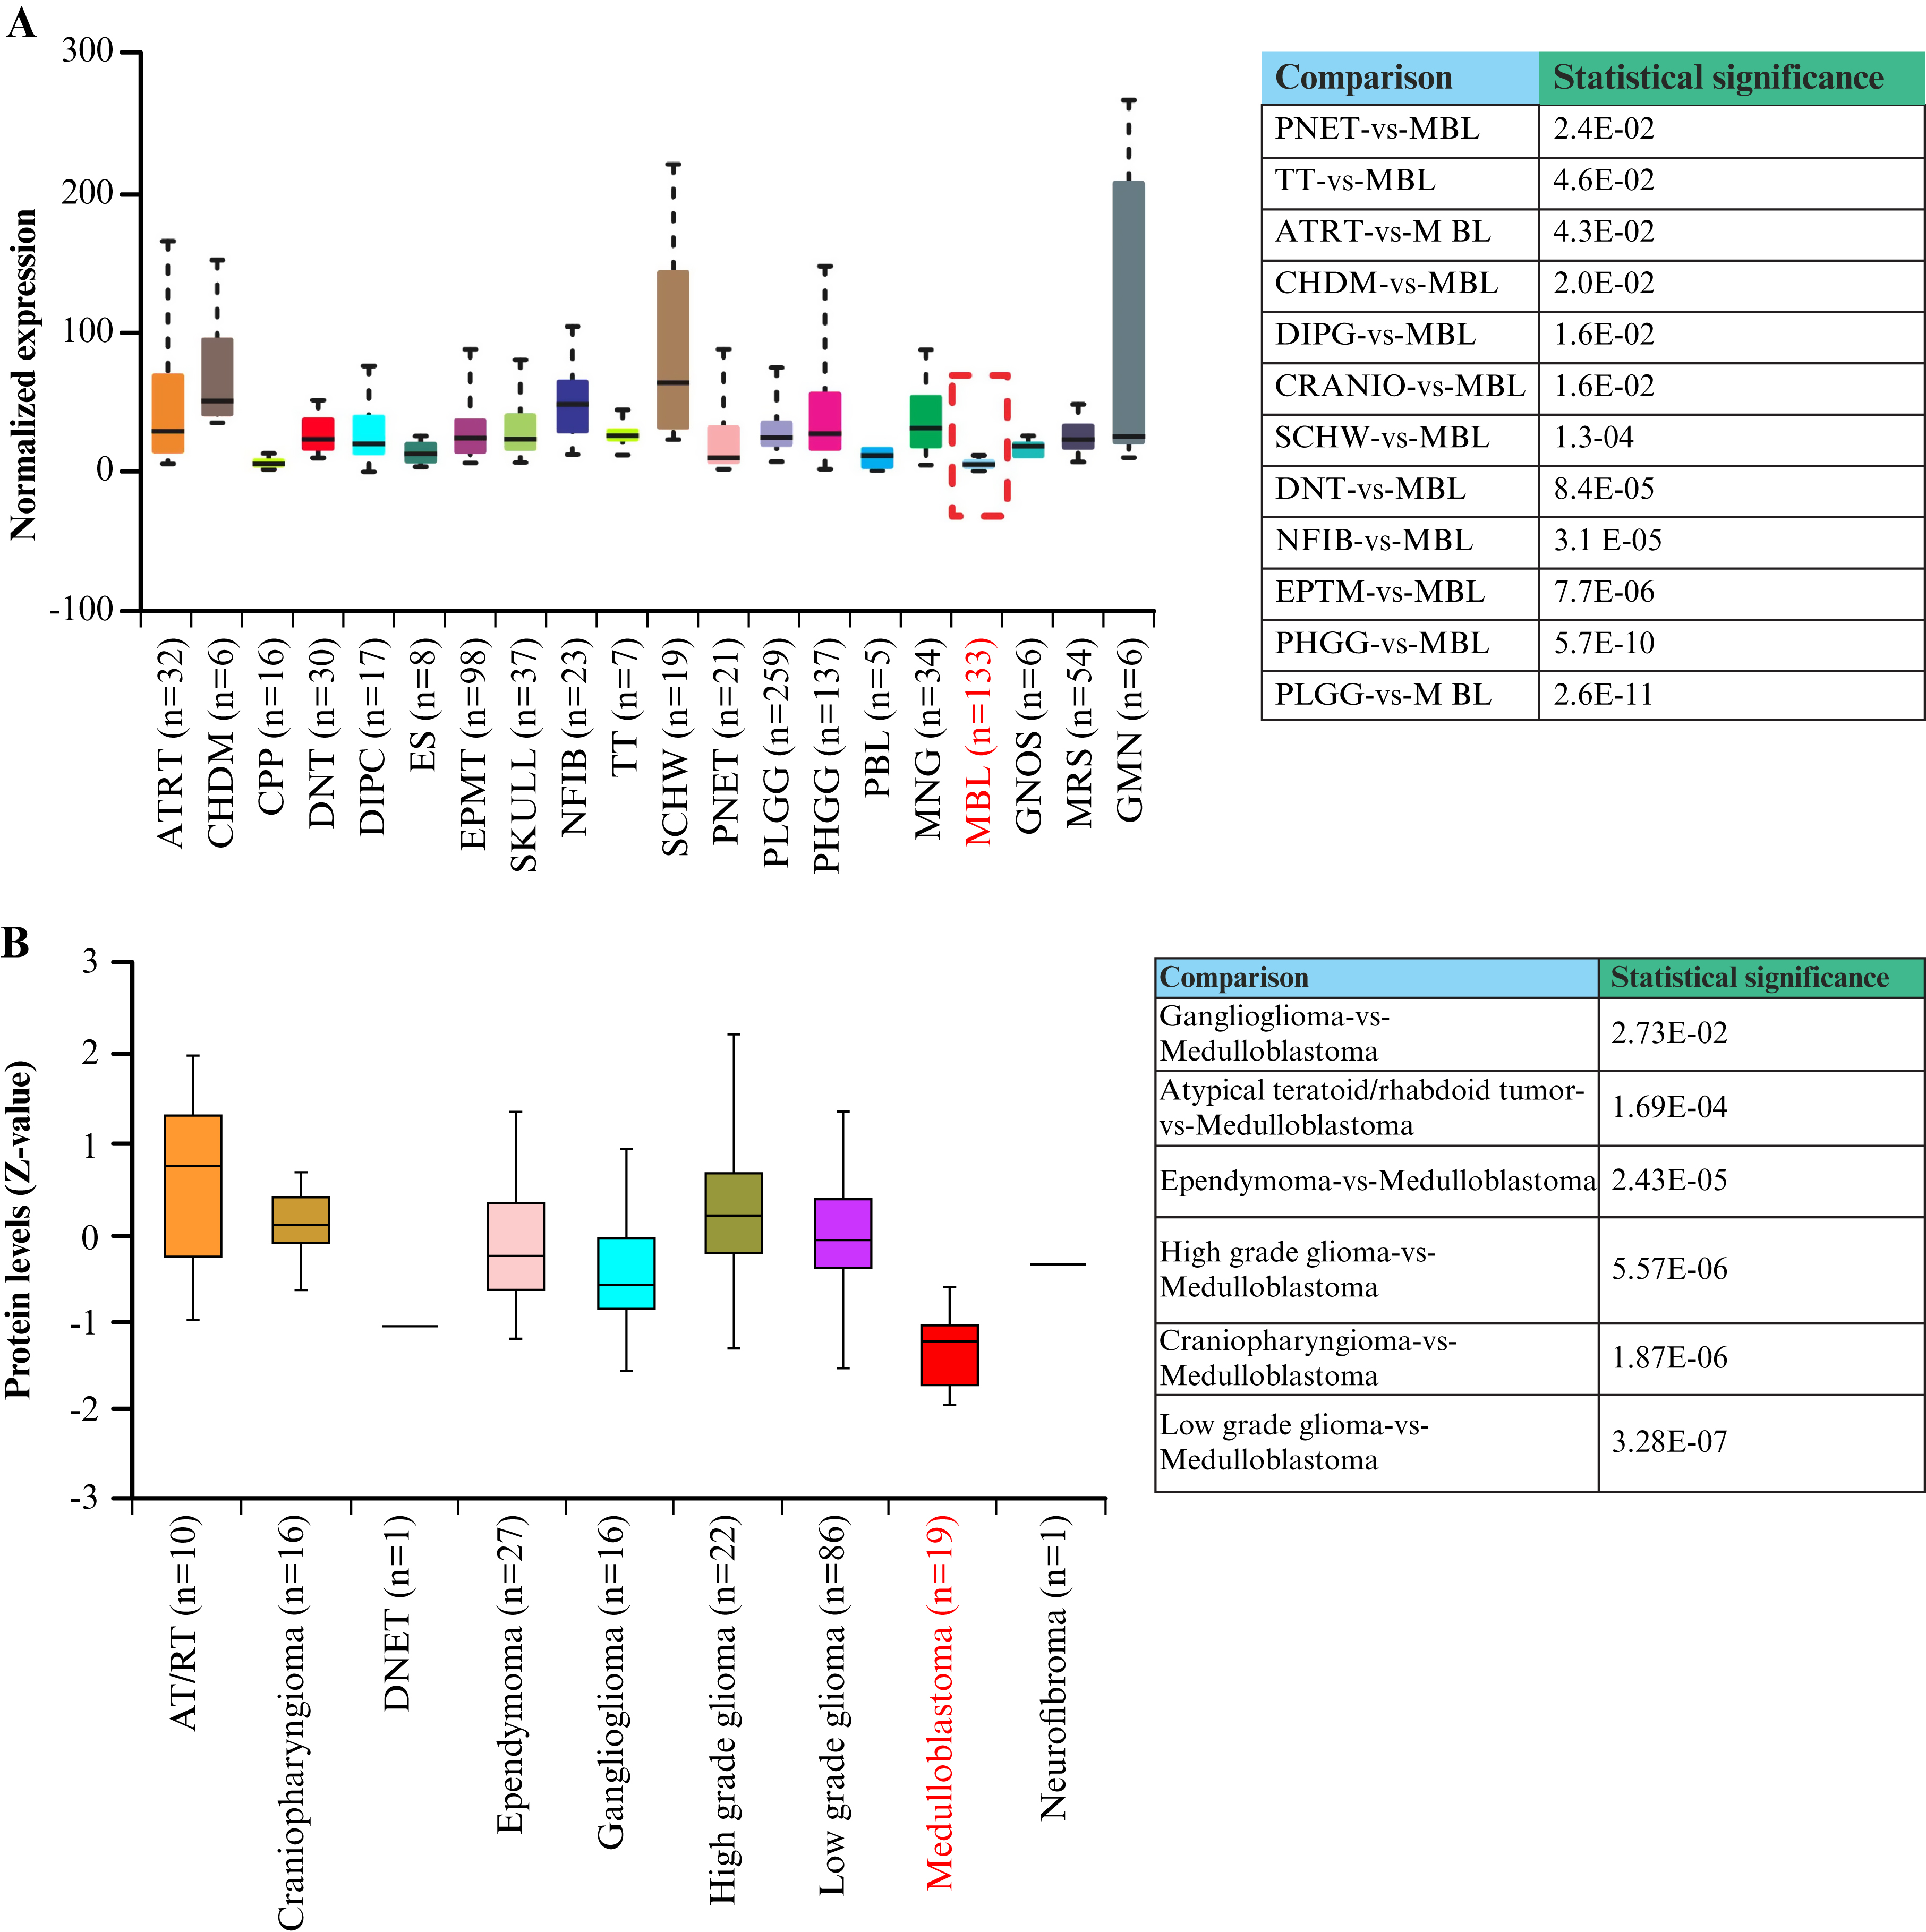
Figure 1.
ISG15 expression is deregulated in pediatric tumors and downregulated in MB patients.
A) ISG15 RNA expression in several pediatric tumors based on tumor histology from UALCAN. B) Comparison of ISG15 protein levels in several pediatric CNS tumors, including MB. MB samples are marked in red. Box-plot graphs were generated using UALCAN based on RNA and proteomic expression of ISG15 in the pediatric CNS tumors (CBTTC dataset) [49, 53]. Expression values were log₂-transformed (TPM + 1). The results were considered statistically significant when p < 0.05.
ISG15: Interferon-stimulated gene 15, ATRT: Atypical teratoid rhabdoid tumor, CHDM: Chordoma, CPP: Choroid plexus papilloma, CRANIO: Craniopharyngioma, DIPG: Diffuse intrinsic pontine glioma, DNT: Dysembryoplastic neuroepithelial tumor, EPMT: Ependymoma, ES: Ewings sarcoma, GMN: Germinoma, GNG: Ganglioglioma, GNOS: Glial-neuronal tumor not otherwise specified, MBL: Medulloblastoma, MNG: Meningioma, NFIB: Neurofibroma/plexiform, PBL: Pineoblastoma, PHGG: High-grade glioma/astrocytoma (WHO grade III/IV), PLGG: Low-grade glioma/astrocytoma (WHO grade I/II), PNET: Supratentorial or spinal cord primitive neuroectodermal, TT: Teratoma, SCHW: Schwannoma, DNET: Dysembryoplastic neuroepithelial tumor, AT/RT: Atypical teratoid/rhabdoid tumor, UALCAN: University of Alabama at Birmingham Cancer Data Analysis Portal, n: Number of samples, Z-value: Standardized score, CBTTC: Childhood Brain Tumor Tissue Consortium, CNS: Central nervous system, TPM: Transcripts per million.
ISGylation system enzymes and IFN-γ signaling elements are deregulated in patients with MB
ISG15 mRNA expression was analyzed in MB tumor samples relative to normal tissue using the Oncopression database. The results revealed that ISG15 expression was lower in MB samples than in normal tissue samples (figure 2A). Interestingly, a subsequent analysis of ISGylation enzyme expression demonstrated a varied expression pattern: the E1 enzyme and the E3 ligase TRIM25 showed no significant change in expression; the E3-ligase HERC5 was downregulated; and the E3-ligase ARIH1 and the E2-enzyme were upregulated (figure 2B). Therefore, ISG15 expression was downregulated in MB, and the expression of the associated ISGylation system enzymes was widely deregulated.
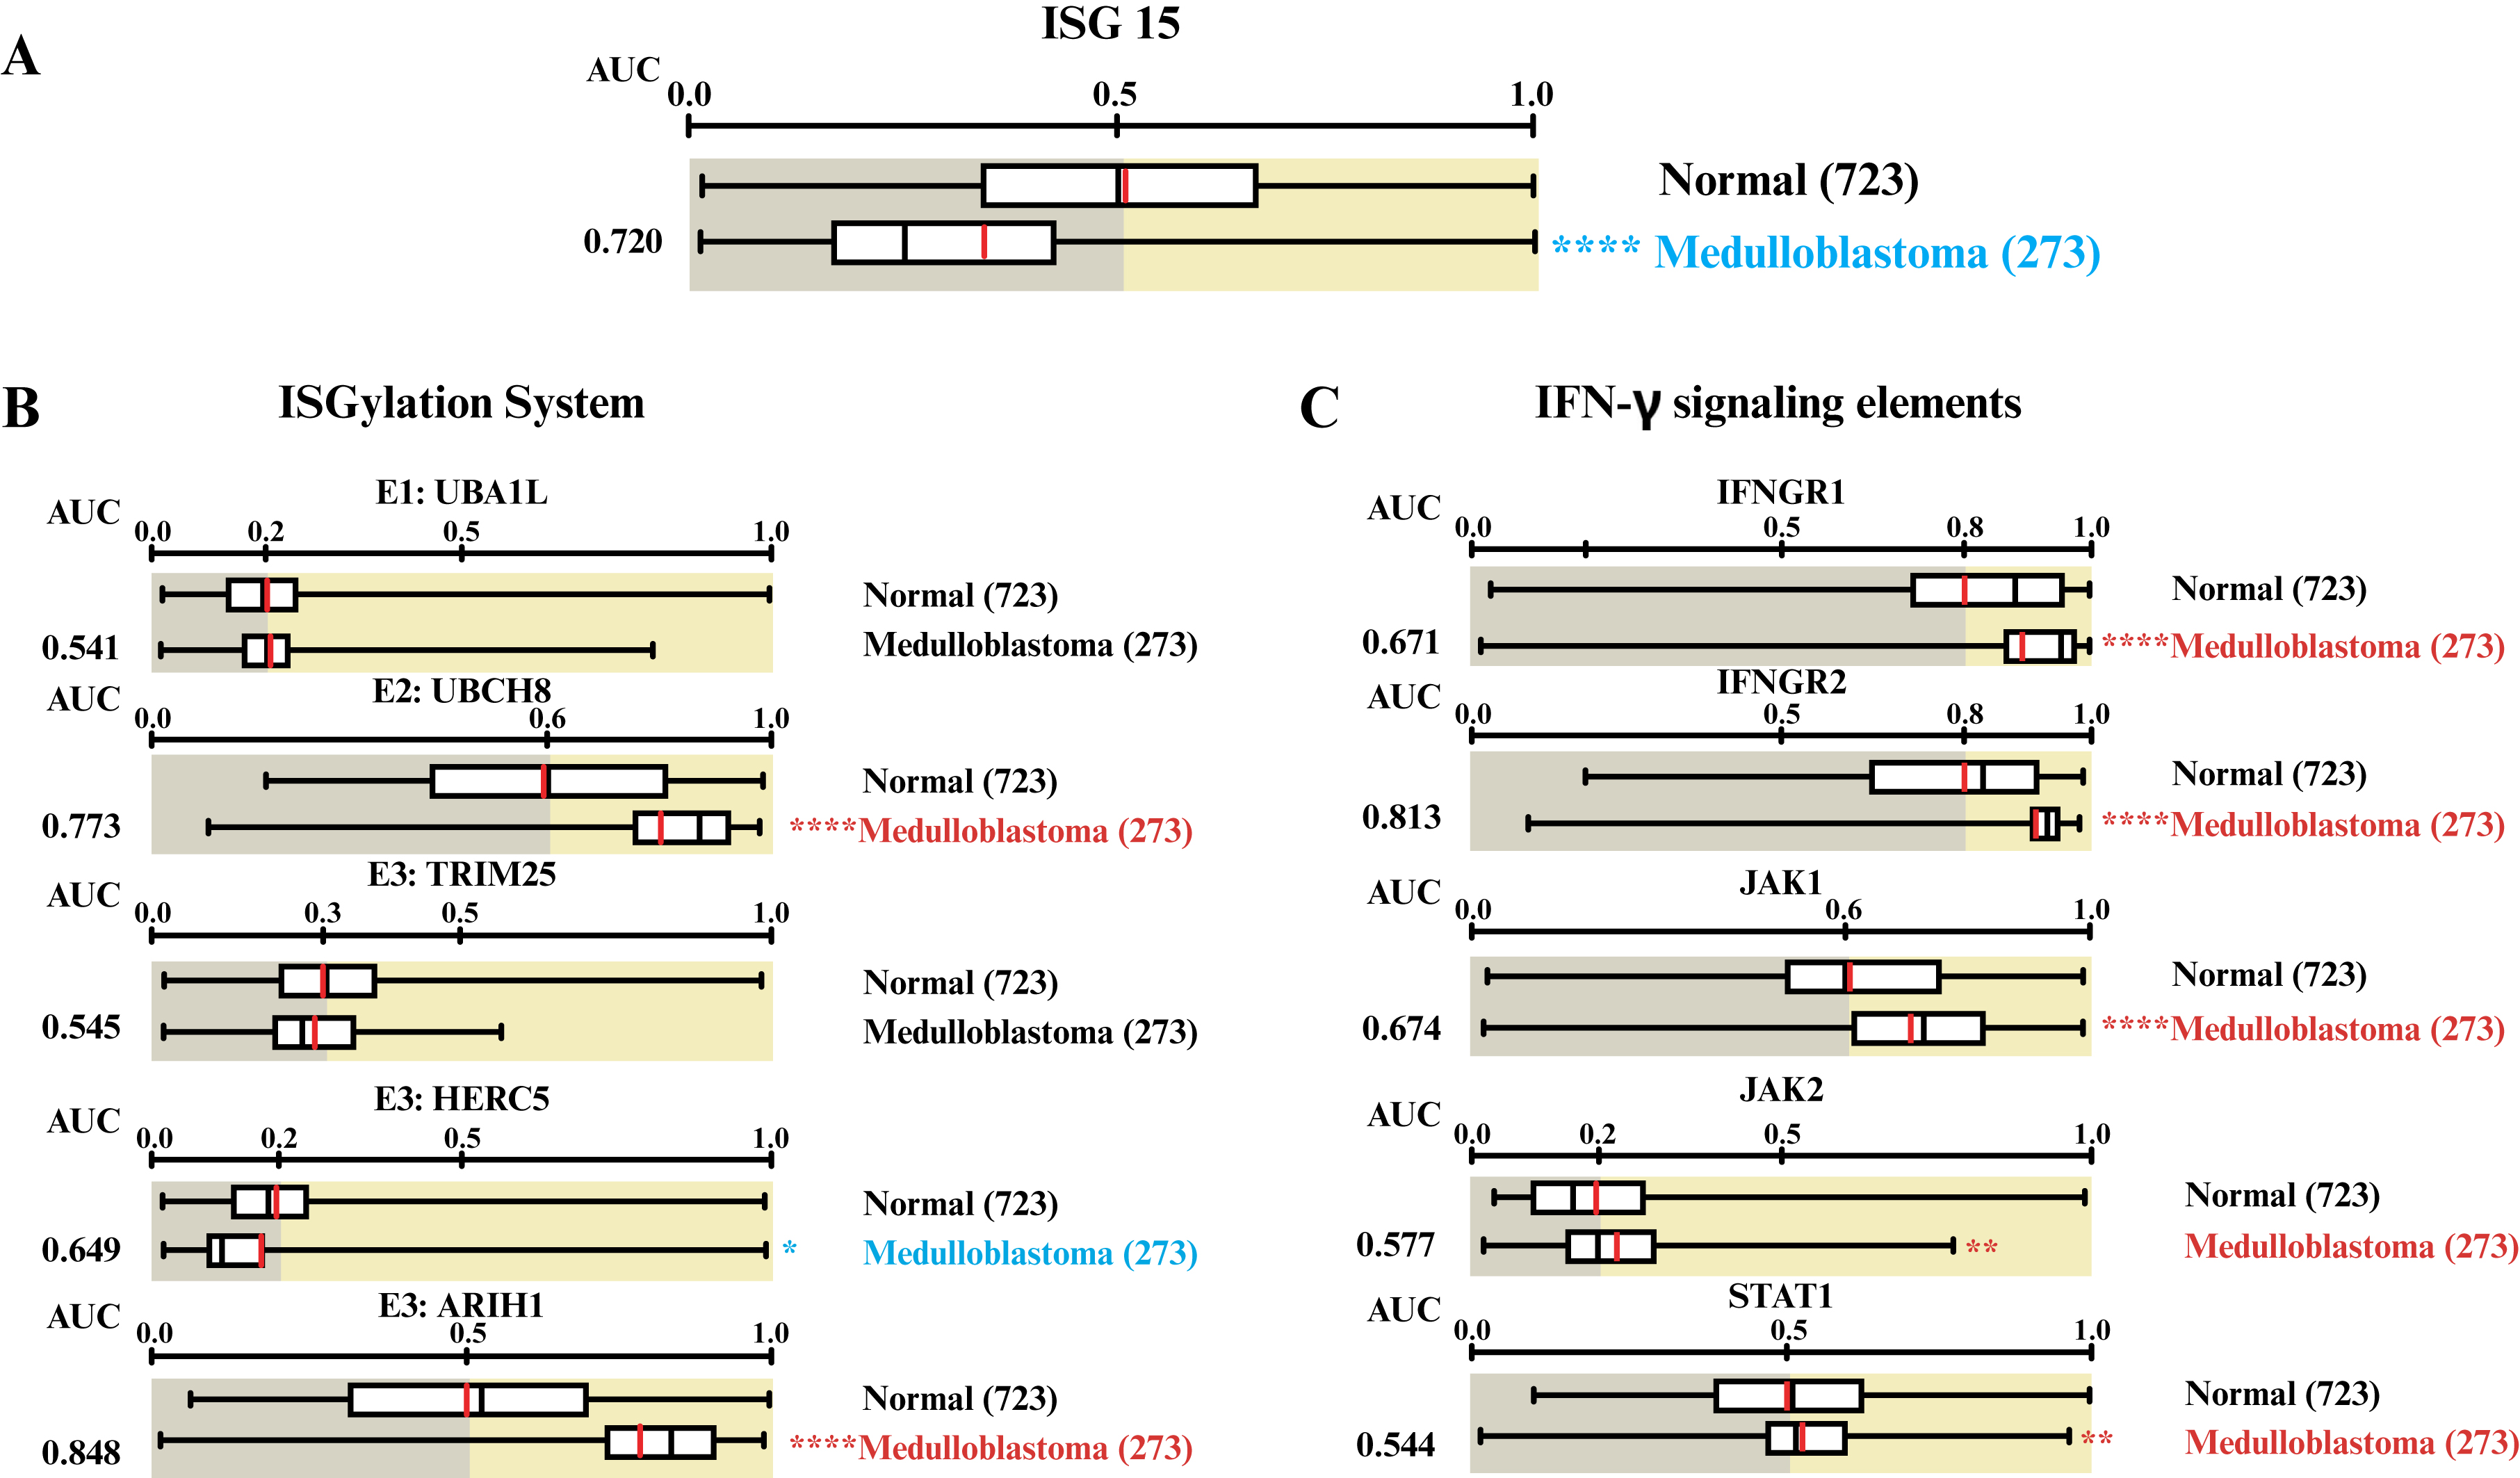
Figure 2.
ISGylation system enzymes and IFN-γ signaling elements are deregulated in patients with MB.
A) ISG15 expression in MB samples compared to normal tissue using the Oncopression database. Expression levels of B) ISGylation enzymes (E1: UBA1L, E2:UBCH8, and three E3: TRIM25, HERC5, and ARIH1) and C) IFN-γ pathway elements (IFNGR1, IFNGR2, JAK1, JAK2, and STAT1) in MB samples compared to normal tissue. Letters in red denote overexpression, while those in blue indicate underexpression. Box-plot graphs were retrieved from the Oncopression web server based on the expression of interest gene in MB and normal tissues [50]. The contents of the Oncopression database are available under the GNU Lesser General Public License v3.0 (LGPL v3). Values between 0 and 1.0 indicate UPC-normalized gene expression. The result was considered significant when *: p < 0.05, **: p < 0.01, ****: p < 0.0001.
UBA1L: E1-activating enzyme ubiquitin-proteasome system, UBCH8: Ubiquitin conjugating enzyme E2 L6, TRIM25: Tripartite motif containing 25, HERC5: HECT and RLD domain containing E3 ubiquitin protein ligase 5, ARIH1: Ariadne RBR E3 ubiquitin protein ligase 1, IFNGR1: Interferon gamma receptor subunit 1, IFNGR2: Interferon gamma receptor subunit 2, JAK1: Janus kinase 1, JAK2: Janus kinase 2, and STAT1: Signal transducer and activator of transcription 1, AUC: Area under the curve, MB: Medulloblastoma, ISG15: Interferon-stimulated gene 15, IFN-γ: Interferon gamma, UPC: Universal expression code.
As previously reported, the ISG15 profile is modulated by IFN-γ in glioblastoma [21], a common malignant brain tumor in adults. To investigate this further, the expression of key elements within the IFN-γ pathway on MB was examined. Our findings indicated that IFNGR1, IFNGR2, JAK1, JAK2, and STAT1 were overexpressed in MB tissues compared to normal control conditions (figure 2C). Hence, although IFN-γ signaling mediators were upregulated, ISG15 expression was decreased in MB samples compared to normal tissue.
ISG15 protein levels are decreased in MB samples
ISG15 protein levels in MB patients were measured and compared to those in the healthy cerebellum. IHC was performed on a tumor tissue array that included 20 MB samples (in triplicate) and 3 healthy human CNS samples. The results showed that ISG15 immunostaining was low or absent in spots containing MB tissue compared to those containing normal tissue (figures 3A, B). The data were statistically significant, confirming lower immunodetection of ISG15 in MB than in normal cerebellar tissue (figure 3C). The findings indicate that ISG15 protein levels were higher in healthy CNS tissue than in MB samples, suggesting a downregulation of the ISG15 protein expression in MB.
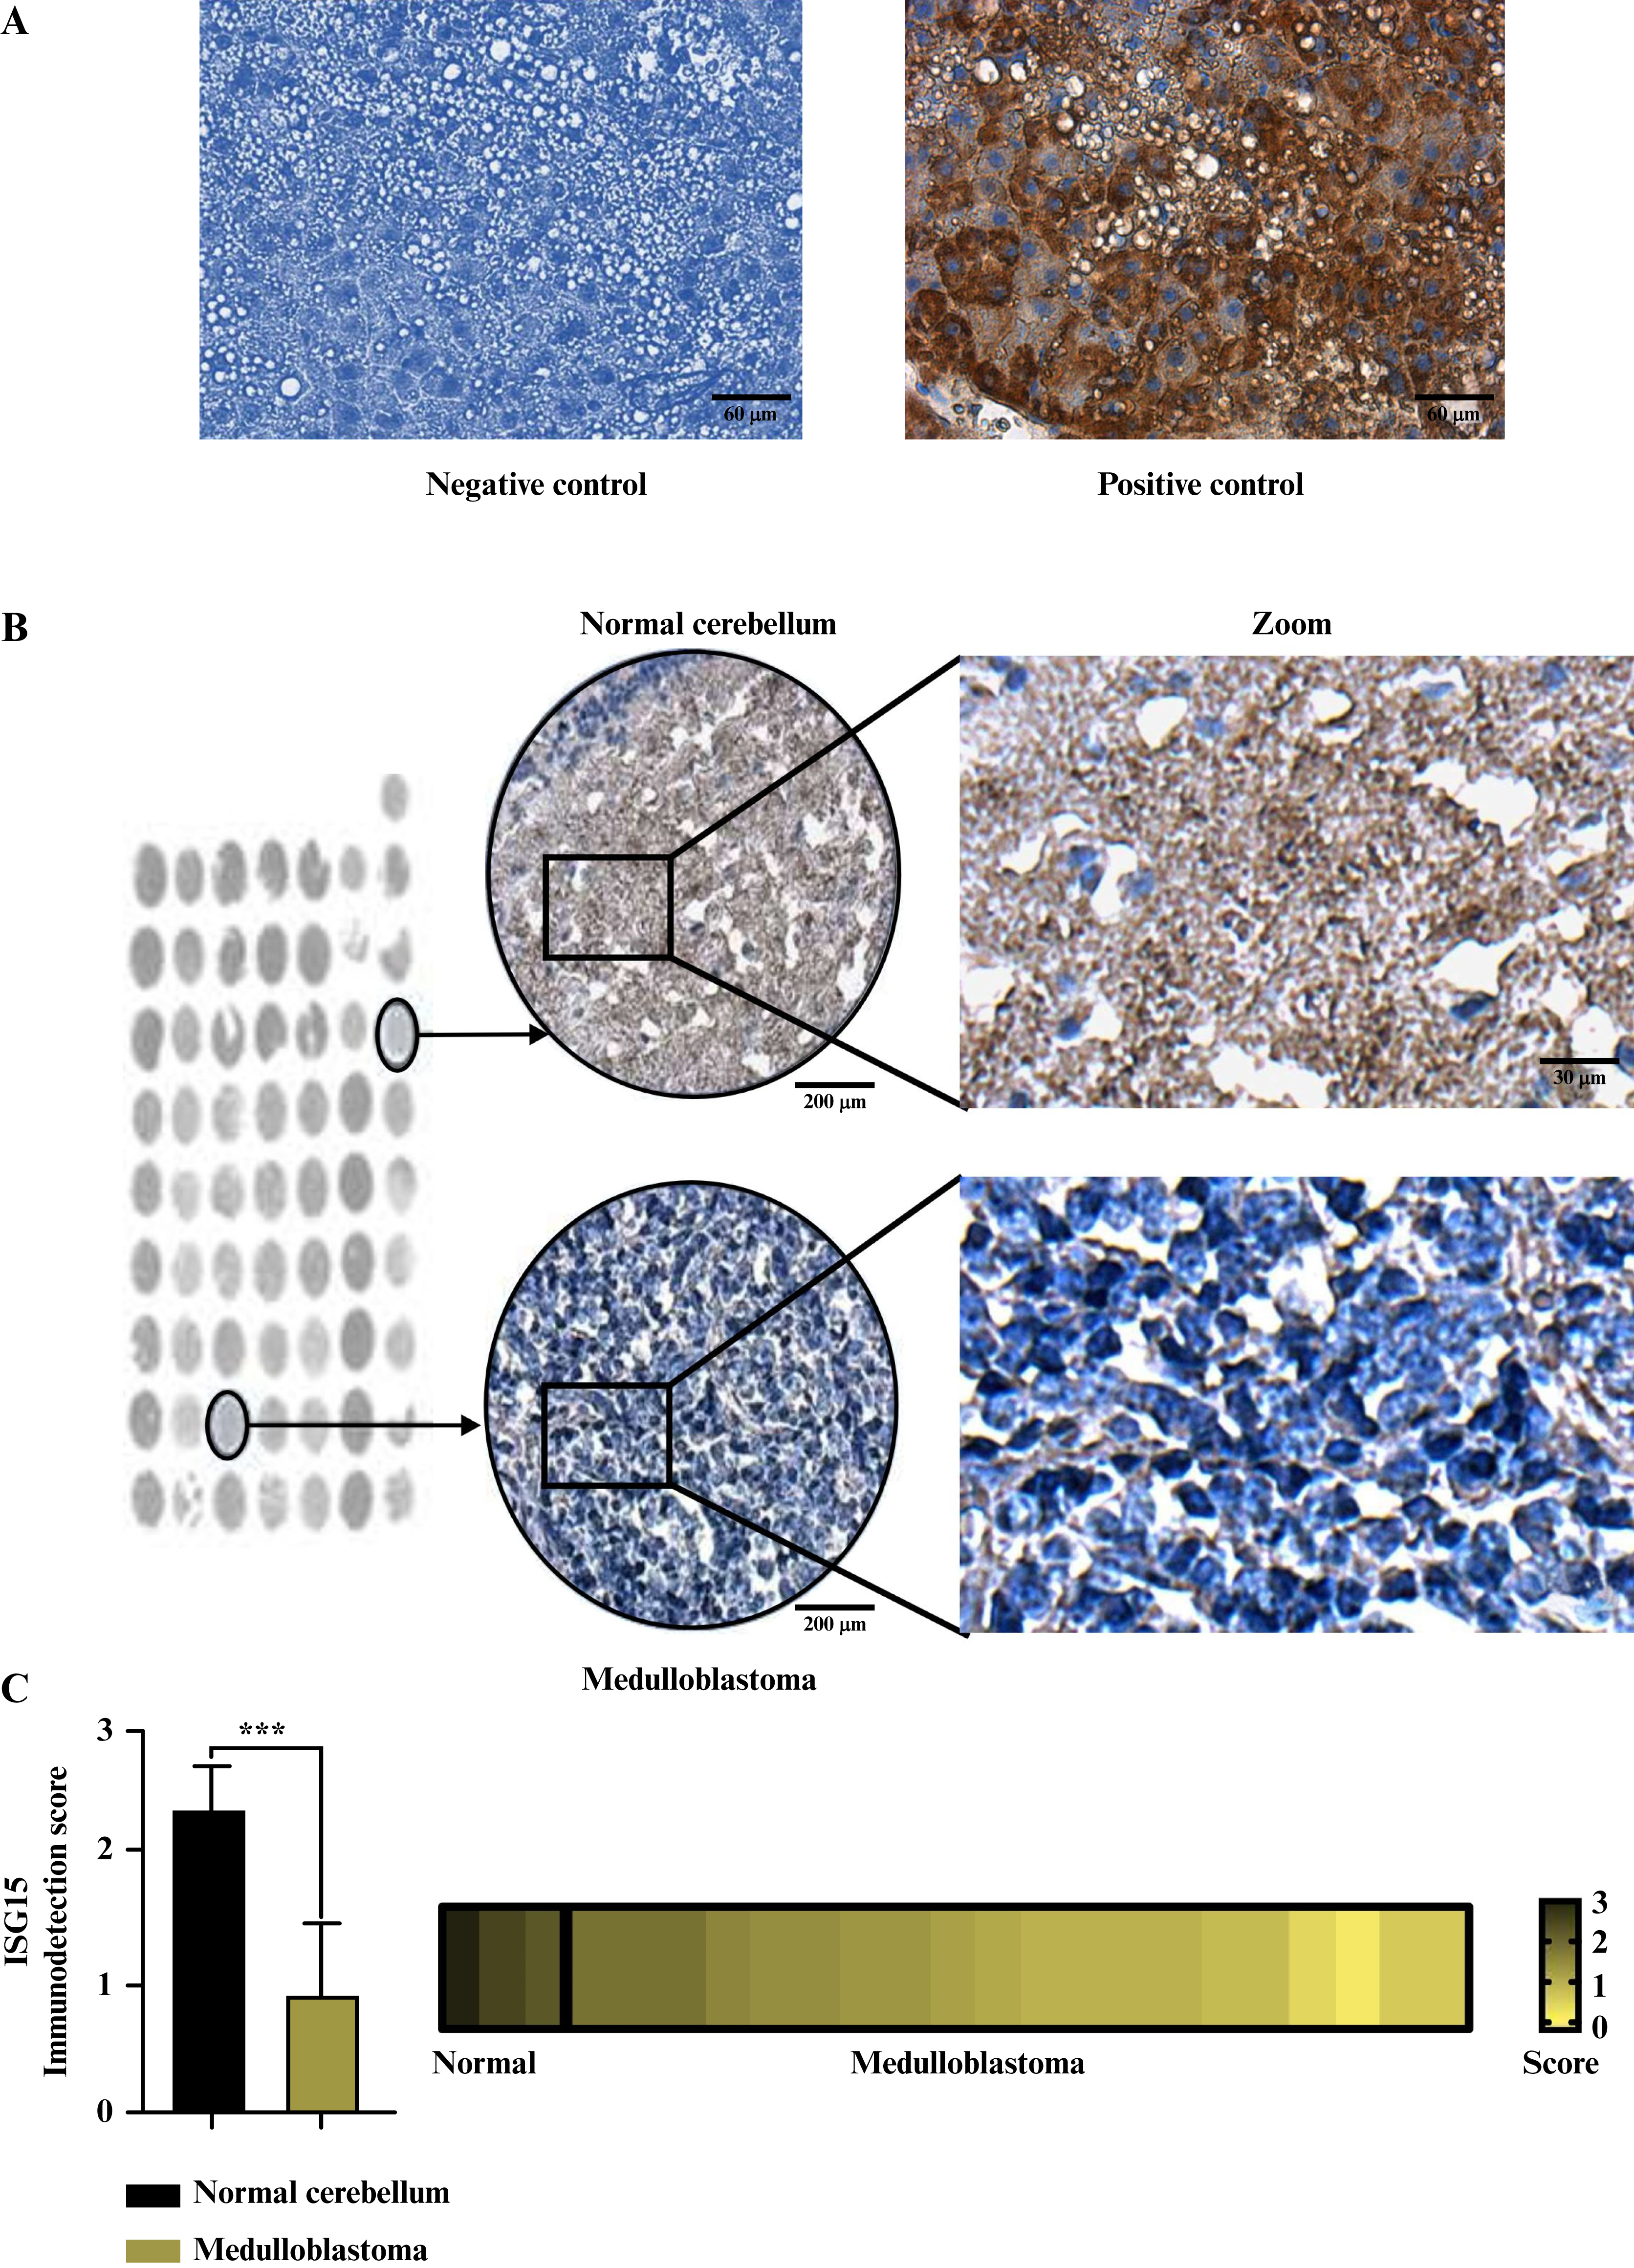
Figure 3.
ISG15 protein levels are decreased in MB samples compared to normal cerebellum tissue samples.
A) Representative images of IHC negative control (lacking the ISG15 antibody) and positive control (with 1:100 ISG15 antibody dilution). Scale bar: 60 μm. B) Representative images of ISG15 IHC samples on a human TMA of MB tissue and normal cerebellum tissue. The selected representative samples are indicated by black circles. Scale bars: 200 μm (tissue spots), 60 μm (middle image), and 30 μm (zoom image). C) Graphical representation of the scoring performed for ISG15 IHC staining in MB samples and normal cerebellum tissue from the TMA, alongside a heat map illustrating the immunoexpression levels of the ISG15 protein across all TMA samples. The Mann-Whitney test was performed to analyze IHC data. The result was considered significant when ***: p < 0.001.
MB: Medulloblastoma, ISG15: Interferon-stimulated gene 15, IHC: Immunohistochemistry, TMA: Tissue microarray.
Reduced ISG15 levels are associated with poor survival in G3 and G4 MB patients
The results indicated that ISG15 was downregulated in MB, with low mRNA and protein levels observed in patient samples. An analysis was conducted to determine whether ISG15 expression and the ISGylation system, including ubiquitin-specific peptidase 18 (USP18), differed across molecular MB subgroups and if these differences affected patient survival. As shown in figure 4A, the expression of ISG15 and ISGylation system was similar across the different MB subgroups (figure 4A). ISG15 expression was further analyzed in several MB-derived cell lines using the R2: Genomics Analysis and Visualization Platform. As shown in figure 4B, the d283 cells, derived from a patient with MB, exhibited the lowest ISG15 expression compared to other cell lines (figure 4B). Interestingly, d456 and x21584 are glioma-derived cells, while the remainder are MB-derived (d324 are SHH-derived; d341 and d556 are G3-derived). To date, the d283 cells have been considered G3/G4-derived [36, 54]; however, their characterization remains debated [38]. Thus, cells derived from the G3 and G4 subgroups showed lower ISG15 expression than those from other cell lines.
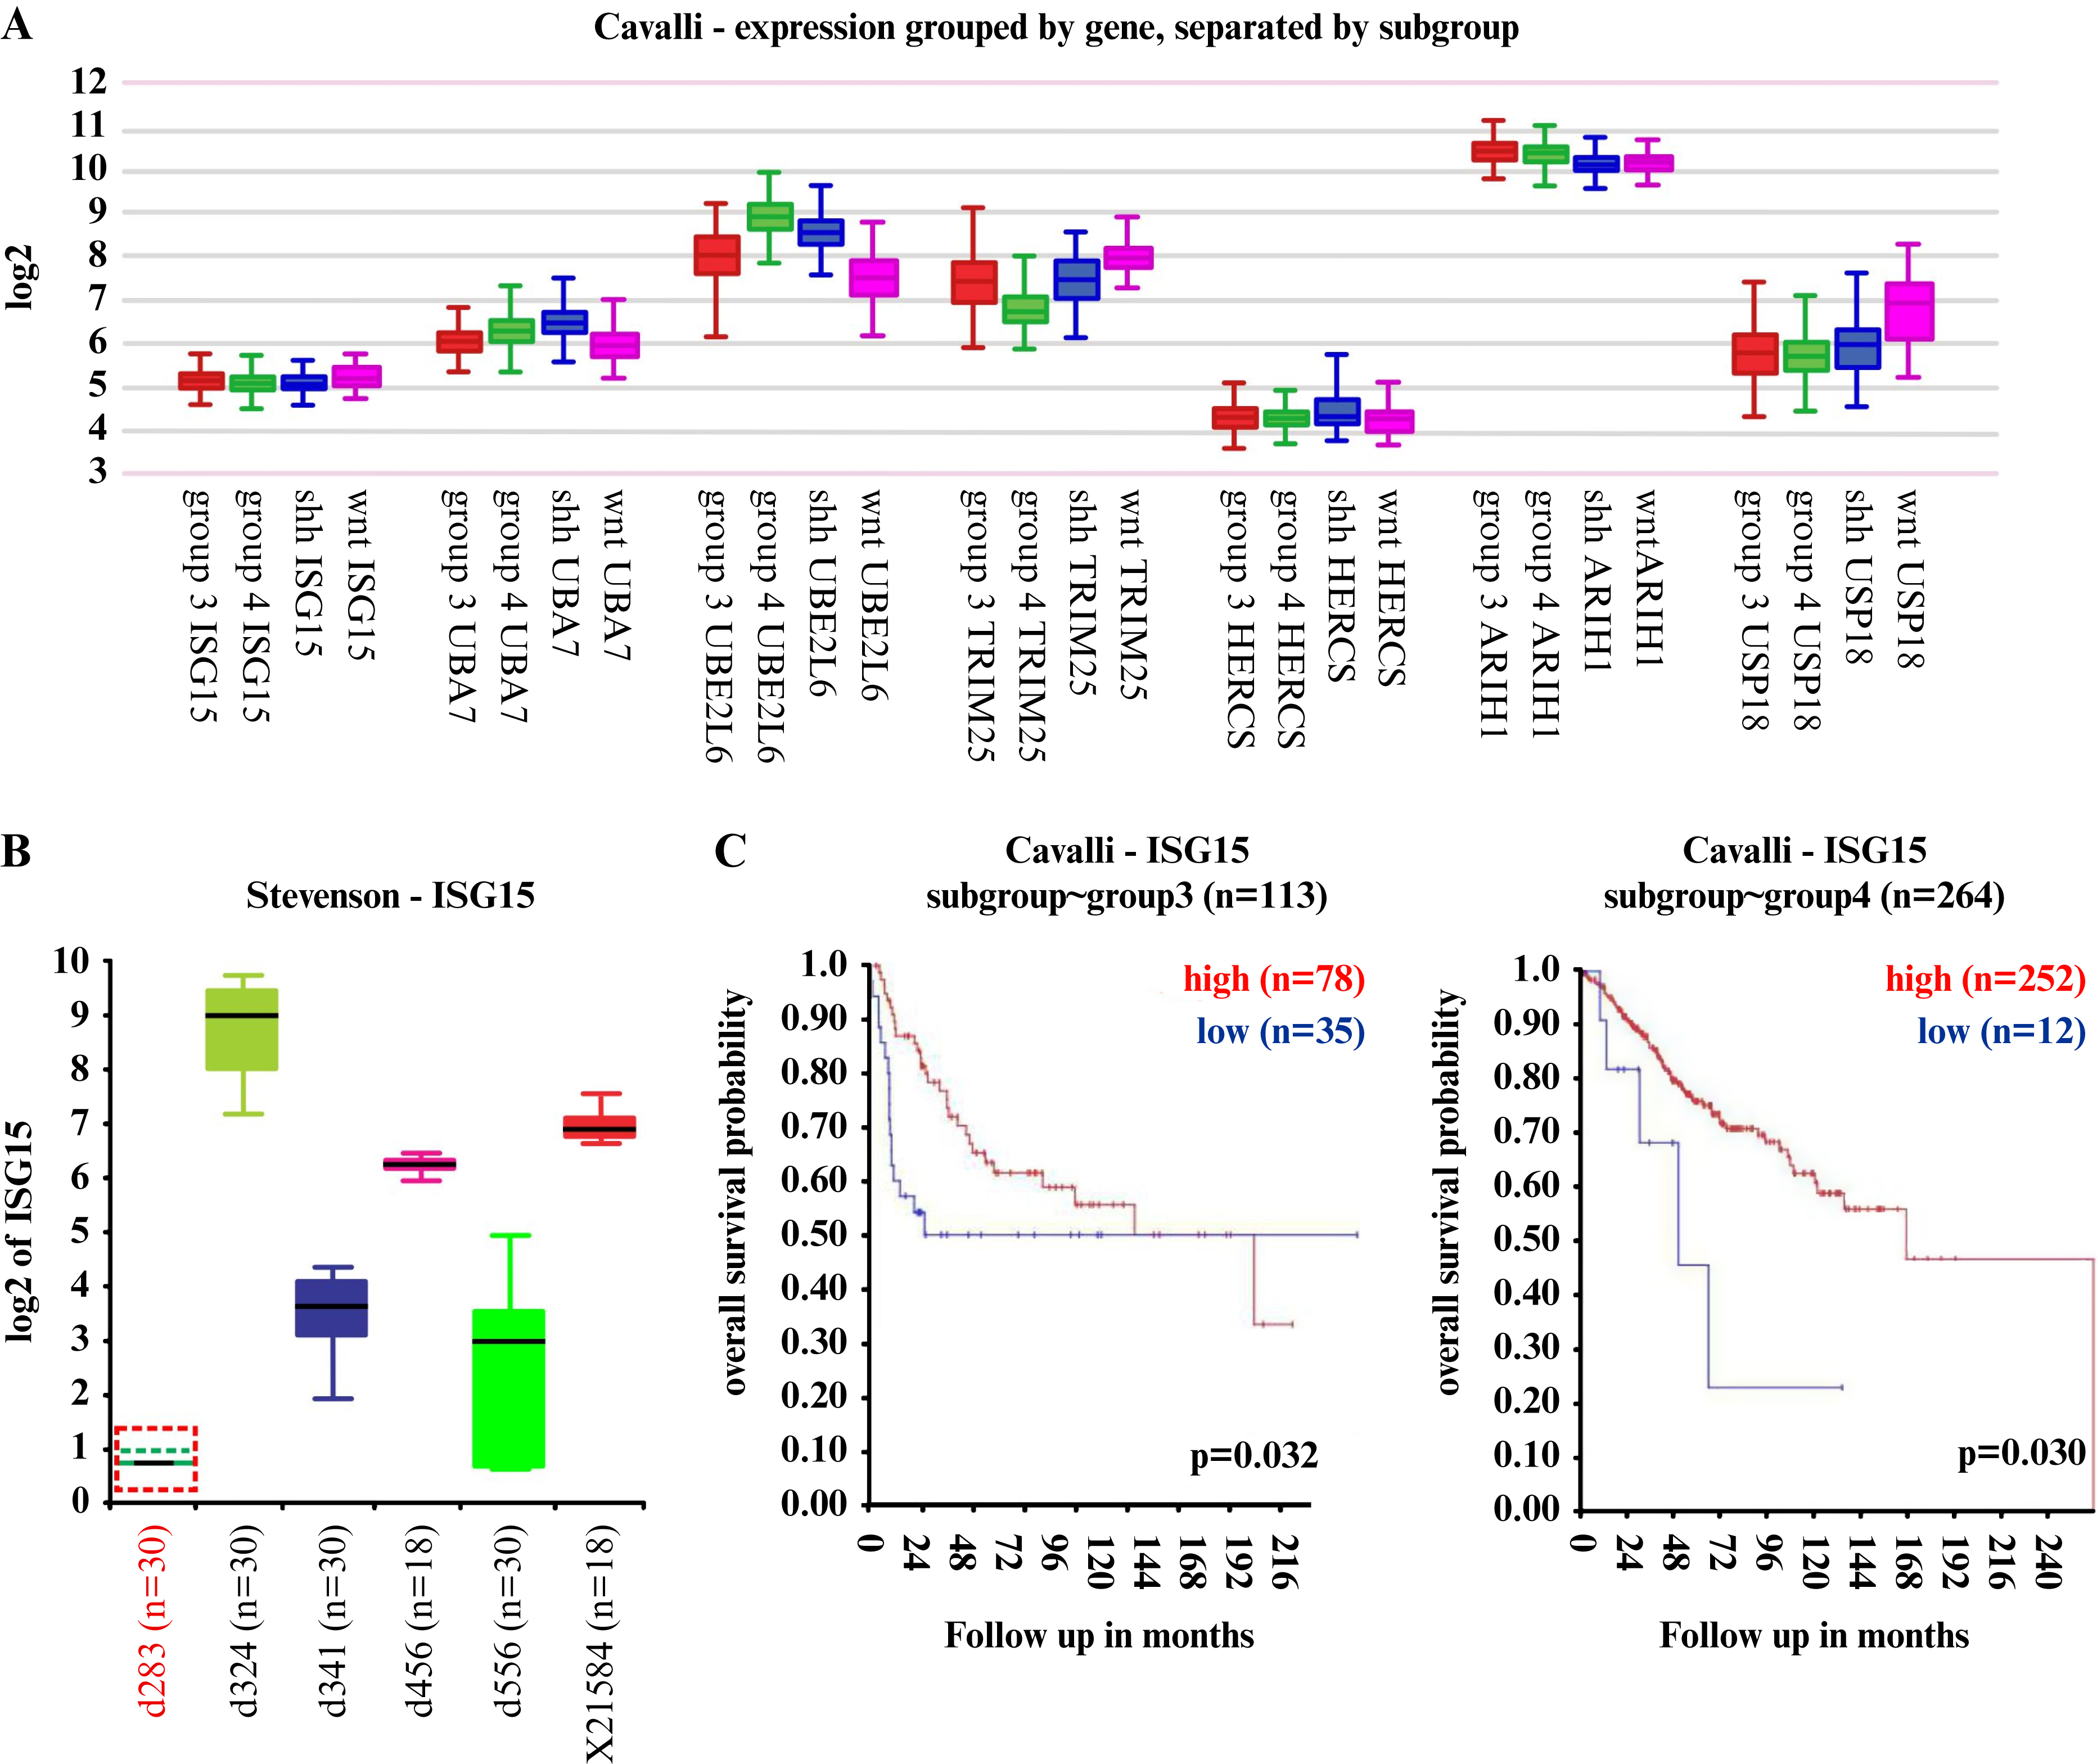
Figure 4.
Reduced levels of ISG15 correlate with poor survival prognosis in G3/G4 MB patients.
A) ISG15 gene expression and ISGylation enzymes expression in several MB subgroups. B) ISG15 gene expression in several CNS tumor-derived cell lines from the R2 database. C) Kaplan-Meier curves illustrating the overall survival probability of patients within the MB G3 and G4 subgroups, stratified by their respective ISG15 gene expression levels. Analysis was performed using the R2: Genomics Analysis and Visualization Platform (http://r2.amc.nl) retrieved from the Cavalli database. Expression values were log₂ (Transcripts Per Million + 1). n: Number of samples. The result was considered significant when p < 0.05.
MB: Medulloblastoma, ISG15: Interferon-stimulated gene 15, CNS: Central nervous system, WNT: Wingless, SHH: Sonic Hedgehog, ARIH1: Ariadne RBR E3 ubiquitin protein ligase 1, HERC5: HECT and RLD domain containing E3 ubiquitin protein ligase 5, TRIM25: Tripartite motif containing 25, UBE2L6: ubiquitin conjugating enzyme E2 L6, UBA7: Ubiquitin-like modifier-activating enzyme 7.
For subsequent analysis, focus was placed on the G4 subgroup, the most frequent and largest MB subgroup, and the G3 subgroup, which has a poorer prognosis. The association of ISG15 expression with patient survival in the G3 and G4 subgroups was analyzed. The results indicated that higher ISG15 levels were associated with better survival in both the G3 and G4 subgroups (figure 4C). These findings revealed the molecular complexity of the ISG15-associated pathway across different cancer types, highlighting that low ISG15 expression in the G3 and G4 subgroups is associated with poor prognosis.
DISCUSSION
ISG15 expression typically increases in several carcinoma types, functioning as an oncoprotein [2]. However, ISG15 expression has not been explored in all cancer types. The upregulation of ISG15 by IFN-γ signaling has been specifically reported in breast cancer and glioblastoma [19, 21, 22]. For instance, in glioblastoma, a malignant brain tumor associated with aging, IFN-γ has been shown to upregulate ISG15, which in turn promotes tumor progression [22]. Nevertheless, the specific profile of ISG15 and its modulation by IFN-γ have not been studied in other CNS tumors, including those affecting children.
In this study, we analyzed the expression and abundance of ISG15 across various pediatric CNS tumors and found the lowest levels in MB. In addition, we observed that MB samples exhibited downregulation of ISG15 alongside the upregulation of IFN-γ pathway mediators when compared with healthy tissue. These findings are notable because glioblastoma is reportedly characterized by the upregulation of both IFN-γ pathway mediators and ISG15. Therefore, a different correlation between the expression of IFN-γ signaling mediators and ISG15 is observed in pediatric MB cases than in the adult brain tumor, glioblastoma. This suggests that the molecular pathways underlying ISG15 expression can differ across various CNS tumors.
Our IHC analysis of the TMA showed decreased ISG15 protein levels in MB samples compared to normal CNS tissue. However, information on the subgroup for these MB samples was not available. Although we do not know the specific subgroups of the MB samples in our study, and given that the G4 subgroup is reportedly the largest [36, 39, 40], most of our samples may belong to G4.
Interestingly, our results suggest that ISG15 may function as a tumor suppressor in the G3 and G4 subgroups, as elevated ISG15 expression is associated with improved survival in G3 and G4 patients. In contrast, ISG15 expression is higher in d324 SHH-derived cells than in other MB cells (G3/G4), which may explain why the SHH subgroup has a better prognosis, as it is more sensitive to chemotherapy and radiotherapy [55]. Data on the WNT subgroup is limited due to its rarity, representing only about 10% of MB cases [35, 36]. The diverse and complex role of ISG15 across MB subgroups suggests that ISG15-triggered molecular mechanisms are interconnected with the affected signaling pathways within each molecular subgroup. Some deregulated genes in recurrent adult and pediatric brain tumors have been linked to cytokine production [53]. Free ISG15 can be found intracellularly and extracellularly and mediates cytokine signaling [56, 57]. Further investigation is required to define the role of ISG15 forms in each MB subgroup.
Therefore, the biology of the G3 and G4 subgroups remains less clear compared to other MB subgroups. Our data are mainly relevant to the G3 and G4 subgroups, as they share some molecular characteristics [35, 37, 43]. Notably, while the G4 subgroup is the largest, its specific clinical relevance remains unclear. In contrast, the G3 subgroup is relevant due to its poor prognosis [39, 41]. Consequently, research efforts are focusing on elucidating the underlying molecular mechanisms and master regulators within the MB G3/G4 subgroups [40, 43]. It has been reported that genes involved in the ubiquitin-proteasome pathway are differentially expressed among the various MB subgroups [34]. ISG15 is a member of the ubiquitin-like protein family; the processes of ISGylation and ubiquitination may cooperate to modulate the stability of certain proteins in MB [2]. Thus, the deregulation of ISG15 may be a critical factor in the G3/G4 subgroups.
While a larger sample size would improve the analysis, this is challenging due to the rarity of MB, which is an uncommon CNS tumor primarily affecting pediatric patients. Furthermore, despite an established molecular classification for MB, the tumor’s inherent heterogeneity remains a limitation, as MB tumors often exhibit characteristics of two distinct groups [30, 42, 43]. For instance, there is a proposal to define a new G3/G4 subgroup within MB, and D283 cells have been suggested as a G3/G4-derived line [54, 58]. Furthermore, the availability and characterization of MB cell lines representative of these subgroups are also limited [36]. Together, these aspects underscore the significant molecular complexity of this cancer.
Moreover, ISG15 expression is primarily associated with pro-tumor activity in carcinomas (e.g., mammary carcinomas) and other CNS tumors (e.g., glioblastoma). Nevertheless, it has also demonstrated anti-tumor activity against ovarian, cervical, and blood cancer cells [14–16], suggesting that ISG15 expression is context-dependent and could potentially function as a tumor suppressor in other cancer types as well. In addition, free or conjugated ISG15 may have opposing effects. For instance, in breast cancer, extracellular free ISG15 was associated with anti-tumor activity, whereas ISGylation was linked to tumor progression [59]. Based on our results, we hypothesize that ISG15 exhibits anti-tumor activity in MB G3 and G4 cases. However, this hypothesis requires future investigation using in vitro cell experiments and/or in vivo animal models to clarify the molecular mechanisms triggered by ISG15 and verify its potential tumor-suppressor function. Thus, the findings presented here provide a basis for further research into the role of ISG15/ISGylation in MB.
CONCLUSION
In conclusion, our findings demonstrate that the expression of ISG15 is downregulated in MB, and the lower expression level correlates with poorer survival rates in the G4 and G3 molecular subgroups. There is a complex interplay between ISG15 levels and altered molecular pathways in the MB subgroups, which may influence tumor progression in a molecular subgroup-dependent manner. Specifically, low ISG15 levels appear to be a potential indicator of poor prognosis for patients in the G3 and G4 subgroups. ISG15 deregulation may serve as a valuable prognostic biomarker for these specific MB subgroups.
DISCLOSURE
Financial support: none. Conflict of interest: none.
Acknowledgments: We thank Ruth Rincon-Heredia and Abraham Rosas-Arellano from Unidad de Imagenología (IFC-UNAM) for their technical support. We also thank Josué O. Ramírez-Jarquín and Marcela Sosa-Garrocho for their technical support.
Funding: This research was supported by the School of Science and Technology (CCyT-2025-CON-11 to A.C.T.C.) from the Autonomous University of Mexico City (UACM).
Author contributions: Eva G. Palacios-Serrato: helped with the investigation, analysis, organization, and preparation of the manuscript. Karen H Medina-Abreu: helped with some analysis. Gabriela Velasco-Loyden: IHC assays. Norma Angélica Lira-Rodríguez: Figure preparation and editing. Angeles C. Tecalco-Cruz: Conceptualization, Investigation, and Writing-original draft, Writing-review & editing. All authors read and approved the submitted version.
Conflicts of interest: The authors declare that they have no conflicts of interest.
Availability of data and materials: The authors confirm that the data supporting the findings of this study are available within the article.
Ethical approval: All tissue in the commercial tissue microarray is collected by the supplier (TissueArray.Com LLC, previously US Biomax, Inc., 15885 Crabbs Branch Way, Derwood, MD 20855, USA) under Health Insurance Portability and Accountability Act -approved protocols with the donor fully informed and providing consent. According to the supplier, a discrete legal consent form was received, and the rights to hold for research purposes or to commercialize further were waived.
REFERENCES
1. Hermann M, Bogunovic D. ISG15: in sickness and in health. Trends Immunol 2017;38:79-93. [Google Scholar]
2. Yuan Y, Qin H, Li H et al. The functional roles of ISG15/ISGylation in cancer. Molecules 2023;28:1337. [Google Scholar]
3. Kang JA, Kim YJ, Jeon YJ. The diverse repertoire of ISG15: more intricate than initially thought. Exp Mol Med 2022;54:1779-92. [Google Scholar]
4. Mirzalieva O, Juncker M, Schwartzenburg J et al. ISG15 and ISGylation in human diseases. Cells 2022;11:538. [Google Scholar]
5. Tecalco-Cruz AC. Molecular pathways of interferon-stimulated gene 15: implications in cancer. Curr Protein Pept Sci 2021;22:19-28. [Google Scholar]
6. Chu L, Qian L, Chen Y et al. HERC5-catalyzed ISGylation potentiates cGAS-mediated innate immunity. Cell Rep 2024;43:113870. [Google Scholar]
7. Wu SF, Xia L, Shi XD et al. RIG-I regulates myeloid differentiation by promoting TRIM25-mediated ISGylation. Proc Natl Acad Sci U S A 2020;117:14395-404. [Google Scholar]
8. Xiong TC, Wei MC, Li FX et al. The E3 ubiquitin ligase ARIH1 promotes antiviral immunity and autoimmunity by inducing mono-ISGylation and oligomerization of cGAS. Nat Commun 2022;13:5973. [Google Scholar]
9. Malakhova O, Malakhov M, Hetherington C et al. Lipopolysaccharide activates the expression of ISG15-specific protease UBP43 via interferon regulatory factor 3. J Biol Chem 2002;277:14703-11. [Google Scholar]
10. Honke N, Shaabani N, Zhang DE et al. Multiple functions of USP18. Cell Death Dis 2016;7:e2444. [Google Scholar]
11. Jiménez Fernández D, Hess S, Knobeloch KP. Strategies to target ISG15 and USP18 toward therapeutic applications. Front Chem 2020;7:923. [Google Scholar]
12. Han C, Nie L, Jia Z et al. KDM6A exhibits antitumor activities toward ovarian cancer by epigenetically activating transcription of ISG-15. Mol Carcinog 2025 [Google Scholar]
13. Madaan V, Kollara A, Spaner D et al. ISGylation enhances dsRNA-induced interferon response and NFκB signaling in fallopian tube epithelial cells. J Biol Chem 2024;300:107686. [Google Scholar]
14. Yeung TL, Tsai CC, Leung CS et al. ISG15 promotes ERK1 ISGylation, CD8+ T cell activation and suppresses ovarian cancer progression. Cancers (Basel) 2018;10:464. [Google Scholar]
15. Park JH, Yang SW, Park JM et al. Positive feedback regulation of p53 transactivity by DNA damage-induced ISG15 modification. Nat Commun 2016;7:12513. [Google Scholar]
16. Zhou MJ, Chen FZ, Chen HC et al. ISG15 inhibits cancer cell growth and promotes apoptosis. Int J Mol Med 2017;39:446-52. [Google Scholar]
17. Tecalco-Cruz AC, Zepeda-Cervantes J. Protein ISGylation: a posttranslational modification with implications for malignant neoplasms. Explor Target Anti-Tumor Ther 2023;4:699-715. [Google Scholar]
18. Nguyen HM, Gaikwad S, Oladejo M et al. Interferon stimulated gene 15 (ISG15) in cancer: an update. Cancer Lett 2023;556:216080. [Google Scholar]
19. Cruz-Ramos E, Macías-Silva M, Sandoval-Hernández A et al. Non-muscle myosin IIA is post-translationally modified by interferon-stimulated gene 15 in breast cancer cells. Int J Biochem Cell Biol 2019;107:14-26. [Google Scholar]
20. Tecalco-Cruz AC, Macías-Silva M, Ramírez-Jarquín JO et al. Identification of genes modulated by interferon gamma in breast cancer cells. Biochem Biophys Rep 2021;27:101053. [Google Scholar]
21. Zamora-Salas SX, Macías-Silva M, Tecalco-Cruz AC. Upregulation of the canonical signaling pathway of interferon-gamma is associated with glioblastoma progression. Mol Biol Rep 2024;51 [Google Scholar]
22. Tecalco-Cruz AC, Cruz-Ramos E. Protein ISGylation and free ISG15 levels are increased by interferon gamma in breast cancer cells. Biochem Biophys Res Commun 2018;499:973-8. [Google Scholar]
23. Burke JD, Young HA. IFN-γ: a cytokine at the right time, is in the right place. Semin Immunol 2019;43:101280. [Google Scholar]
24. Castro F, Cardoso AP, Gonçalves RM et al. Interferon-gamma at the crossroads of tumor immune surveillance or evasion. Front Immunol 2018;9:847. [Google Scholar]
25. Tecalco-Cruz AC, Velasco-Loyden G, Robles-Villarruel L et al. Interferon-stimulated gene 15 and ISGylation are upregulated in glioblastoma. Biochem Biophys Res Commun 2022;621:144-50. [Google Scholar]
26. Martínez León MI. Meduloblastoma pediátrico, revisión y puesta al día. Radiología 2011;53:134-45. [Google Scholar]
27. Millard NE, De Braganca KC. Medulloblastoma. J Child Neurol 2016;31:1341-53. [Google Scholar]
28. Van Bree NFHN, Wilhelm M. The tumor microenvironment of medulloblastoma: an intricate multicellular network with therapeutic potential. Cancers (Basel) 2022;14:5009. [Google Scholar]
29. Hill RM, Richardson S, Schwalbe EC et al. Time, pattern, and outcome of medulloblastoma relapse and their association with tumour biology at diagnosis and therapy: a multicentre cohort study. Lancet Child Adolesc Health 2020;4:865-74. [Google Scholar]
30. Cavalli FMG, Remke M, Rampasek L et al. Intertumoral heterogeneity within medulloblastoma subgroups. Cancer Cell 2017;31:737-54. [Google Scholar]
31. Schakelaar MY, Monnikhof M, Crnko S et al. Cellular immunotherapy for medulloblastoma. Neuro-Oncol 2023;25:617-27. [Google Scholar]
32. Taylor MD, Northcott PA, Korshunov A et al. Molecular subgroups of medulloblastoma: the current consensus. Acta Neuropathol 2012;123:465-72. [Google Scholar]
33. Ramaswamy V, Nör C, Taylor MD. p53 and medulloblastoma. Cold Spring Harb Perspect Med 2016;6:a026278. [Google Scholar]
34. Vriend J, Glogowska A. Transcription of clock genes in medulloblastoma. Cancers (Basel) 2025;17:575. [Google Scholar]
35. Funakoshi Y, Sugihara Y, Uneda A et al. Recent advances in the molecular understanding of medulloblastoma. Cancer Sci 2023;114:741-9. [Google Scholar]
36. Ivanov DP, Coyle B, Walker DA, Grabowska AM. In vitro models of medulloblastoma: choosing the right tool for the job. J Biotechnol 2016;236:10-25. [Google Scholar]
37. Ramírez-Chiquito JC, Juárez-Méndez S. Strategies for the molecular classification of medulloblastoma. Biomedicines 2025;13:2845. [Google Scholar]
38. Menyhárt O, Giangaspero F, Győrffy B. Molecular markers and potential therapeutic targets in non-WNT/non-SHH (group 3 and group 4) medulloblastomas. J Hematol Oncol 2019;12:29. [Google Scholar]
39. Wang YR, Wang P, Yan Z et al. Advancing presurgical non-invasive molecular subgroup prediction in medulloblastoma using artificial intelligence and MRI signatures. Cancer Cell 2024;42:1239-57. [Google Scholar]
40. Michaelsen GL, De Sousa Monteiro T, Imparato DO et al. Medulloblastoma’s master regulators and their association with patients’ risk. Sci Rep 2025;15:16310. [Google Scholar]
41. Prol-Castelo G, Tejada-Lapuerta A, Urda-García B et al. Exploring the boundaries of medulloblastoma subgroups with synthetic data generation. bioRxiv 2024 [Google Scholar]
42. Sharma T, Schwalbe EC, Williamson D et al. Second-generation molecular subgrouping of medulloblastoma: an international meta-analysis of Group 3 and Group 4 subtypes. Acta Neuropathol 2019;138:309-26. [Google Scholar]
43. Northcott PA, Shih DJH, Peacock J et al. Subgroup-specific structural variation across 1,000 medulloblastoma genomes. Nature 2012;488:49-56. [Google Scholar]
44. Juraschka K, Taylor MD. Medulloblastoma in the age of molecular subgroups: a review. J Neurosurg Pediatr 2019;24:353-63. [Google Scholar]
45. Sarkar P, Manna A, Bera S et al. Chitosan nanocarriers: a promising approach for glioblastoma therapy. Carbohydr Polym 2025;365:123823. [Google Scholar]
46. Wu Y, Sun R, Ren S et al. Neuronal reshaping of the tumor microenvironment in tumorigenesis and metastasis: bench to clinic. Med Adv 2025;3:364-71. [Google Scholar]
47. Bai F, Deng Y, Li L et al. Advancements and challenges in brain cancer therapeutics. Exploration 2024;4:20230177. [Google Scholar]
48. Chandrashekar DS, Bashel B, Balasubramanya SAH et al. UALCAN: a portal for facilitating tumor subgroup gene expression and survival analyses. Neoplasia 2017;19:649-58. [Google Scholar]
49. Chandrashekar DS, Karthikeyan SK, Korla PK et al. UALCAN: an update to the integrated cancer data analysis platform. Neoplasia 2022;25:18-27. [Google Scholar]
50. Lee J, Choi C. Oncopression: gene expression compendium for cancer with matched normal tissues. Bioinformatics 2017;33:2068-70. [Google Scholar]
51. Koster J, Volckmann R, Zwijnenburg D et al. Abstract 2490: R2: genomics analysis and visualization platform. Cancer Res 2019;79:2490. [Google Scholar]
52. De Matos LL, Stabenow E, Tavares MR et al. Immunohistochemistry quantification by a digital computer-assisted method compared to semiquantitative analysis. Clinics 2006;61:417-24. [Google Scholar]
53. Chen F, Chandrashekar DS, Scheurer ME et al. Global molecular alterations involving recurrence or progression of pediatric brain tumors. Neoplasia 2022;24:22-33. [Google Scholar]
54. Pallavicini G, Iegiani G, Berto GE et al. CITK loss inhibits growth of Group 3 and Group 4 medulloblastoma cells and sensitizes them to DNA-damaging agents. Cancers (Basel) 2020;12:542. [Google Scholar]
55. Meister N, Shalaby T, Von Bueren AO et al. Interferon-γ mediated up-regulation of caspase-8 sensitises medulloblastoma cells to radio- and chemotherapy. Eur J Cancer 2007;43:1833-41. [Google Scholar]
56. Dos Santos PF, Mansur DS. Beyond ISGlylation: functions of free intracellular and extracellular ISG15. J Interferon Cytokine Res 2017;37:246-53. [Google Scholar]
57. Swaim CD, Scott AF, Canadeo LA et al. Extracellular ISG15 signals cytokine secretion through the LFA-1 integrin receptor. Mol Cell 2017;68:581-90. [Google Scholar]
58. Sengupta S, Weeraratne SD, Sun H et al. α5-GABAA receptors negatively regulate MYC-amplified medulloblastoma growth. Acta Neuropathol 2014;127:593-603. [Google Scholar]
59. Burks J, Reed RE, Desai SD. Free ISG15 triggers an antitumor immune response against breast cancer: a new perspective. Oncotarget 2015;6:7221-31. [Google Scholar]
CBTTC: The Childhood Brain Tumor Tissue Consortium
CNS: central nervous system
G3: Group 3
G4: Group 4
HERC5: HECT and RLD domain containing E3 ubiquitin protein ligase 5 (also known as CEBP1 or CEB1)
ARIH1: Ariadne RBR E3 ubiquitin protein ligase 1, HHARI (also known as ARI, HARI or UBCH7BP)
IFN: interferon
IFNGR1: interferon gamma receptor subunit 1
IFNGR2: interferon gamma receptor subunit 2
IFN-γ: interferon gamma
IHC: immunohistochemistry
ISG: interferon-stimulated genes
ISG15: interferon-stimulated gene 15
JAK1: Janus kinase 1
JAK2: Janus kinase 2
MB: medulloblastoma
SHH: Sonic Hedgehog
STAT1: signal transducer and activator of transcription 1
TMA: tissue microarray
TRIM25: tripartite motif containing 25 (also known as EFP, RNF147, Z147, or ZNF147)
UALCAN: University of Alabama at Birmingham Cancer Data Analysis Portal
UBCH8: ubiquitin conjugating enzyme E2 L6 (also known as RIG-B or UBE2L6)
UBA1L: E1-activating enzyme ubiquitin-proteasome system
WHO: World Health Organization
WNT: Wingless
Cite This Article
 Copyright © 2025 The Author(s). Published by Tech Science Press.
This work is licensed under a Creative Commons Attribution 4.0 International License , which permits unrestricted use, distribution, and reproduction in any medium, provided the original work is properly cited.
 Downloads
 Citation Tools