
 Submit a Paper
 Propose a Special lssue
 Open Access
ARTICLE
Association between interleukin-6 promoter polymorphisms and osteoporosis in javanese postmenopausal women
1 Doctoral Program of Medical Science, Faculty of Medicine, Universitas Brawijaya, Malang, 65145, Indonesia
2 Department of Biomedical, Medical Faculty, Universitas Wijaya Kusuma Surabaya, Surabaya, 60225, Indonesia
3 Department of Orthopaedic, Faculty of Medicine, Universitas Brawijaya, Malang, 65145, Indonesia
4 Department of Pharmacy, Faculty of Medicine, Universitas Brawijaya, Malang, 65145, Indonesia
5 Department of Clinical Parasitology, Faculty of Medicine, Universitas Brawijaya, Malang, 65145, Indonesia
* Corresponding Author: LE Fitri,
European Cytokine Network 2025, 36(4), 74-83. https://doi.org/10.1684/ecn.2025.0507
Accepted 26 January 2026; Issue published 28 February 2026
 View Full Text
 Download PDF
Abstract
Background: The expression of the interleukin-6 (IL-6) gene promoter and its variations in postmenopausal women of Javanese ethnicity remains unexplored. This study aimed to examine IL-6 promoter polymorphisms at positions -174G/C, -572G/C, -597A/G, and -634C/G and their associations to osteoporosis status in Javanese postmenopausal women. Methods: A cross-sectional study was conducted at an elderly integrated service post in Sidoarjo, Indonesia. Among 699 screened individuals, 66 postmenopausal women fulfilled the inclusion and exclusion criteria. Bone mineral density was assessed using dual-energy X-ray absorptiometry (DXA), and osteoporosis status was defined based on T-score values. IL-6 promoter polymorphisms were genotyped by sequencing PCR-amplified promoter regions. IL-6 mRNA expression was assessed using RT-PCR followed by densitometric analysis, and serum IL-6 concentrations were determined using enzyme-linked immunosorbent assay. Results: Our study showed that osteoporosis and osteopenia were predominant (28.8% and 57.6%, respectively), and 13.6% of subjects had normal BMD. The IL-6 promoter variant genotypes and frequencies were as follows: at -174 GG (0.924), CC (0.045), and GC (0.030); at -572 GC (0.424), CC (0.406), and GG (0.167); at -597 GG (0.924) and GA (0.076); and at -634 CC (1). The IL-6 mRNA and protein level (median 6.06, IQR 5.0398 pg/mL) were not statistically different among individuals with different genotypes and with normal, osteopenia, or osteoporosis status. Ordinal regression showed that IL-6 promoter polymorphisms were not significantly associated with osteoporosis status. The polymorphisms of the IL-6 promoter were detected in Javanese postmenopausal women; however, such polymorphisms did not correlate with IL-6 mRNA and protein levels nor osteoporosis status. Conclusion: IL-6 promoter polymorphisms were present in Javanese postmenopausal women; however, these variants were not associated with IL-6 expression at the mRNA or protein level, nor with osteoporosis status.Keywords
Osteoporosis is a disease characterized by bone fragility. Osteoporosis is diagnosed by the presence of low bone mineral density (BMD), microarchitectural bone tissue abnormalities, and/or fracture due to bone fragility. Osteoporosis has been known as «the silent disease» as its clinical manifestation is mostly undetected until bone fracture(s) occur [1]. Such fractures may result in disability, a lower quality of life, high financial costs for patient care, and even mortality. Many factors underlying osteoporosis include age, genetics, lifestyle, drugs, and diseases. The loss of trabecular bone begins during the third decade of life in both men and women and is accelerated at the menopause, whereas most of the cortical bone loss occurs 10 years after the menopause due to cortical thinning and increased cortical porosity [2–5]. Increased bone resorption due to estrogen deficiency has been suggested as one of the mechanisms of osteoporosis in postmenopausal women. Estrogen directly regulates the balance of bone absorption and formation processes by osteoclasts and osteoblasts, respectively, and indirectly via inflammatory cytokines, including interleukin-6 (IL-6) [6]. In postmenopausal women, the estrogen deficiency may result in higher level circulatory IL-6, which stimulates osteoclastogenesis, thus increasing bone resorption, leading to an imbalance in bone remodeling that favors bone loss over formation and consequently develops into osteoporosis [7–11].
Considering the significant role of IL-6 in the development of osteoporosis, genetic variations in the IL-6 promoter region have garnered substantial interest because of their association with BMD and osteoporosis [12, 13]. DNA sequences in the promoter region may act as a cis-factor recognized by trans-acting proteins, which, in concert, regulate transcription of IL-6, thus altering the mRNA and protein level of IL-6 in response to cellular microenvironment signalling [14, 15]. Different sites within the IL-6 promoter region may function differently, as multiple regulatory elements and their corresponding transcription factors can produce differing levels of activation or act synergistically to activate the IL-6 promoter through transcription complex formation [16]. Alteration of DNA base(s) or single nucleotide polymorphisms (SNPs) may change the motif sequence recognition by or binding affinity of transcription factors, thus changing the efficiency of IL-6 expression. Among many SNPs on IL-6 promoter region, the -174 G/C (rs1800795), -572 G/C (rs1800796), -597 A/G (rs1800797), and -634 C/G were reported in genetic association studies in osteoporosis [17–19].
Bone health varies among ethnic groups, age, also between men and women [20, 21]. A study of women across seven Asian countries (Singapore, Taiwan, Thailand, Vietnam, Malaysia, Indonesia, and the Philippines) demonstrated that Indonesian women were among those with the lowest T- scores [22]. Indonesia comprises several ethnic groups, with Javanese accounting for approximately 40% of the population, and our previous study demonstrated that the prevalence of osteoporosis among Javanese postmenopausal women was 73.5% [23, 24]. Despite the compilation of global and regional distribution and frequencies of IL-6 promoter SNPs that could be retrieved from several genetic databases, including Ensemble [25]. Such data for the Indonesian population are lacking; therefore, investigating these SNPs in the Javanese female population, which has a high prevalence of osteoporosis, is crucial for filling this regional gap in genetic epidemiology.
The presents study investigated the genotype and frequencies of IL-6 SNPs at -174 G/C (rs1800795), -572 G/C (rs1800796), -597 A/G (rs1800797), and -634 C/G, IL-6 mRNA and protein levels, as well as determine whether there was any association between IL-6 SNPs genotypes with IL-6 expression and with osteoporosis, in postmenopausal Javanese women resided in Sidoarjo and Surabaya, Indonesia.
This cross-sectional study was conducted in Sidoarjo and Surabaya, East Java, Indonesia. Subjects who attended monthly activity at the Elderly Integrated Service Post (Posyandu Lansia), coming from 13 villages in Sidoarjo and a community association in Surabaya, were screened using questionnaires (the Foundation for Medical Practice Education’s Health Questionnaire for Postmenopausal Women), family pedigree form (three generation information to determine ethnicity), interviews, and BMD check using quantitative ultrasound (QUS) and dual-energy X-ray absorptiometry (DXA) on lumbal and femoral neck bone (Discovery, Hologic, Canada). Inclusion criteria used were women, Javanese (Javanese ethnicity across three generations was verified using family pedigree tracing), and postmenopausal period (no menstruation for 12 consecutive months). The osteoporosis diagnoses in postmenopausal women were based on T-score values (WHO classification: normal if the T-score was > -1.0, osteopenia between -1.0 and -2.5, and osteoporosis if < -2.5). The exclusion criteria, which included several risk factors affecting IL-6 production and reduced bone mass, were rheumatoid arthritis, tuberculosis, diabetes mellitus, breast cancer with bone metastasis, a history of unilateral or bilateral oophorectomy, use of bisphosphonates, regular coffee consumption of more than four cups per day (approximately 946 mL), and/or lack of regular physical exercise for at least 30 minutes per session, a minimum of three times per week [26]. Informed consent was given verbally and in writing in the prior study, with ethical clearance approved by the Health Research Ethics Commission, Faculty of Medicine, Universitas Brawijaya, with the number 247/EC/KEPK/S3/06/2016.
Determination of IL-6 promoter SNPs and IL-6 expression
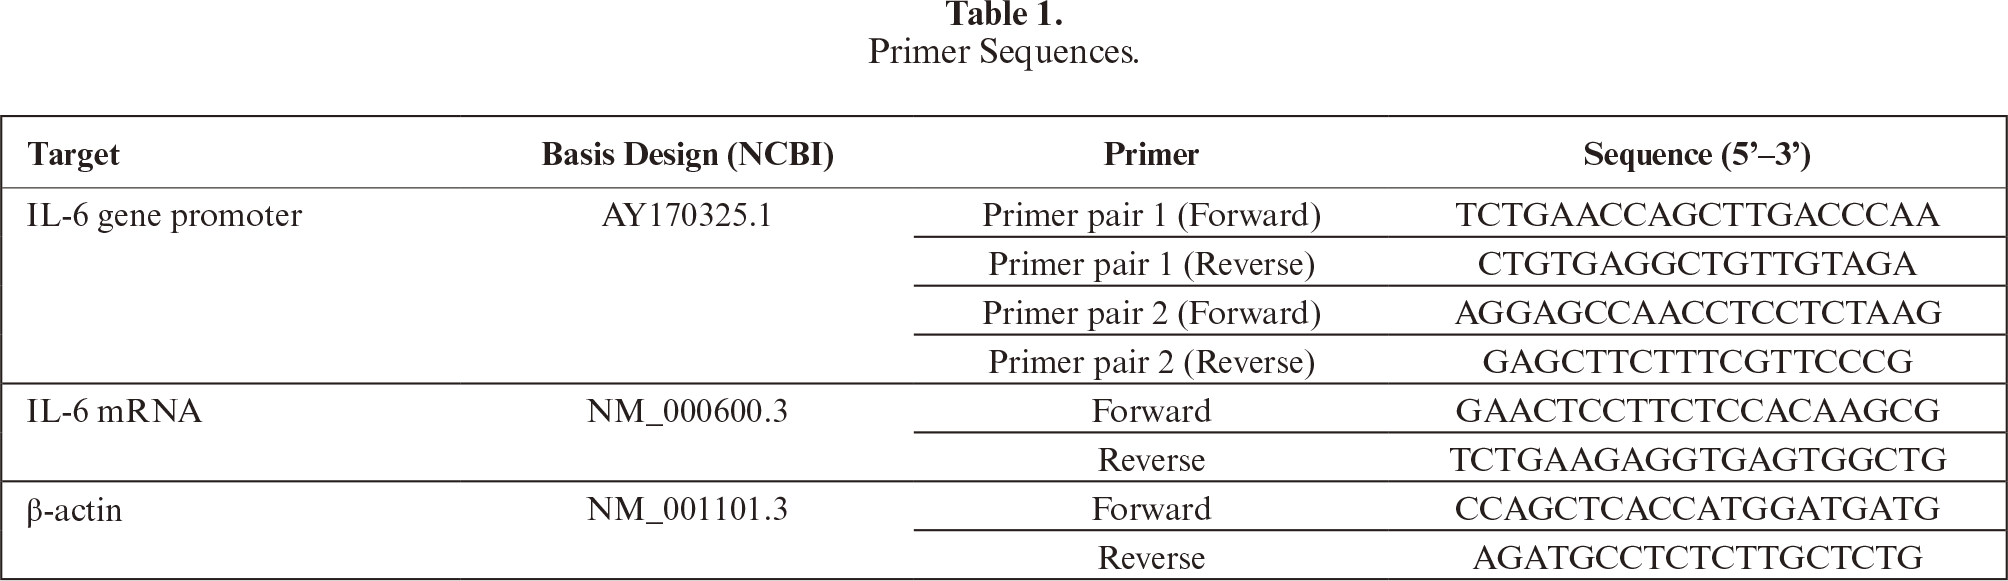
Blood samples were collected from participants meeting inclusion and exclusion criteria, processed, and used for SNPs and expression analyses. Total DNA and RNA were isolated from whole blood using the QIAamp DNA Blood Mini, QIAamp RNA Blood Mini, and RNase-Free DNase Set from QIAGEN (catalog numbers: 511404, 52304,79254, Hilden, Germany). The concentration and purity of DNA and RNA were measured by a spectrophotometer at λ = 260 nm and λ = 280 nm with RNase-free water as a blank. The primers used are shown in table 1.
IL-6 mRNA levels were determined using the Reverse Transcriptase PCR kit (GoTaq® Green Master Mix, Promega, and OneStep RT-PCR, Qiagen). PCR reaction consisted of GoTaq® Green Master Mix 1×12.5 μl, 1 μL of each primer, DNA template, and water to make up a 25 μL volume. For RT-PCR, the 40 μL reaction consisted of 8 μL buffer, 1.6 μL dNTP mix, 1.6 μL enzyme mix, 25 ng RNA template, and 1.6 μL for each primer (both IL-6 and β-actin genes). PCR programming was preceded by the formation of cDNA from mRNA. Amplification of cDNA used cycles of 94 °C for 30 seconds, 53 °C for 30 seconds, 72 °C for 1 minute, and final extensions: 72 °C for 10 minutes. Comparison of cDNA band intensity samples and internal control of the β-actin gene was carried out through densitometric analysis with the ImageJ program (http://rsbweb.nih.gov/ij/). Amplification in PCR and RT-PCR was carried out on a thermal cycler machine for 35, 40, and 31 cycles for the IL-6 promoter region, IL-6, and β-actin mRNA, respectively. PCR programming for the temperature was used from pre-denaturation/incubation to extension as follows: 95 °C 1 minute; 95 °C 30 seconds; 57 °C 30 seconds; 72 °C 30 seconds; and 72 °C 5 minutes. Agarose gel electrophoresis was used to check PCR products of 572 and 760 bp for IL-6 promoter, and RT-PCR of 150 and 204 bp for the IL-6 and β-actin genes, respectively. DNA sequencing was performed using 3500 Series Genetic Analyzers AB Applied Biosystem (catalog number 4405673, Thermo Fisher Scientific, Massachusetts, USA), then analyzed (BioEdit) against NCBI reference sequences.
Serum IL-6 concentrations were measured, in triplicate, by using Sandwich-ELISA following manufacturer instructions (the Human IL-6 Platinum ELISA kit, eBioscience, USA Cat. No BMS213/2CE or MS213/2TENCE), read at λ = 450 nm with corrections at λ = 540–570 nm.
The distribution of the variables was examined by the Kolmogorov-Smirnov test. ANOVA one-way or Kruskal-Wallis was used to assess variable differences among groups. Pearson analyses were used to determine the association between IL-6 mRNA, protein levels, and T-score, while Spearman analyses for genotypes, IL-6 expression, and T-score bone diagnosis (normal, osteopenia, and osteoporosis).
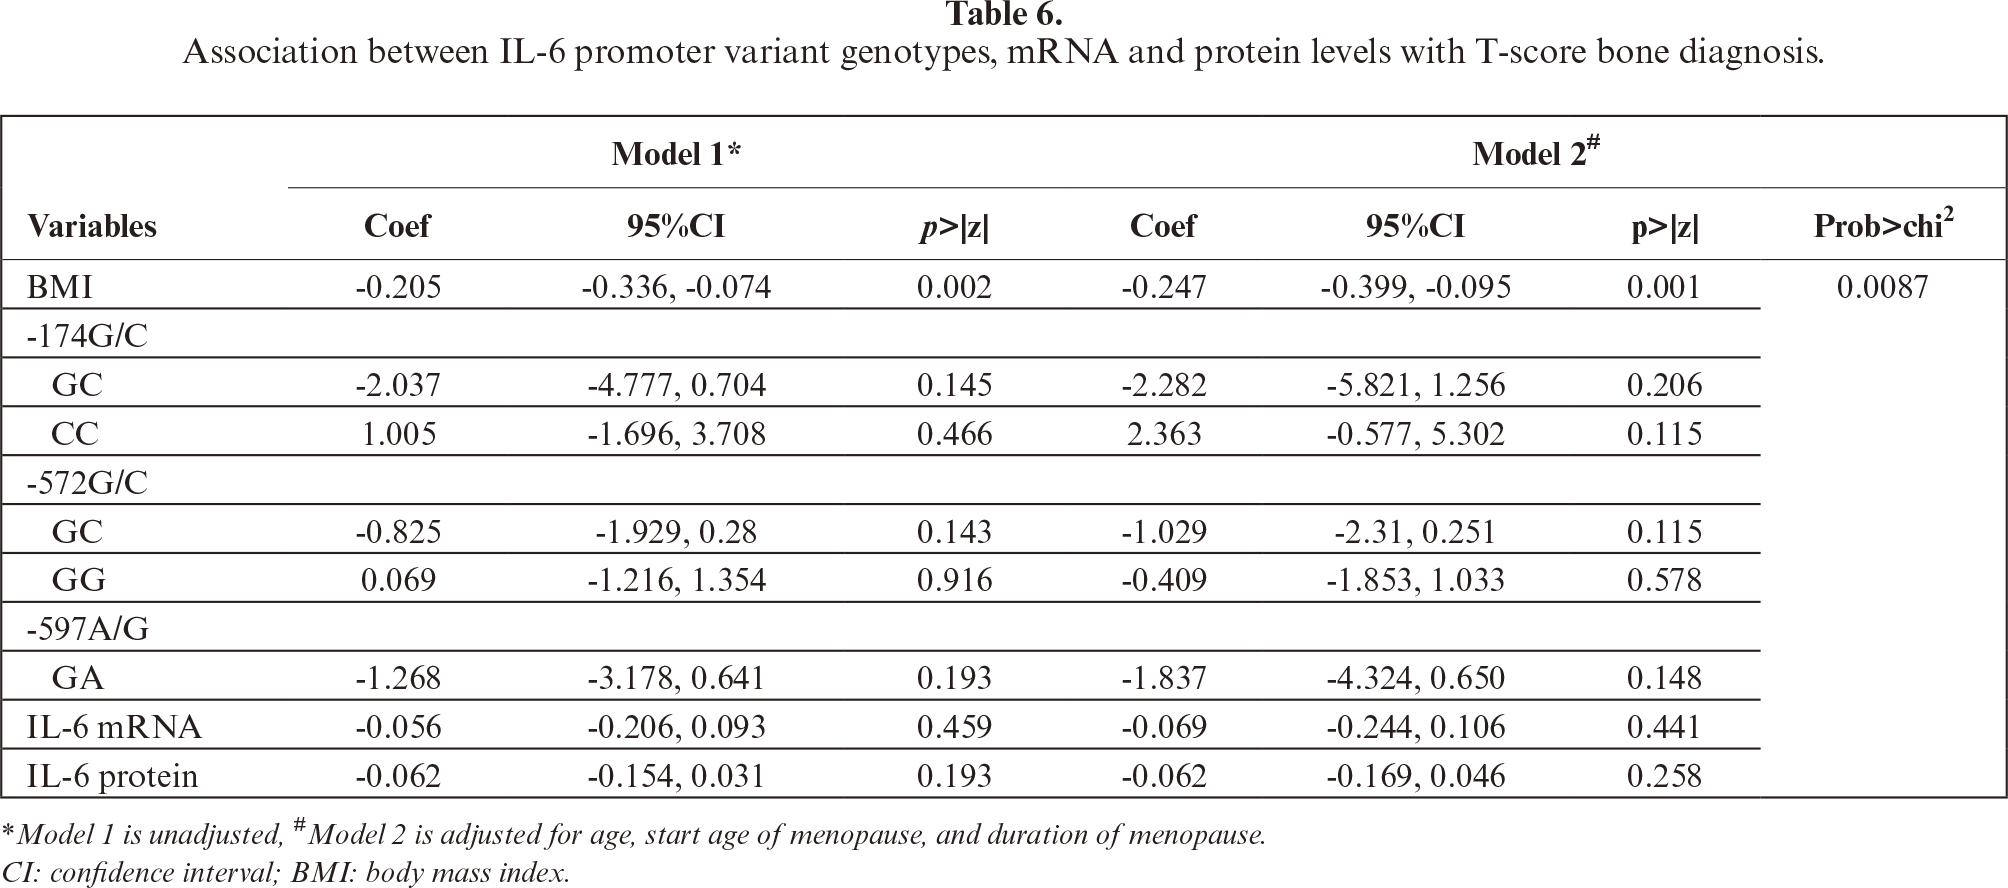
Ordinal regression models were used to analyze the independent effect of BMI, genotypes, and IL-6 expression on T-score bone diagnosis. In Model 1, each variable was regressed on the T-score bone diagnosis without adjustment, whereas in Model 2, it was adjusted for participants’ age, age when menopause started, and duration of menopause. Statistical Product and Service Solutions (SPSS) ver.22 (IBM Corp., Armonk, NY, USA) was used for the analyses, and p<0.05 was considered statistically significant.
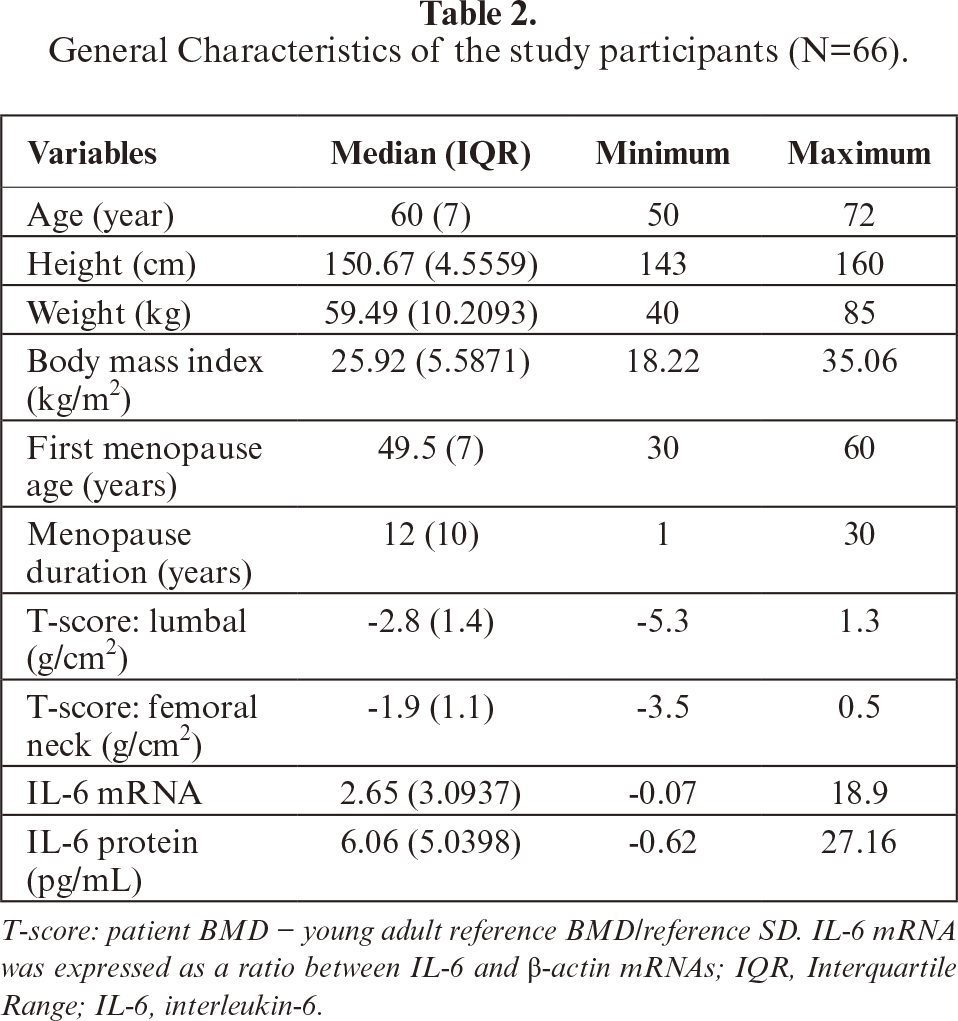
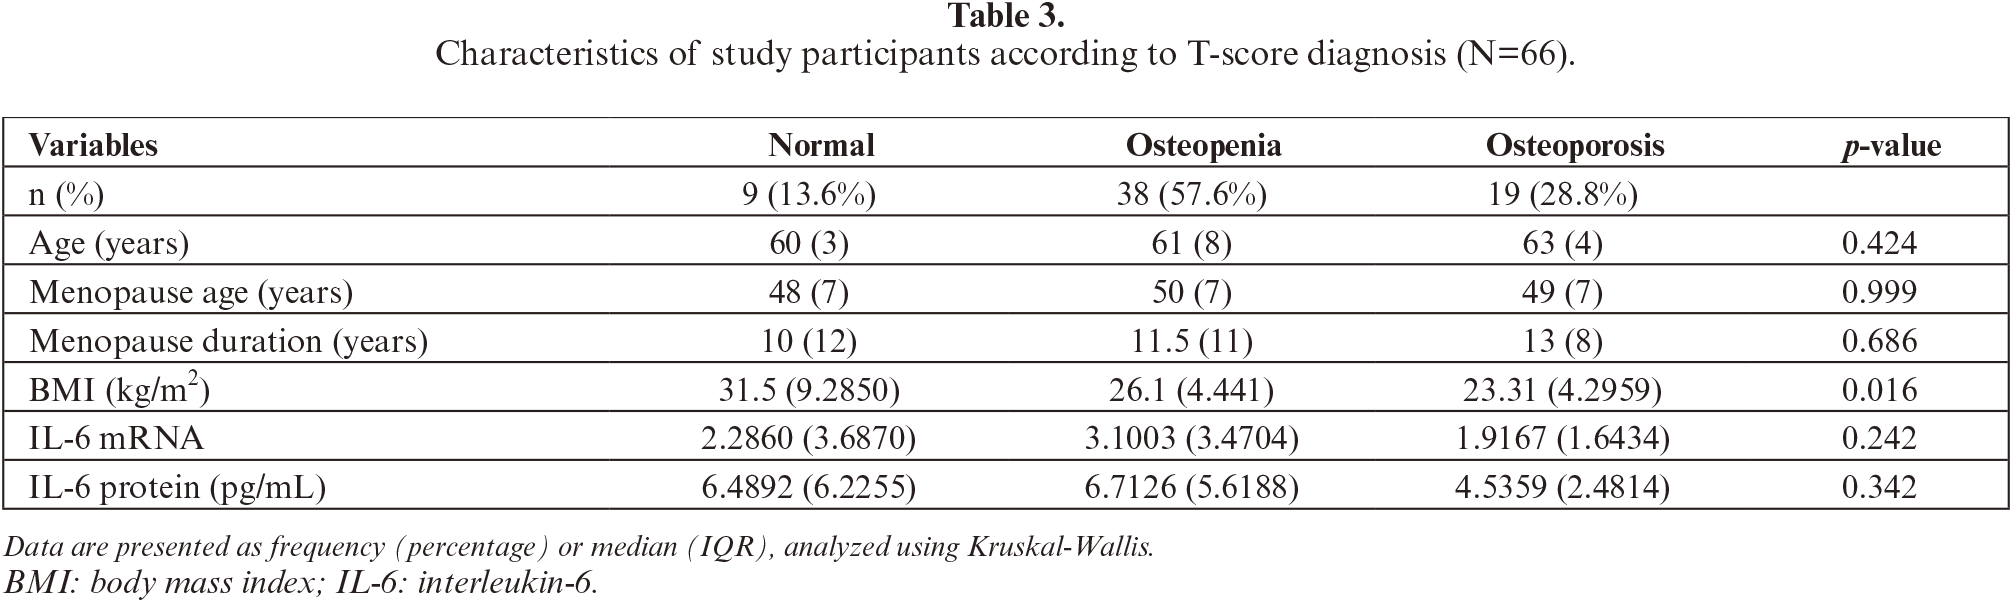
Of 699 individuals screened, 426 were postmenopausal, and a total of 66 met the inclusion and exclusion criteria. In this study, the participants’ age ranged from 50 to 72 years, and the lumbal T-score median was lower than that of the femoral neck (table 2). The prevalence of osteoporosis was 28.8 % (19/66), osteopenia 57.6% (38/66), and normal 13.6% (9/66). Of note, the median BMI of the group with normal T-score was higher than that of the osteopenia and osteoporosis groups and could be considered overweight to obese. The IL-6 mRNA and protein levels were not statistically different among normal, osteopenia, and osteoporosis groups (table 3).
Genotypes of the individuals were determined by amplifying the IL-6 gene promoter region amplified (figure 1) and sequencing for a total length of 1332 bp. The DNA sequences were analyzed, and genotype frequencies were calculated for SNP -174 G/C (rs1800795), -572 G/C (rs1800796), -597 A/G (rs1800797), and -634 C/G. More than 90% homology was demonstrated for all DNA samples aligned against the AY170325 reference sequence. If the base(s) and genotype(s) were the same with AY170325, they were designated as “wild type”, whereas if not the same were “variant” (figure 2).
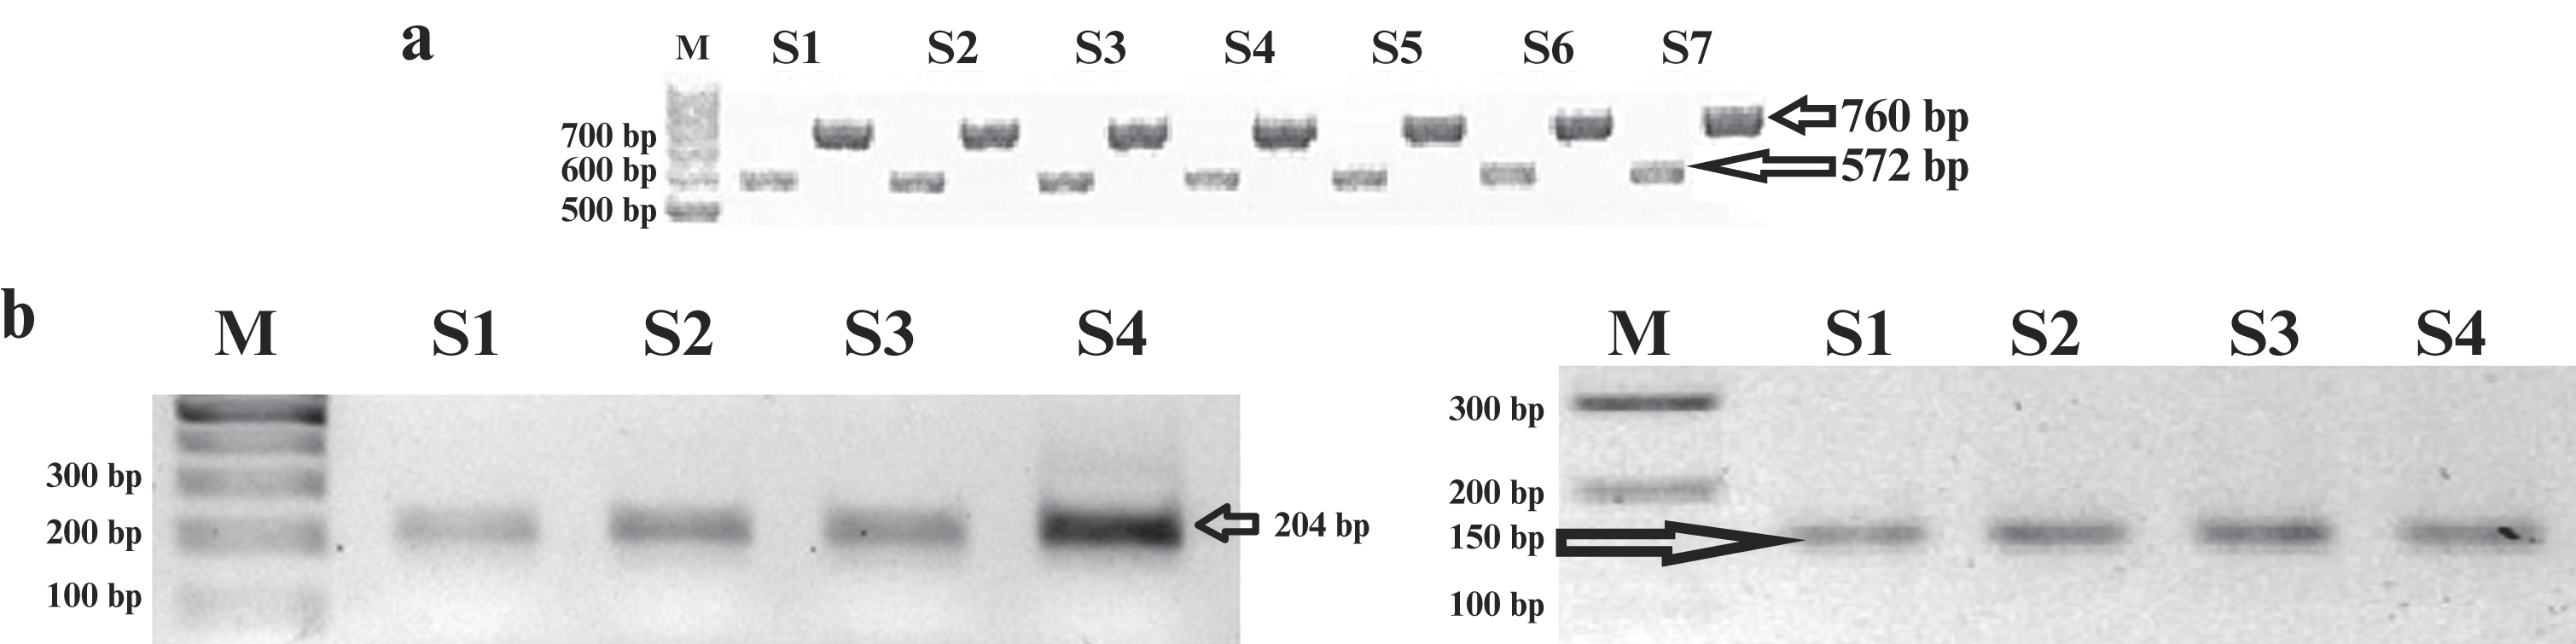
Figure 1:
Visualization of the PCR and RT-PCR products. (a) Representative of PCR results of IL-6 gene promoter products (572 bp and 760 bp); (b) Representative of RT-PCR of β-actin and IL-6 mRNAs (204 bp and 150 bp, respectively).
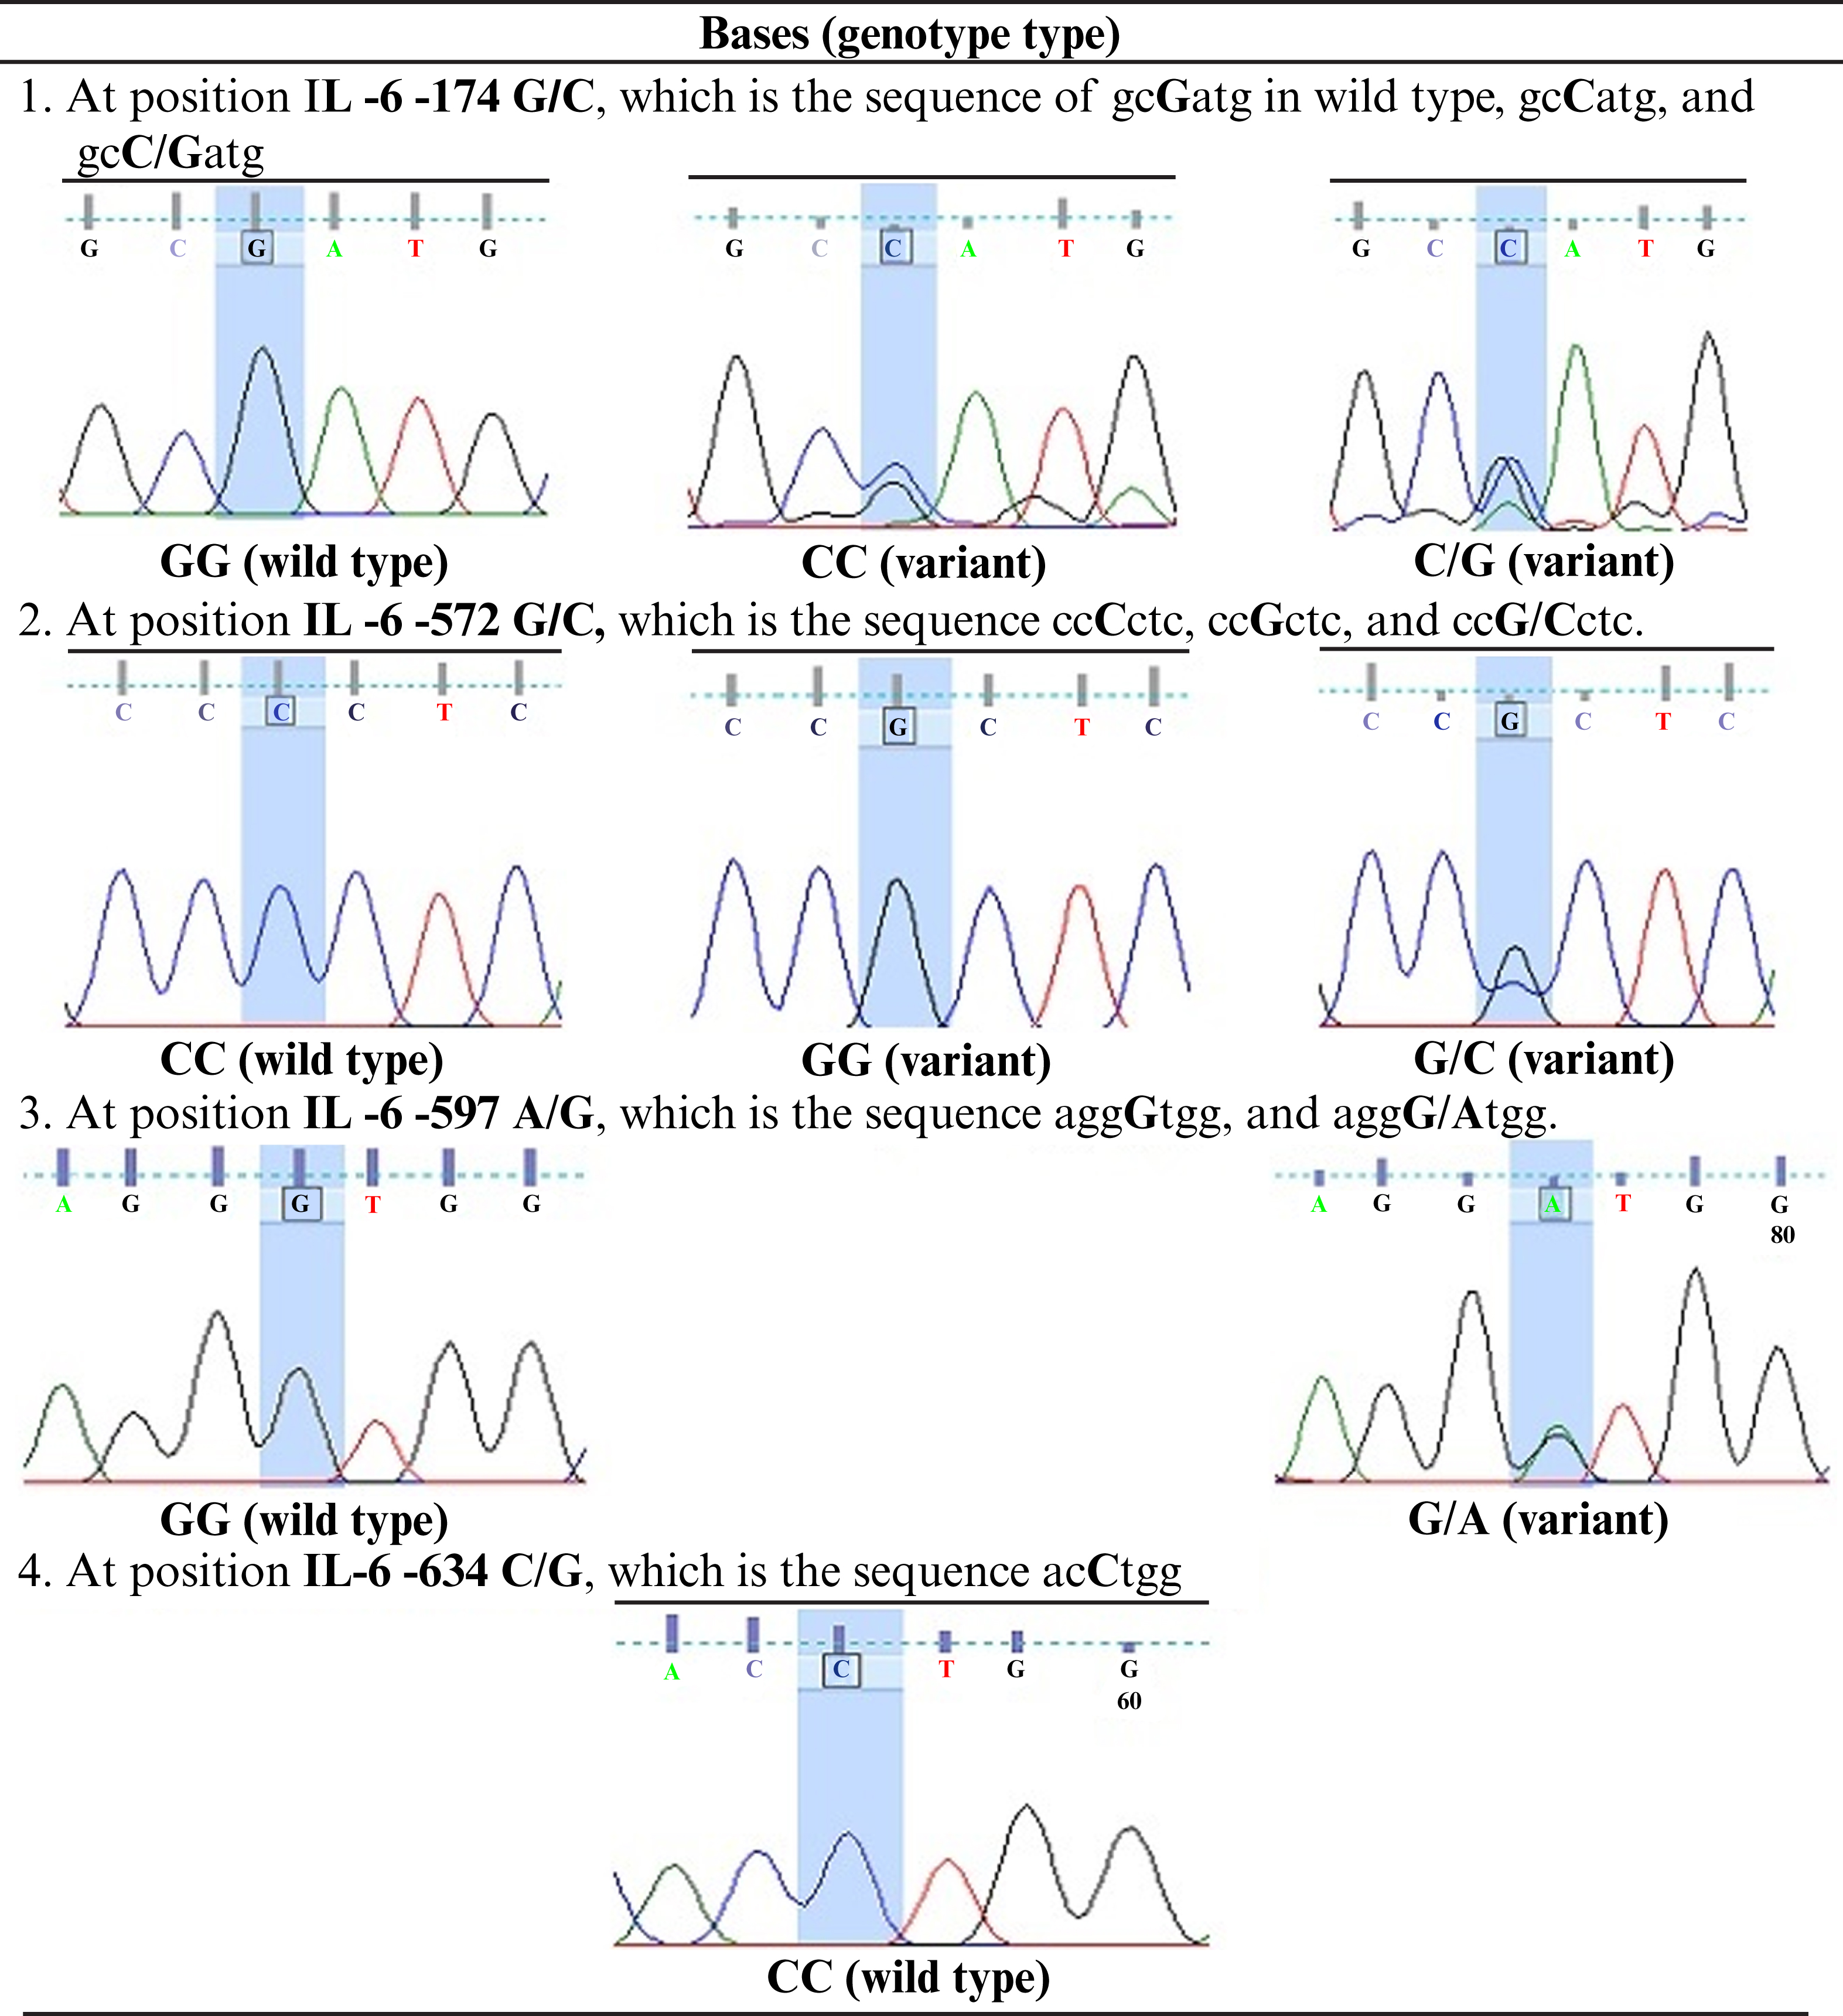
Figure 2:
Bases at four SNP positions in the IL-6 gene promoter, i.e., -174 G/C (rs1800795), -572 G/C (rs1800796), -597 A/G (rs1800797), and -634 C/G. IL-6: interleukin-6.
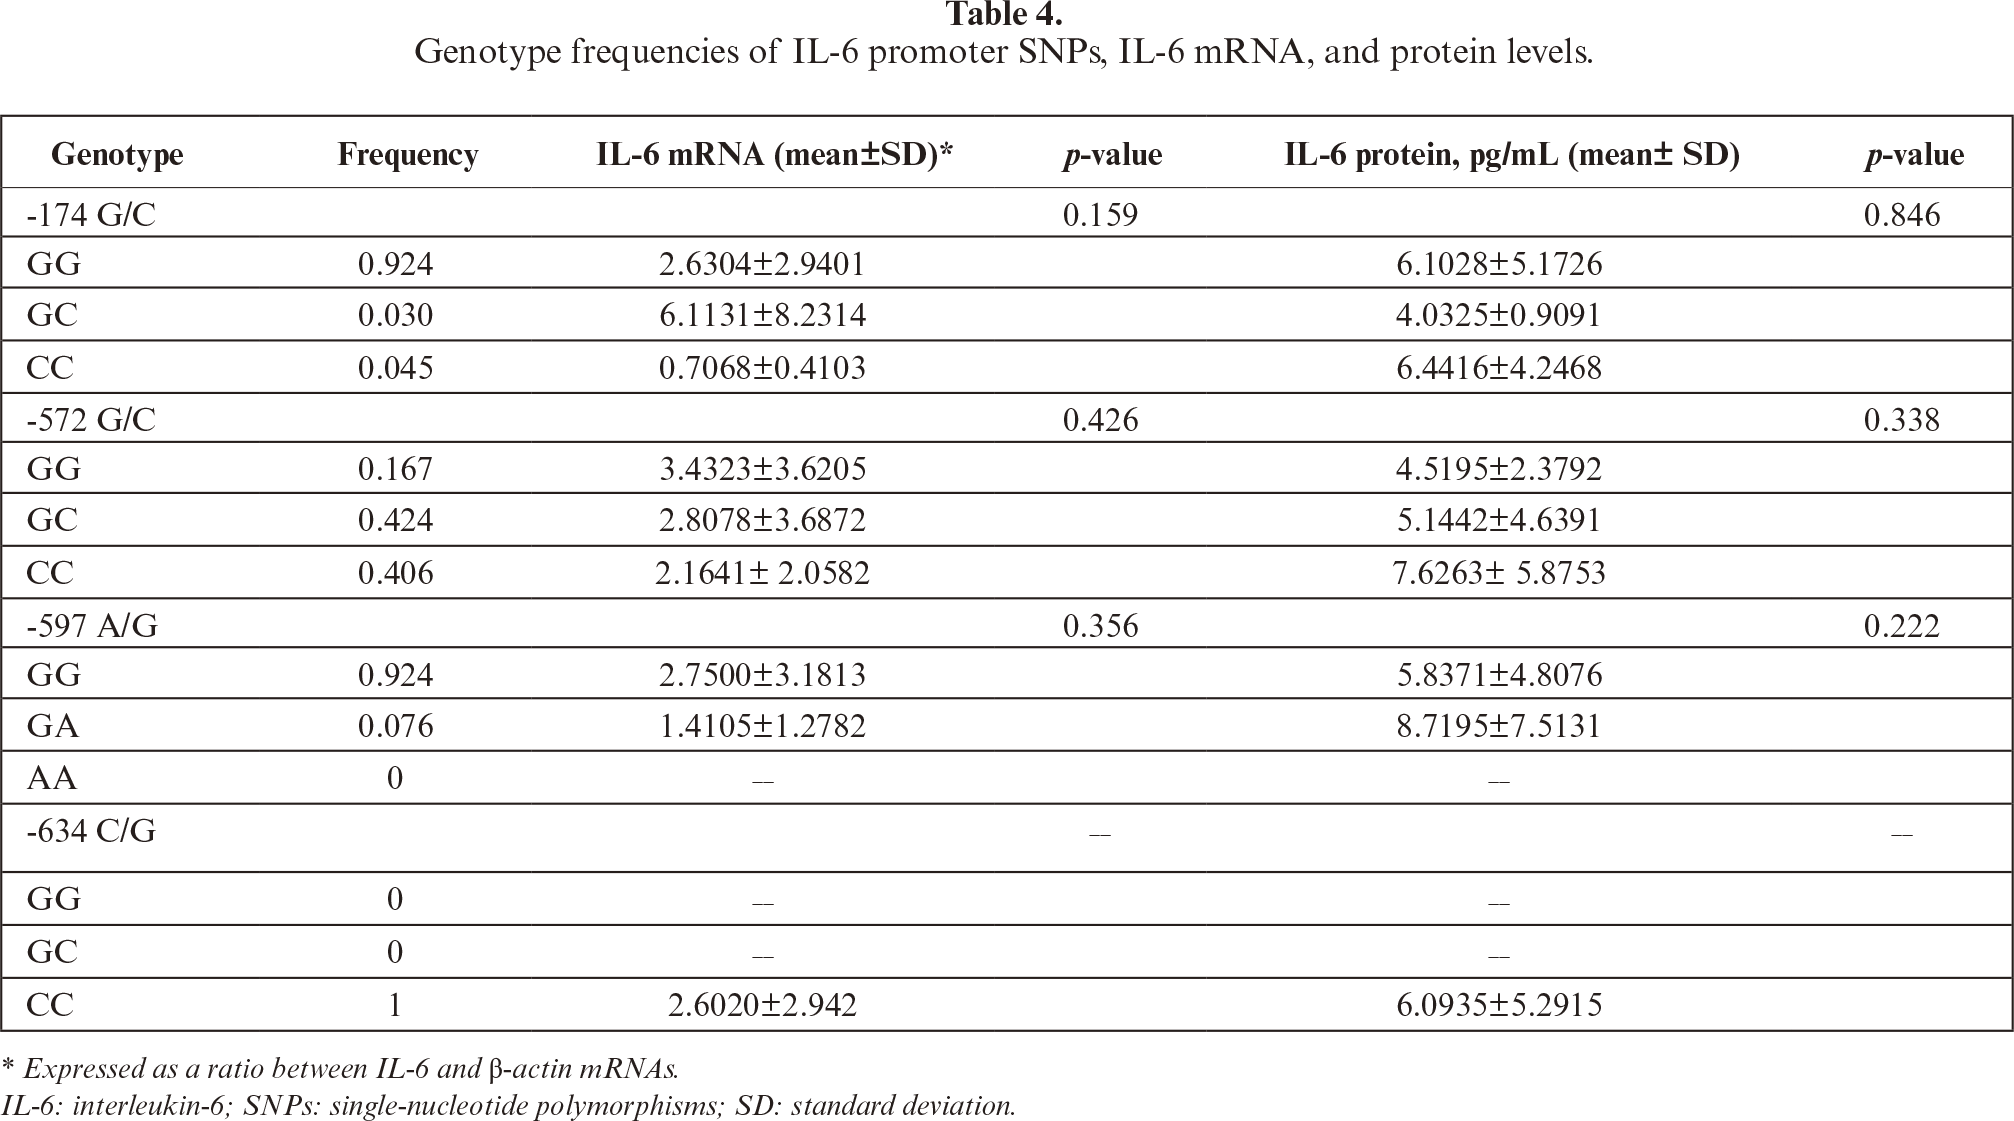
SNPs were detected at position -174 G/C, -572 G/C, and -597 A/G. The GG, CC, and GC genotypes were seen at -174 G/C and -572 G/C. The GG and A/G genotypes were also found at -597 A/G. The present study showed that frequency of IL-6 polymorphisms -174 G/C, -572 G/C, and -597 A/G were highest for GG (92.4%), GC (42.42%), and GG (92.4%) genotypes, respectively, whereas among the lowest were GC (3%), GG (16.7%), and GA (7.6%) genotypes, respectively (tables 4,5). At -634 C/G IL-6, all Javanese postmenopausal women samples showed the CC genotype (100%) and no other genotypes (CG, GG, 0%).
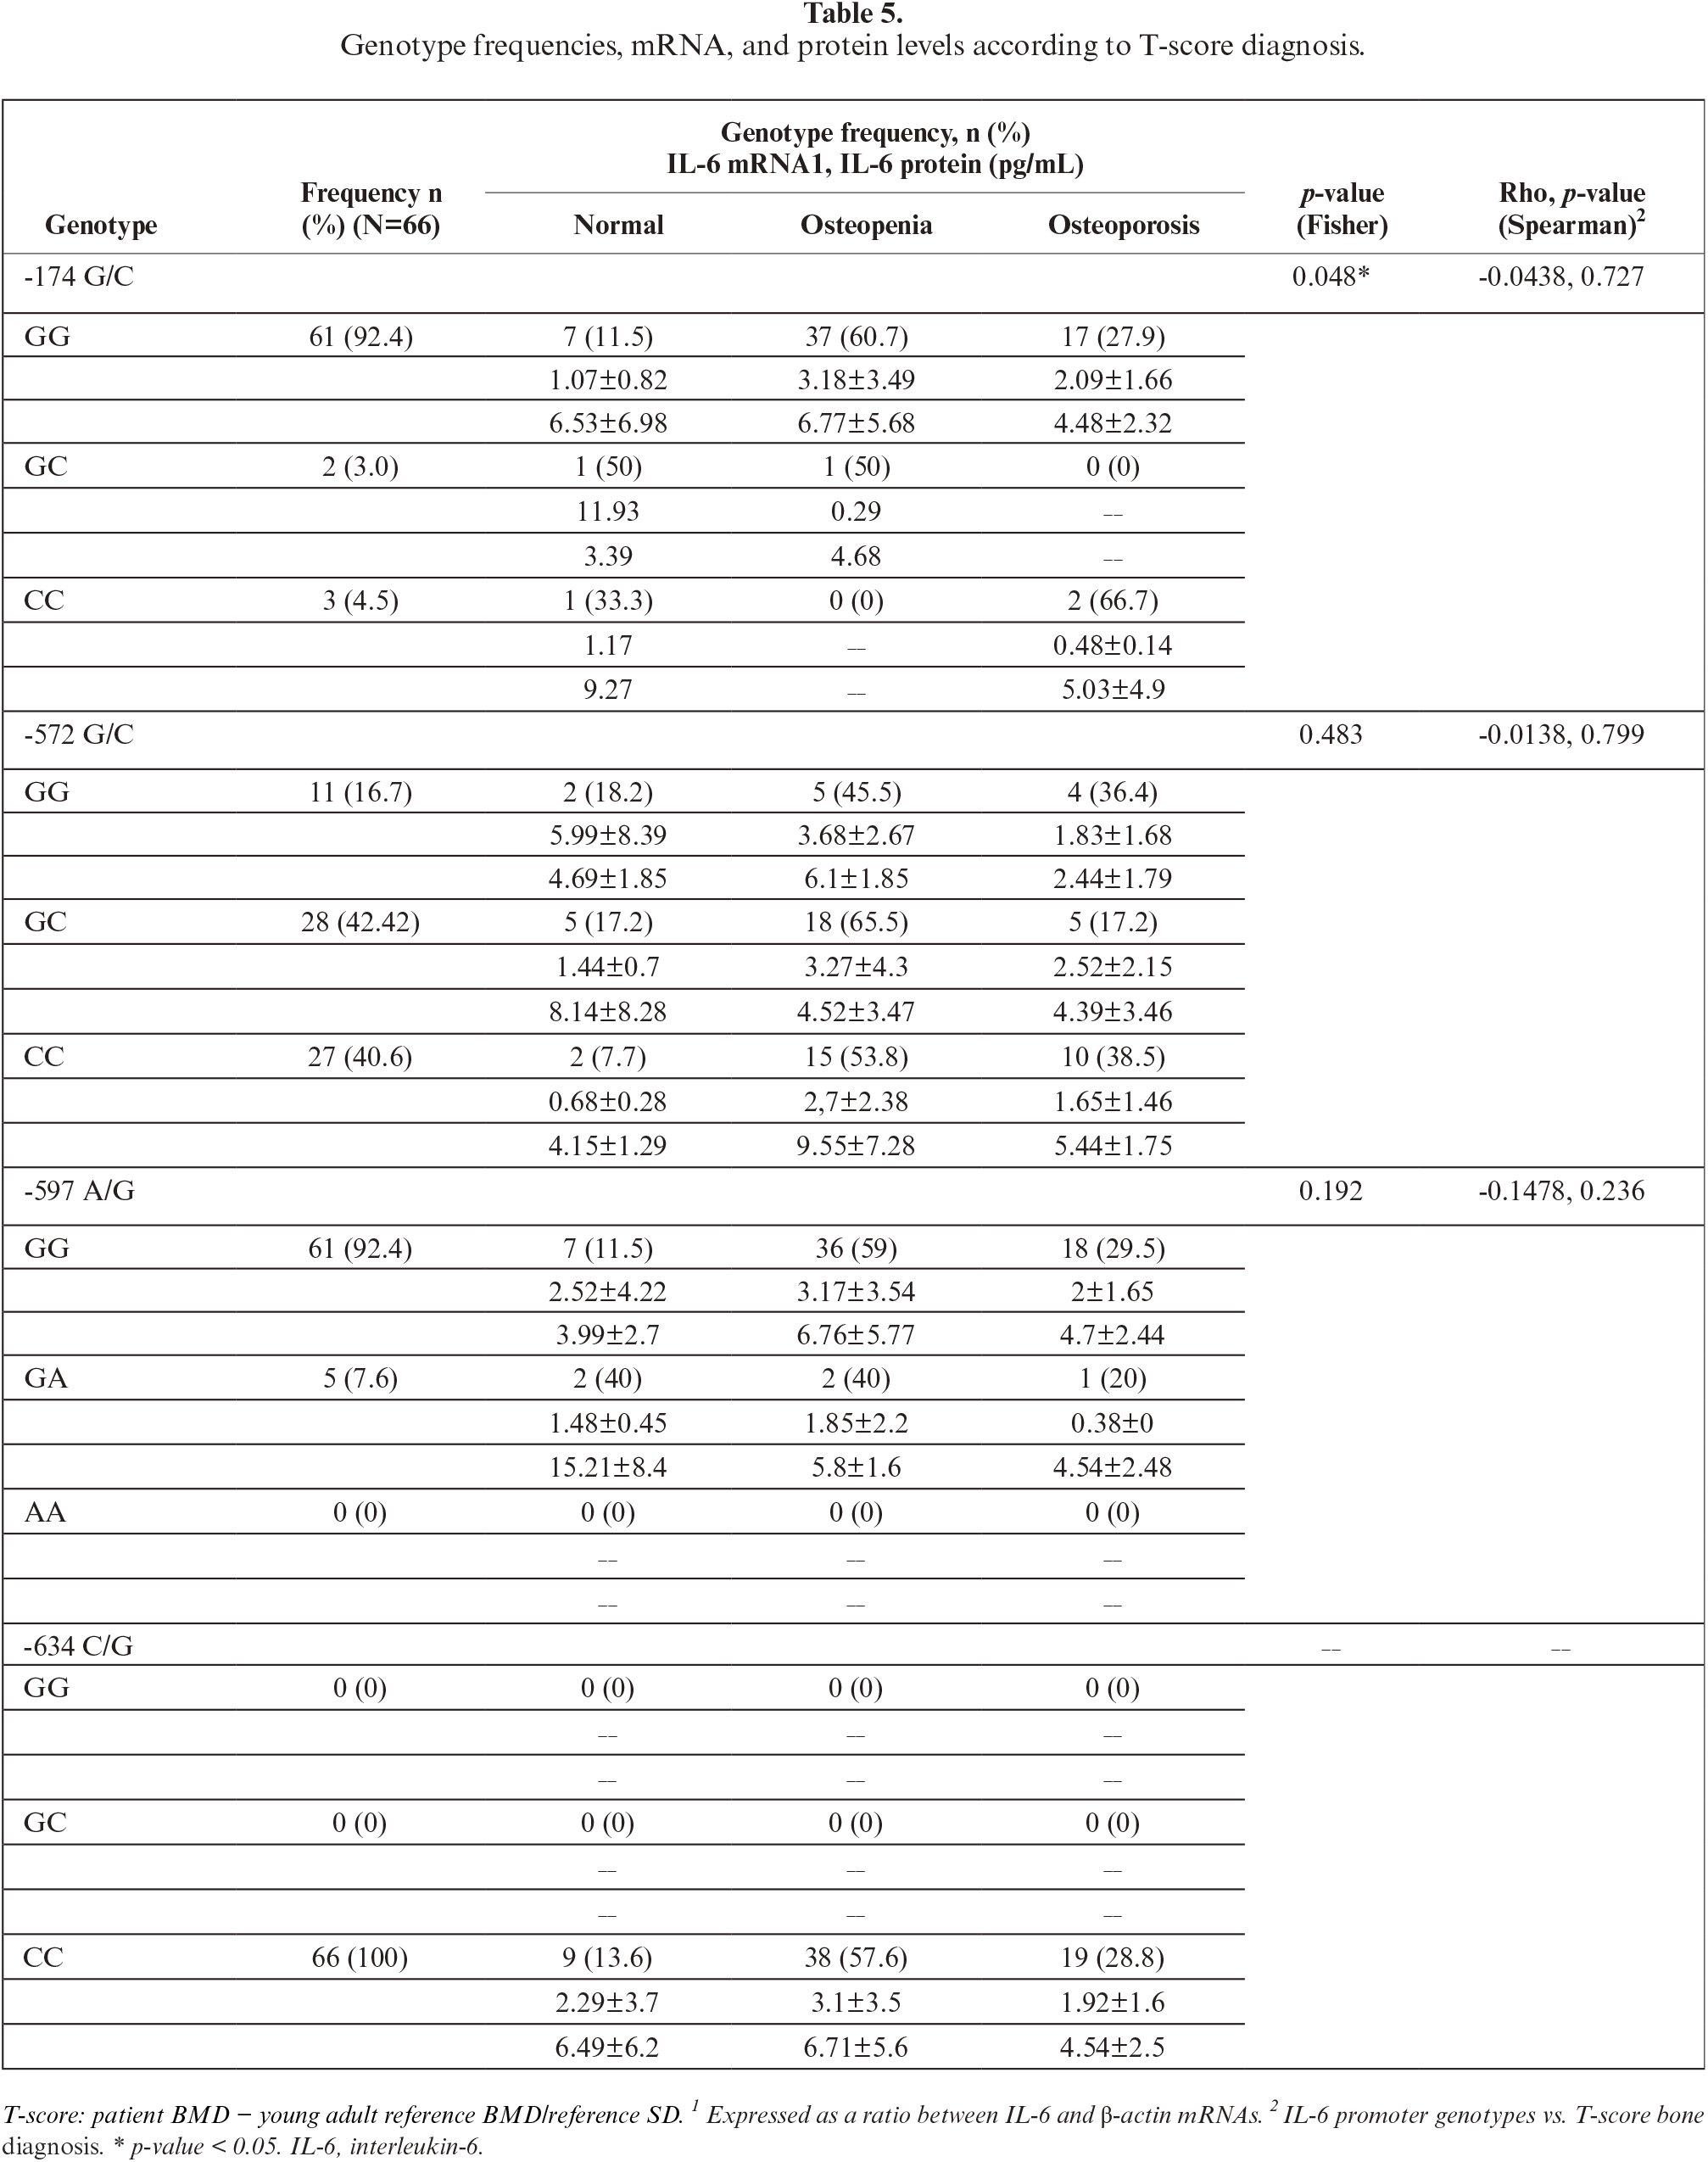
The frequency of IL-6 polymorphisms shown in table 5. The relationship between IL-6 promoter polymorphisms and diagnosis of osteoporosis was only detected on -174G/C (p=0.048). The -174 GG may correlate with osteoporosis; however, it is not statistically significant (table 5).
The association of IL-6 promoter polymorphisms, IL-6 expression, and bone densities was analyzed. Apparently, there was no linear relationship between IL-6 mRNA and protein level, with Pearson correlation r=0.0578, p=0.645. The Pearson correlation between T-scores with IL-6 mRNA and protein levels was not significant (r=0.002, p=0.986 and r=0.108, p=0.387, respectively). Similarly, there were also no significant differences in IL-6 mRNA and protein levels among different genotypes at position -174, -572, and -597 as summarized in figure 3 and table 6
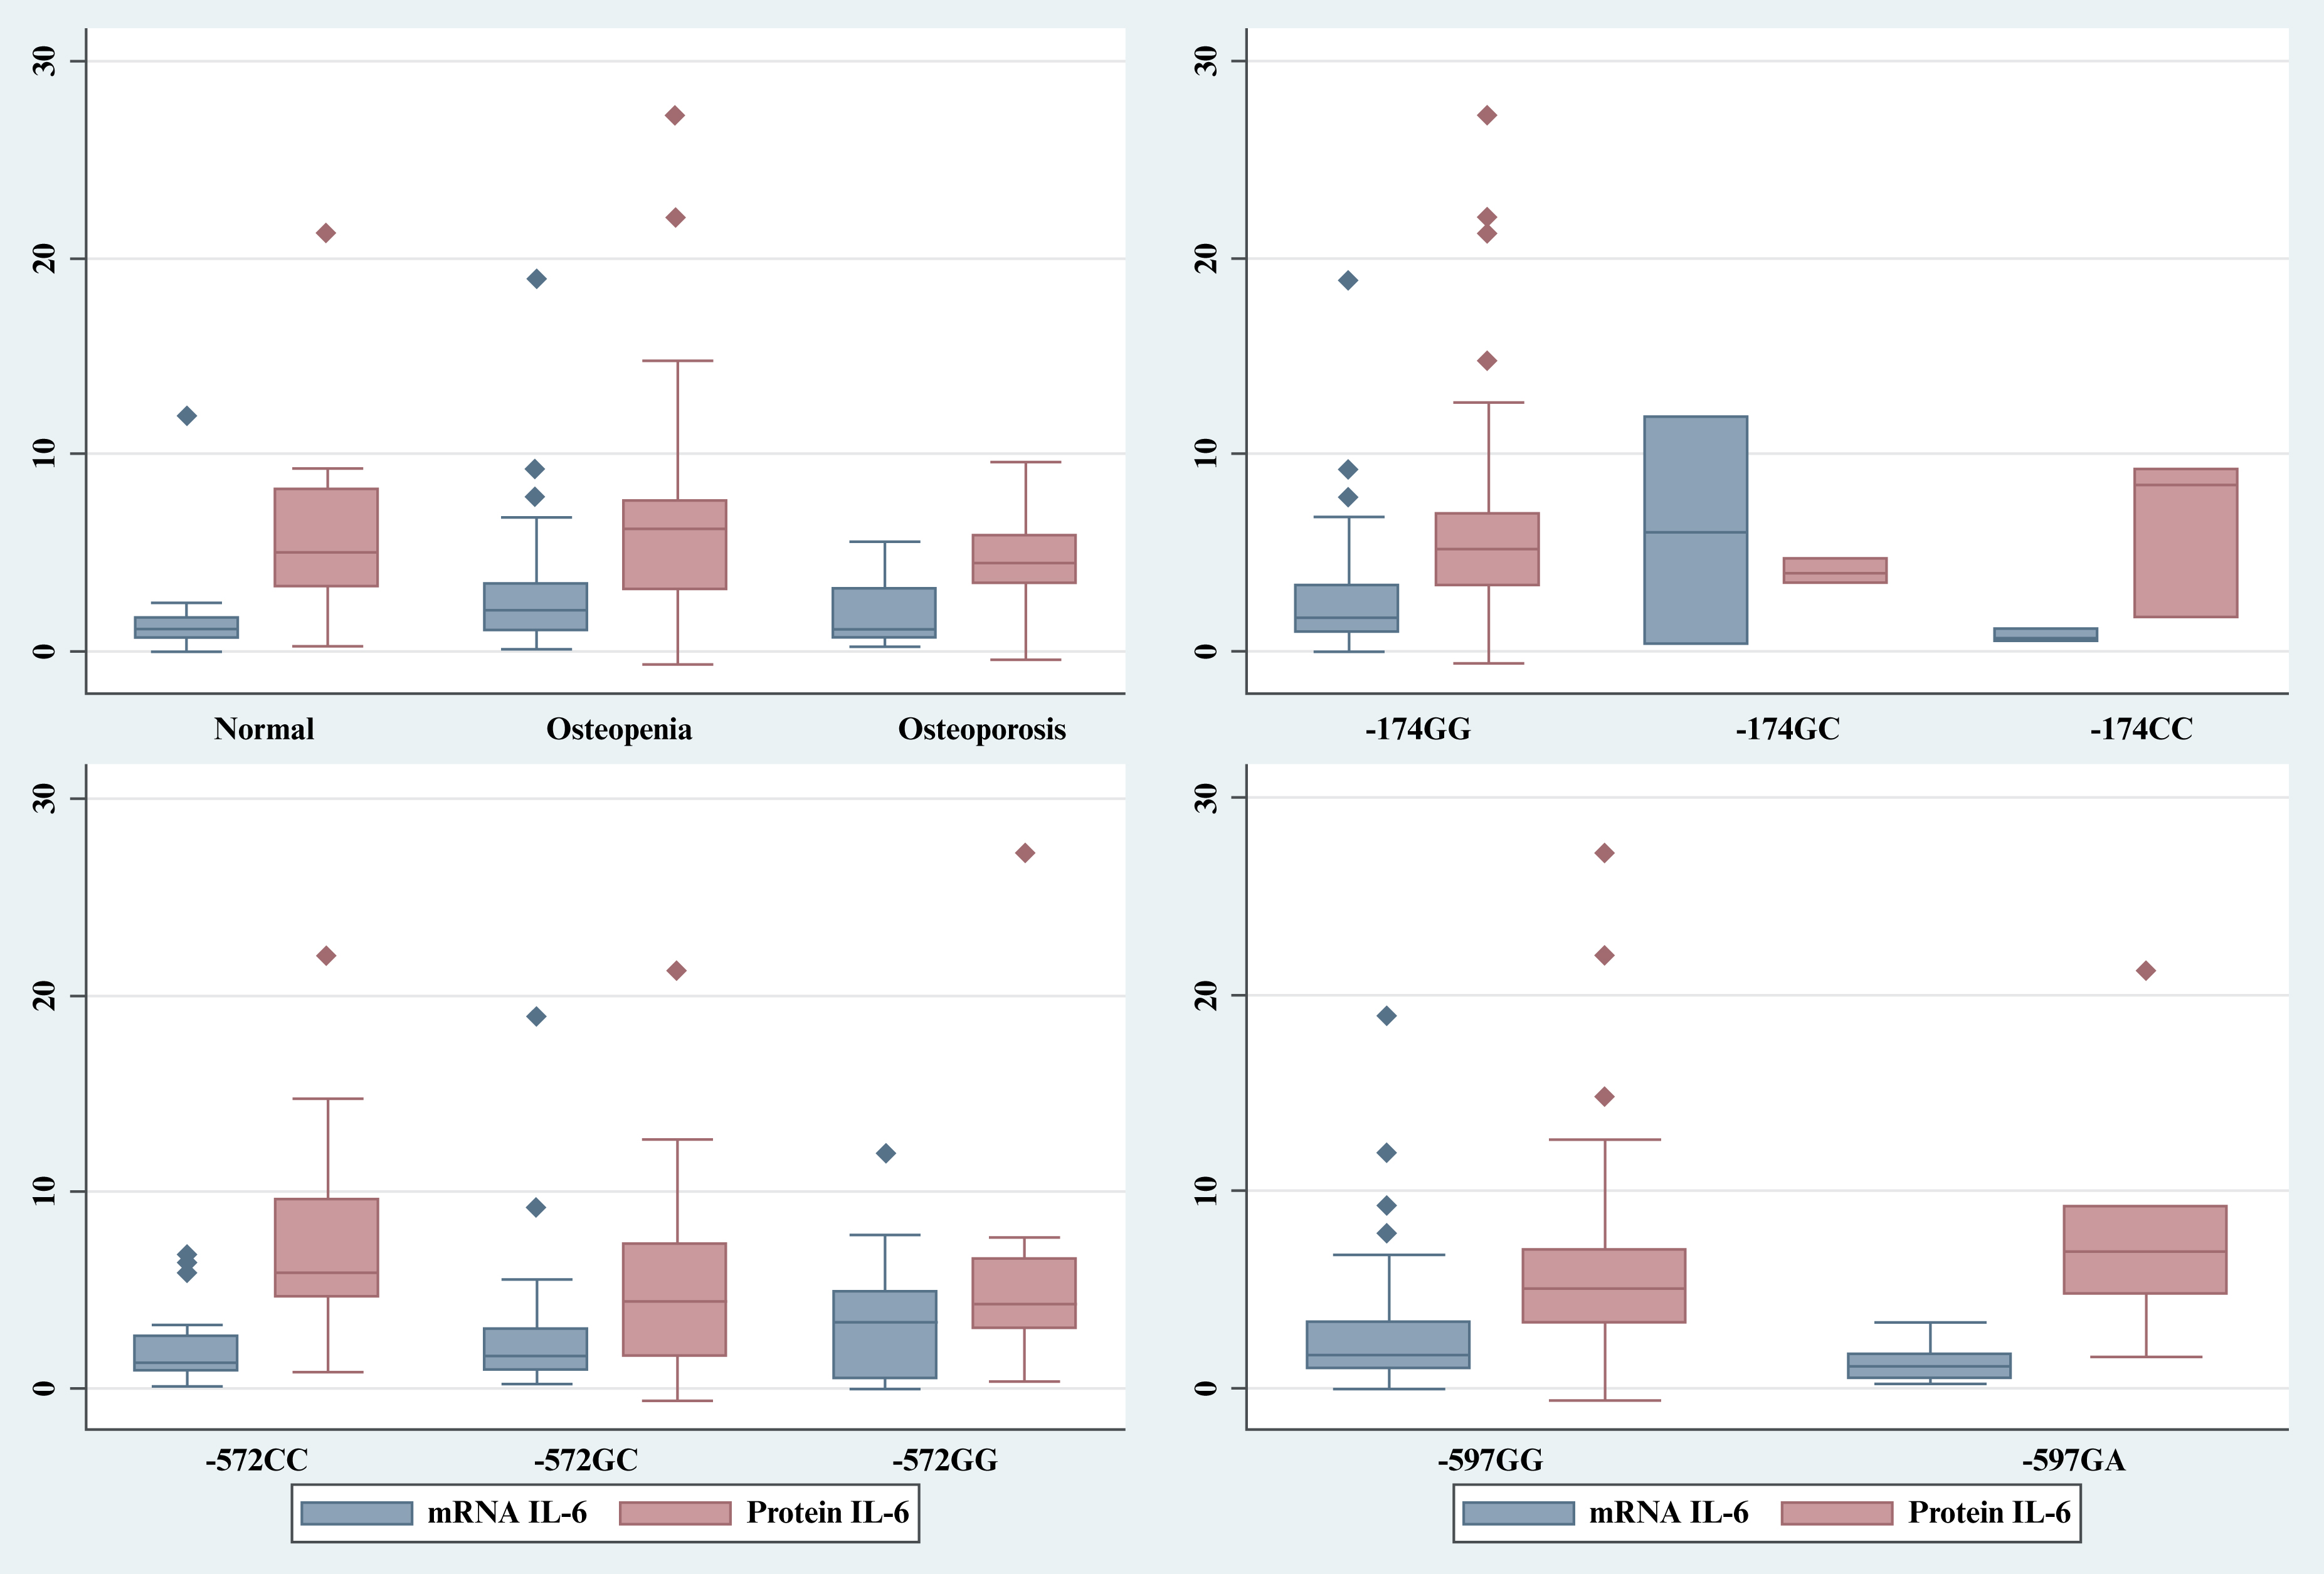
Figure 3:
Summary of IL-6 expression based on T-score diagnosis and IL-6 promoter genotypes. IL-6: interleukin-6.
Many publications reported the association of the SNPs in IL-6 promoter region with risks of osteoporosis; however, mostly were not completed with measurement of the actual IL-6 expression. While numerous studies focus on elderly populations, research suggests that genetic predisposition begins to manifest early. It has been reported that IL-6 promoter variants are associated with BMD even in pre-menopausal women, suggesting that genetic screening could identify at-risk individuals long before the onset of age-related bone loss [12]. Large-scale evidence suggests that specific loci within the IL-6 promoter region are significant predictors of bone health. A meta-analysis focused specifically on the -174 G/C polymorphism, identifying it as a key genetic risk factor for the development of osteoporosis [18]. Building upon this, an independent comprehensive meta-analysis that examined both the -174G/C and -572C/G polymorphisms, confirmed their roles as significant markers in determining individual susceptibility to bone mass loss [17].
Recent studies have highlighted how genetic risk factors interact with environmental and physiological variables in specific Asian cohorts. In another report, focusing on Chinese postmenopausal women, the impact of IL-6 polymorphisms on osteoporosis risk was found to be significantly exacerbated when obesity was taken into account, suggesting a synergistic effect between systemic inflammation and genetic makeup [19]. In the Indonesian context, the results from two studies pinpointed specific regional variations. These studies observed distinct genotype differences in the -572 G>C and -174 G>C loci among Balinese postmenopausal women, distinguishing those with and without osteoporosis. Furthermore, studies investigating less common variants, identified the presence of IL-6 -385A/T and -386A/T polymorphisms in Javanese postmenopausal women, further emphasizing the genetic diversity intrinsic to bone-related pathologies [27–28]. On the other hand, studies linking IL-6 serum levels with bone strength did not consider the SNPs of the IL-6 promoter [8, 9, 11, 20, 29].
The current research identified four SNPs in the promoter region of IL-6 and its expression in postmenopausal Javanese women, aiming to explore the relationship among the genotypes, IL-6 mRNA, protein levels, and osteoporosis. The results showed that the genotype of the SNPs and their frequency did not significantly differ among normal, osteopenia and osteoporosis individuals, and that there were no statistically significant differences between the correlation of the genotypes and IL-6 expression and T-score, respectively. Overall, the median IL-6 protein values of healthy individuals were in the normal range of healthy individuals. According to a recent meta-analysis study, serum IL-6 level is 5.186 pg/mL (95% CI: 4.631, 5.740) and increases with age 0.05 pg/mL per 1 year (95% CI: 0.02, 0.09; p < 0.01) [30]. Even in studies that reported variations in IL-6 serum levels between normal and osteoporosis groups, these differences were mostly very slight and all arguably still within the normal range, for instance, in non-osteoporosis versus osteoporosis, which was 2.51±1.13 pg/mL vs 3.47±1.75 pg/mL in Balinese women [31], 0.14±0.09 IU/mL versus 0.21±0.15 IU/mL in postmenopausal German women with and without hormonal replacement therapy, respectively [8], and 0.15±0.08 IU/mL vs 0.21±0.09 IU/mL in Taiwan women [9]. These data suggested a slight upregulation of IL-6 in osteoporosis, potentially reflecting subtle increases in osteoclastogenic cytokine signaling, but not an extreme pro-inflammatory state. These studies also showed IL-6 elevations are present but small, suggesting that while IL-6 may be involved in osteoporotic processes, its circulating levels might not serve as a robust independent clinical biomarker due to overlap between groups, as the latter study mentioned that the specificity of IL-6 value for diagnosis was 54.53%, which is too low for a diagnosis tool [32]. Stojanović et al. reported that a more pronounced increase, i.e., each doubling of IL-6 serum levels, was associated with an increased hazard ratio for hip fractures, another variable of bone fragility [33]. Results from most recent studies, however, are aligned with our findings, in that circulatory IL-6 did not showed significant relation with femoral neck bone mass density [11]. Moreover, in a previous clinical trial study, a randomized, double-blinded, crossover study revealed that infusion of recombinant IL-6 did not affect bone resorption markers, which suggests that IL-6 did not regulate bone remodeling in humans [29]. Overall, these conflicting results may be explained by the nature of IL-6, which has both pro- and anti-inflammatory actvity [34], its increase with age and acting as a comorbid factor in many inflammatory diseases in the elderly [35, 36].
The expression of IL-6 is not uniform; it is highly regulated by both the cellular environment and internal stress signals. Advances in spatially resolved transcriptomics have highlighted how gene expression, including that of cytokines like IL-6, is organized in a precise architectural manner within tissues to facilitate localized immune responses [37]. At a subcellular level, the distribution of IL-6 mRNA is controlled by specific proteins. For instance, the cellular distribution of Y-box binding protein 1 (YB-1) determines IL-6 mRNA levels, indicating that the cytokine’s availability is managed through intricate intracellular localization mechanisms [38]. The biological outcome of IL-6 presence is dictated by how it interacts with its receptors. IL-6 signals through two primary modes: «classic» signaling (via the membrane-bound IL-6 receptor α) and «trans-signaling» (via the soluble IL-6 receptor). The decision between these pathways is determined by the stoichiometric ratio of IL-6 receptor α (IL-6Rα) to the signal-transducing protein gp130. Dynamic modeling has shown that even slight variations in the expression of these two components can shift a cell’s response from a classic homeostatic signal to a trans-signaling inflammatory response [39]. Furthermore, this regulation is highly cell-specific; research into endoplasmic reticulum (ER) stress shows that IL-6 family cytokines are modulated differently in astrocytes compared to macrophages, suggesting that the same physiological stressor can yield entirely different IL-6 profiles depending on the cell type involved [40].
In the context of bone physiology, the distinction between these signaling pathways is critical for therapeutic understanding. While IL-6 can exhibit both cis-(classic) and trans-signaling in osteocytes and osteoblasts, research indicates that only the trans-signaling pathway is capable of promoting bone formation and driving osteoclastogenesis. This pathway-specific influence is further evidenced in pathological states. In models of estrogen deficiency (such as post-ovariectomy), IL-6 trans-signaling has been identified as the primary mediator of trabecular bone loss. Interestingly, this effect appears localized to trabecular structures, as trans-signaling does not appear to mediate bone loss in cortical bone, further emphasizing the spatial specificity of IL-6 action within different skeletal compartments [6, 7]. The source of the specimen used, i.e., circulatory IL-6, showed temporal (diurnal) variation [41]. Therefore, such confounding factors should be considered in future studies to resolve the conflicting IL-6 roles in bone health.
In this study, we also found that the relation of mRNA and protein levels was not linear; the low or high mRNA level was not necessarily followed by a low or high level of protein, suggesting that regulation of IL-6 expression was not determined entirely by activation or repression of the IL-6 promoter. The level of IL-6 mRNA depends on the number of de novo syntheses of mRNA, posttranscription regulations such as constant flux of the mRNA between nucleus and cytoplasm, also its transport into the extracellular space, and maintenance of mRNA IL-6, i.e., the balance of its stability and degradation [38, 42]. The non-linear relation between mRNA and protein IL-6 has recently been shown following the use of metoprolol, which rapidly decreases IL-6 protein level but not mRNA [43], suggesting the level of IL-6 protein may be regulated at translational and post-translational levels, albeit the mechanisms are underexplored. Moreover, under no inducer of inflammatory condition, the SNPs in the promoter region of IL-6 most probably did not influence the level of basal circulatory IL-6mRNA and protein. Our study highlights that the relationship of genotypes (SNPs) and phenotypes at mRNA and protein levels was not always linear, and differences in SNPs or genotypes would not necessarily translate into mRNA, protein, and the relevant downstream processes.
In our study, only the -634 CC genotype (frequency 1, or 100%) was detected at IL-6 –634 C/G in the Javanese postmenopausal women, which is probably ethnic specific. The only reported study pertaining to -634 C/G,in the Javanese population, showed different results, in that is the GG genotype was proposed to play a role in BMD reduction [44]. Compared to data from other regions, including Global, Southern, and East Asia [25], the IL-6 promoter genotypes and frequencies found in the present study indicate more similarity with those of East Asia than Southern Asia. For -174G/C, the GG genotype was predominant in all regions studies, albeit with different frequencies. The present study showed that the frequency allele of -174 GG was similar to that reported in another study conducted on Javanese [35]. Another study of the Indonesian population also showed that the SNP did not correlate with osteoporosis risk [45]. Recent meta-analysis [17] and other studies, linking obesity [19] and diet [46] with IL-6 promoter SNPs, indicated that overall, -174G/C (rs1800795) was insignificantly associated with osteoporosis vulnerability. It is of note that the distribution of -572G/C (rs1800796) varies globally [25]. From this study, the genotype distribution of the Javanese resembles more than that of Southern Asia. Meta-analysis of association -572G/C with osteoporosis risk reportedly indicated that the occurrence of -572 GG increased the risk of osteoporosis [17], which is in contrast with the present study showing instead the tendency of the occurrence of CC to increase the risk of osteoporosis in Javanese postmenopausal women, despite statistically not being significant (table 5). In order to explain this discrepancy, we suggest a more comprehensive study with larger sample sizes and multicenter designs to warrant validation of the present findings.
This study has several limitations. First, the relatively small sample size may have limited the statistical power and the ability to detect subtle associations between IL-6 polymorphisms, gene expression, and osteoporosis status. Nevertheless, strict inclusion and exclusion criteria were applied to minimize potential confounding effects, particularly rheumatoid arthritis, which is common in older populations.
In conclusion, in postmenopausal Javanese women, the variant genotypes of SNP IL-6 were found in -174 G/C, -572 G/C, -597 A/G, and -634 CG. The results of this study support the assumption that the presence of SNPs in the IL-6 promoter was not necessarily associated with gene expression, i.e., mRNA and protein level nor manifestation of osteoporosis.
DISCLOSURE
Acknowledgment: The author expresses gratitude to Nur Syamsiatul Fajar of the Institute of Tropical Disease at Universitas Airlangga for her laboratory assistance and to all the participants in this study.
Funding statement: This research was funded by a competitive grant from the Ministry of Education, Culture, Research and Technology, the dissertation grant from the Educational Fund Management Institution (Ministry of Finance), Republic of Indonesia, and internal funding from the Institute of Research and Community Services (Universitas Wijaya Kusuma Surabaya). The contract number of each consecutive grant is No: PRJ-828/LPDP.3/2016.
Conflict of interest: The authors have no conflict of interest to declare
Availability of Data and Materials: The datasets generated and/or analyzed during the current study are not publicly available due to ethical restrictions and participant confidentiality, but are available from the corresponding author upon reasonable request
Ethics Approval: This study was approved by the Health Research Ethics Commission, Faculty of Medicine, Universitas Brawijaya, with the number 247/EC/KEPK/S3/06/2016. All participants provided written informed consent prior to participation. The study was conducted in accordance with the Declaration of Helsinki.
Author Contributions: The authors confirm contribution to the paper as follows: Conceptualization, SLU, MH, DL, LEF; methodology, SLU, DL; validation, SLU, LEF; formal analysis, SLU, DL; investigation, SLU, DL, LEF; resources, SLU; data curation, SLU, DL, LEF; writing—original draft preparation, SLU, DL, LEF; writing—review and editing, SLU, LEF; visualization, SLU, DL, LEF; supervision, SLU, MH, DL LEF; project administration, SLU; funding acquisition, SLU, LEF. All authors reviewed the results and approved the final version of the manuscript.
REFERENCES
1. Foundation BHaO. What is osteoporosis and what causes it? [en ligne]. US: BHOF; 2023 [cité 2023 3 octobre]. Disponible sur: https://www.bonehealthandosteoporosis.org/patients/what-is-osteoporosis/ [Google Scholar]
2. Ahire JJ, Kumar V, Rohilla A. Understanding osteoporosis: Human bone density, genetic mechanisms, gut microbiota, and future prospects. Probiotics Antimicrob Proteins 2024;16:875–83. [Google Scholar]
3. Stokes G, Herath M, Samad N, Trinh A, Milat F. Bone health-across a woman’s lifespan. Clin Endocrinol (Oxf) 2025;102:389–402. [Google Scholar]
4. Chadha M, Chaddha R, Divakar H, Kalyan H, Seth S, Shah P. Osteoporosis: epidemiology, pathogenesis, evaluation and treatment. Open J Orthop 2022;12:153–82. [Google Scholar]
5. Liang B, Burley G, Lin S, Shi YC. Osteoporosis pathogenesis and treatment: existing and emerging avenues. Cell Mol Biol Lett 2022;27:72. [Google Scholar]
6. McGregor NE, Murat M, Elango J, et al. IL-6 exhibits both cis- and trans-signaling in osteocytes and osteoblasts, but only trans-signaling promotes bone formation and osteoclastogenesis. J Biol Chem 2019;294:7850–63. [Google Scholar]
7. Lazzaro L, Tonkin BA, Poulton IJ, McGregor NE, Ferlin W, Sims NA. IL-6 trans-signalling mediates trabecular, but not cortical, bone loss after ovariectomy. Bone 2018;112:120–7. [Google Scholar]
8. Scheidt-Nave C, Bismar H, Leidig-Bruckner G, et al. Serum interleukin 6 is a major predictor of bone loss in women specific to the first decade past menopause. J Clin Endocrinol Metab 2001;86:2032–42. [Google Scholar]
9. Shi X, Jiang J, Hong R, Xu F, Dai S. Circulating IGFBP-3 and interleukin 6 as predictors of osteoporosis in postmenopausal women: A cross-sectional study. Mediators Inflamm 2023;2023:2613766. [Google Scholar]
10. Manolagas SC. Birth and death of bone cells: basic regulatory mechanisms and implications for the pathogenesis and treatment of osteoporosis. Endocr Rev 2000;21:115–37. [Google Scholar]
11. Huang Z, Xu Z, Wan R, Hu D, Huang Y. Associations between blood inflammatory markers and bone mineral density and strength in the femoral neck: findings from the MIDUS II study. Sci Rep 2023;13:10662. [Google Scholar]
12. Chung HW, Seo JS, Hur SE, et al. Association of interleukin-6 promoter variant with bone mineral density in pre-menopausal women. J Hum Genet 2003;48:243–8. [Google Scholar]
13. Xiong Y, He Y, Peng Y, Geng Y. Association of IL-6 and TGF-β gene polymorphisms with the risk of thoracolumbar osteoporotic vertebral compression fractures. Pharmacogen Pers Med 2022;15:351–8. [Google Scholar]
14. Luo Y, Zheng SG. Hall of Fame among Pro-inflammatory cytokines: Interleukin-6 gene and its transcriptional regulation mechanisms. Front Immunol 2016;7:604. [Google Scholar]
15. Kang S, Narazaki M, Metwally H, Kshimoto T. Historical overview of the interleukin-6 family cytokine. J Exp Med 2020;217:5. [Google Scholar]
16. Faggioli L, Costanzo C, Donadelli M, Palmieri M. Activation of the interleukin-6 promoter by a dominant negative mutant of c-Jun. Biochim Biophys Acta Mol Cell Res 2004;1692:17–24. [Google Scholar]
17. Chen B, Li HZ. Association of IL-6 174G/C (rs1800795) and 572C/G (rs1800796) polymorphisms with risk of osteoporosis: a meta-analysis. BMC Musculoskelet Disord 2020;21:330. [Google Scholar]
18. Fajar JK, Azharuddin A. The association between interleukin 6 −174 G/C gene polymorphism and the risk of osteoporosis: A meta-analysis. J Taibah Univ Med Sci 2017;12:212–20. [Google Scholar]
19. Ji YF, Jiang X, Li W, Ge X. Impact of interleukin-6 gene polymorphisms and its interaction with obesity on osteoporosis risk in Chinese postmenopausal women. Environ Health Prev 2019;24:48. [Google Scholar]
20. Durdin R, Parsons C, Dennison EM, et al. Inflammatory status, body composition and ethnic differences in bone mineral density: The Southall and Brent Revisited Study. Bone 2022;155:116286. [Google Scholar]
21. Thu WPP, Logan SJS, Cauley JA, Kramer MS, Yong EL. Ethnic differences in bone mineral density among midlife women in a multi-ethnic Southeast Asian cohort. Arch Osteoporos 2019;14:80. [Google Scholar]
22. Kruger MC, Todd JM, Schollum LM, Kuhn-Sherlock B, McLean DW, Wylie K. Bone health comparison in seven Asian countries using calcaneal ultrasound. BMC Musculoskelet Disord 2013;14:81. [Google Scholar]
23. Ananta A, Arifin EN, Hasbullah MS. Demography of Indonesia’s ethnicity. Singapore: ISEAS Publishing; 2015. [Google Scholar]
24. Utami SL, Ishartadianti K, Hidayat M, Fitri LE, Lyrawati D. Osteoporosis and risk factors among postmenopausal women in integrated health post for elderly. J Glob Pharma Technol 2019;11:286–94. [Google Scholar]
25. Cunningham F, Allen JE, Allen J, et al. Ensembl 2022. Nucleic Acids Res 2021;50:D988–95. [Google Scholar]
26. Tarantino U, Iolascon G, Cianferotti L, et al. Clinical guidelines for the prevention and treatment of osteoporosis: summary statements and recommendations from the Italian Society for Orthopaedics and Traumatology. J Orthop Traumatol 2017;18:3–36. [Google Scholar]
27. Utami SL. Identifikasi Polimorfisme Gen Interleukin-6 -385A/T dan -386A/T pada wanita postmenopause suku Jawa dengan osteoporosis. 2022. Prosiding Seminar Nasional Kusuma. Disponible sur: https://journalng.uwks.ac.id/kusuma/article/view/200/150 [Google Scholar]
28. Yulianto E, Astawa P, Siki-Kawiyana K. Genotype difference Of -572 G>C And -174 G>C Il-6 gene polymorphism between Balinese postmenopausal women with osteoporosis and without osteoporosis. Bali Med J 2013;2(3). [Google Scholar]
29. Lehrskov LL, Kjeldsen S, Lyngbæk MP, et al. Interleukin-6 may not affect bone resorption marker CTX or bone formation marker P1NP in humans. J Endocr Soc 2020;4(9): bvaa093. [Google Scholar]
30. Said EA, Al-Reesi I, Al-Shizawi N, et al. Defining IL-6 levels in healthy individuals: A meta-analysis. J Med Virol 2021;93:3915–24. [Google Scholar]
31. Siki-Kawiyana K, Surya GP, Bakta M, Roeshadi D. High serum concentration of interleukine-6 and rank-ligand as risk factors for osteoporosis in estrogen deficiency post-menopausal women. Int J Biomed Sci 2012. [Google Scholar]
32. Borst MJ. 2 - Evidence-Based Practice: The Basic Tools. In Wietlisbach CM, éditeur. Cooper’s Fundamentals of Hand Therapy (Third Edition). St. Louis (MO): Mosby; 2020. p. 15–20. [Google Scholar]
33. Stojanović D, Bůžková P, Mukamal KJ, et al. Soluble inflammatory markers and risk of incident fractures in older adults: The cardiovascular health study. J Bone Miner Res 2018;33:221–8. [Google Scholar]
34. Scheller J, Chalaris A, Schmidt-Arras D, Rose-John S. The pro- and anti-inflammatory properties of the cytokine interleukin-6. Biochim Biophys Acta Mol Cell Res 2011;1813:878–88. [Google Scholar]
35. Susilo H, Thaha M, Pikir BS, et al. The role of plasma interleukin-6 levels on atherosclerotic cardiovascular disease and cardiovascular mortality risk scores in Javanese patients with chronic kidney disease. J Pers Med 2022;12:1122. [Google Scholar]
36. Hirano T. IL-6 in inflammation, autoimmunity and cancer. Int Immunol 2020;33:127–48. [Google Scholar]
37. Crosetto N, Bienko M, van Oudenaarden A. Spatially resolved transcriptomics and beyond. Nat Rev Genet 2015;16:57–66. [Google Scholar]
38. Kang S, Lee TA, Ra EA, et al. Differential control of interleukin-6 mRNA levels by cellular distribution of YB-1. PLoS One 2014;9(11):e112754. [Google Scholar]
39. Reeh H, Rudolph N, Billing U, et al. Response to IL-6 trans- and IL-6 classic signalling is determined by the ratio of the IL-6 receptor α to gp130 expression: fusing experimental insights and dynamic modelling. Cell Commun Signal 2019;17:46. [Google Scholar]
40. Sanchez CL, Sims SG, Nowery JD, Meares GP. Endoplasmic reticulum stress differentially modulates the IL-6 family of cytokines in murine astrocytes and macrophages. Sci Rep 2019;9:14931. [Google Scholar]
41. Nilsonne G, Lekander M, Åkerstedt T, Axelsson J, Ingre M. Diurnal variation of circulating interleukin-6 in humans: A meta-analysis. PLoS One 2016;11(11):e0165799. [Google Scholar]
42. Neininger A, Kontoyiannis D, Kotlyarov A, et al. MK2 Targets AU-rich elements and regulates biosynthesis of tumor necrosis factor and interleukin-6 independently at different post-transcriptional levels. J Biol Chem 2002;277:3065–8. [Google Scholar]
43. Yang Y, Zhang Y, Xing X, et al. IL-6 translation is a therapeutic target of human cytokine release syndrome. J Exp Med 2023;220(11). [Google Scholar]
44. Ota N, Nakajima T, Nakazawa I, et al. A nucleotide variant in the promoter region of the interleukin-6 gene associated with decreased bone mineral density. J Hum Genet 2001;46:267–72. [Google Scholar]
45. Prasetyo SR, Saraswati E, Hutabarat ADR, et al. Interleukin-6-174 G/C genetic polymorphism in Indonesian postmenopausal women. J Int Dent Med Res 2017;10(Special Issue):707–10. [Google Scholar]
46. Lim SY, Chan YM, Ramachandran V, Shariff ZM, Chin YS, Arumugam M. No interaction effect between interleukin-6 polymorphisms and acid ash diet with bone resorption marker in postmenopausal women. Int J Environ Res Public Health 2021;18:827. [Google Scholar]
Cite This Article
 Copyright © 2025 The Author(s). Published by Tech Science Press.
This work is licensed under a Creative Commons Attribution 4.0 International License , which permits unrestricted use, distribution, and reproduction in any medium, provided the original work is properly cited.
 Downloads
 Citation Tools