
 Submit a Paper
 Propose a Special lssue
 Open Access
ARTICLE
The Social Networking Addiction Scale: Translation and Validation Study among Chinese College Students
1 School of Physical Education, Guizhou Normal University, Guiyang, 550001, China
2 Research Centre for Exercise and Physical Fitness, Guizhou Normal University, Guiyang, 550001, China
3 Centre for Basic Education Research, Southwest University, Chongqing, 400715, China
* Corresponding Author: Lin Luo. Email:
International Journal of Mental Health Promotion 2024, 26(1), 51-60. https://doi.org/10.32604/ijmhp.2023.041614
Received 29 April 2023; Accepted 25 September 2023; Issue published 05 February 2024
 View Full Text
 Download PDF
Abstract
Purpose: The core component theory of addiction behavior provides a multidimensional theoretical model for measuring social networking addiction. Based on this theoretical model, the Social Networking Addiction Scale (SNAS) was developed. The aim of this study was to test the psychometric properties of the Chinese version of the SNAS (SNAS-C). Methods: This study used a sample of 3383 Chinese university students to conduct confirmatory factor analysis (CFA) to explore the structural validity of the SNAS-C. This study examined the Pearson correlations between the six subscales of the SNAS-C (i.e., salience, mood modification, tolerance, withdrawal symptoms, conflict, and relapse) and “social appearance anxiety (SAA)”, and “parent and peer attachment (PPA)” to test the construct validity of the SNAS-C. Cronbach’s alpha coefficient was used to evaluate the internal consistency of both the total and subscale scores. Results: The results of the CFA indicated that the six-factor model had an acceptable model fit (χ²/df = 10.954, p < 0.001; GFI = 0.946; AGFI = 0.928; IFI = 0.964; TLI = 0.955; CFI = 0.964; RMR = 0.041; SRMR = 0.037; RMSEA = 0.054 [90% CI [0.052–0.056]). Additionally, the total score of the SNAS-C was significantly positively correlated with the total score of SAA (r = 0.43, p < 0.01), and the subscales of the SNAS-C were significantly positively correlated with the total score of SAA to a medium degree (salience, r = 0.31, mood modification, r = 0.27, tolerance, r = 0.34, withdrawal symptoms, r = 0.39, conflict, r = 0.41, relapse, r = 0.40, p < 0.01). The results of the SNAS-C and PPA were somewhat different, as the SNAS-C was significantly negatively correlated with the PPA (r = −0.12, p < 0.01), and the four subscales were significantly negatively correlated with the PPA to a low degree (tolerance, r = −0.11, withdrawal symptoms, r = −0.15, conflict, r = −0.21, relapse, r = −0.15, p < 0.01). Finally, the SNAS-C also exhibited good internal consistency (Cronbach’s α > 0.808). Conclusion: The results indicate that the six-factor model of the SNAS-C is acceptable, and its validity can meet the tendencies of social networking addiction among Chinese college students. In summary, the current translation and validation study of the SNAS-C provides an auxiliary tool for future research on social networking addiction in the Chinese context, but the generalizability of this scale in different populations requires further investigation.Keywords
Social networks allow users to share content, ideas, opinions, beliefs, and feelings [1,2]. This way of information interaction largely satisfies human social nature and social needs and has become very popular worldwide [3]. Contemporary college students are a generation that has grown up with the rise of social networks [4], and “digital natives” is the most appropriate metaphor for them [5,6]. On the one hand, social networks are beneficial to the lives and studies of college students. For example, social networks largely satisfy the basic psychological needs of college students in the emerging adulthood period [7], such as social support and self-expression [8], which are crucial for them [9]. Through social networks, college students can keep in close contact with their family, relatives, and friends [10]. At the same time, social networks provide college students with access to a wide range of information and resources, reducing barriers to group interaction and communication [11], and better supporting their collaborative learning [12]. Additionally, social networks provide college students with a platform to showcase themselves and engage in positive interactions, which can enhance their adaptability and meet their emotional needs [3,9,10,13]. On the other hand, as college students spend more time consuming social networks, some of them also develop social network addiction [3,14]. College students addicted to social networks tend to have fewer interpersonal interactions in real life, often stay away from normal face-to-face communication, and may even suffer from depression [15], low self-esteem [16], loneliness and anxiety [17], decreased academic performance [2], impulsivity [18], and sleep disorders [19,20].
There is no consensus among scholars on the concept of social network addiction. Griffiths [21] defined addictive behavior as a behavior composed of six core components (salience, mood modification, tolerance, withdrawal symptoms, conflict, and relapse). Any behavior that meets these six criteria (such as social networking) can be defined as addiction, and excessive online social behavior is considered a behavioral addiction. Andreassen et al. [22] defined social network addiction as excessive attention to social networking sites, investing most of one’s time and energy in social networking to the detriment of learning or work. Pantic [23] viewed social network addiction as a collection of mental disorders. Echeburúa et al. [24] and Kuss et al. [3] consider social network addiction as an important feature similar to behavioral problems and substance addiction. Turel et al. [25], Can et al. [26], and Gao et al. [27] believed that the typical characteristic of social network addiction is spending too much time on social networking sites. However, different scholars have different views. For example, Kuss et al. [3] and Gökdaş et al. [28] believed that since the criteria for social network addiction vary, social network addiction should not be confused with social media addiction, social networking site addiction, or online game addiction. Therefore, scholars Shahnawaz et al. [29] redefined the concept of social network addiction and emphasized that social network addiction cannot be equated with other addictions, a viewpoint that has been widely accepted.
Many validated tools for assessing social media addiction have been used in the addiction behavior field. For example, the Bergen Facebook Addiction Scale (BFAS) developed by Andreassen et al. [30], the Bergen Social Media Addiction Scale (BSMAS) developed by Andreassen et al. [31], the Spanish Social Network Addiction Scale (SNAddS-6S) and the Short Spanish Social Network Addiction Scale developed by Cuadrado et al. [32] are all examples of such tools. Although these scales provide effective evaluations of certain aspects or multiple aspects of social media addiction, there are still relatively few tools that can reflect the full range of the six core factors of addictive behavior theory, making it difficult to discern the differential contributions of each factor to social media addiction. Therefore, in 2020, Shahnawaz et al. developed a Social Networking Addiction Scale (SNAS) [29] based on Griffiths’ six-factor theory of addictive behavior [21], which contains the six core factors of social media addiction (salience, mood modification, tolerance, withdrawal symptoms, conflict, and relapse). The tool provides a multidimensional assessment of social media addiction and helps to create comprehensive interventions that can target addictive core factors to reduce social media addiction behaviors. The original SNAS has been reported to be valid and reliable (χ²/df = 3.71, CFI = 0.93, TLI = 0.91, GFI = 0.90, RMSEA = 0.07, SRMR = 0.04, The test–retest reliability was found to be 0.88). Therefore, SNAS is a unique and promising tool that can be used to study the effects of different addiction core factors on social media addiction. Although the validity of the six-factor measurement model of SNAS has been confirmed in samples from multiple countries [2,33], it has not yet been translated into Chinese. To fill this gap in the literature, the first objective of this study is to translate and evaluate the psychometric properties of SNAS-C in a sample of Chinese college students, with a particular focus on examining its factor structure, validity (construct and concurrent), and reliability (internal consistency). Previous studies have found that social appearance anxiety [34], and attachment styles with parents and peers [35,36] are considered important predictors of social network addiction. Therefore, the second aim of this study is to use social appearance anxiety and attachment styles with parents and peers as criterion validity tools for social media addiction, in order to explore the relationship between social network addiction and factors such as social appearance anxiety, and attachment styles with parents and peers. In this study, we hypothesized that social networking addiction is positively correlated with social appearance anxiety and negatively correlated with parent and peer attachment.
From November to December 2022, a total of 3,387 college students completed the survey through the MikeCRM electronic questionnaire platform for this study. All questionnaires were self-reported. These students were from various regions of China. If it was found that a certain participant answered with the same number for 80% or more of the questions, had missing data, or answered irrelevantly, their questionnaire was considered invalid. Finally, four invalid questionnaires were excluded, and a total of 3,383 valid questionnaires were included in the study. Among them, there were 1,127 males (33.30%) and 2,256 females (66.70%); the average age was 19.14 ± 1.09 years; 2,007 were Han nationality (59.30%), and 1,376 were of other ethnic groups (40.70%); 876 had urban residence (25.90%), and 2,507 had rural residence (74.10%); 2,185 were freshmen (64.60%), 1,178 were sophomores (34.80%), 11 were juniors (0.30%), 8 were seniors (0.20%), and only one was a graduate student; 1,387 were liberal arts majors (41.00%), 1,426 were science majors (42.20%), 417 were engineering majors (12.30%), and 153 were art or sports majors (4.50%).
To validate the Social Networking Addiction Scale-Chinese version (SNAS-C), we adapted the Social Networking Addiction Scale (SNAS) developed by Shahnawaz et al. [29]. We employed the back-translation strategy proposed by Brislin [37]. This strategy involved one translation team translating the original scale into Chinese (Mandarin), followed by another translation team translating the scale back from Chinese to the original language. Each translator had over 6 years of experience in translating academic manuscripts, ensuring the quality of the translations remained consistent with the original version. SNAS-C underwent multiple revisions through the comparison of the back-translation and the original SNAS. Subsequently, the second version of SNAS-C was evaluated by a group of four students to assess its readability and acceptability. Ensuring the academic rigor of SNAS-C, we sought the final review of an expert with over 10 years of experience in the field of internet addiction research. Through this process, the initial version of SNAS-C was formed. After obtaining the initial version of SNAS-C, we contacted various departments of the university, informing them of the research objectives and requesting their cooperation. Before formally distributing the questionnaire to all participants, we conducted a pilot study with a prefilling group consisting of 100 individuals to ensure a comprehensive understanding of all items. Adhering to the principle of anonymity, participants were only required to express their thoughts without any distinguishing between true or false. The estimated time for questionnaire completion was approximately 10–15 min.
According to Davis [38], many young people use digital media to self-disclose with friends on social networks. Individuals addicted to social networking tend to compare themselves with individuals who have better body images on social networks, leading to social appearance anxiety [39]. Different attachment styles are significantly related to social networking addiction. Individuals who have communication and trust attachment styles with parents and peers typically have higher self-efficacy, are more likely to overcome negative emotions and difficulties, and are less susceptible to addiction to social networks. On the other hand, individuals with an alienation attachment style are more likely to experience negative symptoms such as excessive reactions and anxiety, indulge in their own world, and are more prone to developing addiction to social networks. Therefore, in this study, we selected the Social Networking Addiction Scale—Chinese version (SNAS-C) as the measurement tool for social networking addiction and used the Social Appearance Anxiety Scale [40], and the Parent and Peer Attachment Questionnaire [41] as criteria validity measurement tools for the SNAS-C.
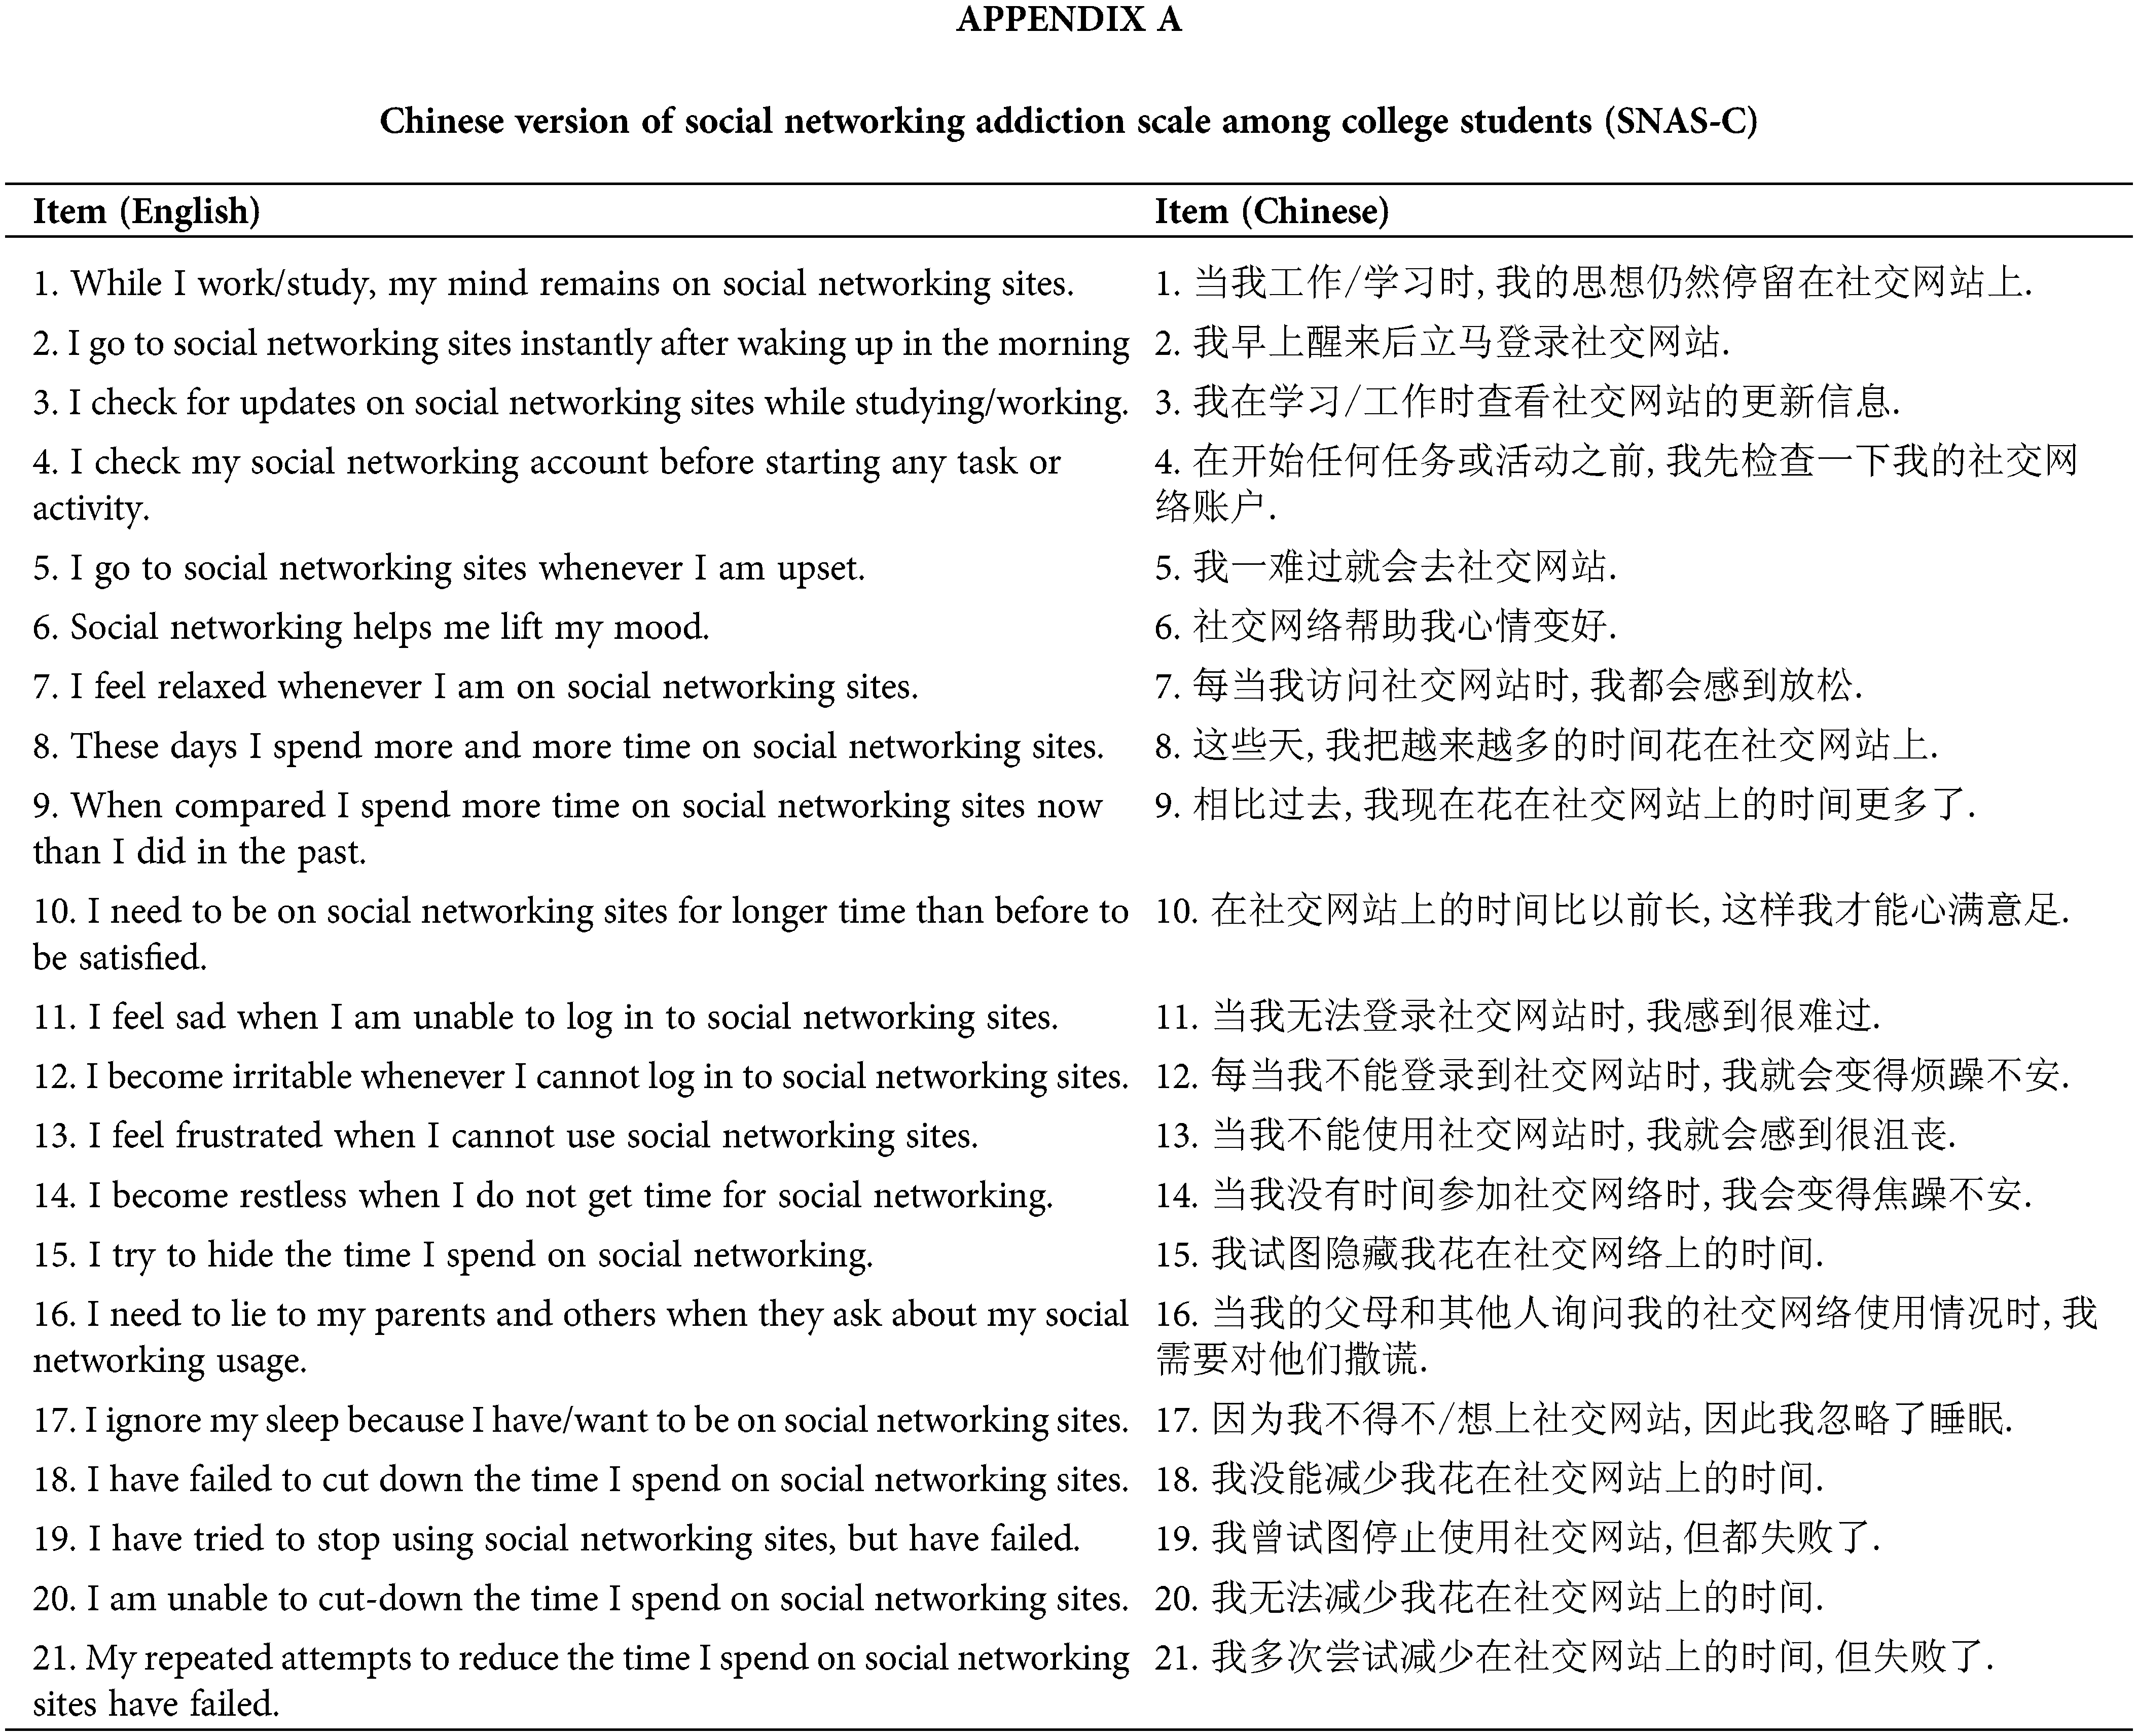
The SNAS-C has been adapted for the Chinese context. It consists of 21 items across six dimensions: prominence, emotional regulation, tolerance, withdrawal symptoms, conflict, and relapse. The prominence dimension has 4 items, emotional regulation has 3 items, tolerance has 3 items, withdrawal symptoms have 4 items, conflict has 3 items, and relapse has 4 items. The answers in the SNAS-C are coded using a Likert scale ranging from 1 (strongly disagree) to 5 (strongly agree). Higher scores on the SNAS-C indicate a higher tendency towards social networking addiction. The English-Chinese comparison of the SNAS-C is provided in Appendix A.
Social Appearance Anxiety (SAA). The Social Appearance Anxiety Scale developed by Hart et al. [40] was used to measure the level of social appearance anxiety among university students. The Chinese version of the scale was revised by Hu [42]. The questionnaire has a unidimensional structure and consists of 16 items, with only item 1 (“I feel comfortable with my appearance”) being reverse-coded. Each item is coded using a Likert scale ranging from 1 (strongly disagree) to 5 (strongly agree). In this study, the Cronbach’s α coefficient for this scale was 0.945.
Parent and Peer Attachment (PPA). The Turkish version of the Parent and Peer Attachment Questionnaire developed by Kocayoruk [41] was used to measure the attachment to important figures (parents and peers) during adolescence. The Chinese version of the scale was revised by Xiang et al. [43]. The questionnaire has a three-subscale structure (attachment to mother, attachment to father, and attachment to peers) and consists of 54 items, with each subscale containing 18 items. Each item is coded using a Likert scale ranging from 1 (never) to 5 (almost always), with 16 items being reverse-coded and 38 items being positively scored. The Cronbach’s α coefficient for the total scale was 0.933, and for the three subscales (attachment to mother, attachment to father, and attachment to peers), the Cronbach’s α coefficients were 0.862, 0.862, and 0.880, respectively.
In this study, IBM SPSS 24 and IBM SPSS Amos 24 software were used for statistical analysis. Descriptive statistical analysis was used for the demographic characteristics of the sample, such as frequency and percentage for categorical variables, and mean and standard deviation for continuous variables. To avoid excessive skewness, item analysis (skewness and kurtosis) was performed on all items, and outliers were identified at p < 0.01.
To validate the construct and discriminant validity of the scale model, this study used confirmatory factor analysis (CFA) with maximum likelihood estimation to evaluate two different models on the entire sample. The first model (M1) placed all items onto a single factor structure, while the second model (M2) placed all items onto a six-factor structure. Different models were compared based on their model fit indices, including the ratio of chi-square to degrees of freedom (χ²/df), root-mean-square error of approximation (RMSEA) (with a 90% CI), root-mean-square residual (RMR), standardized root-mean-square residual (SRMR), goodness of fit index (GFI), adjusted goodness of fit index (AGFI), incremental fit index (IFI), Tucker-Lewis index (TLI), and comparative fit index (CFI). For these indices, the following critical values are recommended [44,45] : χ²/df < 5; RMSEA, RMR, SRMR ≤ 0.06; GFI, AGFI, IFI, TLI, CFI ≥ 0.9. However, because χ² is greatly influenced by sample size, and this study had a sample size of 3383, far exceeding the critical value of 1000, other indices should be combined to evaluate model fit and make an overall judgment [46,47].
To further validate the convergent validity to measure the correlation among multiple indicators of different dimensions, this study used the Average Variance Extracted (AVE) and Composite Reliability (CR) for verification [48]. According to standards, AVE > 0.5 [49] and CR > 0.7 [50] indicate good convergent validity.
The reliability of SNAS-C was tested using the Cronbach’s α coefficient and the Spearman-Brown coefficient. A coefficient > 0.7 [51,52] satisfies the standard.
Finally, the Pearson correlation coefficient (r) [53] was used to test the correlation between SNAS-C, SAA, and PPA. The correlation coefficient criteria [54] are as follows: 0 < r < 0.3, low correlation; 0.3 < r < 0.7, moderate correlation; 0.7 < r < 1, high correlation.
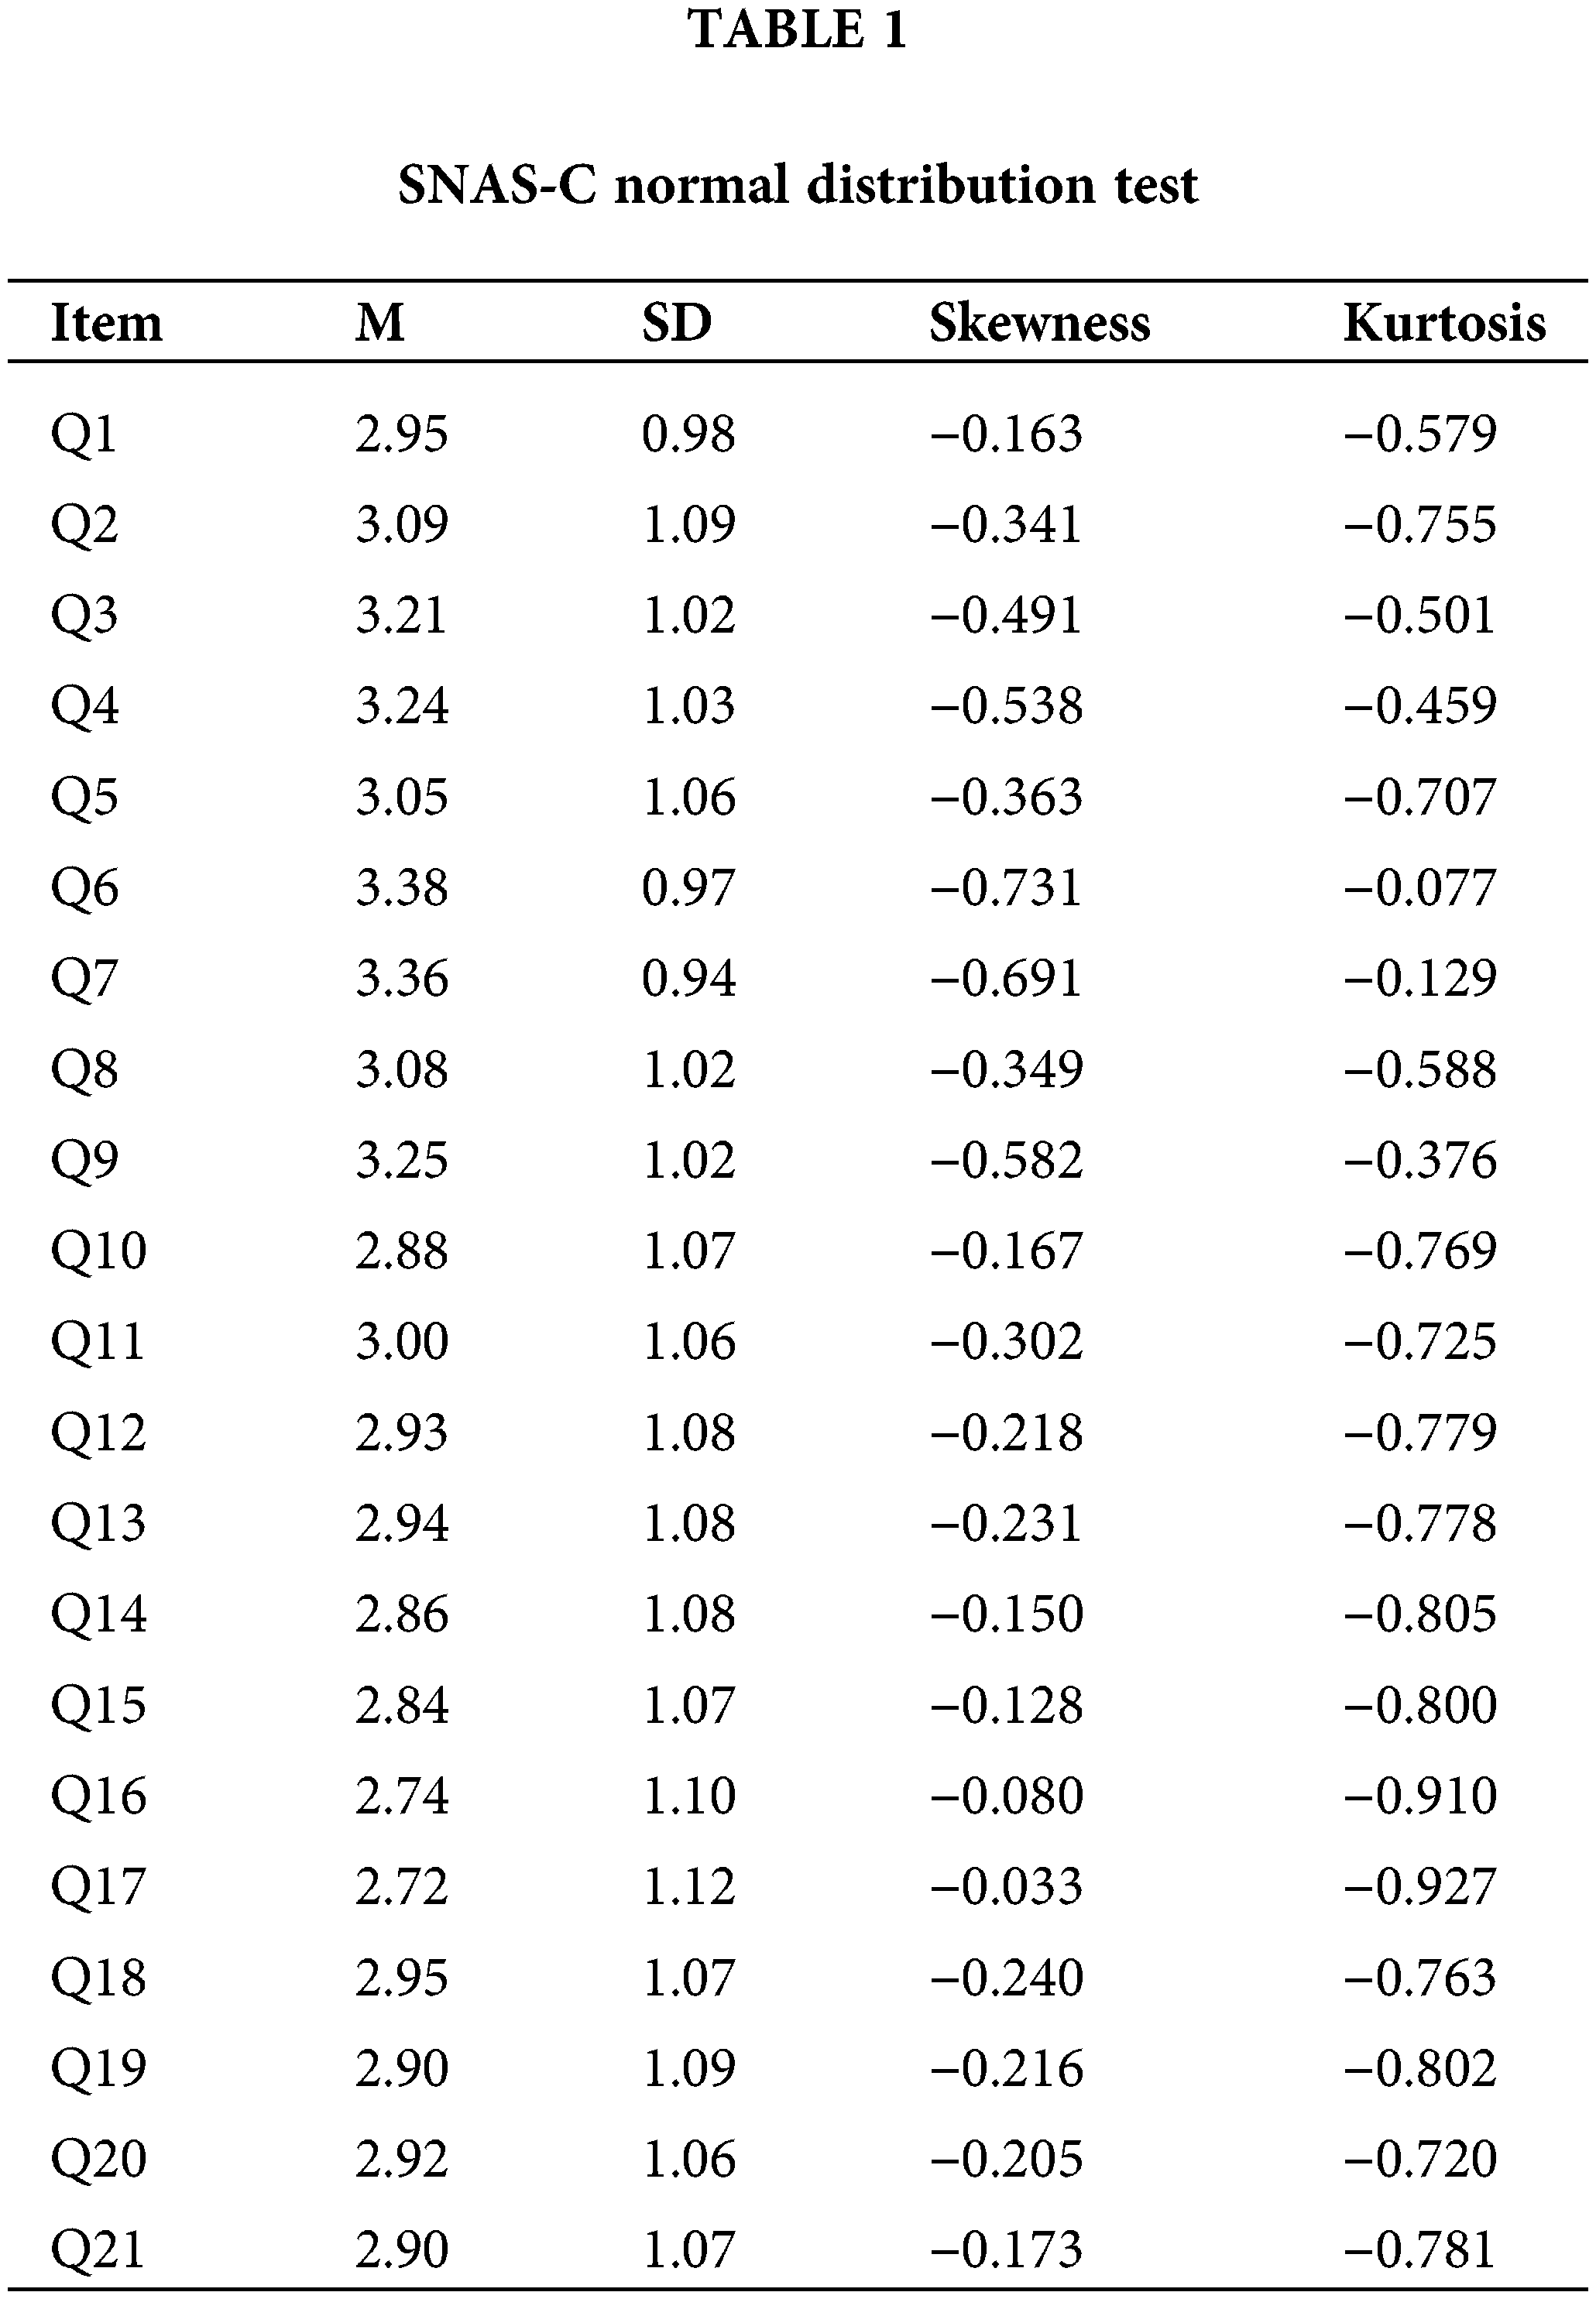
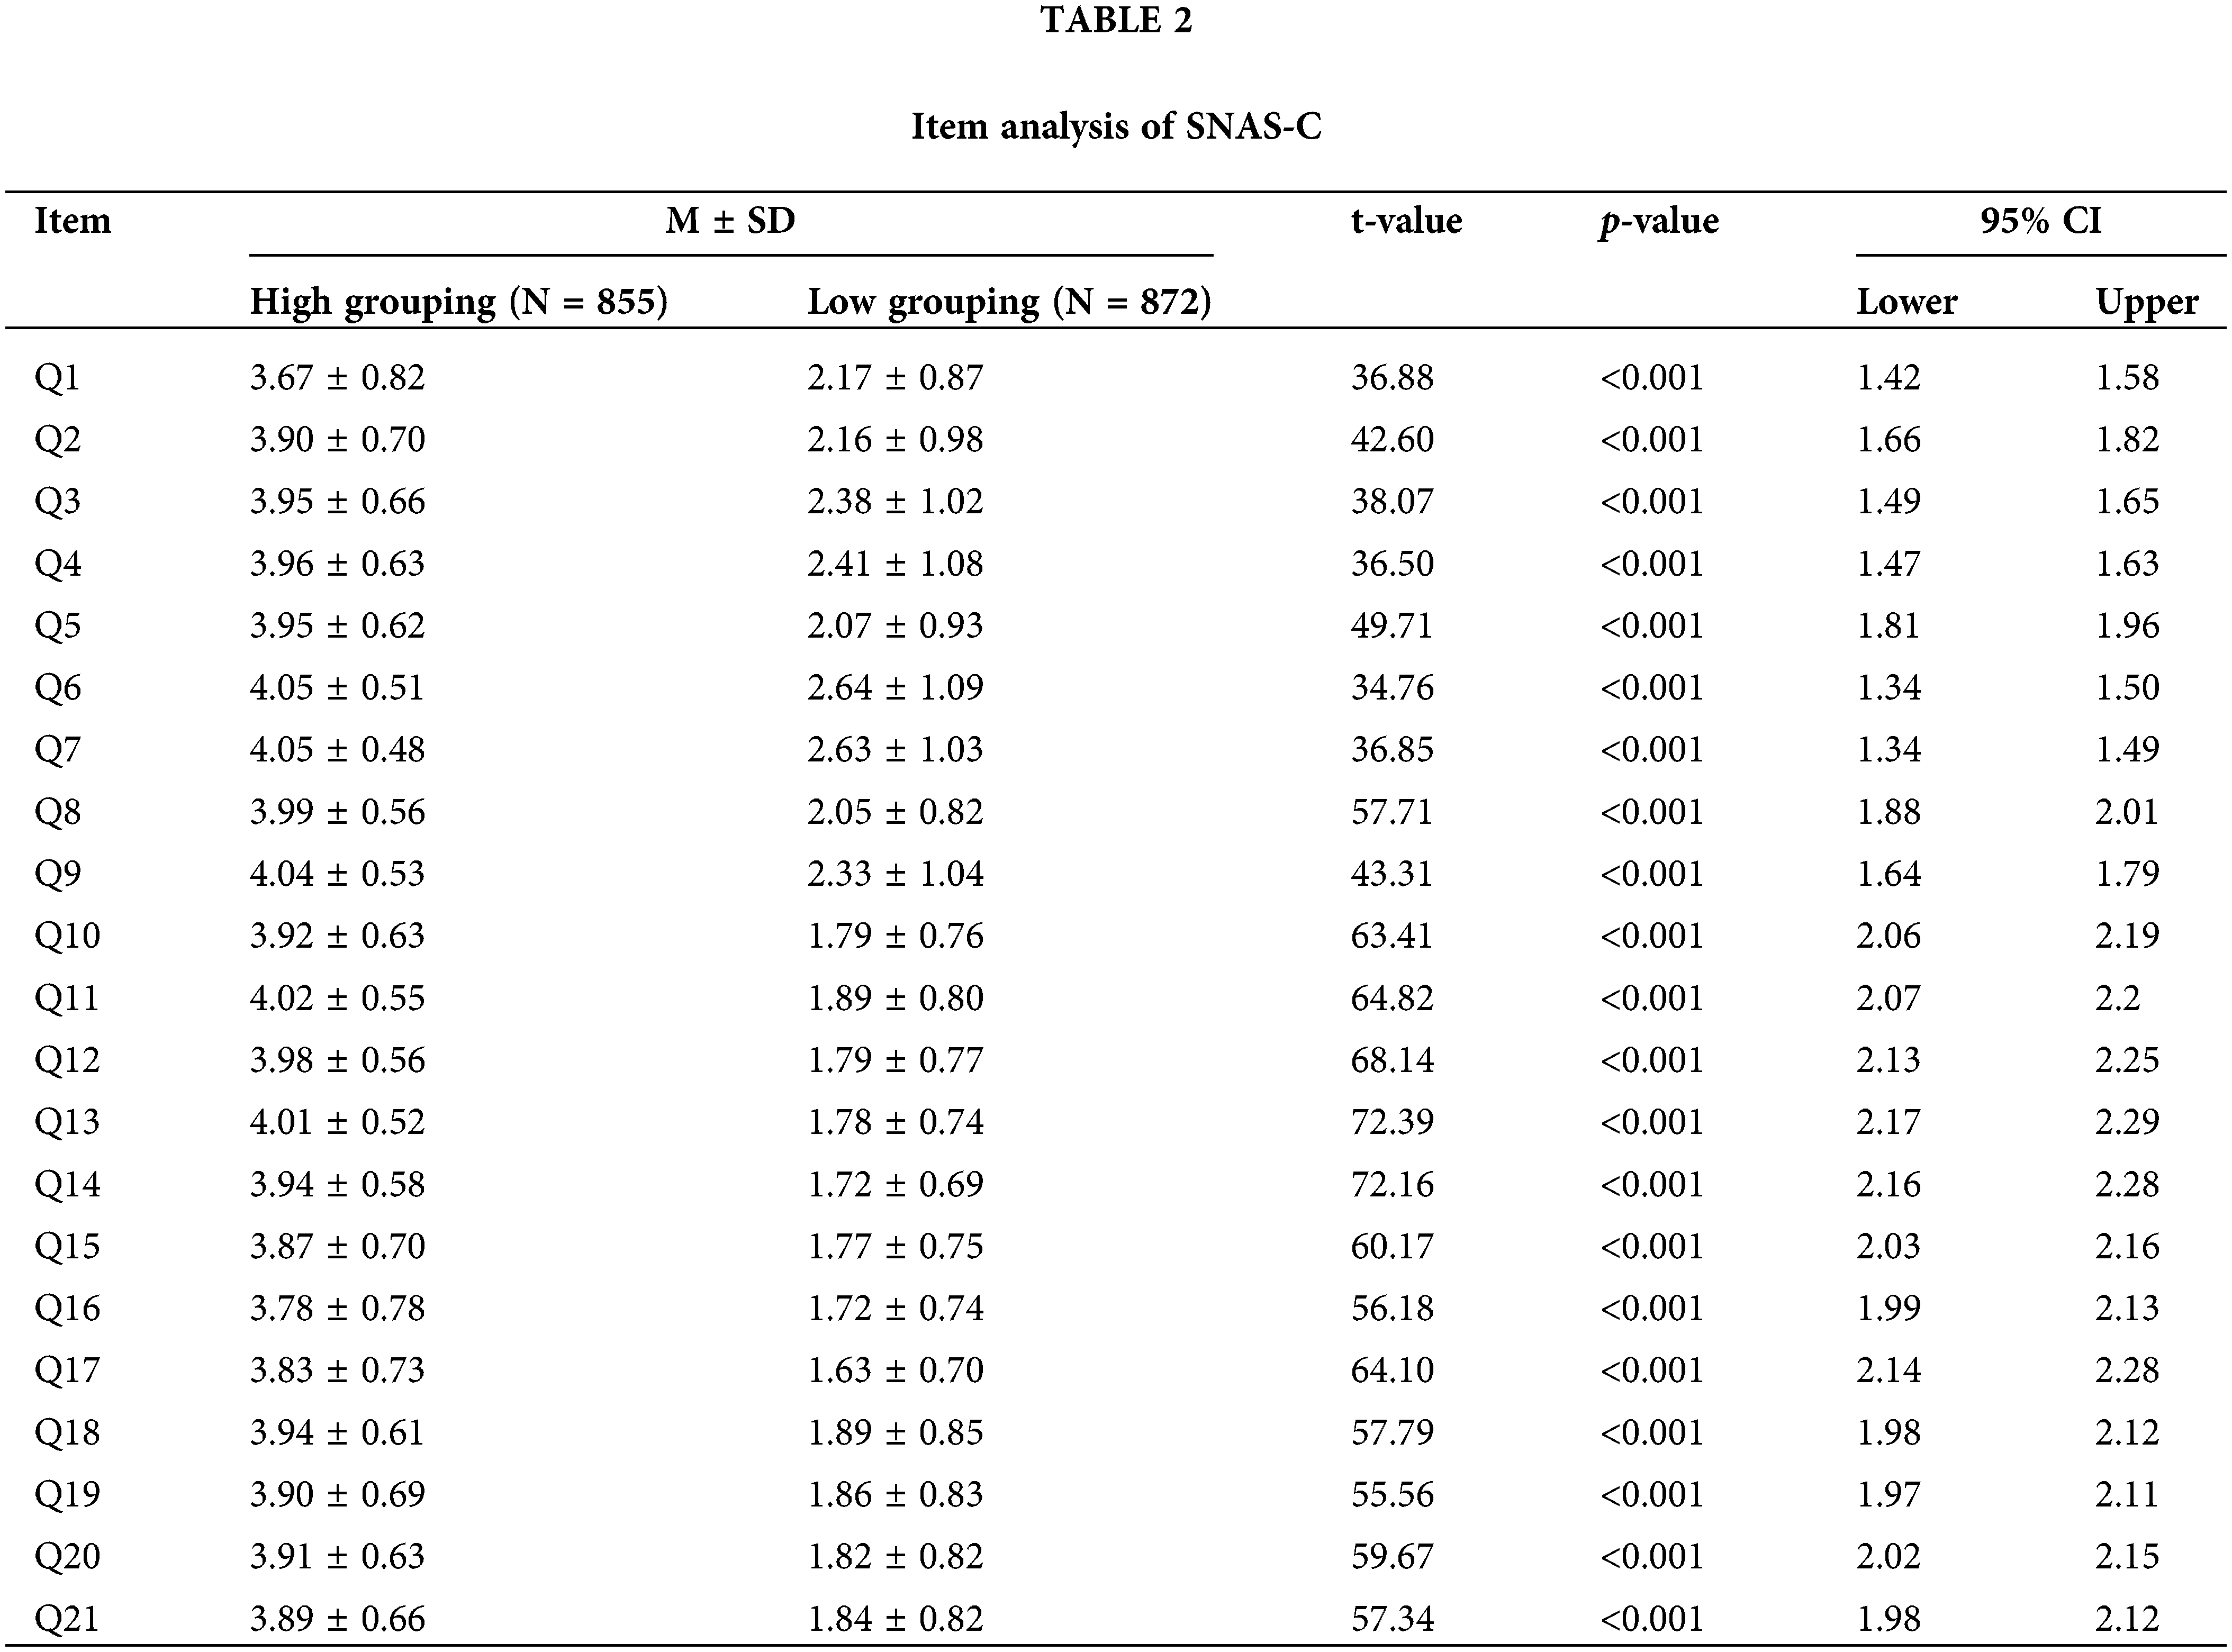
All items had no missing, discrete, or invalid values. Table 1 shows the mean, standard deviation, skewness, and kurtosis of the 21 items of the SNAS-C. The absolute value of the skewness coefficients of all items ranged from 0.033 to 0.731, and the absolute value of the kurtosis coefficients ranged from 0.077 to 0.927, which met the standards of absolute skewness less than 2 and absolute kurtosis less than 7 [55], indicating that each item of SNAS-C conforms to a normal distribution. To further analyze the discriminant validity of the items, we used the critical ratio method to calculate the total score of the questionnaire for high-low sorting and divided them into high and low groups, and then used independent sample t-tests to compare the differences between the high and low groups for each item. According to the results in Table 2, all items of SNAS-C were significant (p < 0.001). Therefore, we believe that maximum likelihood estimation (MLE) is suitable for calculating CFA.
The main purpose of CFA was to examine the stability of the six-factor model of SNAS-C. The initial measurement model (M1) showed poor factor validity. Although the single-factor structure of SNAS-C met the standard of all factor loadings > 0.4, it failed to meet most of the criteria for a good model. In M2, Q1–Q4 were grouped into the first factor, Q5–Q7 into the second factor, Q8–Q10 into the third factor, Q11–Q14 into the fourth factor, Q15–Q17 into the fifth factor, and Q18–Q21 into the sixth factor. M2 showed good fit indices (RMSEA = 0.054 [0.052, 0.056], RMR = 0.041, SRMR = 0.037, GFI = 0.946, AGFI = 0.928, IFI = 0.964, TLI = 0.955, CFI = 0.964), indicating that it should be accepted. The fit indices of the SNAS-C model are shown in Table 3, and the relationships between the items and factors of M2 are shown in Fig. 1. All factor loadings for each factor were above 0.7 (p < 0.001), AVE = 0.517~0.722 > 0.5, and CR = 0.810~0.912 > 0.7, indicating good convergent validity of the scale, which is shown in Table 4. During the CFA, several modification indices were examined to assess the potential improvements in model fit by moving certain items between factors. However, it was determined that the displacement of these items did not significantly disturb the measurement structure of the factors. Therefore, no modifications were made to the original factor structure, and it was deemed appropriate to retain the initial item-factor assignments.
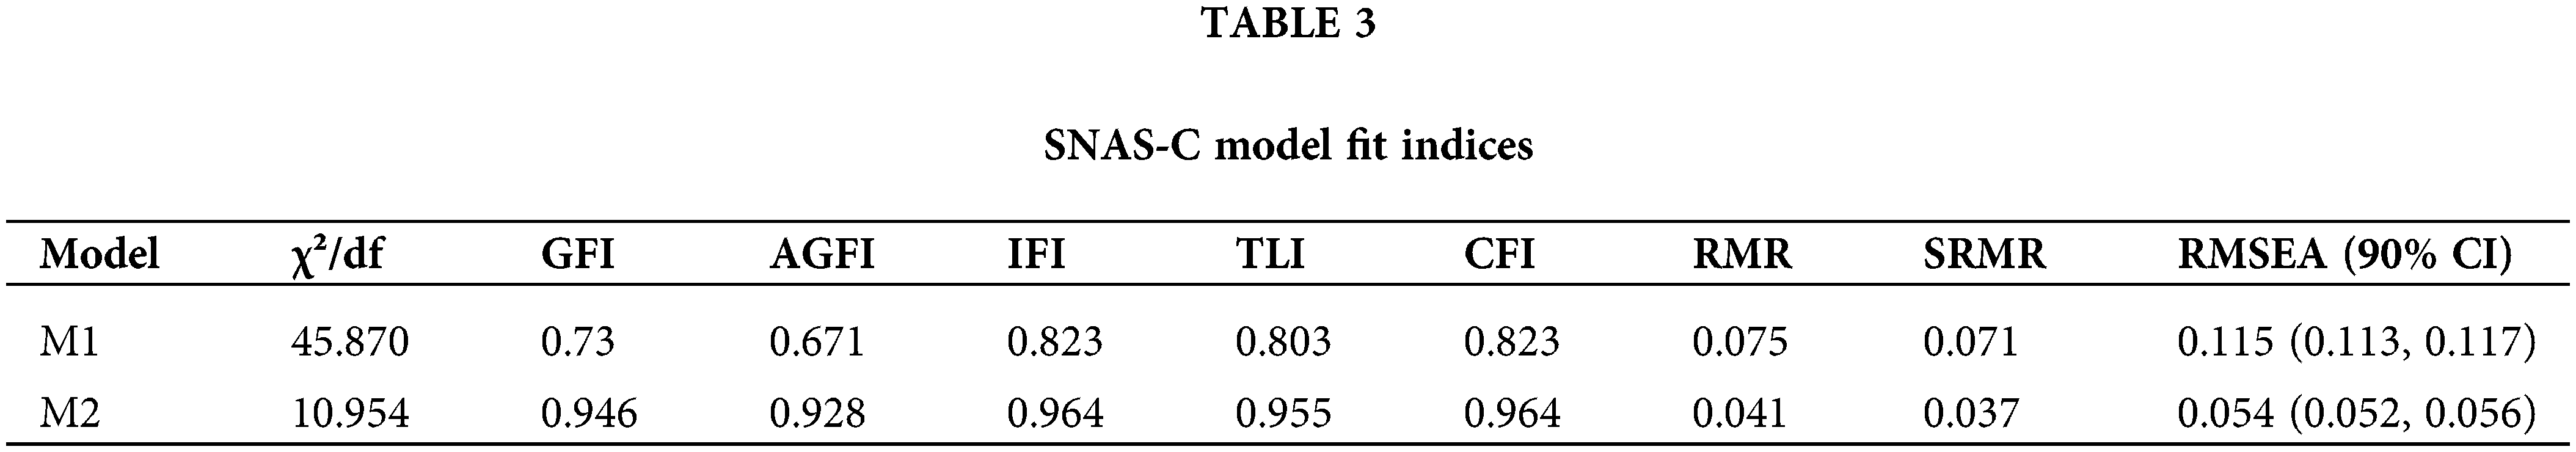
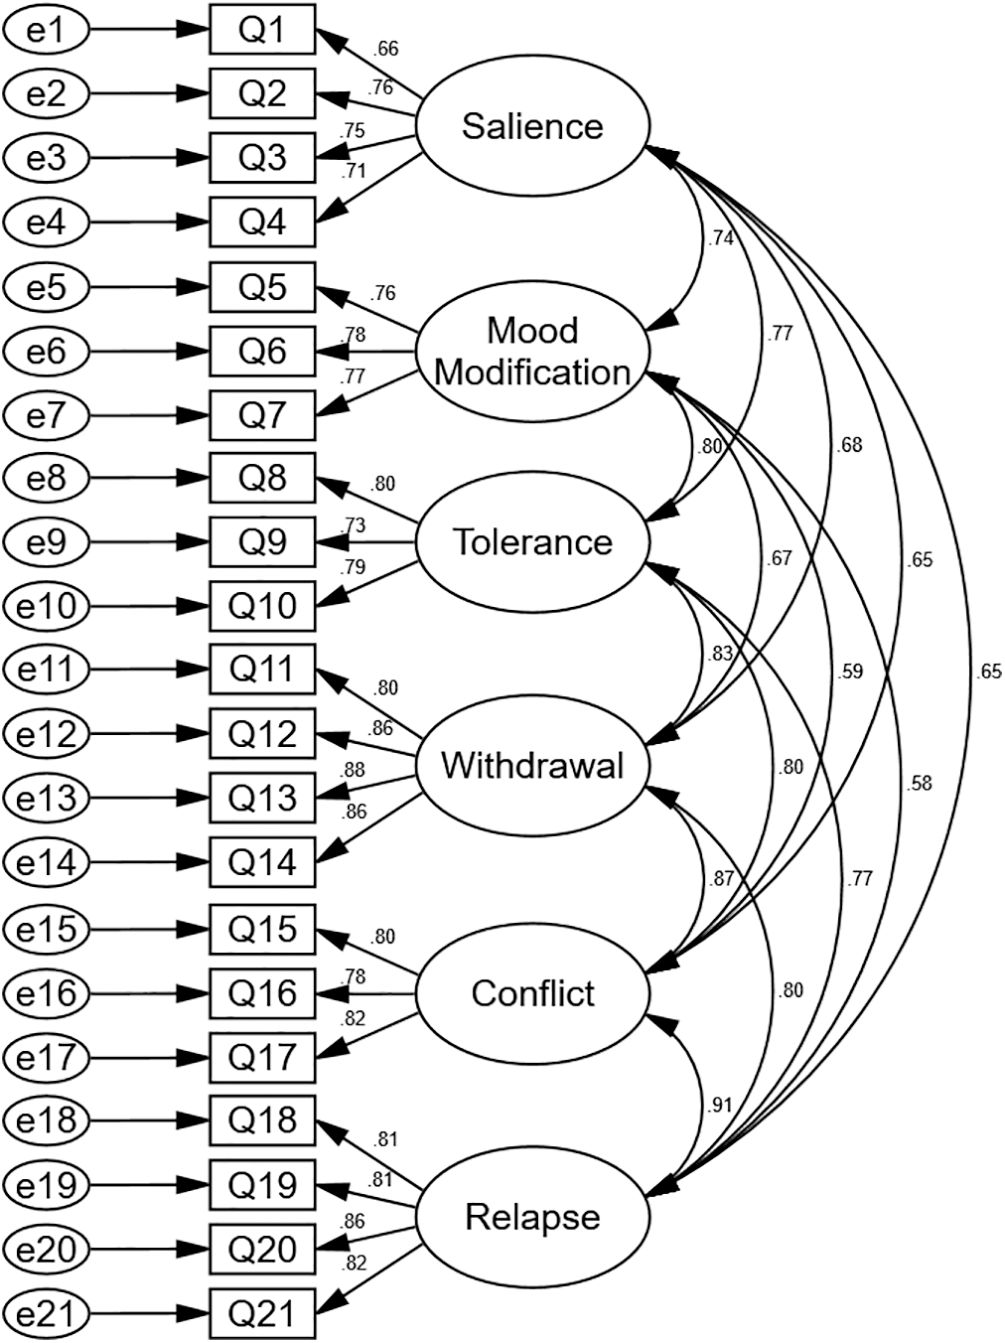
Figure 1: The confirmatory factor analysis of six-factor model of SNAS-C (N = 3383).
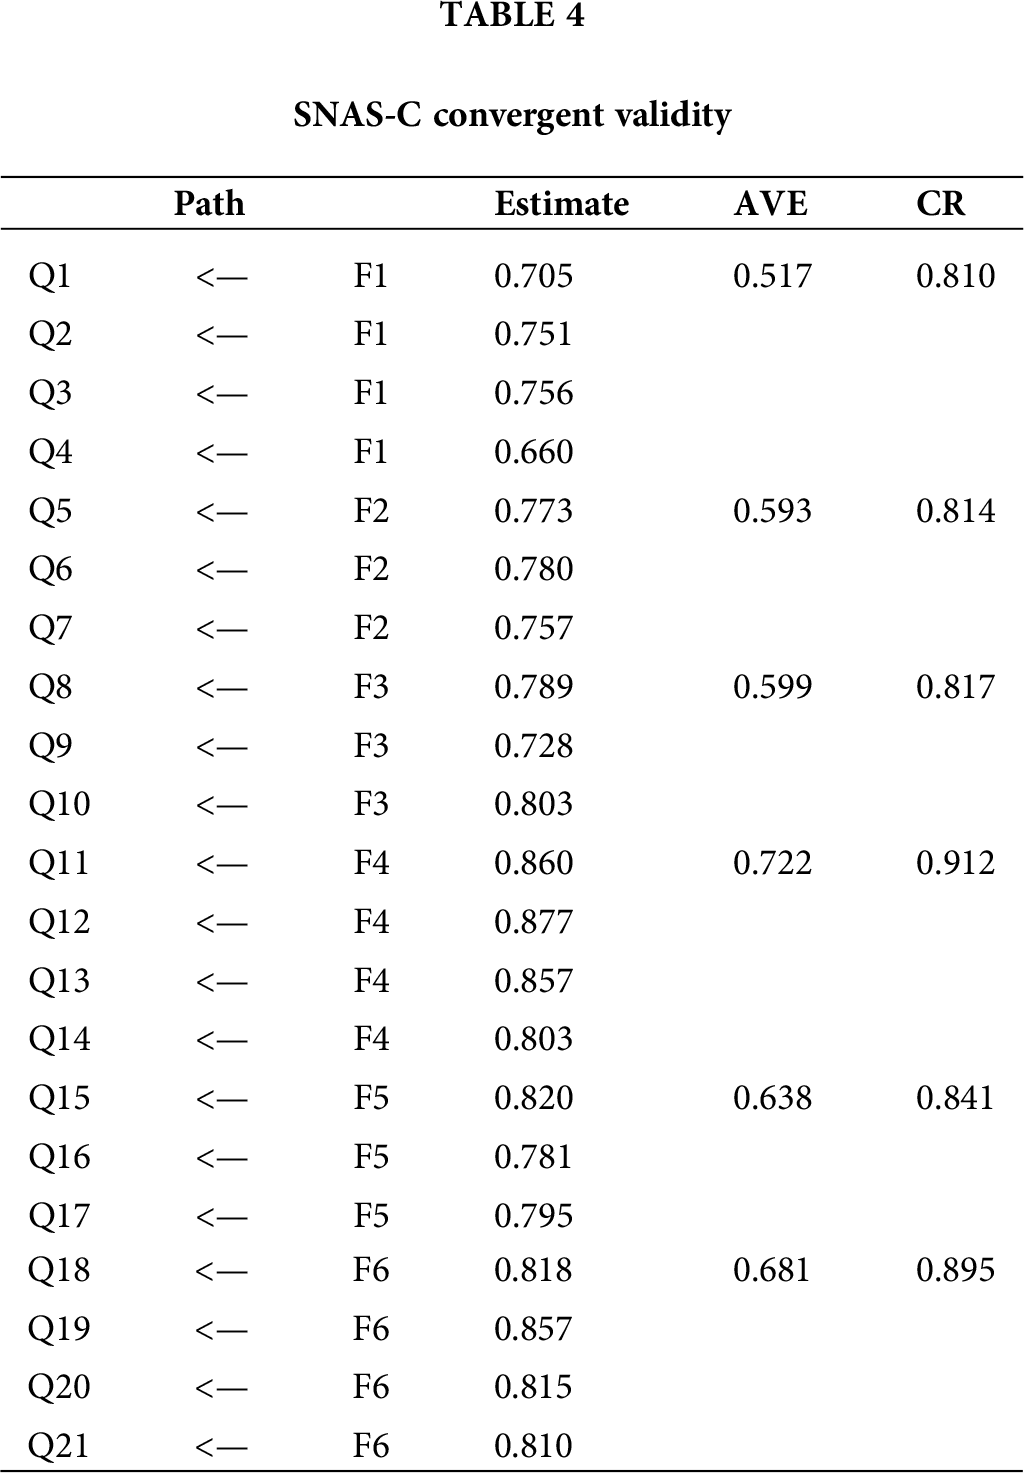
Table 5 shows the Pearson correlation coefficients among the revised SNAS-C total and subscale scores, Social Appearance Anxiety (SAA) total score, and Parent and Peer Attachment (PPA) total score. The results of Pearson correlation analysis indicate that there is a significant medium-to-high positive correlation between the SNAS-C dimension scores and total score (r = 0.75~0.89, p < 0.01), which is almost consistent with the conclusions of previous studies [34]. Additionally, we found a moderate significant positive correlation between the SNAS-C subscales and total score with SAA total score (r = 0.27~0.43, p < 0.01), further confirming the conclusions of previous studies [35,38]. The mood modification of SNAS-C is significantly positively correlated with PPA at a low level (r = 0.05, p < 0.01). Except for the Salience dimension, which is not significantly correlated with PPA, the other subscales and total scores of SNAS-C are significantly negatively correlated with PPA at a low level (r = 0.11~0.21, p < 0.01). Overall, SNAS-C is significantly positively correlated with SAA (r = 0.43, p < 0.01), and significantly negatively correlated with PPA (r = −0.12, p < 0.01), consistent with the hypotheses of this study.
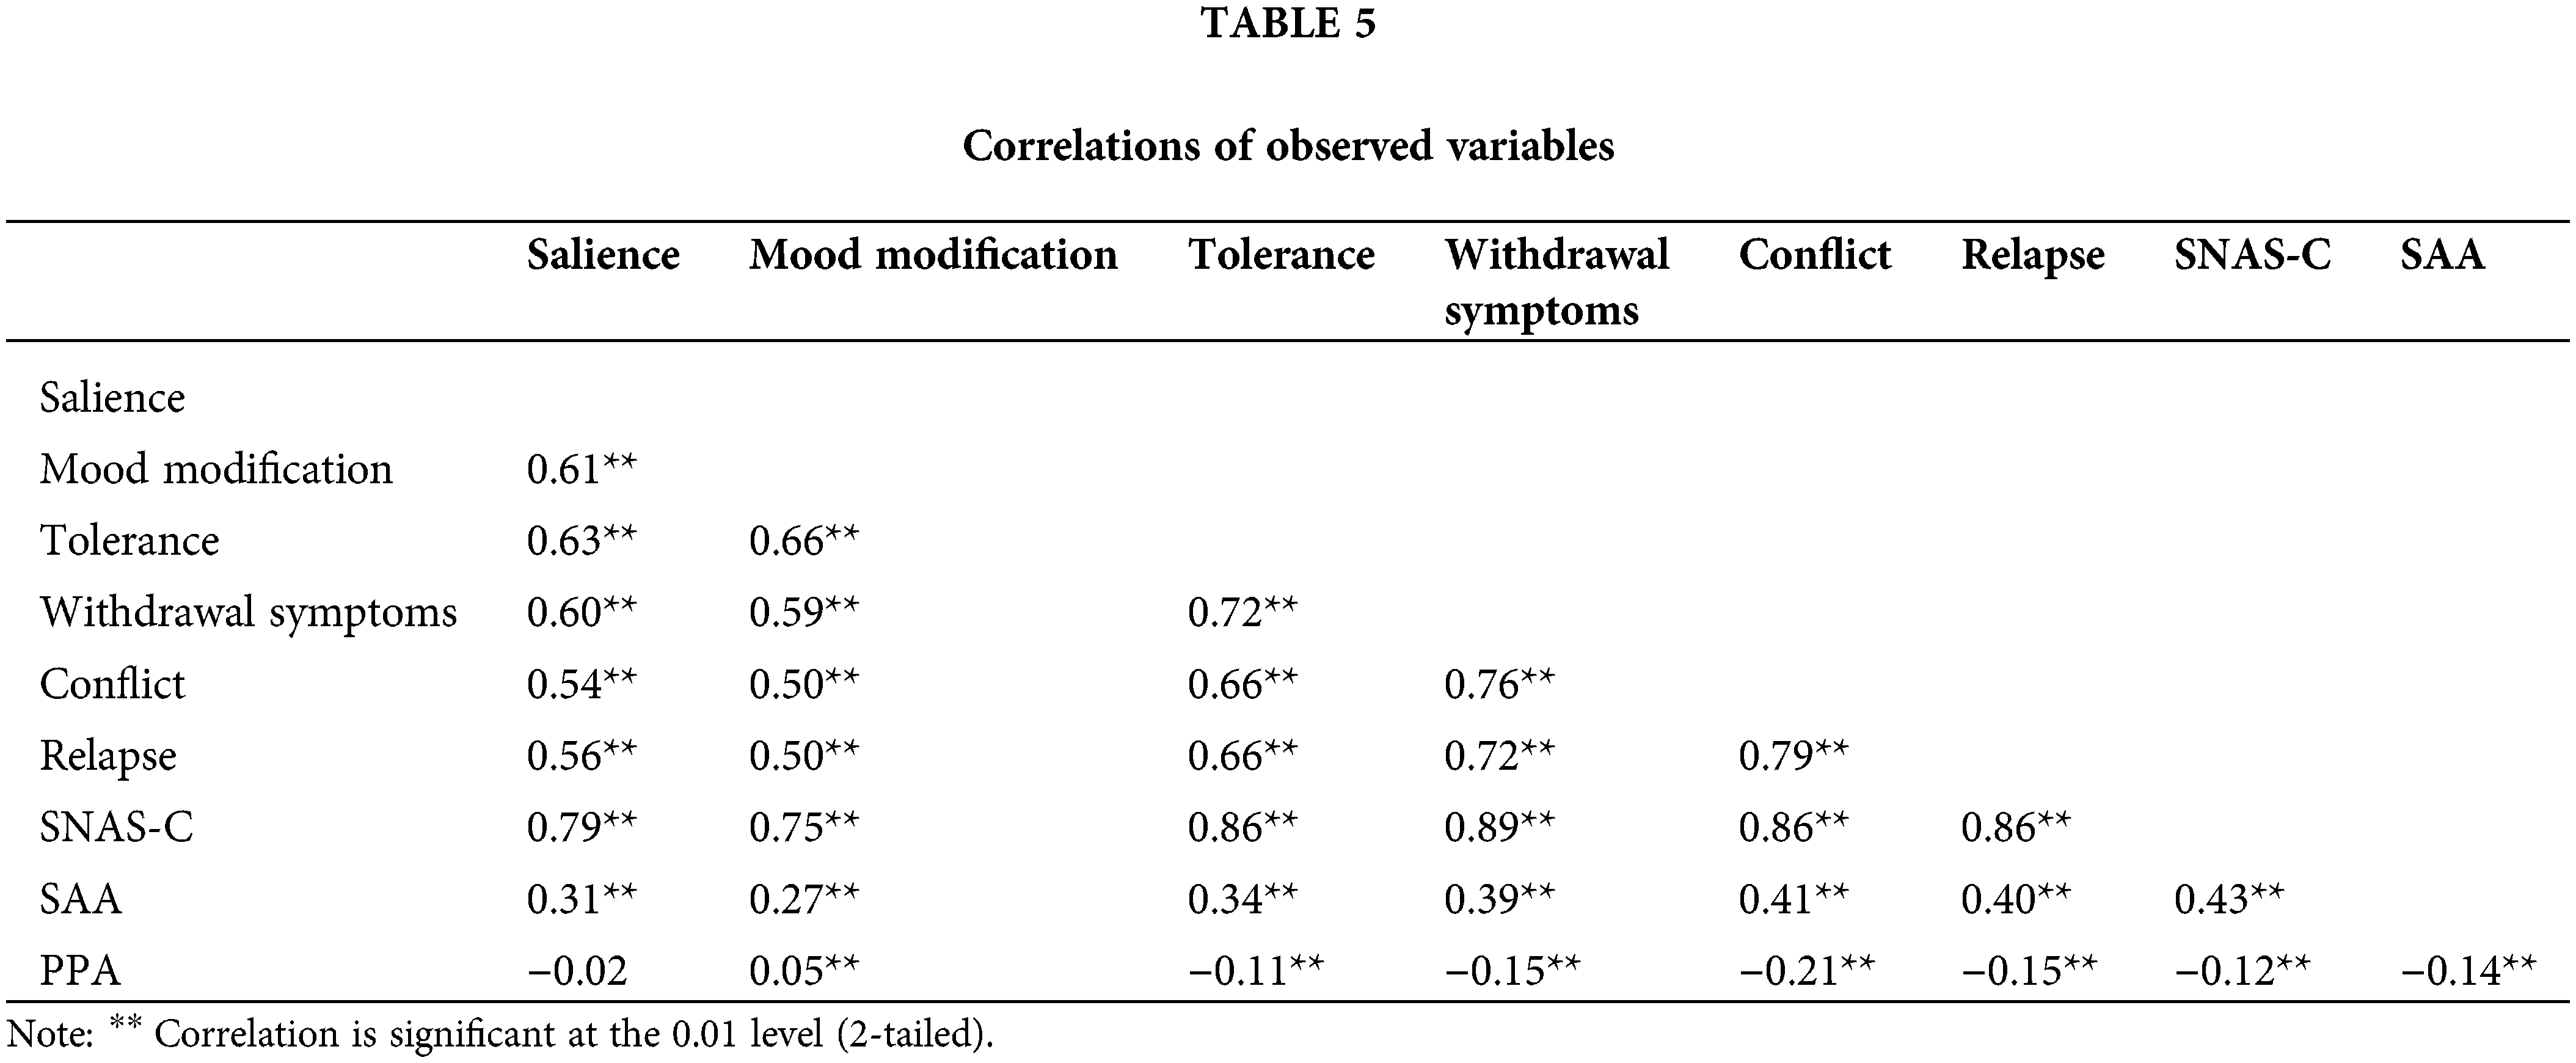
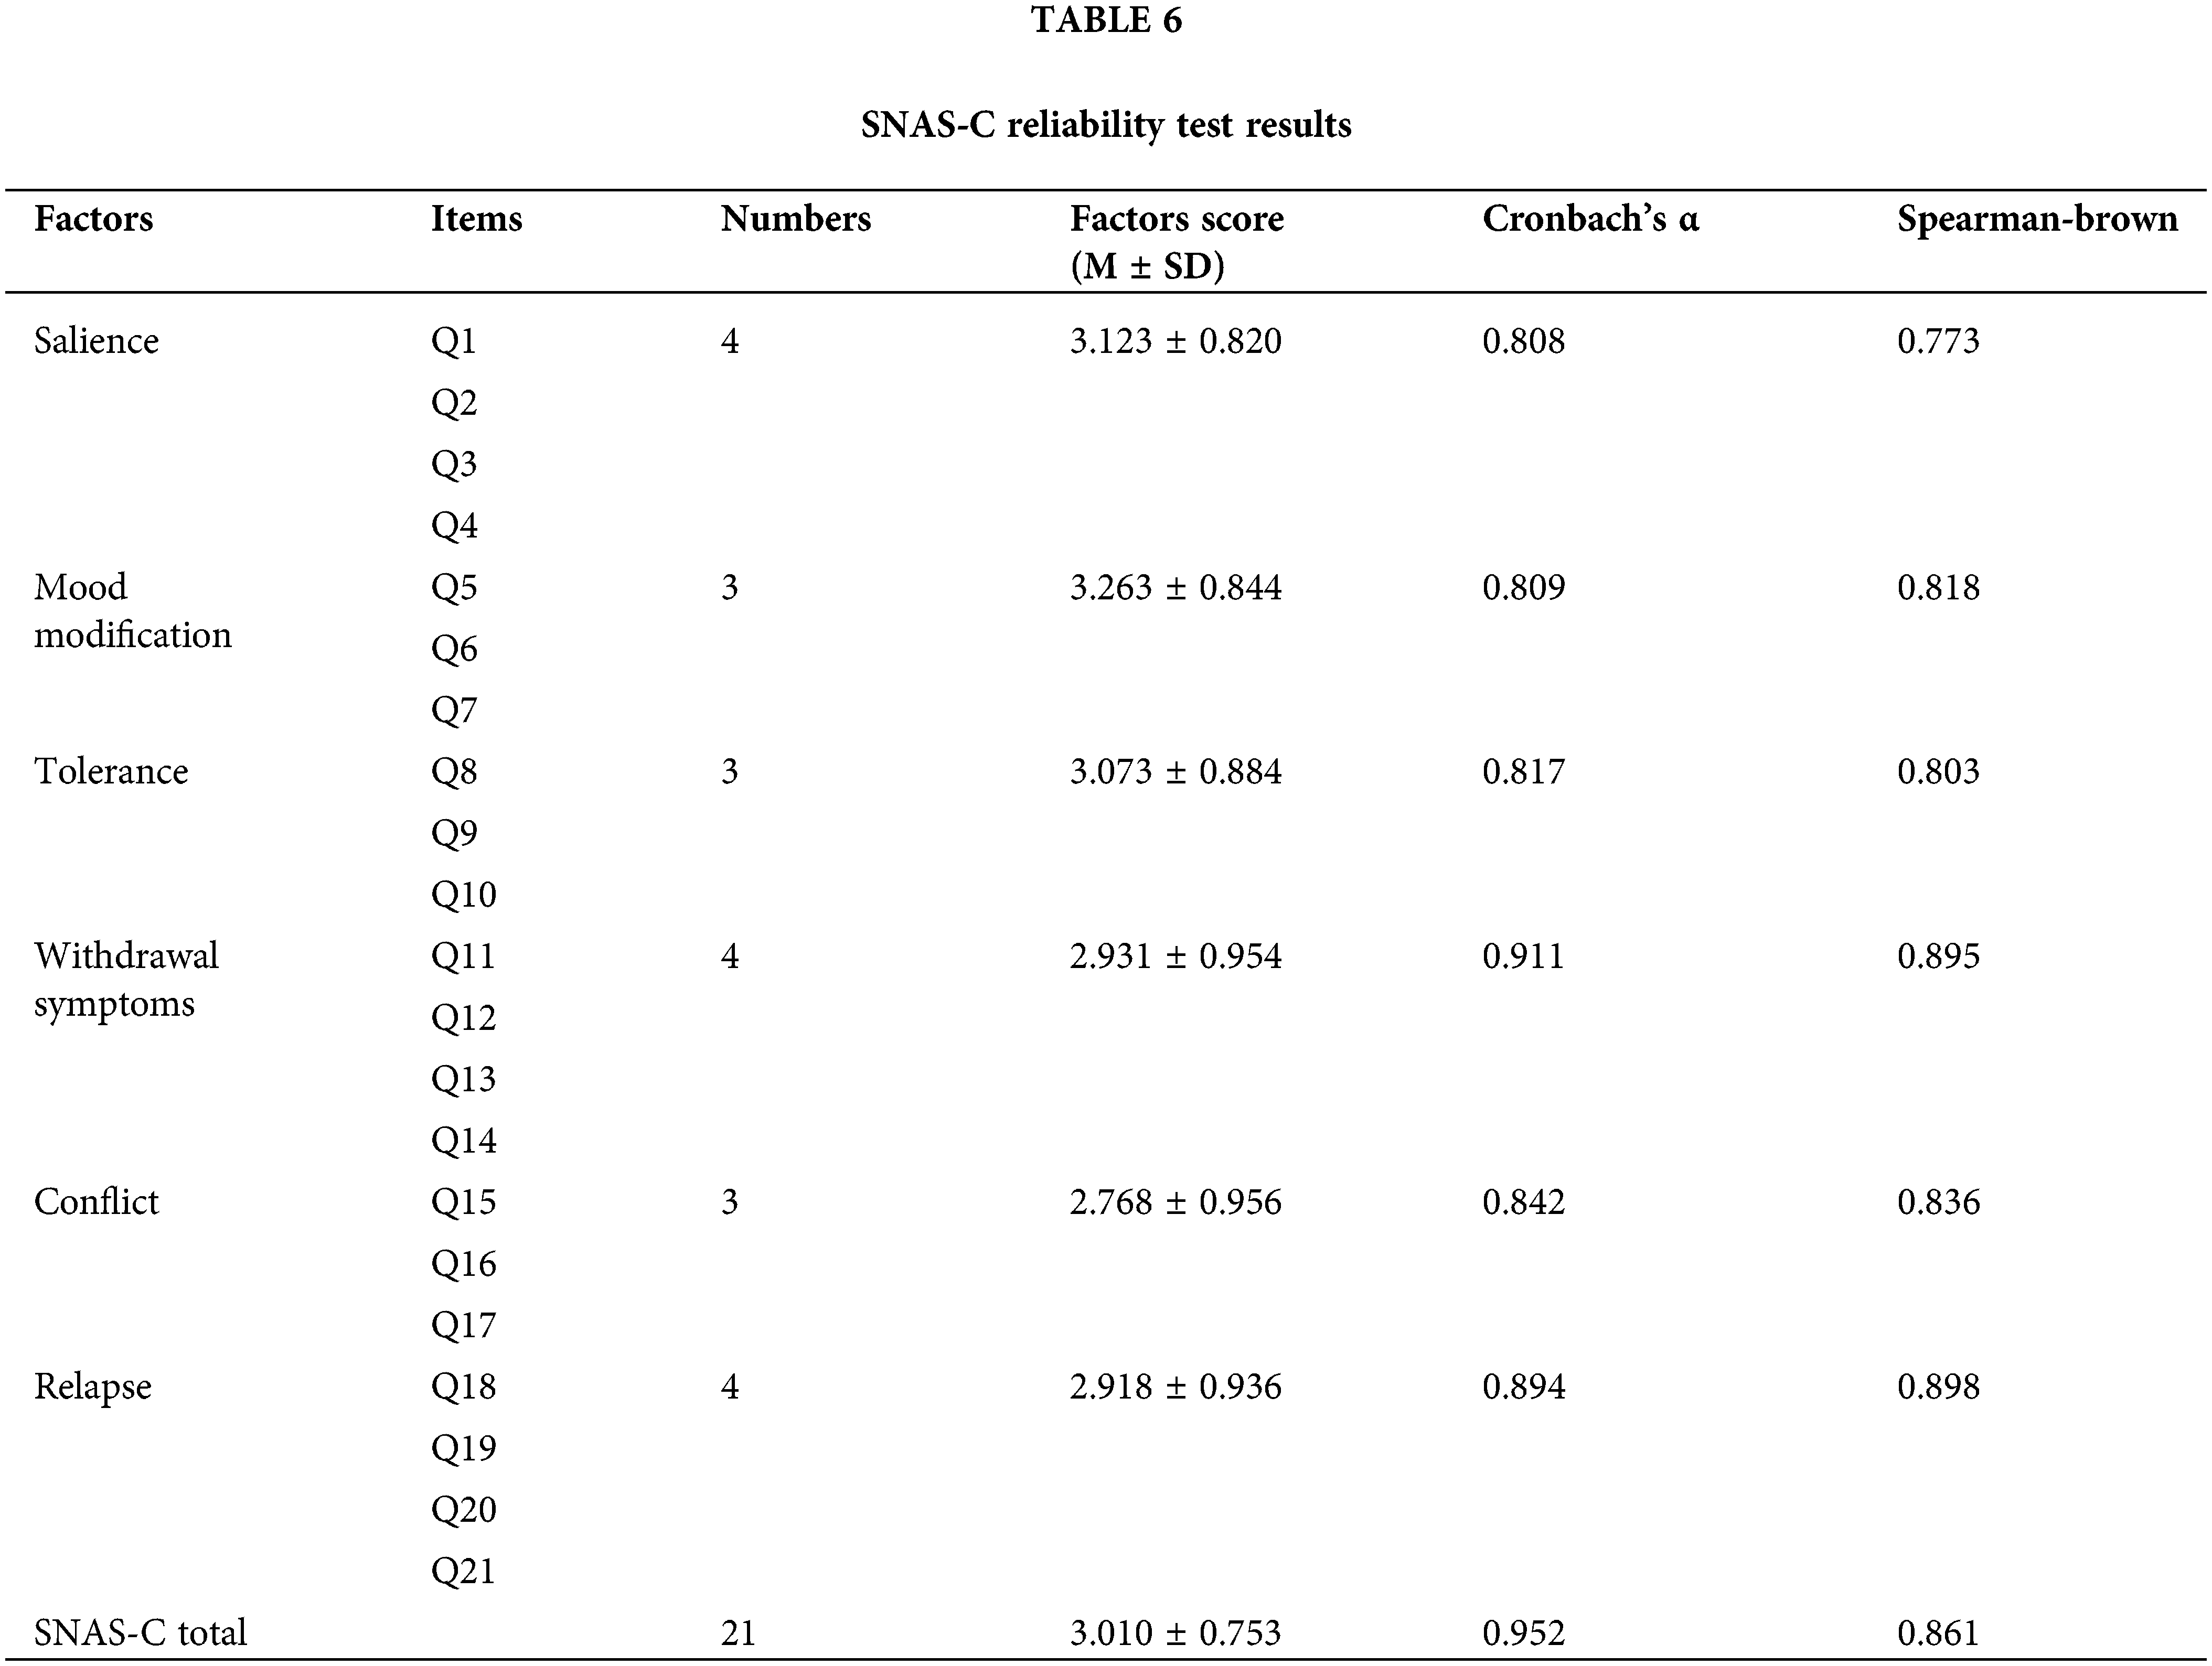
Table 6 shows the key indicators of internal consistency. The Cronbach’s α coefficients and Spearman-Brown coefficients for each dimension are both greater than 0.70, indicating that SNAS-C (Cronbach’s α = 0.952, Spearman-Brown coefficient = 0.861) meets the requirements of psychometric testing and has good reliability.
This study aimed to assess the psychometric properties of the SNAS-C in a relatively large sample of Chinese university students. Our confirmatory factor analysis (CFA) results supported the applicability of the original six-factor model of the SNAS-C in the Chinese cultural context. The factor scores of the SNAS-C were found to be highly correlated with those of the original version of the SNAS [29]. The study revealed significant correlations between the six factors of the SNAS-C and social anxiety, as well as parent and peer attachment. It is important to note that some correlations between factors may be low or non-existent, which could be attributed to various factors such as sampling differences. For example, the participants in the study may not represent the larger population, resulting in sampling discrepancies. Additionally, each subscale of the SNAS-C showed a high level of correlation, indicating good internal consistency. The Cronbach’s alpha coefficients for each subscale and the total scale confirmed the high level of internal consistency of the six subscales and the overall scale.
Consistent with previous literature, the dimensions of the SNAS-C were defined as follows: Salience referred to social networks dominating a person’s thoughts, feelings, and behaviors; mood modification involved using social networks to change and enhance one’s emotions, such as transitioning from negative to positive states; tolerance reflected the need to increase social network use to achieve previous effects; withdrawal symptoms encompassed feeling unhappy due to being unable to access social networks, for example, when the internet is unavailable; conflict involved social networking sites causing conflicts in real-life interpersonal relationships or other activities such as academics, work, or personal relationships; and relapse represented a behavioral pattern of attempting to control social networks but failing, resulting in a return to using them. By conducting a comprehensive assessment of the psychometric properties of the SNAS-C and considering factors such as social appearance anxiety and parent and peer attachment styles, this study advances our understanding of social media addiction in Chinese university students.
The current study has several advantages that highlight its contribution to the existing literature. First, the SNAS-C addresses the lack of assessment of multidimensional social networking addiction in Chinese college students. Second, the sample size used in the current validation study is larger than that of the original validation study (N = 525). Third, the validity of SNAS-C was examined using a survey sample. However, this study also has some limitations. Firstly, as the study focused on college students, the generalizability of the findings is limited, and future research should explore the validity of SNAS-C in other age groups and populations with varying health conditions. Secondly, it is important to note that there are significant limitations in measuring addiction in this study, and the influence of psychopathology or personality-behavior disorders on the research results should be considered. In future studies, these two scales should be applied to a similar sample and the prediction rate in social network addiction should be observed. Finally, other psychological variables such as personality, media preferences, and media use motives may confound the relationship between the six dimensions of SNAS-C and the correlation with digital media dependency, social appearance anxiety, and parent and peer attachment. However, these psychological variables were not measured in this study, and further research should investigate their potential impact on the observed relationships (such as mediation or moderation effects). Therefore, future research should further explore the impact of these factors on social network addiction and discuss them as limiting factors.
The results of this study indicate that SNAS-C has excellent psychometric properties and can reliably assess the multidimensional tendencies of social networking addiction in Chinese college students. Furthermore, our research findings reveal a significant correlation between social networking addiction and digital media dependency, social appearance anxiety, and parent and peer attachment. These results further validate the effectiveness and reliability of SNAS-C.
Acknowledgement: None.
Funding Statement: This study was supported by the Guizhou Provincial Basic Research Program (Natural Science) Project (Qiankehe Fund for Basic Research-ZK [2023] General 251).
Author Contributions: B. S. Y. was responsible for literature organization, data processing and paper writing. Y. J. F. was responsible for questionnaire survey and collection. L. L. was responsible for questionnaire design, research design and paper revision. All authors reviewed the results and approved the final version of the manuscript.
Availability of Data and Materials: The data presented in this study can be made available upon request to the corresponding author. These data are not publicly available ue to informed consent compliance and ethical considerations.
Ethics Approval: This study has obtained approval from the Academic Ethics Committee of Guizhou Normal University (GZNUPEI20220524). Participants were assured that their personal identities would not be disclosed in subsequent research reports.
Conflicts of Interest: The authors declare that they have no conflicts of interest to report regarding the present study.
References
1. Alahmar A. The impact of social media on the academic performance of second year medical students at College of Medicine, University of Babylon. Iraq J Med Allied Sci. 2016;6(2):77. doi:https://doi.org/10.5455/jmas.236927. [Google Scholar] [CrossRef]
2. Azizi SM, Soroush A, Khatony A. The relationship between social networking addiction and academic performance in Iranian students of medical sciences: a cross-sectional study. BMC Psychol. 2019;7(1):28. doi:https://doi.org/10.1186/s40359-019-0305-0. [Google Scholar] [PubMed] [CrossRef]
3. Kuss DJ, Griffiths MD. Online social networking and addiction—a review of the psychological literature. Int J Environ Res Public Health. 2011;8(9):3528–52. doi:https://doi.org/10.3390/ijerph8093528. [Google Scholar] [PubMed] [CrossRef]
4. Coyne SM, Padilla-Walker LM, Howard E. Emerging in a digital world. Emerg Adulthood. 2013;1(2):125–37. doi:https://doi.org/10.1177/2167696813479782. [Google Scholar] [CrossRef]
5. Prensky M. Digital natives, digital immigrants Part 1. Horiz. 2001;9(5):1–6. doi:https://doi.org/10.1108/10748120110424816. [Google Scholar] [CrossRef]
6. Prensky M. Digital natives, digital immigrants Part 2: do they really think differently? Horiz. 2001;9(6):1–6. doi:https://doi.org/10.1108/10748120110424843. [Google Scholar] [CrossRef]
7. Arnett JJ. Emerging adulthood: a theory of development from the late teens through the twenties. Am Psychol. 2000;55(5):469–80. doi:https://doi.org/10.1037/0003-066X.55.5.469. [Google Scholar] [CrossRef]
8. Oh HJ, Ozkaya E, LaRose R. How does online social networking enhance life satisfaction? The relationships among online supportive interaction, affect, perceived social support, sense of community, and life satisfaction. Comput Hum Behav. 2014;30:69–78. doi:https://doi.org/10.1016/j.chb.2013.07.053. [Google Scholar] [CrossRef]
9. Araujo Robles ED. Indicators of social networking addiction in college students from lima. Rev Digit Investig En Docencia Univ. 2016;10:48–58. doi:https://doi.org/10.19083/ridu.10.494. [Google Scholar] [CrossRef]
10. Kujath CL. Facebook and MySpace: Complement or substitute for face-to-face interaction? Cyberpsychology Behav Soc Netw. 2011;14(1–2):75–8. doi:https://doi.org/10.1089/cyber.2009.0311. [Google Scholar] [PubMed] [CrossRef]
11. Madaiah M, Seshaiyengar C, Suresh P, Munipapanna S, Sonnappa S. Study to assess the effects of social networking sites on medical college students. Int J Community Med Public Health. 2016;1204–8. doi:https://doi.org/10.18203/2394-6040.ijcmph20161385. [Google Scholar] [CrossRef]
12. Al-Dhanhani A, Mizouni R, Otrok H, Al-Rubaie A. Analysis of collaborative learning in social network sites used in education. Soc Netw Anal Min. 2015;5(1):65. doi:https://doi.org/10.1007/s13278-015-0303-z. [Google Scholar] [CrossRef]
13. Thompson SH, Lougheed E. Frazzled by Facebook? An exploratory study of gender differences in social network communication among undergraduate men and women. Coll Stud J. 2012;46:88–98. [Google Scholar]
14. Cerniglia L, Guicciardi M, Sinatra M, Monacis L, Simonelli A, Cimino S. The use of digital technologies, impulsivity and psychopathological symptoms in adolescence. Behav Sci. 2019;9(8):82. doi:https://doi.org/10.3390/bs9080082. [Google Scholar] [PubMed] [CrossRef]
15. Shensa A, Escobar-Viera CG, Sidani JE, Bowman ND, Marshal MP, Primack BA. Problematic social media use and depressive symptoms among U.S. young adults: a nationally-representative study. Soc Sci Med. 2017;182:150–7. doi:https://doi.org/10.1016/j.socscimed.2017.03.061. [Google Scholar] [PubMed] [CrossRef]
16. Woods HC, Scott H. #Sleepyteens: Social media use in adolescence is associated with poor sleep quality, anxiety, depression and low self-esteem. J Adolesc. 2016;51(1):41–9. doi:https://doi.org/10.1016/j.adolescence.2016.05.008. [Google Scholar] [PubMed] [CrossRef]
17. Tang CS, Koh YYW. Online social networking addiction among college students in Singapore: comorbidity with behavioral addiction and affective disorder. Asian J Psychiatry. 2017;25(2):175–8. doi:https://doi.org/10.1016/j.ajp.2016.10.027. [Google Scholar] [PubMed] [CrossRef]
18. Wu AMS, Cheung VI, Ku L, Hung EPW. Psychological risk factors of addiction to social networking sites among Chinese smartphone users. J Behav Addict. 2013;2(3):160–6. doi:https://doi.org/10.1556/JBA.2.2013.006. [Google Scholar] [PubMed] [CrossRef]
19. Li JB, Lau JTF, Mo PKH, Su XF, Tang J, Qin ZG, et al. Insomnia partially mediated the association between problematic Internet use and depression among secondary school students in China. J Behav Addict. 2017;6(4):554–63. doi:https://doi.org/10.1556/2006.6.2017.085. [Google Scholar] [PubMed] [CrossRef]
20. Nishant N, Rajguru C, Sankhe L. Social networking sites: a study to assess its affect on sleeping habits and social life of medical students. J Med Sci Clin Res. 2017;5(3):18275–9. doi:https://doi.org/10.18535/jmscr/v5i3.02. [Google Scholar] [CrossRef]
21. Griffiths M. A ‘components’ model of addiction within a biopsychosocial framework. J Subst Use. 2005;10(4):191–7. doi:https://doi.org/10.1080/14659890500114359. [Google Scholar] [CrossRef]
22. Andreassen C, Pallesen S. Social network site addiction—an overview. Curr Pharm Des. 2014;20(25):4053–61. doi:https://doi.org/10.2174/13816128113199990616. [Google Scholar] [PubMed] [CrossRef]
23. Pantic I. Online social networking and mental health. Cyberpsychology Behav Soc Netw. 2014;17(10):652–7. doi:https://doi.org/10.1089/cyber.2014.0070. [Google Scholar] [PubMed] [CrossRef]
24. Echeburúa E, de Corral P. Adicción a las nuevas tecnologías y a las redes sociales en jóvenes : Un nuevo reto. Adicciones. 2010;22(2):91. doi:https://doi.org/10.20882/adicciones.196. [Google Scholar] [CrossRef]
25. Turel O, Serenko A. The benefits and dangers of enjoyment with social networking websites. Eur J Inf Syst. 2012;21(5):512–28. doi:https://doi.org/10.1057/ejis.2012.1. [Google Scholar] [CrossRef]
26. Can L, Kaya N. Social networking sites addiction and the effect of attitude towards social network advertising. Proc—Soc Behav Sci. 2016;235:484–92. doi:https://doi.org/10.1016/j.sbspro.2016.11.059. [Google Scholar] [CrossRef]
27. Gao W, Liu Z, Li J. How does social presence influence SNS addiction? A belongingness theory perspective. Comput Hum Behav. 2017;77(3):347–55. doi:https://doi.org/10.1016/j.chb.2017.09.002. [Google Scholar] [CrossRef]
28. Gokdas I, Kuzucu Y. Social network addiction scale: the validity and reliability study of adolescent and adult form. Int J Assess Tools Educ. 2019;6(3):396–414. doi:https://doi.org/10.21449/ijate.505863. [Google Scholar] [CrossRef]
29. Shahnawaz MG, Rehman U. Social networking addiction scale. Cogent Psychol. 2020;7(1):1832032. doi:https://doi.org/10.1080/23311908.2020.1832032. [Google Scholar] [CrossRef]
30. Andreassen CS, Torsheim T, Brunborg GS, Pallesen S. Development of a Facebook addiction scale. Psychol Rep. 2012;110(2):501–17. doi:https://doi.org/10.2466/02.09.18.PR0.110.2.501-517. [Google Scholar] [PubMed] [CrossRef]
31. Andreassen CS, Billieux J, Griffiths MD, Kuss DJ, Demetrovics Z, Mazzoni E, et al. The relationship between addictive use of social media and video games and symptoms of psychiatric disorders: A large-scale cross-sectional study. Psychol Addict Behav. 2016;30(2):252–62. doi:https://doi.org/10.1037/adb0000160. [Google Scholar] [PubMed] [CrossRef]
32. Cuadrado E, Rojas R, Tabernero C. Development and Validation of the social network addiction scale (SNAddS-6S). Eur J Investig Health Psychol Educ. 2020;10(3):763–78. doi:https://doi.org/10.3390/ejihpe10030056. [Google Scholar] [PubMed] [CrossRef]
33. da Veiga GF, Sotero L, Pontes HM, Cunha D, Portugal A, Relvas AP. Emerging adults and Facebook use: the validation of the Bergen Facebook Addiction Scale (BFAS). Int J Ment Health Addict. 2019;17(2):279–94. doi:https://doi.org/10.1007/s11469-018-0018-2. [Google Scholar] [CrossRef]
34. Saiphoo AN, Vahedi Z. A meta-analytic review of the relationship between social media use and body image disturbance. Comput Hum Behav. 2019;101(1):259–75. doi:https://doi.org/10.1016/j.chb.2019.07.028. [Google Scholar] [CrossRef]
35. Monacis L, de Palo V, Griffiths MD, Sinatra M. Exploring individual differences in online addictions: The role of identity and attachment. Int J Ment Health Addict. 2017;15(4):853–68. doi:https://doi.org/10.1007/s11469-017-9768-5. [Google Scholar] [PubMed] [CrossRef]
36. Monacis L, de Palo V, Griffiths MD, Sinatra M. Social networking addiction, attachment style, and validation of the Italian version of the Bergen social media addiction scale. J Behav Addict. 2017;6(2):178–86. doi:https://doi.org/10.1556/2006.6.2017.023. [Google Scholar] [PubMed] [CrossRef]
37. Brislin RW. Back-translation for cross-cultural research. J Cross-Cult Psychol. 1970;1(3):185–216. doi:https://doi.org/10.1177/135910457000100301. [Google Scholar] [CrossRef]
38. Davis K. Friendship 2.0: Adolescents’ experiences of belonging and self-disclosure online. J Adolesc. 2012;35(6):1527–36. doi:https://doi.org/10.1016/j.adolescence.2012.02.013. [Google Scholar] [PubMed] [CrossRef]
39. Reichenberger J, Radix AK, Blechert J, Legenbauer T. Further support for the validity of the social appearance anxiety scale (SAAS) in a variety of German-speaking samples. Eat Weight Disord—Stud Anorex Bulim Obes. 2022;27:929–43. doi:https://doi.org/10.1007/s40519-021-01171-y. [Google Scholar] [PubMed] [CrossRef]
40. Hart TA, Flora DB, Palyo SA, Fresco DM, Holle C, Heimberg RG. Development and examination of the social appearance anxiety scale. Assessment. 2008;15(1):48–59. doi:https://doi.org/10.1177/1073191107306673. [Google Scholar] [PubMed] [CrossRef]
41. Kocayoruk E. A Turkish adaptation of the inventory of parent and peer attachment: the reliability and validity study. Eurasian J Educ Res. 2010;10:133–50. [Google Scholar]
42. Hu H. The impact of body image and social physique anxiety on exercise behavior in college freshmen. J Chengdu Sport Univ. 2017;43(2):120–6. doi:https://doi.org/10.15942/j.jcsu.2017.02.021. [Google Scholar] [CrossRef]
43. Xiang G, Teng Z, Guo C, Chen H, Miao H. A model of interaction between parental and peer attachment and hope: a longitudinal study of college freshmen. Psychol Dev Educ. 2021;37(3):371–80. [Google Scholar]
44. Hu L, Bentler PM. Cutoff criteria for fit indexes in covariance structure analysis: conventional criteria versus new alternatives. Struct Equ Model Multidiscip J. 1999;6(1):1–55. doi:https://doi.org/10.1080/10705519909540118. [Google Scholar] [CrossRef]
45. Bentler PM. On tests and indices for evaluating structural models. Personal Individ Differ. 2007;42(5):825–9. doi:https://doi.org/10.1016/j.paid.2006.09.024. [Google Scholar] [CrossRef]
46. Wen Z, Hau K, Herbert WM. Structurale quation model testing: cutoff criteria for goodness of fit indices and chi-square test. J Phycol. 2004;36:186–94. [Google Scholar]
47. Wu M. Structural equation model. In: Amos practical advancement. Chongqing, China: Chongqing University Press; 2013. [Google Scholar]
48. Hair JFJ, Black WC, Babin BJ, Anderson RE. Multivariate data analysis. 7th ed. Upper Saddle River, NJ: Pearson; 2009. [Google Scholar]
49. Fornell C, Larcker DF. Evaluating structural equation models with unobservable variables and measurement error. J Mark Res. 1981;18(1):39. doi:https://doi.org/10.1177/002224378101800104. [Google Scholar] [CrossRef]
50. Nunnally JC, Bernstein IH. Psychometric theory. 3rd ed. New York: McGraw-Hill; 1994. [Google Scholar]
51. Bland JM, Altman DG. Statistics notes: Cronbach’s alpha. BMJ. 1997;314:572. doi:https://doi.org/10.1136/bmj.314.7080.572. [Google Scholar] [CrossRef]
52. Tavakol M, Dennick R. Making sense of Cronbach’s alpha. Int J Med Educ. 2011;2:53–5. doi:https://doi.org/10.5116/ijme.4dfb.8dfd. [Google Scholar] [PubMed] [CrossRef]
53. Asuero AG, Sayago A, González AG. The correlation coefficient: an overview. Crit Rev Anal Chem. 2006;36(1):41–59. doi:https://doi.org/10.1080/10408340500526766. [Google Scholar] [CrossRef]
54. Ratner B. The correlation coefficient: its values range between +1/−1, or do they? J Target Meas Anal Mark. 2009;17(2):139–42. doi:https://doi.org/10.1057/jt.2009.5. [Google Scholar] [CrossRef]
55. Kim HY. Statistical notes for clinical researchers: Assessing normal distribution (2) using skewness and kurtosis. Restor Dent Endod. 2013;38(1):52. doi:https://doi.org/10.5395/rde.2013.38.1.52. [Google Scholar] [PubMed] [CrossRef]
Cite This Article
 Copyright © 2024 The Author(s). Published by Tech Science Press.
This work is licensed under a Creative Commons Attribution 4.0 International License , which permits unrestricted use, distribution, and reproduction in any medium, provided the original work is properly cited.
 Downloads
 Citation Tools