
 Submit a Paper
 Propose a Special lssue
 Open Access
ARTICLE

The Plateau Dilemma: Identifying Key Factors of Depression Risk among Middle-Aged and Older Chinese with Chronic Diseases
1 Union Hospital, Tongji Medical College, Huazhong University of Science and Technology, Wuhan, 430022, China
2 School of Economics, Sichuan University, Chengdu, 610065, China
* Corresponding Authors: Yaning Zhang. Email: ,
(This article belongs to the Special Issue: Depression Across the Lifespan: Perspectives on Prevention, Intervention, and Holistic Care)
International Journal of Mental Health Promotion 2025, 27(11), 1747-1768. https://doi.org/10.32604/ijmhp.2025.070491
Received 17 July 2025; Accepted 26 September 2025; Issue published 28 November 2025
 View Full Text
 Download PDF
Abstract
Background: Depression represents a significant global mental health burden, particularly among middle-aged and older Chinese with chronic diseases in high-altitude regions, where harsh environmental conditions and limited social support exacerbate mental health disparities. This paper aims to develop an interpretable machine learning prediction framework to identify the key factors of depression in this vulnerable population, thereby proposing targeted intervention measures. Methods: Utilizing data from the China Health and Retirement Longitudinal Study in 2020, this paper screened out and analyzed 2431 samples. Subsequently, Recursive Feature Elimination and Least Absolute Shrinkage and Selection Operator were applied to screen predictors from 32 alternative variables. Furthermore, through hyperparameter tuning and 5-fold cross-validation, 8 machine learning models were constructed, namely, Random Forest, Extreme Gradient Boosting, Light Gradient Boosting Machine, Gradient Boosting Machine, K-Nearest Neighbor, Naive Bayes Classifier, Support Vector Machine, and Logistic Regression. Finally, the SHAP algorithm was applied to analyze the interpretability of the best-performing model, quantifying nonlinear relationships and threshold effects. Results: Among the respondents, the prevalence of depression was approximately 46.89%. After feature engineering screening, 8 variables were retained for inclusion in the prediction model. Furthermore, the Gradient Boosting Machine performed optimally in terms of comprehensive performance, with an Area Under Receiver Operating Characteristic Curve (AUC) of 0.845, an Accuracy of 0.714, a Sensitivity of 0.655, a Precision of 0.711, a Specificity of 0.766, and an F1 of 0.682. In addition, Life satisfaction, PM2.5, Self-rated health, and Education were identified as the top 4 key factors. Meanwhile, the influence of these variables on depression showed nonlinear and threshold effects. Conclusion: This research highlights the value of machine learning in mental health. Based on the identified key factors, this paper proposed a series of policy measures to improve the health pattern of the middle-aged and elderly populations facing the dual challenges of chronic disease and environmental adversity.Keywords
Depression is one of the most common mental illnesses worldwide, which not only seriously affects patients’ own quality of life but also brings substantial economic burden and caregiving pressure to patients’ families and society [1]. According to data released by the World Health Organization, the global number of patients with depression worldwide has exceeded 300 million, with the incidence rate increasing annually. This trend underscores depression as a growing global public health crisis [2]. In particular, the worldwide prevalence of anxiety and depression has increased significantly since the outbreak of COVID-19 [3]. In view of this, it is of great practical significance to further deepen the research on depression. Studies have shown that the onset of depression is influenced by a variety of factors intertwined with individuals, families, lifestyles, and regional environments [4,5,6,7,8,9]. In particular, the middle-aged and older groups (MOG) may be more susceptible to depression due to deteriorating physical function, reduced social adaptability, and insufficient social support [10].
With the rapid aging of China’s population, the physical and mental health challenges faced by MOG have become increasingly prominent. According to a national survey, the prevalence of depression among MOG in China is approximately 23% [11], which is significantly higher than that reported in many western developed countries [12]. However, only 0.5% of individuals with depression in China receive adequate treatment [13], and this percentage is even lower among MOG. Simultaneously, studies show that 42% of MOG suffer from at least one chronic disease, with a growing number experiencing two or more concurrent chronic diseases [14]. The high prevalence of chronic diseases and multimorbidity not only leads to a continuous decline in the physical functioning of MOG but also induces psychological problems such as depression. A substantial body of traditional epidemiologic researches have also demonstrated a significant correlation between chronic diseases and depression [15,16,17]. For example, older adults with diabetes face a higher risk of psychological challenges such as depression and anxiety, with a morbidity rate 2 to 4 times higher than those of the general older population [18]. Similarly, individuals with chronic diseases, such as heart disease, hypertension, and arthritis, are at higher risk of depressive comorbidities [17].
In recent years, increasing attention has been given to the role of natural environmental factors in psychological development [19]. However, the relationship between altitude, as an important geographic feature in the ecosystems on which human beings depend for survival, and human depression has been slightly underexplored. Currently, only a few studies have confirmed that the risk of depression in the population increases with altitude [20,21,22], but the research on the risk factors of depression in MOG with chronic diseases located at high altitude needs to be supplemented. This research gap is critical to address for the prevention and treatment of depression in specific vulnerable populations. The elevated depression risk at high altitudes is likely mediated through several interrelated mechanisms, which may be exacerbated in individuals with chronic diseases. Physiologically, the extreme conditions characterized by chronic hypoxia, cold temperatures, and intense ultraviolet radiation impose significant stress, with the primary stressor being hypoxia [23]. Prolonged hypoxia induces compensatory cardiopulmonary changes, increases red blood cell count and blood viscosity, thereby exacerbating the risk and severity of prevalent cardiovascular diseases [24]. Critically, the central nervous system is highly dependent on oxygen for its metabolic needs, and any disruption in oxygen supply can lead to significant neuronal damage and dysfunction [25]. For instance, prolonged hypoxia can accelerate the progression of various chronic diseases such as stroke and neurodegenerative disorders [26,27]. However, individuals with pre-existing chronic conditions, whose physiological systems are often compromised, exhibit reduced resilience to these additional environmental stressors [28]. Consequently, the harsh environment in high-altitude areas imposes a greater physical burden on local residents, especially those with chronic diseases. These physiological burdens are often translated into mental health problems, thereby increasing the depression risk in MOG. At the same time, compounding these biological challenges, the harsh living environment and geographic isolation typical of high-altitude regions frequently lead to limited access to specialized healthcare for MOG [29,30]. Especially for those managing chronic diseases, this barrier impedes effective disease monitoring and intervention, potentially worsening physical health and intensifying feelings of helplessness and vulnerability, key psychological precursors to depression. Furthermore, geographic isolation in high-altitude areas often fosters social closure, reducing opportunities for meaningful social interaction and support networks, while economic opportunities may also be constrained. Social isolation, loneliness, and socioeconomic disadvantage are well-established risk factors for mental health issues, particularly among MOG [31,32]. In short, the cumulative effect of navigating chronic diseases amidst the physical hardships, restricted healthcare access, social isolation, and potential economic strain inherent to many high-altitude environments creates a potent and multifaceted psychosocial risk profile for depression among MOG. Therefore, these geographically marginalized MOG, especially those facing the dual burden of chronic disease and high-altitude adversity, represent a critical focus for achieving SDG 3 (Good Health and Well-being) and SDG 10 (Reduced Inequalities) by addressing persistent health disparities.
In order to identify high-risk groups and implement appropriate early interventions, an important task is the risk prediction of depression. In terms of prediction models, traditional statistical methods have been widely used, yet their limitations have become increasingly apparent as research deepens and real-world grow increasingly complex. Studies have shown that machine learning methods, with their powerful data mining and complex pattern recognition capabilities, can effectively improve the accuracy and stability of prediction [33]. Consequently, in recent years, an increasing number of studies have begun to explore prediction models based on machine learning. Algorithms such as Random Forest (RF) and Support Vector Machine (SVM) have shown better performance in depression prediction tasks [34]. The Light Gradient Boosting Machine (LGBM) has also demonstrated excellent performance in studies on people with depressive symptoms. It is combined with the SHapley Additive exPlanations (SHAP) value algorithm to enable interpretability analysis, thereby alleviating the “black box” problem associated with traditional machine learning prediction processes [35].
Despite past studies have accumulated many results in the field of depression, several gaps remain. First, there is a lack of specific research on the comorbidity of chronic diseases and depression in the special environment of high altitude. The distinct natural and social conditions of high altitude may bring additional stress to patients from physical, psychological, and social levels, however, the risk factors influencing depression onset in vulnerable high-altitude populations remain insufficiently explored. Second, in the prediction of depression, traditional statistical models often struggle to synthesize multidimensional information, such as environmental factors and demographic indicators in high-altitude areas, resulting in limited prediction accuracy.
This study aims to address the aforementioned research gaps. On the one hand, it focuses on the MOG suffering from chronic diseases in the special geographic region of high-altitude cities in China, contributing Chinese wisdom to the intersection of plateau medicine and mental health in the world. On the other hand, we introduced various machine learning algorithms to construct a risk prediction model and conduct an interpretable analysis, thereby identifying the key factors influencing depression in MOG with chronic diseases at high altitudes in China. In conclusion, this study will help health policy makers to formulate regionalized mental health care strategies to improve the overall health outcomes of vulnerable groups in this special region and reduce the burden of medical care on society.
This paper adopts the China Health and Retirement Longitudinal Study (CHARLS) as the study sample, which is conducted by Peking University., CHARLS selects samples according to the random probability sampling method in proportion to ensure a reasonable representation of individuals from different regions and types. Initiated in 2008, the CHARLS survey follows a biennial cycle, with samples spread across 28 provinces in China. CHARLS is the first nationally representative survey database focused on MOG in China, with data collected covering multidimensional information such as demographic characteristics, daily lifestyle, and physical and mental health status. Based on its good reliability and validity, CHARLS has gained widespread recognition and application in academic research [16]. Considering the completeness and timeliness of the data, this paper utilizes the latest release of the fifth cross-sectional data in 2020. Further, the following study participant inclusion criteria were developed in this paper: age ≥45 years, average altitude of the living area ≥900 m [20], and chronic disease ≥2 categories [16]. It should be noted that previous studies have shown that the association between suicide rates and altitude increases sharply at the threshold of 2000–3000 feet (approximately 610–914 m), and suicidal tendencies are highly correlated with depression [36]. Meanwhile, some scholars have divided their research subjects into two groups based on an altitude threshold of 900 m: high-altitude and low-altitude. Their analysis reveals that groups migrating from low-altitude to high-altitude regions face an increased depression risk [20]. Given China’s geographic context, vast regions, such as the Loess Plateau and the Yunnan-Guizhou Plateau, have average altitudes ranging from approximately 1000 to 2000 m. These areas are home to significant populations facing the dual burdens of chronic diseases and environmental adversity, including limited healthcare access and socioeconomic disadvantages. Therefore, this paper adopts 900 m as the threshold for defining high-altitude areas, thereby including these critical populations residing in areas experiencing substantial altitude-related stress. In addition, participants with missing or unavailable key information were excluded. Finally, a total of 2431 individuals with complete information became the subjects of this paper. Furthermore, this study also matched the macro indicators of each region in the 2020 China Urban Statistical Yearbook with the CHARLS-2020 database based on the region codes. The specific measures and descriptive statistics of each indicator are shown in Table 1 and Table 2.
The study protocol of the CHARLS was approved by the Peking University Biomedical Ethics Committee (IRB00001052-11015), which conformed to the standards set by the latest revision of the Declaration of Helsinki. All participants included in the study provided informed consent.
The use of the Center for Epidemiologic Studies Depression Scale (CESD) to measure depression risk has been demonstrated to be reliable and valid [37]. Therefore, the 10-item Brief Scale (CESD-10) was chosen to assess the depression risk in the study population. The response options were scored using a 4-point Likert scale, where 0 = very little or not at all, 1 = not too much, 2 = sometimes or half the time, and 3 = most of the time, with items 5 and 8 being reverse-scored. Finally, the scores for each question were totaled based on the respondent’s answers, with higher scores indicating poorer psychological status. Studies based on the CHARLS dataset have confirmed that CESD-10 can effectively measures depression levels in Chinese MOG [38]. In this study, the Cronbach’s alpha coefficient of this scale was approximately 0.78, indicating acceptable reliability and validity. Additionally, most studies generally adopt a score of 10 as the cut-off point [16], thus, in this study, CESD ≥ 10 was used to identify respondents suffering from depression, who were coded as 1, while those below the threshold were coded as 0. Table 2 shows that the number of people suffering from depression was 1140, with a prevalence rate of approximately 46.89%, which is significantly higher than that of the general MOG. Moreover, the ratio between the depression group and non-depression groups is approximately 1.13:1, indicating that the classification problem proved to be balanced.
Based on expert consultation and relevant literature review [4,5,6,7,8,9,10,16,39,40], this study selected a total of 32 influencing factors related to depression from 4 aspects: individual and family characteristics, individual health status, daily lifestyle, and macro-regional characteristics. These factors encompass multiple dimensions, ranging from personal basic information to family structure, from physical health conditions to mental health levels, from daily behavioral habits to the socio-economic environment of the residential areas. This comprehensive analytic framework is intended to provide a foundation for subsequent clinical intervention and policy formulation.
Firstly, the data of individual and family characteristics selected in this study included 10 variables: gender, marital status, household registration, household income, family size, children’s Economic support for parents, age, education level, and whether they have medical insurance and endowment insurance. At the same time, the following 9 health variables were selected for the study: self-rated health, activities of daily living (ADL), hospitalization in the past year, headache, shoulder pain, arm pain, back pain, leg pain, and hip fracture. It should be noted that this paper used ADL-6 items to evaluate individual independent living ability, with the higher the score, the worse the ability. In addition, 8 variables were included in the daily lifestyle factors: life satisfaction, chess/card activities, socializing with friends, smoking, drinking, exercise, helping others, and volunteer/charity activities. These variables comprehensively reflect the personality traits, coping styles, and social participation of the participants. Although relevant studies have confirmed a significant association between personality traits and the risk of depression [41], considering the availability of CHARLS data, this paper selected two variables, “help others” and “volunteer/charity activities”, to reflect the personality traits of the participants. Finally, this paper also collected 5 regional macro characteristic variables: per capita GDP, per capita wage level, road density, PM2.5 average annual concentration, and population density.
Table 1: Specific measures for each variable.
| Variable | Assignment |
|---|---|
| Target Variable | |
| Depression | “CESD ≥ 10” = 1, “CESD < 10” = 0 |
| Individual and Family Characteristics | |
| 1 Gender | Male = 1, female = 0 |
| 2 Marital status | Married = 1, otherwise = 0 |
| 3 Urban/rural | Urban = 1, rural = 0 |
| 4 Medical insurance | Possession = 1, otherwise = 0 |
| 5 Endowment insurance | Possession = 1, otherwise = 0 |
| 6 Family size | Continuous variable (people) |
| 7 Age | Continuous variable (years) |
| 8 Education level | Illiterate = 1, elementary school = 2, middle school = 3, high school and above = 4 |
| 9 Economic support | Continuous variable (10,000 RMB) |
| 10 Gross household income | Continuous variable (10,000 RMB) |
| Health Status | |
| 11 Self-rated health | Very good = 5, good = 4, fair = 3, bad = 2, very bad = 1 |
| 12 ADL | Total score for 6 daily activities |
| 13 Hospitalization | Yes = 1, no = 0 |
| 14 Headache | Yes = 1, no = 0 |
| 15 Shoulder pain | Yes = 1, no = 0 |
| 16 Arm pain | Yes = 1, no = 0 |
| 17 Back pain | Yes = 1, no = 0 |
| 18 Leg pain | Yes = 1, no = 0 |
| 19 Hip fracture | Yes = 1, no = 0 |
| Daily Lifestyle | |
| 20 Life satisfaction | Extremely satisfied = 5, very satisfied = 4, quite satisfied = 3, not very satisfied = 2, not at all satisfied = 1 |
| 21 Drink | Drinking = 1, otherwise = 0 |
| 22 Smoke | Smoking = 1, otherwise = 0 |
| 23 Exercise | Exercising = 1, otherwise = 0 |
| 24 Chess/card activities | Yes = 1, no = 0 |
| 25 Visit/socialize with friends | Yes = 1, no = 0 |
| 26 Help others | Yes = 1, no = 0 |
| 27 Volunteer/charity activities | Yes = 1, no = 0 |
| Regional Characteristics | |
| 28 PM2.5 | Continuous variable (µg/m3) |
| 29 Population density | Continuous variable (people/km2) |
| 30 Road density | Continuous variable (km/km2) |
| 31 Wage | Continuous variable (10,000 RMB) |
| 32 GDP | Continuous variable (10,000 RMB) |
Table 2: Descriptive statistics for each variable (N = 2431).
| Variable | Option | Percentage (%) | Variable | Option | Percentage (%) |
|---|---|---|---|---|---|
| Target Variable | 14 Headache | 0 | 65.405 | ||
| Depression | 0 | 53.106 | 1 | 34.595 | |
| 1 | 46.894 | 15 Shoulder pain | 0 | 69.107 | |
| Individual and Family Characteristics | 1 | 30.893 | |||
| 1 Gender | 0 | 52.489 | 16 Arm pain | 0 | 73.797 |
| 1 | 47.511 | 1 | 26.203 | ||
| 2 Marital status | 0 | 15.343 | 17 Back pain | 0 | 56.355 |
| 1 | 84.657 | 1 | 43.645 | ||
| 3 Urban/rural | 0 | 63.76 | 18 Leg pain | 0 | 64.665 |
| 1 | 36.24 | 1 | 35.335 | ||
| 4 Medical insurance | 0 | 3.579 | 19 Hip fracture | 0 | 99.095 |
| 1 | 96.421 | 1 | 0.905 | ||
| 5 Endowment insurance | 0 | 9.255 | Daily Lifestyle | ||
| 1 | 90.745 | 20 Life satisfaction | 1 | 3.702 | |
| 6 Family size | 1~4 | 83.258 | 2 | 9.831 | |
| 5~8 | 16.248 | 3 | 49.568 | ||
| 9~13 | 0.494 | 4 | 30.358 | ||
| 7 Age | 45~60 | 49.938 | 5 | 6.541 | |
| 61~80 | 47.758 | 21 Drink | 0 | 66.804 | |
| 81~100 | 2.263 | 1 | 33.196 | ||
| 101~120 | 0.041 | 22 Smoke | 0 | 55.862 | |
| 8 Education | 1 | 46.771 | 1 | 44.138 | |
| 2 | 21.432 | 23 Exercise | 0 | 8.844 | |
| 3 | 20.074 | 1 | 91.156 | ||
| 4 | 11.724 | 24 Chess/card activities | 0 | 87.865 | |
| 9 Economic support | 0~0.2 | 47.306 | 1 | 12.135 | |
| 0.21~0.4 | 14.973 | 25 Visit/socialize with friends | 0 | 68.531 | |
| 0.41~0.6 | 10.613 | 1 | 31.469 | ||
| 0.61~0.8 | 7.733 | 26 Help others | 0 | 83.176 | |
| 0.81~1 | 3.127 | 1 | 16.824 | ||
| 1.01~5 | 14.932 | 27 Volunteer/charity activities | 0 | 96.75 | |
| >5.01 | 1.316 | 1 | 3.25 | ||
| 10 Gross household income | <0 | 8.474 | Regional Characteristics | ||
| 1~2 | 37.269 | 28 PM2.5 | 4~10 | 4.278 | |
| 2.1~4 | 18.058 | 11~20 | 41.259 | ||
| 4.1~6 | 12.752 | 21~30 | 26.943 | ||
| 6.1~8 | 7.733 | 31~40 | 16.413 | ||
| 8.1~10 | 5.718 | 41~60 | 11.107 | ||
| 10.1~12 | 3.661 | 29 Population density | 0~100 | 49.774 | |
| >12.1 | 6.335 | 101~200 | 23.611 | ||
| Health Status | 201~300 | 17.36 | |||
| 11 Self-rated health | 1 | 12.299 | 301~400 | 1.48 | |
| 2 | 22.131 | 401~500 | 7.775 | ||
| 3 | 45.167 | 30 Road density | 0~0.5 | 44.179 | |
| 4 | 12.258 | 0.6~1 | 33.731 | ||
| 5 | 8.145 | 1.1~2 | 14.274 | ||
| 12 ADL | 0 | 74.743 | 2.1~5 | 7.816 | |
| 1 | 12.423 | 31 Wage | 0~2 | 3.949 | |
| 2 | 5.183 | 2.1~6 | 0 | ||
| 3 | 3.497 | 6.1~8 | 36.158 | ||
| 4 | 2.098 | 8.1~10 | 52.118 | ||
| 5 | 1.111 | 10.1~12 | 7.775 | ||
| 6 | 0.946 | 32 GDP | 0~2 | 3.826 | |
| 13 Hospitalization | 0 | 78.322 | 2.1~4 | 41.999 | |
| 1 | 21.678 | 4.1~6 | 31.88 | ||
| 14 Headache | 0 | 65.405 | 6.1~8 | 17.688 | |
| 1 | 34.595 | 8.1~10 | 4.607 | ||
| 15 Shoulder pain | 0 | 69.107 | |||
| 1 | 30.893 | ||||
| 16 Arm pain | 0 | 73.797 | |||
| 1 | 26.203 | ||||
| 17 Back pain | 0 | 56.355 | |||
| 1 | 43.645 | ||||
| 18 Leg pain | 0 | 64.665 | |||
| 1 | 35.335 | ||||
| 19 Hip fracture | 0 | 99.095 | |||
| 1 | 0.905 | ||||
All of the analyses are implemented in Python 3.7.0. The flowchart of the study design is shown in Fig. 1. Firstly, this paper organized the data filtered from the CHARLS-2020 database and converted the data into a format suitable for model training. Secondly, the dataset was divided using simple random sampling, with 70% allocated to the training set and 30% to the test set.
Subsequently, this paper employed two feature screening methods to filter out variables with minimal influence on the target variable. The first method was Recursive Feature Elimination (RFE), implemented using four tree-based models: RF, Extreme Gradient Boosting (XGB), LGBM, and Gradient Boosting Machine (GBM). The advantage of using tree-based models for RFE lies in their ability to automatically assess feature importance and progressively eliminate redundant features, thereby retaining the most discriminative feature subset while enhancing the computational efficiency of feature selection [42,43]. Then, Least Absolute Shrinkage and Selection Operator (LASSO) was applied to further screen the meaningful predictors, using 5-fold cross-validation to determine the optimal penalty parameter, ultimately identifying the optimal features.
Furthermore, to validate the statistical significance of the distribution differences in the selected features between the depression and non-depression groups, the Mann-Whitney U test (WRS) was employed. And then, 8 machine learning models were constructed, including RF, XGB, LGBM, GBM, SVM, K-Nearest Neighbor (KNN), Naive Bayes Classifier (NBC), and Logistic Regression (LR). To ensure that each machine learning algorithm achieves its optimal performance, a grid search strategy combined with 5-fold cross-validation was adopted for systematic hyperparameter tuning. Meanwhile, Accuracy, Sensitivity, Precision, Specificity, F1, Area the Under Receiver Operating Characteristic Curve (AUC), and Calibration Curve were selected to evaluate the model performance [44]. Among them, the Calibration Curve plays a crucial role in better diagnosis and interpretation in medical applications [45].
Finally, the SHAP (SHapley Additive exPlanations) value was employed to analyze the interpretability of the best-performing model [46]. SHAP value quantified the importance and direction of each feature’s contribution to depression prediction (positive values increased depression risk prediction; negative values decreased it). Nonlinear relationships and threshold effects were visualized using SHAP dependency plots. The operational principle of SHAP is shown as follows:
Among them,
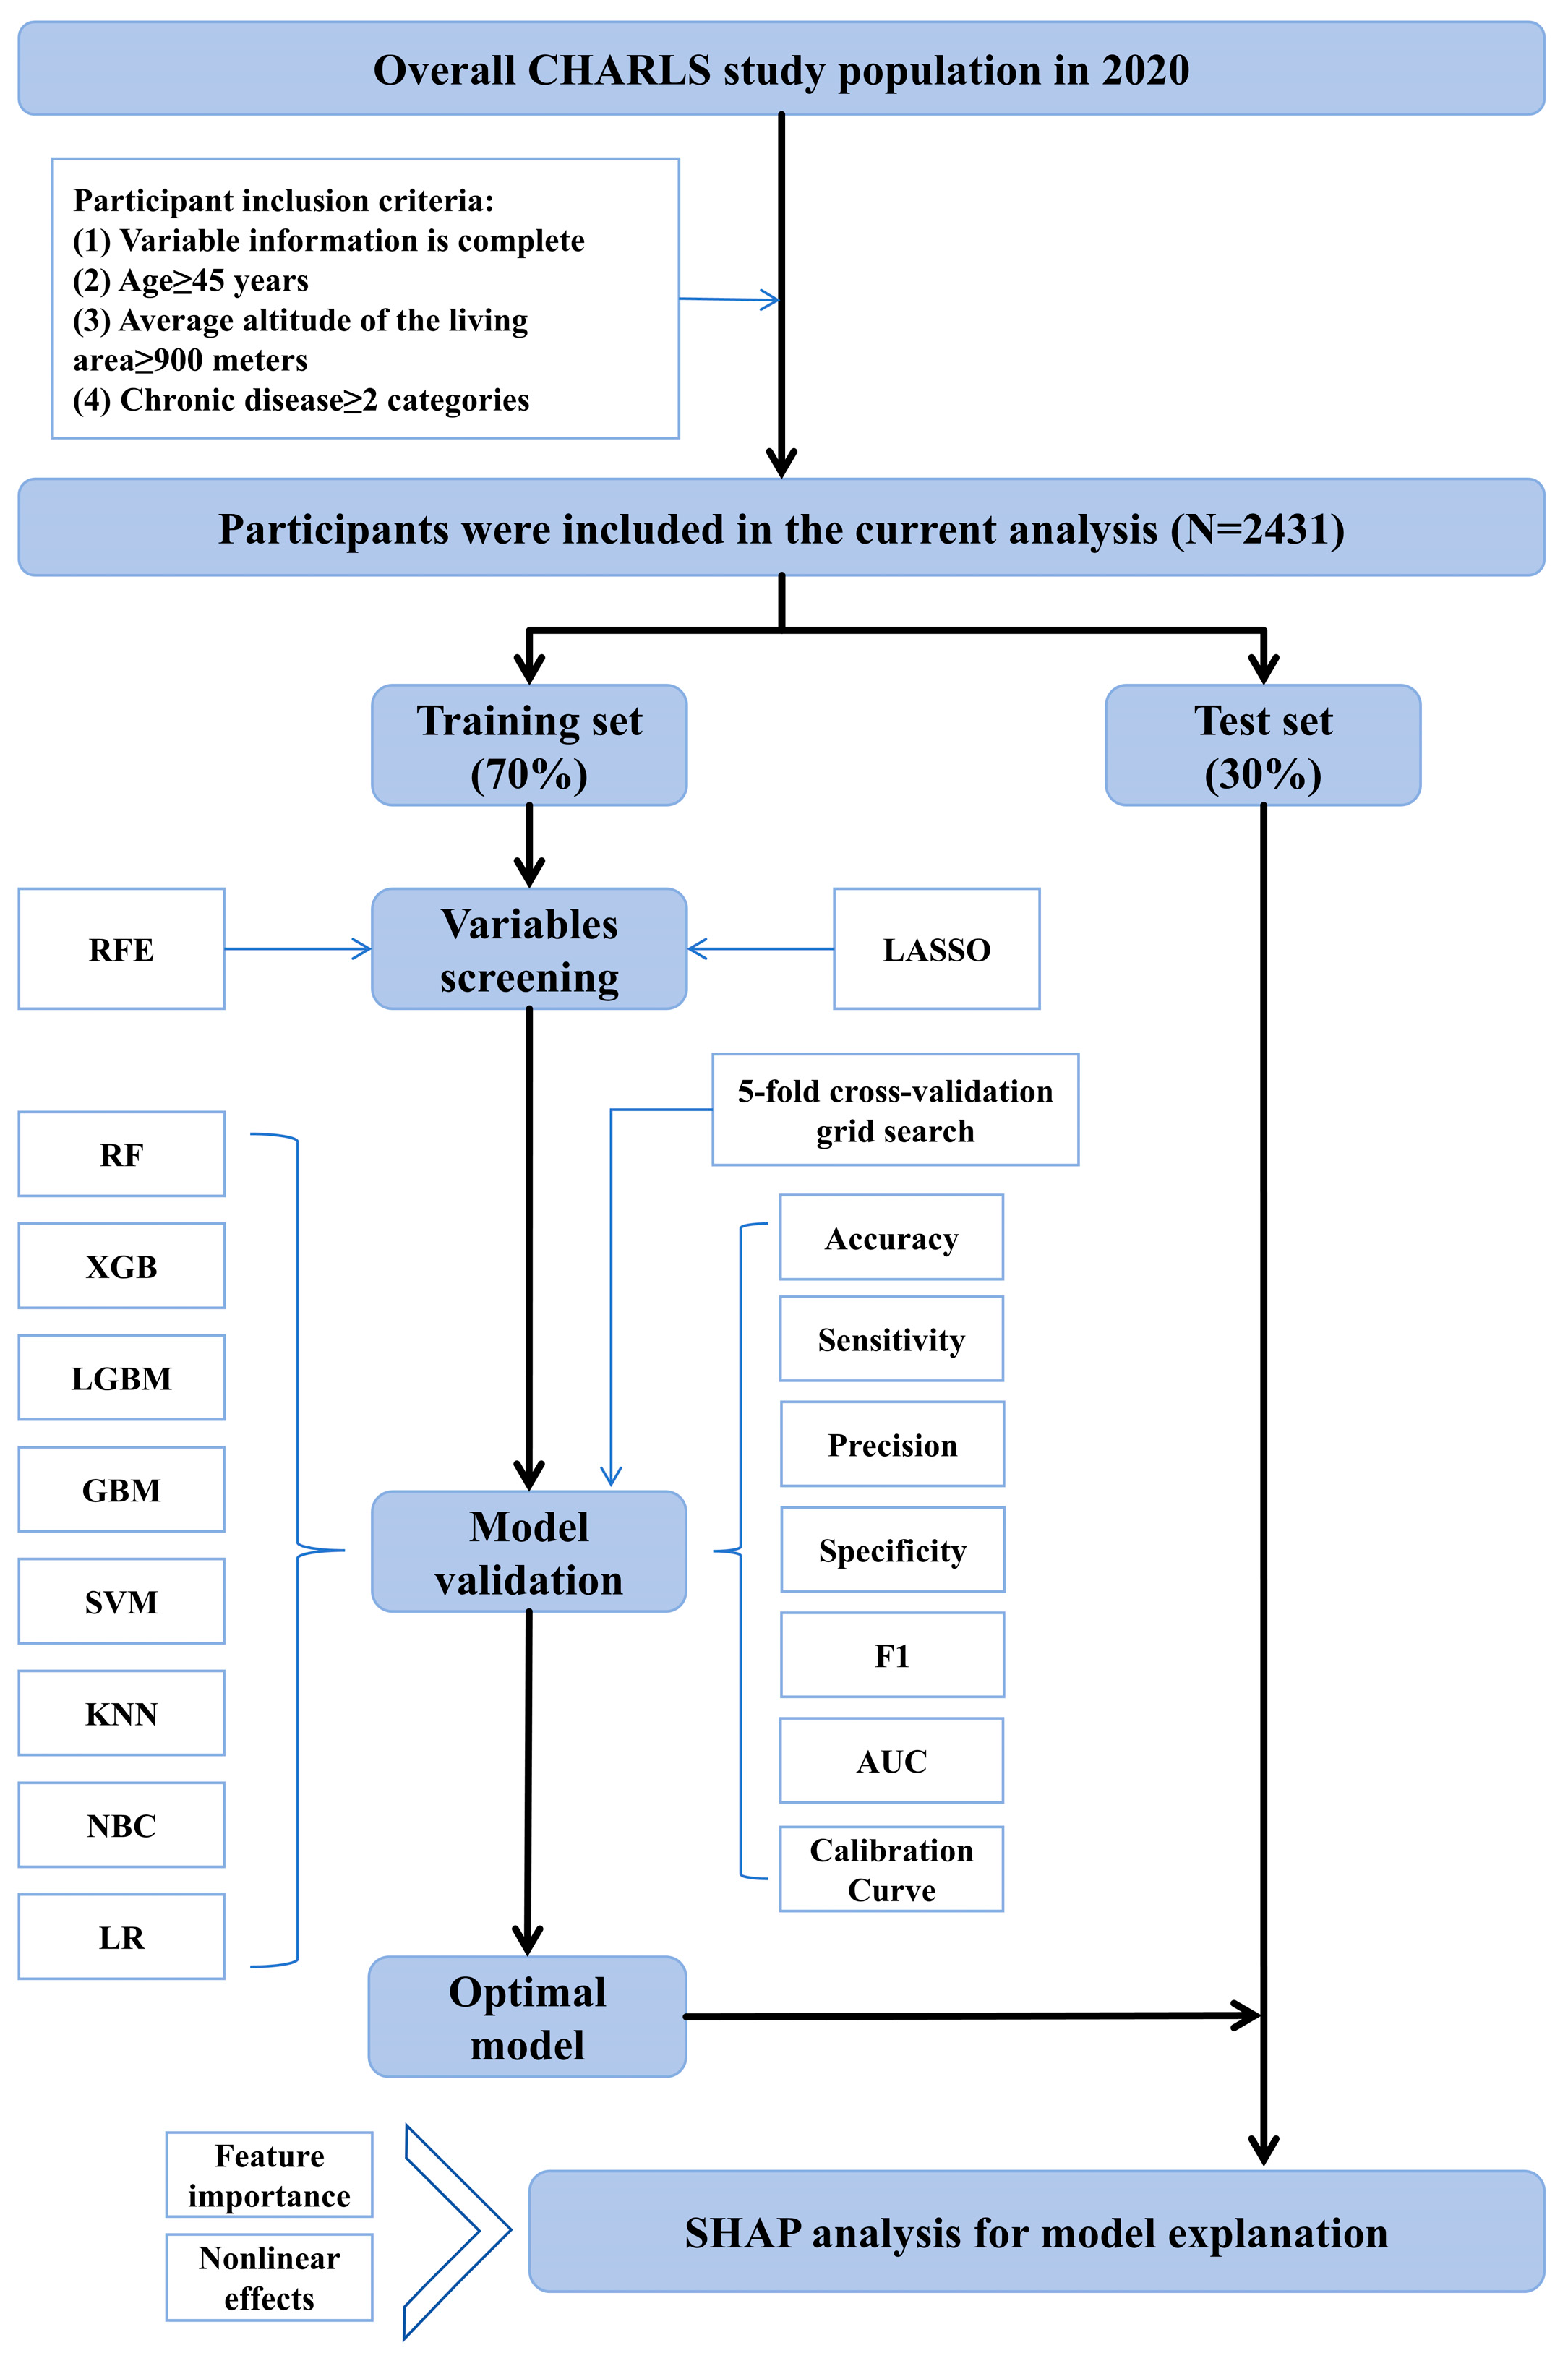
Figure 1: Flowchart of the study design. Note: RFE, recursive feature elimination; LASSO, least absolute shrinkage and selection operator; RF, random forest; XGB, extreme gradient boosting; LGBM, light gradient boosting machine; GBM, gradient boosting machine; SVM, support vector machine; KNN, K-nearest neighbor; NBC, naive bayes classifier; LR, logistic regression; AUC, area under receiver operating characteristic curve.
To identify variables most strongly associated with depression and improve the prediction accuracy of the model, two feature engineering methods were adopted in this paper. Firstly, to avoid the omission of key features due to the algorithmic preference of a single model, four classifiers (RF, XGB, LGBM, and GBM) were used to perform RFE independently, and the union of selected features was taken. According to Fig. 2, RFE based on the four types of tree models each screened out the top 10 feature variables. In total, 17 feature variables were retained. Next, this paper used LASSO to further screen meaningful feature variables. As shown in Fig. 3, the coefficients of some variables were gradually compressed to 0 as the value of λ increased, and the number of variables also decreased. In this paper, λ1se was chosen because it led to a stricter penalty [47], yielding a more concise set of predictors compared to λmin. Ultimately, a total of 8 variables were retained, namely Gender, Self-rated health, ADL, Life satisfaction, Headache, Leg pain, Education, and PM2.5.
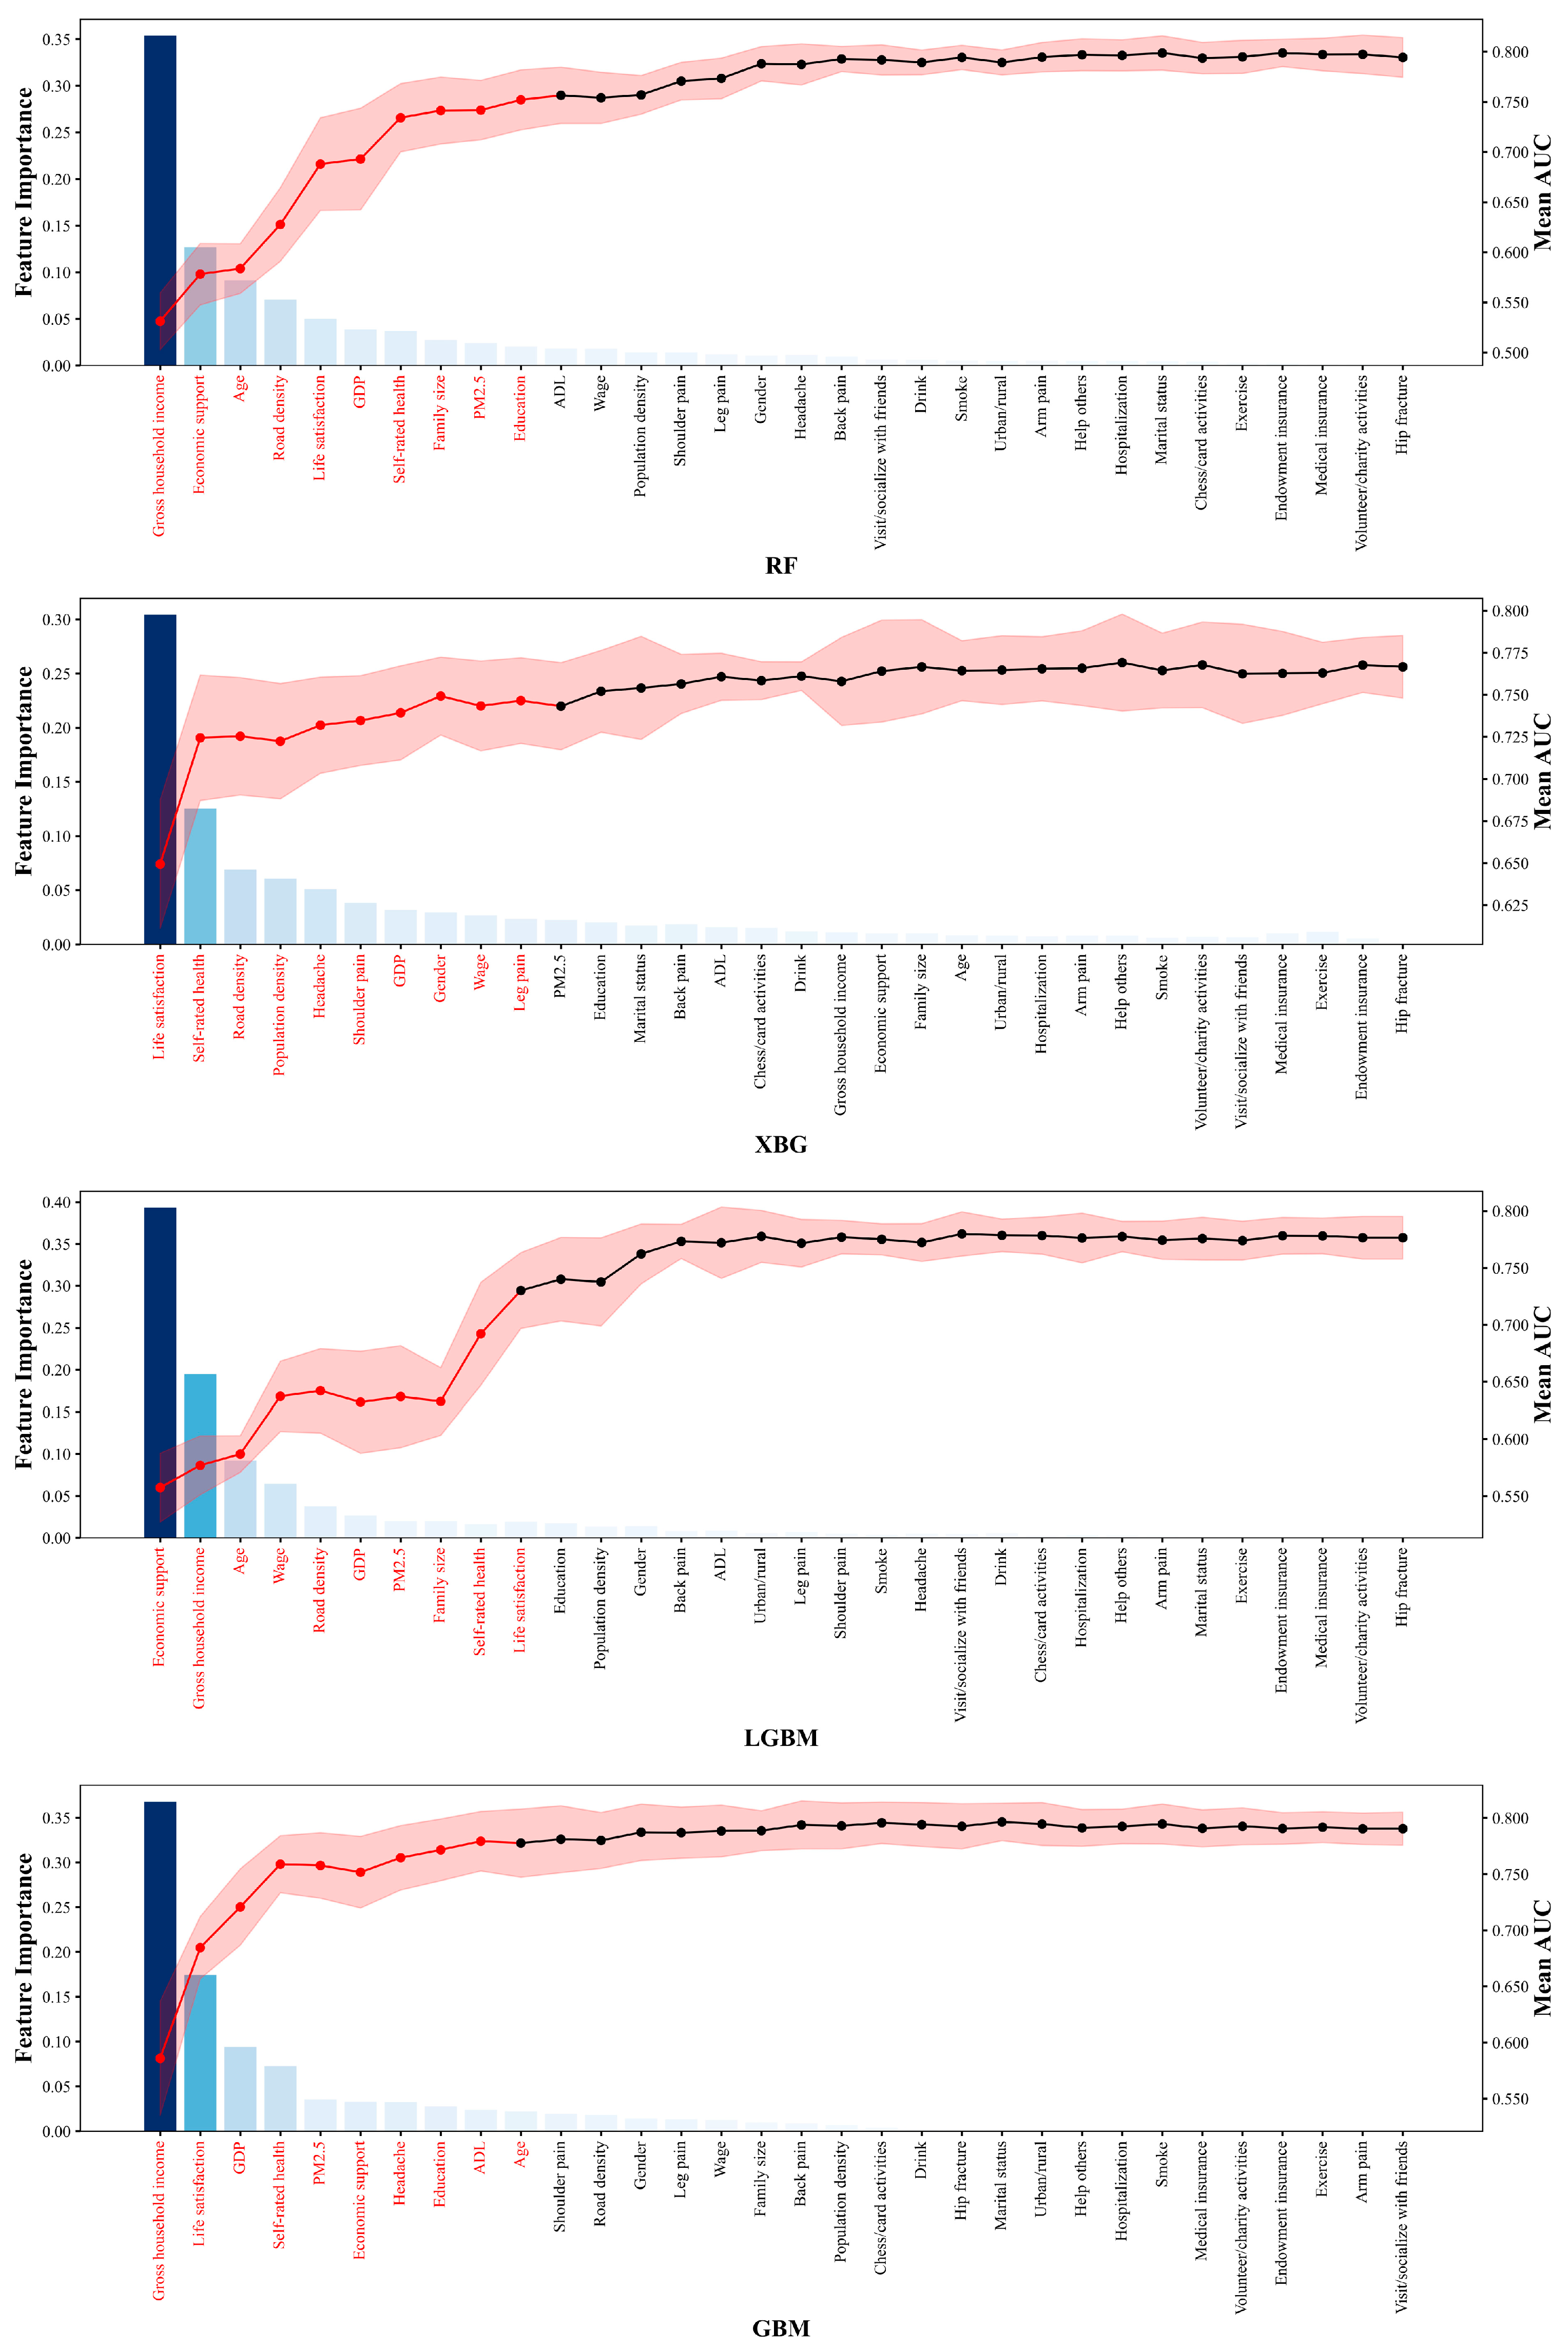
Figure 2: Results of recursive feature screening. Note: RF, random forest; XGB, extreme gradient boosting; LGBM, light gradient boosting machine; GBM, gradient boosting machine; AUC, area under receiver operating characteristic curve.
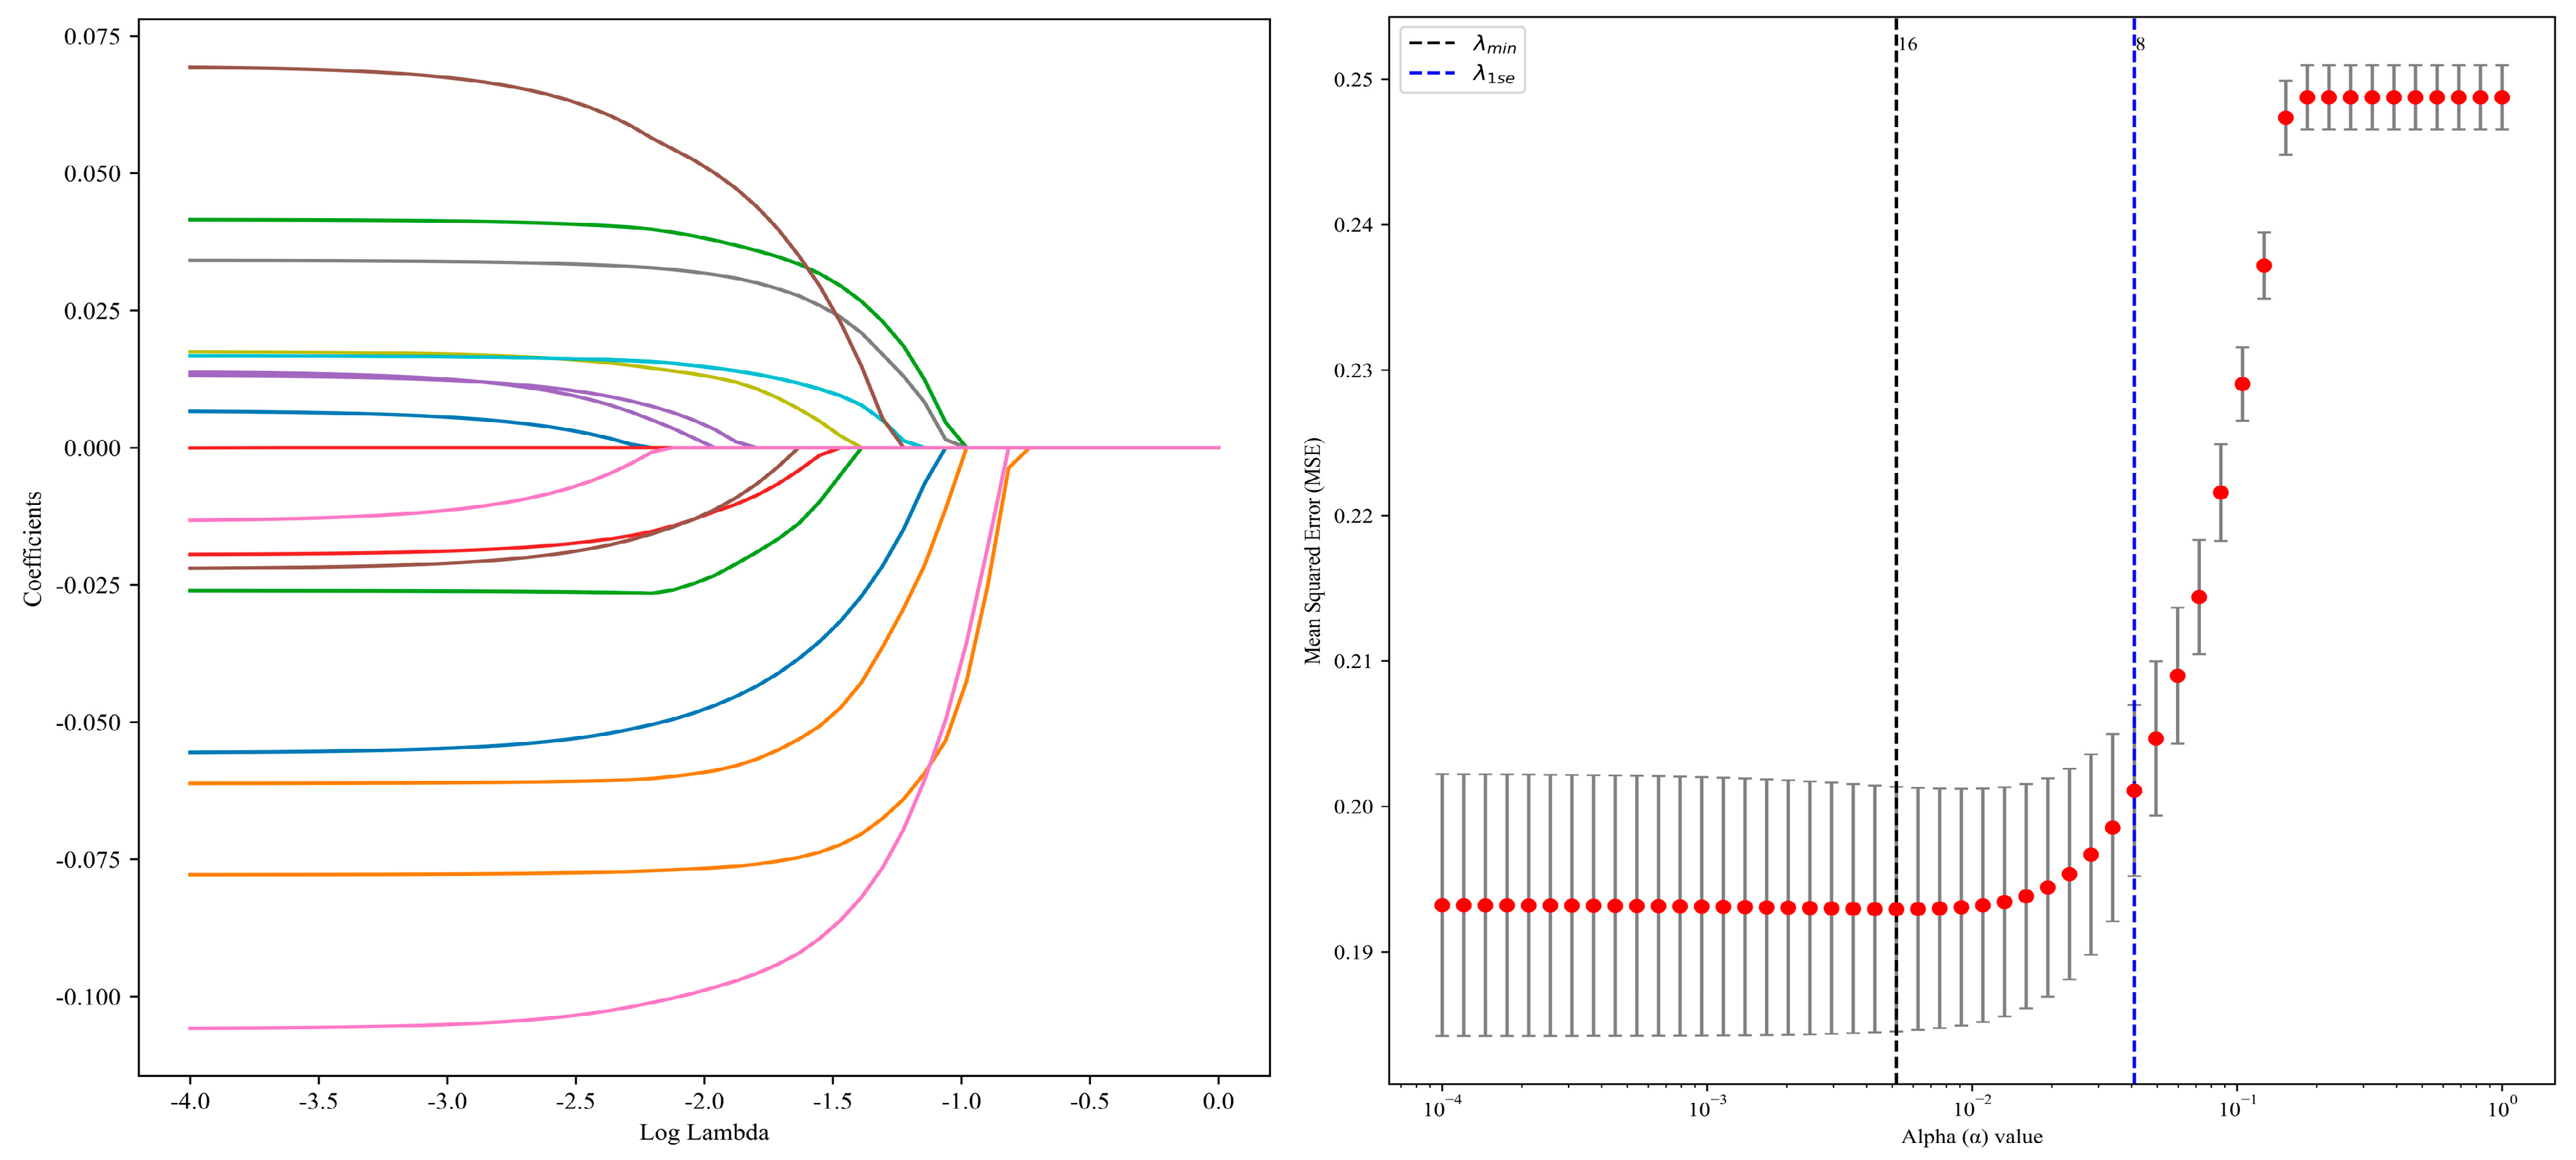
Figure 3: Variable selection using LASSO regression.
In addition, following previous studies [35], WRS was used to determine whether the differences in each important feature between the two groups were statistically significant. According to the results shown in Table 3, there were significant distribution differences between groups for all features. Specifically, in terms of subjective feelings, the self-rated health and life satisfaction reported by the non-depression group were significantly better than those of the depression group. On the contrary, in terms of physical symptoms and environmental exposure indicators, the depression group showed significantly higher levels of headache, leg pain, and PM2.5 exposure. ADL showed that the functional status of the non-depression group was significantly better. As for demographic characteristics, there are also significant differences between the two groups. The educational level of the depression group is relatively lower, and there are significant differences in gender distribution, indicating that the proportion of females is higher in the depression group. All differences were highly statistically significant. The Common Language Effect Size (CLES) and Rank-Biserial Correlation (RBC) further consistently confirmed the direction and intensity of the above differences, indicating a systematic association between depressive states and multi-dimensional health disadvantages as well as sociodemographic factors.
Table 3: Results of mann-whitney U.
| Feature | U Stat | p-Value | CLES | RBC |
|---|---|---|---|---|
| Self-rated health | 989,422 | 1.93 × 10−54 | 0.328 | −0.345 |
| Life satisfaction | 956,645 | 9.11 × 10−44 | 0.350 | −0.300 |
| ADL | 566,808.5 | 8.62 × 10−38 | 0.615 | 0.230 |
| Headache | 580,749 | 1.13 × 10⁻²⁷ | 0.605 | 0.211 |
| Leg pain | 581,285 | 3.06 × 10⁻²⁷ | 0.605 | 0.210 |
| Education | 908,873.5 | 1.14 × 10⁻²⁶ | 0.382 | −0.235 |
| Gender | 869,124 | 4.65 × 10⁻¹⁹ | 0.409 | −0.181 |
| PM2.5 | 626,484 | 2.09 × 10⁻¹⁰ | 0.574 | 0.149 |
The above 8 machine learning models were constructed based on the selected features and hyperparameter tuning was performed using grid search combined with 5-fold cross-validation. The grid search method ensures the search for the globally optimal hyperparameter combination within a given range by exhaustively traversing the predefined parameter space. Meanwhile, the 5-fold cross-validation uses stratified sampling to divide the data into complementary subsets, effectively reducing the risk of evaluation fluctuations caused by a single data division. Ultimately, the optimal hyperparameter configurations for each model on the training set were determined (Table 4).
Table 4: Hyperparameter settings for each machine learning model.
| Model | Hyperparameter Settings |
|---|---|
| RF | max_depth: 10, min_samples_split: 10, n_estimators: 50 |
| XGB | learning_rate: 0.1, max_depth: 3, n_estimators: 100 |
| LGBM | boosting_type: gbdt, learning_rate: 0.01, n_estimators: 200, num_leaves: 31 |
| GBM | learning_rate: 0.1, max_depth: 3, n_estimators: 100, subsample: 1.0 |
| SVM | C: 0.1, gamma: scale, kernel: rbf |
| KNN | n_neighbors: 10, p: 1, weights: uniform |
| NBC | var_smoothing: 1 × 10⁻⁹ |
| LR | C: 0.1, penalty: l2, solver: lbfgs |
Subsequently, the Receiver Operating Characteristic Curve and Calibration Curve were plotted respectively on the test set, and the corresponding confidence intervals were calculated. As can be seen from Fig. 4 and Fig. 5, tree-based models yielded the highest AUC values, with RF performing best and GBM ranking third. Regarding Calibration Curves, XGB and LR demonstrated the best fit, followed closely by GBM. Meanwhile, the results in Table 5 showed that GBM achieved the highest Accuracy, Sensitivity, and F1, with values of 0.7137, 0.6550, and 0.6819, respectively. Although NBC achieved the best results in one specific performance indicator, namely Precision, GBM also performed well, ranking second with a value of 0.7111. In terms of the Specificity indicator, KNN performed the best, while GBM ranked fourth. Overall, based on a comprehensive comparison across all evaluation metrics, GBM outperformed the other 7 models, and therefore it was chosen as the benchmark machine learning model to be combined with the SHAP value to accurately predict the depression risk among MOG with chronic diseases in high-altitude regions of China.
Table 5: Comparison of the performance of eight machine learning models.
| Indicator | RF | XGB | LGBM | GBM | KNN | NBC | SVM | LR |
|---|---|---|---|---|---|---|---|---|
| Accuracy | 0.6959 | 0.7110 | 0.6986 | 0.7137 | 0.6795 | 0.7000 | 0.7014 | 0.6959 |
| Sensitivity | 0.6287 | 0.6462 | 0.6316 | 0.6550 | 0.5409 | 0.5936 | 0.6462 | 0.6316 |
| Precision | 0.6935 | 0.7106 | 0.6968 | 0.7111 | 0.7061 | 0.7173 | 0.6950 | 0.6923 |
| Specificity | 0.7552 | 0.7680 | 0.7577 | 0.7655 | 0.8015 | 0.7938 | 0.7500 | 0.7526 |
| F1 | 0.6595 | 0.6769 | 0.6626 | 0.6819 | 0.6126 | 0.6496 | 0.6697 | 0.6606 |
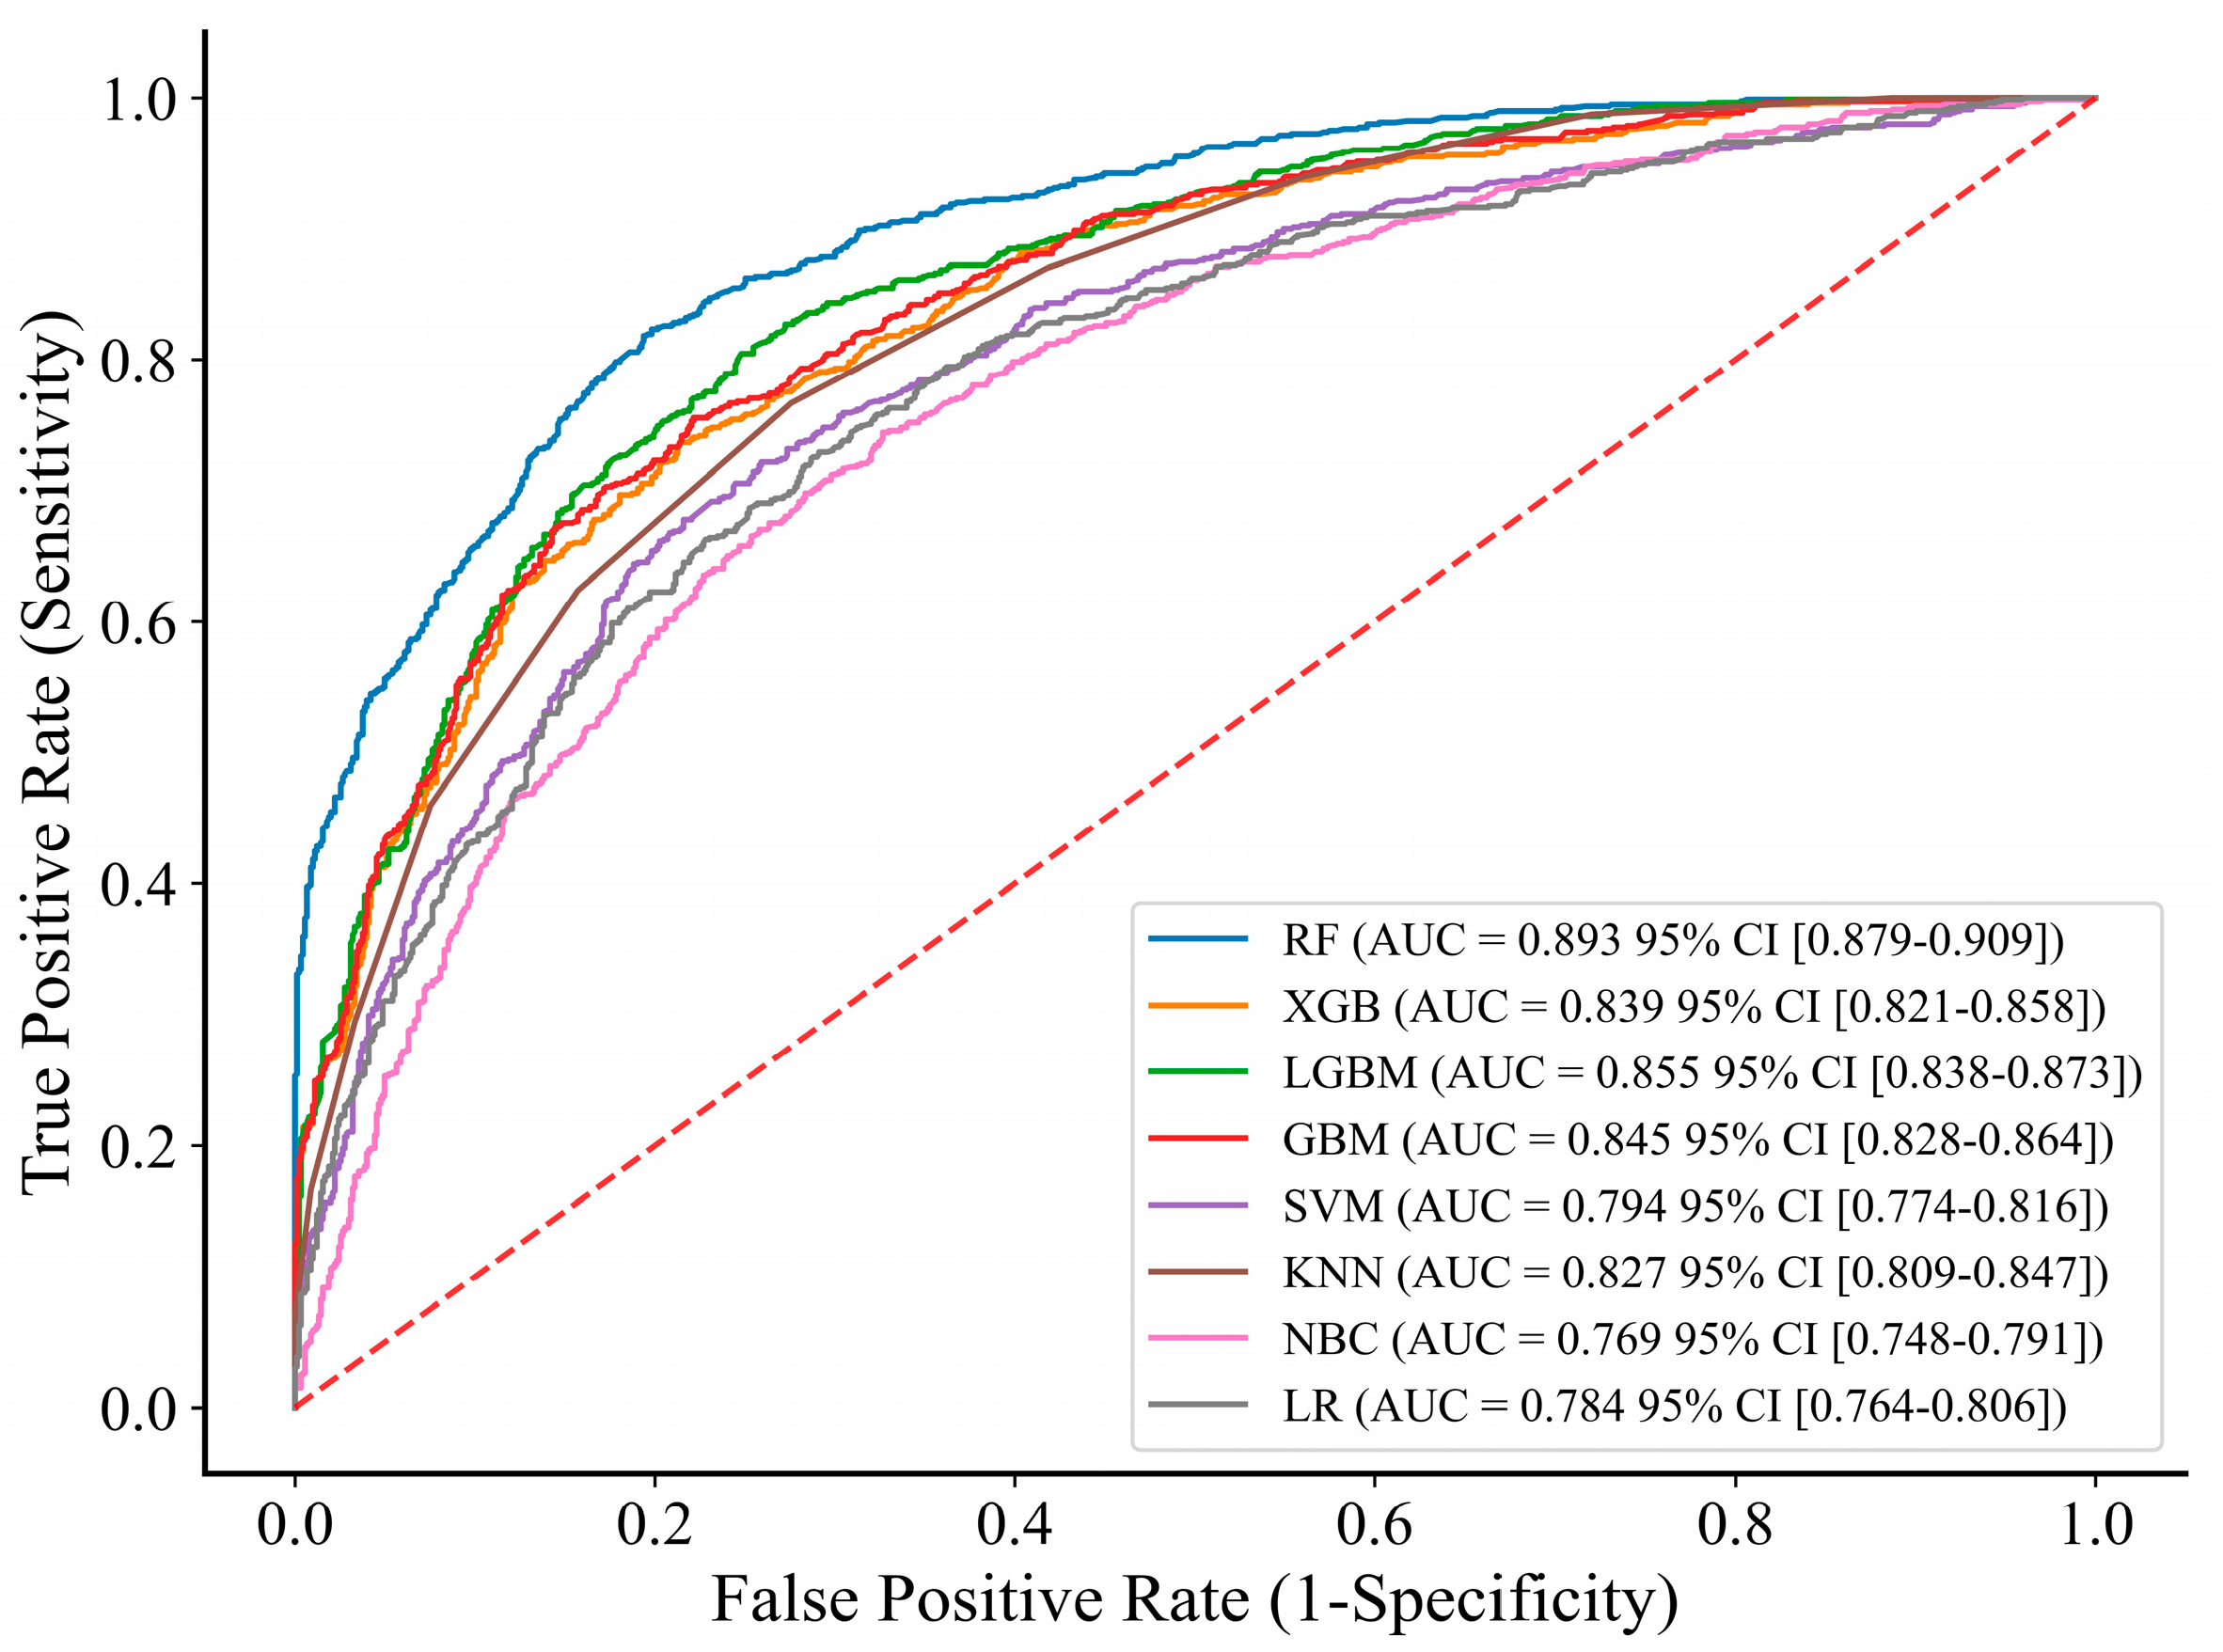
Figure 4: Receiver operating characteristic curve of 8 machine learning models. Note: RF, random forest; XGB, extreme gradient boosting; LGBM, light gradient boosting machine; GBM, gradient boosting machine; SVM, support vector machine; KNN, K-nearest neighbor; NBC, naive bayes classifier; LR, logistic regression; CI, confidence interval.
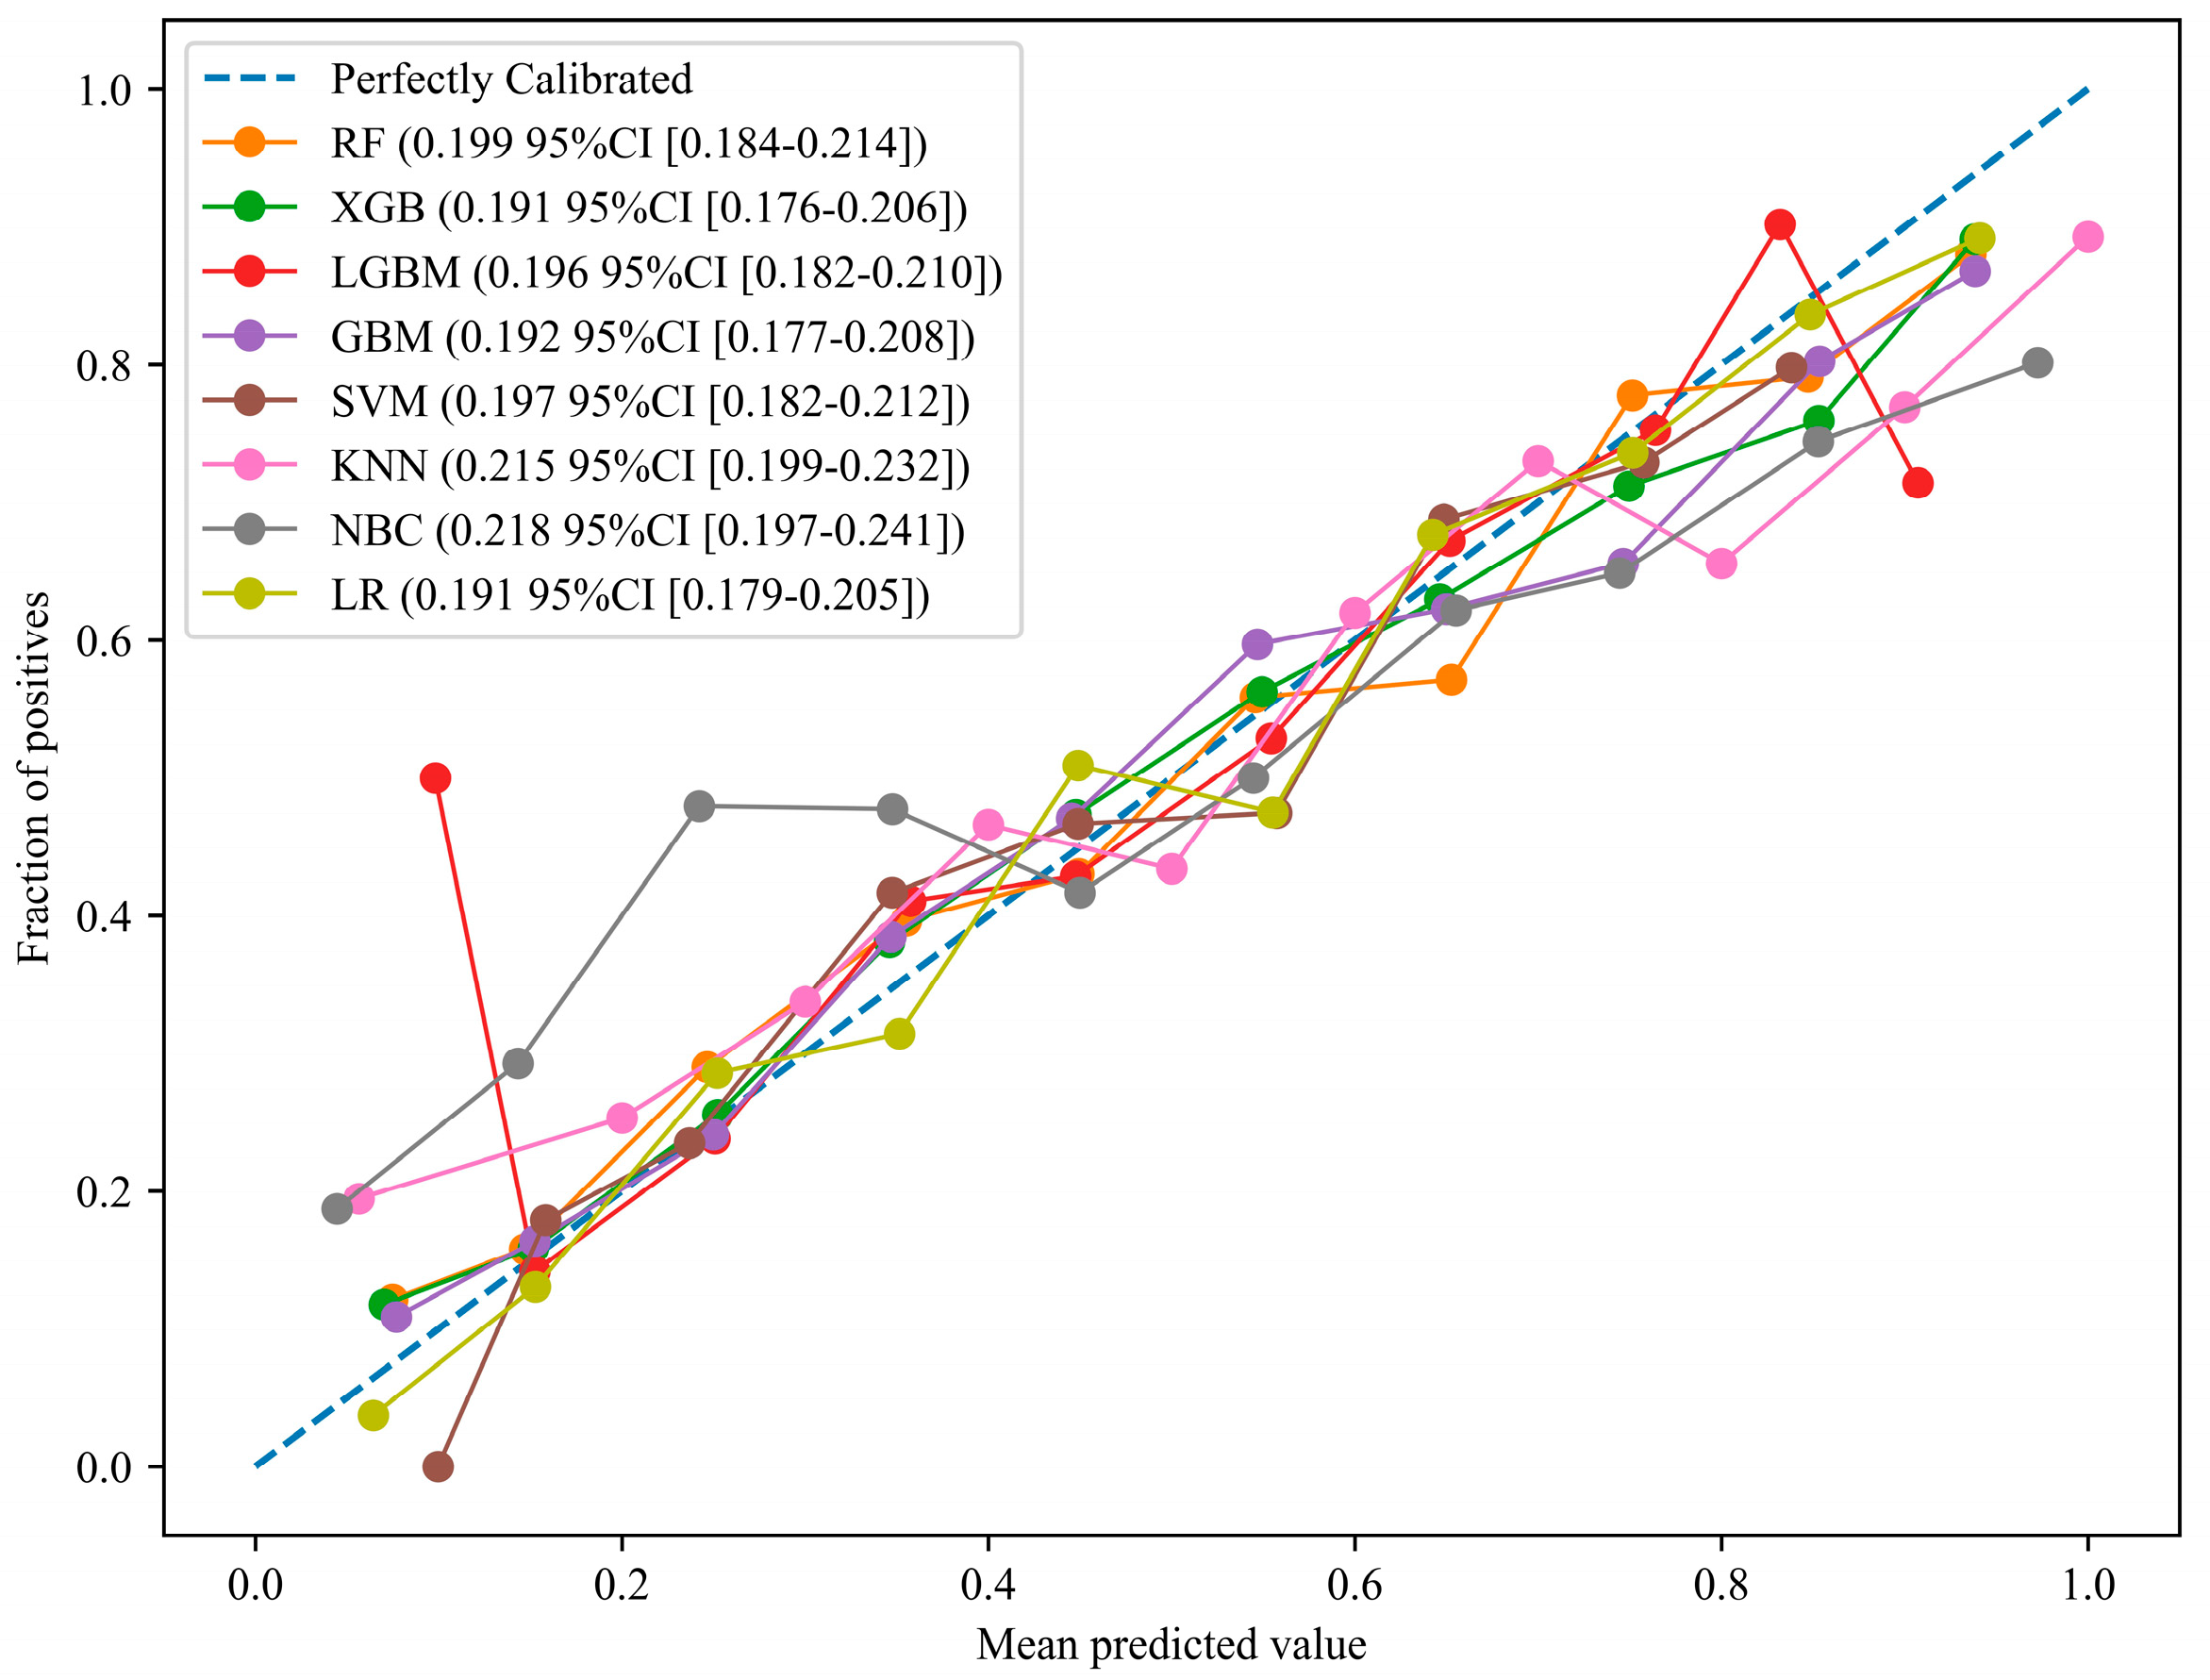
Figure 5: Calibration Curves of 8 machine learning models. Note: RF, random forest; XGB, extreme gradient boosting; LGBM, light gradient boosting machine; GBM, gradient boosting machine; SVM, support vector machine; KNN, K-nearest neighbor; NBC, naive bayes classifier; LR, logistic regression; CI, confidence interval.
The SHAP value quantified the extent to which each feature variable contributed to the model’s prediction results. Based on the mean |SHAP value|, this paper calculated the overall contribution degree of each alternative predictor variable to the model prediction results (see Fig. 6). It can be seen that the contribution of Life satisfaction is the most significant, accounting for 18.90% of the overall feature influence. The exposure level of PM2.5 followed closely, with a contribution rate of 16.87%. self-rated health showed the third most significant influence, accounting for 15.33%, while the influence of Education was slightly lower, accounting for 14.59%. In contrast, the contribution of gender factors and physical symptoms were relatively weakened. Finally, the contribution rate of ADL was 7.86%, ranking last among the 8 examined variables. Overall, the ranked order of feature importance based on SHAP value was: Life satisfaction > PM2.5 > Self-rated health > Education > Gender > Headache > Leg pain > ADL. Among them, the contribution ratios of the top four variables each exceeded 10%, and there was a significant gap compared with the remaining four variables. Therefore, they were identified as the key factors influencing the depression risk among MOG with chronic diseases in high-altitude areas of China. In addition, the distribution of color dots allowed us to observe the direction of influence of each feature variable on the target variables (see Fig. 7). For continuous variables, the SHAP values of Life satisfaction, Self-rated health, and Education all exhibited a clear “left red, right blue” distribution, indicating that an increase in the values of these variables can help to reduce the risk of depression. Conversely, the SHAP values of PM2.5 and ADL showed a clear “left blue, right red” distribution, indicating that higher values of these two variables increased the risk of depression. In terms of the dichotomous variables, the risk of depression was higher among female and individuals reporting headache or leg pain.
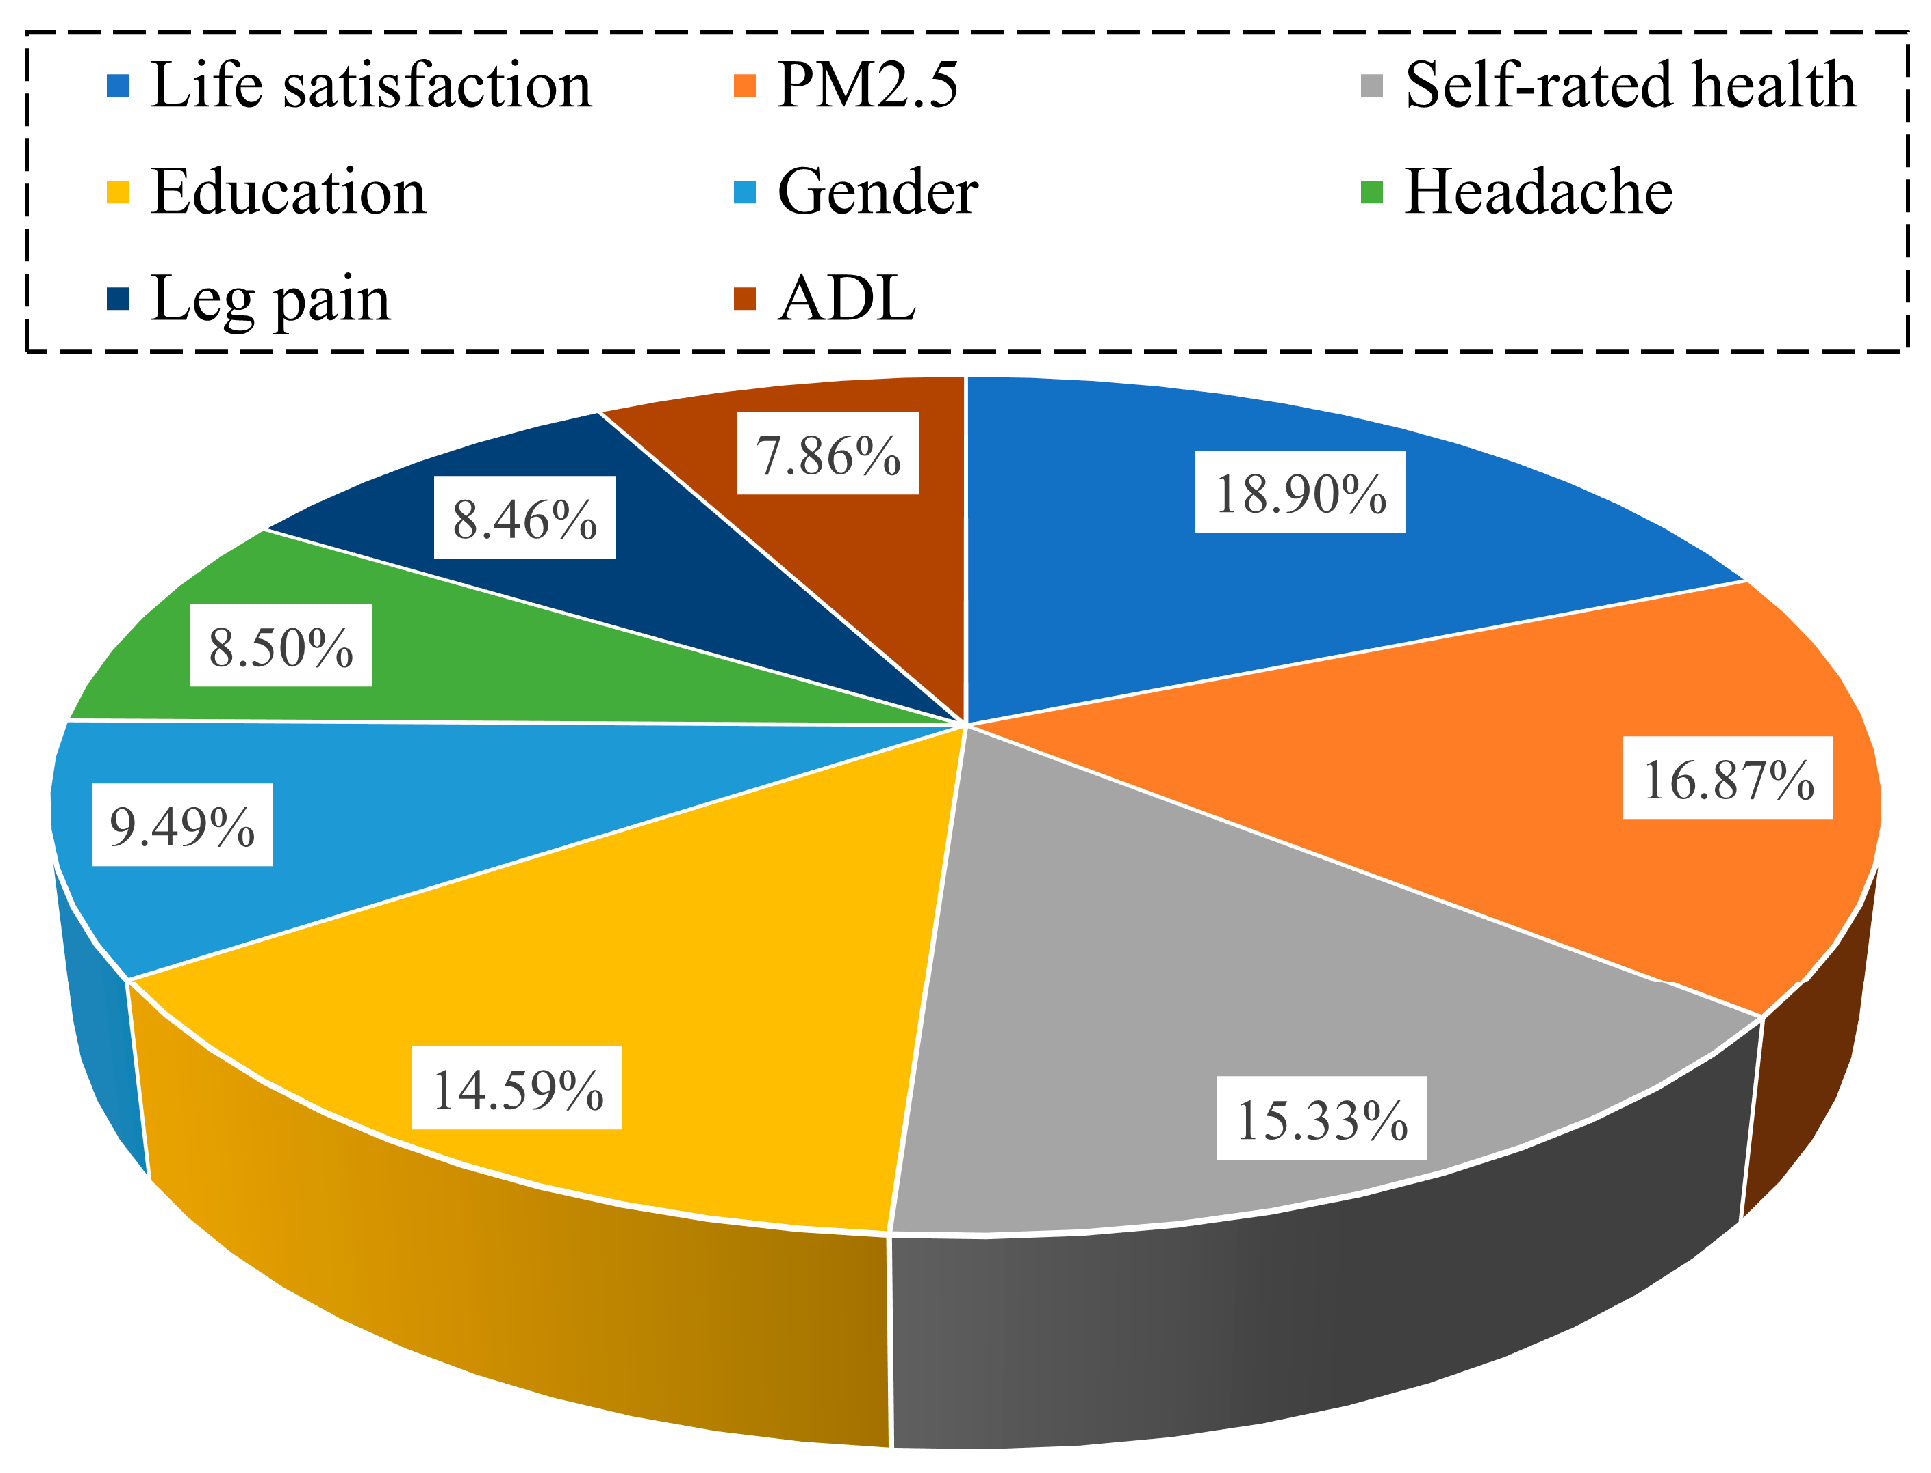
Figure 6: Proportion of feature importance of alternative predictor variables.
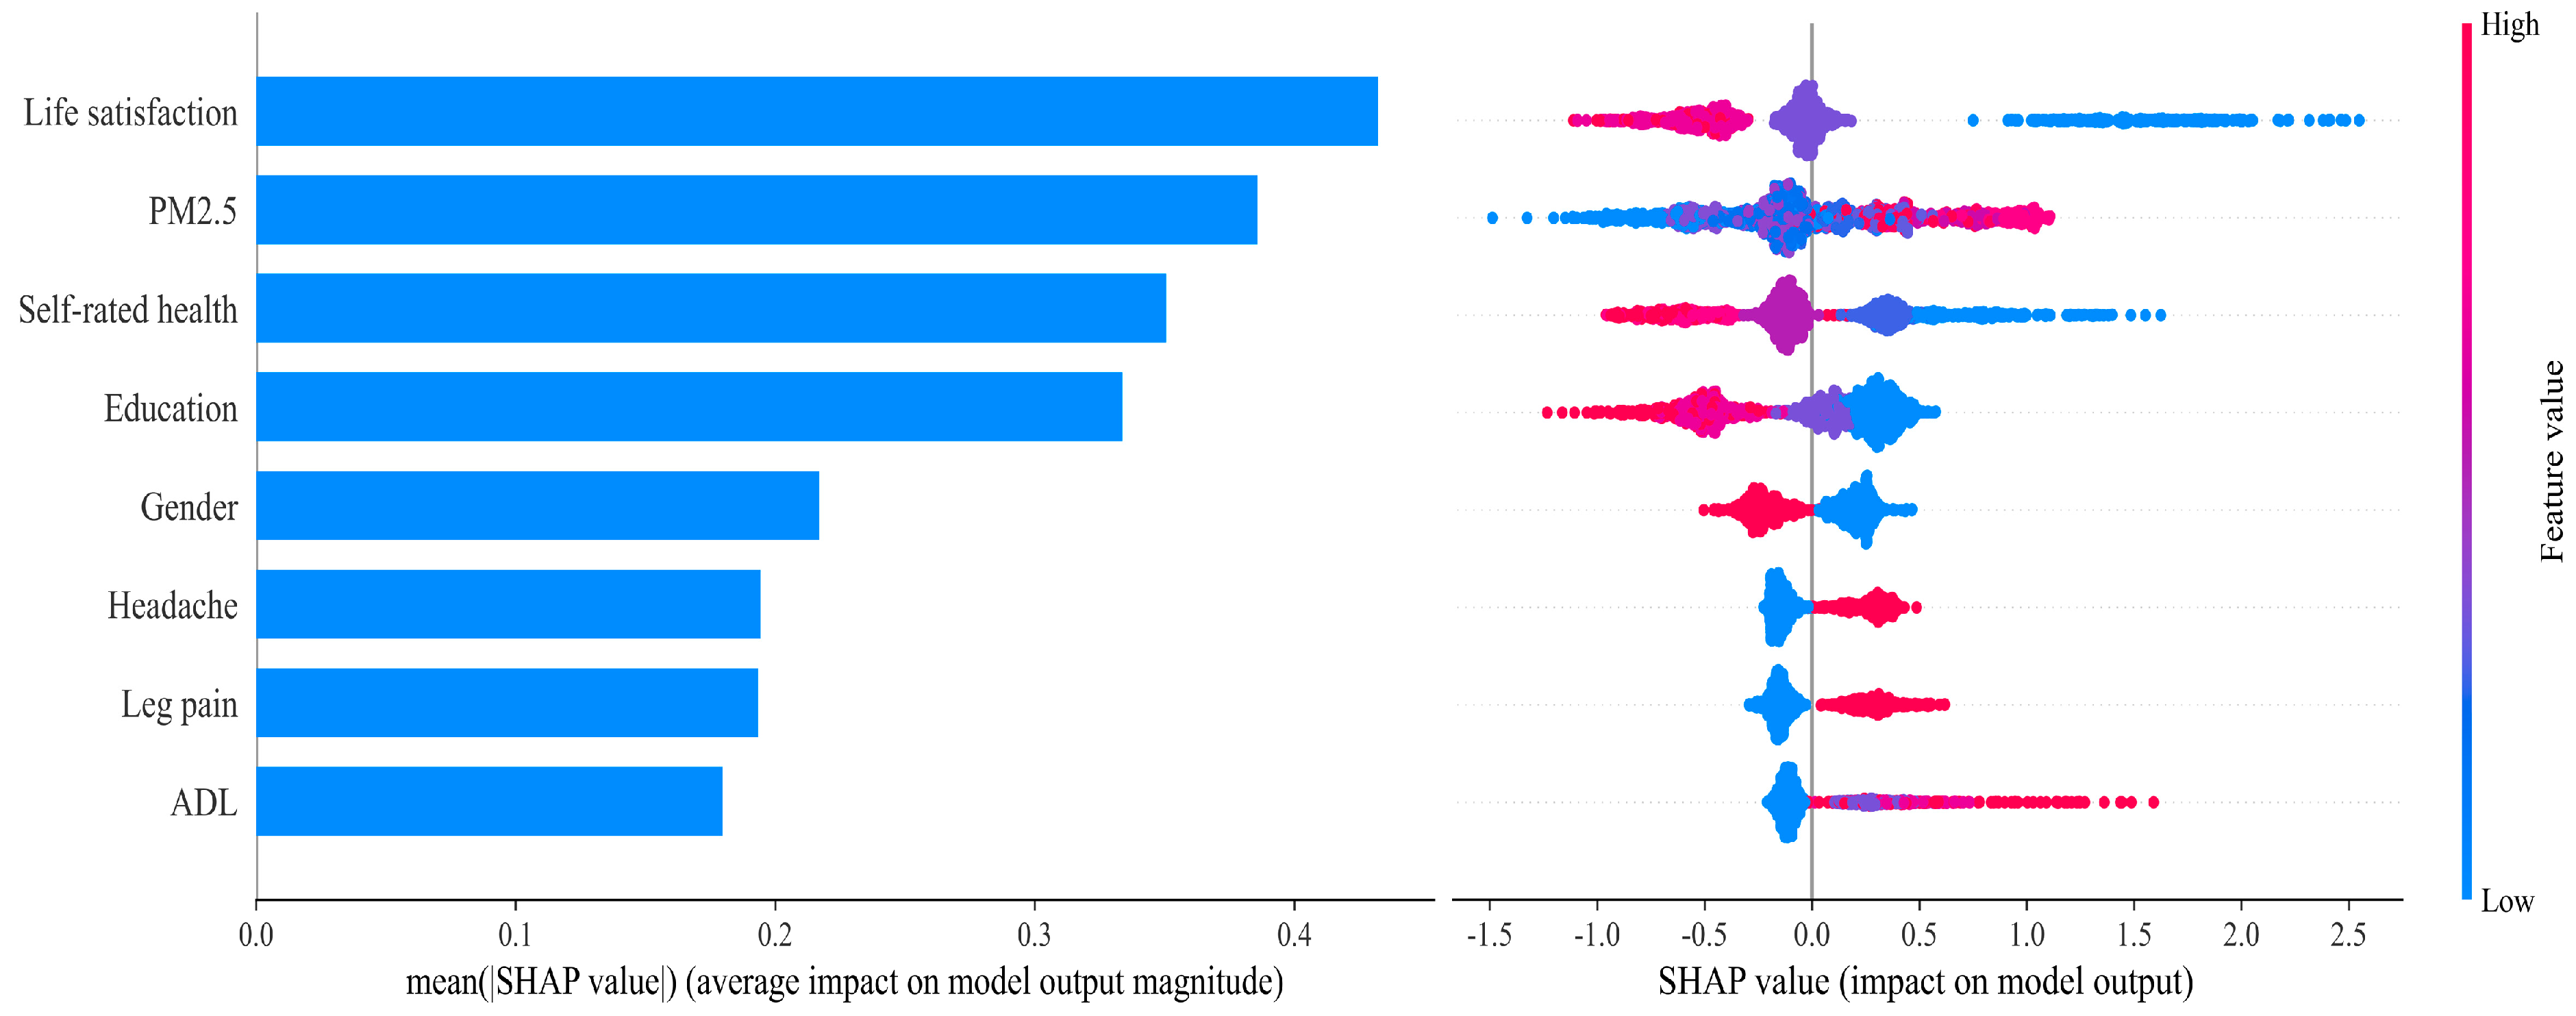
Figure 7: SHAP feature of alternative predictor variables.
This paper further produced a SHAP dependency plot of the 8 key factors to illustrate how varying values of each feature variable influence prediction outcomes (Fig. 8). In the plots, the horizontal axis represents the value range of the feature variable, while the SHAP value on the vertical axis indicates its impact on depression risk. A SHAP value greater than 0 implies an increased predicted risk of depression. It can be seen that when Life satisfaction reached a value of 3, its SHAP value shifted from positive to negative, suggesting a substantial reduction in depression risk beyond this threshold. Similarly, when the values of Self-rated health and Education were more than 3 and 2, respectively, the risk of depression in this group decreased significantly. In contrast, when the values of PM2.5 and ADL reached 30 and 1, respectively, the risk of depression increased sharply. Moreover, females exhibited a higher predicted depression risk compared to males. Individuals experiencing headache or leg pain also showed elevated risk levels.
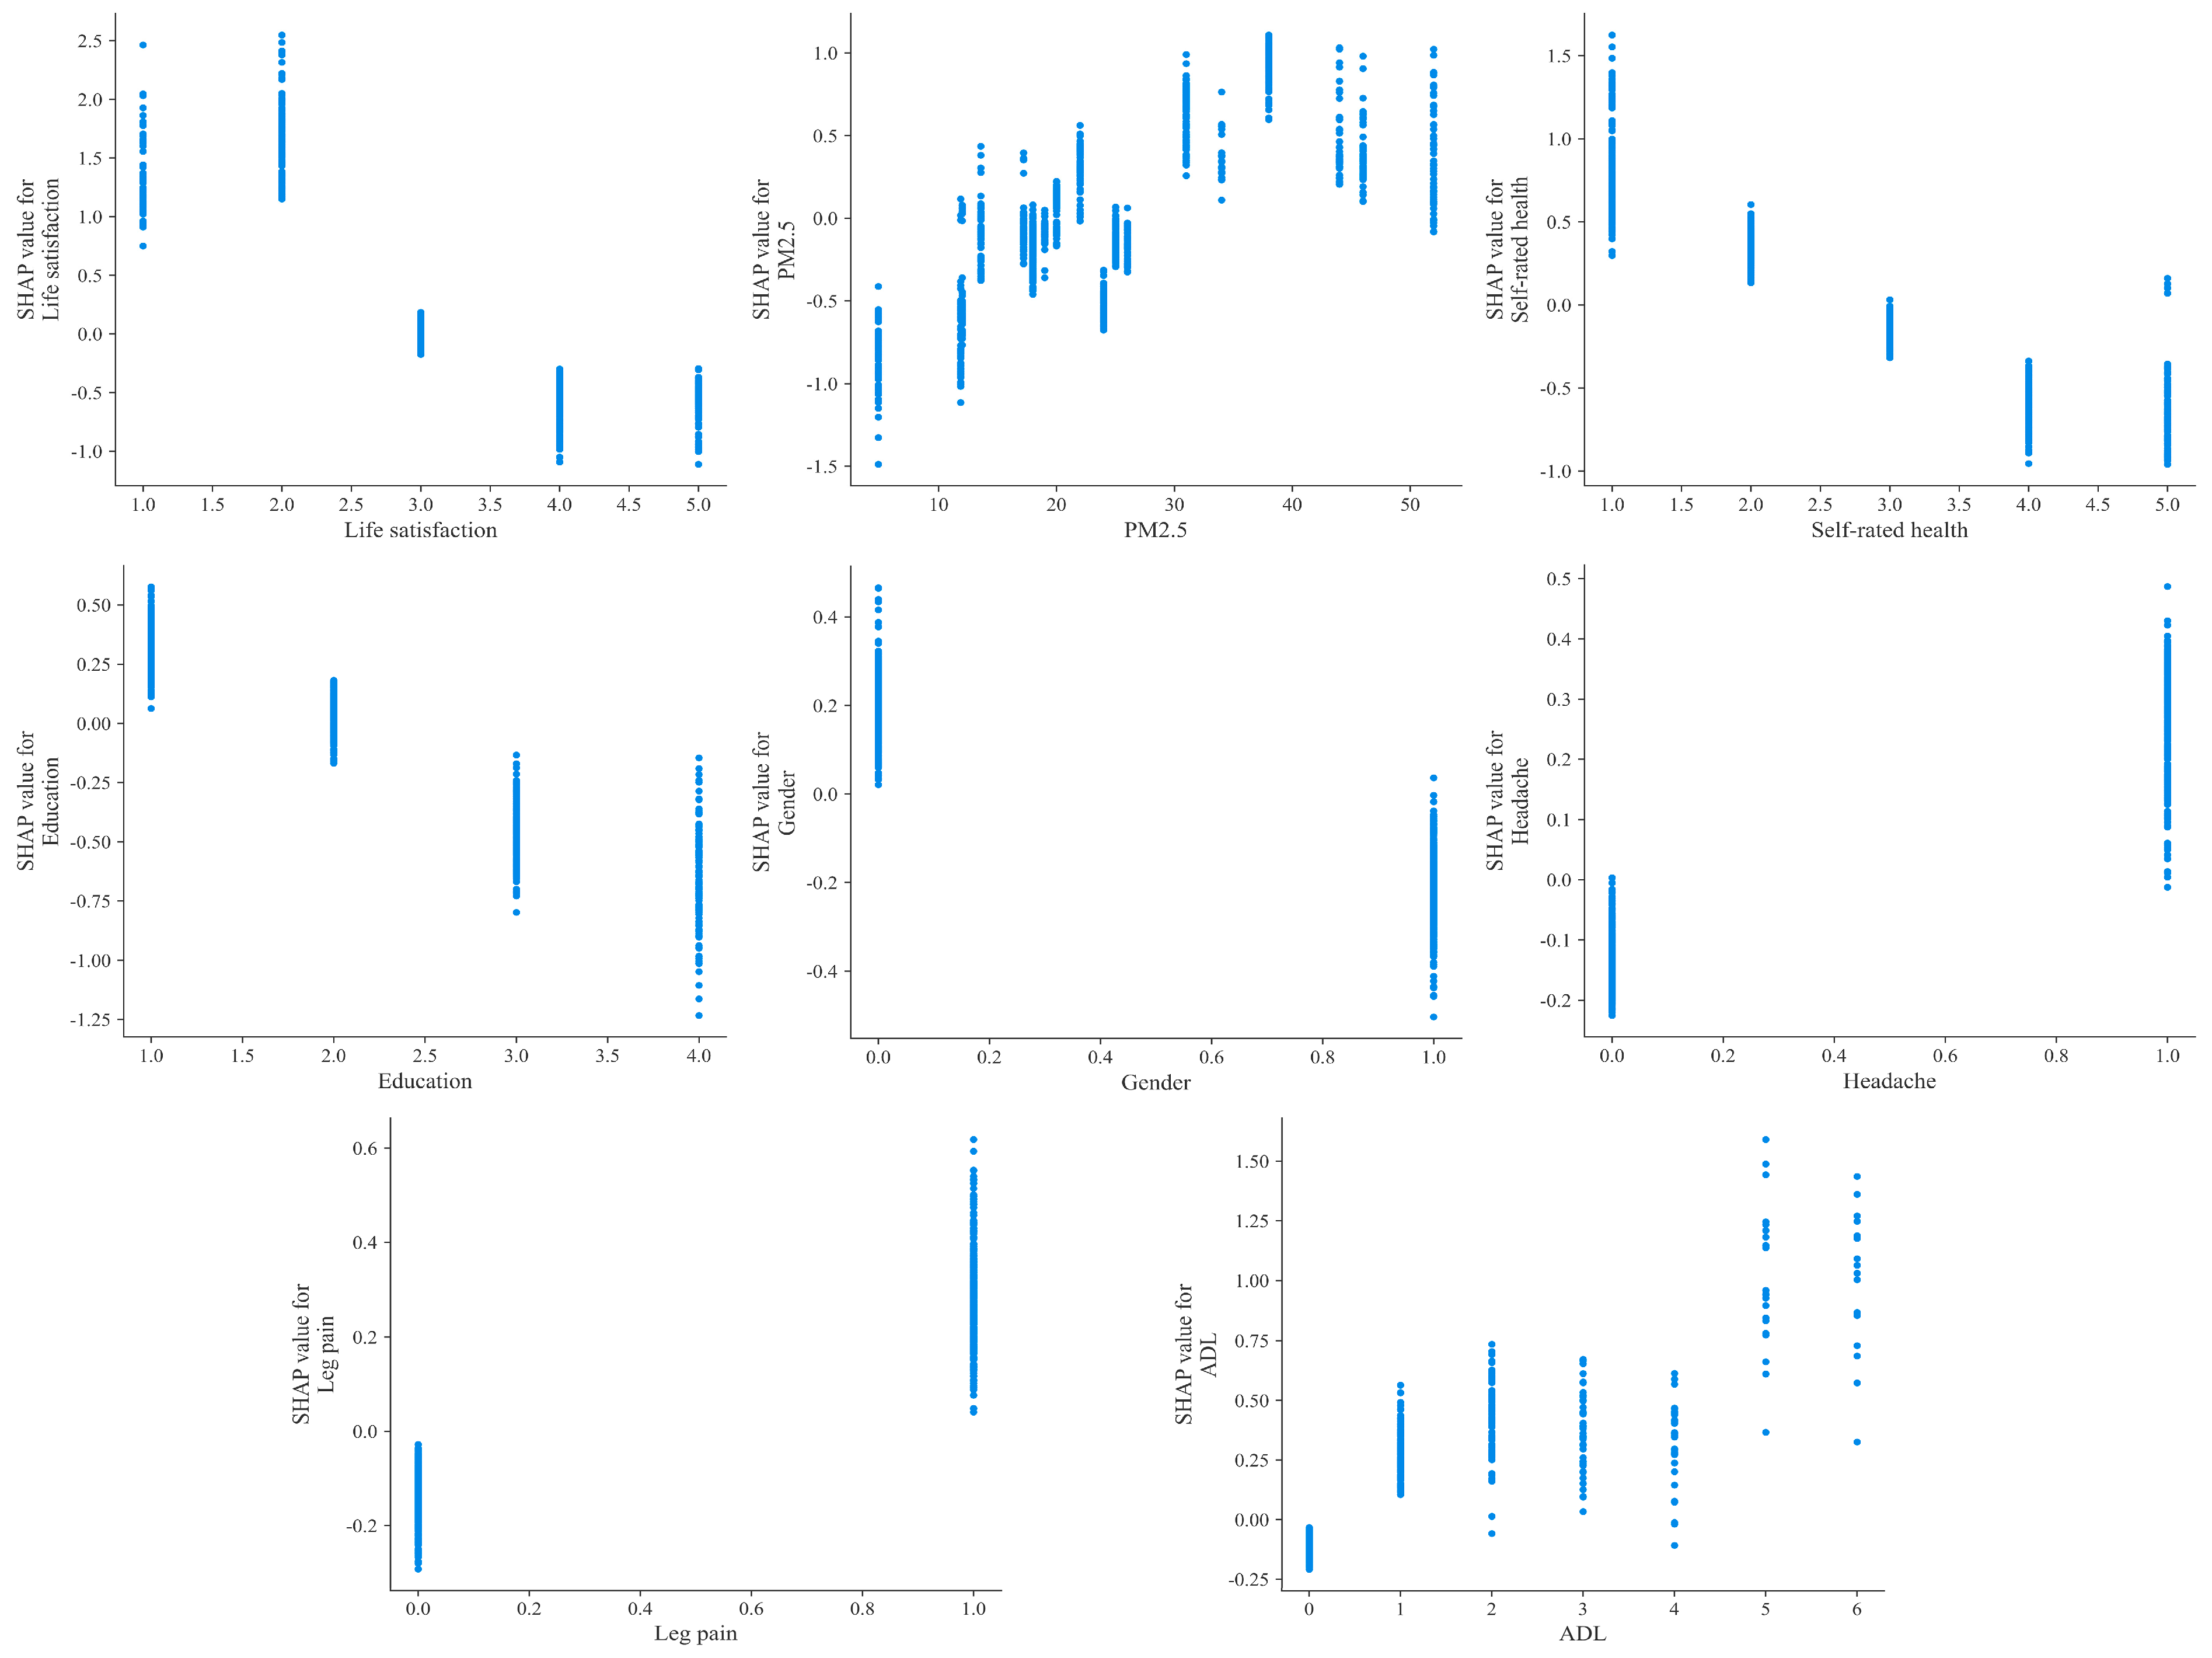
Figure 8: SHAP dependency plot for alternative predictor variables.
The increasing burden of depression among MOG with chronic diseases in high-altitude regions presents a multifaceted public health challenge. This challenge is shaped by the interplay of unique environmental and socioeconomic conditions. High-altitude areas are characterized by chronic hypoxia, extreme temperature fluctuations, and intense ultraviolet radiation. These factors impose physiological stressors that can exacerbate chronic conditions such as cardiovascular disorders and respiratory ailments [24]. These environmental adversities are further compounded by socioeconomic vulnerabilities, including limited healthcare infrastructure, geographic isolation which reduces access to mental health services, and cultural barriers that often stigmatize psychological distress [48,49]. Despite growing evidence linking altitude and mental health, existing studies have predominantly focused on general populations or single disease entities [21,22]. This narrow focus has neglected the synergistic effects of chronic diseases, environmental stressors, and sociocultural disparities in high-risk subgroups. This gap underscores the urgency of context-specific research to address the compounded risks faced by MOG in high-altitude China. By integrating geographic, clinical, and psychosocial predictors into a unified predictive model, our study advances a holistic understanding of depression determinants in these vulnerable populations. It also offers a scalable framework for other regions worldwide grappling with similar environmental and demographic challenges.
Studies have shown that machine learning models offer advantages over traditional statistical methods for risk prediction. In this study, we developed and validated eight machine learning models to predict depression risk among MOG with chronic diseases in China’s high-altitude areas. LR was previously considered a standard method for binary classification [50]. However, from our evaluation and comparison of model performance, GBM performed optimally overall and outperformed LR on most metrics. One likely reason is that LR is constrained by assumptions of normality and linearity, which limit its ability to capture the nonlinear and complex interactions between variables [44]. In contrast, GBM is an ensemble learning algorithm that iteratively trains multiple weak learners (e.g., decision trees) and aggregates their outputs into a robust predictive model. This integrated approach can significantly improve prediction accuracy and stability [51]. In many practical applications, especially when dealing with complex nonlinear relationships and high-dimensional data, GBM often achieves better prediction results than other models [52], which aligns with the findings of this study. From the perspective of influencing factors, the selection of features or variables plays a critical role in model development. RFE and LASSO helped to identify 8 significant variables, which supported previous literatures on the demographic characteristics, daily lifestyle, individual health status, and regional characteristics of depression [7,8,9,53], emphasizing the reliability and relevance of the selected predictors. Further, from the machine learning predictions, Life satisfaction, PM2.5, Self-rated health, and Education were identified as the 4 key factors that could significantly influence the depression risk among MOG with chronic diseases at high-altitude areas in China. This is similar to the results of previous studies [40,54]. At the same time, this result also reveals the particularity of high-altitude areas.
It has been shown that positive life attitudes can buffer the negative effects of stressful events on mental health [55]. In China’s high-altitude areas, due to the relatively harsh natural environment and limited living conditions, MOG with chronic diseases face more challenges, and thus a strong psychological state can help them cope with both physical discomfort and living conditions. Studies have also found that long-term exposure to high levels of air pollution impairs the functioning of the human nervous system [56], and hinders daily physical activity and social contact among MOG [57], thus increasing the incidence of depression. Research further suggests that the unique geographical environment of high-altitude areas in China makes PM2.5 exposure positively correlated with the risk of influenza, and the elderly are more vulnerable [58]. While this study did not statistically test interaction effects between PM2.5 and altitude-related stressors, previous findings imply that such interactions may intensify both physical and mental health risks. Furthermore, individuals with higher levels of education tend to have richer knowledge and resources [59,60], making them more likely to adopt positive and effective coping strategies in the face of chronic diseases and life stress. In addition, subjective assessments of health reflect how individuals perceive their own physical well-being [61]. MOG with poorer self-rated health are more likely to experience negative emotions due to physical discomfort, thereby increasing their depression risk.
Although machine learning algorithms have demonstrated better performance than traditional regression methods, they are frequently criticized for a lack of transparency and interpretability [62]. To better understand the internal logic and decision rules behind the model predictions, another strength of this study is the use of SHAP value to interpret the best performing machine learning model to assess the contribution of alternative feature variables. The SHAP dependency plot helps to observe how each feature variable influences the output of the prediction model at different value levels. From the results, the changes in the values of the variables were not simply linear but exhibited threshold patterns that warrant further investigation. For example, once the value of Life satisfaction exceeds 2, the depression risk among MOG with chronic diseases in high-altitude areas of China declines significantly. Similar threshold effects were observed for Education, Self-rated health, and PM2.5, which could not be observed in the linear model [46]. These thresholds offer empirically-derived cut-off points that can be directly integrated into public health practice to enhance the precision and efficiency of mental health initiatives. For instance, the finding that life satisfaction scores below 3 are associated with a sharp increase in depression risk suggests that this value can serve as a critical indicator in community-based screening programs. Primary healthcare workers or community volunteers could incorporate brief assessments of life satisfaction into routine visits, with scores at or below this threshold triggering referrals for more comprehensive psychological evaluation or enrolment in supportive interventions. Similarly, the identified thresholds for self-rated health and education provide clear, actionable criteria for identifying individuals who may benefit from targeted support services. These thresholds enable a shift from generic screening approaches toward stratified prevention, where resources are directed to those who need them most based on transparent. Environmental monitoring represents another practical application of these findings. The association between PM2.5 concentrations exceeding 30 µg/m3 and elevated depression risk underscores the importance of integrating air quality data into public health planning. Local health authorities could establish alert systems that activate additional mental health outreach efforts during periods of high pollution, particularly targeting MOG with chronic conditions. Such an approach not only addresses the direct physiological effects of pollution but also mitigates its psychological impact by providing timely support and reinforcing coping mechanisms. Overall, the SHAP values used in this study provide a way to unlock the black box of machine learning models and improve their interpretability and transparency, which allows us to better understand the predictive results of the GBM model on the depression risk.
The depression risk among MOG with chronic diseases in high-altitude areas of China is shaped by multiple contributing factors. Constructing a prediction model tailored to this vulnerable group holds significant value in safeguarding their health and well-being. From the results of interpretable machine learning, a total of 4 alternative variables were identified as key factors influencing the risk of depression, and at the same time, there is a threshold effect of these variables on the output results. These findings provide empirical evidence for the adoption of early intervention measures.
- (1)Integrating mental health screening into routine primary care visits represents a practical first step. Community health workers, who are already present in these regions, could be trained to administer short, validated questionnaires focusing on key predictors identified in this study, such as life satisfaction and self-rated health. Individuals scoring below the established thresholds could then be referred to a limited but focused set of support services, such as structured peer-support groups co-facilitated by a trained community volunteer and a visiting mental health professional.
- (2)Environmental health interventions can be tailored to local realities. Given the strong association between PM2.5 levels and depression risk, local authorities could implement a simple, color-coded air quality alert system (e.g., using flags or social media announcements) that triggers specific community responses. On days with poor air quality, community centers could be opened to provide a cleaner indoor environment for vulnerable elders, and health workers could prioritize door-to-door check-ins for those with chronic respiratory or cardiovascular conditions, combining physical health monitoring with psychosocial support.
- (3)Collaboration with local non-governmental organizations could yield high-impact results. The educational focus should be on developing and disseminating accessible health literacy materials. This could involve using visual aids, radio broadcasts in local dialects, or interactive village workshops to teach practical skills for managing common chronic diseases, recognizing signs of emotional distress, and navigating available health and social services. Empowering MOG with this knowledge can build resilience and foster self-efficacy, which are critical protective factors against depression.
- (4)The most effective strategy will be one that combines these elements through a coordinated, cross-sectoral effort. Piloting an integrated program in a few selected counties that combines community-based screening, targeted outreach during environmental adversities, and practical health education would allow for the refinement of these approaches based on real-world feedback before scaling them across the broader region.
There are several limitations in this study. First, our operationalization of high altitude as ≥900 m, while justified by prior epidemiological studies on mental health and based on the demographic distribution of China’s plateau populations, may not fully capture the graded physiological stress associated with very high altitudes (e.g., >2500 m). Second, the CHARLS-2020 data are only cross-sectional and may not capture dynamic changes in variables over time. Meanwhile, there is no guarantee that all potential factors were included in this study. In addition, the machine learning models trained on CHARLS-2020 data may have reduced generalizability to populations outside China or to other time periods, particularly given possible changes in environmental or healthcare factors. “High altitude” was operationalized as ≥900 m, which may not fully capture physiological stress effects compared to very high altitudes (e.g., >2500 m). Last, although GBM performed the best among the 8 machine learning models, there is still room for improvement in the performance of the model. Therefore, future research can be carried out on the above aspects, so as to make a greater contribution to public health and psychological well-being.
The unique environmental pressure and limited social support in high-altitude areas of China exacerbate the psychological burden and depression risk among MOG with chronic diseases. Addressing this issue requires innovative approaches to identify high-risk populations and inform targeted interventions. In this study, the CHARLS-2020 dataset was used to screen 2431 subjects with complete information based on specific criteria. We found that the prevalence of depressive symptoms in this population was 46.89%. Then, RFE and LASSO were applied to screen the alternative 32 explanatory variables that might be related to depression, which in turn yielded 8 predictor variables to be included in the machine learning model. Meanwhile, a grid search strategy combined with 5-fold cross-validation was adopted for systematic hyperparameter tuning. Further, based on multiple evaluation metrics, GBM demonstrated superior predictive performance among the 8 machine learning models. Finally, the results of the SHAP value algorithm showed that Life satisfaction, PM2.5, Self-rated health, and Education were identified as the 4 key factors influencing the prevalence of depression among MOG with chronic diseases in high-altitude areas of China. Meanwhile, SHAP analysis further revealed nonlinear relationships and threshold effects among these factors. In summary, this study successfully constructed a depression risk prediction model based on machine learning algorithms, thus providing strong support for the mental health protection and clinical intervention of MOG with chronic diseases in high-altitude areas of China.
Acknowledgement:
Funding Statement: This study has been supported by the Project of Zhongyuan Medical Innovation Foundation Hospital Management Research (25YCG1004).
Author Contributions: The authors confirm contribution to the paper as follows: Conceptualization, Zhe He; methodology and software, Yaning Zhang; data curation, Zhe He and Yaning Zhang; writing—original draft preparation, Zhe He; writing—review and editing, Yaning Zhang; project administration, Yaning Zhang. All authors reviewed the results and approved the final version of the manuscript.
Availability of Data and Materials: The data that support the findings of this study are available from the Corresponding Author, Yaning Zhang, upon reasonable request.
Ethics Approval: The study protocol of the CHARLS was approved by the Peking University Biomedical Ethics Committee (IRB00001052-11015), which conformed to the standards set by the latest revision of the Declaration of Helsinki. All participants included in the study provided informed consent.
Conflicts of Interest: The authors declare no conflicts of interest to report regarding the present study.
Abbreviations
| China health and retirement longitudinal study | |
| Middle-aged and older groups | |
| Activities of daily living | |
| Recursive feature elimination | |
| Least absolute shrinkage and selection operator | |
| Random forest | |
| Extreme gradient boosting | |
| Light gradient boosting machine | |
| Gradient boosting machine | |
| K-nearest neighbor | |
| Naive bayes classifier | |
| Support vector machine | |
| Logistic regression | |
| Area under receiver operating characteristic curve | |
| SHapley additive explanations | |
| Center for epidemiologic studies depression scale | |
| Gross domestic product | |
| Sustainable development goal |
References
1. Cao J , Truong AL , Banu S , Shah AA , Sabharwal A , Moukaddam N . Tracking and predicting depressive symptoms of adolescents using smartphone-based self-reports, parental evaluations, and passive phone sensor data: development and usability study. JMIR Ment Health. 2020; 7( 1): e14045. doi:10.2196/14045. [Google Scholar] [CrossRef]
2. Qu Y , Su C , Zhao Q , Shi A , Zhao F , Tang L , et al. Gut microbiota-mediated elevated production of secondary bile acids in chronic unpredictable mild stress. Front Pharmacol. 2022; 13: 837543. doi:10.3389/fphar.2022.837543. [Google Scholar] [CrossRef]
3. Bryant RA , Dawson KS , Keyan D , Azevedo S , Yadav S , Tran J , et al. Effectiveness of a videoconferencing-delivered psychological intervention for mental health problems during COVID-19: a proof-of-concept randomized clinical trial. Psychother Psychosom. 2022; 91( 1): 63– 72. doi:10.1159/000520283. [Google Scholar] [CrossRef]
4. Wang L , Xu X Shi L , Su H , Wang W , Fang X , et al. A cross-sectional study of the psychological status of 33,706 hospital workers at the late stage of the COVID-19 outbreak. J Affect Disord. 2022; 297: 156– 68. doi:10.1016/j.jad.2021.10.013. [Google Scholar] [CrossRef]
5. Hill LM , Kajula LJ , Maman S . Correlates of anxiety and depression among young men living in Dar Es Salaam, Tanzania. Int J Ment Health Addict. 2020; 18: 917– 31. doi:10.1007/s11469-018-9993-6. [Google Scholar] [CrossRef]
6. He L , Wang K , Zhang Z , Wang J , Li T , Wang Y , et al. Depression levels of state functionaries: empirical evidence from China. Front Psychiatry. 2021; 12: 754182. doi:10.3389/fpsyt.2021.754182. [Google Scholar] [CrossRef]
7. Jin LQ , Pan CW , Zhao CH , Li DL , Wu YB , Zhang TY . Perceived social support and symptoms of depression and anxiety among Chinese adolescents: a moderated chain mediation model. Int J Ment Health Promot. 2025; 27( 1): 29– 40. doi:10.32604/ijmhp.2025.057962. [Google Scholar] [CrossRef]
8. Zablan K , Melvin G , Hayley A . Dog ownership, physical activity, loneliness and mental health: a comparison of older adult and younger adult companion animal owners. BMC Psychol. 2024; 12( 1): 618. doi:10.1186/s40359-024-02104-x. [Google Scholar] [CrossRef]
9. Gou Y , Wu N , Xia J , Liu Y , Yang H , Wang H , et al. Province- and individual-level influential factors of depression: multilevel cross-provinces comparison in China. Front Public Health. 2022; 10: 893280. doi:10.3389/fpubh.2022.893280. [Google Scholar] [CrossRef]
10. Ding Y , Chen L , Zhang Z . The relationship between social participation and depressive symptoms among Chinese middle-aged and older adults: a cross-lagged panel analysis. Front Public Health. 2022; 10: 996606. doi:10.3389/fpubh.2022.996606. [Google Scholar] [CrossRef]
11. Ye YP , Wang JN , Li QC , Xu CM , Rong C . Factors associated with the depression status of Chinese parents who have lost their only child. Front Public Health. 2022; 10: 931945. doi:10.3389/fpubh.2022.931945. [Google Scholar] [CrossRef]
12. Anderson DN . Treating depression in old age: the reasons to be positive. Age Ageing. 2001; 30( 1): 13– 7. doi:10.1093/ageing/30.1.13. [Google Scholar] [CrossRef]
13. Li J , Jiang C , Liu R , Lai Y , Li L , Zhao X , et al. Prognostic value of post-discharge depression in patients recently hospitalized with acute heart failure. Front Cardiovasc Med. 2022; 9: 858751. doi:10.3389/fcvm.2022.858751. [Google Scholar] [CrossRef]
14. Fan ZY , Yang Y , Zhang CH , Yin RY , Tang L , Zhang F . Prevalence and patterns of comorbidity among middle-aged and elderly people in China: a cross-sectional study based on CHARLS data. Int J Gen Med. 2021; 14: 1449– 55. doi:10.2147/IJGM.S309783. [Google Scholar] [CrossRef]
15. Li Y , Chen X , Hu D , Peng X , Wang J . The relationship between psychological distress and frailty in stroke patients: the mediating effect of depression. BMC Psychol. 2025; 13( 1): 159. doi:10.1186/s40359-025-02454-0. [Google Scholar] [CrossRef]
16. Liu H , Zhou Z , Fan X , Shen C , Ma Y , Sun H , et al. Association between multiple chronic conditions and depressive symptoms among older adults in China: evidence from the China health and retirement longitudinal study (CHARLS). Int J Public Health. 2023; 68: 1605572. doi:10.3389/ijph.2023.1605572. [Google Scholar] [CrossRef]
17. Jiang C , Zhu F , Qin T . Relationships between Chronic Diseases and depression among middle-aged and elderly people in China: a prospective study from CHARLS. Curr Med Sci. 2020; 40( 5): 858– 70. doi:10.1007/s11596-020-2270-5. [Google Scholar] [CrossRef]
18. Lv X , Yu DSF , Cao Y , Xia J . Self-care experiences of empty-nest elderly living with type 2 diabetes mellitus: a qualitative study from China. Front Endocrinol. 2021; 12: 745145. doi:10.3389/fendo.2021.745145. [Google Scholar] [CrossRef]
19. Ventriglio A , Bellomo A , Gioia I , Sabatino D , Favale D , Berardis D , et al. Environmental pollution and mental health: a narrative review of literature. CNS Spectr. 2020; 26( 1): 51– 61. doi:10.1017/S1092852920001303. [Google Scholar] [CrossRef]
20. Kious BM , Bakian A , Zhao J , Mickey B , Guille C , Renshaw P , et al. Altitude and risk of depression and anxiety: findings from the intern health study. Int Rev Psychiatry. 2019; 31( 7): 637– 45. doi:10.1080/09540261.2019.1586324. [Google Scholar] [CrossRef]
21. Hernández-Vásquez A , Vargas-Fernández R , Rojas-Roque C , Gamboa-Unsihuay JE . Association between altitude and depression in Peru: an 8-year pooled analysis of population-based surveys. J Affect Disord. 2022; 299: 536– 44. doi:10.1016/j.jad.2021.12.059. [Google Scholar] [CrossRef]
22. Cao Y , Li G , Xue J , Zhang G , Gao S , Huang Y , et al. Depression and related factors in patients with parkinson’s disease at high altitude. Neuropsych Dis Treat. 2021; 17: 1353– 62. doi:10.2147/NDT.S300596. [Google Scholar] [CrossRef]
23. Kuhn BT . The impact of the chronic high-altitude environment on chronic obstructive pulmonary disease outcomes. Am J of Resp Crit Care. 2024; 210( 10): 1173– 4. doi:10.1164/rccm.202404-0667ED. [Google Scholar] [CrossRef]
24. Tang S , Zhou W , Chen L , Yan H , Chen L , Luo F . High altitude polycythemia and its maladaptive mechanisms: an updated review. Front Med. 2024; 11: 1448654. doi:10.3389/fmed.2024.1448654. [Google Scholar] [CrossRef]
25. Liu B , Yuan M , Yang M , Zhu H , Zhang W . The effect of high-altitude hypoxia on neuropsychiatric functions. High Alt Med Biol. 2024; 25( 1): 26– 41. doi:10.1089/ham.2022.0136. [Google Scholar] [CrossRef]
26. Chen H , Ma D , Yue F , Qi Y , Dou M , Cui L , et al. The potential role of hypoxia-inducible factor-1 in the progression and therapy of central nervous system diseases. Curr Neuropharmacol. 2022; 20( 9): 1651– 66. doi:10.2174/1570159X19666210729123137. [Google Scholar] [CrossRef]
27. Corcoran A , O’Connor JJ . Hypoxia-inducible factor signalling mechanisms in the central nervous system. Acta Physiol. 2013; 208( 4): 298– 310. doi:10.1111/apha.12117. [Google Scholar] [CrossRef]
28. Claflin ES , Daunter AK , Bowman A , Startup J , Reed E , Krishnan C , et al. Hospitalized patients with COVID-19 and neurological complications experience more frequent decline in functioning and greater rehabilitation needs. Am J Phys Med Rehabil. 2021; 100( 8): 725– 9. doi:10.1097/PHM.0000000000001807. [Google Scholar] [CrossRef]
29. Xia Y , Pang L , Tang M , Luo Z , Ma M , Wang H , et al. Association of altitude with all-cause and cardiovascular mortality among patients with hypertension: a cohort study in Southwest China. BMC Public Health. 2024; 24( 1): 3461. doi:10.1186/s12889-024-20891-1. [Google Scholar] [CrossRef]
30. Morisaki Y , Fujiu M , Takayama J , Sagae M , Hirako K . Quantitative evaluation of difficulty in visiting hospitals for elderly patients in depopulated area in Japan: using national health insurance data. Sustainability. 2023; 15( 21): 15272. doi:10.3390/su152115272. [Google Scholar] [CrossRef]
31. Banerjee A , Duflo E , Grela E , McKelway M , Schilbach F , Sharma G , et al. Depression and loneliness among the elderly in low-and middle-income countries. J Econ Perspect. 2023; 37( 2): 179– 202. doi:10.1257/jep.37.2.179. [Google Scholar] [CrossRef]
32. Peltzer K . Longitudinal associations of loneliness with mental and physical health in ageing adults in South Africa. Int J Ment Health Promot. 2025; 27( 5): 625– 35. doi:10.32604/ijmhp.2025.063801. [Google Scholar] [CrossRef]
33. Bota PJ , Wang C , Fred AL , Silva HP . A review, current challenges, and future possibilities on emotion recognition using machine learning and physiological signals. IEEE Access. 2019; 7: 140990– 1020. doi:10.1109/ACCESS.2019.2944001. [Google Scholar] [CrossRef]
34. Shin D , Lee KJ , Adeluwa T , Hur J . Machine learning-based predictive modeling of postpartum depression. J Clin Med. 2020; 9( 9): 2899. doi:10.3390/jcm9092899. [Google Scholar] [CrossRef]
35. Ntakolia C , Yotsidi V , Rannou I , Gournellis R . Interpretable machine learning approach for predicting clinically significant suicide risk: a case study of patients with major depressive disorder in Greece. Psychiat Res. 2025; 351: 116607. doi:10.1016/j.psychres.2025.116607. [Google Scholar] [CrossRef]
36. Brenner B , Cheng D , Clark S , Camargo CA . Positive association between altitude and suicide in 2584 US counties. High Alt Med Biol. 2011; 12( 1): 31– 5. doi:10.1089/ham.2010.1058. [Google Scholar] [CrossRef]
37. Lei X , Sun X , Strauss J , Zhang P , Zhao Y . Depressive symptoms and SES among the mid-aged and elderly in China: evidence from the China Health and Retirement Longitudinal Study national baseline. Soc Sci Med. 2014; 120: 224– 32. doi:10.1016/j.socscimed.2014.09.028. [Google Scholar] [CrossRef]
38. Zhou L , Wang W , Ma X . The bidirectional association between the disability in activities of daily living and depression: a longitudinal study in Chinese middle-aged and older adults. BMC Public Health. 2024; 24( 1): 1884. doi:10.1186/s12889-024-19421-w. [Google Scholar] [CrossRef]
39. Wang X , Guo J , Liu H , Zhao T , Li H , Wang T . Impact of social participation types on depression in the elderly in China: an analysis based on counterfactual causal inference. Front Public Health. 2022; 10: 792765. doi:10.3389/fpubh.2022.792765. [Google Scholar] [CrossRef]
40. Hu Y , Zhou F , Kaminga AC , Yan S , Hu Z . Associations of depressive symptoms and chronic diseases with activities of daily living among middle-aged and older population in China: a population-based cohort study. Front Psychiatry. 2022; 13: 848255. doi:10.3389/fpsyt.2022.848255. [Google Scholar] [CrossRef]
41. Kang W , Tiego J , Hellyer PJ , Trender W , Grant JE , Chamberlain SR , et al. Validation of an abbreviated Big Five personality inventory at large population scale: psychometric structure and associations with common psychiatric and neurological disorders. Compr Psychiat. 2024; 134: 152514. doi:10.1016/j.comppsych.2024.152514. [Google Scholar] [CrossRef]
42. Liu H , Zhou Y , Jiang C . Classifying metro drivers’ cognitive distractions during manual operations using machine learning and random forest-recursive feature elimination. Sci Rep. 2025; 15( 1): 7564. doi:10.1038/s41598-025-92248-6. [Google Scholar] [CrossRef]
43. Karami G , Giuseppe Orlando M , Delli Pizzi A , Caulo M , Del Gratta C . Predicting overall survival time in glioblastoma patients using gradient boosting machines algorithm and recursive feature elimination technique. Cancers. 2021; 13( 19): 4976. doi:10.3390/cancers13194976. [Google Scholar] [CrossRef]
44. Zhou Y , Zhang Z , Li Q , Mao G , Zhou Z . Construction and validation of machine learning algorithm for predicting depression among home-quarantined individuals during the large-scale COVID-19 outbreak: based on Adaboost model. BMC Psychol. 2024; 12( 1): 230. doi:10.1186/s40359-024-01696-8. [Google Scholar] [CrossRef]
45. Ntakolia C , Priftis D , Charakopoulou-Travlou M , Rannou I , Magklara K , Giannopoulou I , et al. An explainable machine learning approach for COVID-19’s impact on mood states of children and adolescents during the first lockdown in greece. Healthcare. 2022; 10( 1): 149. doi:10.3390/healthcare10010149. [Google Scholar] [CrossRef]
46. Casaes Teixeira B , Toporcov TN , Chiaravalloti-Neto F , Chiavegatto Filho ADP . Spatial clusters of cancer mortality in Brazil: a machine learning modeling approach. Int J Public Health. 2023; 68: 1604789. doi:10.3389/ijph.2023.1604789. [Google Scholar] [CrossRef]
47. Zhang T , Zhang C , Zhong Y , Sun Y , Wang H , Li H , et al. A radiomics nomogram for invasiveness prediction in lung adenocarcinoma manifesting as part-solid nodules with solid components smaller than 6 mm. Front Oncol. 2022; 12: 900049. doi:10.3389/fonc.2022.900049. [Google Scholar] [CrossRef]
48. Nakagomi A , Saito M , Ojima T , Ueno T , Hanazato M , Kondo K . Sociodemographic heterogeneity in the associations of social isolation with mortality. JAMA Netw Open. 2024; 7( 5): e2413132. doi:10.1001/jamanetworkopen.2024.13132. [Google Scholar] [CrossRef]
49. Wang Y , Liu M , Liu J . Catastrophic health expenditure and the risk of depression among middle-aged and old people in China: a national population-based longitudinal study. Epidemiol Psych Sci. 2023; 32: e36. doi:10.1017/S2045796023000240; 2023. [Google Scholar] [CrossRef]
50. Jin J , Agiovlasitis S , Yun J . Predictors of perceived health in adults with an intellectual disability. Res Dev Disabil. 2020; 101: 103642. doi:10.1016/j.ridd.2020.103642. [Google Scholar] [CrossRef]
51. Chen S , Liao CJ . Prediction of the probability and risk factors of early abdominal aortic aneurysm using the gradient boosted decision trees model. Appl Artif Intell. 2022; 36( 1): 2014190. doi:10.1080/08839514.2021.2014190. [Google Scholar] [CrossRef]
52. Dai LL , Jiang TC , Li PF , Shao H , Wang X , Wang Y , et al. Predictors of maternal death among women with pulmonary hypertension in China from 2012 to 2020: a retrospective single-center study. Front Cardiovasc Med. 2022; 9: 814557. doi:10.3389/fcvm.2022.814557. [Google Scholar] [CrossRef]
53. Shen L , Xu X , Yue S , Yin S . A predictive model for depression in Chinese middle-aged and elderly people with physical disabilities. BMC Psychiatry. 2024; 24( 1): 305. doi:10.1186/s12888-024-05766-4. [Google Scholar] [CrossRef]
54. Fan X , Guo X , Ren Z , Li X , He M , Shi H , et al. The prevalence of depressive symptoms and associated factors in middle-aged and elderly Chinese people. J Affect Disord. 2021; 293: 222– 8. doi:10.1016/j.jad.2021.06.044. [Google Scholar] [CrossRef]
55. Mei S , Qin Z , Yang Y , Gao T , Ren H , Hu Y , et al. Influence of life satisfaction on quality of life: mediating roles of depression and anxiety among cardiovascular disease patients. Clin Nurs Res. 2020; 30( 2): 215– 24. doi:10.1177/1054773820947984. [Google Scholar] [CrossRef]
56. Borroni E , Pesatori AC , Bollati V , Buoli M , Carugno M . Air pollution exposure and depression: a comprehensive updated systematic review and meta-analysis. Environ Pollution. 2022; 292: 118245. doi:10.1016/j.envpol.2021.118245. [Google Scholar] [CrossRef]
57. Wang R , Yang B , Liu P , Zhang J , Liu Y , Yao Y , et al. The longitudinal relationship between exposure to air pollution and depression in older adults. Int J Geriatr Psych. 2020; 35( 6): 610– 6. doi:10.1002/gps.5277. [Google Scholar] [CrossRef]
58. Zhang Y , Ning Z , Deng P , Qin S , Zhao J , He S . The impact of air pollution on influenza incidence in high-altitude regions: a time-stratified case-crossover study based on Qinghai Province. Int Arch Occup Environ Health. 2025; 98( 2): 203– 13. doi:10.1007/s00420-025-02123-0. [Google Scholar] [CrossRef]
59. Kim Y , Stern Y , Seo SW , Na DL , Jang JW , Jang H . Factors associated with cognitive reserve according to education level. Alzheimers Dement. 2024; 20( 11): 7686– 97. doi:10.1002/alz.14236. [Google Scholar] [CrossRef]
60. Patria B . The longitudinal effects of education on depression: finding from the Indonesian national survey. Front Public Health. 2022; 10: 1017995. doi:10.3389/fpubh.2022.1017995. [Google Scholar] [CrossRef]
61. Kim Y , Jang E . Low self-rated health as a risk factor for depression in South Korea: a survey of young males and females. Healthcare. 2021; 9( 4): 452. doi:10.3390/healthcare9040452. [Google Scholar] [CrossRef]
62. Azodi CB , Tang J , Shiu SH . Opening the black box: interpretable machine learning for geneticists. Trends Genet. 2020; 36( 6): 442– 55. doi:10.1016/j.tig.2020.03.005. [Google Scholar] [CrossRef]
Cite This Article
 Copyright © 2025 The Author(s). Published by Tech Science Press.
This work is licensed under a Creative Commons Attribution 4.0 International License , which permits unrestricted use, distribution, and reproduction in any medium, provided the original work is properly cited.
 Downloads
 Citation Tools