
 Submit a Paper
 Propose a Special lssue
 Open Access
ARTICLE
Possible Classifications of Social Network Addiction: A Latent Profile Analysis of Chinese College Students
1 School of Physical Education, Guizhou Normal University, Guiyang, 550025, China
2 Key Laboratory of Brain Function and Brain Disease Prevention and Treatment of Guizhou Province, Guiyang, 550025, China
* Corresponding Author: Lin Luo. Email:
(This article belongs to the Special Issue: Latent Profile Analysis in Mental Health Research: Exploring Heterogeneity through Person Centric Approach)
International Journal of Mental Health Promotion 2025, 27(6), 863-876. https://doi.org/10.32604/ijmhp.2025.064385
Received 13 February 2025; Accepted 21 May 2025; Issue published 30 June 2025
 View Full Text
 Download PDF
Abstract
Objectives: Social Network Addiction (SNA) is becoming increasingly prevalent among college students; however, there remains a lack of consensus regarding the measurement tools and their optimal cutoff score. This study aims to validate the 21-item Social Network Addiction Scale-Chinese (SNAS-C) in its Chinese version and to determine its optimal cutoff score for identifying potential SNA cases within the college student population. Methods: A cross-sectional survey was conducted, recruiting 3387 college students. Latent profile analysis (LPA) and receiver operating characteristic (ROC) curve analysis were employed to establish the optimal cutoff score for the validated 21-item SNAS-C. Results: Three profile models were selected based on multiple statistical criteria, classifying participants into low-risk, moderate-risk, and high-risk groups. The highest-risk group was defined as “positive” for SNA, while the remaining groups were considered “negative”, serving as the reference standard for ROC analysis. The optimal cutoff score was determined to be 72 (sensitivity: 98.2%, specificity: 96.86%), with an overall classification accuracy of 97.0%. The “positive” group reported significantly higher frequency of social network usage, greater digital media dependence scores, and a higher incidence of network addiction. Conclusion: This study identified the optimal cutoff score for the SNAS-C as ≥72, demonstrating high sensitivity, specificity, and diagnostic accuracy. This threshold effectively distinguishes between high-risk and low-risk SNA.Keywords
Supplementary Material
Supplementary Material FileIn the digital age, social networks have become an integral part of daily life for billions of users worldwide. As of 2023, the number of social network users in China has surpassed 1 billion, with university students being one of the most active demographics in terms of social network usage [1]. Although social networks provide convenient communication and access to information, excessive use has led to widespread mental health issues, particularly social network addiction (SNA). SNA is defined as a pathological dependence on social networking platforms characterized by uncontrollable usage, an intense desire for social interaction, and impaired daily functioning due to excessive use [2]. Research indicates that SNA is closely associated with psychological issues such as anxiety, depression, and loneliness, significantly impacting individuals’ academic performance, interpersonal relationships, and sleep quality [3,4].
Initially viewed as a subtype of internet addiction, SNA has garnered increased attention from researchers as social networks have proliferated. Andreassen et al. [5] proposed that the core features of SNA include excessive focus on social networks, withdrawal symptoms, increased tolerance, and neglect of other important activities due to social network use. Among the Chinese university student population, the issue of SNA is particularly prominent. A study by Li et al. [6] found that more than 30% of Chinese university students exhibit tendencies toward SNA, a rate significantly higher than that of other age groups.
University students are at a critical transitional stage from adolescence to adulthood, facing academic pressures, career planning, and interpersonal relationship challenges. This psychological vulnerability makes them more susceptible to SNA [7]. Additionally, university students engage in social network use more frequently and often lack effective self-regulation abilities, further exacerbating the risk of addiction [8]. For example, a longitudinal study on Chinese university students found a significant positive correlation between SNA, declining academic performance, and mental health issues [9].
In recent years, the measurement tools for social network addiction have diversified (see Table 1). Internationally recognized scales include: (1) the Bergen Facebook Addiction Scale (BFAS) (18 items, covering six dimensions such as salience and mood modification) [10]; (2) the Social Media Disorder Scale (SMDS) (27 items, including nine diagnostic dimensions based on the DSM-5 framework) [11]; and (3) the Problematic Social Media Use Scale (PSMUS) (18 items), which is a multidimensional assessment tool [12]. Notably, the Social Networking Addiction Scale (SNAS) developed by Shahnawaz and Rehman [13] (21 items) achieves initial cross-cultural applicability by generalizing platform specificity (e.g., replacing “Facebook” with “social networking sites”) while retaining core dimensions such as excessive use, withdrawal symptoms, tolerance, and functional impairment.
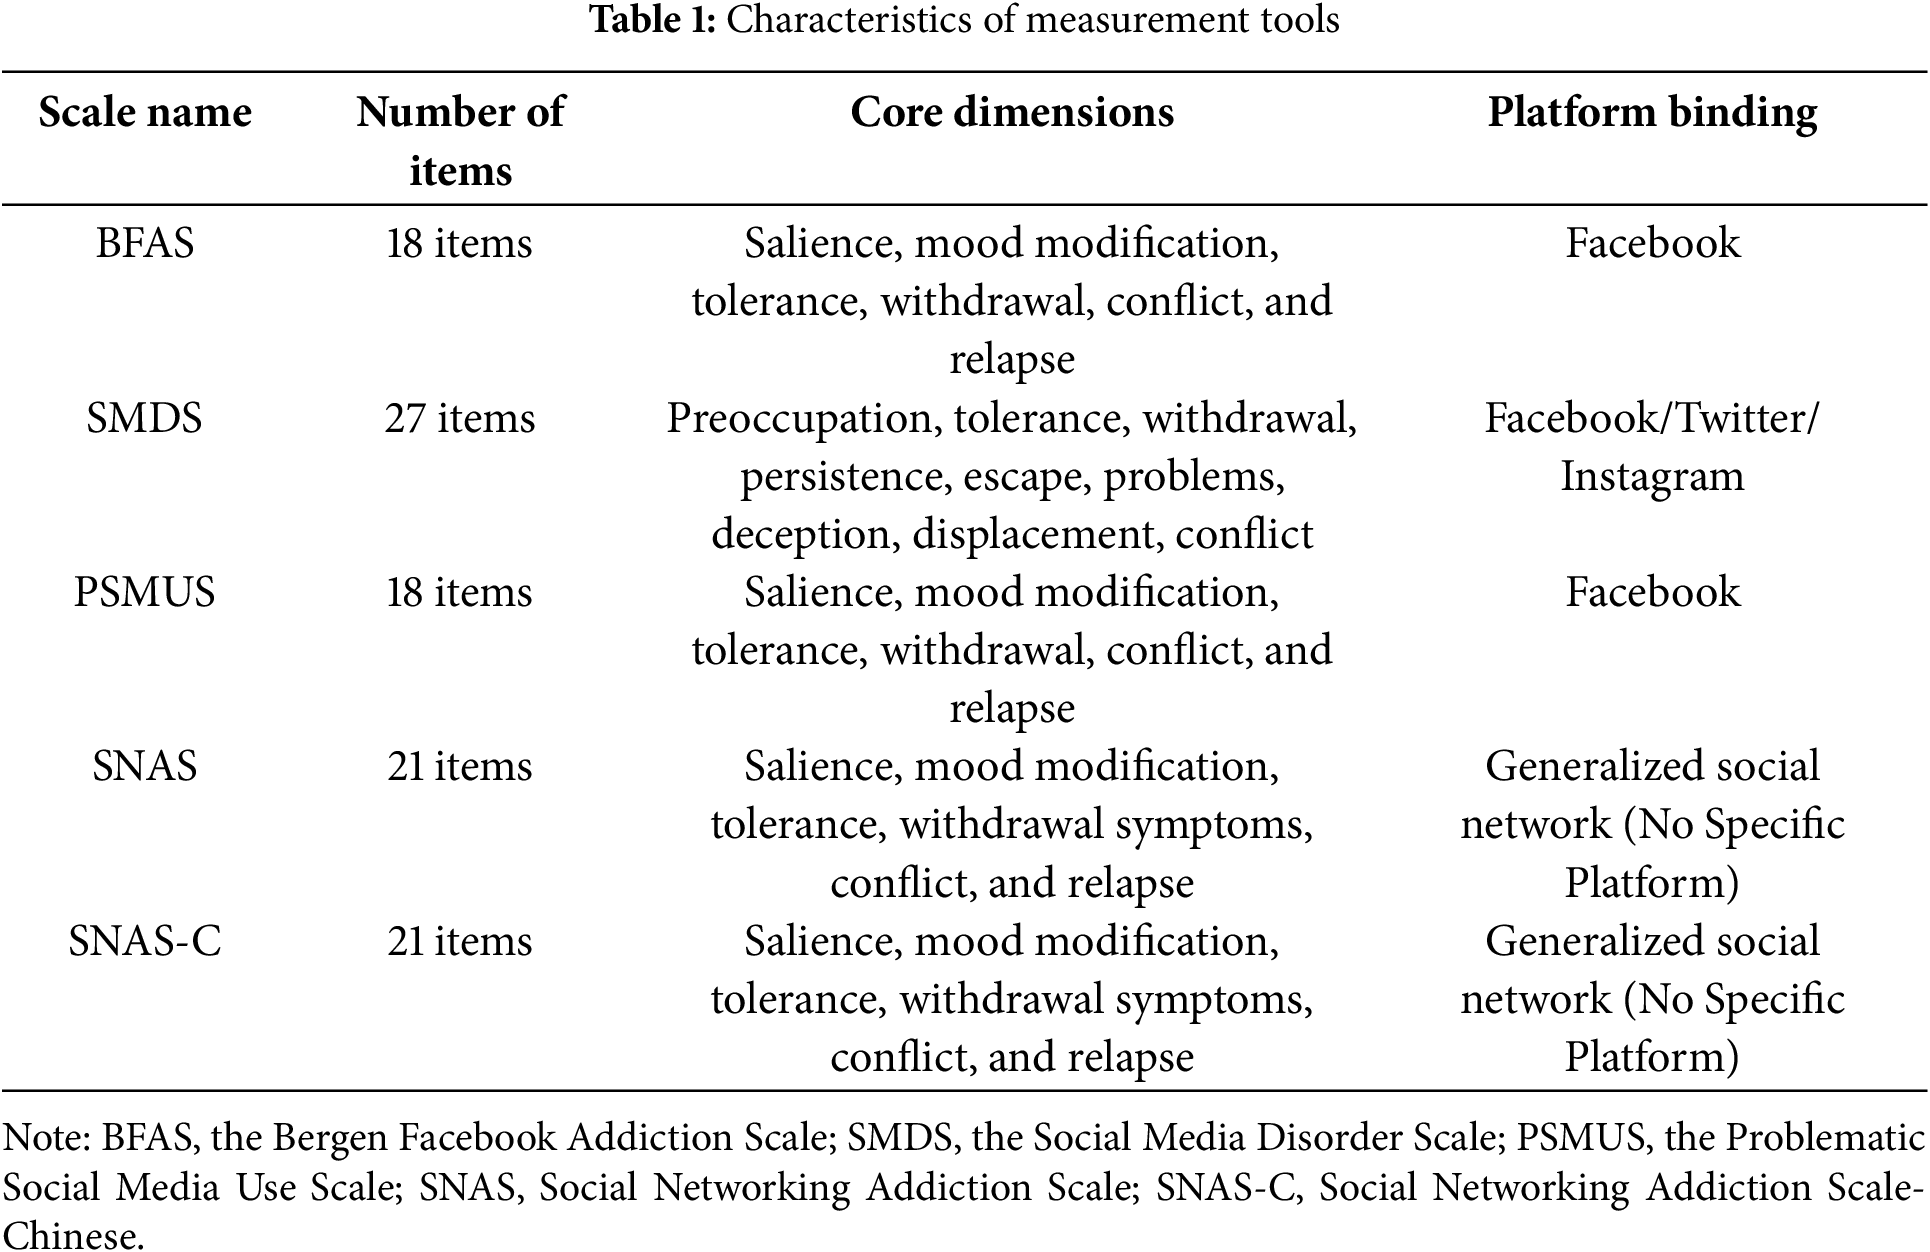
These scales, however, exhibit significant regional limitations. The BFAS, SMDS, and PSMUS [10–12] are closely tied to Western social platforms (e.g., Facebook, Instagram), and their item design (e.g., “using Twitter to escape reality”) is structurally misaligned with China’s digital ecosystem (e.g., WeChat, Weibo, Douyin). This misalignment manifests in two ways: (1) platform-function mismatch, as these tools fail to capture the addiction patterns arising from China-specific integrated features such as WeChat Pay and short-video live streaming; and (2) cultural-value bias, as dimensions rooted in individualistic frameworks (e.g., the “deception” item in SMDS) struggle to reflect passive overuse behaviors driven by collectivist cultural norms [14]. Although the SNAS partially addresses platform bias through generalization, its original version still lacks systematic cultural adaptation for the Chinese context.
To address these issues, the Social Networking Addiction Scale-Chinese (SNAS-C) was developed through a standardized three-stage cross-cultural validation process (translation, back-translation, and cognitive interviews), achieving a localized reconstruction of the theoretical framework specifically for Chinese university students [15]. The SNAS-C offers several notable advantages: First, it demonstrates strong cultural adaptability, with cultural adjustments during the translation and validation process ensuring alignment with the social networking usage patterns and cultural background of Chinese university students. Second, the SNAS-C comprehensively covers the core features of social network addiction, enabling a more thorough assessment of individual addiction severity and its impact on daily life. Additionally, it exhibits excellent psychometric properties among Chinese university students, with high internal consistency (Cronbach’s α > 0.90) and stable, reliable measurement results [15]. Finally, the SNAS-C has been applied in relevant studies [14], providing valuable data support for the field of social network addiction. However, the lack of a clear cutoff score limits its application in clinical screening and large-scale research.
In clinical practice, traditional psychiatric interviews face significant challenges in identifying severe social network addiction cases. The combination of Latent Profile Analysis (LPA) and Receiver Operating Characteristic (ROC) curve analysis offers an innovative solution to this complex problem. This approach has been validated across multiple psychological scale cutoff score studies [8,12,16,17].
As a person-centered statistical method, LPA can identify hidden homogeneous subgroups within populations based on shared characteristics [18]. Compared to traditional classification methods, LPA significantly reduces misclassification rates and demonstrates exceptional performance in psychological construct classification, including depression [16], perceived stigma [19], online social network addiction [8], problematic social media use [12], and agoraphobia [17]. By marking the most severe cases as “cases”, ROC analysis can precisely determine an optimal cutoff score that balances sensitivity and specificity [20]. Although not an absolute gold standard, this method has gained widespread acceptance in the absence of clinical consensus [11,21].
The present study focuses on establishing the optimal cutoff score for SNAS-C, aimed at precisely identifying severely social network-addicted university students. By integrating LPA and ROC analysis, the research constructs a dynamic stratification model through examining the complex associations between latent profiles, classification results, and external variables. The core hypotheses include: (1) classifying university students into distinct latent subgroups based on SNAS-C scores, with the “at-risk SNAS-C” group exhibiting the most severe characteristics; (2) the identified cutoff score demonstrating high sensitivity and specificity in severe case classification, with good external validity.
2.1 Participants and Procedure
This study employs a stratified multi-stage sampling design. Firstly, based on the distribution of student sources from six universities within Guizhou University Town (covering 12 provinces/municipalities/autonomous regions), initial quotas are allocated according to the proportion of students from each province. Secondly, within each university, stratification is conducted by discipline (science and engineering, humanities, and comprehensive) and by grade level.
Data collection is carried out using a combination of online and offline methods. The online component involves distributing the questionnaire link through physical education instructors at the universities, while the offline component employs systematic sampling to invite participants in public areas. However, since physical education instructors primarily target first- and second-year students, and the number of third- and fourth-year students on campus is reduced due to internships and practical training, the final sample, although encompassing participants from the aforementioned 12 provinces, municipalities, and autonomous regions—including Guizhou, Guangxi, Chongqing, Sichuan, Beijing, Jiangsu, Shandong, Henan, and Heilongjiang—exhibits a notable skewed distribution.
All participants are social network users, and their data is analyzed in this report. Additionally, all participants are required to provide information regarding their sex, age, ethnicity, place of residence, and major.
2.2.1 Social Network Addiction
The Social Network Addiction Scale (SNAS), developed by Shahnawaz and Rehman [13] based on Griffiths’ six-factor model of addiction behaviors, was used to assess social media addiction across six core dimensions: salience, mood modification, tolerance, withdrawal symptoms, conflict, and relapse. The original version of the scale contains 21 items, each rated on a 5-point Likert scale (1 = strongly disagree, 5 = strongly agree). The Chinese version of the SNAS (SNAS-C), adapted and localized by Bi et al. [15], retains the structural and dimensional integrity of the original version while exhibiting strong reliability and validity. In this study, the Cronbach’s α for the total scale was 0.954 (McDonald’s ω = 0.958, Mean Inter-item Correlation [MIC] = 0.407). The α coefficients for the six dimensions ranged from 0.810 to 0.875 (MIC range: 0.418–0.709), demonstrating excellent internal consistency.
2.2.2 Digital Media Use Dependency
The Digital Media Use Dependency Scale (DMUD), adapted from [22], was used in this study. The Chinese version of the scale [23] consists of 12 items forming a unidimensional scale (e.g., I prefer communicating via email rather than face-to-face). Participants rated their responses on a 5-point Likert scale, ranging from 1 (strongly disagree) to 5 (strongly agree). The total score is obtained by summing the scores of all items, with higher scores indicating greater dependence on digital media. Rasch model analysis confirmed that the Chinese version of the DMUD exhibited acceptable reliability and validity, with a Cronbach’s α of 0.930. Although “digital media dependence” is not included in the International Classification of Diseases 11th Revision (ICD-11), the term is widely used in the literature and was thus adopted in this study.
2.2.3 Other Social Network Use Characteristics
The survey investigated participants’ online social network usage, collecting data on both account ownership and weekly frequency of use.
Internet addiction was assessed via Young’s 8-item Diagnostic Questionnaire (YDQ), characterized by dichotomous “Yes/No” responses [24,25]. Respondents endorsing five or more affirmative items were identified as potential internet addiction cases. Extensively utilized among Chinese student populations, this instrument has demonstrated robust psychometric properties with established validity and reliability [26]. In the current research, the scale’s internal consistency was reflected by a Cronbach’s α of 0.840. While ICD-11 does not formally recognize “internet addiction” as a diagnostic category, the term remains prevalent in academic discourse and was consequently adopted in this investigation.
LPA was employed to identify groups of participants within SNAS-C exhibiting similar addiction risk responses. The model selection process involved a comprehensive approach to determining the optimal number of latent classes. The first stage of analysis focused on model fit criteria. Researchers evaluated lower values of the Akaike Information Criterion (AIC), Bayesian Information Criterion (BIC), and Sample-Size Adjusted Bayesian Information Criterion (ssaBIC) [27], which indicated better model performance. Scatter plots were utilized for visualization [28], and non-significant bootstrap likelihood ratio test (BLRT) results (p-value > 0.05) suggested the superiority of the k-profile model over the k − 1 profile model. Classification accuracy was assessed through multiple parameters. A higher entropy value (ranging from 0 to 1) indicated improved classification precision, with values exceeding 0.8 representing high accuracy [29]. An additional crucial criterion mandated that each latent class include at least 5% of the sample to eliminate unrealistic solutions and prevent overfitting [30–32]. To ensure methodological rigor, the identified latent class model underwent cross-validation using two randomly split samples: a training sample (n = 1694) and a validation sample (n = 1693). In the validation phase, researchers compared the model with parameters fixed from the training sample against a model derived freely from the validation sample. Ultimately, participants were categorized into groups based on different levels of SNAS-C risk, with the number of risk groups corresponding directly to the number of identified latent profiles. This approach allowed for a nuanced understanding of social network addiction risk profiles within the studied population.
2.3.2 Step 2: Determining the Cutoff Score
The cutoff score for the SNAS-C scale was systematically determined through an integrated methodological approach combining LPA and ROC curve analysis [33]. Researchers identified potential social network addiction cases by using the highest-risk latent class as a reference standard, comparing sensitivity and specificity across different scale scores. Employing the Youden Index as the primary discriminative metric, the optimal cutoff score was established to maximize diagnostic differentiation. This rigorous analytical procedure enabled the classification of participants into two distinct groups: a positive group representing potential social network addiction cases and a negative group comprising potential non-cases, based on their SNAS-C score positioning relative to the derived diagnostic threshold.
2.3.3 Step 3: Comparison of External Characteristics
The research utilized a comprehensive statistical framework to investigate the relationships between social network addiction latent profiles and external characteristics. Different statistical techniques were strategically applied based on variable types and group structures. Categorical variables were analyzed using chi-square tests, while continuous variables underwent comparative assessments through t-tests or one-way analysis of variance (ANOVA), depending on the number of comparison groups. Spearman’s correlation coefficient served as the primary method for quantifying the strength and direction of associations between latent profiles, addiction classification, and external characteristic measures.
LPA was performed using Mplus 7.3, and other statistical analyses were conducted using Python. A two-tailed p-value < 0.05 was considered statistically significant.
This study strictly followed the ethical principles outlined in the Declaration of Helsinki and was approved by the Academic Ethics Committee of Guizhou Normal University (approval number: 20230300005). All participants signed a written informed consent form before participation, fully understanding the study’s purpose and data confidentiality principles. Participation was entirely voluntary, and participants could withdraw at any time without any consequences.
3.1 Participant Characteristics
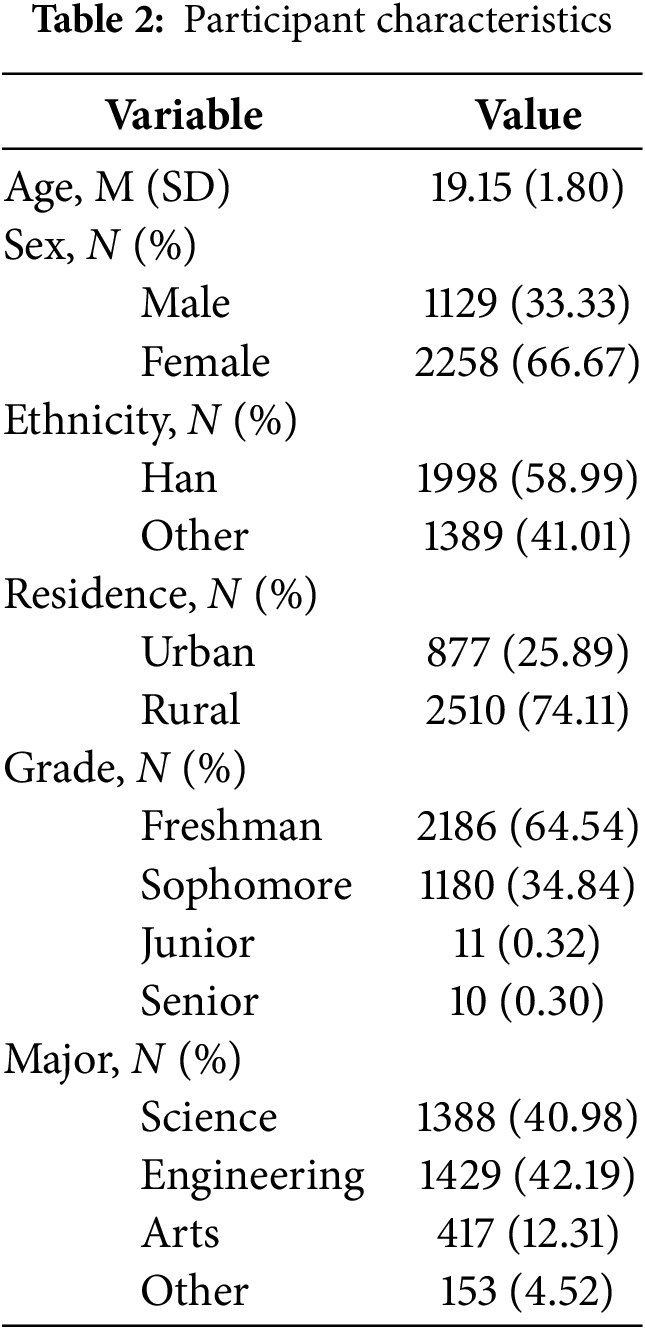
This study included 3387 participants (Table 2) with an average age of 19.15 years (SD = 1.80). The sex distribution was 33.33% male and 66.67% female; 58.99% were Han Chinese, and 41.01% were from other ethnic groups. The majority of participants resided in rural areas (74.11%), with 25.89% living in urban areas. Regarding academic year, 64.54% were freshmen, 34.84% were sophomores, and juniors and seniors accounted for 0.32% and 0.30%, respectively. The distribution of majors was as follows: 40.98% in science, 42.19% in engineering, 12.31% in the arts, and 4.52% in other fields. Normality test results for the primary variables are presented in Supplementary Table S1.
LPA models with 1 to 6 profiles were systematically evaluated (Table 3). While information criteria (AIC, BIC, aBIC) (Fig. 1A–C) monotonically decreased with increasing profile numbers—indicating improved model fit—entropy values (Fig. 1D) for all multi-profile models exceeded 0.93 (range: 0.932–0.956), demonstrating robust classification accuracy. However, diminishing marginal returns emerged as model complexity increased: The aBIC reduction from 3- to 4-profile models was substantial (Δ = 1378 units), whereas subsequent increments (4 → 5 → 6 profiles) yielded progressively smaller improvements (Δ = 851 and 741 units, respectively), consistent with the “elbow criterion” for optimal complexity. This pattern suggests diminishing explanatory gains from additional profiles beyond the 3-class solution.
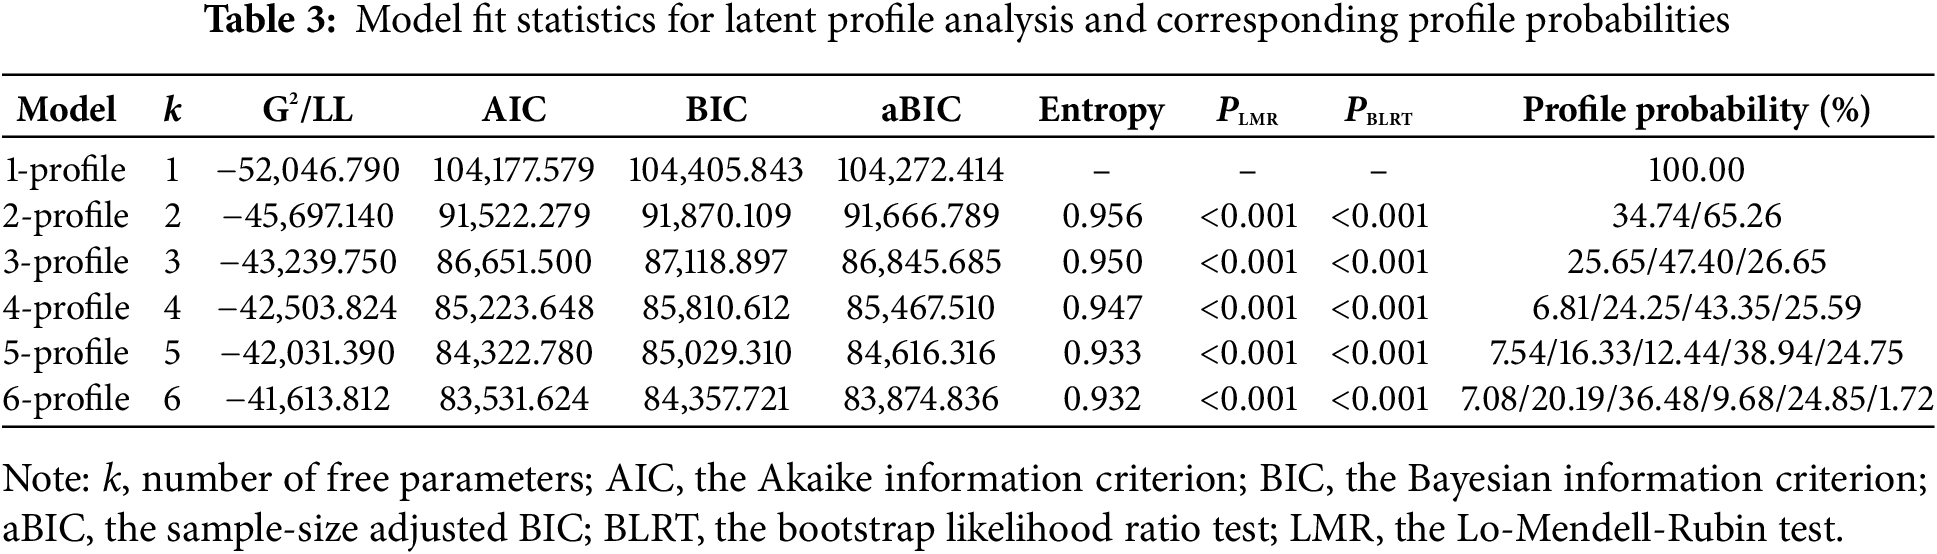
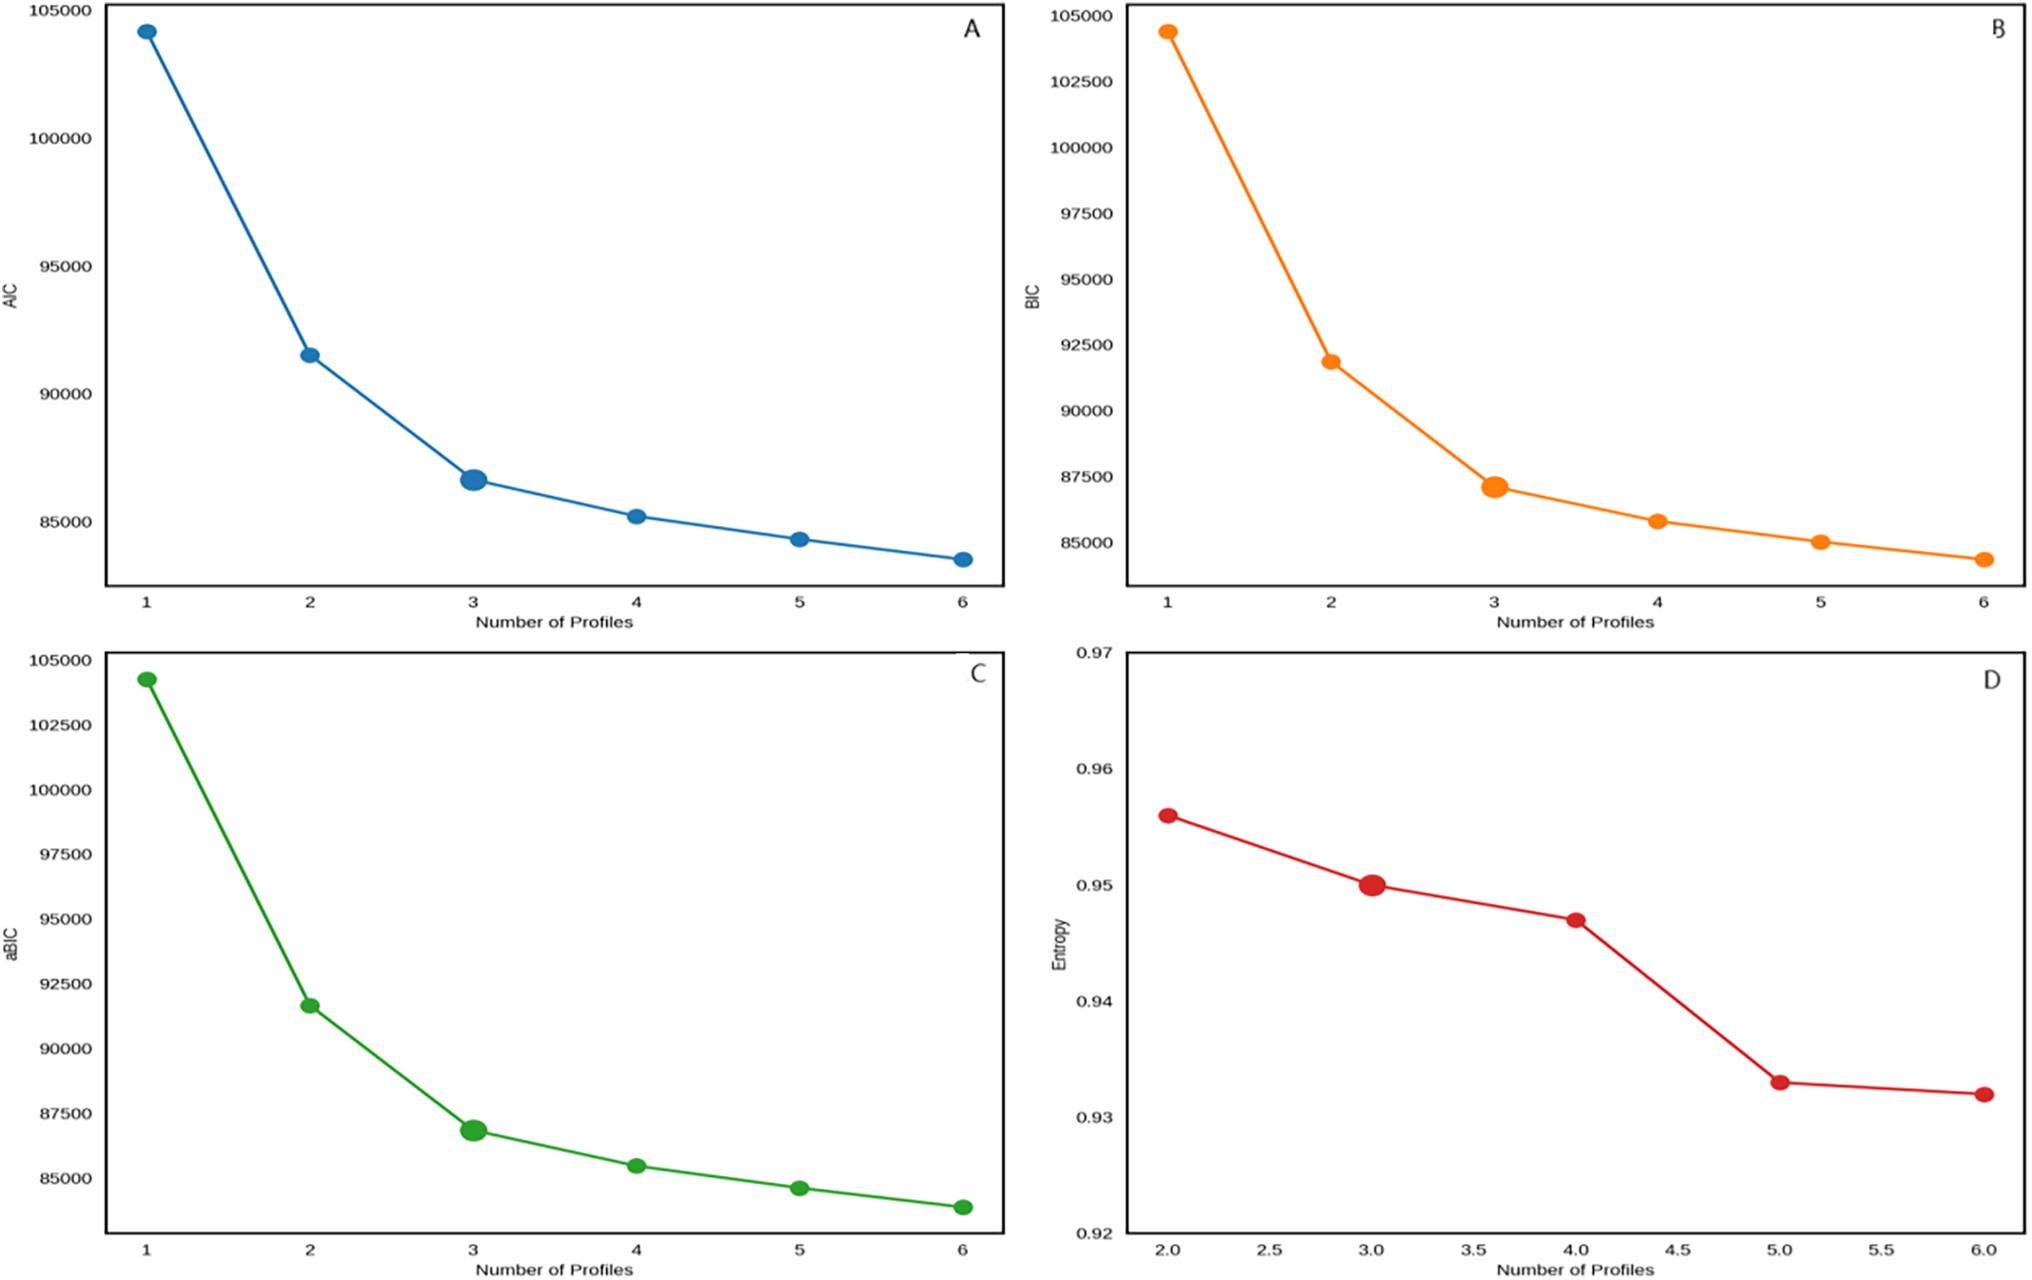
Figure 1: The scree plots based on the AIC, BIC, aBIC, and Entropy indices depict the trend in model fit across one to six latent profiles. (A) the Akaike Information Criterion (AIC); (B) the Bayesian Information Criterion (BIC); (C) the Adjusted Bayesian Information Criterion (aBIC); (D) the Entropy values
Although likelihood ratio tests (PLMR, PBLRT) statistically supported higher-complexity models (p < 0.001), the 3-profile model exhibited superior classification clarity (entropy = 0.950 vs. 0.932–0.947 for 4–6 profiles), effectively balancing precision against over-segmentation risks. Critically, the 3-profile solution produced three well-proportioned subgroups: high-risk (25.65%), low-risk (47.40%), and no-risk (26.65%) categories. In contrast, higher-dimensional models (e.g., 6-profile) generated fragmented subgroups with limited practical interpretability, including a marginal 1.72% subgroup, likely reflecting stochastic noise. Discriminant validity was further confirmed by strong between-group effect sizes (Cohen’s d > 0.80; Supplementary Table S2) and a pronounced elbow inflection at 3 profiles in the scree plot (Fig. 1), collectively affirming the 3-profile model’s psychometric robustness.
The 3-profile architecture aligned parsimoniously with established risk stratification frameworks in behavioral addiction research (Fig. 2A,B). The at-risk SNAS-C (26.65%) exhibited clinically significant social network addiction tendencies, contrasting with normative usage patterns in the low-risk SNAS-C (47.40%) and adaptive behaviors in the no-risk SNAS-C (25.65%). This tripartite classification system not only adheres to the principle of statistical parsimony (mitigating overfitting) but also operationalizes theoretical constructs into actionable risk tiers—a critical advancement for targeted prevention strategies. Multidimensional validation confirmed that the 3-profile model optimally reconciles statistical rigor with theoretical fidelity, establishing it as the empirically and conceptually superior solution.
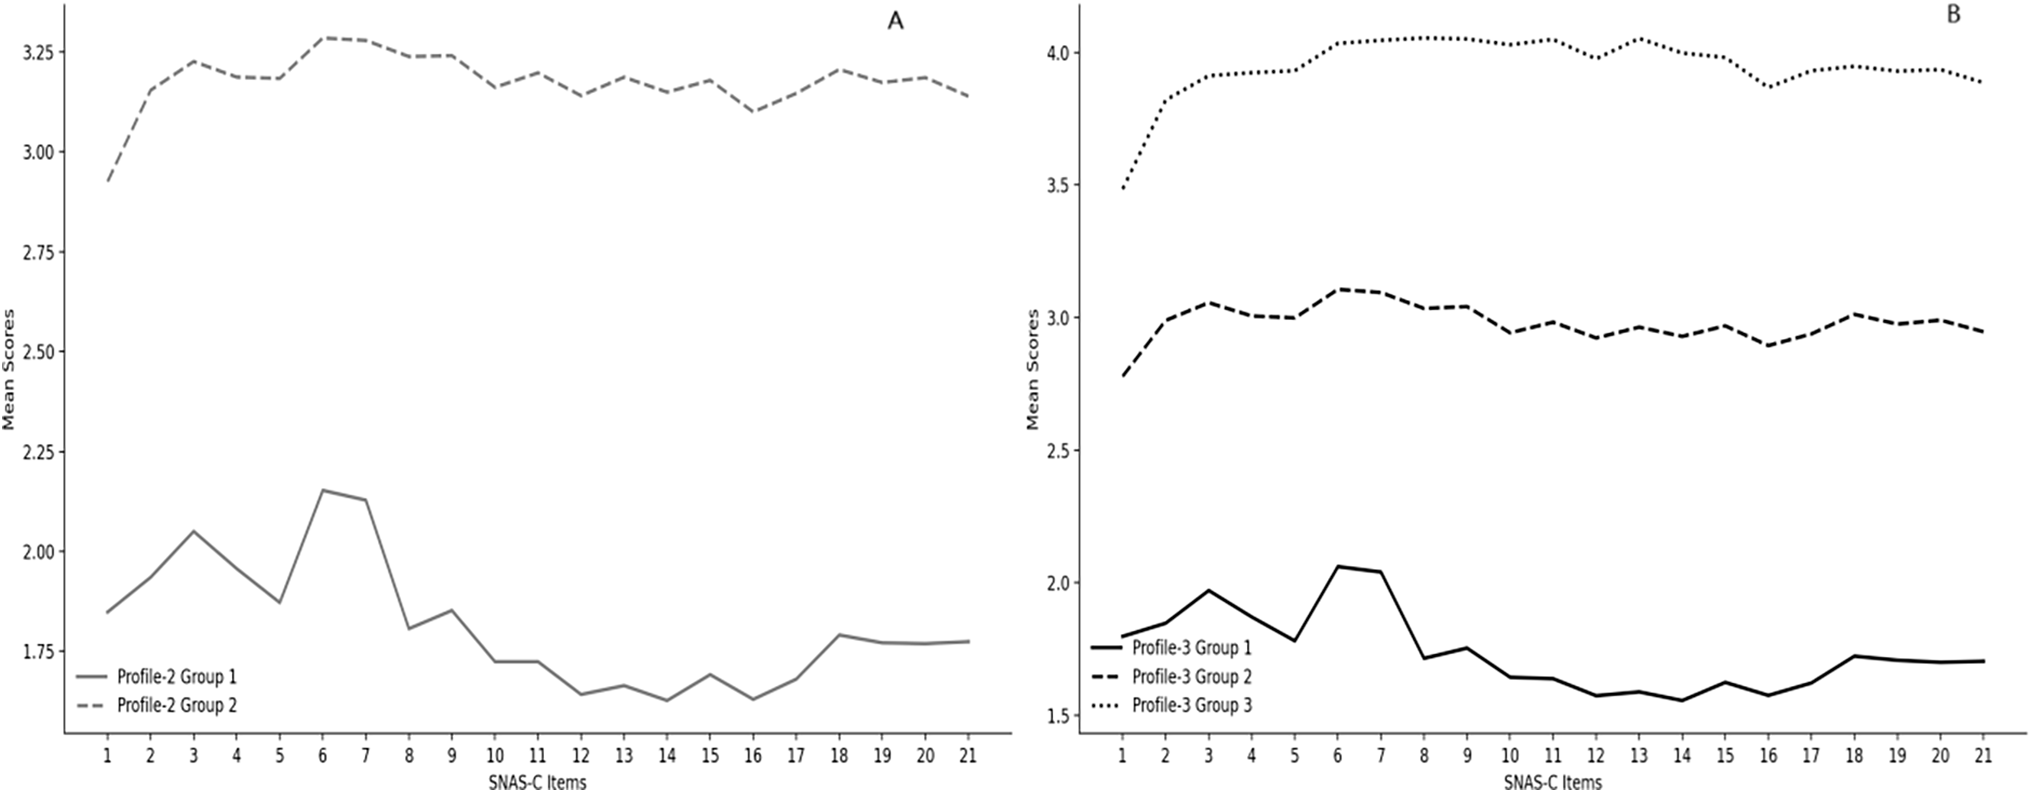
Figure 2: Conditional means for each profile based on 2- and 3-latent profiles. (A) conditional means for the 2-class profile; (B) Conditional means for the 3-class profile
In this analysis, the No-risk SNAS-C and Low-risk SNAS-C group was coded as 0 (non-case group), while the At-risk SNAS-C group was coded as 1 (case group). Using the binary results obtained from the LPA (case and non-case) as the reference standard, the diagnostic performance of different SNAS-C scores was analyzed through ROC curves. The results showed that the area under the ROC curve (AUC) was 0.96 (95% CI: 0.95–0.98), demonstrating the scale’s excellent discriminative ability (Fig. 3, Supplementary Fig. S1).
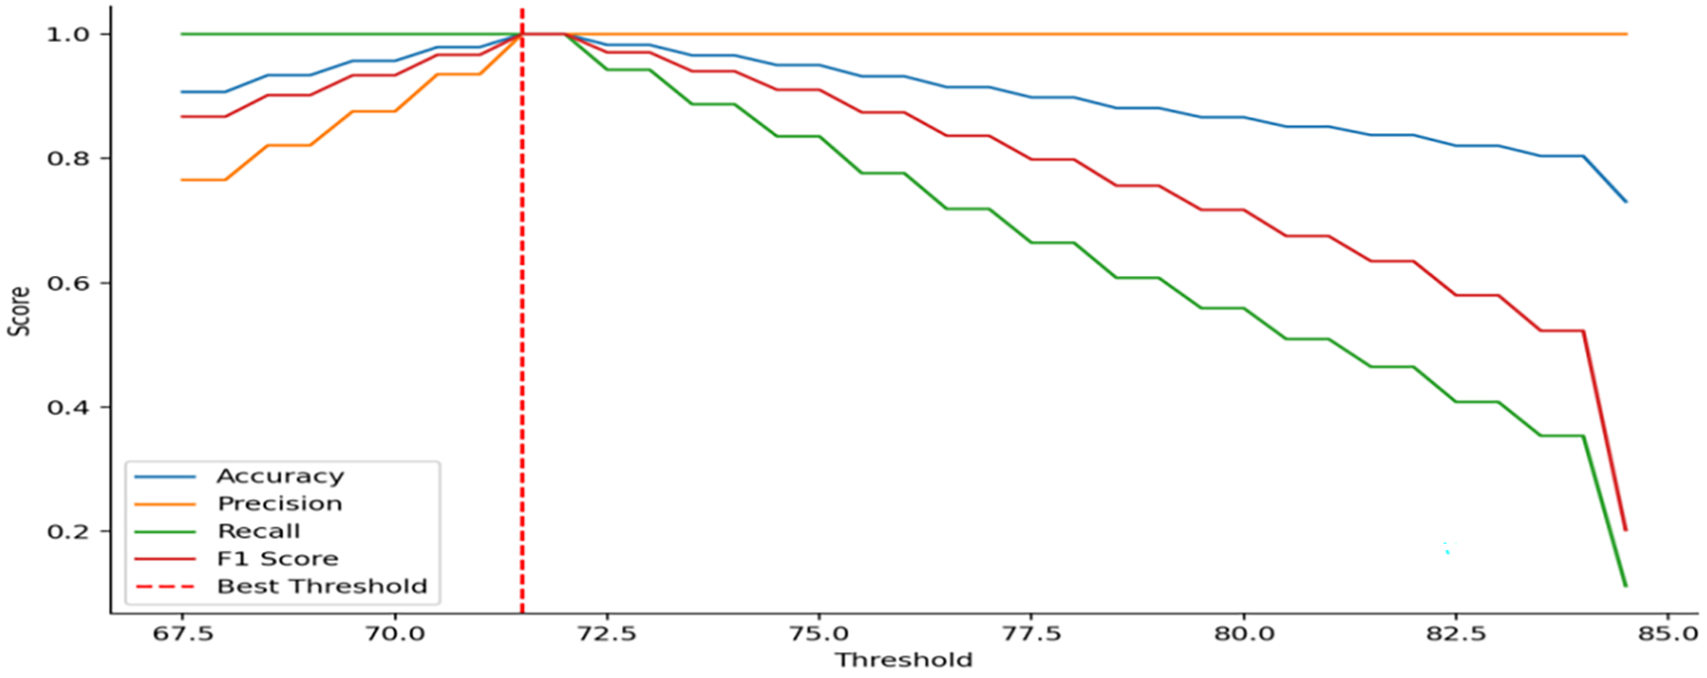
Figure 3: Optimal threshold plot
Further analysis revealed that the potential cutoff score was in the range of 68–74 points (Fig. 3), with a score of 72 corresponding to the highest Youden index (Youden index = 0.948). This cutoff exhibited the best diagnostic performance: sensitivity of 98.2%, specificity of 96.86%, and diagnostic accuracy of 97.0% (Supplementary Table S3). Based on these findings, participants with an SNAS-C score ≥ 72 were classified as the case group. This result indicates that the SNAS-C scale has excellent diagnostic performance in distinguishing between cases and non-cases, and a score of 72 can serve as an effective cutoff for identifying high-risk individuals in clinical practice. The case group (defined as participants with an SNAS-C score ≥ 72) accounted for 30.35%.
3.4 Comparison of Different Dimensions of SNAS-C
To validate the effectiveness of the cutoff score of 72 (coding the No-risk SNAS-C and Low-risk SNAS-C groups as 0 “No-risk group” and the At-risk SNAS-C group as 1 “At-risk group” in distinguishing participants with and without social network addiction (SNA), this study analyzed participants’ performance across all six dimensions of the SNAS-C (see Fig. 4). The results showed that the At-risk cases (with scores ≥ 72) had significantly higher scores on all six dimensions compared to the No-risk cases. This indicates that both the LPA and ROC analyses demonstrated strong discriminative ability in identifying At-risk and No-risk participants.
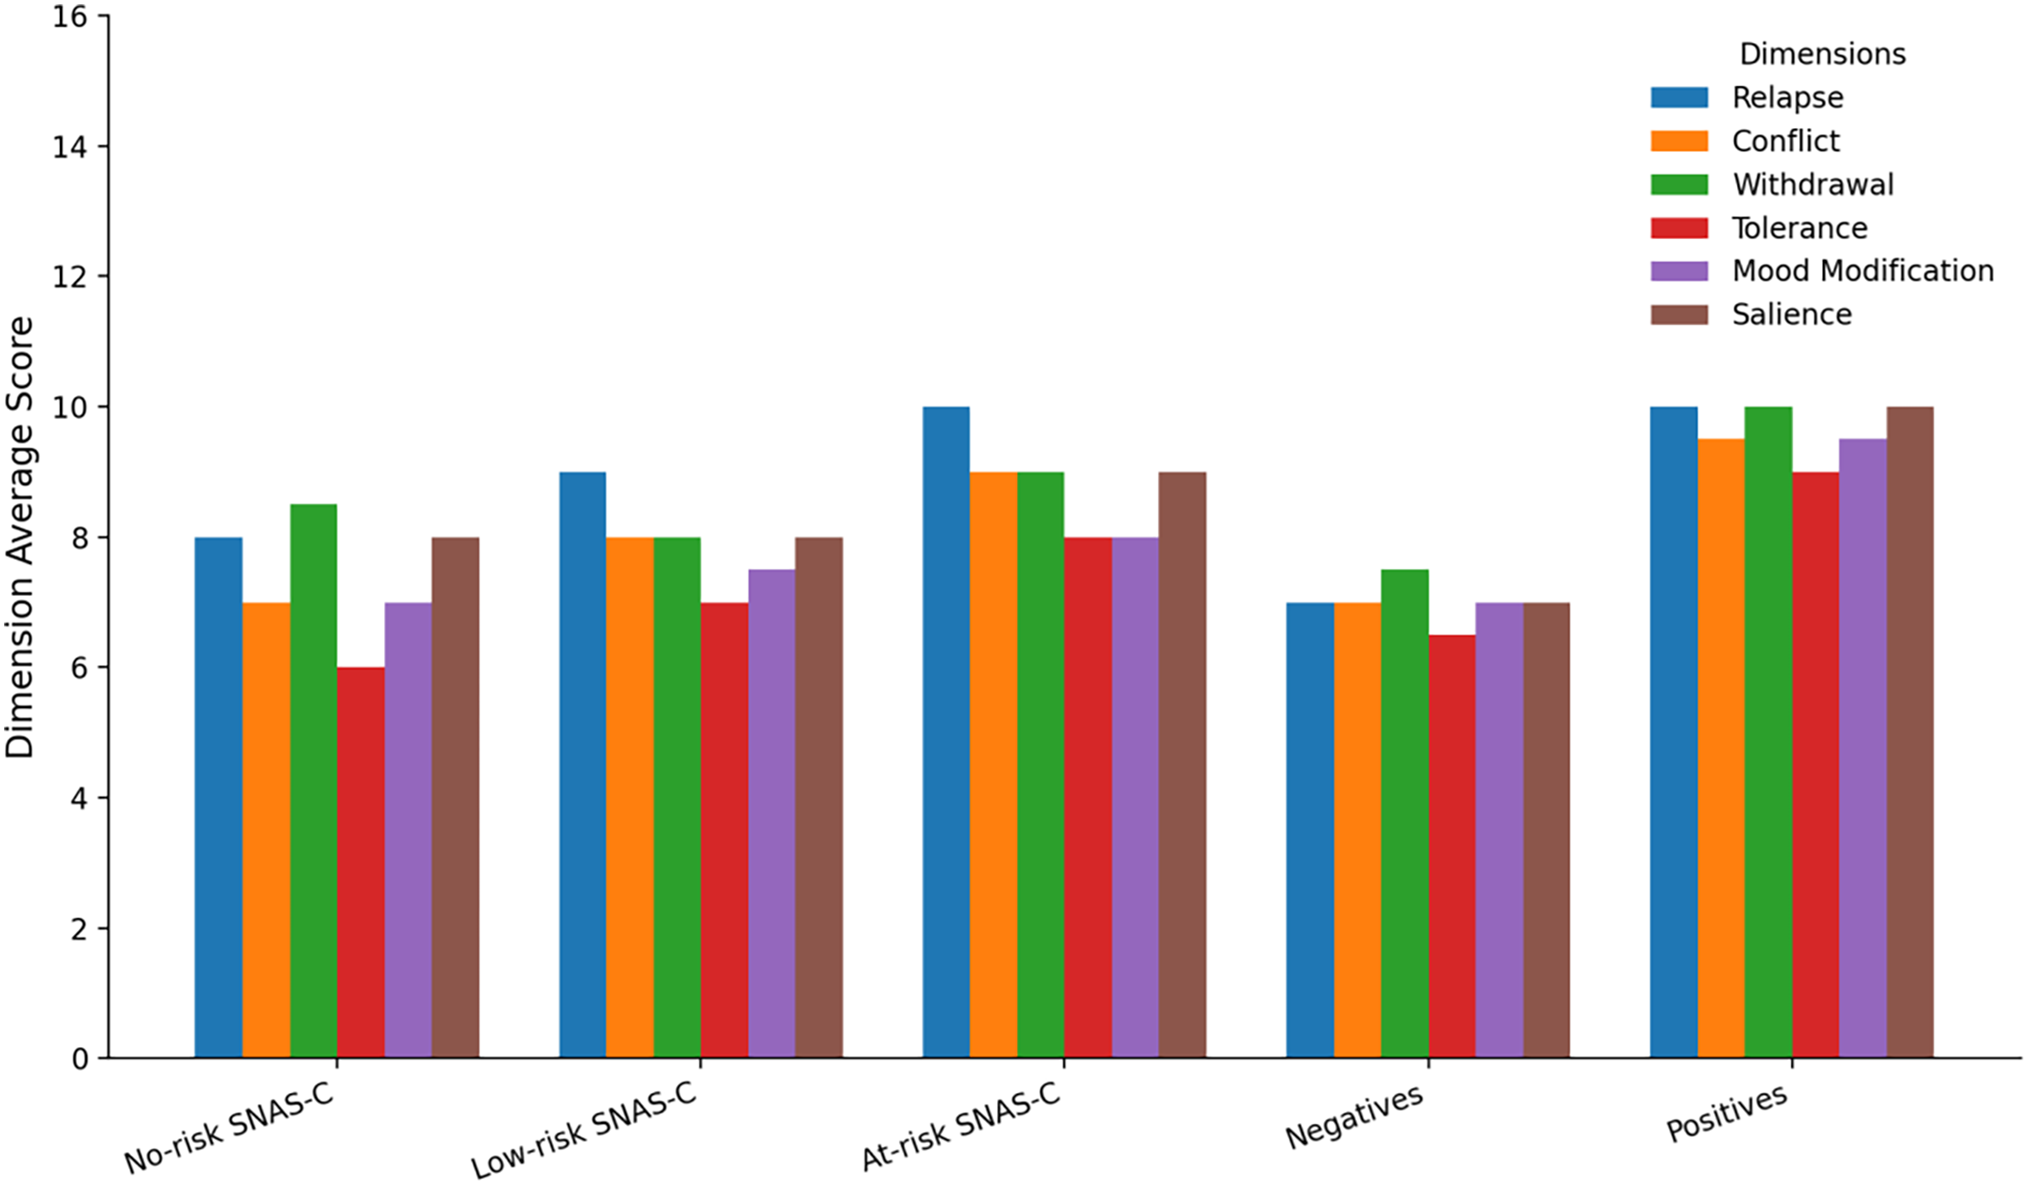
Figure 4: Latent profiles of different participants and the performance of receiver operating characteristic analysis. Note: Salience, Mood Modification, Tolerance, Conflict, and Relapse are the six dimensions of SNAS-C
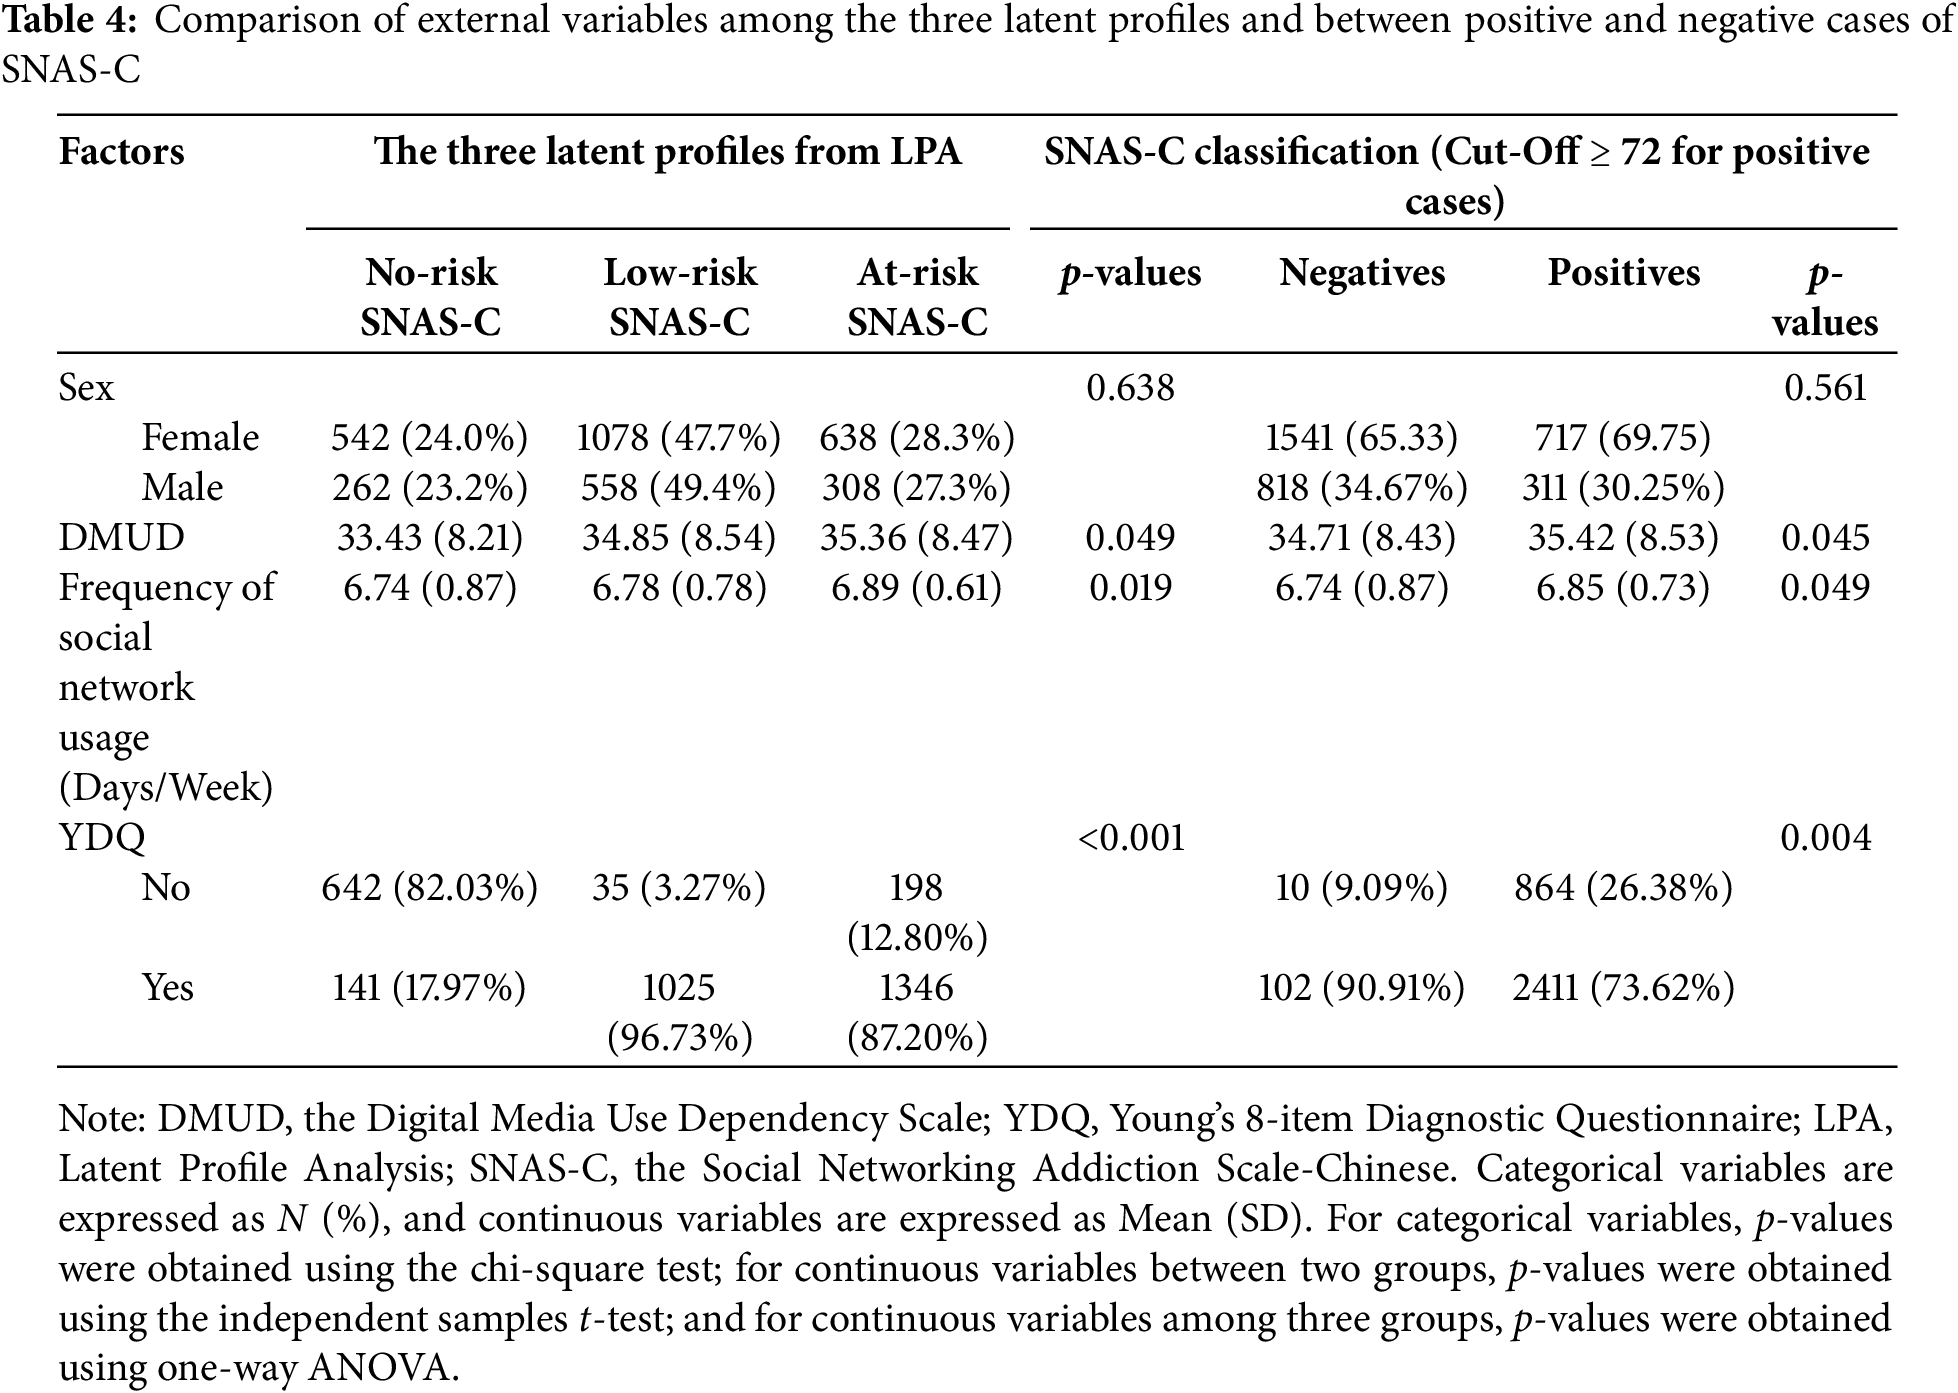
3.5 Comparing Levels of External Factors between SNAS-C Positive/Negative Groups (Cut-Off Point of 72) and among Latent Classes Derived from LPA
Table 4 presents the data analysis results, showing that among the three latent profiles (No-risk, Low-risk, High-risk), the High-risk profile had significantly higher scores in Digital Media Use Dependence (DMUD: 35.36 ± 8.47), frequency of social network use (6.89 ± 0.61 days/week), and the proportion of YDQ-positive responses (87.20%) compared to the No-risk and Low-risk profiles (p < 0.05). Furthermore, social network addiction-positive cases (with a cutoff score ≥ 72) showed significantly higher scores on DMUD (35.42 ± 8.53), frequency of social network use (6.85 ± 0.73 days/week), and YDQ-positive responses (73.62%) compared to negative cases (p < 0.05). However, sex did not significantly impact profile distribution or addiction classification (p > 0.05). These results indicate that the LPA and ROC-derived cutoff value of the SNAS-C can effectively distinguish between different risk profiles and addiction statuses, providing important insights for relevant intervention measures.
This study identified three latent classes through LPA, with 30.35% of social network users classified into the high-risk “positive group” and the remaining 72.06% classified into the “negative group.” Through ROC analysis, we determined that a cutoff score of 72 or higher is the optimal threshold for diagnosing social SNA, with a sensitivity of 98.2%, specificity of 96.86%, and diagnostic accuracy of 97.0%. This result demonstrates that the cutoff threshold is highly effective in distinguishing between high-risk and low-risk groups.
Furthermore, the high-risk group demonstrated significantly higher scores compared to the low-risk group in Digital Media Use Dependence (DMUD: 35.36 ± 8.47), social network usage frequency (6.85 ± 0.73 days/week), and YDQ-positive proportions (73.62%) (p < 0.05), which further supports the external validity of the identified cutoff score.
The cutoff score established in this study provides an important reference for future research. For instance, the SNAS-C scale and its identified cutoff can be used to investigate the relationship between SNA and other internet-related addictive behaviors, including internet gaming disorder, online gambling addiction, and smartphone addiction [13,15,34]. Based on the selected cutoff, the prevalence of SNA among Chinese university students in the study sample was 27.94%. However, the global prevalence of SNA among university students varies significantly. A meta-analysis by Lin et al. [14] reported a global prevalence of 18.4%, while a study by Moreno et al. [35] in the United States found a prevalence of 4%, and research by Elhai et al. [36] in Egypt reported a prevalence of up to 55.2%. These discrepancies suggest that the prevalence of SNA may be affected by cultural context and measurement tools, warranting caution in interpreting cross-regional comparisons.
In this study, we found that the high-risk group of university students exhibited significantly higher levels of digital media dependence, internet addiction, and social media usage frequency compared to the low-risk group. These findings are consistent with previous research. For example, Lin et al. [14] noted a significant correlation between SNA and digital media dependence as well as social media usage frequency. Additionally, a study on university students found that approximately 38% were at risk for SNA, with these students also exhibiting a higher proportion of depressive symptoms compared to non-addicted groups [37]. These findings further support the close association between SNA and mental health issues.
It is also important to note that the impact of social networks on university students has been widely established [38], and the symptoms of SNA share similarities with those of substance addiction [39]. Therefore, determining the cutoff score for the SNA scale is crucial for further research on this issue.
However, this study has several limitations. First, SNA is not yet officially included in the Diagnostic and Statistical Manual of Mental Disorders (5th Edition) or the International Classification of Diseases (11th Edition), and the cutoff score identified in this study has not been validated through clinical interviews, the gold standard for diagnosis. Therefore, the classification results based on this study’s cutoff should be considered as “possible SNA” or “high SNA risk” rather than a confirmed addiction disorder. Second, the data were self-reported, which may be subject to social desirability bias, although anonymous measures were implemented to reduce this bias. Additionally, the study sample was limited to a few universities in a single city in China, with a higher proportion of first- and second-year students, which may limit the generalizability of the results. Future research should validate the findings in broader populations and regions and further validate the effectiveness of the cutoff score using clinical diagnostic gold standards.
Nonetheless, this study provides important reference points for the development of cutoff score in internet-related assessment tools. Identifying cutoff score for screening tools is essential for distinguishing between high-risk and low-risk groups in epidemiological studies and interventions. Although the gold standard is considered best practice, when it is not feasible, the combination of LPA and ROC analysis provides a viable alternative for determining cutoff score. Future research could further conduct longitudinal studies to evaluate the effectiveness of the SNA cutoff score in predicting behaviors and health outcomes, as well as its relationship with other internet-related disorders, such as internet gaming disorder and online gambling disorder.
This study identified the optimal cutoff score for SNAS-C as ≥72, demonstrating high sensitivity, specificity, and diagnostic accuracy. This threshold effectively differentiates between high-risk and low-risk groups. The positive SNA group exhibited significantly higher levels of digital media dependence, internet addiction, and social media usage frequency compared to the negative group, further validating the strong association between SNA and these behaviors.
This research provides valuable insights for the development of assessment tools for SNA and lays the foundation for exploring the connection between SNA and other internet-related disorders. Longitudinal research should also be conducted to assess the predictive validity and efficacy of interventions to mitigate the potential negative impacts of SNA on university students’ mental health.
Acknowledgement: Not applicable.
Funding Statement: This study was supported by the National Natural Science Foundation of China (Grant No. 72364006).
Author Contributions: The authors confirm contribution to the paper as follows: conceptualization, design, data analysis, project administration, funding acquisition, writing—original draft preparation, and writing—review and editing, Lin Luo; data survey, Junfeng Yuan, Yanling Wang, Rui Zhu, and Huilin Xu; literature collection, Siyuan Bi and Zhongge Zhang. All authors reviewed the results and approved the final version of the manuscript.
Availability of Data and Materials: The data that support the findings of this study are available from the corresponding author upon reasonable request.
Ethics Approval: This study strictly followed the ethical principles outlined in the Declaration of Helsinki and was approved by the Academic Ethics Committee of Guizhou Normal University (approval number: 20230300005).
Informed Consent: All participants signed a written informed consent form before participation, fully understanding the study’s purpose and data confidentiality principles. Participation was entirely voluntary, and participants could withdraw at any time without any consequences.
Conflicts of Interest: The authors declare no conflicts of interest to report regarding the present study.
Supplementary Materials: The supplementary material is available online at https://www.techscience.com/doi/10.32604/ijmhp.2025.064835/s1.
References
1. Zhao L, He YF, Shi HX. On social behavior and ideology of university students on wechat: a netnographic study in China. Soc Sci Humanit Open. 2021;24(3):270. doi:10.2139/ssrn.3948797. [Google Scholar] [CrossRef]
2. Andreassen CS. Online social network site addiction: a comprehensive review. Curr Addict Rep. 2015;2(2):175–84. doi:10.1007/s40429-015-0056-9. [Google Scholar] [CrossRef]
3. Kuss DJ, Griffiths MD. Social networking sites and addiction: ten lessons learned. Int J Environ Res Public Health. 2017;14(3):311. doi:10.3390/ijerph14030311. [Google Scholar] [CrossRef]
4. Hou Y, Xiong D, Jiang T, Song L, Wang Q. Social media addiction: its impact, mediation, and intervention. Cyberpsychol J Psychosoc Res Cyberspace. 2019;13(1):4. doi:10.5817/CP2019-1-4. [Google Scholar] [CrossRef]
5. Andreassen CS, Pallesen S, Griffiths MD. The relationship between addictive use of social media, narcissism, and self-esteem: findings from a large national survey. Addict Behav. 2017;64:287–93. doi:10.1016/j.addbeh.2016.03.006. [Google Scholar] [CrossRef]
6. Li JB, Wu AM, Feng LF, Deng Y, Li JH, Chen YX, et al. Classification of probable online social networking addiction: a latent profile analysis from a large-scale survey among Chinese adolescents. J Behav Addict. 2020;9(3):698–708. doi:10.1556/2006.2020.00047. [Google Scholar] [CrossRef]
7. Wang C, Wang J. Latent profile analysis of problematic social media use and its association with mental health outcomes among Chinese adolescents. J Affect Disord. 2020;274(3):1076–83. doi:10.1016/j.jad.2020.05.148. [Google Scholar] [CrossRef]
8. Li J, Zhan D, Zhou Y, Gao X. Loneliness and problematic mobile phone use among adolescents during the COVID-19 pandemic: the roles of escape motivation and self-control. Addict Behav. 2021;118(2):106857. doi:10.1016/j.addbeh.2021.106857. [Google Scholar] [CrossRef]
9. Chen J, Liang Y, Mai C, Zhong X, Qu C. General deficit in inhibitory control of excessive smartphone users: evidence from an event-related potential study. Front Psychol. 2020;11:511. doi:10.3389/fpsyg.2020.00511. [Google Scholar] [CrossRef]
10. Andreassen CS, Torsheim T, Brunborg GS, Pallesen S. Development of a Facebook addiction scale. Psychol Rep. 2012;110(2):501–17. doi:10.2466/02.09.18.PR0.110.2.501-517. [Google Scholar] [CrossRef]
11. van Smeden M, Naaktgeboren CA, Reitsma JB, Moons KG, de Groot JA. Latent class models in diagnostic studies when there is no reference standard—a systematic review. Am J Epidemiol. 2016;183(5):377–84. doi:10.1093/aje/kwv134. [Google Scholar] [CrossRef]
12. Bányai F, Zsila Á, Király O, Maraz A, Elekes Z, Griffiths MD, et al. Problematic social media use: results from a large-scale nationally representative adolescent sample. PLoS One. 2017;12(1):e0169839. doi:10.1371/journal.pone.0169839. [Google Scholar] [CrossRef]
13. Shahnawaz MG, Rehman U. Social networking addiction scale. Cogent Psychol. 2020;7(1):1832032. doi:10.1080/23311908.2020.1832032. [Google Scholar] [CrossRef]
14. Lin CY, Broström A, Griffiths MD, Pakpour AH. The global prevalence of social media addiction among university students: a systematic review and meta-analysis. Soc Psych Psych Epid. 2023;58(3):345–56. doi:10.1007/s10389-023-02012-1. [Google Scholar] [CrossRef]
15. Bi S, Yuan J, Luo L. The social networking addiction scale: translation and validation study among Chinese college students. Int J Ment Health Promot. 2024;26(1):51–60. doi:10.32604/ijmhp.2023.041614. [Google Scholar] [CrossRef]
16. Fu X, Zhang K, Chen X, Chen Z. Latent profile analysis of problematic social media use and its relationship with mental health among Chinese adolescents. J Affect Disord. 2022;298:634–41. doi:10.1016/j.jad.2021.11.023. [Google Scholar] [CrossRef]
17. Luo Y, Zhang X, Chen Z. Latent profile analysis of nomophobia and its association with mental health outcomes among Chinese adults. J Behav Addict. 2024;13(1):45–56. doi:10.1556/2006.2024.00012. [Google Scholar] [CrossRef]
18. Marsh HW, Lüdtke O, Trautwein U, Morin AJS. Classical latent profile analysis of academic self-concept dimensions: synergy of person- and variable-centered approaches to theoretical models of self-concept. Struct Equ Modeling. 2009;16(2):191–225. doi:10.1080/10705510902751010. [Google Scholar] [CrossRef]
19. Wu Y, Zhang L, Chen X. Perceived stigma and its association with mental health outcomes among Chinese adolescents: a latent profile analysis. J Youth Adolesc. 2023;52(3):567–79. doi:10.1007/s10964-022-01672-8. [Google Scholar] [CrossRef]
20. Magidson J, Vermunt JK. Latent class models for clustering: a comparison with K-means. Can J Mark Res. 2002;20(1):37–44. [Google Scholar]
21. Garrett ES, Eaton WW, Zeger S. Methods for evaluating the performance of diagnostic tests in the absence of a gold standard: a latent class model approach. Stat Med. 2002;21(9):1289–307. doi:10.1002/sim.1104. [Google Scholar] [CrossRef]
22. Bahk CM, Sheil A, Rohm CET, Lin F. Digital media dependency, relational orientation and social networking among college students. Commun IIMA. 2010;10:69–78. doi:10.58729/1941-6687.1144. [Google Scholar] [CrossRef]
23. Luo L, Yuan J, Bi S, Wang Y. A model linking digital media dependence, exercise empowerment, and social physique anxiety among emerging adulthood college students. Front Psychol. 2023;14:1249182. doi:10.3389/fpsyg.2023.1249182. [Google Scholar] [CrossRef]
24. Aboujaoude E. Problematic internet use: an overview. World Psychiatry. 2010;9(2):85–90. doi:10.1002/j.2051-5545.2010.tb00278.x. [Google Scholar] [CrossRef]
25. Young KS. Internet addiction: the emergence of a new clinical disorder. Cyberpsychol Behav. 1998;1(3):237–44. doi:10.1089/cpb.1998.1.237. [Google Scholar] [CrossRef]
26. Li Y, Zhang X, Lu F, Zhang Q, Wang Y. Internet addiction among elementary and middle school students in China: a nationally representative sample study. Cyberpsychol Behav Soc Netw. 2014;17(2):111–6. doi:10.1089/cyber.2012.0482. [Google Scholar] [CrossRef]
27. Nylund-Gibson K, Choi AY. Ten frequently asked questions about latent class analysis. Transl Issues Psychol Sci. 2018;4(4):440–61. doi:10.1037/tps0000176. [Google Scholar] [CrossRef]
28. Masyn KE. Latent class analysis and finite mixture modeling. In: Little TD, editor. The Oxford handbook of quantitative methods. Oxford, UK: Oxford University Press; 2013. p. 551–611. [Google Scholar]
29. Fonseca-Pedrero E, Lemos-Giráldez S, Paino M, Villazón-García U, Muñiz J. Validation of the Schizotypal Personality Questionnaire—Brief Form in adolescents. Schizophr Res. 2017;111(1–3):53–60. doi:10.1016/j.schres.2009.03.006. [Google Scholar] [CrossRef]
30. Nagin DS. Group-based modeling of development. Cambridge, MA, USA: Harvard University Press; 2005. 213 p. [Google Scholar]
31. Weller BE, Bowen NK, Faubert SJ. Latent class analysis: a guide to best practice. J Black Psychol. 2020;46(4):287–311. doi:10.1177/0095798420930932. [Google Scholar] [CrossRef]
32. Rachid T, Abarda A, Hasbaoui A. Latent class analysis: a review and recommendations for future applications in health sciences. Procedia Comput Sci. 2024;238(1–2):1062–7. doi:10.1016/j.procs.2024.06.135. [Google Scholar] [CrossRef]
33. Hassanzad M, Hajian-Tilaki K. Methods of determining optimal cut-point of diagnostic biomarkers with application of clinical data in ROC analysis: an update review. BMC Med Res Methodol. 2024;24(1):84. doi:10.1186/s12874-024-02198-2. [Google Scholar] [CrossRef]
34. Peng P, Chen Z, Ren S, Liu Y, He R, Liang Y, et al. Determination of the cutoff point for Smartphone Application-Based Addiction Scale for adolescents: a latent profile analysis. BMC Psychiatry. 2023;23(1):675. doi:10.1186/s12888-023-05170-4. [Google Scholar] [CrossRef]
35. Moreno MA, Jelenchick LA, Cox E, Young H, Christakis DA. Problematic internet use among US youth: a systematic review. Arch Pediatr Adolesc Med. 2011;165(9):797–805. doi:10.1001/archpediatrics.2011.58. [Google Scholar] [CrossRef]
36. Elhai JD, Yang H, Montag C. Prevalence and determinants of social media addiction among university students in Egypt. J Affect Disord. 2023;325(8):123–30. doi:10.1016/j.jad.2023.01.045. [Google Scholar] [CrossRef]
37. Romero CP, Blas JO. Adicción a las redes sociales y sintomatología depresiva en universitarios. CASUS Rev De Investig Y Casos En Salud. 2017;2:47–53. (In Spanish). doi:10.35626/casus.1.2017.31. [Google Scholar] [CrossRef]
38. Mikami AY, Szwedo DE. Social networking in online and offline contexts. In: Levesque RJR, editor. Encyclopedia of adolescence. Berlin/Heidelberg, Germany: Springer; 2014. p. 2801–8. doi:10.1007/978-1-4419-1695-2_283. [Google Scholar] [CrossRef]
39. Griffiths MD. Social networking addiction: emerging themes and issues. J Addict Res Ther. 2013;4(5):e118. doi:10.4172/2155-6105.1000e118. [Google Scholar] [CrossRef]
Cite This Article
 Copyright © 2025 The Author(s). Published by Tech Science Press.
This work is licensed under a Creative Commons Attribution 4.0 International License , which permits unrestricted use, distribution, and reproduction in any medium, provided the original work is properly cited.
 Downloads
 Citation Tools